Garner, IA Map & Demographics
Garner Map
Garner Overview
$34,147
PER CAPITA INCOME
$86,103
AVG FAMILY INCOME
$69,056
AVG HOUSEHOLD INCOME
39.6%
WAGE / INCOME GAP [ % ]
60.4¢/ $1
WAGE / INCOME GAP [ $ ]
0.41
INEQUALITY / GINI INDEX
3,065
TOTAL POPULATION
1,485
MALE POPULATION
1,580
FEMALE POPULATION
93.99
MALES / 100 FEMALES
106.40
FEMALES / 100 MALES
46.3
MEDIAN AGE
2.8
AVG FAMILY SIZE
2.3
AVG HOUSEHOLD SIZE
1,525
LABOR FORCE [ PEOPLE ]
60.5%
PERCENT IN LABOR FORCE
1.8%
UNEMPLOYMENT RATE
Garner Zip Codes
Garner Area Codes
Income in Garner
Income Overview in Garner
Per Capita Income in Garner is $34,147, while median incomes of families and households are $86,103 and $69,056 respectively.
| Characteristic | Number | Measure |
| Per Capita Income | 3,065 | $34,147 |
| Median Family Income | 927 | $86,103 |
| Mean Family Income | 927 | $95,114 |
| Median Household Income | 1,287 | $69,056 |
| Mean Household Income | 1,287 | $79,968 |
| Income Deficit | 927 | $0 |
| Wage / Income Gap (%) | 3,065 | 39.60% |
| Wage / Income Gap ($) | 3,065 | 60.40¢ per $1 |
| Gini / Inequality Index | 3,065 | 0.41 |
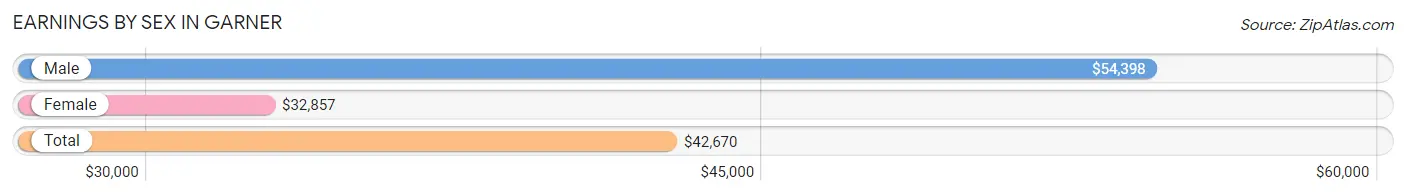
Earnings by Sex in Garner
Average Earnings in Garner are $42,670, $54,398 for men and $32,857 for women, a difference of 39.6%.
| Sex | Number | Average Earnings |
| Male | 775 (49.5%) | $54,398 |
| Female | 790 (50.5%) | $32,857 |
| Total | 1,565 (100.0%) | $42,670 |
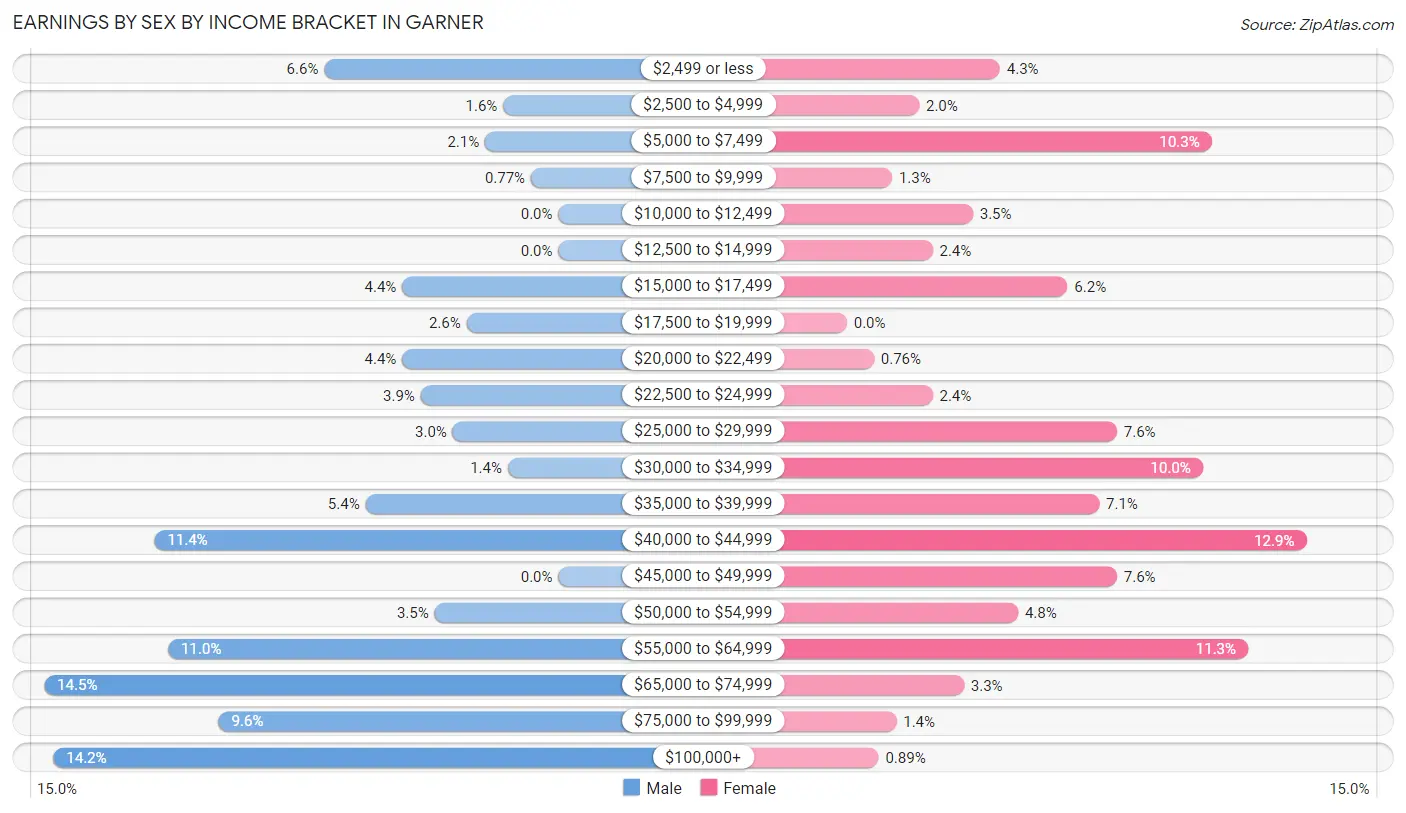
Earnings by Sex by Income Bracket in Garner
The most common earnings brackets in Garner are $65,000 to $74,999 for men (112 | 14.4%) and $40,000 to $44,999 for women (102 | 12.9%).
| Income | Male | Female |
| $2,499 or less | 51 (6.6%) | 34 (4.3%) |
| $2,500 to $4,999 | 12 (1.5%) | 16 (2.0%) |
| $5,000 to $7,499 | 16 (2.1%) | 81 (10.2%) |
| $7,500 to $9,999 | 6 (0.8%) | 10 (1.3%) |
| $10,000 to $12,499 | 0 (0.0%) | 28 (3.5%) |
| $12,500 to $14,999 | 0 (0.0%) | 19 (2.4%) |
| $15,000 to $17,499 | 34 (4.4%) | 49 (6.2%) |
| $17,500 to $19,999 | 20 (2.6%) | 0 (0.0%) |
| $20,000 to $22,499 | 34 (4.4%) | 6 (0.8%) |
| $22,500 to $24,999 | 30 (3.9%) | 19 (2.4%) |
| $25,000 to $29,999 | 23 (3.0%) | 60 (7.6%) |
| $30,000 to $34,999 | 11 (1.4%) | 79 (10.0%) |
| $35,000 to $39,999 | 42 (5.4%) | 56 (7.1%) |
| $40,000 to $44,999 | 88 (11.4%) | 102 (12.9%) |
| $45,000 to $49,999 | 0 (0.0%) | 60 (7.6%) |
| $50,000 to $54,999 | 27 (3.5%) | 38 (4.8%) |
| $55,000 to $64,999 | 85 (11.0%) | 89 (11.3%) |
| $65,000 to $74,999 | 112 (14.4%) | 26 (3.3%) |
| $75,000 to $99,999 | 74 (9.6%) | 11 (1.4%) |
| $100,000+ | 110 (14.2%) | 7 (0.9%) |
| Total | 775 (100.0%) | 790 (100.0%) |
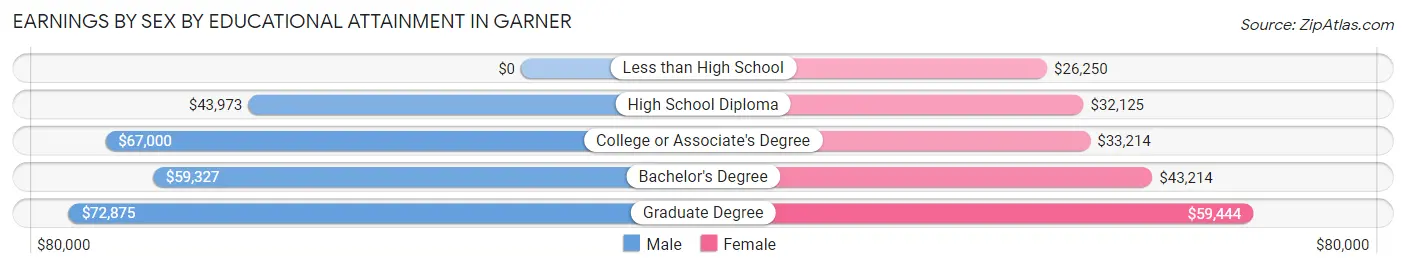
Earnings by Sex by Educational Attainment in Garner
Average earnings in Garner are $58,627 for men and $37,014 for women, a difference of 36.9%. Men with an educational attainment of graduate degree enjoy the highest average annual earnings of $72,875, while those with high school diploma education earn the least with $43,973. Women with an educational attainment of graduate degree earn the most with the average annual earnings of $59,444, while those with less than high school education have the smallest earnings of $26,250.
| Educational Attainment | Male Income | Female Income |
| Less than High School | - | - |
| High School Diploma | $43,973 | $32,125 |
| College or Associate's Degree | $67,000 | $33,214 |
| Bachelor's Degree | $59,327 | $43,214 |
| Graduate Degree | $72,875 | $59,444 |
| Total | $58,627 | $37,014 |
Family Income in Garner
Family Income Brackets in Garner
According to the Garner family income data, there are 219 families falling into the $75,000 to $99,999 income range, which is the most common income bracket and makes up 23.6% of all families. Conversely, the $10,000 to $14,999 income bracket is the least frequent group with only 16 families (1.7%) belonging to this category.
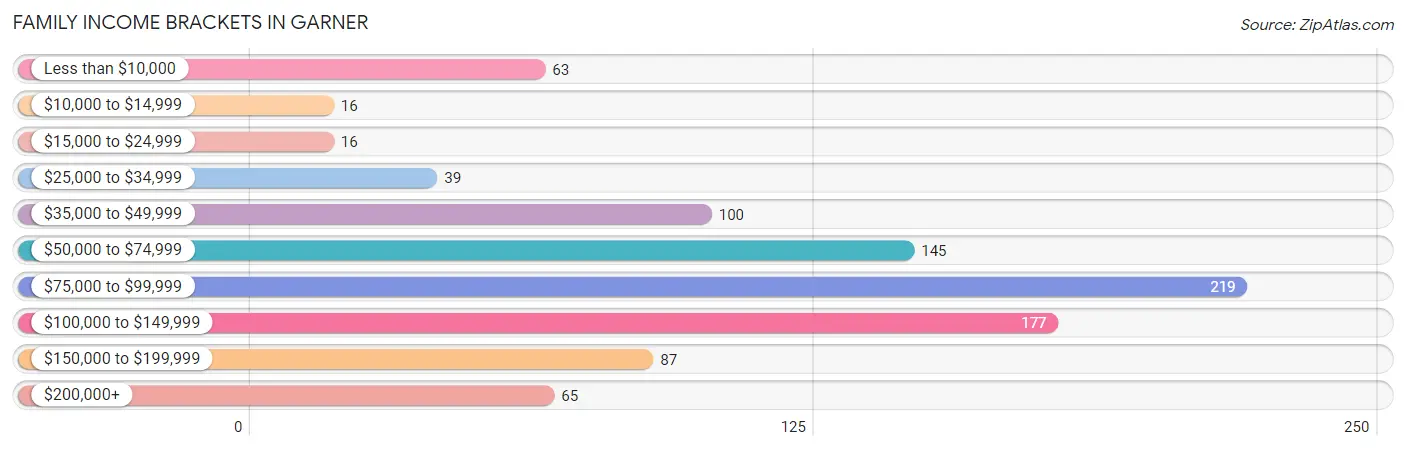
| Income Bracket | # Families | % Families |
| Less than $10,000 | 63 | 6.8% |
| $10,000 to $14,999 | 16 | 1.7% |
| $15,000 to $24,999 | 16 | 1.7% |
| $25,000 to $34,999 | 39 | 4.2% |
| $35,000 to $49,999 | 100 | 10.8% |
| $50,000 to $74,999 | 145 | 15.6% |
| $75,000 to $99,999 | 219 | 23.6% |
| $100,000 to $149,999 | 177 | 19.1% |
| $150,000 to $199,999 | 87 | 9.4% |
| $200,000+ | 65 | 7.0% |
Family Income by Famaliy Size in Garner
4-person families (107 | 11.5%) account for the highest median family income in Garner with $89,375 per family, while 2-person families (531 | 57.3%) have the highest median income of $39,062 per family member.
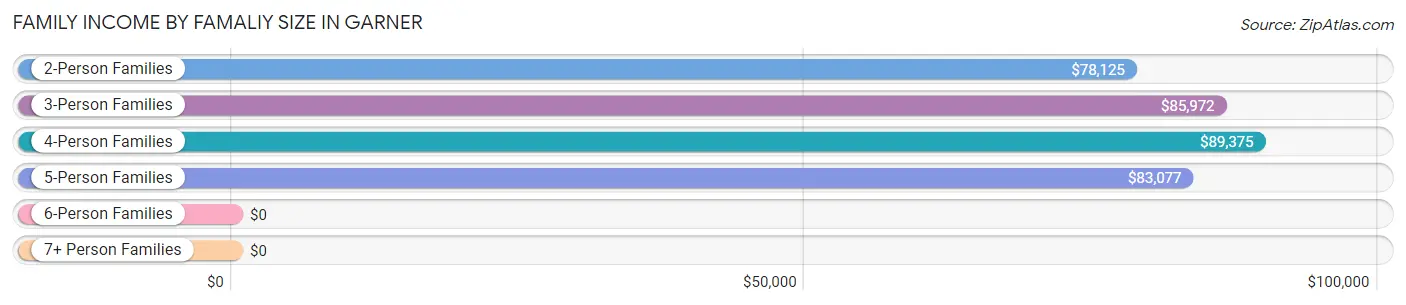
| Income Bracket | # Families | Median Income |
| 2-Person Families | 531 (57.3%) | $78,125 |
| 3-Person Families | 246 (26.5%) | $85,972 |
| 4-Person Families | 107 (11.5%) | $89,375 |
| 5-Person Families | 30 (3.2%) | $83,077 |
| 6-Person Families | 0 (0.0%) | $0 |
| 7+ Person Families | 13 (1.4%) | $0 |
| Total | 927 (100.0%) | $86,103 |
Family Income by Number of Earners in Garner
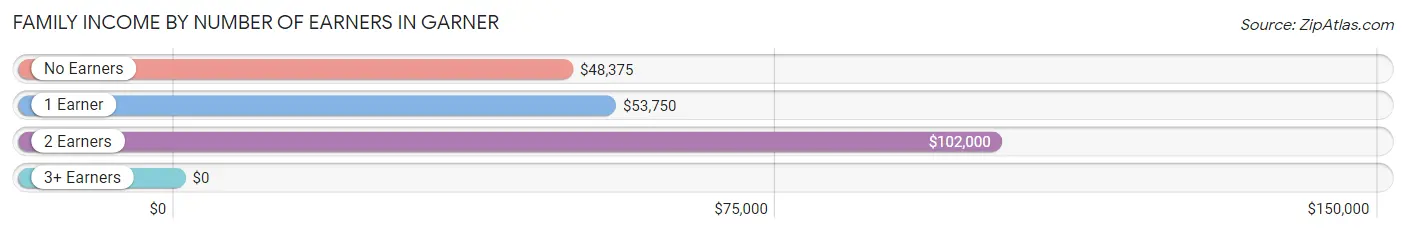
| Number of Earners | # Families | Median Income |
| No Earners | 205 (22.1%) | $48,375 |
| 1 Earner | 186 (20.1%) | $53,750 |
| 2 Earners | 500 (53.9%) | $102,000 |
| 3+ Earners | 36 (3.9%) | $0 |
| Total | 927 (100.0%) | $86,103 |
Household Income in Garner
Household Income Brackets in Garner
With 250 households falling in the category, the $75,000 to $99,999 income range is the most frequent in Garner, accounting for 19.4% of all households. In contrast, only 66 households (5.1%) fall into the $200,000+ income bracket, making it the least populous group.
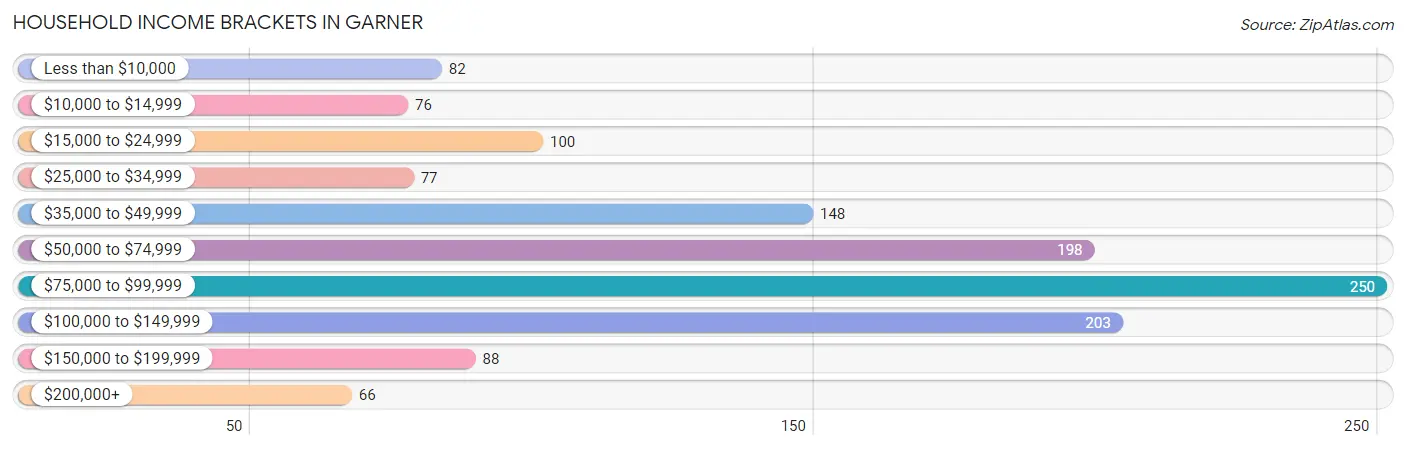
| Income Bracket | # Households | % Households |
| Less than $10,000 | 82 | 6.4% |
| $10,000 to $14,999 | 76 | 5.9% |
| $15,000 to $24,999 | 100 | 7.8% |
| $25,000 to $34,999 | 77 | 6.0% |
| $35,000 to $49,999 | 148 | 11.5% |
| $50,000 to $74,999 | 198 | 15.4% |
| $75,000 to $99,999 | 250 | 19.4% |
| $100,000 to $149,999 | 203 | 15.8% |
| $150,000 to $199,999 | 88 | 6.8% |
| $200,000+ | 66 | 5.1% |
Household Income by Householder Age in Garner
The median household income in Garner is $69,056, with the highest median household income of $103,125 found in the 45 to 64 years age bracket for the primary householder. A total of 324 households (25.2%) fall into this category. Meanwhile, the 15 to 24 years age bracket for the primary householder has the lowest median household income of $0, with 44 households (3.4%) in this group.
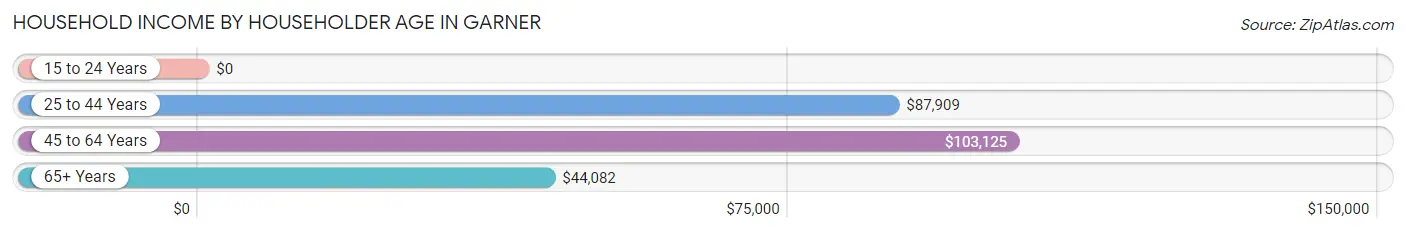
| Income Bracket | # Households | Median Income |
| 15 to 24 Years | 44 (3.4%) | $0 |
| 25 to 44 Years | 367 (28.5%) | $87,909 |
| 45 to 64 Years | 324 (25.2%) | $103,125 |
| 65+ Years | 552 (42.9%) | $44,082 |
| Total | 1,287 (100.0%) | $69,056 |
Poverty in Garner
Income Below Poverty by Sex and Age in Garner
With 9.5% poverty level for males and 14.5% for females among the residents of Garner, 75 year old and over males and 16 and 17 year old females are the most vulnerable to poverty, with 29 males (24.2%) and 29 females (72.5%) in their respective age groups living below the poverty level.
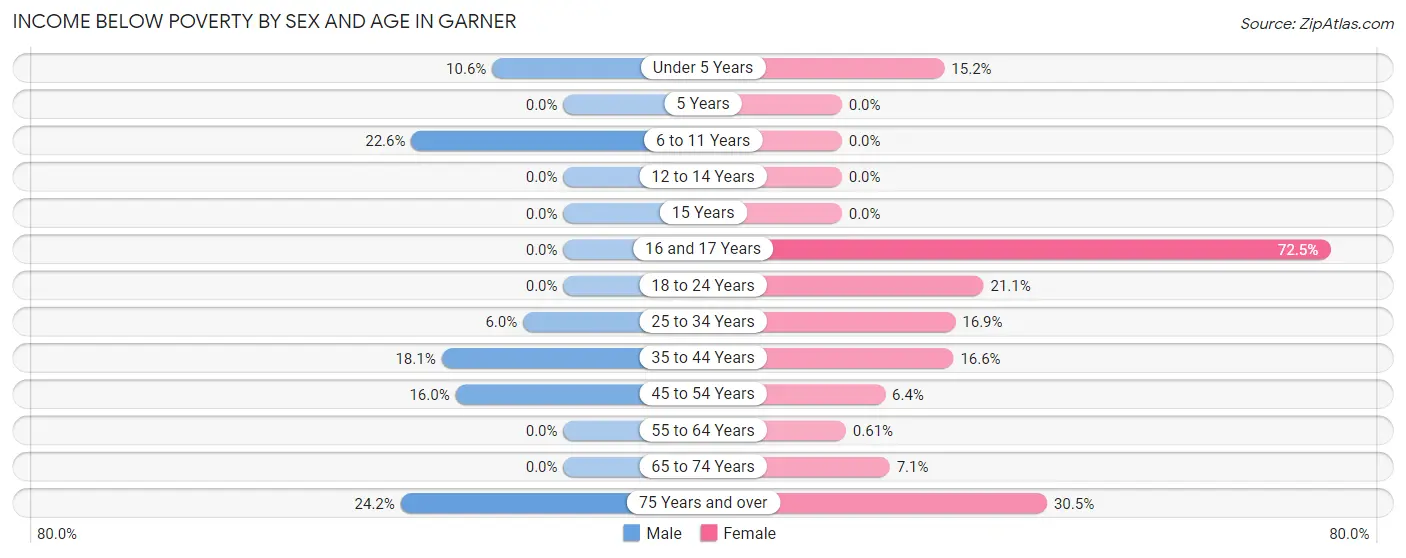
| Age Bracket | Male | Female |
| Under 5 Years | 13 (10.6%) | 16 (15.2%) |
| 5 Years | 0 (0.0%) | 0 (0.0%) |
| 6 to 11 Years | 21 (22.6%) | 0 (0.0%) |
| 12 to 14 Years | 0 (0.0%) | 0 (0.0%) |
| 15 Years | 0 (0.0%) | 0 (0.0%) |
| 16 and 17 Years | 0 (0.0%) | 29 (72.5%) |
| 18 to 24 Years | 0 (0.0%) | 16 (21.0%) |
| 25 to 34 Years | 7 (6.0%) | 29 (16.9%) |
| 35 to 44 Years | 38 (18.1%) | 31 (16.6%) |
| 45 to 54 Years | 29 (16.0%) | 11 (6.4%) |
| 55 to 64 Years | 0 (0.0%) | 1 (0.6%) |
| 65 to 74 Years | 0 (0.0%) | 20 (7.1%) |
| 75 Years and over | 29 (24.2%) | 71 (30.5%) |
| Total | 137 (9.5%) | 224 (14.5%) |
Income Above Poverty by Sex and Age in Garner
According to the poverty statistics in Garner, males aged 5 years and females aged 6 to 11 years are the age groups that are most secure financially, with 100.0% of males and 100.0% of females in these age groups living above the poverty line.
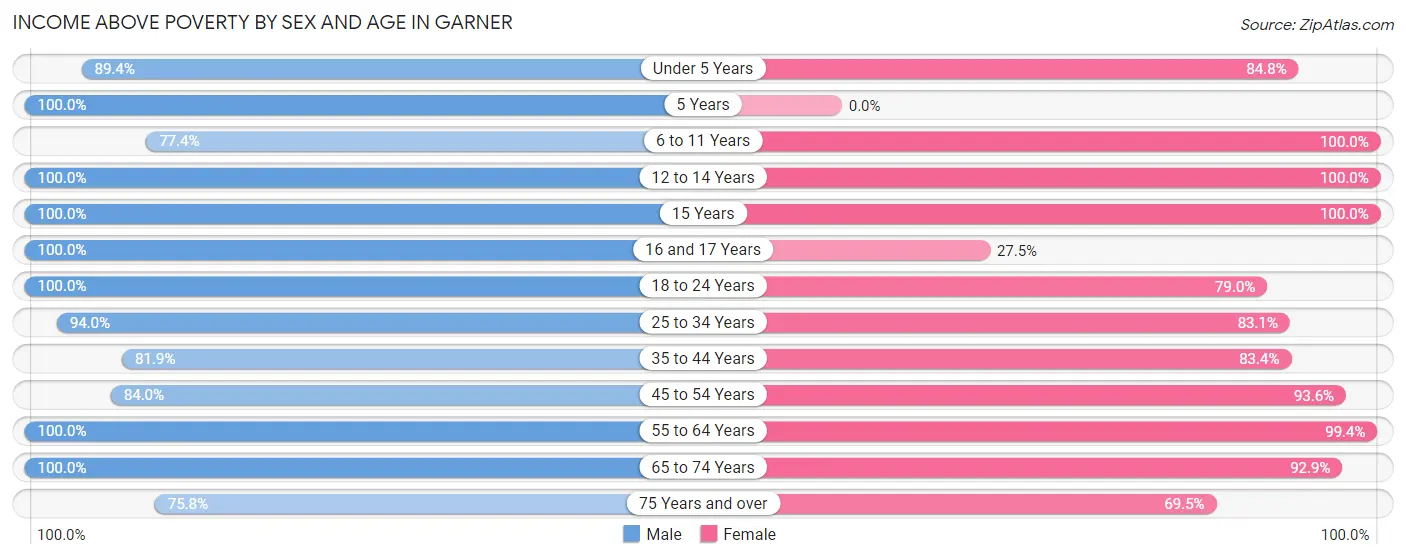
| Age Bracket | Male | Female |
| Under 5 Years | 110 (89.4%) | 89 (84.8%) |
| 5 Years | 58 (100.0%) | 0 (0.0%) |
| 6 to 11 Years | 72 (77.4%) | 77 (100.0%) |
| 12 to 14 Years | 28 (100.0%) | 22 (100.0%) |
| 15 Years | 25 (100.0%) | 13 (100.0%) |
| 16 and 17 Years | 11 (100.0%) | 11 (27.5%) |
| 18 to 24 Years | 116 (100.0%) | 60 (78.9%) |
| 25 to 34 Years | 110 (94.0%) | 143 (83.1%) |
| 35 to 44 Years | 172 (81.9%) | 156 (83.4%) |
| 45 to 54 Years | 152 (84.0%) | 160 (93.6%) |
| 55 to 64 Years | 134 (100.0%) | 162 (99.4%) |
| 65 to 74 Years | 233 (100.0%) | 261 (92.9%) |
| 75 Years and over | 91 (75.8%) | 162 (69.5%) |
| Total | 1,312 (90.5%) | 1,316 (85.5%) |
Income Below Poverty Among Married-Couple Families in Garner
The poverty statistics for married-couple families in Garner show that 7.6% or 57 of the total 751 families live below the poverty line. Families with 1 or 2 children have the highest poverty rate of 12.6%, comprising of 28 families. On the other hand, families with 3 or 4 children have the lowest poverty rate of 0.0%, which includes 0 families.
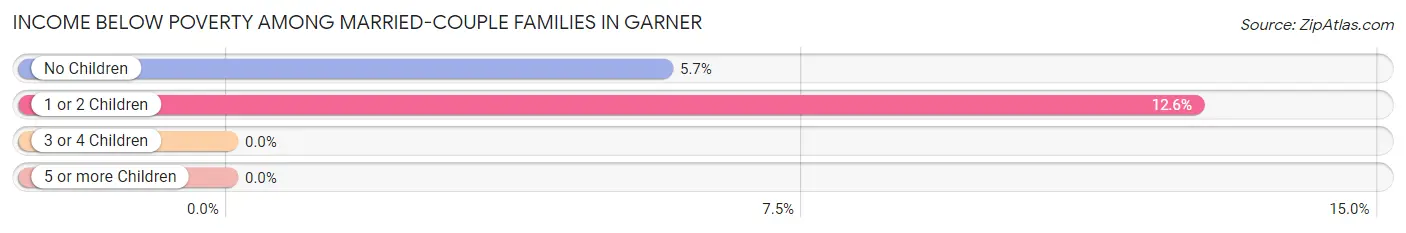
| Children | Above Poverty | Below Poverty |
| No Children | 482 (94.3%) | 29 (5.7%) |
| 1 or 2 Children | 194 (87.4%) | 28 (12.6%) |
| 3 or 4 Children | 18 (100.0%) | 0 (0.0%) |
| 5 or more Children | 0 (0.0%) | 0 (0.0%) |
| Total | 694 (92.4%) | 57 (7.6%) |
Income Below Poverty Among Single-Parent Households in Garner
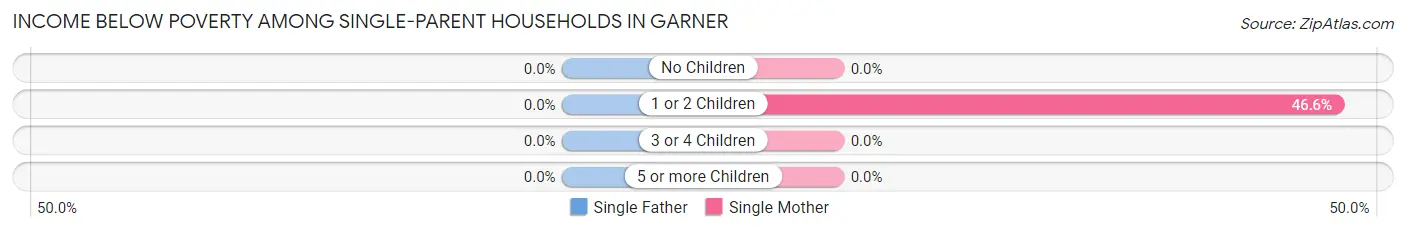
| Children | Single Father | Single Mother |
| No Children | 0 (0.0%) | 0 (0.0%) |
| 1 or 2 Children | 0 (0.0%) | 34 (46.6%) |
| 3 or 4 Children | 0 (0.0%) | 0 (0.0%) |
| 5 or more Children | 0 (0.0%) | 0 (0.0%) |
| Total | 0 (0.0%) | 34 (27.2%) |
Income Below Poverty Among Married-Couple vs Single-Parent Households in Garner
The poverty data for Garner shows that 57 of the married-couple family households (7.6%) and 34 of the single-parent households (19.3%) are living below the poverty level. Within the married-couple family households, those with 1 or 2 children have the highest poverty rate, with 28 households (12.6%) falling below the poverty line. Among the single-parent households, those with 1 or 2 children have the highest poverty rate, with 34 household (46.6%) living below poverty.
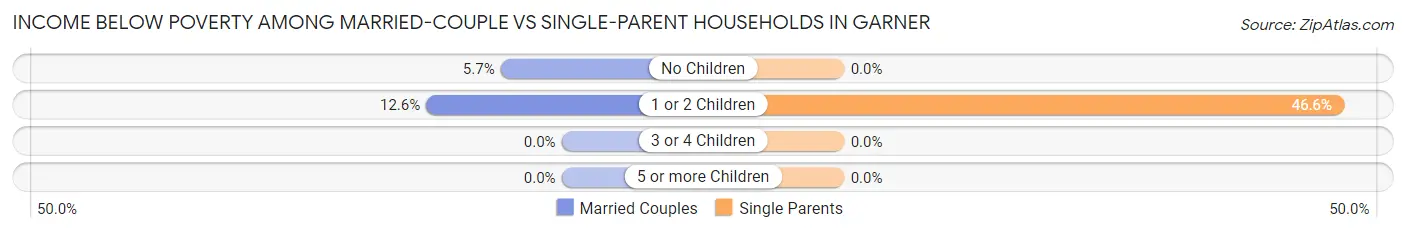
| Children | Married-Couple Families | Single-Parent Households |
| No Children | 29 (5.7%) | 0 (0.0%) |
| 1 or 2 Children | 28 (12.6%) | 34 (46.6%) |
| 3 or 4 Children | 0 (0.0%) | 0 (0.0%) |
| 5 or more Children | 0 (0.0%) | 0 (0.0%) |
| Total | 57 (7.6%) | 34 (19.3%) |
Race in Garner
The most populous races in Garner are White / Caucasian (2,913 | 95.0%), Hispanic or Latino (151 | 4.9%), and Black / African American (80 | 2.6%).
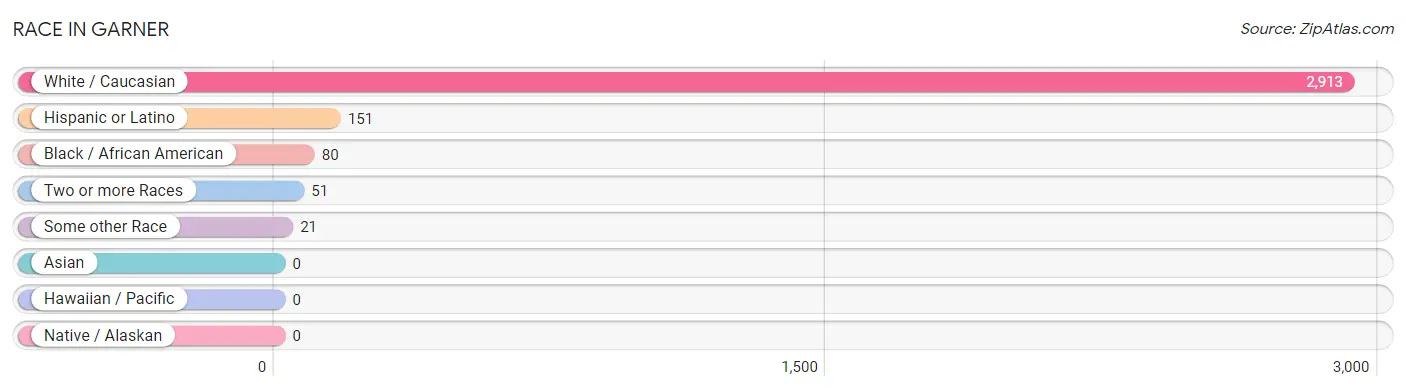
| Race | # Population | % Population |
| Asian | 0 | 0.0% |
| Black / African American | 80 | 2.6% |
| Hawaiian / Pacific | 0 | 0.0% |
| Hispanic or Latino | 151 | 4.9% |
| Native / Alaskan | 0 | 0.0% |
| White / Caucasian | 2,913 | 95.0% |
| Two or more Races | 51 | 1.7% |
| Some other Race | 21 | 0.7% |
| Total | 3,065 | 100.0% |
Ancestry in Garner
The most populous ancestries reported in Garner are German (1,145 | 37.4%), Norwegian (463 | 15.1%), Irish (245 | 8.0%), English (176 | 5.7%), and American (164 | 5.3%), together accounting for 71.5% of all Garner residents.
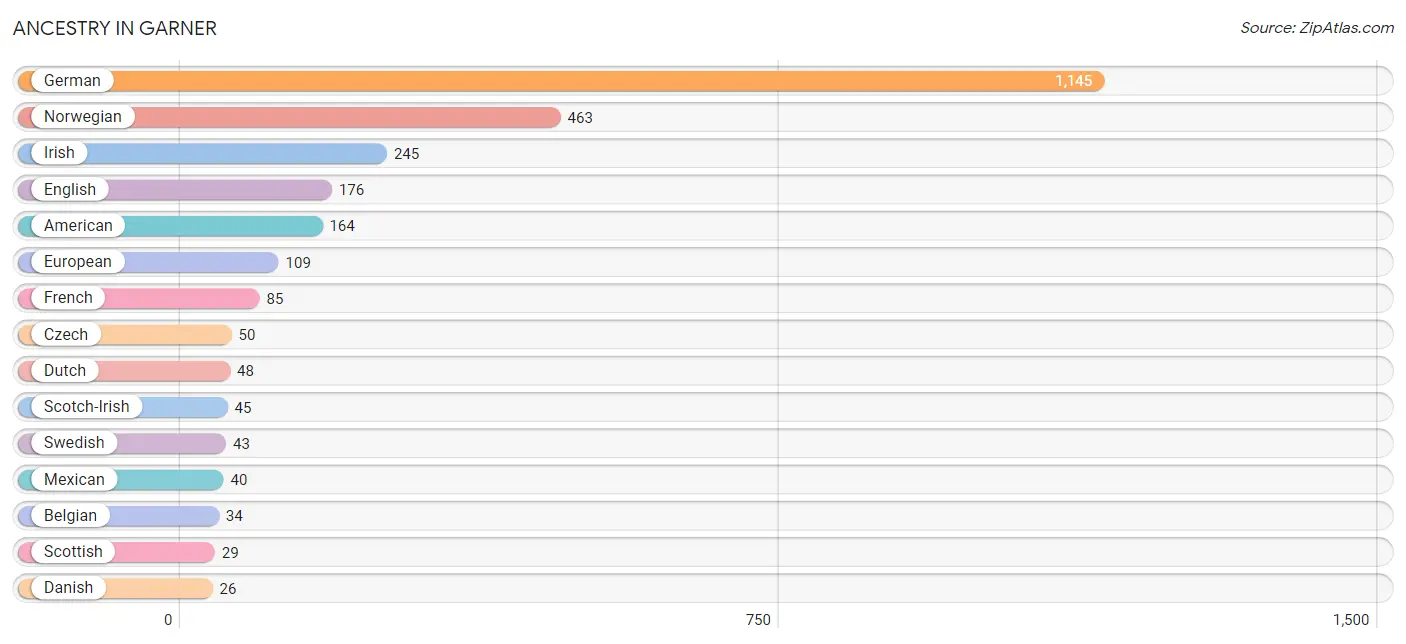
| Ancestry | # Population | % Population |
| American | 164 | 5.3% |
| Belgian | 34 | 1.1% |
| British | 8 | 0.3% |
| Cuban | 12 | 0.4% |
| Czech | 50 | 1.6% |
| Danish | 26 | 0.9% |
| Dutch | 48 | 1.6% |
| English | 176 | 5.7% |
| European | 109 | 3.6% |
| French | 85 | 2.8% |
| German | 1,145 | 37.4% |
| Irish | 245 | 8.0% |
| Italian | 17 | 0.5% |
| Luxembourger | 10 | 0.3% |
| Mexican | 40 | 1.3% |
| Norwegian | 463 | 15.1% |
| Polish | 4 | 0.1% |
| Scandinavian | 14 | 0.5% |
| Scotch-Irish | 45 | 1.5% |
| Scottish | 29 | 0.9% |
| South African | 20 | 0.6% |
| Subsaharan African | 20 | 0.6% |
| Swedish | 43 | 1.4% | View All 23 Rows |
Immigrants in Garner
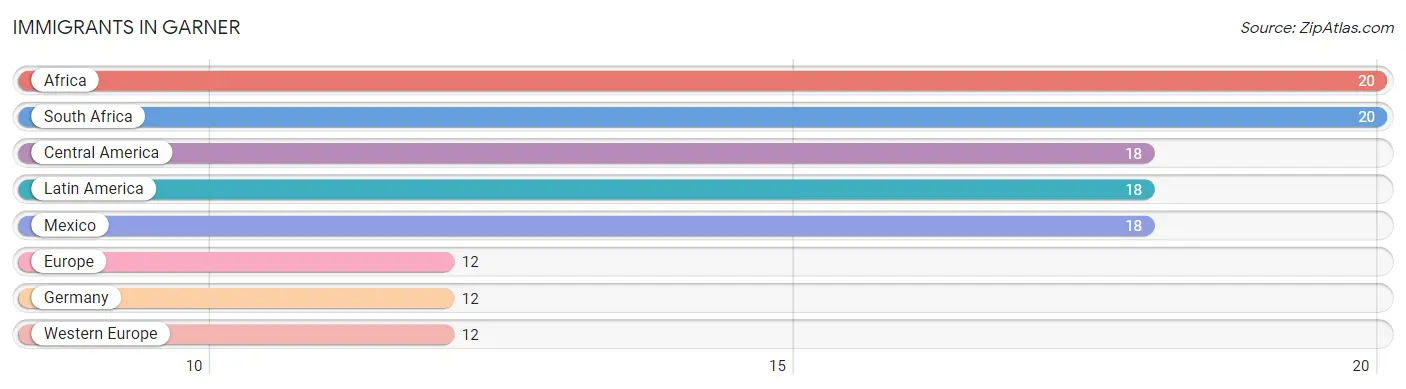
The most numerous immigrant groups reported in Garner came from Africa (20 | 0.6%), South Africa (20 | 0.6%), Central America (18 | 0.6%), Latin America (18 | 0.6%), and Mexico (18 | 0.6%), together accounting for 3.1% of all Garner residents.
| Immigration Origin | # Population | % Population |
| Africa | 20 | 0.6% |
| Central America | 18 | 0.6% |
| Europe | 12 | 0.4% |
| Germany | 12 | 0.4% |
| Latin America | 18 | 0.6% |
| Mexico | 18 | 0.6% |
| South Africa | 20 | 0.6% |
| Western Europe | 12 | 0.4% | View All 8 Rows |
Sex and Age in Garner
Sex and Age in Garner
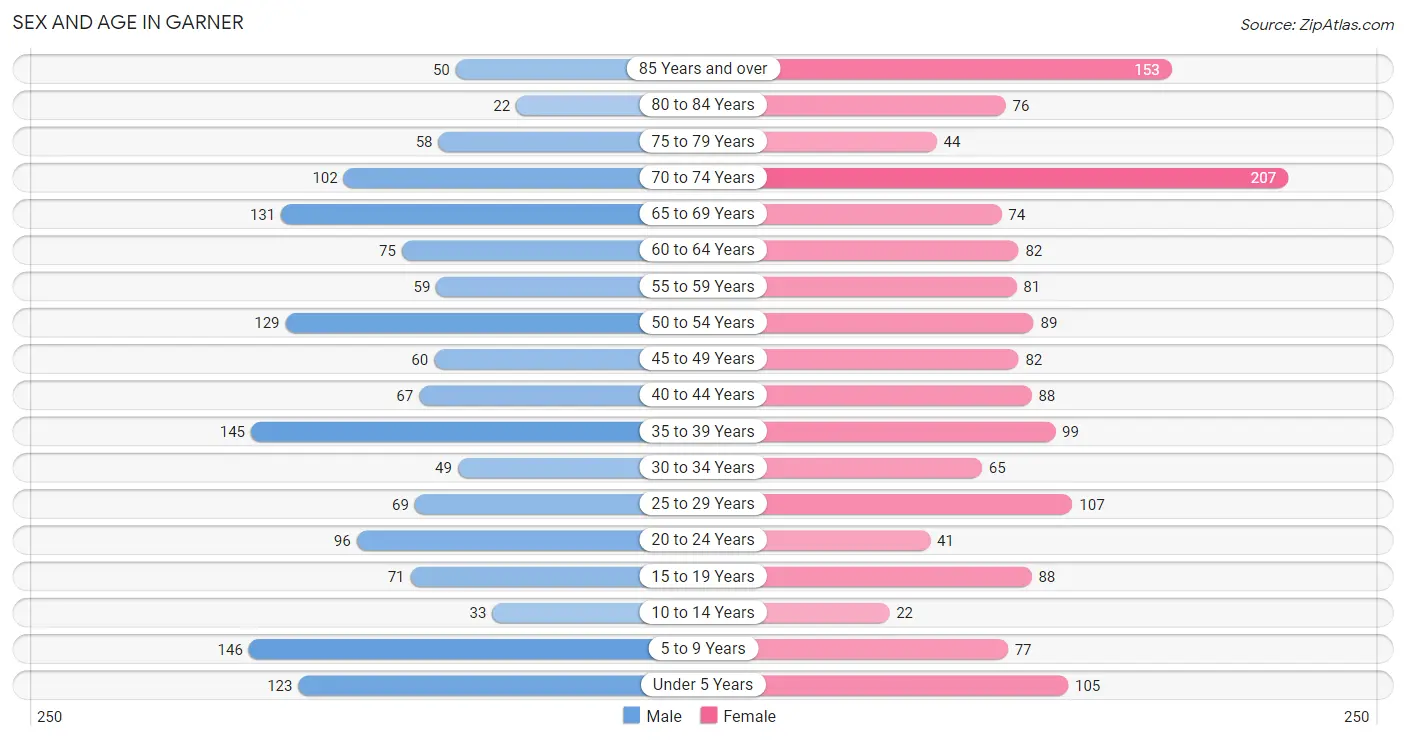
The most populous age groups in Garner are 5 to 9 Years (146 | 9.8%) for men and 70 to 74 Years (207 | 13.1%) for women.
| Age Bracket | Male | Female |
| Under 5 Years | 123 (8.3%) | 105 (6.7%) |
| 5 to 9 Years | 146 (9.8%) | 77 (4.9%) |
| 10 to 14 Years | 33 (2.2%) | 22 (1.4%) |
| 15 to 19 Years | 71 (4.8%) | 88 (5.6%) |
| 20 to 24 Years | 96 (6.5%) | 41 (2.6%) |
| 25 to 29 Years | 69 (4.6%) | 107 (6.8%) |
| 30 to 34 Years | 49 (3.3%) | 65 (4.1%) |
| 35 to 39 Years | 145 (9.8%) | 99 (6.3%) |
| 40 to 44 Years | 67 (4.5%) | 88 (5.6%) |
| 45 to 49 Years | 60 (4.0%) | 82 (5.2%) |
| 50 to 54 Years | 129 (8.7%) | 89 (5.6%) |
| 55 to 59 Years | 59 (4.0%) | 81 (5.1%) |
| 60 to 64 Years | 75 (5.1%) | 82 (5.2%) |
| 65 to 69 Years | 131 (8.8%) | 74 (4.7%) |
| 70 to 74 Years | 102 (6.9%) | 207 (13.1%) |
| 75 to 79 Years | 58 (3.9%) | 44 (2.8%) |
| 80 to 84 Years | 22 (1.5%) | 76 (4.8%) |
| 85 Years and over | 50 (3.4%) | 153 (9.7%) |
| Total | 1,485 (100.0%) | 1,580 (100.0%) |
Families and Households in Garner
Median Family Size in Garner
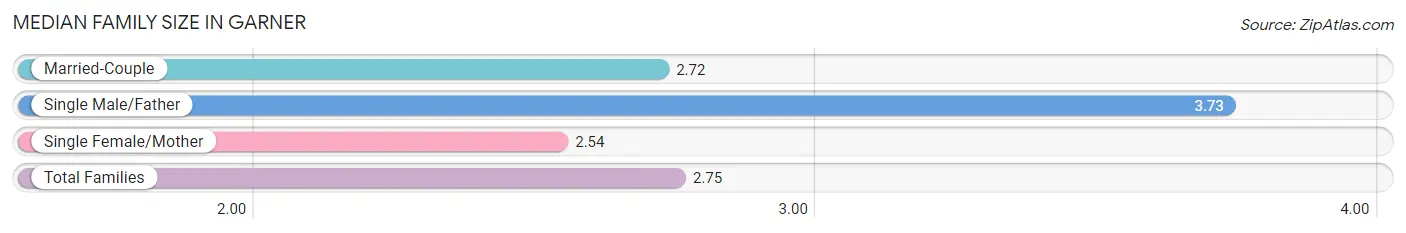
The median family size in Garner is 2.75 persons per family, with single male/father families (51 | 5.5%) accounting for the largest median family size of 3.73 persons per family. On the other hand, single female/mother families (125 | 13.5%) represent the smallest median family size with 2.54 persons per family.
| Family Type | # Families | Family Size |
| Married-Couple | 751 (81.0%) | 2.72 |
| Single Male/Father | 51 (5.5%) | 3.73 |
| Single Female/Mother | 125 (13.5%) | 2.54 |
| Total Families | 927 (100.0%) | 2.75 |
Median Household Size in Garner
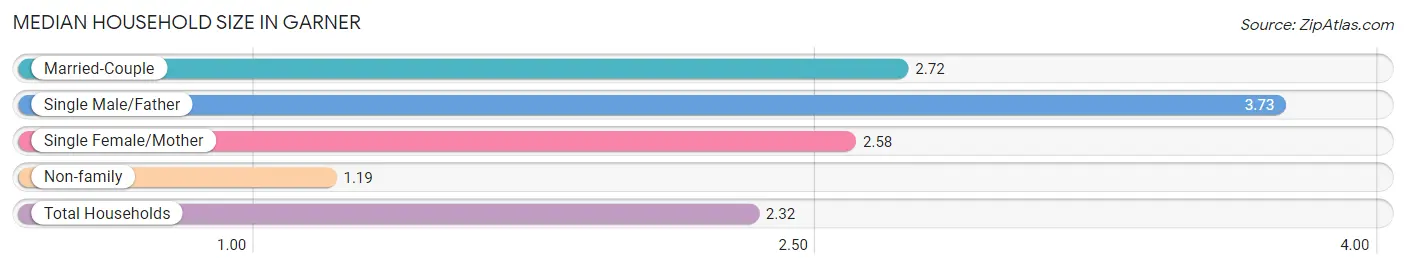
The median household size in Garner is 2.32 persons per household, with single male/father households (51 | 4.0%) accounting for the largest median household size of 3.73 persons per household. non-family households (360 | 28.0%) represent the smallest median household size with 1.19 persons per household.
| Household Type | # Households | Household Size |
| Married-Couple | 751 (58.4%) | 2.72 |
| Single Male/Father | 51 (4.0%) | 3.73 |
| Single Female/Mother | 125 (9.7%) | 2.58 |
| Non-family | 360 (28.0%) | 1.19 |
| Total Households | 1,287 (100.0%) | 2.32 |
Household Size by Marriage Status in Garner
Out of a total of 1,287 households in Garner, 927 (72.0%) are family households, while 360 (28.0%) are nonfamily households. The most numerous type of family households are 2-person households, comprising 531, and the most common type of nonfamily households are 1-person households, comprising 296.
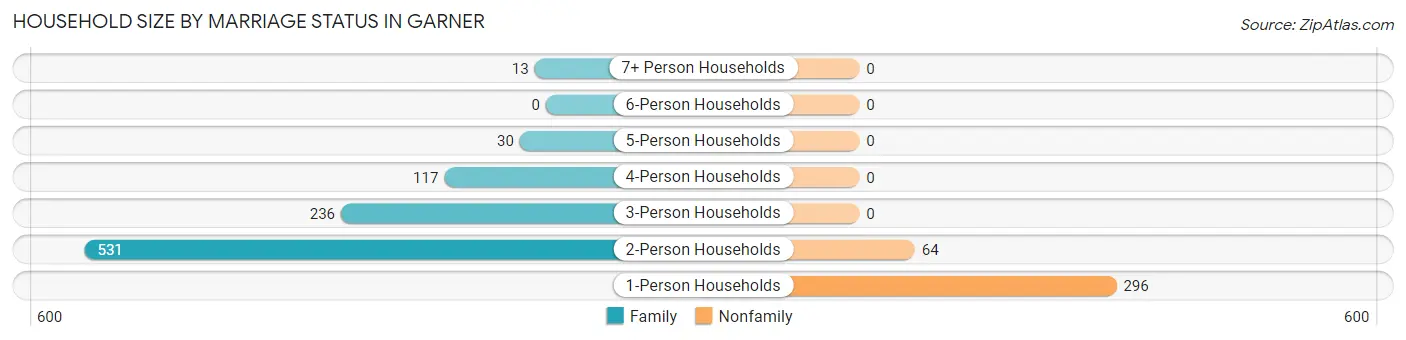
| Household Size | Family Households | Nonfamily Households |
| 1-Person Households | - | 296 (23.0%) |
| 2-Person Households | 531 (41.3%) | 64 (5.0%) |
| 3-Person Households | 236 (18.3%) | 0 (0.0%) |
| 4-Person Households | 117 (9.1%) | 0 (0.0%) |
| 5-Person Households | 30 (2.3%) | 0 (0.0%) |
| 6-Person Households | 0 (0.0%) | 0 (0.0%) |
| 7+ Person Households | 13 (1.0%) | 0 (0.0%) |
| Total | 927 (72.0%) | 360 (28.0%) |
Female Fertility in Garner
Fertility by Age in Garner
Average fertility rate in Garner is 41.0 births per 1,000 women. Women in the age bracket of 20 to 34 years have the highest fertility rate with 113.0 births per 1,000 women. Women in the age bracket of 20 to 34 years acount for 100.0% of all women with births.
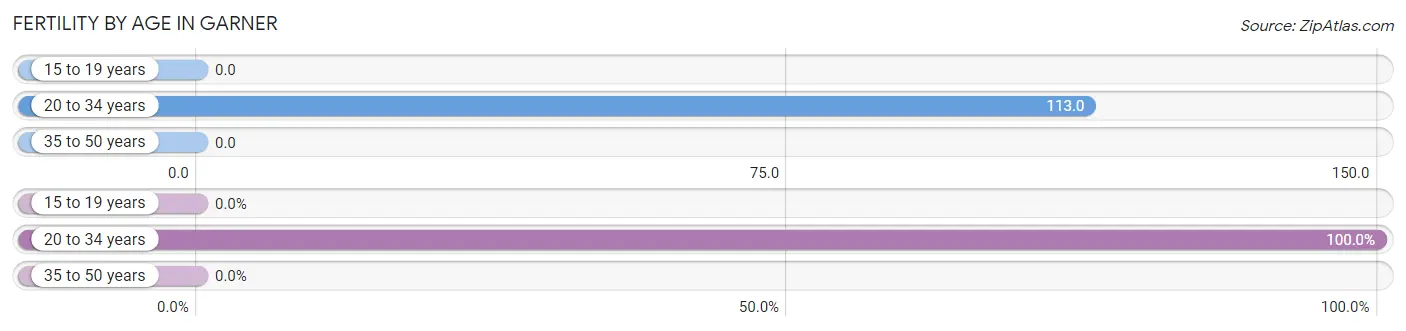
| Age Bracket | Women with Births | Births / 1,000 Women |
| 15 to 19 years | 0 (0.0%) | 0.0 |
| 20 to 34 years | 24 (100.0%) | 113.0 |
| 35 to 50 years | 0 (0.0%) | 0.0 |
| Total | 24 (100.0%) | 41.0 |
Fertility by Age by Marriage Status in Garner
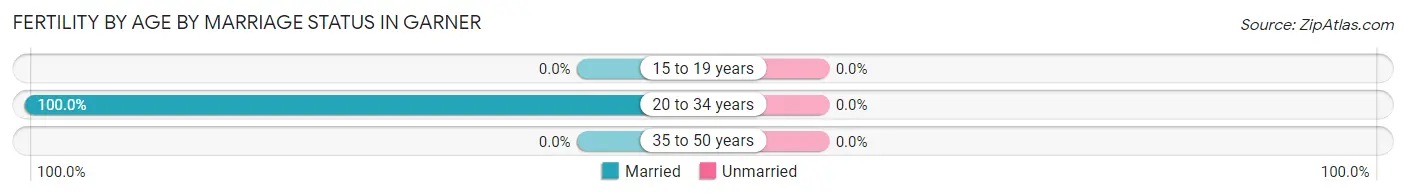
| Age Bracket | Married | Unmarried |
| 15 to 19 years | 0 (0.0%) | 0 (0.0%) |
| 20 to 34 years | 24 (100.0%) | 0 (0.0%) |
| 35 to 50 years | 0 (0.0%) | 0 (0.0%) |
| Total | 24 (100.0%) | 0 (0.0%) |
Fertility by Education in Garner
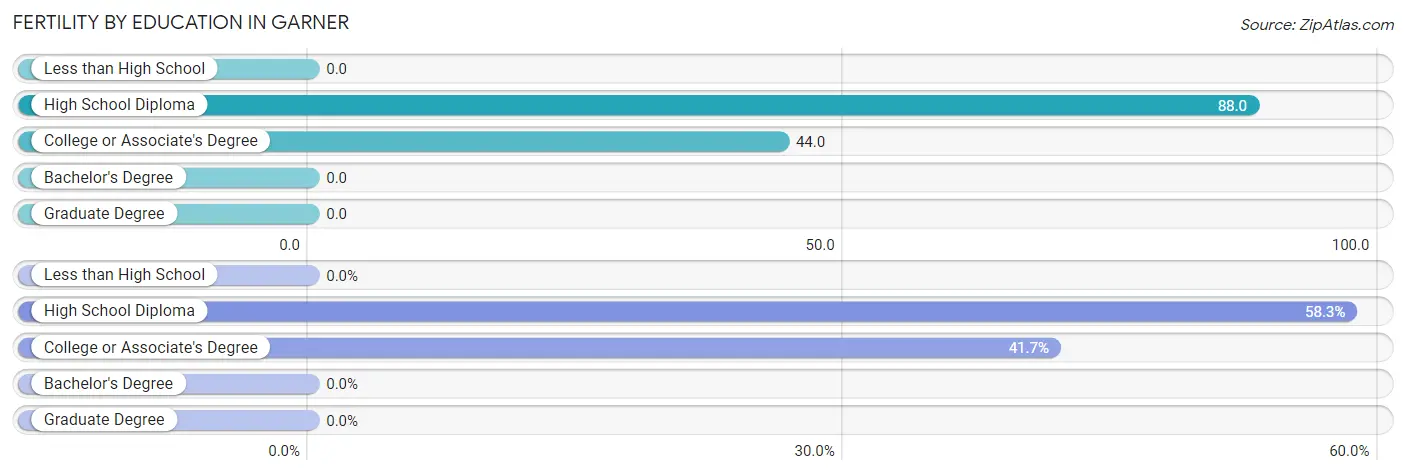
| Educational Attainment | Women with Births | Births / 1,000 Women |
| Less than High School | 0 (0.0%) | 0.0 |
| High School Diploma | 14 (58.3%) | 88.0 |
| College or Associate's Degree | 10 (41.7%) | 44.0 |
| Bachelor's Degree | 0 (0.0%) | 0.0 |
| Graduate Degree | 0 (0.0%) | 0.0 |
| Total | 24 (100.0%) | 41.0 |
Fertility by Education by Marriage Status in Garner
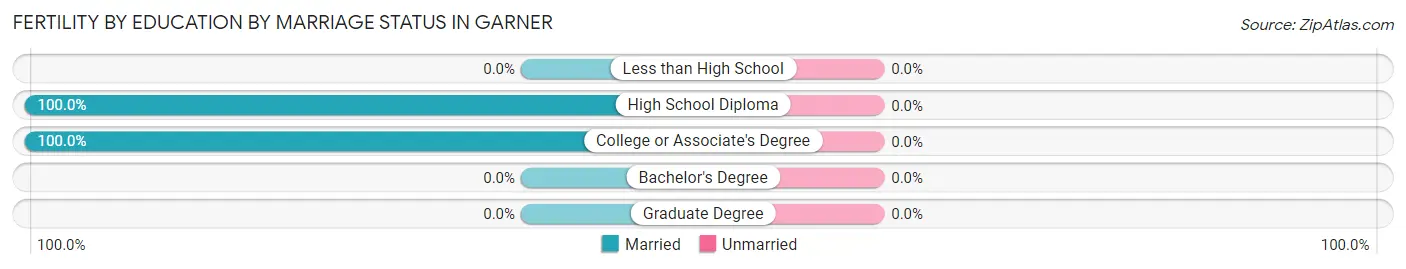
| Educational Attainment | Married | Unmarried |
| Less than High School | 0 (0.0%) | 0 (0.0%) |
| High School Diploma | 14 (100.0%) | 0 (0.0%) |
| College or Associate's Degree | 10 (100.0%) | 0 (0.0%) |
| Bachelor's Degree | 0 (0.0%) | 0 (0.0%) |
| Graduate Degree | 0 (0.0%) | 0 (0.0%) |
| Total | 24 (100.0%) | 0 (0.0%) |
Employment Characteristics in Garner
Employment by Class of Employer in Garner
Among the 1,497 employed individuals in Garner, private company employees (1,022 | 68.3%), not-for-profit organizations (125 | 8.4%), and local government employees (125 | 8.4%) make up the most common classes of employment.
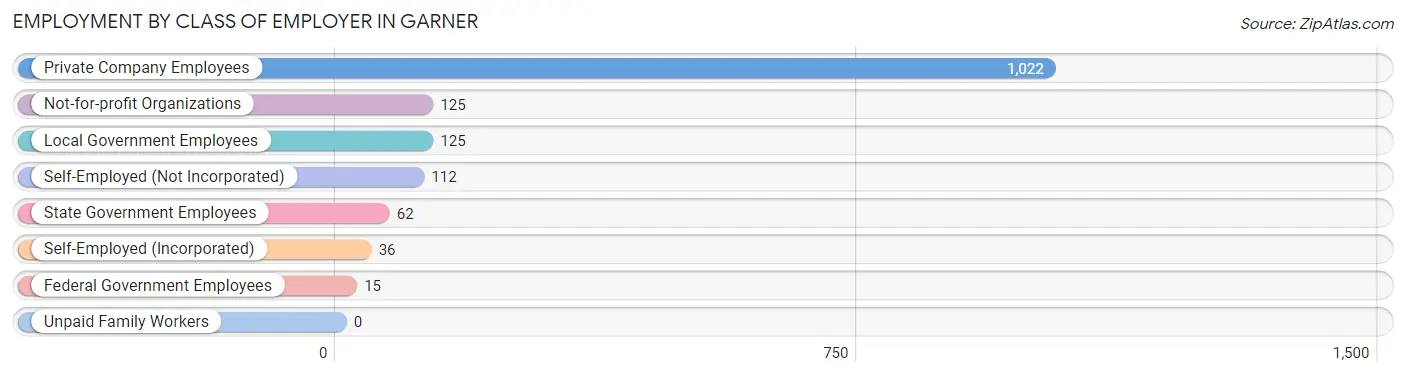
| Employer Class | # Employees | % Employees |
| Private Company Employees | 1,022 | 68.3% |
| Self-Employed (Incorporated) | 36 | 2.4% |
| Self-Employed (Not Incorporated) | 112 | 7.5% |
| Not-for-profit Organizations | 125 | 8.4% |
| Local Government Employees | 125 | 8.4% |
| State Government Employees | 62 | 4.1% |
| Federal Government Employees | 15 | 1.0% |
| Unpaid Family Workers | 0 | 0.0% |
| Total | 1,497 | 100.0% |
Employment Status by Age in Garner
According to the labor force statistics for Garner, out of the total population over 16 years of age (2,521), 60.5% or 1,525 individuals are in the labor force, with 1.8% or 27 of them unemployed. The age group with the highest labor force participation rate is 30 to 34 years, with 100.0% or 114 individuals in the labor force. Within the labor force, the 35 to 44 years age range has the highest percentage of unemployed individuals, with 6.9% or 27 of them being unemployed.
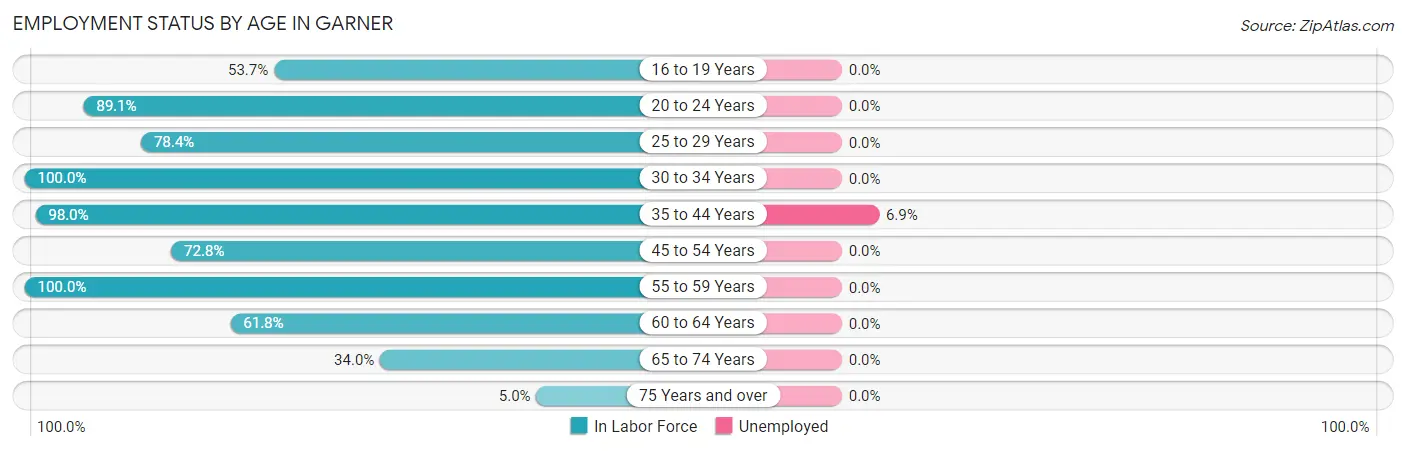
| Age Bracket | In Labor Force | Unemployed |
| 16 to 19 Years | 65 (53.7%) | 0 (0.0%) |
| 20 to 24 Years | 122 (89.1%) | 0 (0.0%) |
| 25 to 29 Years | 138 (78.4%) | 0 (0.0%) |
| 30 to 34 Years | 114 (100.0%) | 0 (0.0%) |
| 35 to 44 Years | 391 (98.0%) | 27 (6.9%) |
| 45 to 54 Years | 262 (72.8%) | 0 (0.0%) |
| 55 to 59 Years | 140 (100.0%) | 0 (0.0%) |
| 60 to 64 Years | 97 (61.8%) | 0 (0.0%) |
| 65 to 74 Years | 175 (34.0%) | 0 (0.0%) |
| 75 Years and over | 20 (5.0%) | 0 (0.0%) |
| Total | 1,525 (60.5%) | 27 (1.8%) |
Employment Status by Educational Attainment in Garner
According to labor force statistics for Garner, 84.8% of individuals (1,141) out of the total population between 25 and 64 years of age (1,346) are in the labor force, with 2.4% or 27 of them being unemployed. The group with the highest labor force participation rate are those with the educational attainment of college / associate degree, with 90.8% or 505 individuals in the labor force. Within the labor force, individuals with less than high school education have the highest percentage of unemployment, with 68.8% or 22 of them being unemployed.
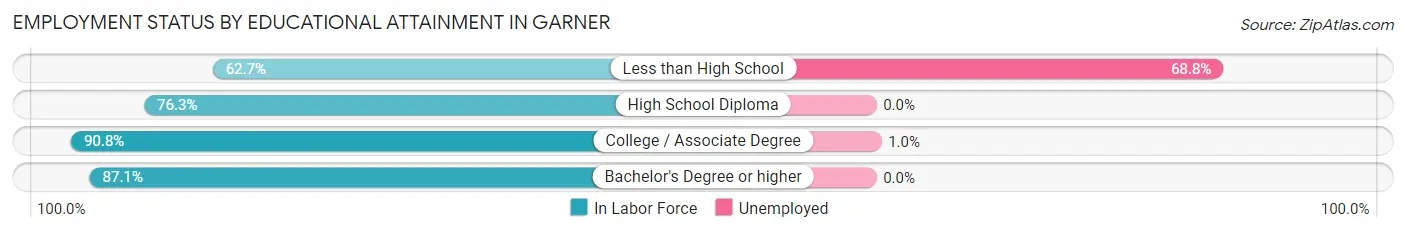
| Educational Attainment | In Labor Force | Unemployed |
| Less than High School | 32 (62.7%) | 35 (68.8%) |
| High School Diploma | 273 (76.3%) | 0 (0.0%) |
| College / Associate Degree | 505 (90.8%) | 6 (1.0%) |
| Bachelor's Degree or higher | 332 (87.1%) | 0 (0.0%) |
| Total | 1,141 (84.8%) | 32 (2.4%) |
Employment Occupations by Sex in Garner
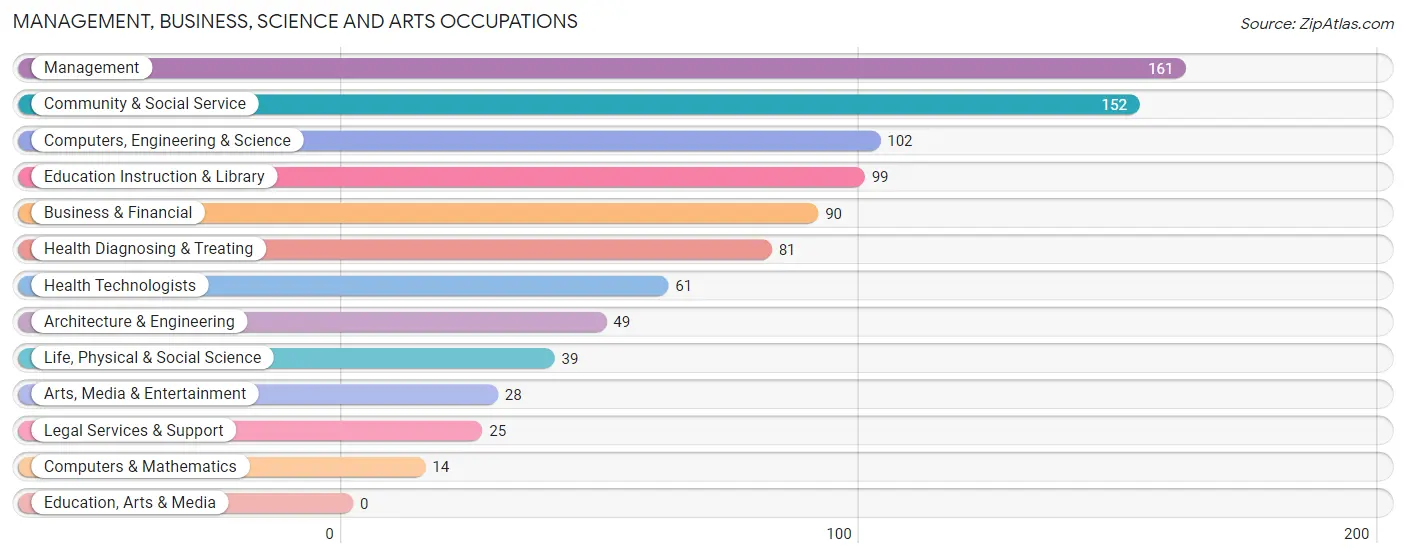
Management, Business, Science and Arts Occupations
The most common Management, Business, Science and Arts occupations in Garner are Management (161 | 10.7%), Community & Social Service (152 | 10.2%), Computers, Engineering & Science (102 | 6.8%), Education Instruction & Library (99 | 6.6%), and Business & Financial (90 | 6.0%).
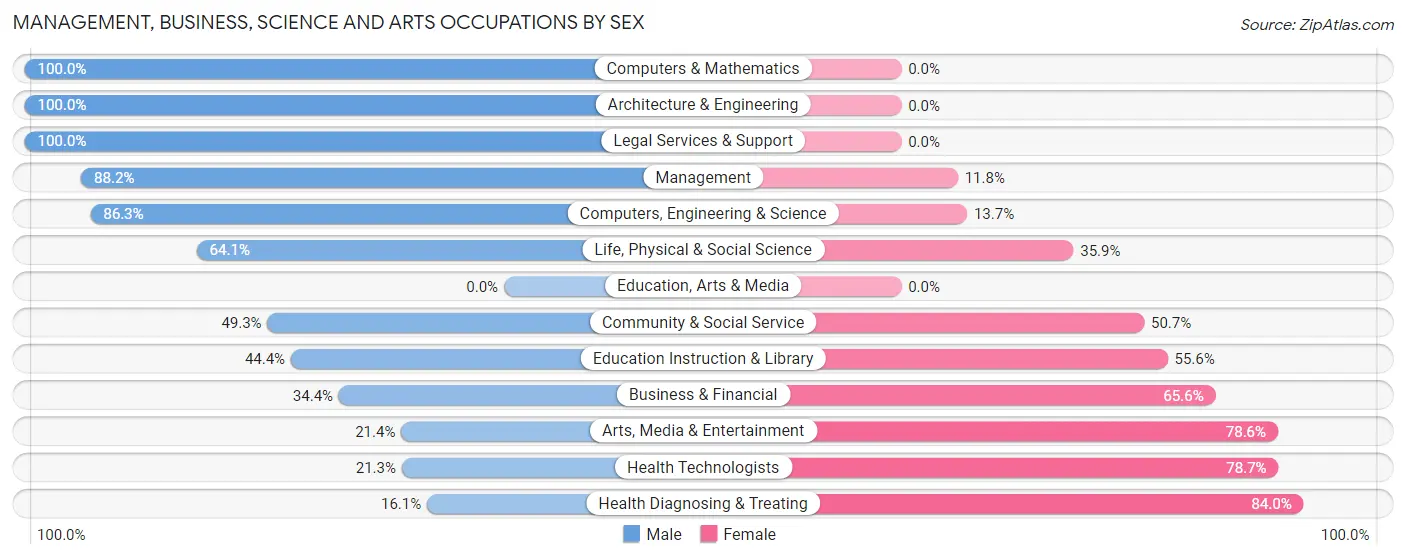
Management, Business, Science and Arts Occupations by Sex
Within the Management, Business, Science and Arts occupations in Garner, the most male-oriented occupations are Computers & Mathematics (100.0%), Architecture & Engineering (100.0%), and Legal Services & Support (100.0%), while the most female-oriented occupations are Health Diagnosing & Treating (84.0%), Health Technologists (78.7%), and Arts, Media & Entertainment (78.6%).
| Occupation | Male | Female |
| Management | 142 (88.2%) | 19 (11.8%) |
| Business & Financial | 31 (34.4%) | 59 (65.6%) |
| Computers, Engineering & Science | 88 (86.3%) | 14 (13.7%) |
| Computers & Mathematics | 14 (100.0%) | 0 (0.0%) |
| Architecture & Engineering | 49 (100.0%) | 0 (0.0%) |
| Life, Physical & Social Science | 25 (64.1%) | 14 (35.9%) |
| Community & Social Service | 75 (49.3%) | 77 (50.7%) |
| Education, Arts & Media | 0 (0.0%) | 0 (0.0%) |
| Legal Services & Support | 25 (100.0%) | 0 (0.0%) |
| Education Instruction & Library | 44 (44.4%) | 55 (55.6%) |
| Arts, Media & Entertainment | 6 (21.4%) | 22 (78.6%) |
| Health Diagnosing & Treating | 13 (16.1%) | 68 (84.0%) |
| Health Technologists | 13 (21.3%) | 48 (78.7%) |
| Total (Category) | 349 (59.6%) | 237 (40.4%) |
| Total (Overall) | 757 (50.6%) | 740 (49.4%) |
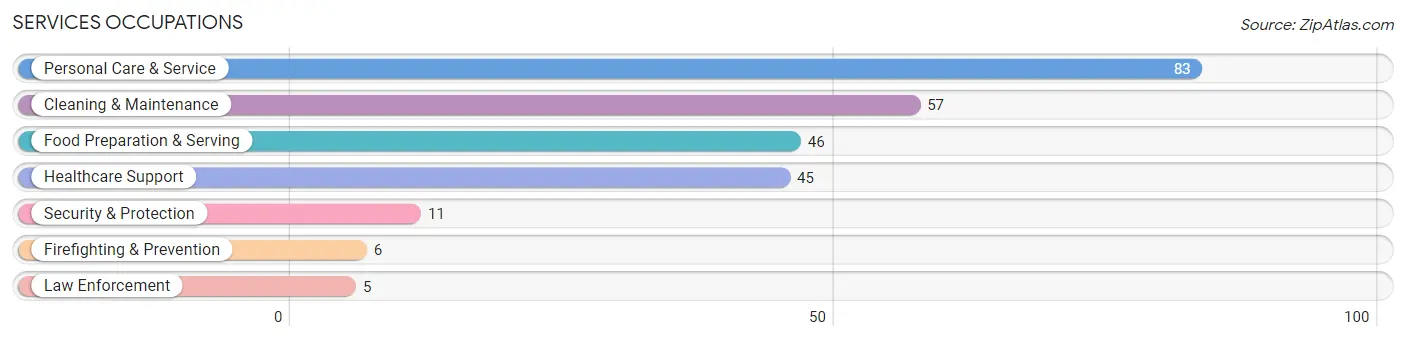
Services Occupations
The most common Services occupations in Garner are Personal Care & Service (83 | 5.5%), Cleaning & Maintenance (57 | 3.8%), Food Preparation & Serving (46 | 3.1%), Healthcare Support (45 | 3.0%), and Security & Protection (11 | 0.7%).
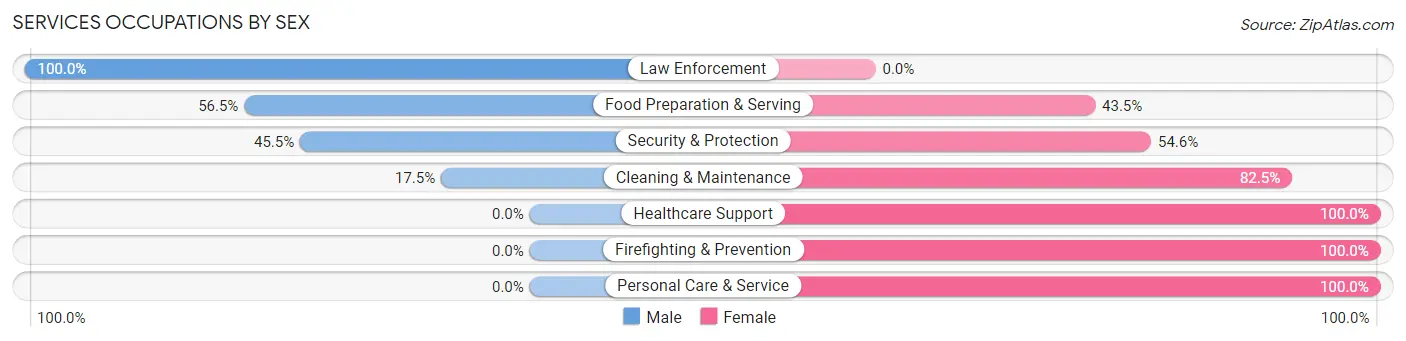
Services Occupations by Sex
Within the Services occupations in Garner, the most male-oriented occupations are Law Enforcement (100.0%), Food Preparation & Serving (56.5%), and Security & Protection (45.5%), while the most female-oriented occupations are Healthcare Support (100.0%), Firefighting & Prevention (100.0%), and Personal Care & Service (100.0%).
| Occupation | Male | Female |
| Healthcare Support | 0 (0.0%) | 45 (100.0%) |
| Security & Protection | 5 (45.5%) | 6 (54.5%) |
| Firefighting & Prevention | 0 (0.0%) | 6 (100.0%) |
| Law Enforcement | 5 (100.0%) | 0 (0.0%) |
| Food Preparation & Serving | 26 (56.5%) | 20 (43.5%) |
| Cleaning & Maintenance | 10 (17.5%) | 47 (82.5%) |
| Personal Care & Service | 0 (0.0%) | 83 (100.0%) |
| Total (Category) | 41 (16.9%) | 201 (83.1%) |
| Total (Overall) | 757 (50.6%) | 740 (49.4%) |
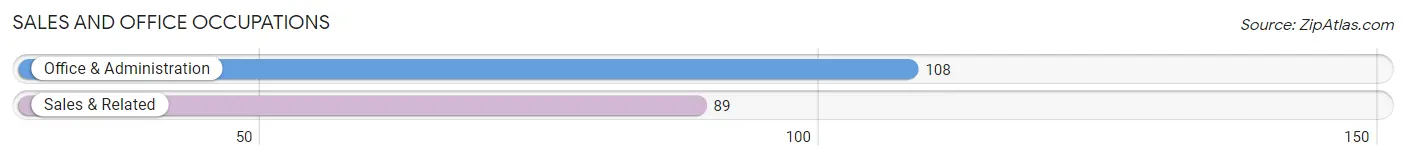
Sales and Office Occupations
The most common Sales and Office occupations in Garner are Office & Administration (108 | 7.2%), and Sales & Related (89 | 5.9%).
Sales and Office Occupations by Sex
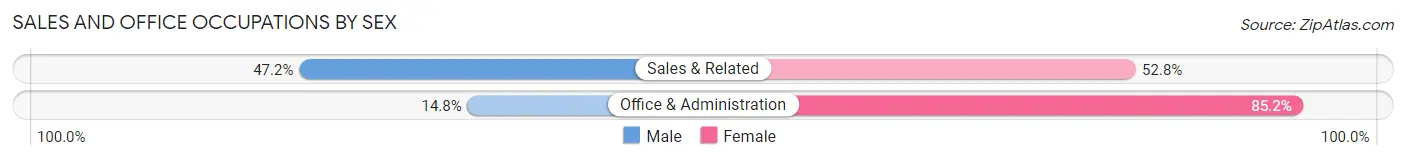
| Occupation | Male | Female |
| Sales & Related | 42 (47.2%) | 47 (52.8%) |
| Office & Administration | 16 (14.8%) | 92 (85.2%) |
| Total (Category) | 58 (29.4%) | 139 (70.6%) |
| Total (Overall) | 757 (50.6%) | 740 (49.4%) |
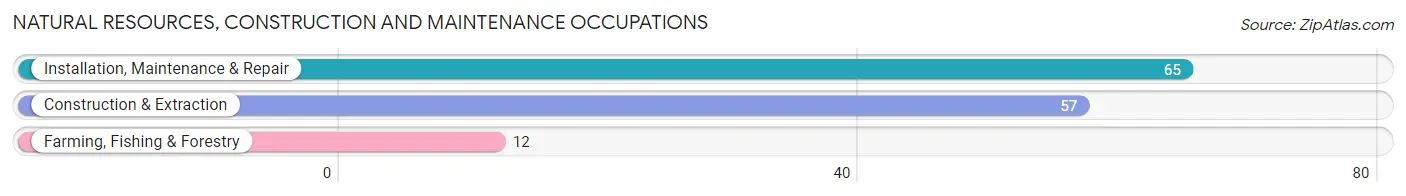
Natural Resources, Construction and Maintenance Occupations
The most common Natural Resources, Construction and Maintenance occupations in Garner are Installation, Maintenance & Repair (65 | 4.3%), Construction & Extraction (57 | 3.8%), and Farming, Fishing & Forestry (12 | 0.8%).
Natural Resources, Construction and Maintenance Occupations by Sex
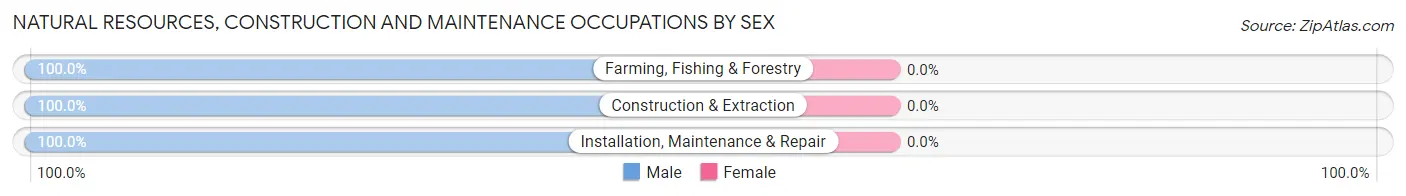
| Occupation | Male | Female |
| Farming, Fishing & Forestry | 12 (100.0%) | 0 (0.0%) |
| Construction & Extraction | 57 (100.0%) | 0 (0.0%) |
| Installation, Maintenance & Repair | 65 (100.0%) | 0 (0.0%) |
| Total (Category) | 134 (100.0%) | 0 (0.0%) |
| Total (Overall) | 757 (50.6%) | 740 (49.4%) |
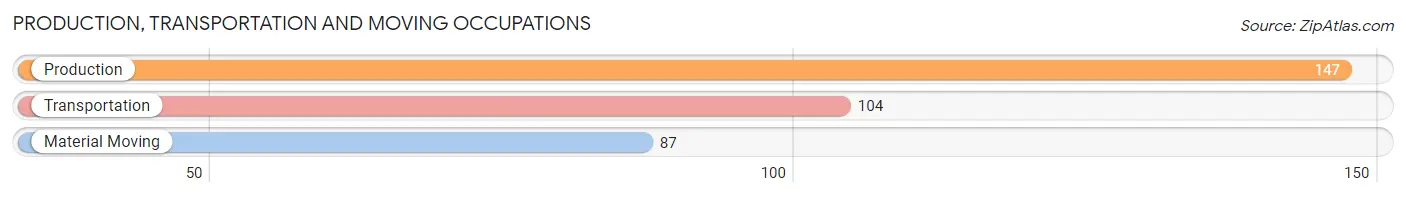
Production, Transportation and Moving Occupations
The most common Production, Transportation and Moving occupations in Garner are Production (147 | 9.8%), Transportation (104 | 7.0%), and Material Moving (87 | 5.8%).
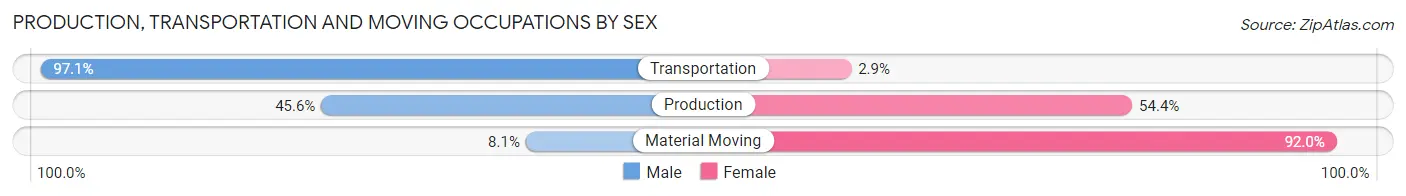
Production, Transportation and Moving Occupations by Sex
| Occupation | Male | Female |
| Production | 67 (45.6%) | 80 (54.4%) |
| Transportation | 101 (97.1%) | 3 (2.9%) |
| Material Moving | 7 (8.1%) | 80 (91.9%) |
| Total (Category) | 175 (51.8%) | 163 (48.2%) |
| Total (Overall) | 757 (50.6%) | 740 (49.4%) |
Employment Industries by Sex in Garner
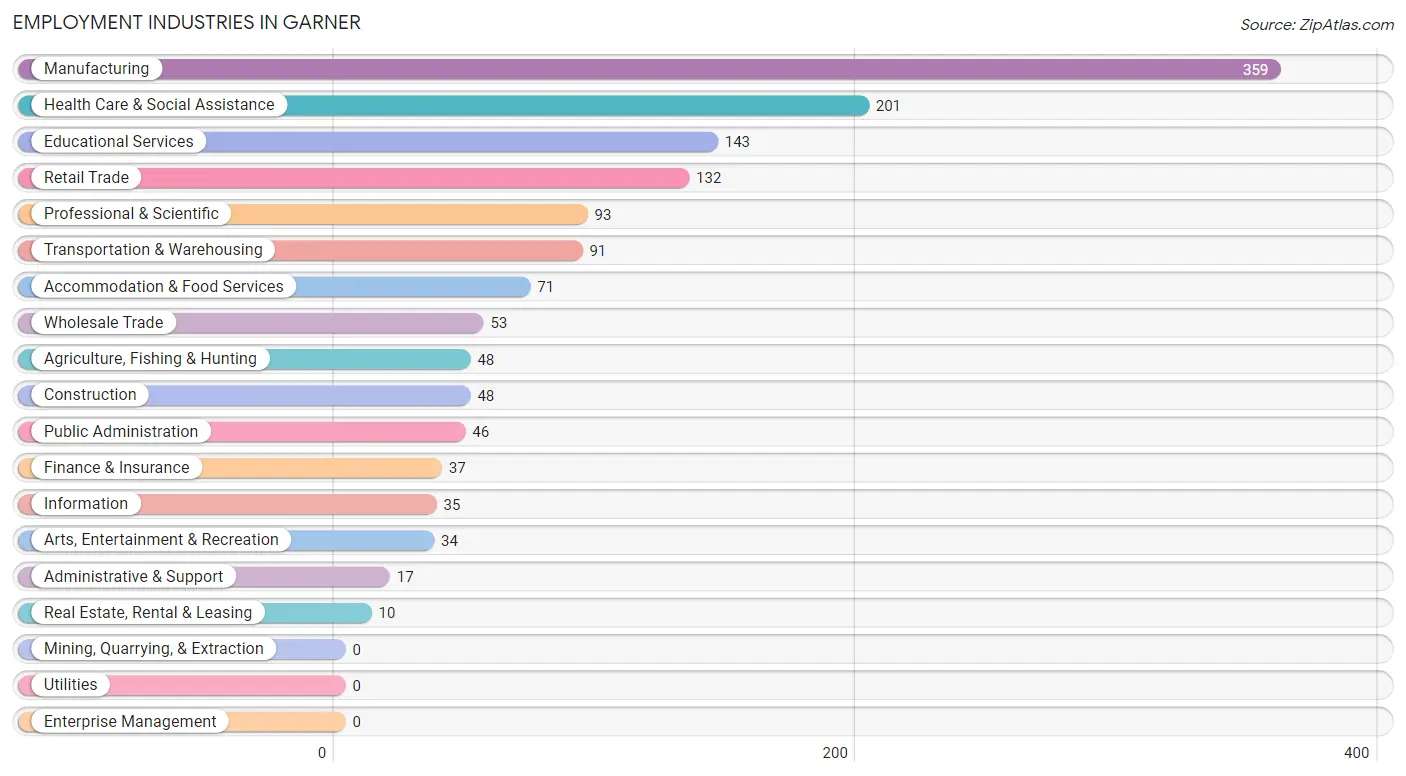
Employment Industries in Garner
The major employment industries in Garner include Manufacturing (359 | 24.0%), Health Care & Social Assistance (201 | 13.4%), Educational Services (143 | 9.6%), Retail Trade (132 | 8.8%), and Professional & Scientific (93 | 6.2%).
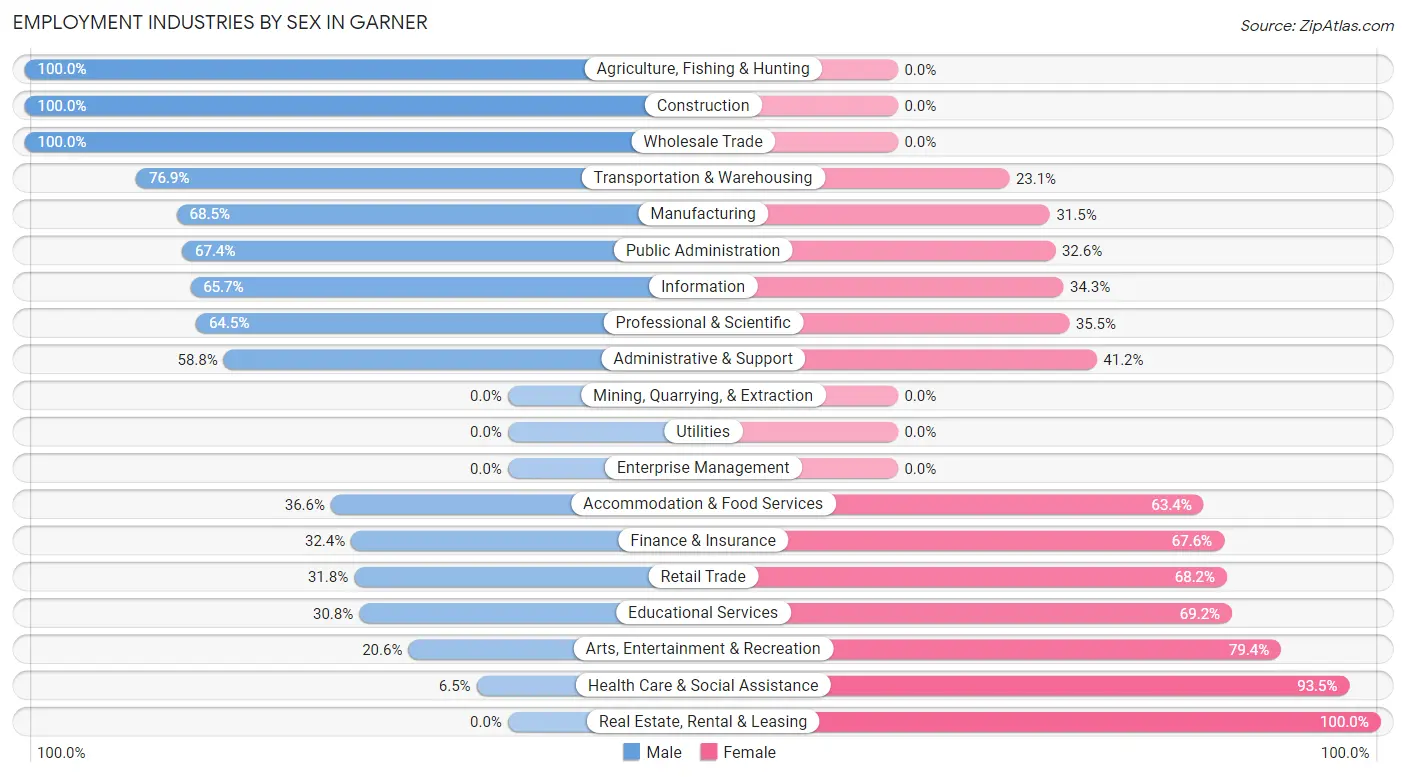
Employment Industries by Sex in Garner
The Garner industries that see more men than women are Agriculture, Fishing & Hunting (100.0%), Construction (100.0%), and Wholesale Trade (100.0%), whereas the industries that tend to have a higher number of women are Real Estate, Rental & Leasing (100.0%), Health Care & Social Assistance (93.5%), and Arts, Entertainment & Recreation (79.4%).
| Industry | Male | Female |
| Agriculture, Fishing & Hunting | 48 (100.0%) | 0 (0.0%) |
| Mining, Quarrying, & Extraction | 0 (0.0%) | 0 (0.0%) |
| Construction | 48 (100.0%) | 0 (0.0%) |
| Manufacturing | 246 (68.5%) | 113 (31.5%) |
| Wholesale Trade | 53 (100.0%) | 0 (0.0%) |
| Retail Trade | 42 (31.8%) | 90 (68.2%) |
| Transportation & Warehousing | 70 (76.9%) | 21 (23.1%) |
| Utilities | 0 (0.0%) | 0 (0.0%) |
| Information | 23 (65.7%) | 12 (34.3%) |
| Finance & Insurance | 12 (32.4%) | 25 (67.6%) |
| Real Estate, Rental & Leasing | 0 (0.0%) | 10 (100.0%) |
| Professional & Scientific | 60 (64.5%) | 33 (35.5%) |
| Enterprise Management | 0 (0.0%) | 0 (0.0%) |
| Administrative & Support | 10 (58.8%) | 7 (41.2%) |
| Educational Services | 44 (30.8%) | 99 (69.2%) |
| Health Care & Social Assistance | 13 (6.5%) | 188 (93.5%) |
| Arts, Entertainment & Recreation | 7 (20.6%) | 27 (79.4%) |
| Accommodation & Food Services | 26 (36.6%) | 45 (63.4%) |
| Public Administration | 31 (67.4%) | 15 (32.6%) |
| Total | 757 (50.6%) | 740 (49.4%) |
Education in Garner
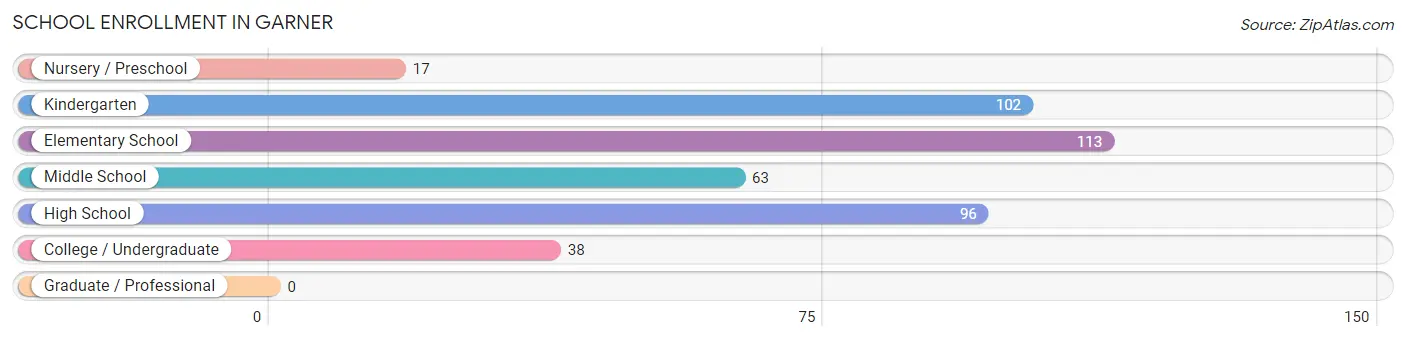
School Enrollment in Garner
The most common levels of schooling among the 429 students in Garner are elementary school (113 | 26.3%), kindergarten (102 | 23.8%), and high school (96 | 22.4%).
| School Level | # Students | % Students |
| Nursery / Preschool | 17 | 4.0% |
| Kindergarten | 102 | 23.8% |
| Elementary School | 113 | 26.3% |
| Middle School | 63 | 14.7% |
| High School | 96 | 22.4% |
| College / Undergraduate | 38 | 8.9% |
| Graduate / Professional | 0 | 0.0% |
| Total | 429 | 100.0% |
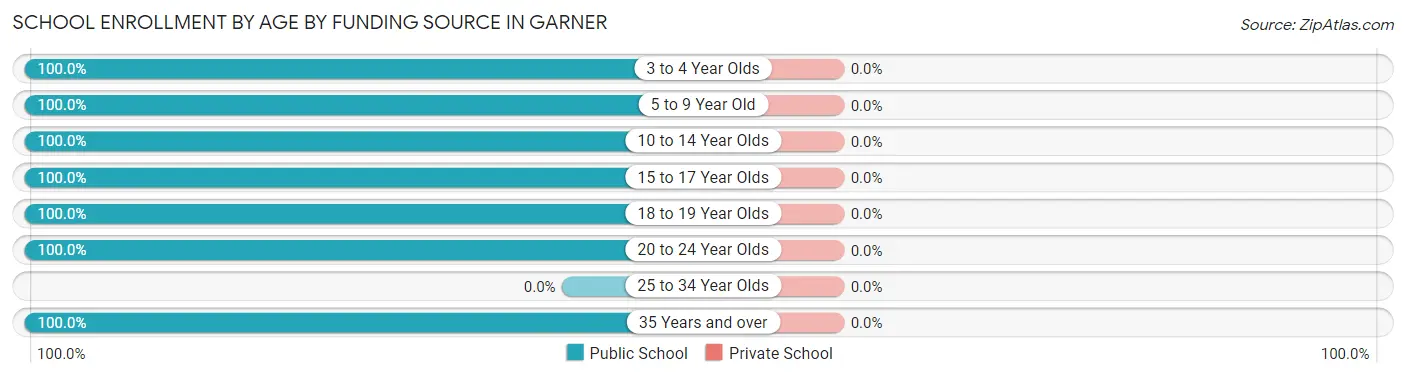
School Enrollment by Age by Funding Source in Garner
| Age Bracket | Public School | Private School |
| 3 to 4 Year Olds | 17 (100.0%) | 0 (0.0%) |
| 5 to 9 Year Old | 223 (100.0%) | 0 (0.0%) |
| 10 to 14 Year Olds | 55 (100.0%) | 0 (0.0%) |
| 15 to 17 Year Olds | 89 (100.0%) | 0 (0.0%) |
| 18 to 19 Year Olds | 28 (100.0%) | 0 (0.0%) |
| 20 to 24 Year Olds | 6 (100.0%) | 0 (0.0%) |
| 25 to 34 Year Olds | 0 (0.0%) | 0 (0.0%) |
| 35 Years and over | 11 (100.0%) | 0 (0.0%) |
| Total | 429 (100.0%) | 0 (0.0%) |
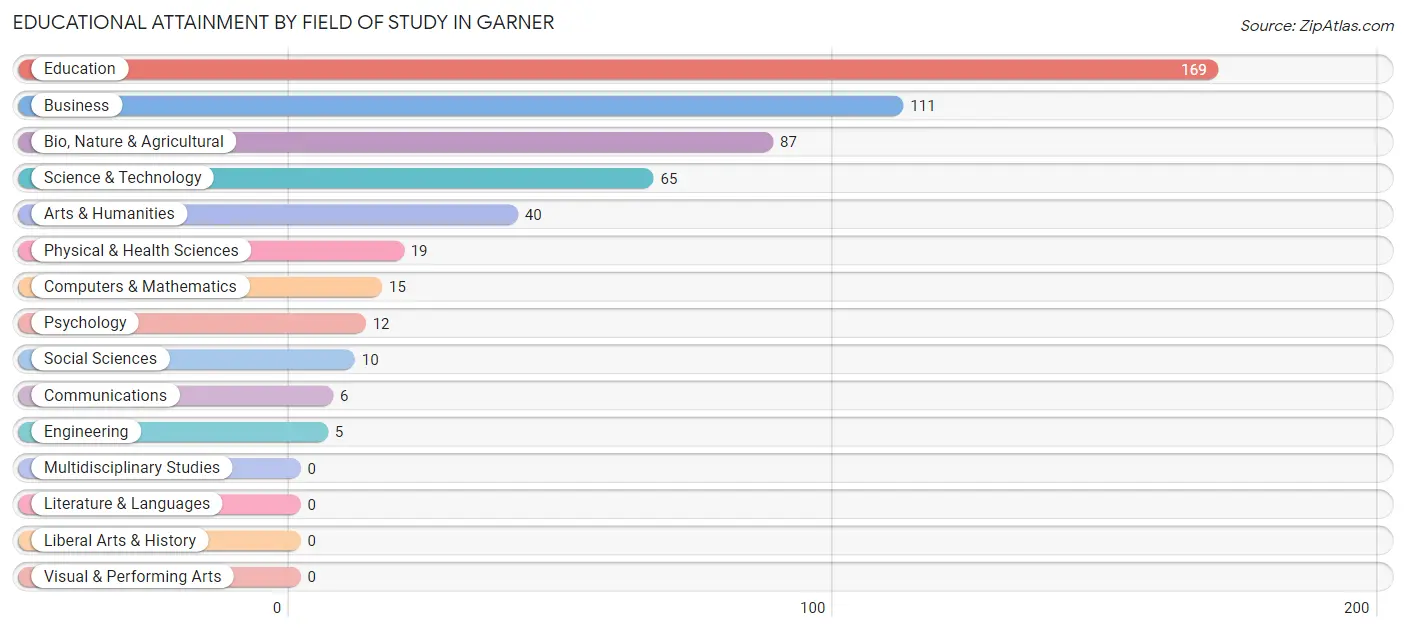
Educational Attainment by Field of Study in Garner
Education (169 | 31.4%), business (111 | 20.6%), bio, nature & agricultural (87 | 16.1%), science & technology (65 | 12.1%), and arts & humanities (40 | 7.4%) are the most common fields of study among 539 individuals in Garner who have obtained a bachelor's degree or higher.
| Field of Study | # Graduates | % Graduates |
| Computers & Mathematics | 15 | 2.8% |
| Bio, Nature & Agricultural | 87 | 16.1% |
| Physical & Health Sciences | 19 | 3.5% |
| Psychology | 12 | 2.2% |
| Social Sciences | 10 | 1.9% |
| Engineering | 5 | 0.9% |
| Multidisciplinary Studies | 0 | 0.0% |
| Science & Technology | 65 | 12.1% |
| Business | 111 | 20.6% |
| Education | 169 | 31.4% |
| Literature & Languages | 0 | 0.0% |
| Liberal Arts & History | 0 | 0.0% |
| Visual & Performing Arts | 0 | 0.0% |
| Communications | 6 | 1.1% |
| Arts & Humanities | 40 | 7.4% |
| Total | 539 | 100.0% |
Transportation & Commute in Garner
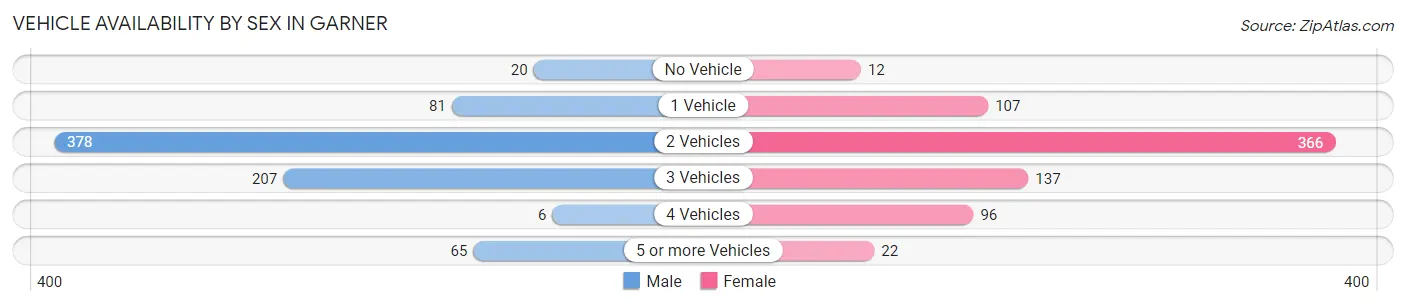
Vehicle Availability by Sex in Garner
The most prevalent vehicle ownership categories in Garner are males with 2 vehicles (378, accounting for 49.9%) and females with 2 vehicles (366, making up 51.1%).
| Vehicles Available | Male | Female |
| No Vehicle | 20 (2.6%) | 12 (1.6%) |
| 1 Vehicle | 81 (10.7%) | 107 (14.5%) |
| 2 Vehicles | 378 (49.9%) | 366 (49.5%) |
| 3 Vehicles | 207 (27.3%) | 137 (18.5%) |
| 4 Vehicles | 6 (0.8%) | 96 (13.0%) |
| 5 or more Vehicles | 65 (8.6%) | 22 (3.0%) |
| Total | 757 (100.0%) | 740 (100.0%) |
Commute Time in Garner
The most frequently occuring commute durations in Garner are 5 to 9 minutes (574 commuters, 41.1%), 20 to 24 minutes (188 commuters, 13.5%), and 30 to 34 minutes (184 commuters, 13.2%).
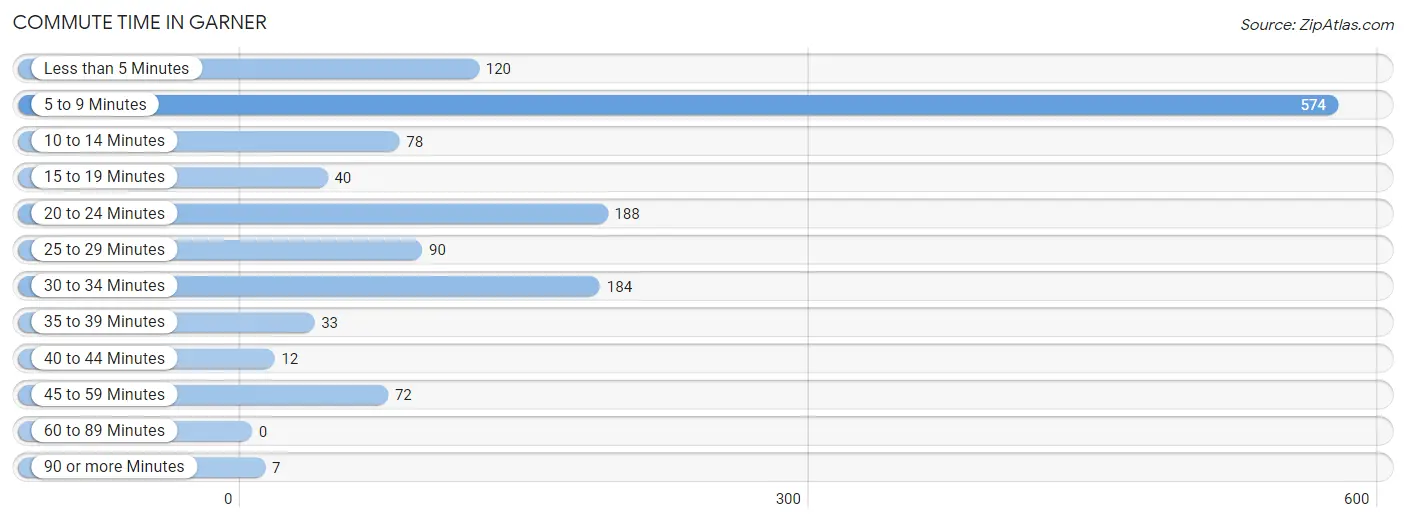
| Commute Time | # Commuters | % Commuters |
| Less than 5 Minutes | 120 | 8.6% |
| 5 to 9 Minutes | 574 | 41.1% |
| 10 to 14 Minutes | 78 | 5.6% |
| 15 to 19 Minutes | 40 | 2.9% |
| 20 to 24 Minutes | 188 | 13.5% |
| 25 to 29 Minutes | 90 | 6.4% |
| 30 to 34 Minutes | 184 | 13.2% |
| 35 to 39 Minutes | 33 | 2.4% |
| 40 to 44 Minutes | 12 | 0.9% |
| 45 to 59 Minutes | 72 | 5.1% |
| 60 to 89 Minutes | 0 | 0.0% |
| 90 or more Minutes | 7 | 0.5% |
Commute Time by Sex in Garner
The most common commute times in Garner are 5 to 9 minutes (313 commuters, 43.6%) for males and 5 to 9 minutes (261 commuters, 38.3%) for females.
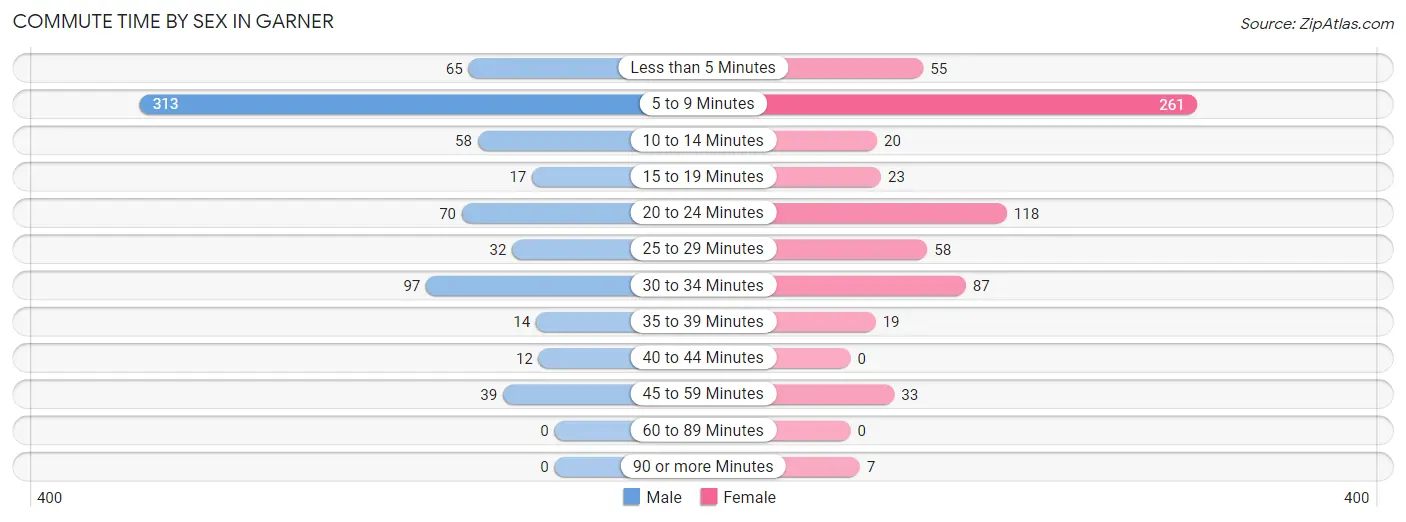
| Commute Time | Male | Female |
| Less than 5 Minutes | 65 (9.1%) | 55 (8.1%) |
| 5 to 9 Minutes | 313 (43.6%) | 261 (38.3%) |
| 10 to 14 Minutes | 58 (8.1%) | 20 (2.9%) |
| 15 to 19 Minutes | 17 (2.4%) | 23 (3.4%) |
| 20 to 24 Minutes | 70 (9.8%) | 118 (17.3%) |
| 25 to 29 Minutes | 32 (4.5%) | 58 (8.5%) |
| 30 to 34 Minutes | 97 (13.5%) | 87 (12.8%) |
| 35 to 39 Minutes | 14 (1.9%) | 19 (2.8%) |
| 40 to 44 Minutes | 12 (1.7%) | 0 (0.0%) |
| 45 to 59 Minutes | 39 (5.4%) | 33 (4.9%) |
| 60 to 89 Minutes | 0 (0.0%) | 0 (0.0%) |
| 90 or more Minutes | 0 (0.0%) | 7 (1.0%) |
Time of Departure to Work by Sex in Garner
The most frequent times of departure to work in Garner are 12:00 AM to 4:59 AM (131, 18.3%) for males and 7:30 AM to 7:59 AM (191, 28.1%) for females.
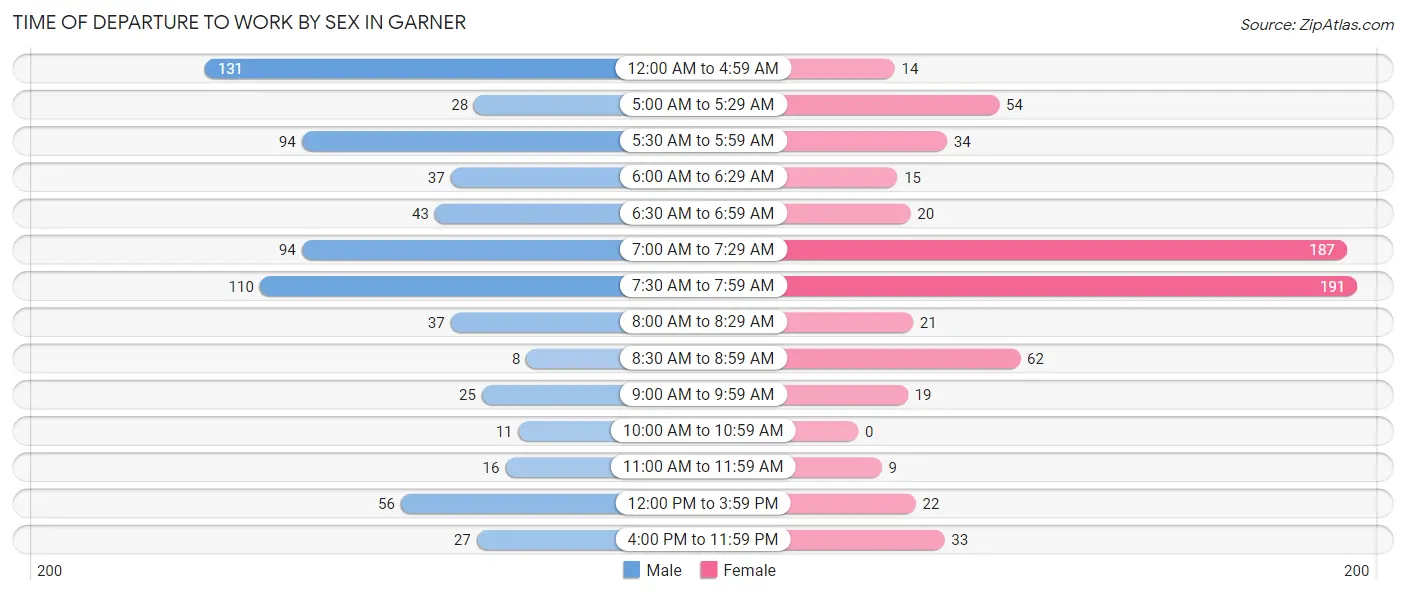
| Time of Departure | Male | Female |
| 12:00 AM to 4:59 AM | 131 (18.3%) | 14 (2.1%) |
| 5:00 AM to 5:29 AM | 28 (3.9%) | 54 (7.9%) |
| 5:30 AM to 5:59 AM | 94 (13.1%) | 34 (5.0%) |
| 6:00 AM to 6:29 AM | 37 (5.2%) | 15 (2.2%) |
| 6:30 AM to 6:59 AM | 43 (6.0%) | 20 (2.9%) |
| 7:00 AM to 7:29 AM | 94 (13.1%) | 187 (27.5%) |
| 7:30 AM to 7:59 AM | 110 (15.3%) | 191 (28.1%) |
| 8:00 AM to 8:29 AM | 37 (5.2%) | 21 (3.1%) |
| 8:30 AM to 8:59 AM | 8 (1.1%) | 62 (9.1%) |
| 9:00 AM to 9:59 AM | 25 (3.5%) | 19 (2.8%) |
| 10:00 AM to 10:59 AM | 11 (1.5%) | 0 (0.0%) |
| 11:00 AM to 11:59 AM | 16 (2.2%) | 9 (1.3%) |
| 12:00 PM to 3:59 PM | 56 (7.8%) | 22 (3.2%) |
| 4:00 PM to 11:59 PM | 27 (3.8%) | 33 (4.9%) |
| Total | 717 (100.0%) | 681 (100.0%) |
Housing Occupancy in Garner
Occupancy by Ownership in Garner
Of the total 1,287 dwellings in Garner, owner-occupied units account for 993 (77.2%), while renter-occupied units make up 294 (22.8%).
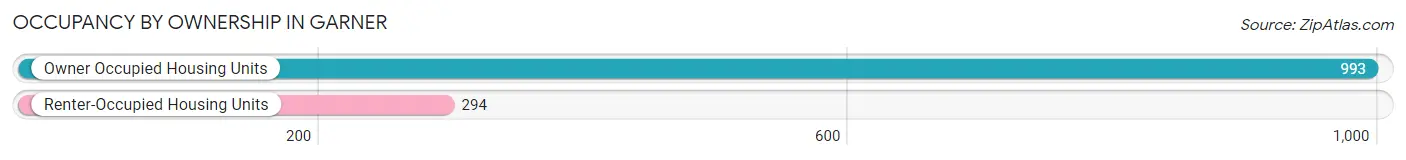
| Occupancy | # Housing Units | % Housing Units |
| Owner Occupied Housing Units | 993 | 77.2% |
| Renter-Occupied Housing Units | 294 | 22.8% |
| Total Occupied Housing Units | 1,287 | 100.0% |
Occupancy by Household Size in Garner
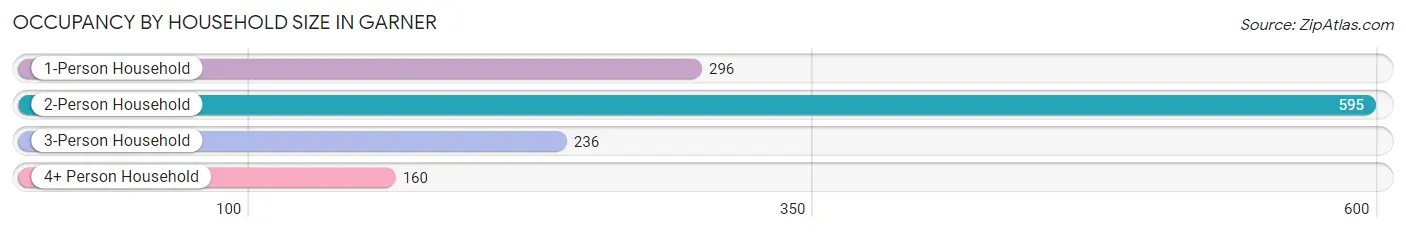
| Household Size | # Housing Units | % Housing Units |
| 1-Person Household | 296 | 23.0% |
| 2-Person Household | 595 | 46.2% |
| 3-Person Household | 236 | 18.3% |
| 4+ Person Household | 160 | 12.4% |
| Total Housing Units | 1,287 | 100.0% |
Occupancy by Ownership by Household Size in Garner
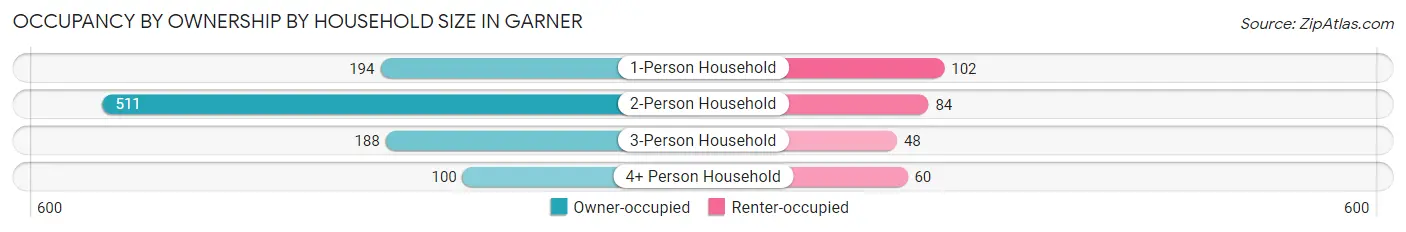
| Household Size | Owner-occupied | Renter-occupied |
| 1-Person Household | 194 (65.5%) | 102 (34.5%) |
| 2-Person Household | 511 (85.9%) | 84 (14.1%) |
| 3-Person Household | 188 (79.7%) | 48 (20.3%) |
| 4+ Person Household | 100 (62.5%) | 60 (37.5%) |
| Total Housing Units | 993 (77.2%) | 294 (22.8%) |
Occupancy by Educational Attainment in Garner
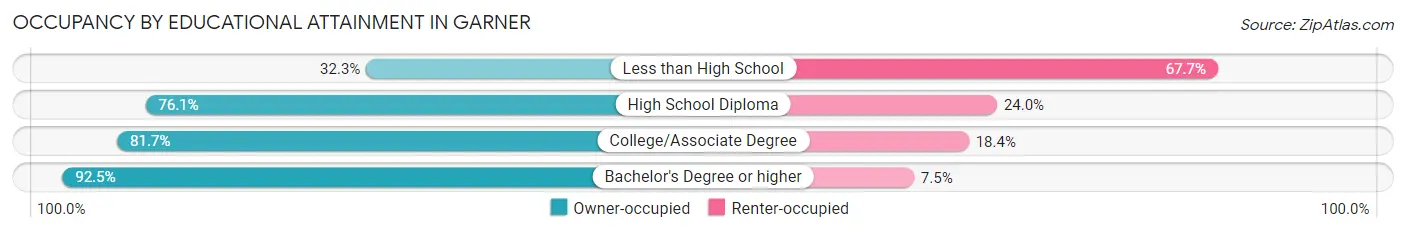
| Household Size | Owner-occupied | Renter-occupied |
| Less than High School | 51 (32.3%) | 107 (67.7%) |
| High School Diploma | 200 (76.0%) | 63 (23.9%) |
| College/Associate Degree | 445 (81.7%) | 100 (18.3%) |
| Bachelor's Degree or higher | 297 (92.5%) | 24 (7.5%) |
Occupancy by Age of Householder in Garner
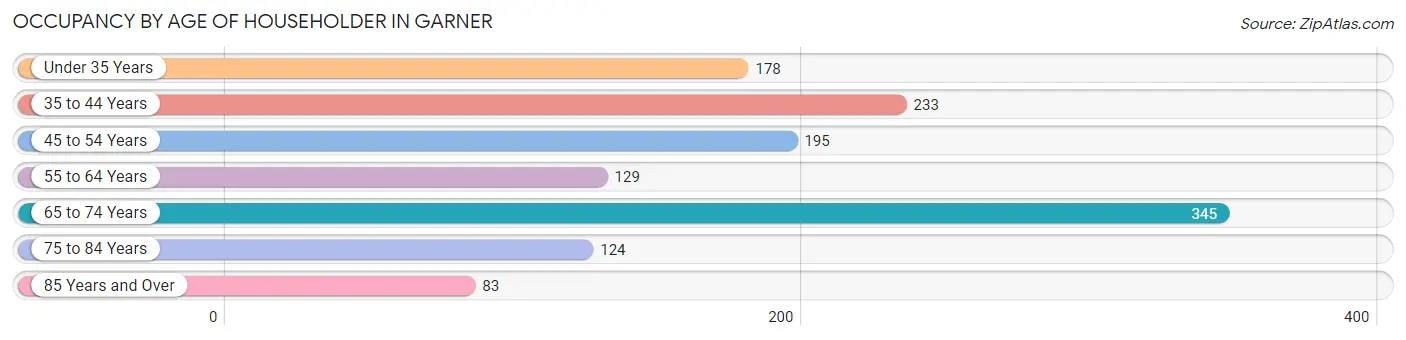
| Age Bracket | # Households | % Households |
| Under 35 Years | 178 | 13.8% |
| 35 to 44 Years | 233 | 18.1% |
| 45 to 54 Years | 195 | 15.1% |
| 55 to 64 Years | 129 | 10.0% |
| 65 to 74 Years | 345 | 26.8% |
| 75 to 84 Years | 124 | 9.6% |
| 85 Years and Over | 83 | 6.5% |
| Total | 1,287 | 100.0% |
Housing Finances in Garner
Median Income by Occupancy in Garner
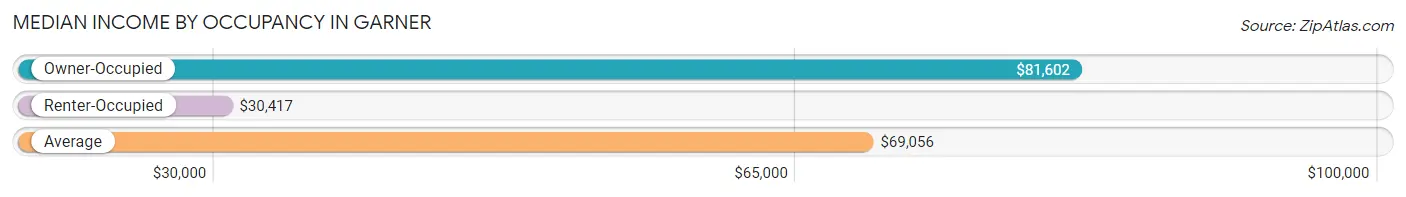
| Occupancy Type | # Households | Median Income |
| Owner-Occupied | 993 (77.2%) | $81,602 |
| Renter-Occupied | 294 (22.8%) | $30,417 |
| Average | 1,287 (100.0%) | $69,056 |
Occupancy by Householder Income Bracket in Garner
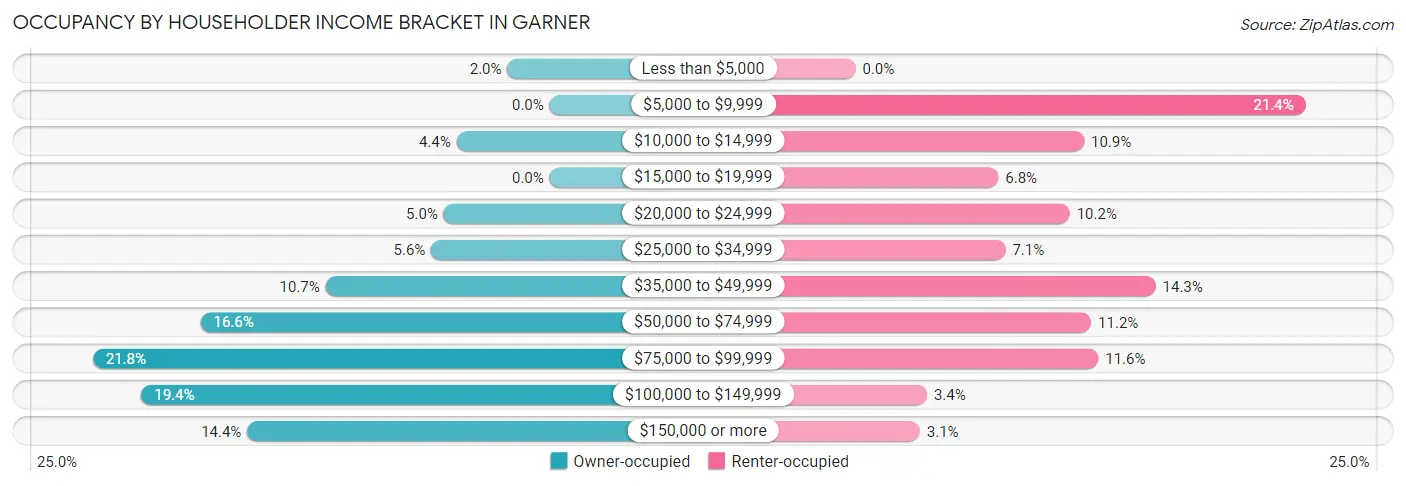
| Income Bracket | Owner-occupied | Renter-occupied |
| Less than $5,000 | 20 (2.0%) | 0 (0.0%) |
| $5,000 to $9,999 | 0 (0.0%) | 63 (21.4%) |
| $10,000 to $14,999 | 44 (4.4%) | 32 (10.9%) |
| $15,000 to $19,999 | 0 (0.0%) | 20 (6.8%) |
| $20,000 to $24,999 | 50 (5.0%) | 30 (10.2%) |
| $25,000 to $34,999 | 56 (5.6%) | 21 (7.1%) |
| $35,000 to $49,999 | 106 (10.7%) | 42 (14.3%) |
| $50,000 to $74,999 | 165 (16.6%) | 33 (11.2%) |
| $75,000 to $99,999 | 216 (21.7%) | 34 (11.6%) |
| $100,000 to $149,999 | 193 (19.4%) | 10 (3.4%) |
| $150,000 or more | 143 (14.4%) | 9 (3.1%) |
| Total | 993 (100.0%) | 294 (100.0%) |
Monthly Housing Cost Tiers in Garner
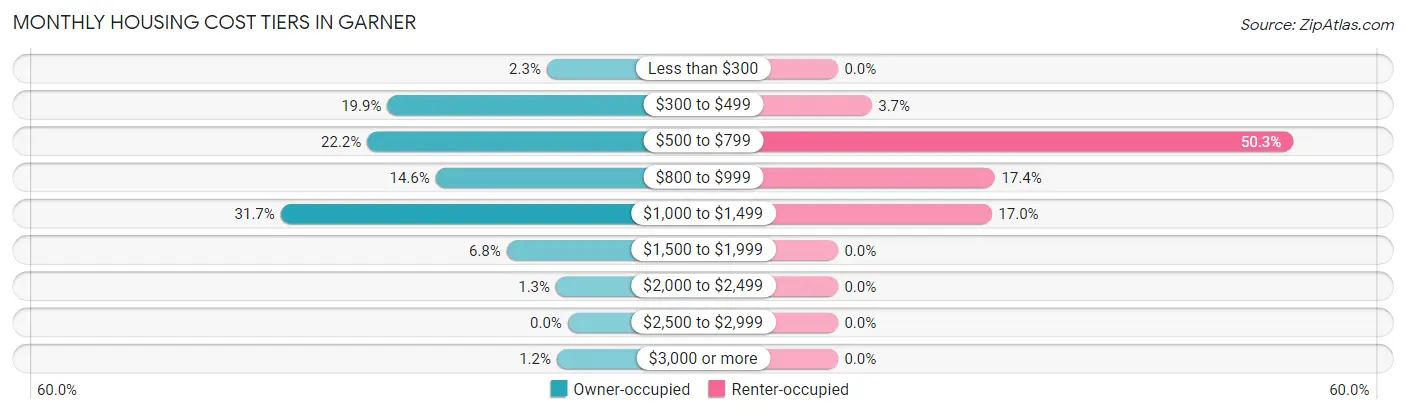
| Monthly Cost | Owner-occupied | Renter-occupied |
| Less than $300 | 23 (2.3%) | 0 (0.0%) |
| $300 to $499 | 198 (19.9%) | 11 (3.7%) |
| $500 to $799 | 220 (22.2%) | 148 (50.3%) |
| $800 to $999 | 145 (14.6%) | 51 (17.3%) |
| $1,000 to $1,499 | 315 (31.7%) | 50 (17.0%) |
| $1,500 to $1,999 | 67 (6.8%) | 0 (0.0%) |
| $2,000 to $2,499 | 13 (1.3%) | 0 (0.0%) |
| $2,500 to $2,999 | 0 (0.0%) | 0 (0.0%) |
| $3,000 or more | 12 (1.2%) | 0 (0.0%) |
| Total | 993 (100.0%) | 294 (100.0%) |
Physical Housing Characteristics in Garner
Housing Structures in Garner
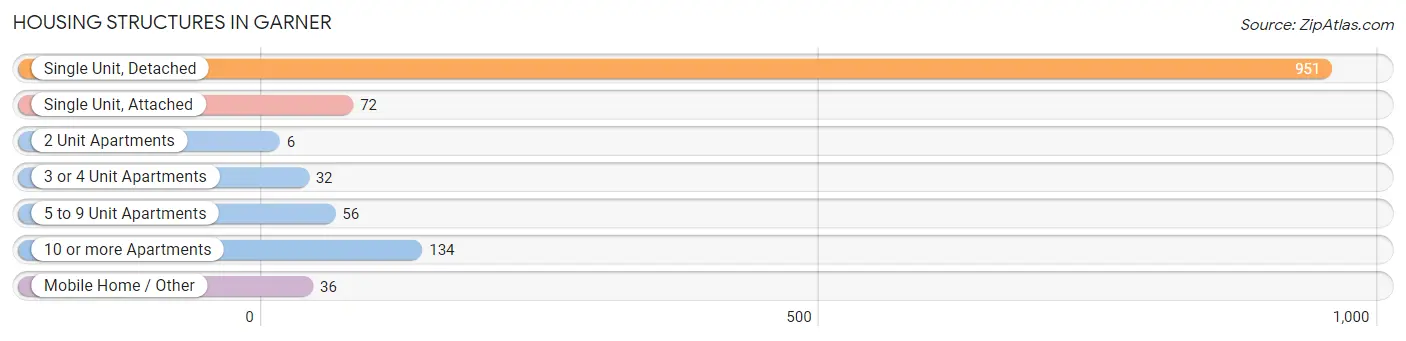
| Structure Type | # Housing Units | % Housing Units |
| Single Unit, Detached | 951 | 73.9% |
| Single Unit, Attached | 72 | 5.6% |
| 2 Unit Apartments | 6 | 0.5% |
| 3 or 4 Unit Apartments | 32 | 2.5% |
| 5 to 9 Unit Apartments | 56 | 4.3% |
| 10 or more Apartments | 134 | 10.4% |
| Mobile Home / Other | 36 | 2.8% |
| Total | 1,287 | 100.0% |
Housing Structures by Occupancy in Garner
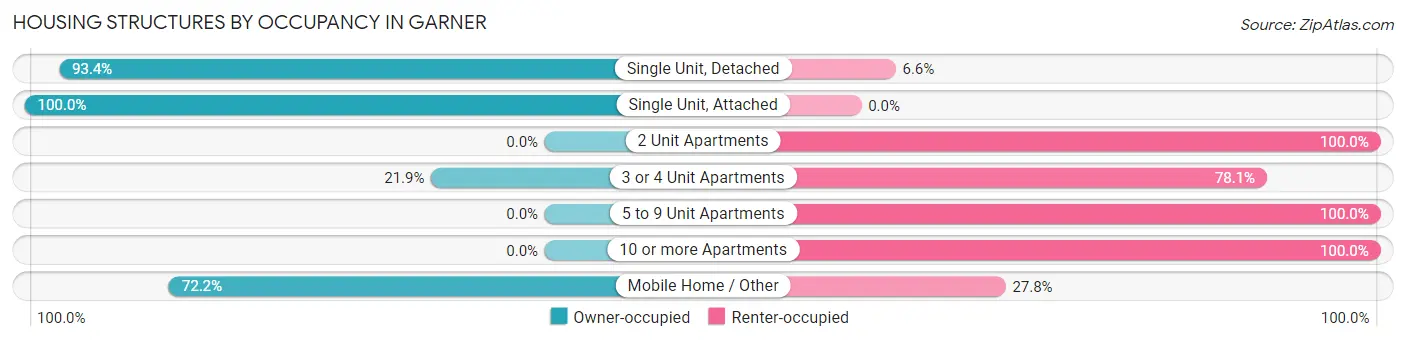
| Structure Type | Owner-occupied | Renter-occupied |
| Single Unit, Detached | 888 (93.4%) | 63 (6.6%) |
| Single Unit, Attached | 72 (100.0%) | 0 (0.0%) |
| 2 Unit Apartments | 0 (0.0%) | 6 (100.0%) |
| 3 or 4 Unit Apartments | 7 (21.9%) | 25 (78.1%) |
| 5 to 9 Unit Apartments | 0 (0.0%) | 56 (100.0%) |
| 10 or more Apartments | 0 (0.0%) | 134 (100.0%) |
| Mobile Home / Other | 26 (72.2%) | 10 (27.8%) |
| Total | 993 (77.2%) | 294 (22.8%) |
Housing Structures by Number of Rooms in Garner
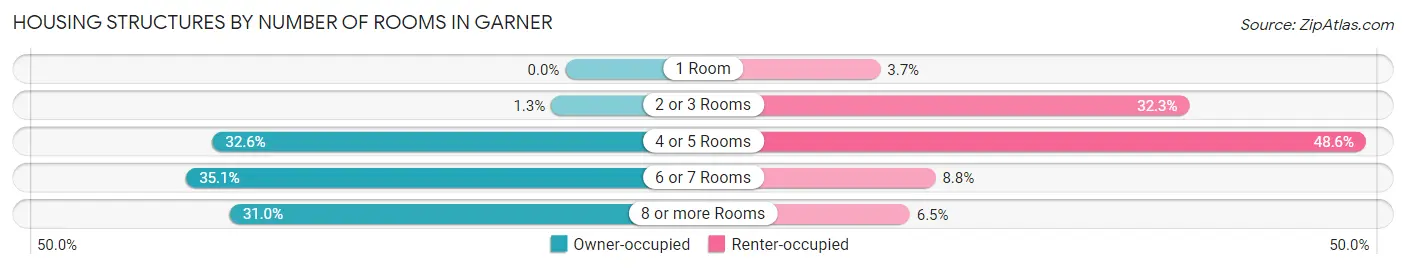
| Number of Rooms | Owner-occupied | Renter-occupied |
| 1 Room | 0 (0.0%) | 11 (3.7%) |
| 2 or 3 Rooms | 13 (1.3%) | 95 (32.3%) |
| 4 or 5 Rooms | 324 (32.6%) | 143 (48.6%) |
| 6 or 7 Rooms | 348 (35.0%) | 26 (8.8%) |
| 8 or more Rooms | 308 (31.0%) | 19 (6.5%) |
| Total | 993 (100.0%) | 294 (100.0%) |
Housing Structure by Heating Type in Garner
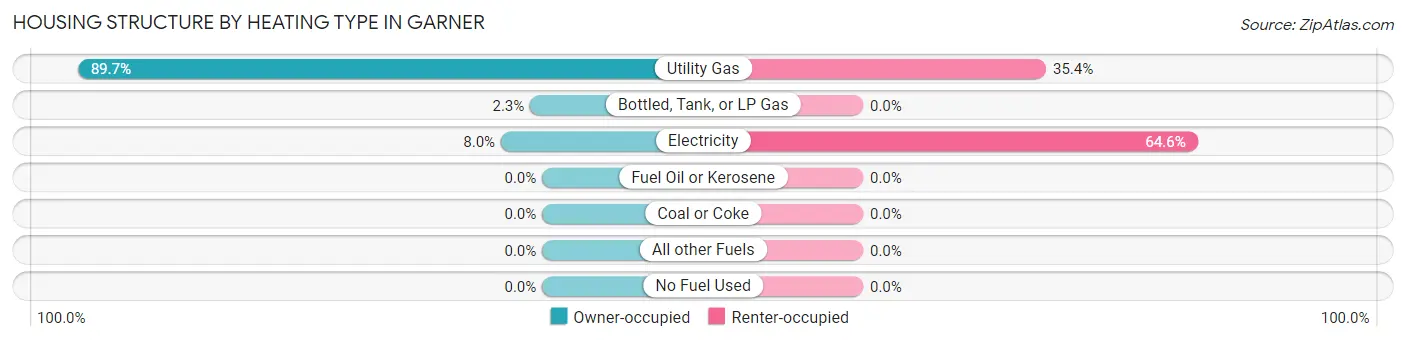
| Heating Type | Owner-occupied | Renter-occupied |
| Utility Gas | 891 (89.7%) | 104 (35.4%) |
| Bottled, Tank, or LP Gas | 23 (2.3%) | 0 (0.0%) |
| Electricity | 79 (8.0%) | 190 (64.6%) |
| Fuel Oil or Kerosene | 0 (0.0%) | 0 (0.0%) |
| Coal or Coke | 0 (0.0%) | 0 (0.0%) |
| All other Fuels | 0 (0.0%) | 0 (0.0%) |
| No Fuel Used | 0 (0.0%) | 0 (0.0%) |
| Total | 993 (100.0%) | 294 (100.0%) |
Household Vehicle Usage in Garner
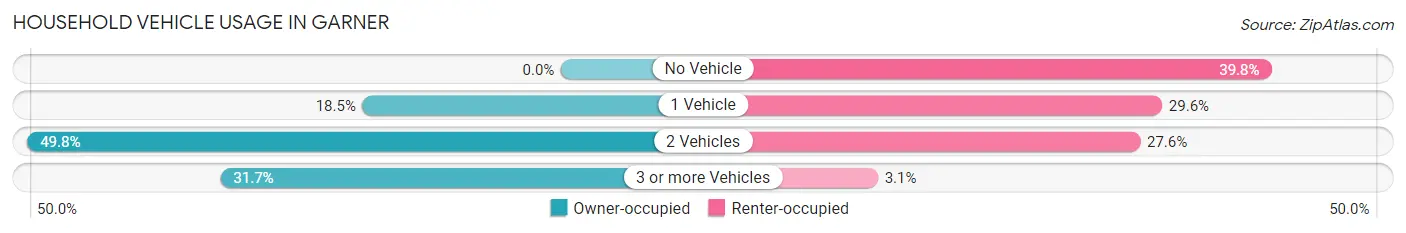
| Vehicles per Household | Owner-occupied | Renter-occupied |
| No Vehicle | 0 (0.0%) | 117 (39.8%) |
| 1 Vehicle | 184 (18.5%) | 87 (29.6%) |
| 2 Vehicles | 494 (49.7%) | 81 (27.6%) |
| 3 or more Vehicles | 315 (31.7%) | 9 (3.1%) |
| Total | 993 (100.0%) | 294 (100.0%) |
Real Estate & Mortgages in Garner
Real Estate and Mortgage Overview in Garner
| Characteristic | Without Mortgage | With Mortgage |
| Housing Units | 406 | 587 |
| Median Property Value | $153,200 | $156,200 |
| Median Household Income | $49,000 | $88 |
| Monthly Housing Costs | $483 | $12 |
| Real Estate Taxes | $1,864 | $0 |
Property Value by Mortgage Status in Garner
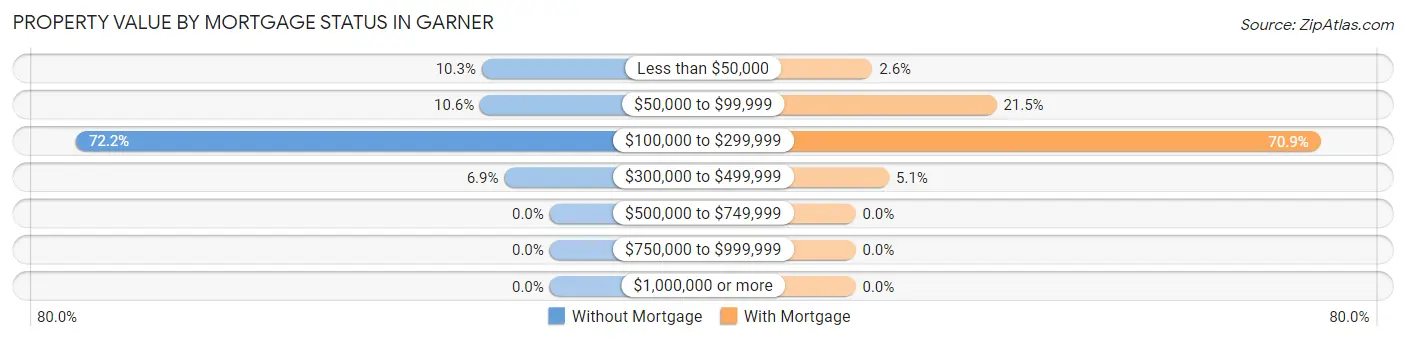
| Property Value | Without Mortgage | With Mortgage |
| Less than $50,000 | 42 (10.3%) | 15 (2.6%) |
| $50,000 to $99,999 | 43 (10.6%) | 126 (21.5%) |
| $100,000 to $299,999 | 293 (72.2%) | 416 (70.9%) |
| $300,000 to $499,999 | 28 (6.9%) | 30 (5.1%) |
| $500,000 to $749,999 | 0 (0.0%) | 0 (0.0%) |
| $750,000 to $999,999 | 0 (0.0%) | 0 (0.0%) |
| $1,000,000 or more | 0 (0.0%) | 0 (0.0%) |
| Total | 406 (100.0%) | 587 (100.0%) |
Household Income by Mortgage Status in Garner
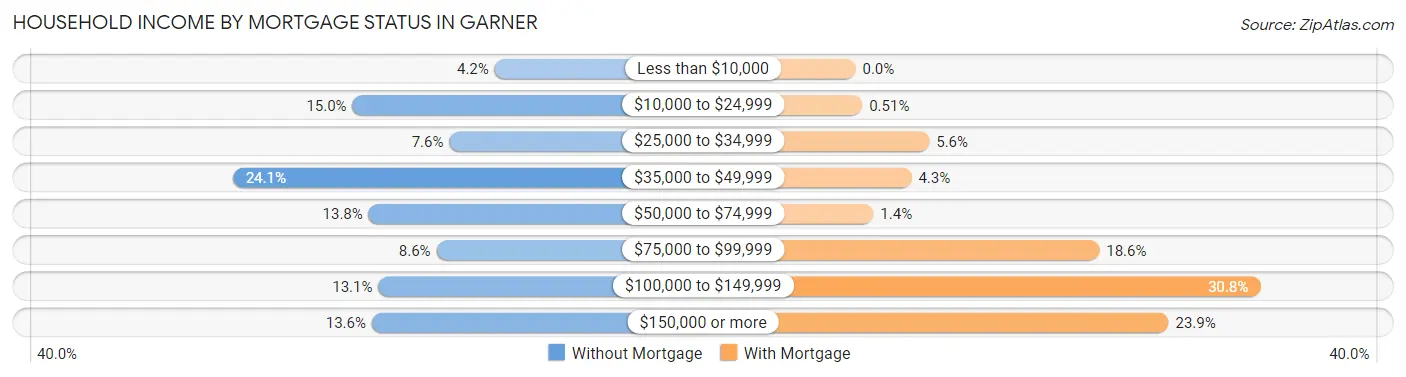
| Household Income | Without Mortgage | With Mortgage |
| Less than $10,000 | 17 (4.2%) | 0 (0.0%) |
| $10,000 to $24,999 | 61 (15.0%) | 3 (0.5%) |
| $25,000 to $34,999 | 31 (7.6%) | 33 (5.6%) |
| $35,000 to $49,999 | 98 (24.1%) | 25 (4.3%) |
| $50,000 to $74,999 | 56 (13.8%) | 8 (1.4%) |
| $75,000 to $99,999 | 35 (8.6%) | 109 (18.6%) |
| $100,000 to $149,999 | 53 (13.1%) | 181 (30.8%) |
| $150,000 or more | 55 (13.6%) | 140 (23.8%) |
| Total | 406 (100.0%) | 587 (100.0%) |
Property Value to Household Income Ratio in Garner
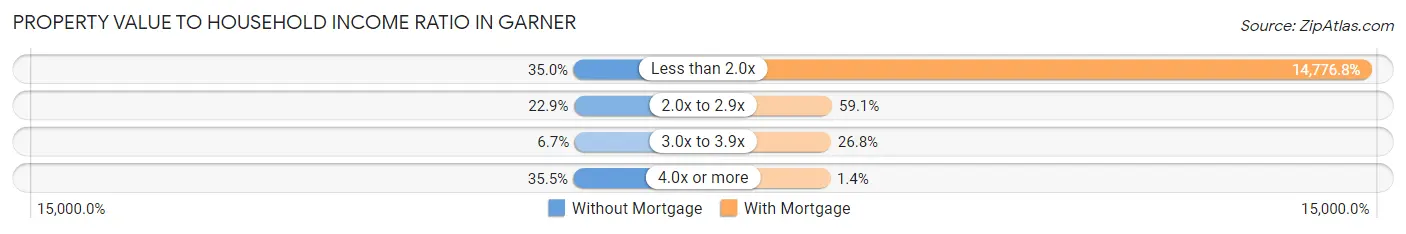
| Value-to-Income Ratio | Without Mortgage | With Mortgage |
| Less than 2.0x | 142 (35.0%) | 86,740 (14,776.8%) |
| 2.0x to 2.9x | 93 (22.9%) | 347 (59.1%) |
| 3.0x to 3.9x | 27 (6.7%) | 157 (26.8%) |
| 4.0x or more | 144 (35.5%) | 8 (1.4%) |
| Total | 406 (100.0%) | 587 (100.0%) |
Real Estate Taxes by Mortgage Status in Garner
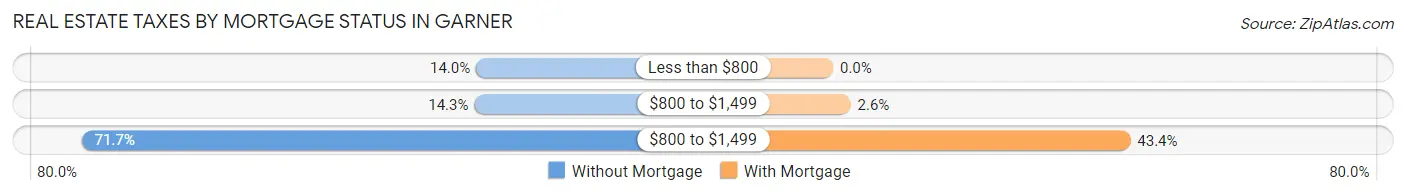
| Property Taxes | Without Mortgage | With Mortgage |
| Less than $800 | 57 (14.0%) | 0 (0.0%) |
| $800 to $1,499 | 58 (14.3%) | 15 (2.6%) |
| $800 to $1,499 | 291 (71.7%) | 255 (43.4%) |
| Total | 406 (100.0%) | 587 (100.0%) |
Health & Disability in Garner
Health Insurance Coverage by Age in Garner
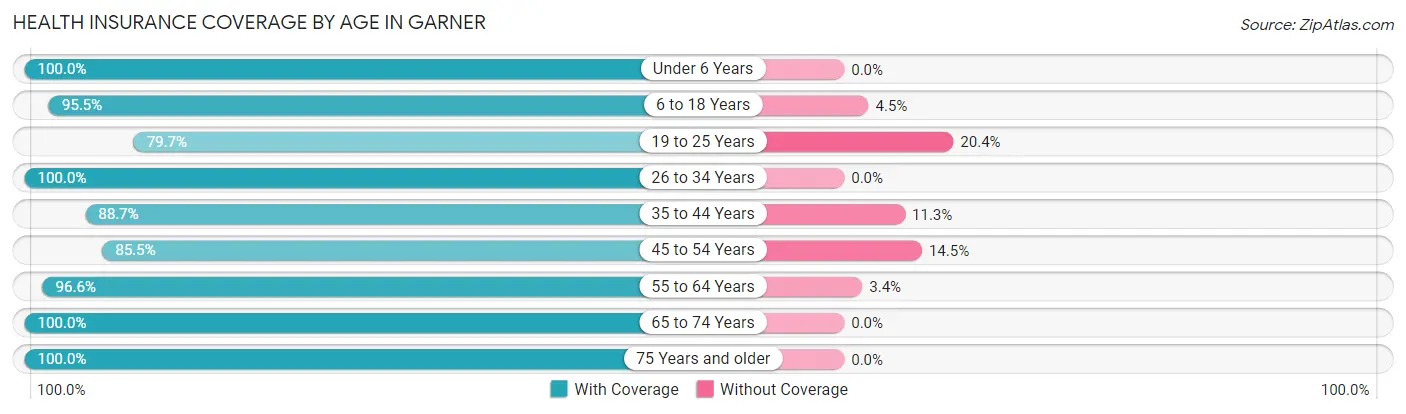
| Age Bracket | With Coverage | Without Coverage |
| Under 6 Years | 286 (100.0%) | 0 (0.0%) |
| 6 to 18 Years | 295 (95.5%) | 14 (4.5%) |
| 19 to 25 Years | 180 (79.6%) | 46 (20.3%) |
| 26 to 34 Years | 255 (100.0%) | 0 (0.0%) |
| 35 to 44 Years | 352 (88.7%) | 45 (11.3%) |
| 45 to 54 Years | 301 (85.5%) | 51 (14.5%) |
| 55 to 64 Years | 287 (96.6%) | 10 (3.4%) |
| 65 to 74 Years | 514 (100.0%) | 0 (0.0%) |
| 75 Years and older | 353 (100.0%) | 0 (0.0%) |
| Total | 2,823 (94.5%) | 166 (5.6%) |
Health Insurance Coverage by Citizenship Status in Garner
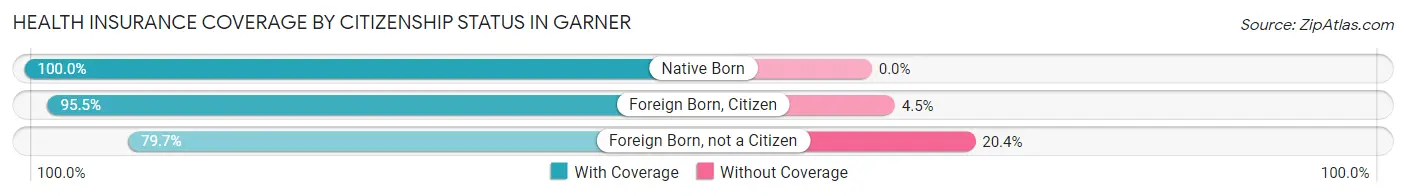
| Citizenship Status | With Coverage | Without Coverage |
| Native Born | 286 (100.0%) | 0 (0.0%) |
| Foreign Born, Citizen | 295 (95.5%) | 14 (4.5%) |
| Foreign Born, not a Citizen | 180 (79.6%) | 46 (20.3%) |
Health Insurance Coverage by Household Income in Garner
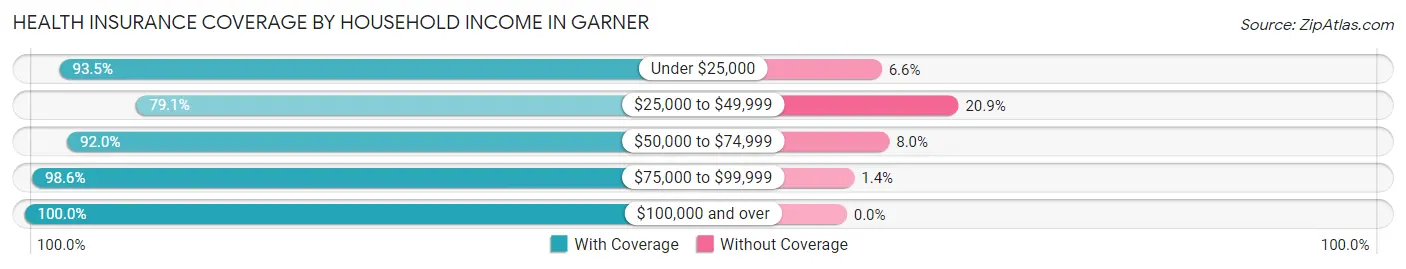
| Household Income | With Coverage | Without Coverage |
| Under $25,000 | 385 (93.4%) | 27 (6.6%) |
| $25,000 to $49,999 | 359 (79.1%) | 95 (20.9%) |
| $50,000 to $74,999 | 393 (92.0%) | 34 (8.0%) |
| $75,000 to $99,999 | 701 (98.6%) | 10 (1.4%) |
| $100,000 and over | 984 (100.0%) | 0 (0.0%) |
Public vs Private Health Insurance Coverage by Age in Garner
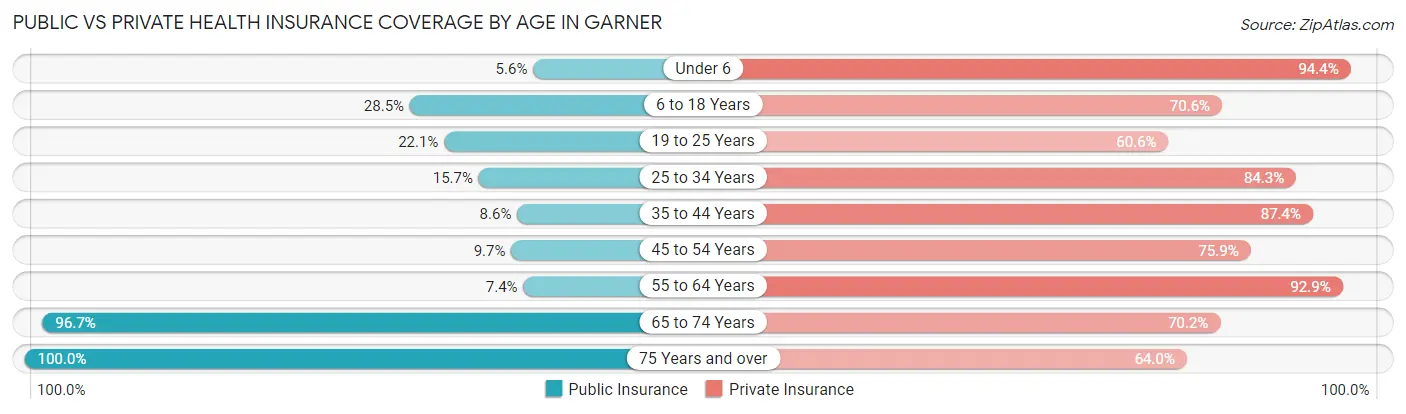
| Age Bracket | Public Insurance | Private Insurance |
| Under 6 | 16 (5.6%) | 270 (94.4%) |
| 6 to 18 Years | 88 (28.5%) | 218 (70.6%) |
| 19 to 25 Years | 50 (22.1%) | 137 (60.6%) |
| 25 to 34 Years | 40 (15.7%) | 215 (84.3%) |
| 35 to 44 Years | 34 (8.6%) | 347 (87.4%) |
| 45 to 54 Years | 34 (9.7%) | 267 (75.8%) |
| 55 to 64 Years | 22 (7.4%) | 276 (92.9%) |
| 65 to 74 Years | 497 (96.7%) | 361 (70.2%) |
| 75 Years and over | 353 (100.0%) | 226 (64.0%) |
| Total | 1,134 (37.9%) | 2,317 (77.5%) |
Disability Status by Sex by Age in Garner
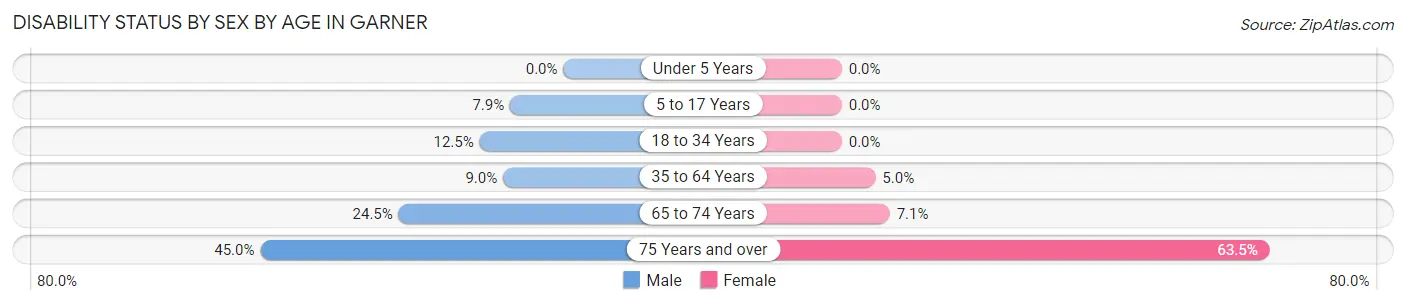
| Age Bracket | Male | Female |
| Under 5 Years | 0 (0.0%) | 0 (0.0%) |
| 5 to 17 Years | 17 (7.9%) | 0 (0.0%) |
| 18 to 34 Years | 29 (12.4%) | 0 (0.0%) |
| 35 to 64 Years | 47 (8.9%) | 26 (5.0%) |
| 65 to 74 Years | 57 (24.5%) | 20 (7.1%) |
| 75 Years and over | 54 (45.0%) | 148 (63.5%) |
Disability Class by Sex by Age in Garner
Disability Class: Hearing Difficulty
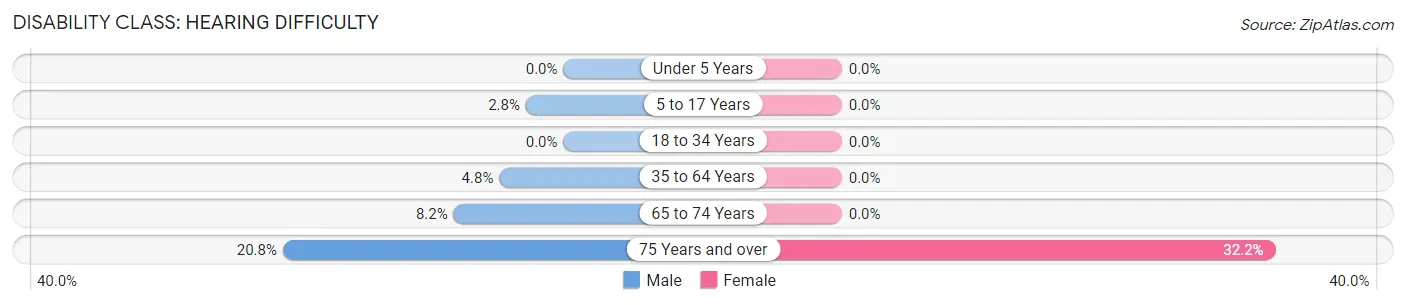
| Age Bracket | Male | Female |
| Under 5 Years | 0 (0.0%) | 0 (0.0%) |
| 5 to 17 Years | 6 (2.8%) | 0 (0.0%) |
| 18 to 34 Years | 0 (0.0%) | 0 (0.0%) |
| 35 to 64 Years | 25 (4.8%) | 0 (0.0%) |
| 65 to 74 Years | 19 (8.2%) | 0 (0.0%) |
| 75 Years and over | 25 (20.8%) | 75 (32.2%) |
Disability Class: Vision Difficulty
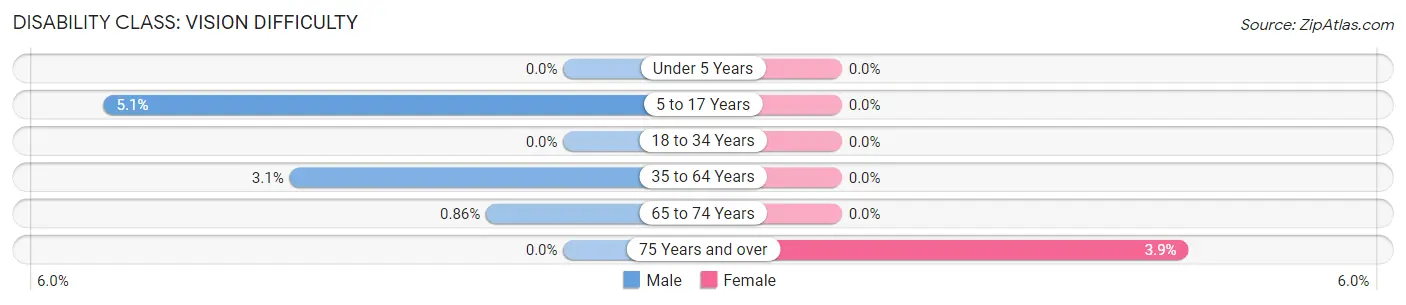
| Age Bracket | Male | Female |
| Under 5 Years | 0 (0.0%) | 0 (0.0%) |
| 5 to 17 Years | 11 (5.1%) | 0 (0.0%) |
| 18 to 34 Years | 0 (0.0%) | 0 (0.0%) |
| 35 to 64 Years | 16 (3.0%) | 0 (0.0%) |
| 65 to 74 Years | 2 (0.9%) | 0 (0.0%) |
| 75 Years and over | 0 (0.0%) | 9 (3.9%) |
Disability Class: Cognitive Difficulty
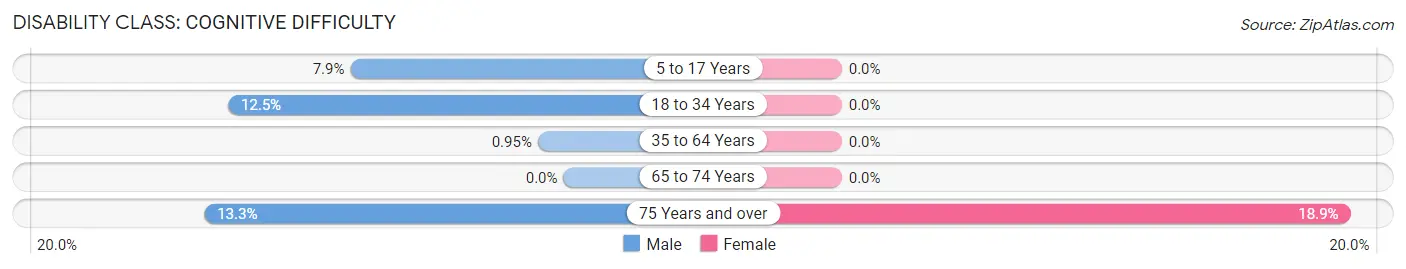
| Age Bracket | Male | Female |
| 5 to 17 Years | 17 (7.9%) | 0 (0.0%) |
| 18 to 34 Years | 29 (12.4%) | 0 (0.0%) |
| 35 to 64 Years | 5 (0.9%) | 0 (0.0%) |
| 65 to 74 Years | 0 (0.0%) | 0 (0.0%) |
| 75 Years and over | 16 (13.3%) | 44 (18.9%) |
Disability Class: Ambulatory Difficulty
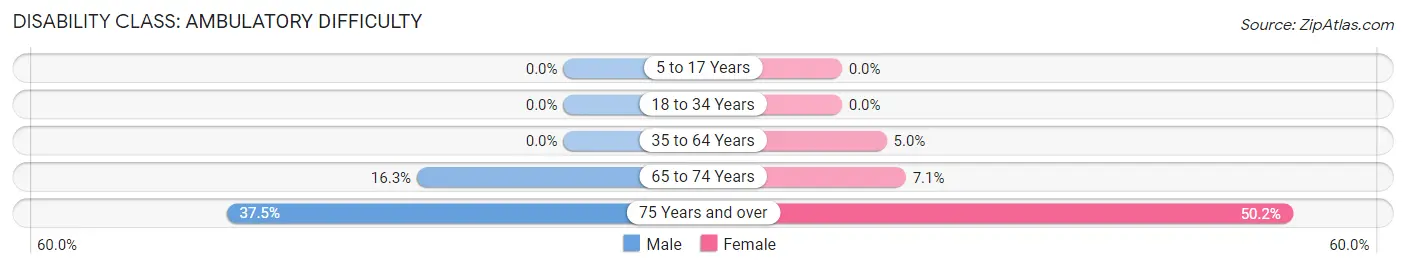
| Age Bracket | Male | Female |
| 5 to 17 Years | 0 (0.0%) | 0 (0.0%) |
| 18 to 34 Years | 0 (0.0%) | 0 (0.0%) |
| 35 to 64 Years | 0 (0.0%) | 26 (5.0%) |
| 65 to 74 Years | 38 (16.3%) | 20 (7.1%) |
| 75 Years and over | 45 (37.5%) | 117 (50.2%) |
Disability Class: Self-Care Difficulty
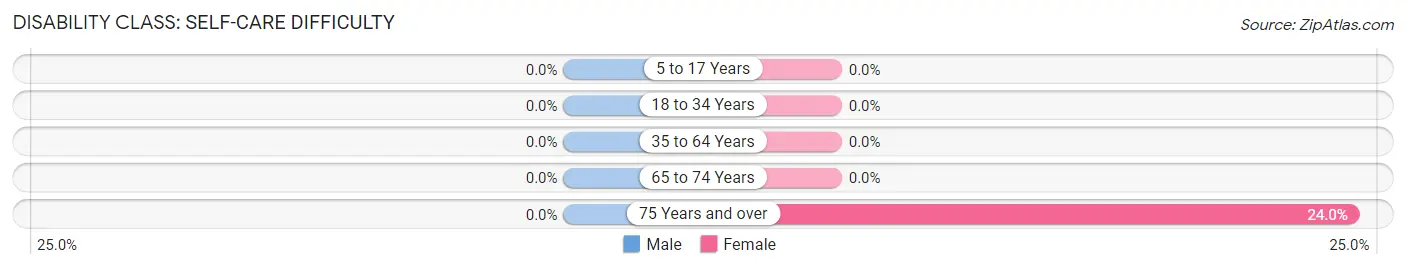
| Age Bracket | Male | Female |
| 5 to 17 Years | 0 (0.0%) | 0 (0.0%) |
| 18 to 34 Years | 0 (0.0%) | 0 (0.0%) |
| 35 to 64 Years | 0 (0.0%) | 0 (0.0%) |
| 65 to 74 Years | 0 (0.0%) | 0 (0.0%) |
| 75 Years and over | 0 (0.0%) | 56 (24.0%) |
Technology Access in Garner
Computing Device Access in Garner
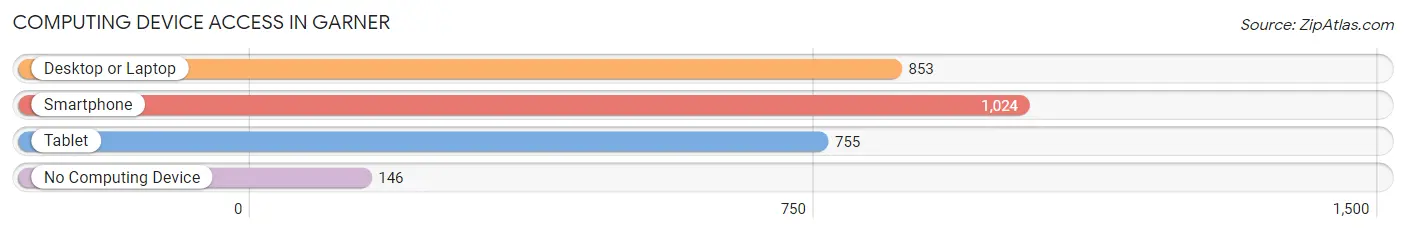
| Device Type | # Households | % Households |
| Desktop or Laptop | 853 | 66.3% |
| Smartphone | 1,024 | 79.6% |
| Tablet | 755 | 58.7% |
| No Computing Device | 146 | 11.3% |
| Total | 1,287 | 100.0% |
Internet Access in Garner

| Internet Type | # Households | % Households |
| Dial-Up Internet | 34 | 2.6% |
| Broadband Home | 839 | 65.2% |
| Cellular Data Only | 228 | 17.7% |
| Satellite Internet | 29 | 2.2% |
| No Internet | 173 | 13.4% |
| Total | 1,287 | 100.0% |
Garner Summary
Garner, Iowa is a small city located in Hancock County, Iowa. It is situated on the banks of the Shell Rock River, and is part of the Mason City Micropolitan Statistical Area. The city has a population of 2,717 people, according to the 2010 census.
History
Garner was founded in 1881 by a group of settlers from Norway. The city was named after the Norwegian town of Gjørv, which is located near the city of Trondheim. The settlers were attracted to the area due to its fertile soil and abundant natural resources. The first settlers built a sawmill and a gristmill, and the town quickly grew.
In 1883, the Chicago, Milwaukee & St. Paul Railroad arrived in Garner, and the town was officially incorporated in 1885. The railroad brought new businesses and industries to the area, and the population of Garner began to grow.
In the early 1900s, Garner was a thriving agricultural community. The town was home to several grain elevators, a creamery, a flour mill, and a canning factory. The town also had a number of stores, churches, and schools.
Geography
Garner is located in the north-central part of Iowa, in Hancock County. The city is situated on the banks of the Shell Rock River, and is part of the Mason City Micropolitan Statistical Area. The city has a total area of 1.7 square miles, all of which is land.
The climate in Garner is humid continental, with hot summers and cold winters. The average temperature in the summer is around 75 degrees Fahrenheit, and the average temperature in the winter is around 20 degrees Fahrenheit.
Economy
The economy of Garner is largely based on agriculture. The city is home to several grain elevators, a creamery, a flour mill, and a canning factory. The city also has a number of stores, churches, and schools.
The city is also home to several manufacturing companies, including a plastics manufacturer, a metal fabricator, and a machine shop. The city also has a number of retail stores, restaurants, and other businesses.
Demographics
According to the 2010 census, the population of Garner was 2,717 people. The racial makeup of the city was 97.3% White, 0.7% African American, 0.3% Native American, 0.2% Asian, 0.1% Pacific Islander, 0.4% from other races, and 1.0% from two or more races. Hispanic or Latino of any race were 1.3% of the population.
The median income for a household in Garner was $41,944, and the median income for a family was $50,000. The per capita income for the city was $20,845. About 8.3% of families and 10.2% of the population were below the poverty line, including 14.2% of those under age 18 and 8.2% of those age 65 or over.
Common Questions
What is Per Capita Income in Garner?
Per Capita income in Garner is $34,147.
What is the Median Family Income in Garner?
Median Family Income in Garner is $86,103.
What is the Median Household income in Garner?
Median Household Income in Garner is $69,056.
What is Income or Wage Gap in Garner?
Income or Wage Gap in Garner is 39.6%.
Women in Garner earn 60.4 cents for every dollar earned by a man.
What is Inequality or Gini Index in Garner?
Inequality or Gini Index in Garner is 0.41.
What is the Total Population of Garner?
Total Population of Garner is 3,065.
What is the Total Male Population of Garner?
Total Male Population of Garner is 1,485.
What is the Total Female Population of Garner?
Total Female Population of Garner is 1,580.
What is the Ratio of Males per 100 Females in Garner?
There are 93.99 Males per 100 Females in Garner.
What is the Ratio of Females per 100 Males in Garner?
There are 106.40 Females per 100 Males in Garner.
What is the Median Population Age in Garner?
Median Population Age in Garner is 46.3 Years.
What is the Average Family Size in Garner
Average Family Size in Garner is 2.8 People.
What is the Average Household Size in Garner
Average Household Size in Garner is 2.3 People.
How Large is the Labor Force in Garner?
There are 1,525 People in the Labor Forcein in Garner.
What is the Percentage of People in the Labor Force in Garner?
60.5% of People are in the Labor Force in Garner.
What is the Unemployment Rate in Garner?
Unemployment Rate in Garner is 1.8%.