Lincoln, IA Map & Demographics
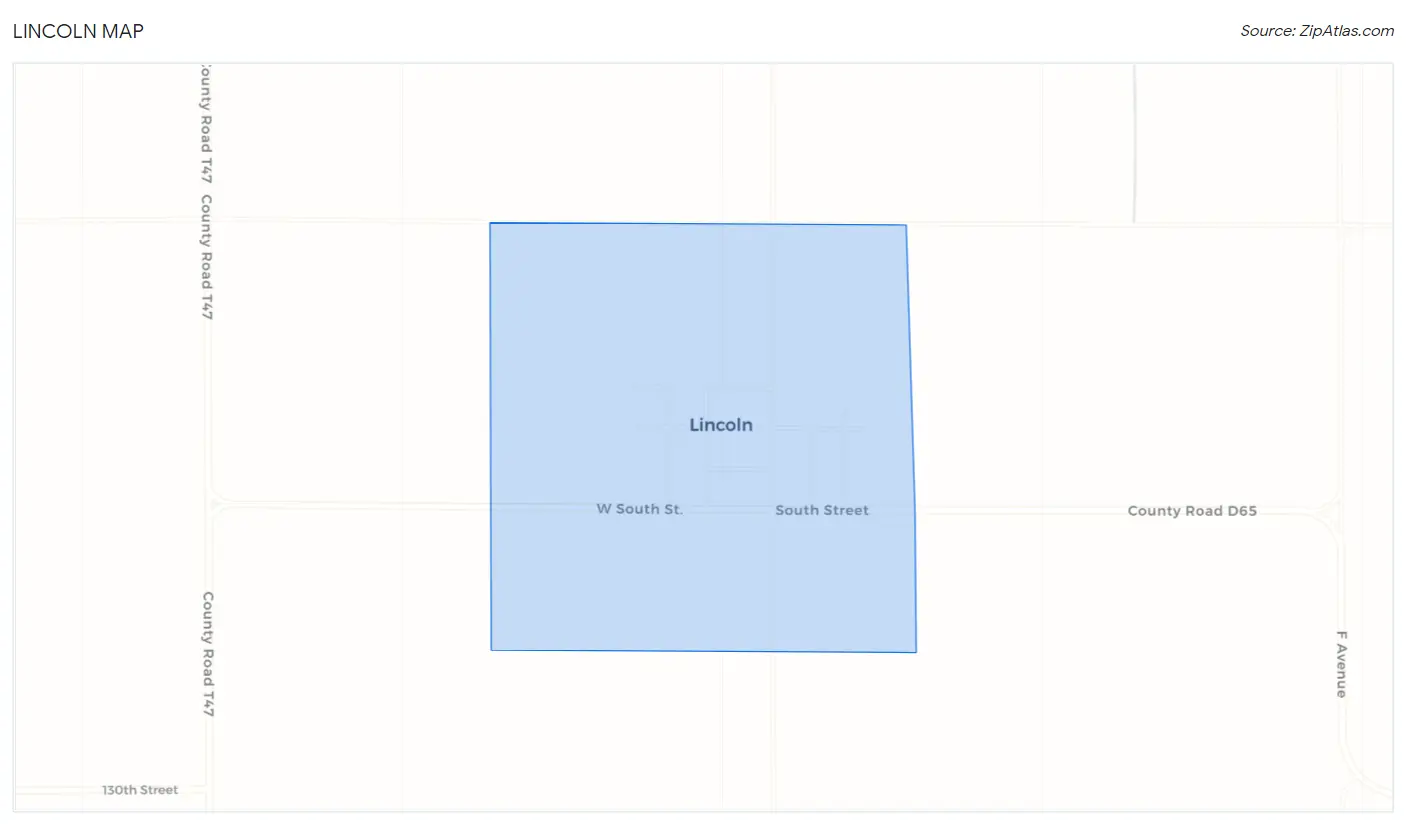
Lincoln Map
Lincoln Overview
$28,299
PER CAPITA INCOME
$76,667
AVG FAMILY INCOME
$57,500
AVG HOUSEHOLD INCOME
8.2%
WAGE / INCOME GAP [ % ]
91.8¢/ $1
WAGE / INCOME GAP [ $ ]
0.34
INEQUALITY / GINI INDEX
118
TOTAL POPULATION
73
MALE POPULATION
45
FEMALE POPULATION
162.22
MALES / 100 FEMALES
61.64
FEMALES / 100 MALES
54.0
MEDIAN AGE
2.8
AVG FAMILY SIZE
2.4
AVG HOUSEHOLD SIZE
55
LABOR FORCE [ PEOPLE ]
56.7%
PERCENT IN LABOR FORCE
Lincoln Zip Codes
Income in Lincoln
Income Overview in Lincoln
Per Capita Income in Lincoln is $28,299, while median incomes of families and households are $76,667 and $57,500 respectively.
| Characteristic | Number | Measure |
| Per Capita Income | 118 | $28,299 |
| Median Family Income | 36 | $76,667 |
| Mean Family Income | 36 | $78,167 |
| Median Household Income | 50 | $57,500 |
| Mean Household Income | 50 | $65,298 |
| Income Deficit | 36 | $0 |
| Wage / Income Gap (%) | 118 | 8.24% |
| Wage / Income Gap ($) | 118 | 91.76¢ per $1 |
| Gini / Inequality Index | 118 | 0.34 |
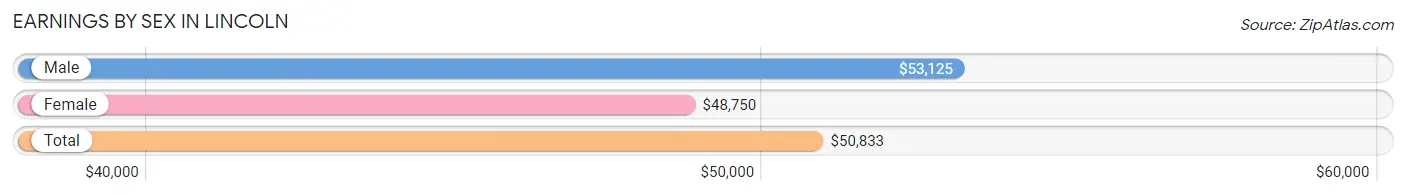
Earnings by Sex in Lincoln
Average Earnings in Lincoln are $50,833, $53,125 for men and $48,750 for women, a difference of 8.2%.
| Sex | Number | Average Earnings |
| Male | 34 (58.6%) | $53,125 |
| Female | 24 (41.4%) | $48,750 |
| Total | 58 (100.0%) | $50,833 |
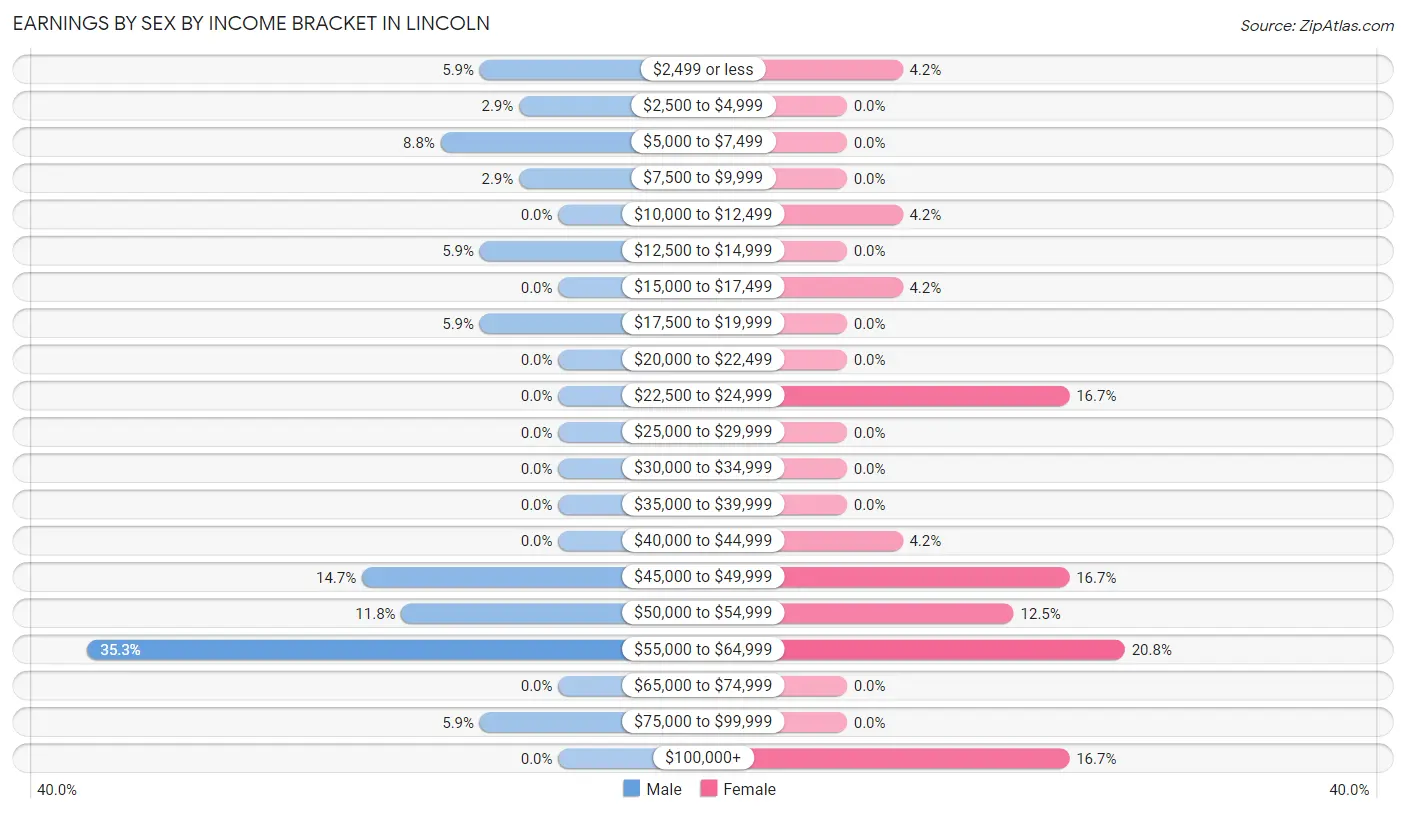
Earnings by Sex by Income Bracket in Lincoln
The most common earnings brackets in Lincoln are $55,000 to $64,999 for men (12 | 35.3%) and $55,000 to $64,999 for women (5 | 20.8%).
| Income | Male | Female |
| $2,499 or less | 2 (5.9%) | 1 (4.2%) |
| $2,500 to $4,999 | 1 (2.9%) | 0 (0.0%) |
| $5,000 to $7,499 | 3 (8.8%) | 0 (0.0%) |
| $7,500 to $9,999 | 1 (2.9%) | 0 (0.0%) |
| $10,000 to $12,499 | 0 (0.0%) | 1 (4.2%) |
| $12,500 to $14,999 | 2 (5.9%) | 0 (0.0%) |
| $15,000 to $17,499 | 0 (0.0%) | 1 (4.2%) |
| $17,500 to $19,999 | 2 (5.9%) | 0 (0.0%) |
| $20,000 to $22,499 | 0 (0.0%) | 0 (0.0%) |
| $22,500 to $24,999 | 0 (0.0%) | 4 (16.7%) |
| $25,000 to $29,999 | 0 (0.0%) | 0 (0.0%) |
| $30,000 to $34,999 | 0 (0.0%) | 0 (0.0%) |
| $35,000 to $39,999 | 0 (0.0%) | 0 (0.0%) |
| $40,000 to $44,999 | 0 (0.0%) | 1 (4.2%) |
| $45,000 to $49,999 | 5 (14.7%) | 4 (16.7%) |
| $50,000 to $54,999 | 4 (11.8%) | 3 (12.5%) |
| $55,000 to $64,999 | 12 (35.3%) | 5 (20.8%) |
| $65,000 to $74,999 | 0 (0.0%) | 0 (0.0%) |
| $75,000 to $99,999 | 2 (5.9%) | 0 (0.0%) |
| $100,000+ | 0 (0.0%) | 4 (16.7%) |
| Total | 34 (100.0%) | 24 (100.0%) |
Earnings by Sex by Educational Attainment in Lincoln
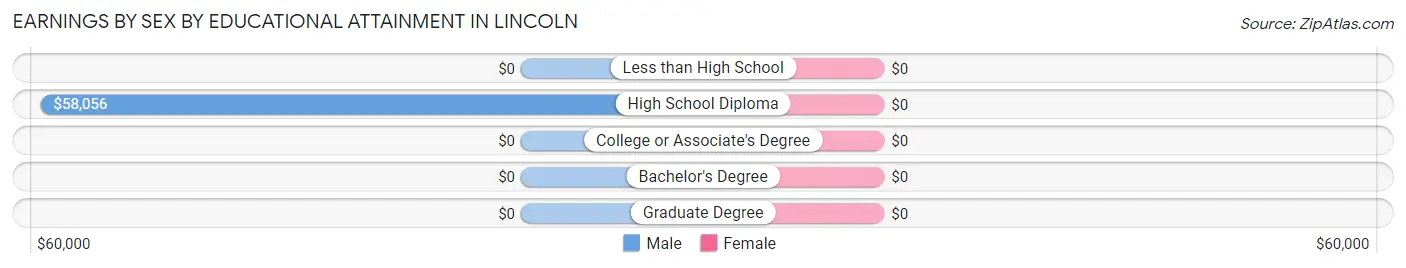
| Educational Attainment | Male Income | Female Income |
| Less than High School | - | - |
| High School Diploma | $58,056 | $0 |
| College or Associate's Degree | - | - |
| Bachelor's Degree | - | - |
| Graduate Degree | - | - |
| Total | $53,750 | $48,750 |
Family Income in Lincoln
Family Income Brackets in Lincoln
According to the Lincoln family income data, there are 13 families falling into the $100,000 to $149,999 income range, which is the most common income bracket and makes up 36.1% of all families.
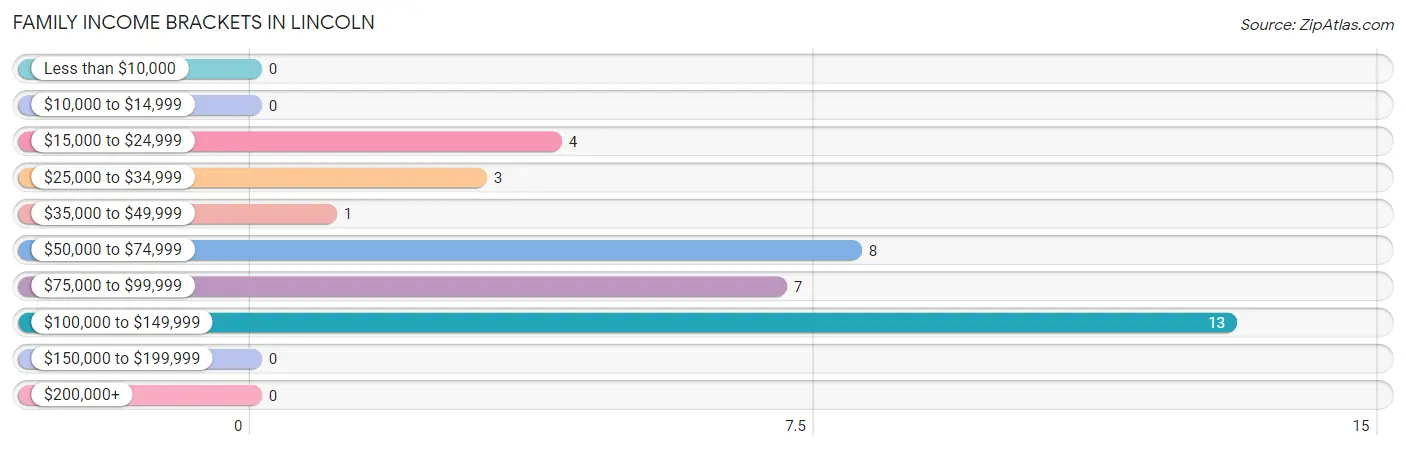
| Income Bracket | # Families | % Families |
| Less than $10,000 | 0 | 0.0% |
| $10,000 to $14,999 | 0 | 0.0% |
| $15,000 to $24,999 | 4 | 11.1% |
| $25,000 to $34,999 | 3 | 8.3% |
| $35,000 to $49,999 | 1 | 2.8% |
| $50,000 to $74,999 | 8 | 22.2% |
| $75,000 to $99,999 | 7 | 19.4% |
| $100,000 to $149,999 | 13 | 36.1% |
| $150,000 to $199,999 | 0 | 0.0% |
| $200,000+ | 0 | 0.0% |
Family Income by Famaliy Size in Lincoln
4-person families (7 | 19.4%) account for the highest median family income in Lincoln with $96,875 per family, while 4-person families (7 | 19.4%) have the highest median income of $24,219 per family member.
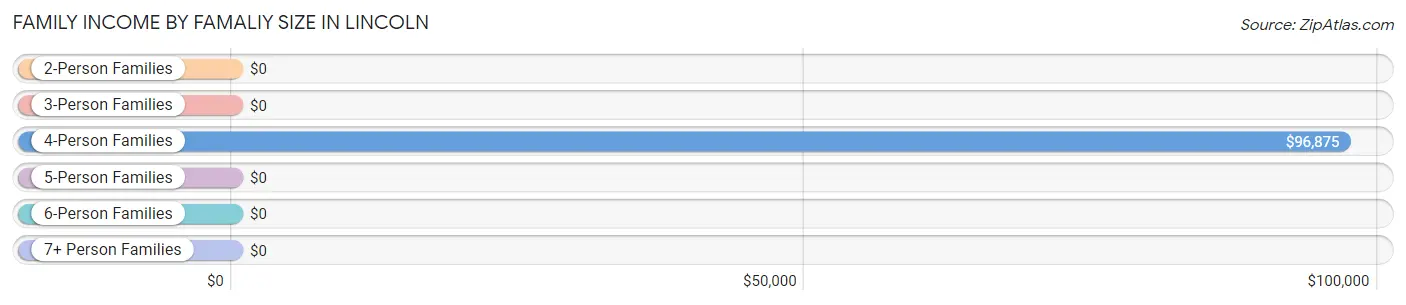
| Income Bracket | # Families | Median Income |
| 2-Person Families | 26 (72.2%) | $0 |
| 3-Person Families | 0 (0.0%) | $0 |
| 4-Person Families | 7 (19.4%) | $96,875 |
| 5-Person Families | 3 (8.3%) | $0 |
| 6-Person Families | 0 (0.0%) | $0 |
| 7+ Person Families | 0 (0.0%) | $0 |
| Total | 36 (100.0%) | $76,667 |
Family Income by Number of Earners in Lincoln
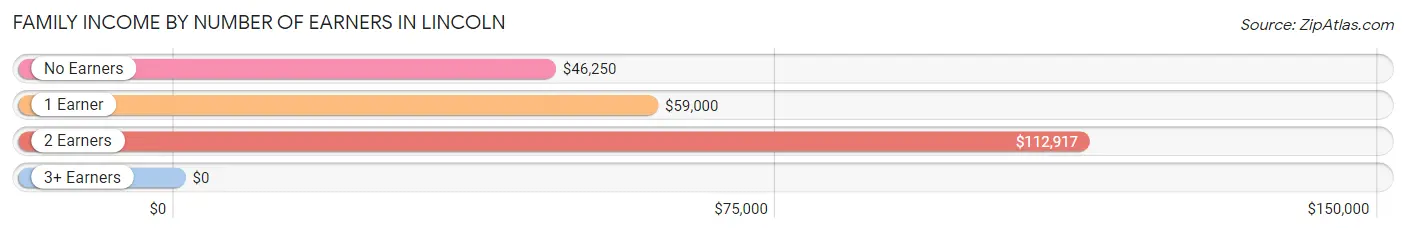
| Number of Earners | # Families | Median Income |
| No Earners | 5 (13.9%) | $46,250 |
| 1 Earner | 16 (44.4%) | $59,000 |
| 2 Earners | 15 (41.7%) | $112,917 |
| 3+ Earners | 0 (0.0%) | $0 |
| Total | 36 (100.0%) | $76,667 |
Household Income in Lincoln
Household Income Brackets in Lincoln
With 13 households falling in the category, the $100,000 to $149,999 income range is the most frequent in Lincoln, accounting for 26.0% of all households.
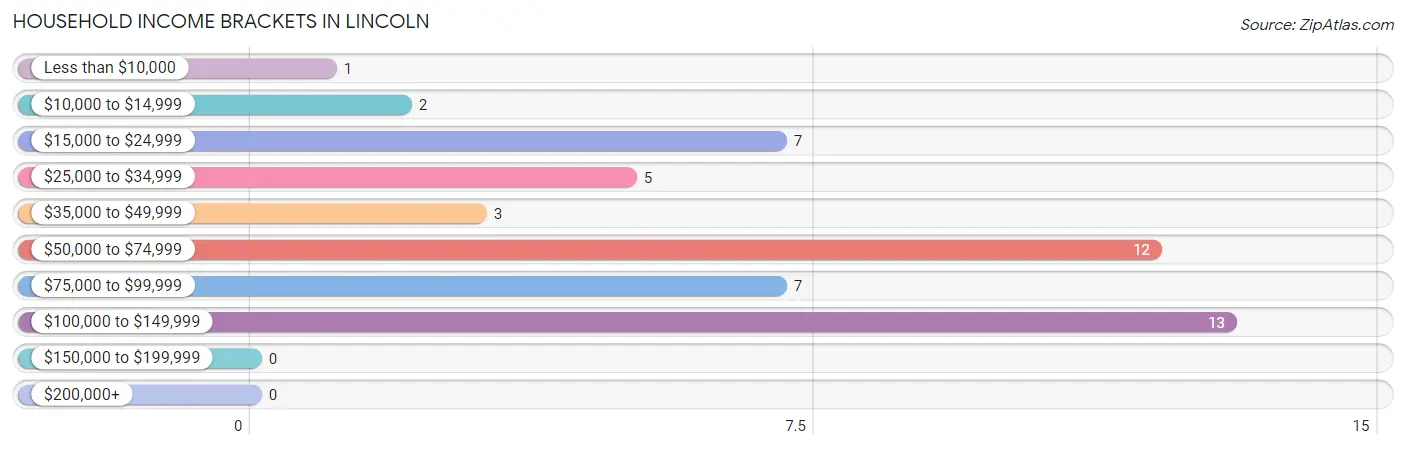
| Income Bracket | # Households | % Households |
| Less than $10,000 | 1 | 2.0% |
| $10,000 to $14,999 | 2 | 4.0% |
| $15,000 to $24,999 | 7 | 14.0% |
| $25,000 to $34,999 | 5 | 10.0% |
| $35,000 to $49,999 | 3 | 6.0% |
| $50,000 to $74,999 | 12 | 24.0% |
| $75,000 to $99,999 | 7 | 14.0% |
| $100,000 to $149,999 | 13 | 26.0% |
| $150,000 to $199,999 | 0 | 0.0% |
| $200,000+ | 0 | 0.0% |
Household Income by Householder Age in Lincoln
The median household income in Lincoln is $57,500, with the highest median household income of $76,667 found in the 25 to 44 years age bracket for the primary householder. A total of 12 households (24.0%) fall into this category.
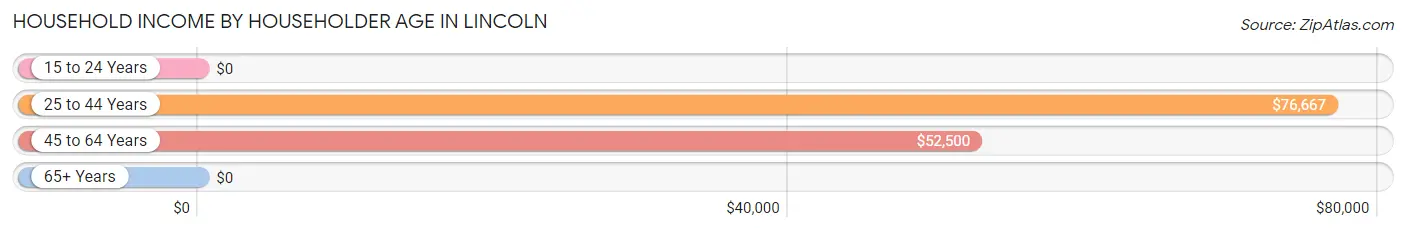
| Income Bracket | # Households | Median Income |
| 15 to 24 Years | 0 (0.0%) | $0 |
| 25 to 44 Years | 12 (24.0%) | $76,667 |
| 45 to 64 Years | 24 (48.0%) | $52,500 |
| 65+ Years | 14 (28.0%) | $0 |
| Total | 50 (100.0%) | $57,500 |
Poverty in Lincoln
Income Below Poverty by Sex and Age in Lincoln
With 16.4% poverty level for males and 4.4% for females among the residents of Lincoln, 75 year old and over males and 45 to 54 year old females are the most vulnerable to poverty, with 5 males (55.6%) and 1 females (25.0%) in their respective age groups living below the poverty level.
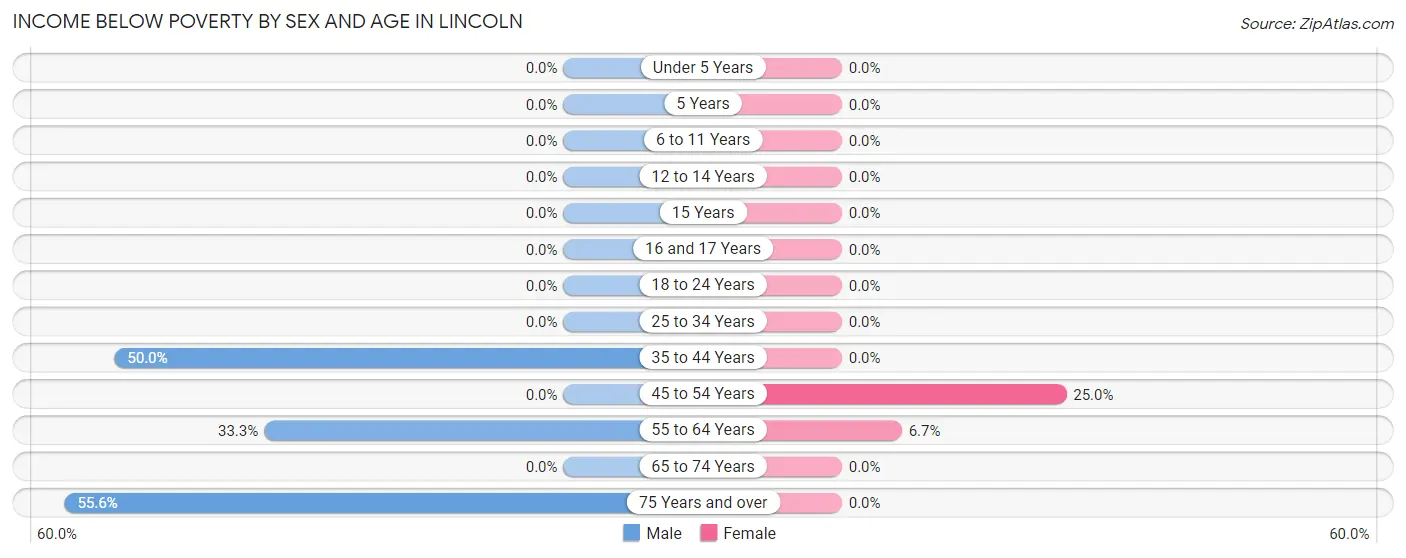
| Age Bracket | Male | Female |
| Under 5 Years | 0 (0.0%) | 0 (0.0%) |
| 5 Years | 0 (0.0%) | 0 (0.0%) |
| 6 to 11 Years | 0 (0.0%) | 0 (0.0%) |
| 12 to 14 Years | 0 (0.0%) | 0 (0.0%) |
| 15 Years | 0 (0.0%) | 0 (0.0%) |
| 16 and 17 Years | 0 (0.0%) | 0 (0.0%) |
| 18 to 24 Years | 0 (0.0%) | 0 (0.0%) |
| 25 to 34 Years | 0 (0.0%) | 0 (0.0%) |
| 35 to 44 Years | 1 (50.0%) | 0 (0.0%) |
| 45 to 54 Years | 0 (0.0%) | 1 (25.0%) |
| 55 to 64 Years | 6 (33.3%) | 1 (6.7%) |
| 65 to 74 Years | 0 (0.0%) | 0 (0.0%) |
| 75 Years and over | 5 (55.6%) | 0 (0.0%) |
| Total | 12 (16.4%) | 2 (4.4%) |
Income Above Poverty by Sex and Age in Lincoln
According to the poverty statistics in Lincoln, males aged under 5 years and females aged under 5 years are the age groups that are most secure financially, with 100.0% of males and 100.0% of females in these age groups living above the poverty line.
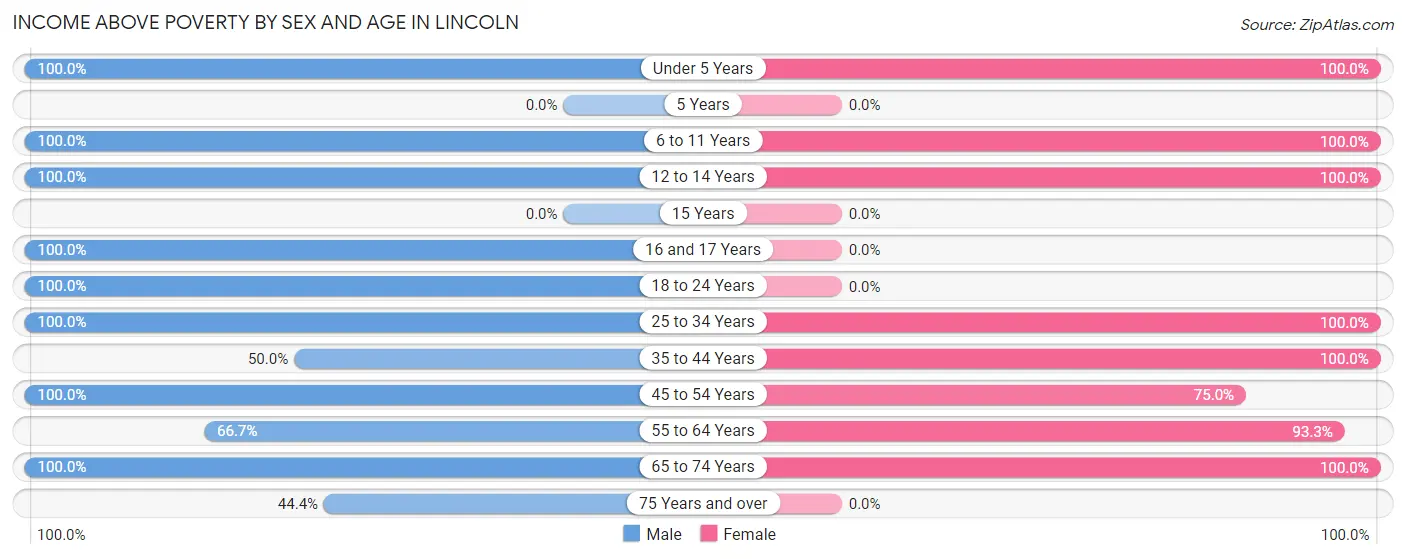
| Age Bracket | Male | Female |
| Under 5 Years | 6 (100.0%) | 3 (100.0%) |
| 5 Years | 0 (0.0%) | 0 (0.0%) |
| 6 to 11 Years | 6 (100.0%) | 1 (100.0%) |
| 12 to 14 Years | 1 (100.0%) | 4 (100.0%) |
| 15 Years | 0 (0.0%) | 0 (0.0%) |
| 16 and 17 Years | 6 (100.0%) | 0 (0.0%) |
| 18 to 24 Years | 2 (100.0%) | 0 (0.0%) |
| 25 to 34 Years | 8 (100.0%) | 7 (100.0%) |
| 35 to 44 Years | 1 (50.0%) | 5 (100.0%) |
| 45 to 54 Years | 6 (100.0%) | 3 (75.0%) |
| 55 to 64 Years | 12 (66.7%) | 14 (93.3%) |
| 65 to 74 Years | 9 (100.0%) | 6 (100.0%) |
| 75 Years and over | 4 (44.4%) | 0 (0.0%) |
| Total | 61 (83.6%) | 43 (95.6%) |
Income Below Poverty Among Married-Couple Families in Lincoln
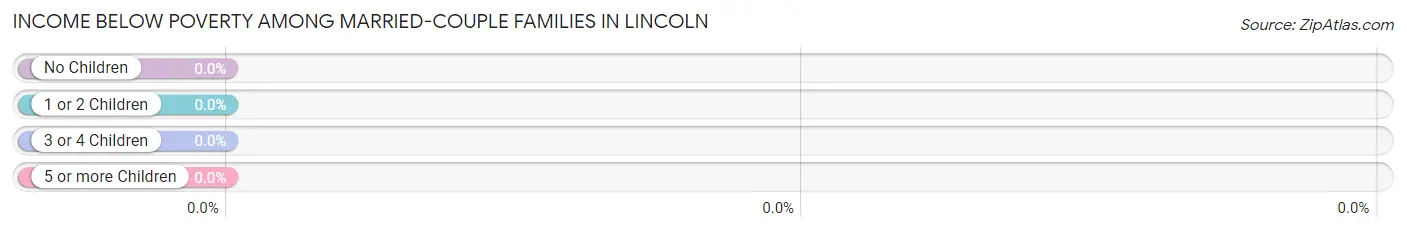
| Children | Above Poverty | Below Poverty |
| No Children | 20 (100.0%) | 0 (0.0%) |
| 1 or 2 Children | 5 (100.0%) | 0 (0.0%) |
| 3 or 4 Children | 3 (100.0%) | 0 (0.0%) |
| 5 or more Children | 0 (0.0%) | 0 (0.0%) |
| Total | 28 (100.0%) | 0 (0.0%) |
Income Below Poverty Among Single-Parent Households in Lincoln
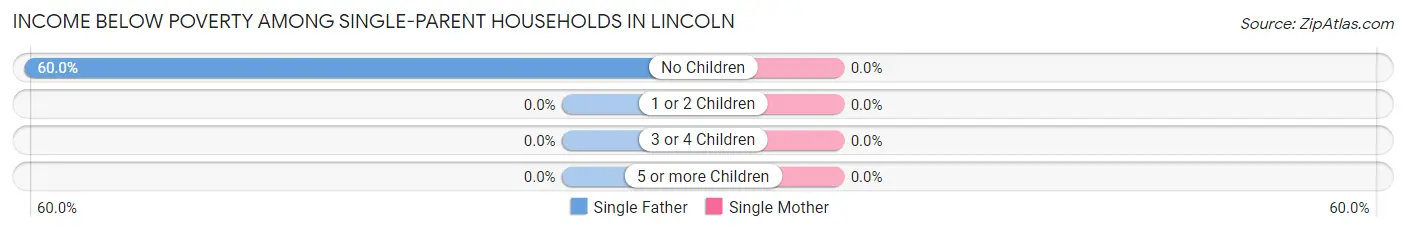
| Children | Single Father | Single Mother |
| No Children | 3 (60.0%) | 0 (0.0%) |
| 1 or 2 Children | 0 (0.0%) | 0 (0.0%) |
| 3 or 4 Children | 0 (0.0%) | 0 (0.0%) |
| 5 or more Children | 0 (0.0%) | 0 (0.0%) |
| Total | 3 (60.0%) | 0 (0.0%) |
Income Below Poverty Among Married-Couple vs Single-Parent Households in Lincoln
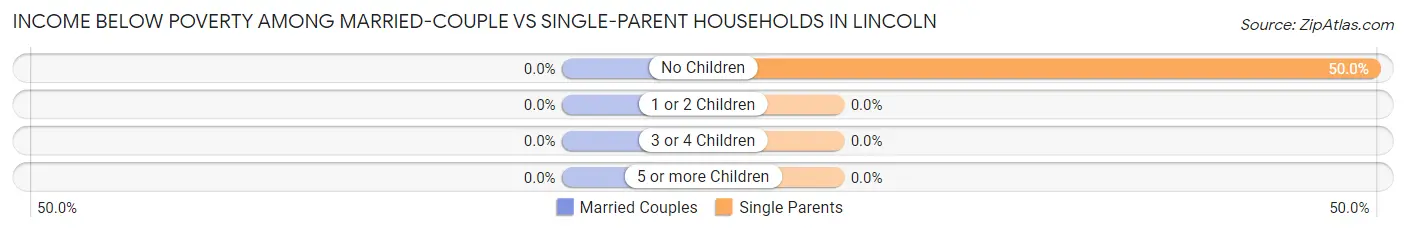
| Children | Married-Couple Families | Single-Parent Households |
| No Children | 0 (0.0%) | 3 (50.0%) |
| 1 or 2 Children | 0 (0.0%) | 0 (0.0%) |
| 3 or 4 Children | 0 (0.0%) | 0 (0.0%) |
| 5 or more Children | 0 (0.0%) | 0 (0.0%) |
| Total | 0 (0.0%) | 3 (37.5%) |
Race in Lincoln
The most populous races in Lincoln are White / Caucasian (114 | 96.6%), Hispanic or Latino (10 | 8.5%), and Two or more Races (4 | 3.4%).
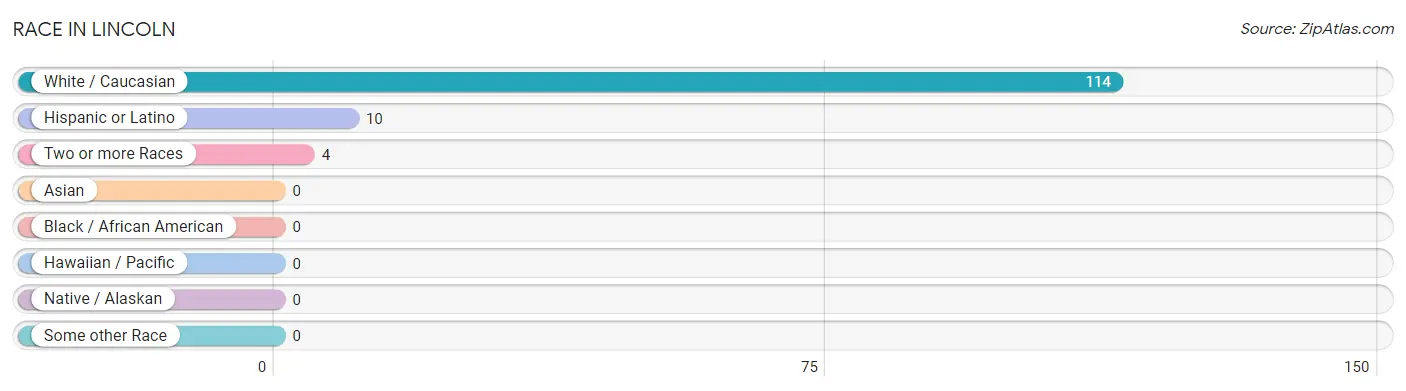
| Race | # Population | % Population |
| Asian | 0 | 0.0% |
| Black / African American | 0 | 0.0% |
| Hawaiian / Pacific | 0 | 0.0% |
| Hispanic or Latino | 10 | 8.5% |
| Native / Alaskan | 0 | 0.0% |
| White / Caucasian | 114 | 96.6% |
| Two or more Races | 4 | 3.4% |
| Some other Race | 0 | 0.0% |
| Total | 118 | 100.0% |
Ancestry in Lincoln
The most populous ancestries reported in Lincoln are German (31 | 26.3%), English (14 | 11.9%), Mexican (8 | 6.8%), Irish (6 | 5.1%), and Danish (4 | 3.4%), together accounting for 53.4% of all Lincoln residents.
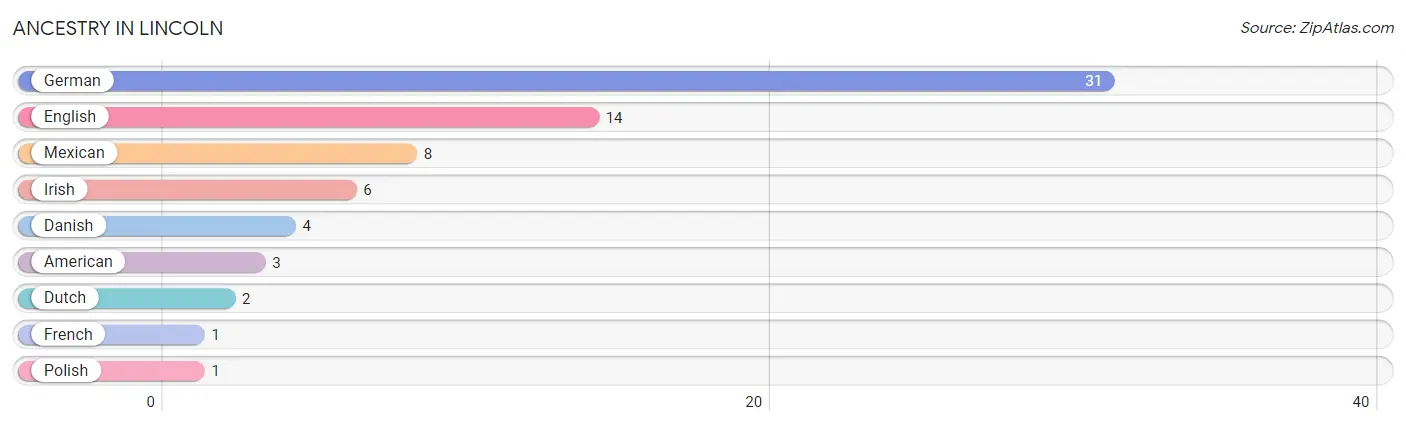
| Ancestry | # Population | % Population |
| American | 3 | 2.5% |
| Danish | 4 | 3.4% |
| Dutch | 2 | 1.7% |
| English | 14 | 11.9% |
| French | 1 | 0.9% |
| German | 31 | 26.3% |
| Irish | 6 | 5.1% |
| Mexican | 8 | 6.8% |
| Polish | 1 | 0.9% | View All 9 Rows |
Immigrants in Lincoln

| Immigration Origin | # Population | % Population | View All 0 Rows |
Sex and Age in Lincoln
Sex and Age in Lincoln
The most populous age groups in Lincoln are 60 to 64 Years (13 | 17.8%) for men and 60 to 64 Years (9 | 20.0%) for women.
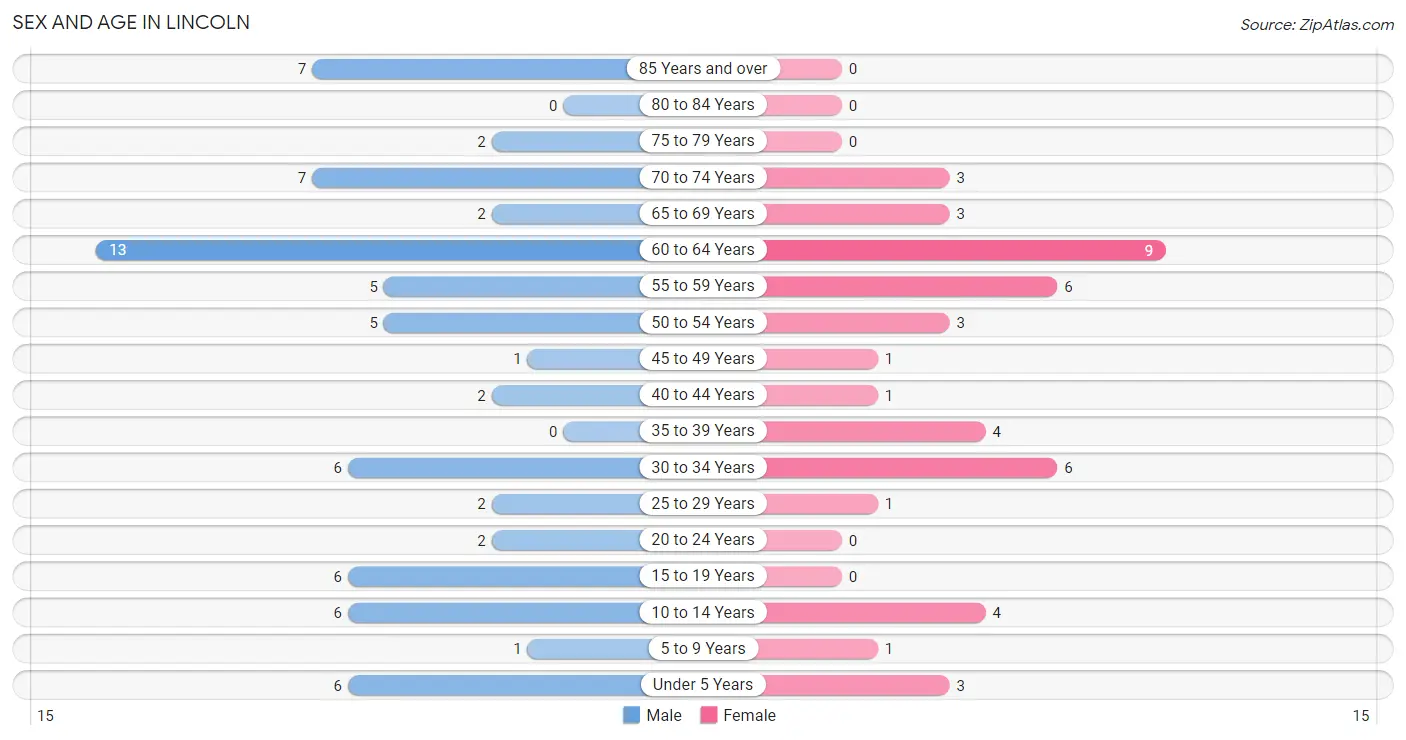
| Age Bracket | Male | Female |
| Under 5 Years | 6 (8.2%) | 3 (6.7%) |
| 5 to 9 Years | 1 (1.4%) | 1 (2.2%) |
| 10 to 14 Years | 6 (8.2%) | 4 (8.9%) |
| 15 to 19 Years | 6 (8.2%) | 0 (0.0%) |
| 20 to 24 Years | 2 (2.7%) | 0 (0.0%) |
| 25 to 29 Years | 2 (2.7%) | 1 (2.2%) |
| 30 to 34 Years | 6 (8.2%) | 6 (13.3%) |
| 35 to 39 Years | 0 (0.0%) | 4 (8.9%) |
| 40 to 44 Years | 2 (2.7%) | 1 (2.2%) |
| 45 to 49 Years | 1 (1.4%) | 1 (2.2%) |
| 50 to 54 Years | 5 (6.9%) | 3 (6.7%) |
| 55 to 59 Years | 5 (6.9%) | 6 (13.3%) |
| 60 to 64 Years | 13 (17.8%) | 9 (20.0%) |
| 65 to 69 Years | 2 (2.7%) | 3 (6.7%) |
| 70 to 74 Years | 7 (9.6%) | 3 (6.7%) |
| 75 to 79 Years | 2 (2.7%) | 0 (0.0%) |
| 80 to 84 Years | 0 (0.0%) | 0 (0.0%) |
| 85 Years and over | 7 (9.6%) | 0 (0.0%) |
| Total | 73 (100.0%) | 45 (100.0%) |
Families and Households in Lincoln
Median Family Size in Lincoln
The median family size in Lincoln is 2.81 persons per family, with married-couple families (28 | 77.8%) accounting for the largest median family size of 2.93 persons per family. On the other hand, single female/mother families (3 | 8.3%) represent the smallest median family size with 2.33 persons per family.
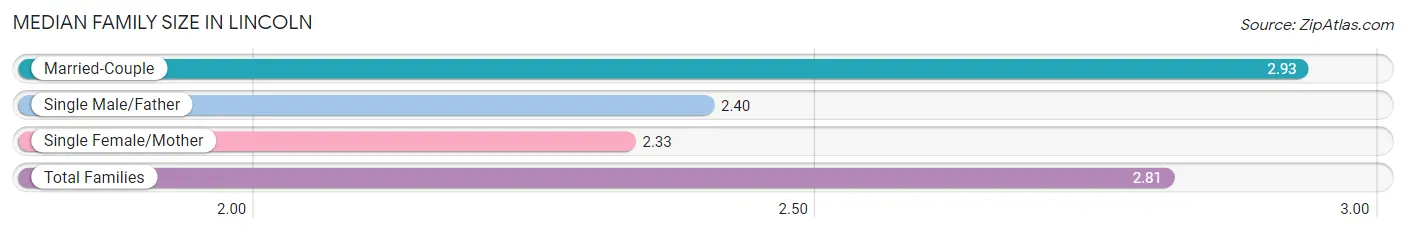
| Family Type | # Families | Family Size |
| Married-Couple | 28 (77.8%) | 2.93 |
| Single Male/Father | 5 (13.9%) | 2.40 |
| Single Female/Mother | 3 (8.3%) | 2.33 |
| Total Families | 36 (100.0%) | 2.81 |
Median Household Size in Lincoln
The median household size in Lincoln is 2.36 persons per household, with married-couple households (28 | 56.0%) accounting for the largest median household size of 2.93 persons per household. non-family households (14 | 28.0%) represent the smallest median household size with 1.14 persons per household.
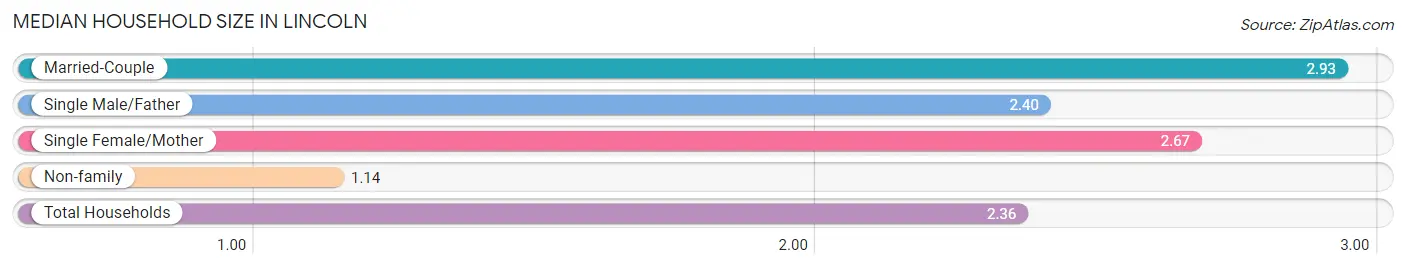
| Household Type | # Households | Household Size |
| Married-Couple | 28 (56.0%) | 2.93 |
| Single Male/Father | 5 (10.0%) | 2.40 |
| Single Female/Mother | 3 (6.0%) | 2.67 |
| Non-family | 14 (28.0%) | 1.14 |
| Total Households | 50 (100.0%) | 2.36 |
Household Size by Marriage Status in Lincoln
Out of a total of 50 households in Lincoln, 36 (72.0%) are family households, while 14 (28.0%) are nonfamily households. The most numerous type of family households are 2-person households, comprising 26, and the most common type of nonfamily households are 1-person households, comprising 11.
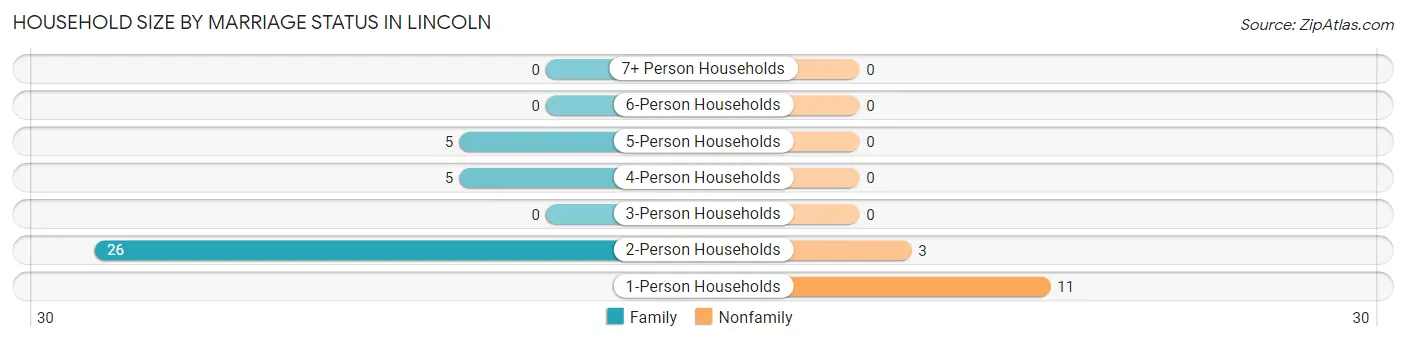
| Household Size | Family Households | Nonfamily Households |
| 1-Person Households | - | 11 (22.0%) |
| 2-Person Households | 26 (52.0%) | 3 (6.0%) |
| 3-Person Households | 0 (0.0%) | 0 (0.0%) |
| 4-Person Households | 5 (10.0%) | 0 (0.0%) |
| 5-Person Households | 5 (10.0%) | 0 (0.0%) |
| 6-Person Households | 0 (0.0%) | 0 (0.0%) |
| 7+ Person Households | 0 (0.0%) | 0 (0.0%) |
| Total | 36 (72.0%) | 14 (28.0%) |
Female Fertility in Lincoln
Fertility by Age in Lincoln
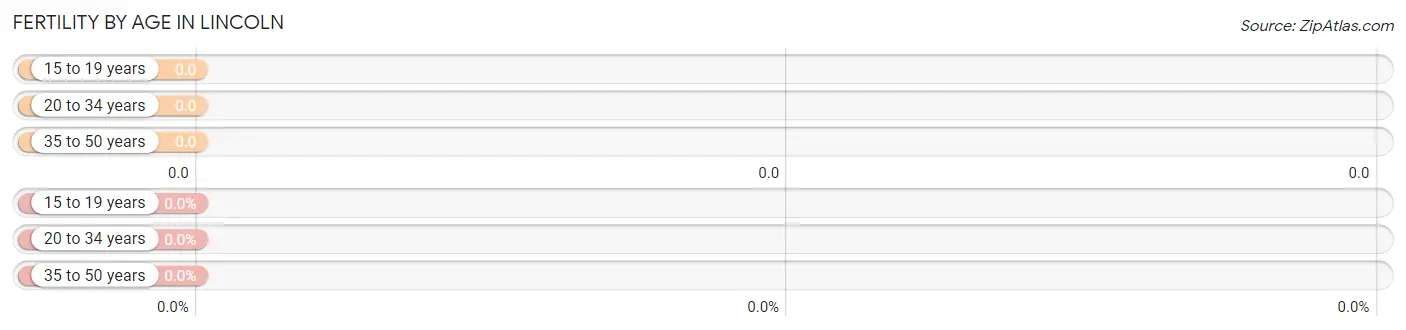
| Age Bracket | Women with Births | Births / 1,000 Women |
| 15 to 19 years | 0 (0.0%) | 0.0 |
| 20 to 34 years | 0 (0.0%) | 0.0 |
| 35 to 50 years | 0 (0.0%) | 0.0 |
| Total | 0 (0.0%) | 0.0 |
Fertility by Age by Marriage Status in Lincoln
| Age Bracket | Married | Unmarried |
| 15 to 19 years | 0 (0.0%) | 0 (0.0%) |
| 20 to 34 years | 0 (0.0%) | 0 (0.0%) |
| 35 to 50 years | 0 (0.0%) | 0 (0.0%) |
| Total | 0 (0.0%) | 0 (0.0%) |
Fertility by Education in Lincoln
| Educational Attainment | Women with Births | Births / 1,000 Women |
| Less than High School | 0 (0.0%) | 0.0 |
| High School Diploma | 0 (0.0%) | 0.0 |
| College or Associate's Degree | 0 (0.0%) | 0.0 |
| Bachelor's Degree | 0 (0.0%) | 0.0 |
| Graduate Degree | 0 (0.0%) | 0.0 |
| Total | 0 (0.0%) | 0.0 |
Fertility by Education by Marriage Status in Lincoln
| Educational Attainment | Married | Unmarried |
| Less than High School | 0 (0.0%) | 0 (0.0%) |
| High School Diploma | 0 (0.0%) | 0 (0.0%) |
| College or Associate's Degree | 0 (0.0%) | 0 (0.0%) |
| Bachelor's Degree | 0 (0.0%) | 0 (0.0%) |
| Graduate Degree | 0 (0.0%) | 0 (0.0%) |
| Total | 0 (0.0%) | 0 (0.0%) |
Employment Characteristics in Lincoln
Employment by Class of Employer in Lincoln
Among the 55 employed individuals in Lincoln, private company employees (41 | 74.6%), self-employed (incorporated) (8 | 14.5%), and state government employees (4 | 7.3%) make up the most common classes of employment.
| Employer Class | # Employees | % Employees |
| Private Company Employees | 41 | 74.6% |
| Self-Employed (Incorporated) | 8 | 14.5% |
| Self-Employed (Not Incorporated) | 2 | 3.6% |
| Not-for-profit Organizations | 0 | 0.0% |
| Local Government Employees | 0 | 0.0% |
| State Government Employees | 4 | 7.3% |
| Federal Government Employees | 0 | 0.0% |
| Unpaid Family Workers | 0 | 0.0% |
| Total | 55 | 100.0% |
Employment Status by Age in Lincoln
| Age Bracket | In Labor Force | Unemployed |
| 16 to 19 Years | 0 (0.0%) | 0 (0.0%) |
| 20 to 24 Years | 2 (100.0%) | 0 (0.0%) |
| 25 to 29 Years | 3 (100.0%) | 0 (0.0%) |
| 30 to 34 Years | 12 (100.0%) | 0 (0.0%) |
| 35 to 44 Years | 6 (85.7%) | 0 (0.0%) |
| 45 to 54 Years | 7 (70.0%) | 0 (0.0%) |
| 55 to 59 Years | 11 (100.0%) | 0 (0.0%) |
| 60 to 64 Years | 14 (63.6%) | 0 (0.0%) |
| 65 to 74 Years | 0 (0.0%) | 0 (0.0%) |
| 75 Years and over | 0 (0.0%) | 0 (0.0%) |
| Total | 55 (56.7%) | 0 (0.0%) |
Employment Status by Educational Attainment in Lincoln
| Educational Attainment | In Labor Force | Unemployed |
| Less than High School | 4 (66.7%) | 0 (0.0%) |
| High School Diploma | 23 (74.2%) | 0 (0.0%) |
| College / Associate Degree | 20 (90.9%) | 0 (0.0%) |
| Bachelor's Degree or higher | 6 (100.0%) | 0 (0.0%) |
| Total | 53 (81.5%) | 0 (0.0%) |
Employment Occupations by Sex in Lincoln
Management, Business, Science and Arts Occupations
The most common Management, Business, Science and Arts occupations in Lincoln are Management (6 | 10.9%), Community & Social Service (5 | 9.1%), Education Instruction & Library (4 | 7.3%), Health Diagnosing & Treating (4 | 7.3%), and Computers, Engineering & Science (2 | 3.6%).
Management, Business, Science and Arts Occupations by Sex
Within the Management, Business, Science and Arts occupations in Lincoln, the most male-oriented occupations are Computers, Engineering & Science (100.0%), Life, Physical & Social Science (100.0%), and Management (83.3%), while the most female-oriented occupations are Community & Social Service (100.0%), Education, Arts & Media (100.0%), and Education Instruction & Library (100.0%).
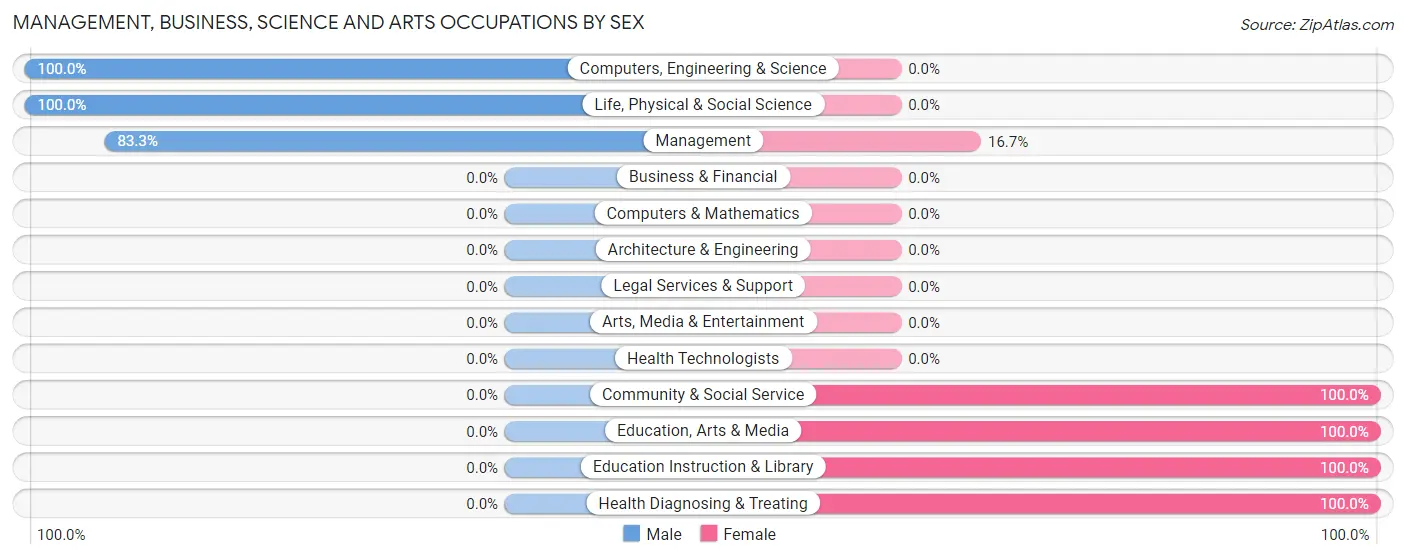
| Occupation | Male | Female |
| Management | 5 (83.3%) | 1 (16.7%) |
| Business & Financial | 0 (0.0%) | 0 (0.0%) |
| Computers, Engineering & Science | 2 (100.0%) | 0 (0.0%) |
| Computers & Mathematics | 0 (0.0%) | 0 (0.0%) |
| Architecture & Engineering | 0 (0.0%) | 0 (0.0%) |
| Life, Physical & Social Science | 2 (100.0%) | 0 (0.0%) |
| Community & Social Service | 0 (0.0%) | 5 (100.0%) |
| Education, Arts & Media | 0 (0.0%) | 1 (100.0%) |
| Legal Services & Support | 0 (0.0%) | 0 (0.0%) |
| Education Instruction & Library | 0 (0.0%) | 4 (100.0%) |
| Arts, Media & Entertainment | 0 (0.0%) | 0 (0.0%) |
| Health Diagnosing & Treating | 0 (0.0%) | 4 (100.0%) |
| Health Technologists | 0 (0.0%) | 0 (0.0%) |
| Total (Category) | 7 (41.2%) | 10 (58.8%) |
| Total (Overall) | 31 (56.4%) | 24 (43.6%) |
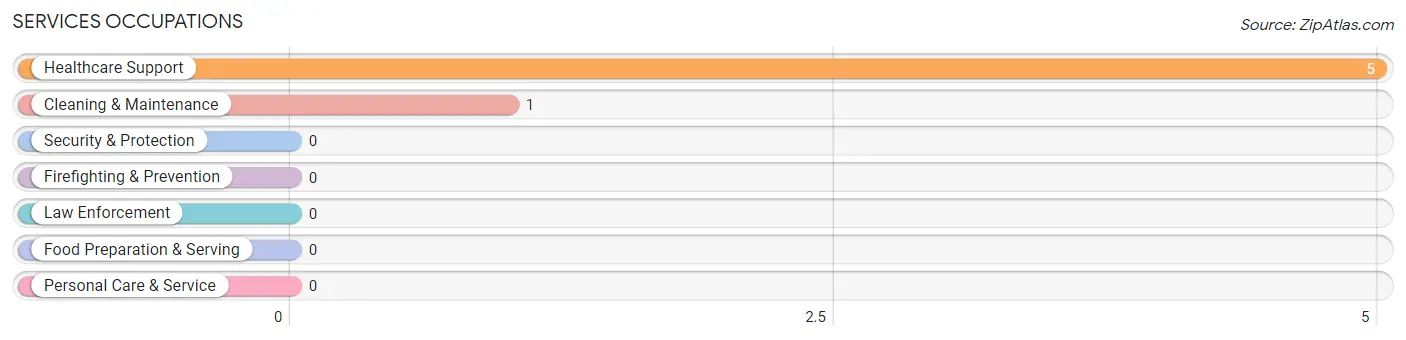
Services Occupations
The most common Services occupations in Lincoln are Healthcare Support (5 | 9.1%), and Cleaning & Maintenance (1 | 1.8%).
Services Occupations by Sex
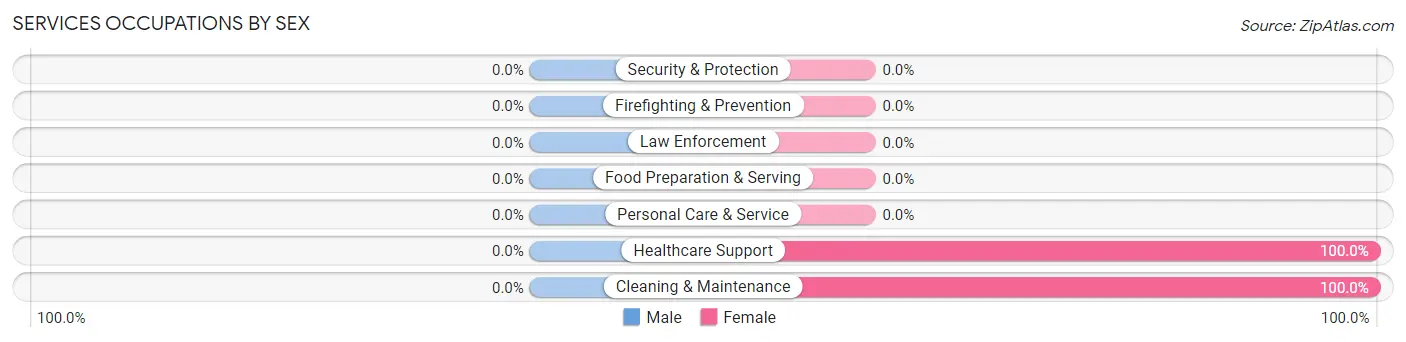
| Occupation | Male | Female |
| Healthcare Support | 0 (0.0%) | 5 (100.0%) |
| Security & Protection | 0 (0.0%) | 0 (0.0%) |
| Firefighting & Prevention | 0 (0.0%) | 0 (0.0%) |
| Law Enforcement | 0 (0.0%) | 0 (0.0%) |
| Food Preparation & Serving | 0 (0.0%) | 0 (0.0%) |
| Cleaning & Maintenance | 0 (0.0%) | 1 (100.0%) |
| Personal Care & Service | 0 (0.0%) | 0 (0.0%) |
| Total (Category) | 0 (0.0%) | 6 (100.0%) |
| Total (Overall) | 31 (56.4%) | 24 (43.6%) |
Sales and Office Occupations
The most common Sales and Office occupations in Lincoln are Sales & Related (4 | 7.3%), and Office & Administration (4 | 7.3%).
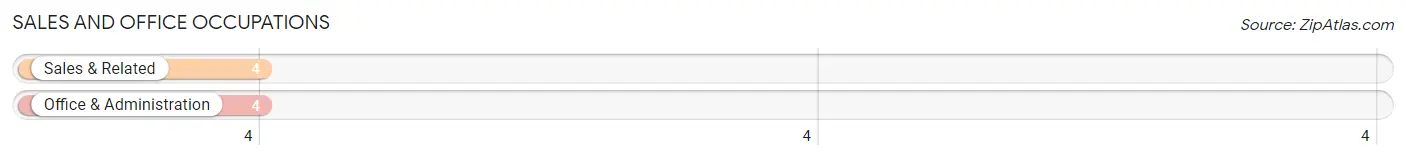
Sales and Office Occupations by Sex
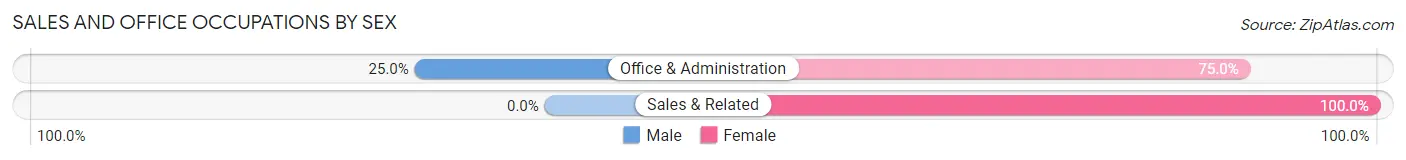
| Occupation | Male | Female |
| Sales & Related | 0 (0.0%) | 4 (100.0%) |
| Office & Administration | 1 (25.0%) | 3 (75.0%) |
| Total (Category) | 1 (12.5%) | 7 (87.5%) |
| Total (Overall) | 31 (56.4%) | 24 (43.6%) |
Natural Resources, Construction and Maintenance Occupations
The most common Natural Resources, Construction and Maintenance occupations in Lincoln are Installation, Maintenance & Repair (12 | 21.8%), Farming, Fishing & Forestry (2 | 3.6%), and Construction & Extraction (1 | 1.8%).
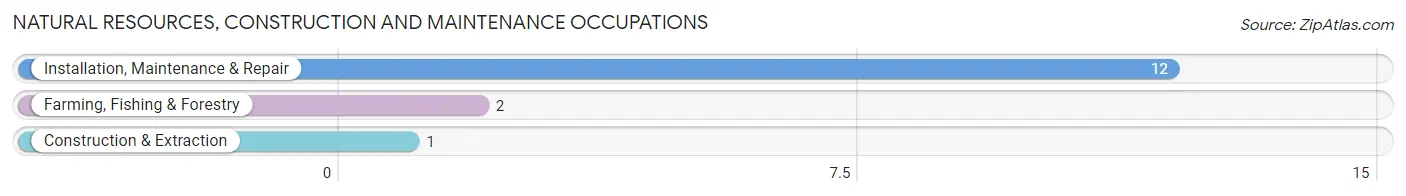
Natural Resources, Construction and Maintenance Occupations by Sex
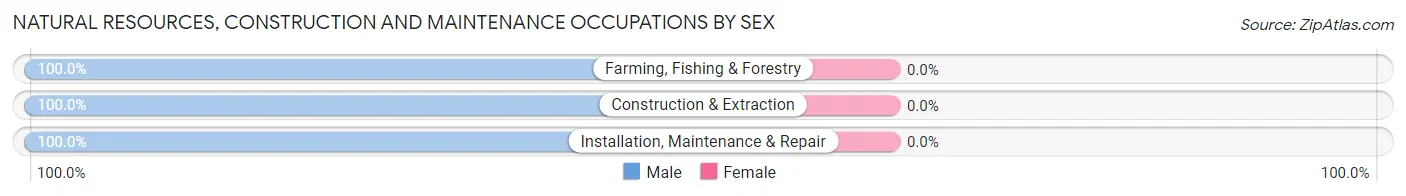
| Occupation | Male | Female |
| Farming, Fishing & Forestry | 2 (100.0%) | 0 (0.0%) |
| Construction & Extraction | 1 (100.0%) | 0 (0.0%) |
| Installation, Maintenance & Repair | 12 (100.0%) | 0 (0.0%) |
| Total (Category) | 15 (100.0%) | 0 (0.0%) |
| Total (Overall) | 31 (56.4%) | 24 (43.6%) |
Production, Transportation and Moving Occupations
The most common Production, Transportation and Moving occupations in Lincoln are Material Moving (6 | 10.9%), and Transportation (3 | 5.4%).
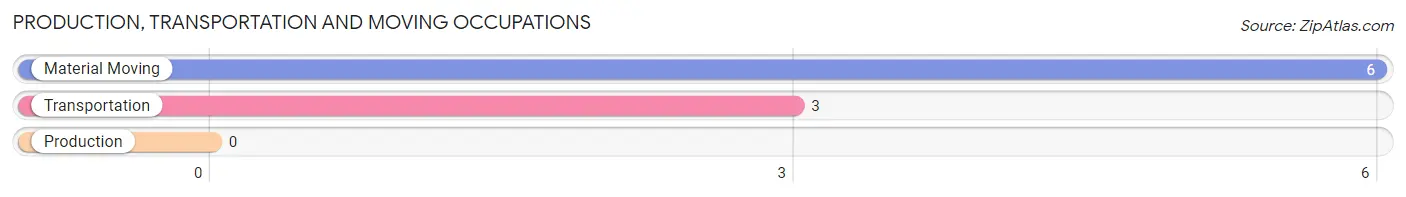
Production, Transportation and Moving Occupations by Sex
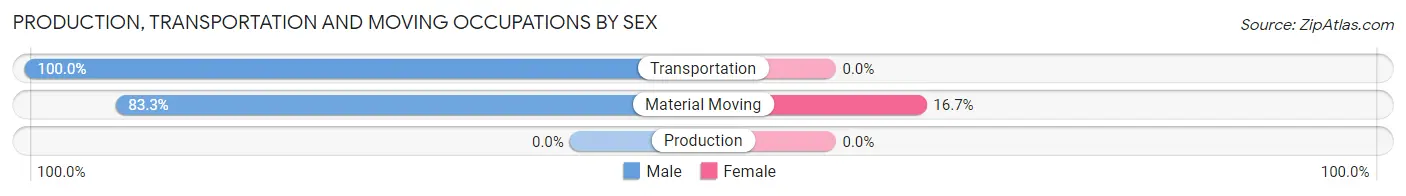
| Occupation | Male | Female |
| Production | 0 (0.0%) | 0 (0.0%) |
| Transportation | 3 (100.0%) | 0 (0.0%) |
| Material Moving | 5 (83.3%) | 1 (16.7%) |
| Total (Category) | 8 (88.9%) | 1 (11.1%) |
| Total (Overall) | 31 (56.4%) | 24 (43.6%) |
Employment Industries by Sex in Lincoln
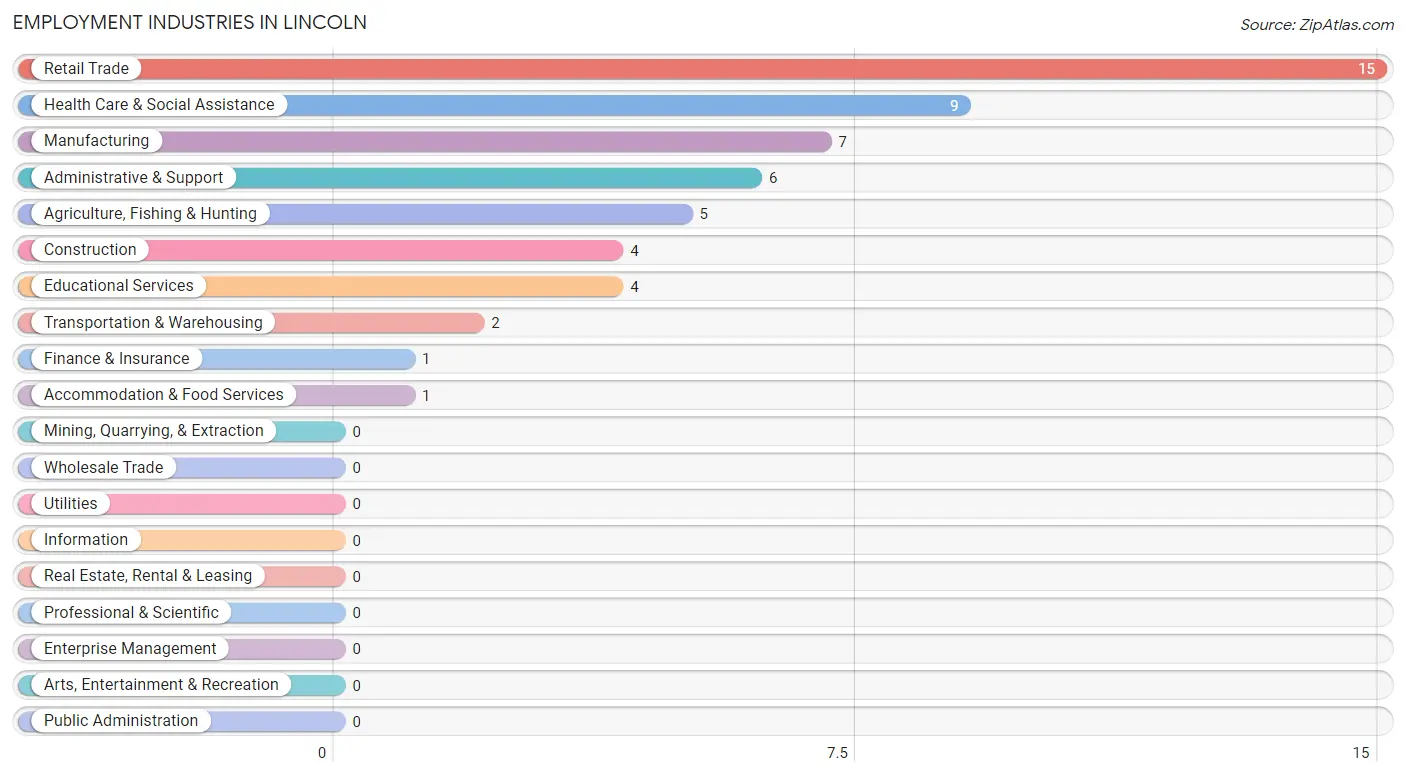
Employment Industries in Lincoln
The major employment industries in Lincoln include Retail Trade (15 | 27.3%), Health Care & Social Assistance (9 | 16.4%), Manufacturing (7 | 12.7%), Administrative & Support (6 | 10.9%), and Agriculture, Fishing & Hunting (5 | 9.1%).
Employment Industries by Sex in Lincoln
The Lincoln industries that see more men than women are Agriculture, Fishing & Hunting (100.0%), Construction (100.0%), and Transportation & Warehousing (100.0%), whereas the industries that tend to have a higher number of women are Finance & Insurance (100.0%), Educational Services (100.0%), and Health Care & Social Assistance (100.0%).
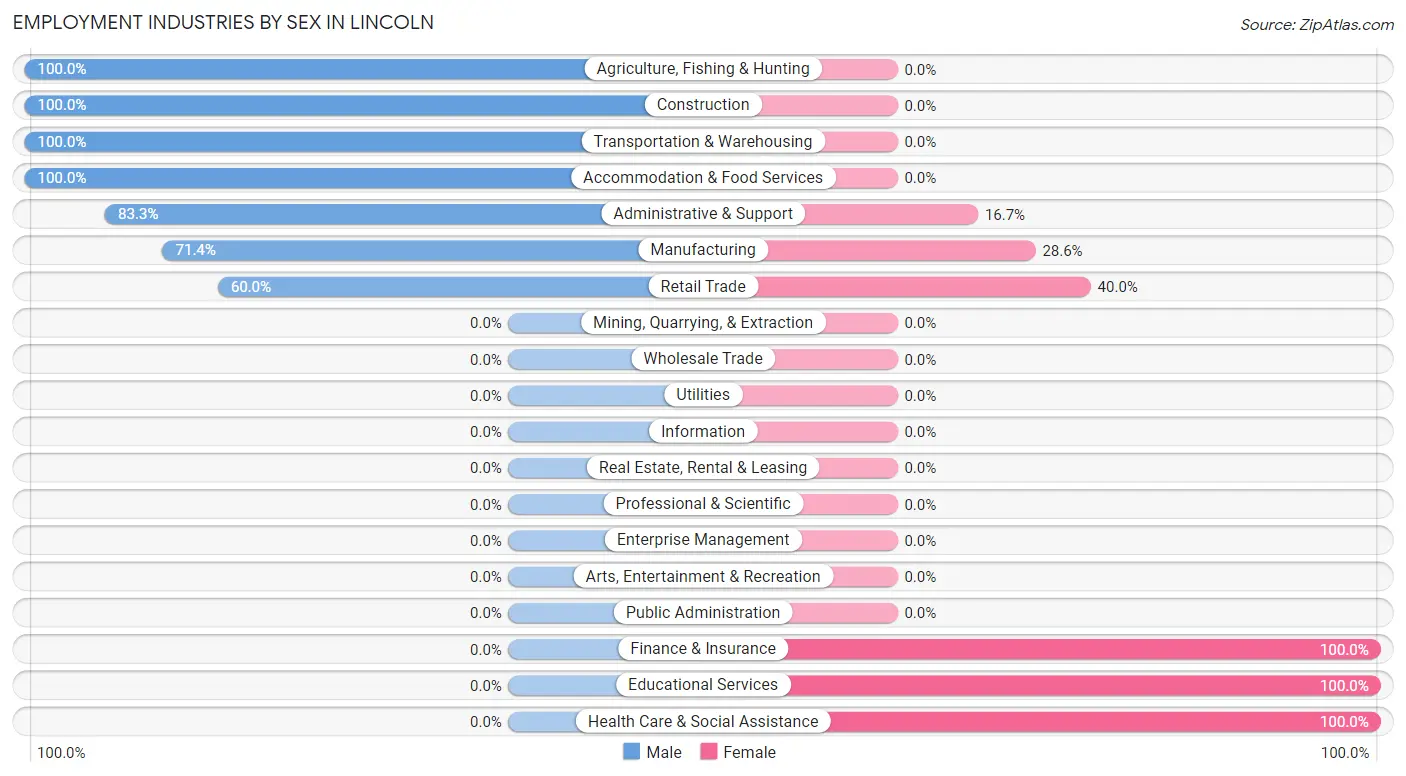
| Industry | Male | Female |
| Agriculture, Fishing & Hunting | 5 (100.0%) | 0 (0.0%) |
| Mining, Quarrying, & Extraction | 0 (0.0%) | 0 (0.0%) |
| Construction | 4 (100.0%) | 0 (0.0%) |
| Manufacturing | 5 (71.4%) | 2 (28.6%) |
| Wholesale Trade | 0 (0.0%) | 0 (0.0%) |
| Retail Trade | 9 (60.0%) | 6 (40.0%) |
| Transportation & Warehousing | 2 (100.0%) | 0 (0.0%) |
| Utilities | 0 (0.0%) | 0 (0.0%) |
| Information | 0 (0.0%) | 0 (0.0%) |
| Finance & Insurance | 0 (0.0%) | 1 (100.0%) |
| Real Estate, Rental & Leasing | 0 (0.0%) | 0 (0.0%) |
| Professional & Scientific | 0 (0.0%) | 0 (0.0%) |
| Enterprise Management | 0 (0.0%) | 0 (0.0%) |
| Administrative & Support | 5 (83.3%) | 1 (16.7%) |
| Educational Services | 0 (0.0%) | 4 (100.0%) |
| Health Care & Social Assistance | 0 (0.0%) | 9 (100.0%) |
| Arts, Entertainment & Recreation | 0 (0.0%) | 0 (0.0%) |
| Accommodation & Food Services | 1 (100.0%) | 0 (0.0%) |
| Public Administration | 0 (0.0%) | 0 (0.0%) |
| Total | 31 (56.4%) | 24 (43.6%) |
Education in Lincoln
School Enrollment in Lincoln
The most common levels of schooling among the 20 students in Lincoln are high school (10 | 50.0%), middle school (6 | 30.0%), and nursery / preschool (1 | 5.0%).
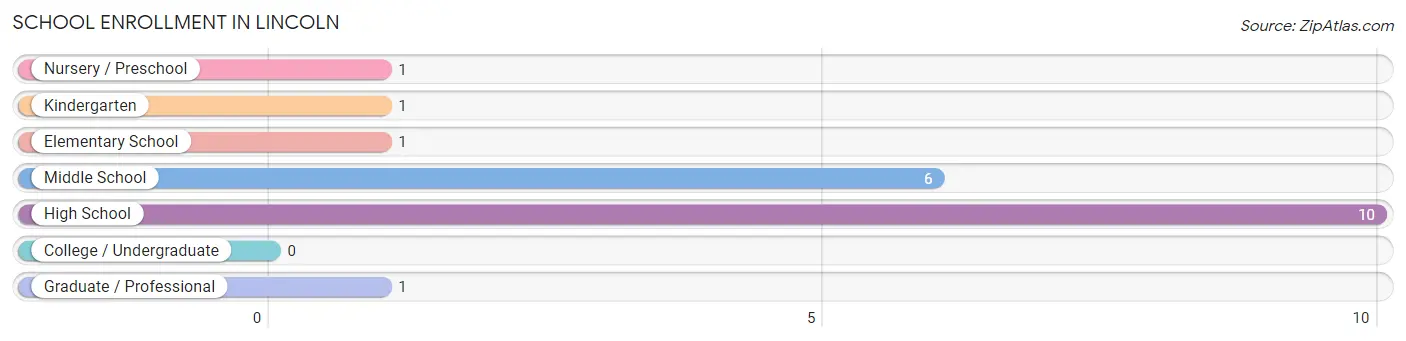
| School Level | # Students | % Students |
| Nursery / Preschool | 1 | 5.0% |
| Kindergarten | 1 | 5.0% |
| Elementary School | 1 | 5.0% |
| Middle School | 6 | 30.0% |
| High School | 10 | 50.0% |
| College / Undergraduate | 0 | 0.0% |
| Graduate / Professional | 1 | 5.0% |
| Total | 20 | 100.0% |
School Enrollment by Age by Funding Source in Lincoln
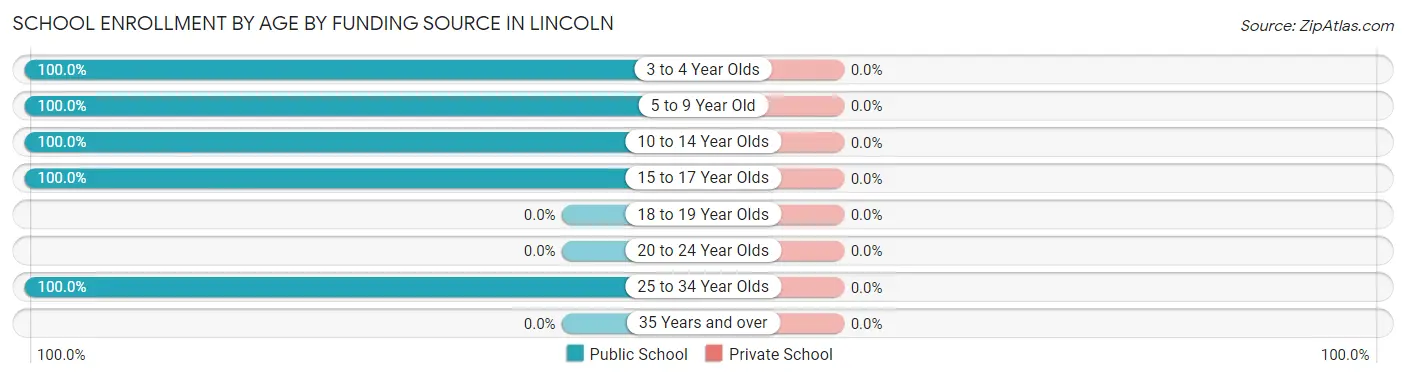
| Age Bracket | Public School | Private School |
| 3 to 4 Year Olds | 1 (100.0%) | 0 (0.0%) |
| 5 to 9 Year Old | 2 (100.0%) | 0 (0.0%) |
| 10 to 14 Year Olds | 10 (100.0%) | 0 (0.0%) |
| 15 to 17 Year Olds | 6 (100.0%) | 0 (0.0%) |
| 18 to 19 Year Olds | 0 (0.0%) | 0 (0.0%) |
| 20 to 24 Year Olds | 0 (0.0%) | 0 (0.0%) |
| 25 to 34 Year Olds | 1 (100.0%) | 0 (0.0%) |
| 35 Years and over | 0 (0.0%) | 0 (0.0%) |
| Total | 20 (100.0%) | 0 (0.0%) |
Educational Attainment by Field of Study in Lincoln
Education (5 | 62.5%), engineering (1 | 12.5%), business (1 | 12.5%), and communications (1 | 12.5%) are the most common fields of study among 8 individuals in Lincoln who have obtained a bachelor's degree or higher.
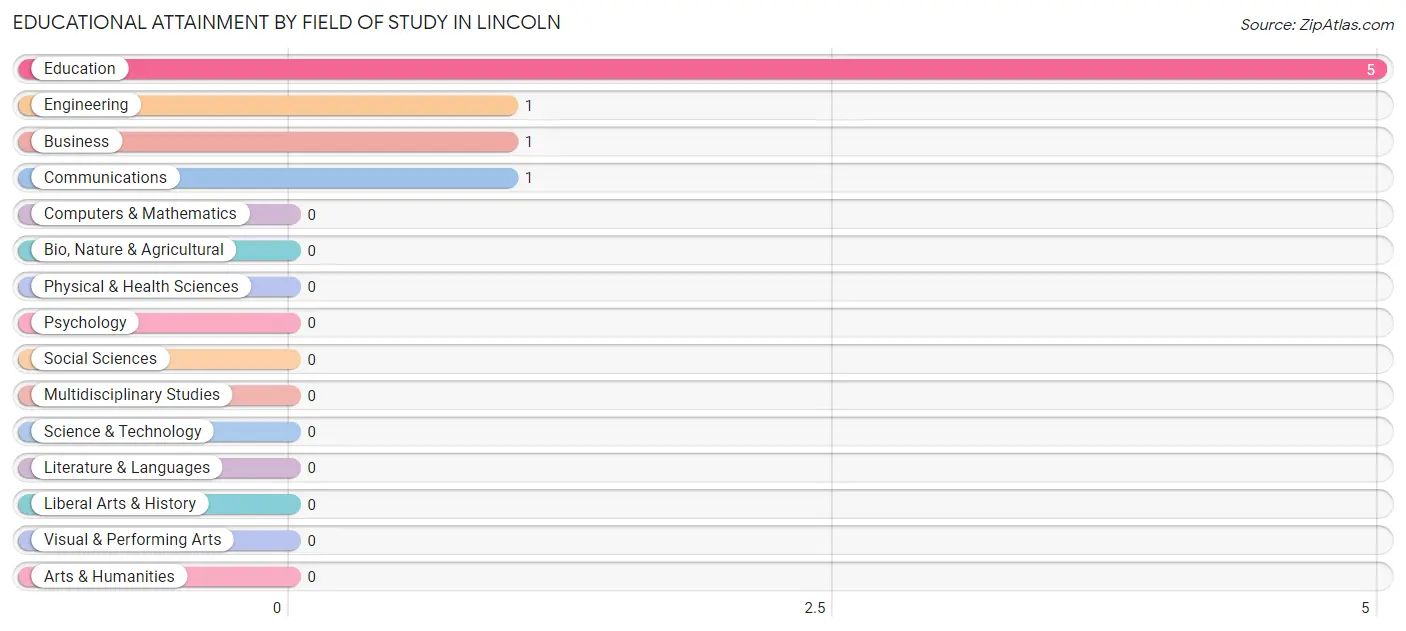
| Field of Study | # Graduates | % Graduates |
| Computers & Mathematics | 0 | 0.0% |
| Bio, Nature & Agricultural | 0 | 0.0% |
| Physical & Health Sciences | 0 | 0.0% |
| Psychology | 0 | 0.0% |
| Social Sciences | 0 | 0.0% |
| Engineering | 1 | 12.5% |
| Multidisciplinary Studies | 0 | 0.0% |
| Science & Technology | 0 | 0.0% |
| Business | 1 | 12.5% |
| Education | 5 | 62.5% |
| Literature & Languages | 0 | 0.0% |
| Liberal Arts & History | 0 | 0.0% |
| Visual & Performing Arts | 0 | 0.0% |
| Communications | 1 | 12.5% |
| Arts & Humanities | 0 | 0.0% |
| Total | 8 | 100.0% |
Transportation & Commute in Lincoln
Vehicle Availability by Sex in Lincoln
The most prevalent vehicle ownership categories in Lincoln are males with 2 vehicles (15, accounting for 48.4%) and females with 2 vehicles (15, making up 62.5%).
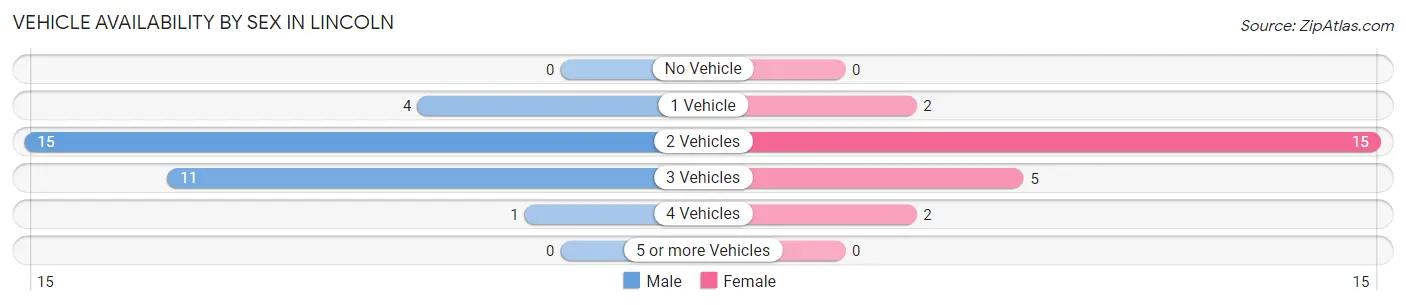
| Vehicles Available | Male | Female |
| No Vehicle | 0 (0.0%) | 0 (0.0%) |
| 1 Vehicle | 4 (12.9%) | 2 (8.3%) |
| 2 Vehicles | 15 (48.4%) | 15 (62.5%) |
| 3 Vehicles | 11 (35.5%) | 5 (20.8%) |
| 4 Vehicles | 1 (3.2%) | 2 (8.3%) |
| 5 or more Vehicles | 0 (0.0%) | 0 (0.0%) |
| Total | 31 (100.0%) | 24 (100.0%) |
Commute Time in Lincoln
The most frequently occuring commute durations in Lincoln are 30 to 34 minutes (11 commuters, 20.0%), 15 to 19 minutes (9 commuters, 16.4%), and less than 5 minutes (7 commuters, 12.7%).
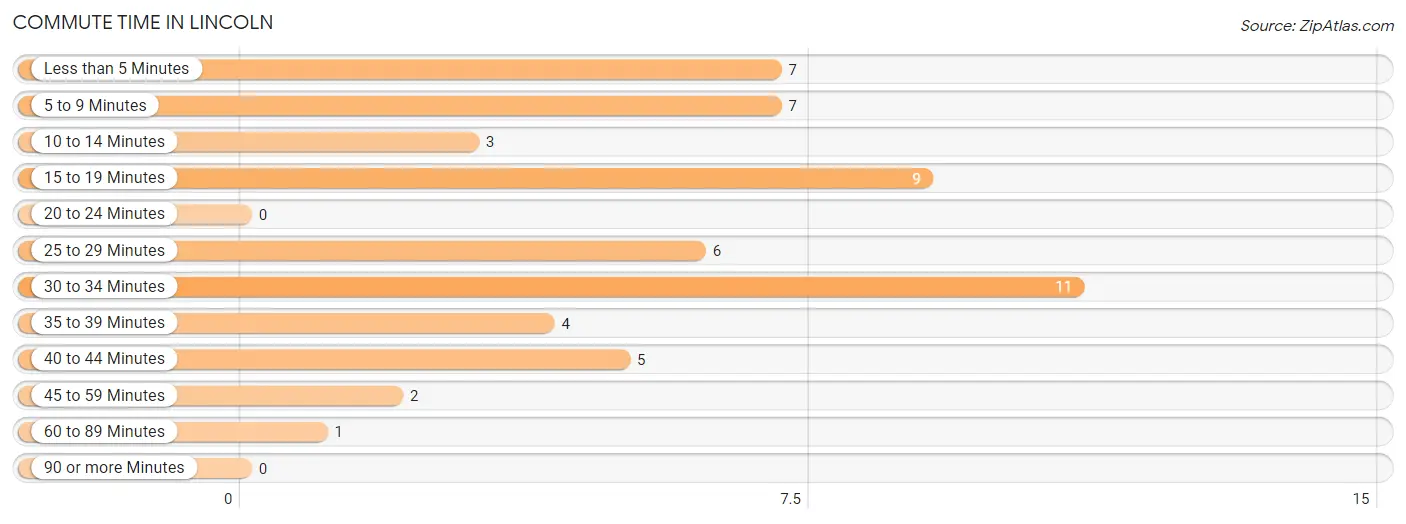
| Commute Time | # Commuters | % Commuters |
| Less than 5 Minutes | 7 | 12.7% |
| 5 to 9 Minutes | 7 | 12.7% |
| 10 to 14 Minutes | 3 | 5.4% |
| 15 to 19 Minutes | 9 | 16.4% |
| 20 to 24 Minutes | 0 | 0.0% |
| 25 to 29 Minutes | 6 | 10.9% |
| 30 to 34 Minutes | 11 | 20.0% |
| 35 to 39 Minutes | 4 | 7.3% |
| 40 to 44 Minutes | 5 | 9.1% |
| 45 to 59 Minutes | 2 | 3.6% |
| 60 to 89 Minutes | 1 | 1.8% |
| 90 or more Minutes | 0 | 0.0% |
Commute Time by Sex in Lincoln
The most common commute times in Lincoln are 15 to 19 minutes (9 commuters, 29.0%) for males and 30 to 34 minutes (11 commuters, 45.8%) for females.
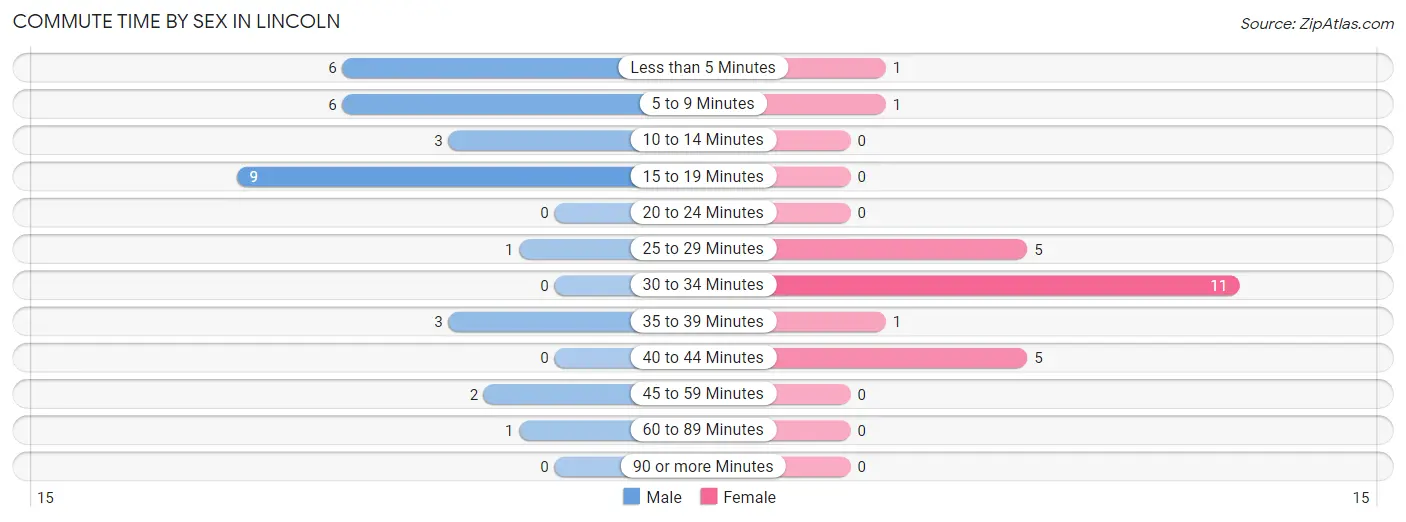
| Commute Time | Male | Female |
| Less than 5 Minutes | 6 (19.4%) | 1 (4.2%) |
| 5 to 9 Minutes | 6 (19.4%) | 1 (4.2%) |
| 10 to 14 Minutes | 3 (9.7%) | 0 (0.0%) |
| 15 to 19 Minutes | 9 (29.0%) | 0 (0.0%) |
| 20 to 24 Minutes | 0 (0.0%) | 0 (0.0%) |
| 25 to 29 Minutes | 1 (3.2%) | 5 (20.8%) |
| 30 to 34 Minutes | 0 (0.0%) | 11 (45.8%) |
| 35 to 39 Minutes | 3 (9.7%) | 1 (4.2%) |
| 40 to 44 Minutes | 0 (0.0%) | 5 (20.8%) |
| 45 to 59 Minutes | 2 (6.5%) | 0 (0.0%) |
| 60 to 89 Minutes | 1 (3.2%) | 0 (0.0%) |
| 90 or more Minutes | 0 (0.0%) | 0 (0.0%) |
Time of Departure to Work by Sex in Lincoln
The most frequent times of departure to work in Lincoln are 7:00 AM to 7:29 AM (15, 48.4%) for males and 7:00 AM to 7:29 AM (9, 37.5%) for females.
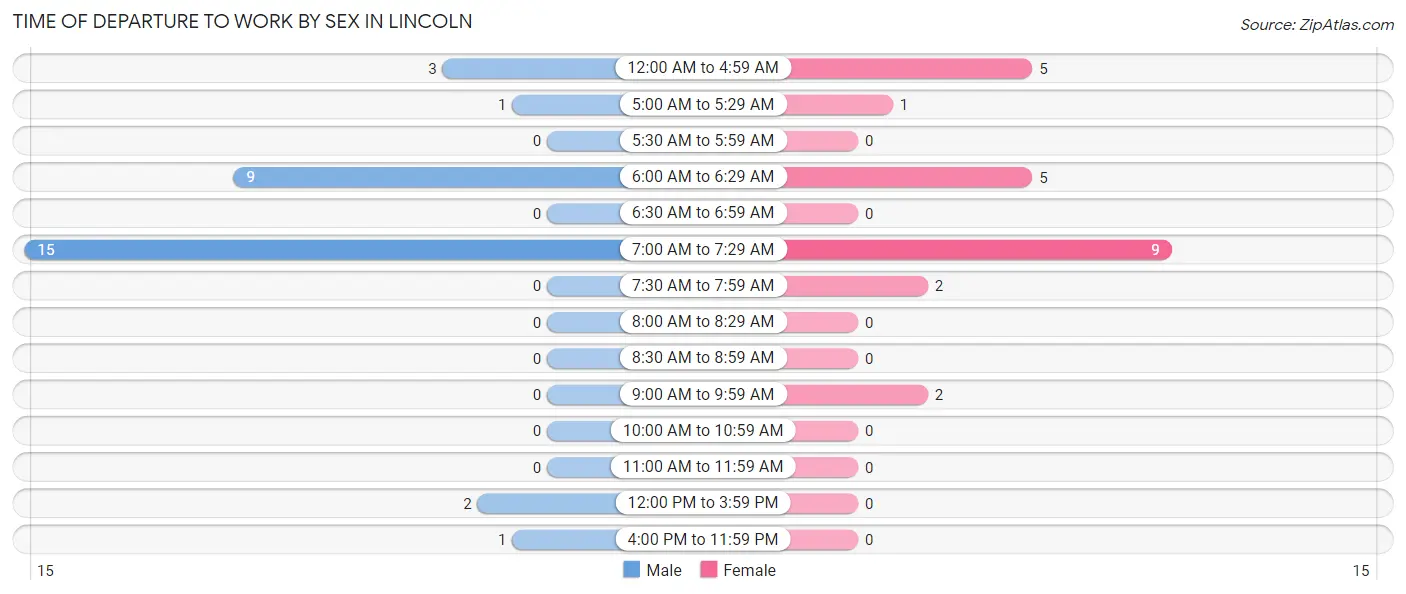
| Time of Departure | Male | Female |
| 12:00 AM to 4:59 AM | 3 (9.7%) | 5 (20.8%) |
| 5:00 AM to 5:29 AM | 1 (3.2%) | 1 (4.2%) |
| 5:30 AM to 5:59 AM | 0 (0.0%) | 0 (0.0%) |
| 6:00 AM to 6:29 AM | 9 (29.0%) | 5 (20.8%) |
| 6:30 AM to 6:59 AM | 0 (0.0%) | 0 (0.0%) |
| 7:00 AM to 7:29 AM | 15 (48.4%) | 9 (37.5%) |
| 7:30 AM to 7:59 AM | 0 (0.0%) | 2 (8.3%) |
| 8:00 AM to 8:29 AM | 0 (0.0%) | 0 (0.0%) |
| 8:30 AM to 8:59 AM | 0 (0.0%) | 0 (0.0%) |
| 9:00 AM to 9:59 AM | 0 (0.0%) | 2 (8.3%) |
| 10:00 AM to 10:59 AM | 0 (0.0%) | 0 (0.0%) |
| 11:00 AM to 11:59 AM | 0 (0.0%) | 0 (0.0%) |
| 12:00 PM to 3:59 PM | 2 (6.5%) | 0 (0.0%) |
| 4:00 PM to 11:59 PM | 1 (3.2%) | 0 (0.0%) |
| Total | 31 (100.0%) | 24 (100.0%) |
Housing Occupancy in Lincoln
Occupancy by Ownership in Lincoln
Of the total 50 dwellings in Lincoln, owner-occupied units account for 43 (86.0%), while renter-occupied units make up 7 (14.0%).
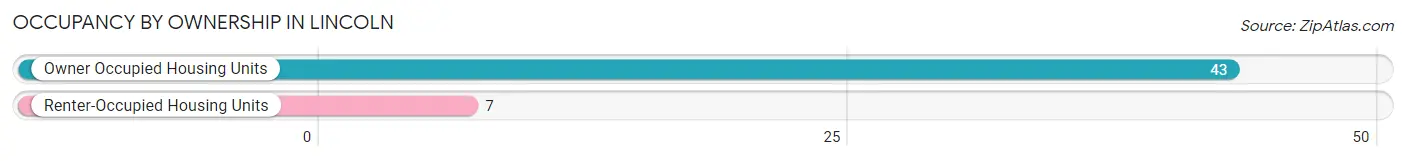
| Occupancy | # Housing Units | % Housing Units |
| Owner Occupied Housing Units | 43 | 86.0% |
| Renter-Occupied Housing Units | 7 | 14.0% |
| Total Occupied Housing Units | 50 | 100.0% |
Occupancy by Household Size in Lincoln
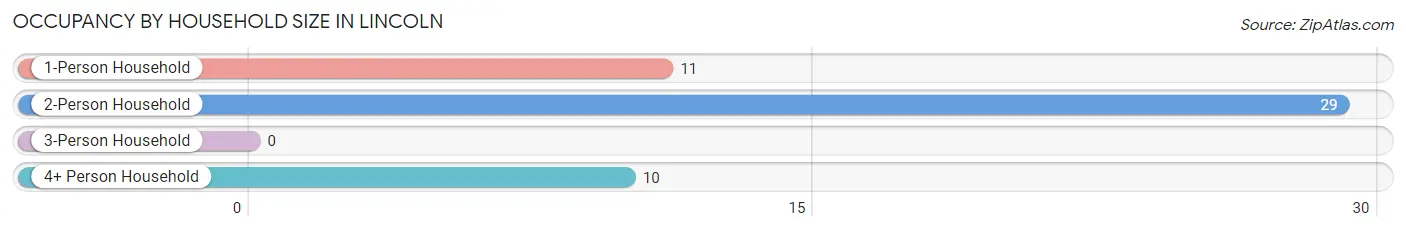
| Household Size | # Housing Units | % Housing Units |
| 1-Person Household | 11 | 22.0% |
| 2-Person Household | 29 | 58.0% |
| 3-Person Household | 0 | 0.0% |
| 4+ Person Household | 10 | 20.0% |
| Total Housing Units | 50 | 100.0% |
Occupancy by Ownership by Household Size in Lincoln
| Household Size | Owner-occupied | Renter-occupied |
| 1-Person Household | 10 (90.9%) | 1 (9.1%) |
| 2-Person Household | 28 (96.6%) | 1 (3.5%) |
| 3-Person Household | 0 (0.0%) | 0 (0.0%) |
| 4+ Person Household | 5 (50.0%) | 5 (50.0%) |
| Total Housing Units | 43 (86.0%) | 7 (14.0%) |
Occupancy by Educational Attainment in Lincoln
| Household Size | Owner-occupied | Renter-occupied |
| Less than High School | 1 (100.0%) | 0 (0.0%) |
| High School Diploma | 20 (83.3%) | 4 (16.7%) |
| College/Associate Degree | 21 (91.3%) | 2 (8.7%) |
| Bachelor's Degree or higher | 1 (50.0%) | 1 (50.0%) |
Occupancy by Age of Householder in Lincoln
| Age Bracket | # Households | % Households |
| Under 35 Years | 10 | 20.0% |
| 35 to 44 Years | 2 | 4.0% |
| 45 to 54 Years | 5 | 10.0% |
| 55 to 64 Years | 19 | 38.0% |
| 65 to 74 Years | 10 | 20.0% |
| 75 to 84 Years | 2 | 4.0% |
| 85 Years and Over | 2 | 4.0% |
| Total | 50 | 100.0% |
Housing Finances in Lincoln
Median Income by Occupancy in Lincoln
| Occupancy Type | # Households | Median Income |
| Owner-Occupied | 43 (86.0%) | $57,750 |
| Renter-Occupied | 7 (14.0%) | $0 |
| Average | 50 (100.0%) | $57,500 |
Occupancy by Householder Income Bracket in Lincoln
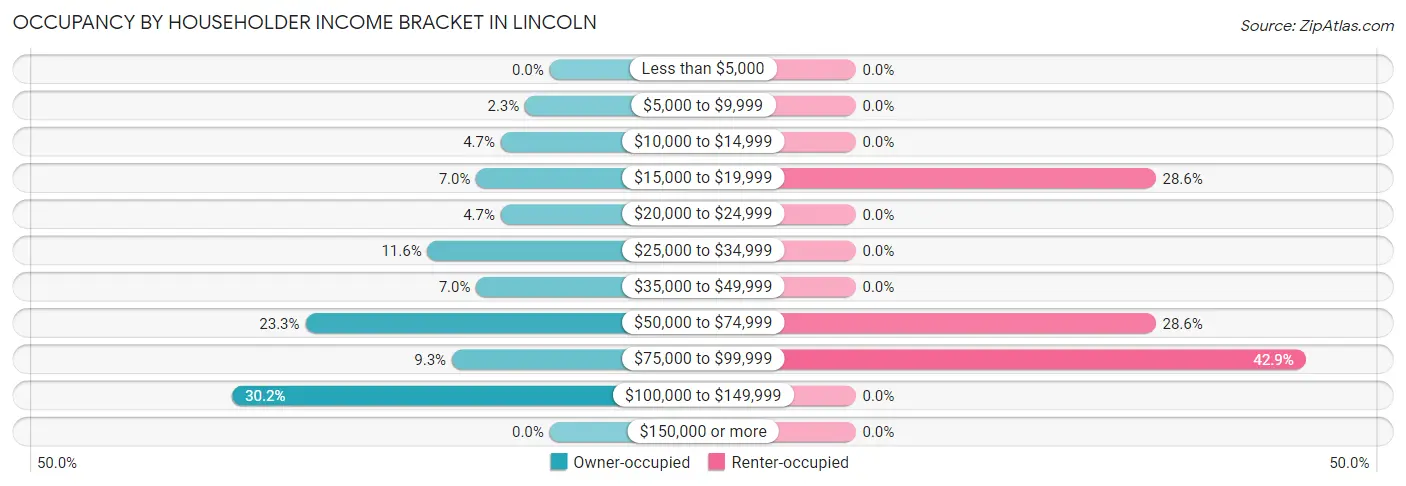
| Income Bracket | Owner-occupied | Renter-occupied |
| Less than $5,000 | 0 (0.0%) | 0 (0.0%) |
| $5,000 to $9,999 | 1 (2.3%) | 0 (0.0%) |
| $10,000 to $14,999 | 2 (4.6%) | 0 (0.0%) |
| $15,000 to $19,999 | 3 (7.0%) | 2 (28.6%) |
| $20,000 to $24,999 | 2 (4.6%) | 0 (0.0%) |
| $25,000 to $34,999 | 5 (11.6%) | 0 (0.0%) |
| $35,000 to $49,999 | 3 (7.0%) | 0 (0.0%) |
| $50,000 to $74,999 | 10 (23.3%) | 2 (28.6%) |
| $75,000 to $99,999 | 4 (9.3%) | 3 (42.9%) |
| $100,000 to $149,999 | 13 (30.2%) | 0 (0.0%) |
| $150,000 or more | 0 (0.0%) | 0 (0.0%) |
| Total | 43 (100.0%) | 7 (100.0%) |
Monthly Housing Cost Tiers in Lincoln
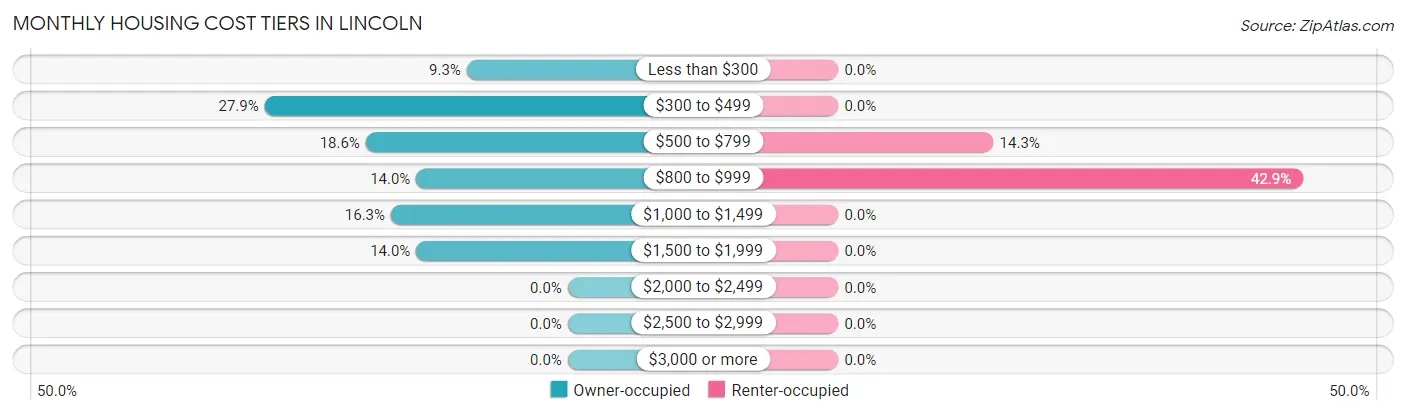
| Monthly Cost | Owner-occupied | Renter-occupied |
| Less than $300 | 4 (9.3%) | 0 (0.0%) |
| $300 to $499 | 12 (27.9%) | 0 (0.0%) |
| $500 to $799 | 8 (18.6%) | 1 (14.3%) |
| $800 to $999 | 6 (14.0%) | 3 (42.9%) |
| $1,000 to $1,499 | 7 (16.3%) | 0 (0.0%) |
| $1,500 to $1,999 | 6 (14.0%) | 0 (0.0%) |
| $2,000 to $2,499 | 0 (0.0%) | 0 (0.0%) |
| $2,500 to $2,999 | 0 (0.0%) | 0 (0.0%) |
| $3,000 or more | 0 (0.0%) | 0 (0.0%) |
| Total | 43 (100.0%) | 7 (100.0%) |
Physical Housing Characteristics in Lincoln
Housing Structures in Lincoln
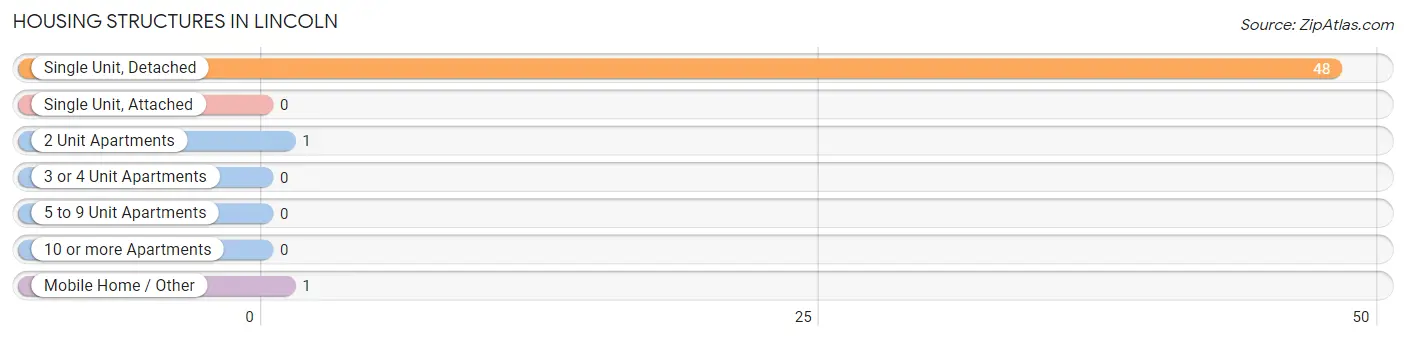
| Structure Type | # Housing Units | % Housing Units |
| Single Unit, Detached | 48 | 96.0% |
| Single Unit, Attached | 0 | 0.0% |
| 2 Unit Apartments | 1 | 2.0% |
| 3 or 4 Unit Apartments | 0 | 0.0% |
| 5 to 9 Unit Apartments | 0 | 0.0% |
| 10 or more Apartments | 0 | 0.0% |
| Mobile Home / Other | 1 | 2.0% |
| Total | 50 | 100.0% |
Housing Structures by Occupancy in Lincoln
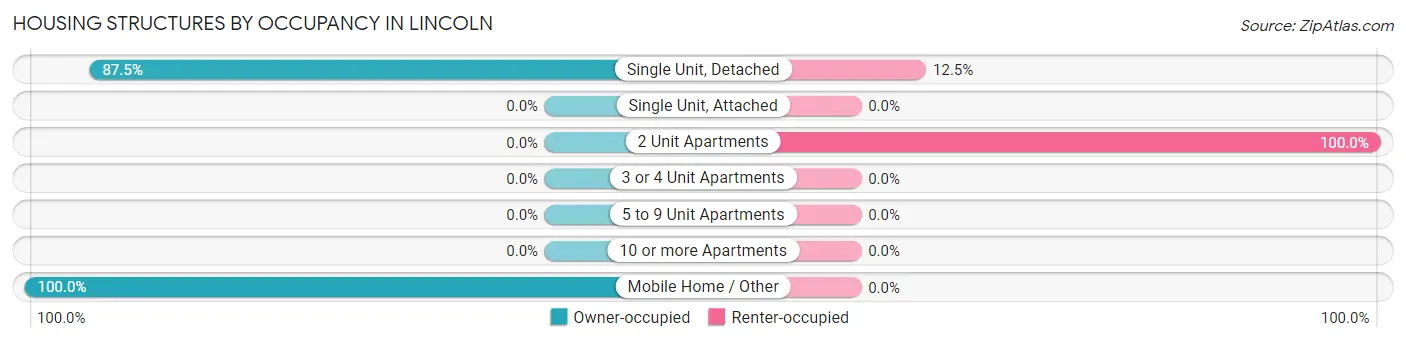
| Structure Type | Owner-occupied | Renter-occupied |
| Single Unit, Detached | 42 (87.5%) | 6 (12.5%) |
| Single Unit, Attached | 0 (0.0%) | 0 (0.0%) |
| 2 Unit Apartments | 0 (0.0%) | 1 (100.0%) |
| 3 or 4 Unit Apartments | 0 (0.0%) | 0 (0.0%) |
| 5 to 9 Unit Apartments | 0 (0.0%) | 0 (0.0%) |
| 10 or more Apartments | 0 (0.0%) | 0 (0.0%) |
| Mobile Home / Other | 1 (100.0%) | 0 (0.0%) |
| Total | 43 (86.0%) | 7 (14.0%) |
Housing Structures by Number of Rooms in Lincoln
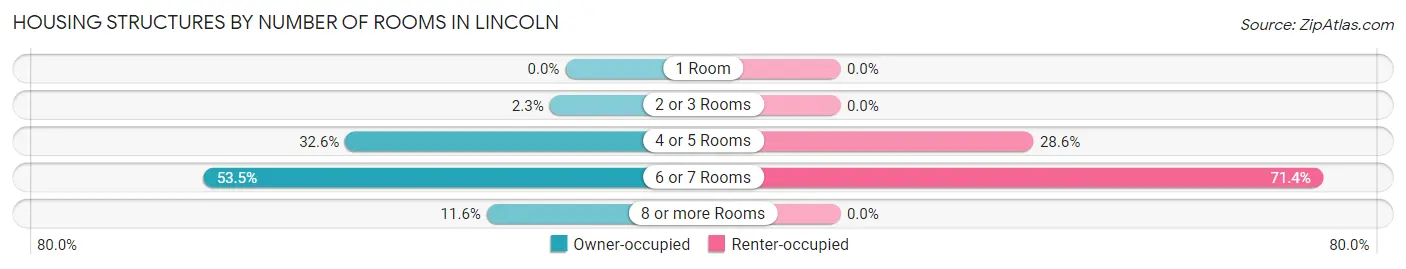
| Number of Rooms | Owner-occupied | Renter-occupied |
| 1 Room | 0 (0.0%) | 0 (0.0%) |
| 2 or 3 Rooms | 1 (2.3%) | 0 (0.0%) |
| 4 or 5 Rooms | 14 (32.6%) | 2 (28.6%) |
| 6 or 7 Rooms | 23 (53.5%) | 5 (71.4%) |
| 8 or more Rooms | 5 (11.6%) | 0 (0.0%) |
| Total | 43 (100.0%) | 7 (100.0%) |
Housing Structure by Heating Type in Lincoln
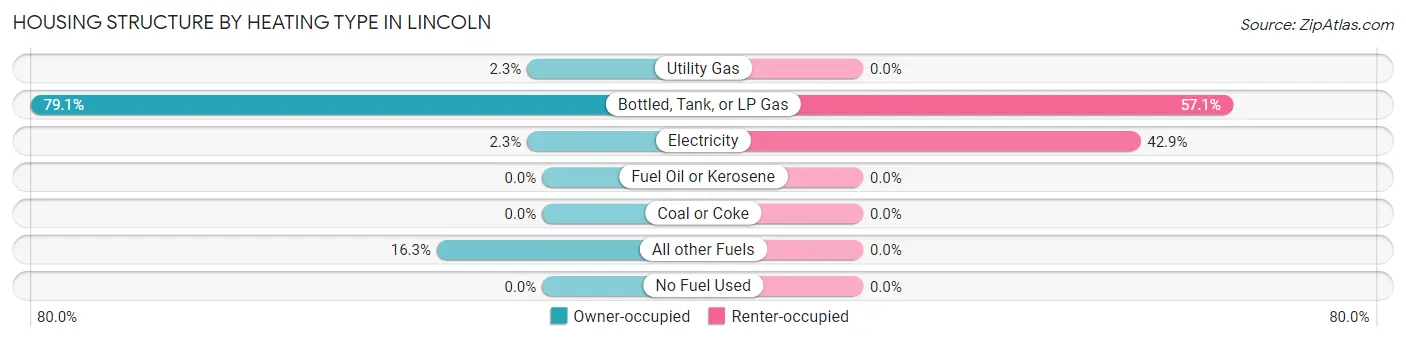
| Heating Type | Owner-occupied | Renter-occupied |
| Utility Gas | 1 (2.3%) | 0 (0.0%) |
| Bottled, Tank, or LP Gas | 34 (79.1%) | 4 (57.1%) |
| Electricity | 1 (2.3%) | 3 (42.9%) |
| Fuel Oil or Kerosene | 0 (0.0%) | 0 (0.0%) |
| Coal or Coke | 0 (0.0%) | 0 (0.0%) |
| All other Fuels | 7 (16.3%) | 0 (0.0%) |
| No Fuel Used | 0 (0.0%) | 0 (0.0%) |
| Total | 43 (100.0%) | 7 (100.0%) |
Household Vehicle Usage in Lincoln
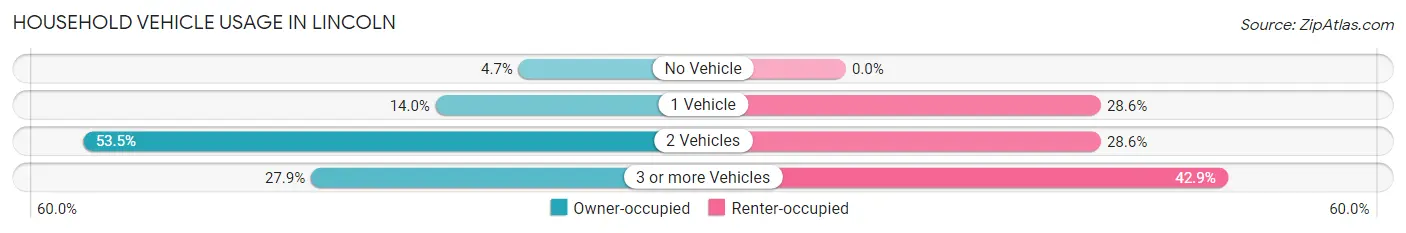
| Vehicles per Household | Owner-occupied | Renter-occupied |
| No Vehicle | 2 (4.6%) | 0 (0.0%) |
| 1 Vehicle | 6 (14.0%) | 2 (28.6%) |
| 2 Vehicles | 23 (53.5%) | 2 (28.6%) |
| 3 or more Vehicles | 12 (27.9%) | 3 (42.9%) |
| Total | 43 (100.0%) | 7 (100.0%) |
Real Estate & Mortgages in Lincoln
Real Estate and Mortgage Overview in Lincoln
| Characteristic | Without Mortgage | With Mortgage |
| Housing Units | 17 | 26 |
| Median Property Value | $101,600 | $104,500 |
| Median Household Income | - | - |
| Monthly Housing Costs | $442 | $0 |
| Real Estate Taxes | $1,083 | $0 |
Property Value by Mortgage Status in Lincoln
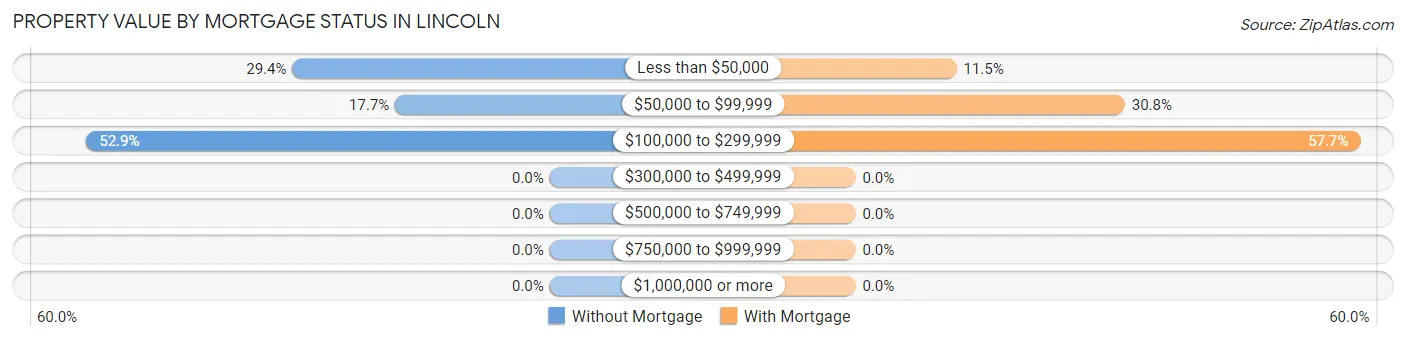
| Property Value | Without Mortgage | With Mortgage |
| Less than $50,000 | 5 (29.4%) | 3 (11.5%) |
| $50,000 to $99,999 | 3 (17.6%) | 8 (30.8%) |
| $100,000 to $299,999 | 9 (52.9%) | 15 (57.7%) |
| $300,000 to $499,999 | 0 (0.0%) | 0 (0.0%) |
| $500,000 to $749,999 | 0 (0.0%) | 0 (0.0%) |
| $750,000 to $999,999 | 0 (0.0%) | 0 (0.0%) |
| $1,000,000 or more | 0 (0.0%) | 0 (0.0%) |
| Total | 17 (100.0%) | 26 (100.0%) |
Household Income by Mortgage Status in Lincoln
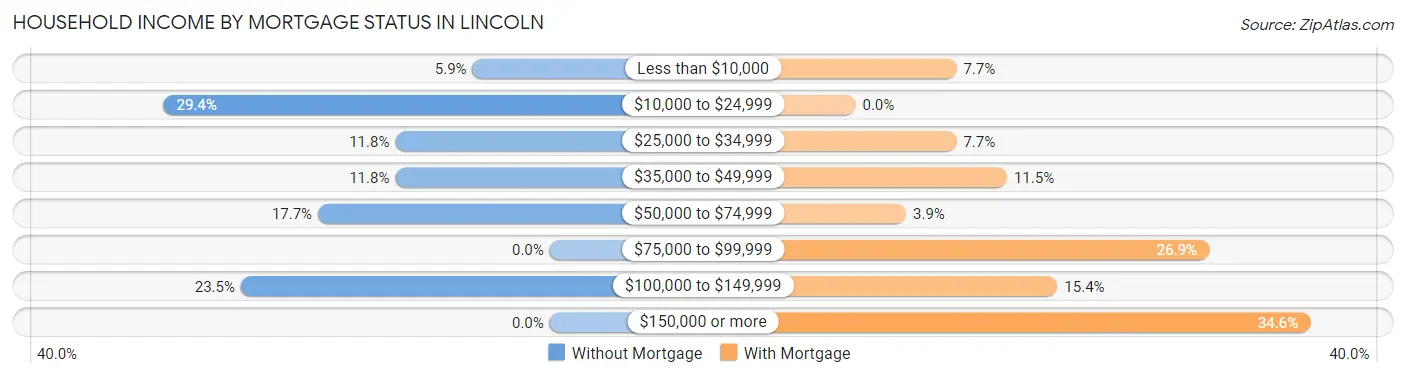
| Household Income | Without Mortgage | With Mortgage |
| Less than $10,000 | 1 (5.9%) | 2 (7.7%) |
| $10,000 to $24,999 | 5 (29.4%) | 0 (0.0%) |
| $25,000 to $34,999 | 2 (11.8%) | 2 (7.7%) |
| $35,000 to $49,999 | 2 (11.8%) | 3 (11.5%) |
| $50,000 to $74,999 | 3 (17.6%) | 1 (3.8%) |
| $75,000 to $99,999 | 0 (0.0%) | 7 (26.9%) |
| $100,000 to $149,999 | 4 (23.5%) | 4 (15.4%) |
| $150,000 or more | 0 (0.0%) | 9 (34.6%) |
| Total | 17 (100.0%) | 26 (100.0%) |
Property Value to Household Income Ratio in Lincoln
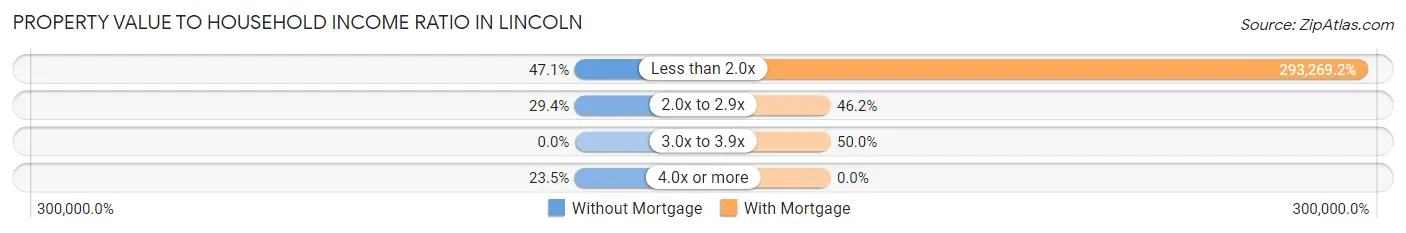
| Value-to-Income Ratio | Without Mortgage | With Mortgage |
| Less than 2.0x | 8 (47.1%) | 76,250 (293,269.2%) |
| 2.0x to 2.9x | 5 (29.4%) | 12 (46.2%) |
| 3.0x to 3.9x | 0 (0.0%) | 13 (50.0%) |
| 4.0x or more | 4 (23.5%) | 0 (0.0%) |
| Total | 17 (100.0%) | 26 (100.0%) |
Real Estate Taxes by Mortgage Status in Lincoln
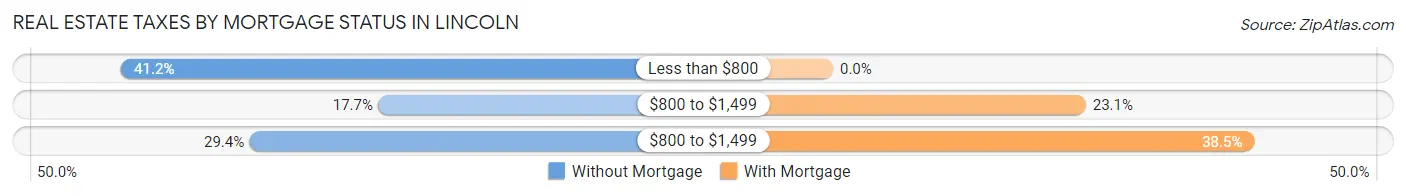
| Property Taxes | Without Mortgage | With Mortgage |
| Less than $800 | 7 (41.2%) | 0 (0.0%) |
| $800 to $1,499 | 3 (17.6%) | 6 (23.1%) |
| $800 to $1,499 | 5 (29.4%) | 10 (38.5%) |
| Total | 17 (100.0%) | 26 (100.0%) |
Health & Disability in Lincoln
Health Insurance Coverage by Age in Lincoln
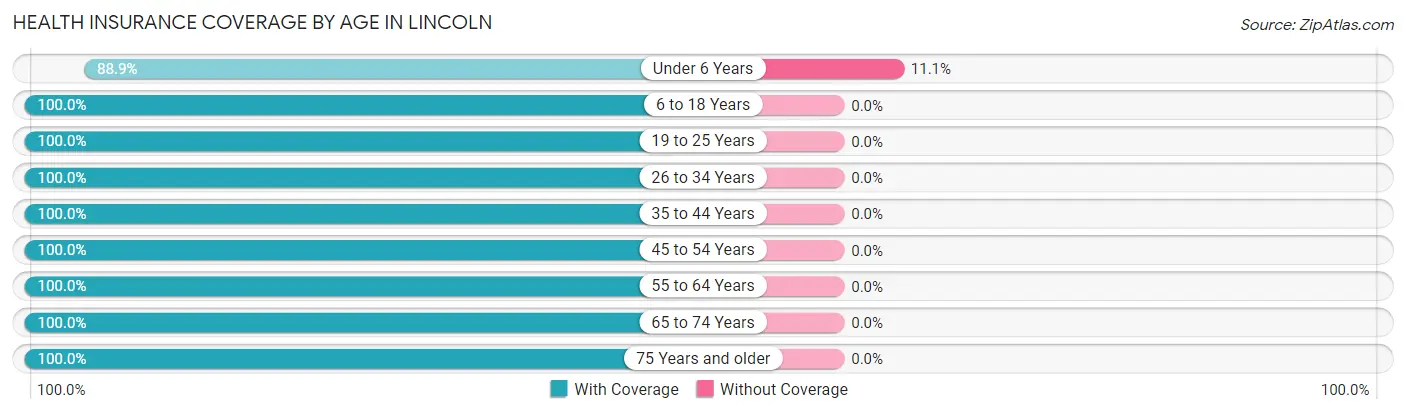
| Age Bracket | With Coverage | Without Coverage |
| Under 6 Years | 8 (88.9%) | 1 (11.1%) |
| 6 to 18 Years | 18 (100.0%) | 0 (0.0%) |
| 19 to 25 Years | 2 (100.0%) | 0 (0.0%) |
| 26 to 34 Years | 15 (100.0%) | 0 (0.0%) |
| 35 to 44 Years | 7 (100.0%) | 0 (0.0%) |
| 45 to 54 Years | 10 (100.0%) | 0 (0.0%) |
| 55 to 64 Years | 33 (100.0%) | 0 (0.0%) |
| 65 to 74 Years | 15 (100.0%) | 0 (0.0%) |
| 75 Years and older | 9 (100.0%) | 0 (0.0%) |
| Total | 117 (99.2%) | 1 (0.9%) |
Health Insurance Coverage by Citizenship Status in Lincoln
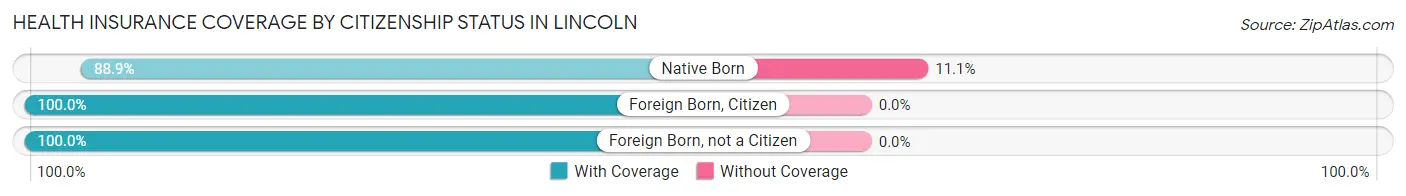
| Citizenship Status | With Coverage | Without Coverage |
| Native Born | 8 (88.9%) | 1 (11.1%) |
| Foreign Born, Citizen | 18 (100.0%) | 0 (0.0%) |
| Foreign Born, not a Citizen | 2 (100.0%) | 0 (0.0%) |
Health Insurance Coverage by Household Income in Lincoln
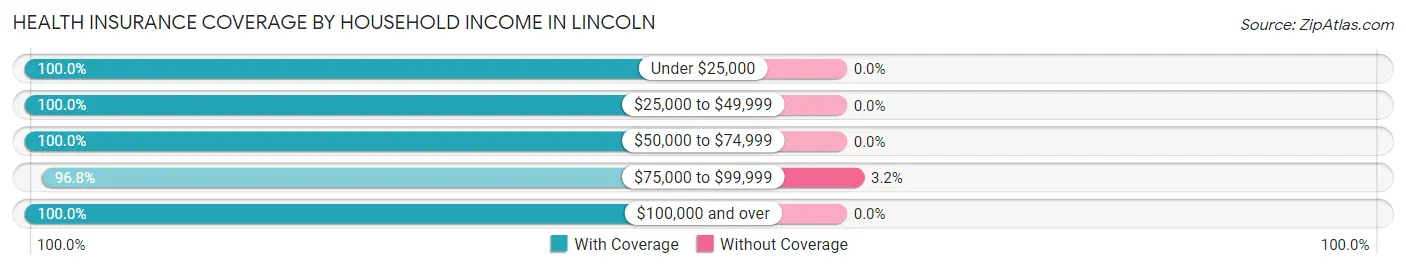
| Household Income | With Coverage | Without Coverage |
| Under $25,000 | 17 (100.0%) | 0 (0.0%) |
| $25,000 to $49,999 | 14 (100.0%) | 0 (0.0%) |
| $50,000 to $74,999 | 22 (100.0%) | 0 (0.0%) |
| $75,000 to $99,999 | 30 (96.8%) | 1 (3.2%) |
| $100,000 and over | 34 (100.0%) | 0 (0.0%) |
Public vs Private Health Insurance Coverage by Age in Lincoln
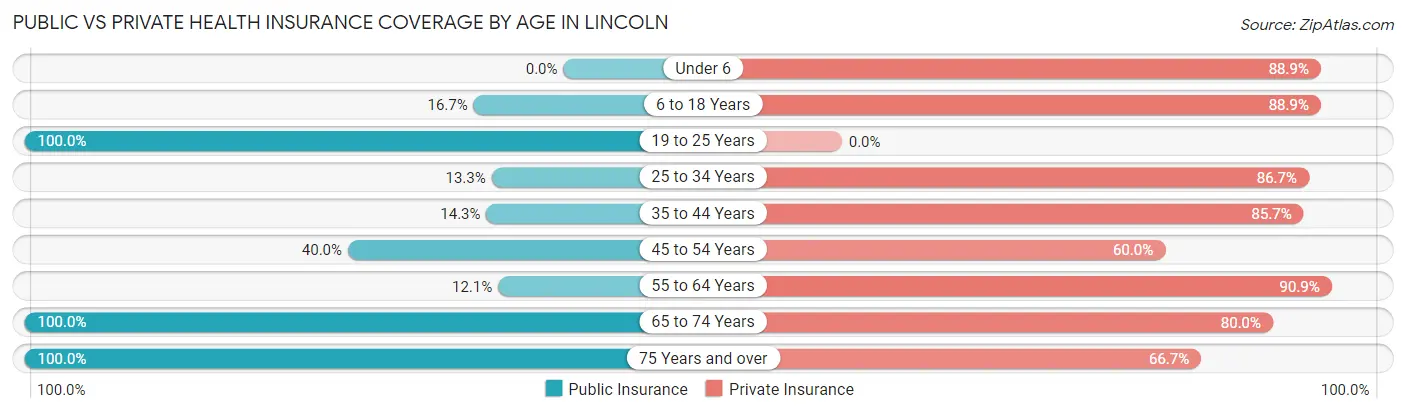
| Age Bracket | Public Insurance | Private Insurance |
| Under 6 | 0 (0.0%) | 8 (88.9%) |
| 6 to 18 Years | 3 (16.7%) | 16 (88.9%) |
| 19 to 25 Years | 2 (100.0%) | 0 (0.0%) |
| 25 to 34 Years | 2 (13.3%) | 13 (86.7%) |
| 35 to 44 Years | 1 (14.3%) | 6 (85.7%) |
| 45 to 54 Years | 4 (40.0%) | 6 (60.0%) |
| 55 to 64 Years | 4 (12.1%) | 30 (90.9%) |
| 65 to 74 Years | 15 (100.0%) | 12 (80.0%) |
| 75 Years and over | 9 (100.0%) | 6 (66.7%) |
| Total | 40 (33.9%) | 97 (82.2%) |
Disability Status by Sex by Age in Lincoln
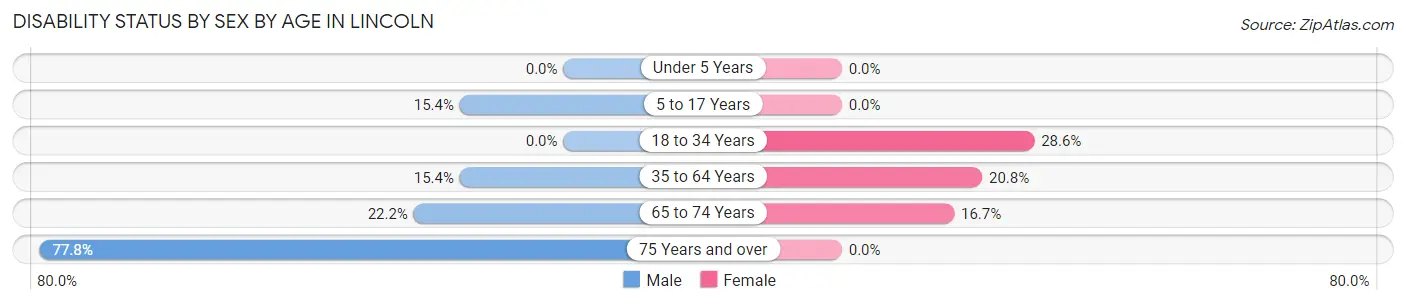
| Age Bracket | Male | Female |
| Under 5 Years | 0 (0.0%) | 0 (0.0%) |
| 5 to 17 Years | 2 (15.4%) | 0 (0.0%) |
| 18 to 34 Years | 0 (0.0%) | 2 (28.6%) |
| 35 to 64 Years | 4 (15.4%) | 5 (20.8%) |
| 65 to 74 Years | 2 (22.2%) | 1 (16.7%) |
| 75 Years and over | 7 (77.8%) | 0 (0.0%) |
Disability Class by Sex by Age in Lincoln
Disability Class: Hearing Difficulty
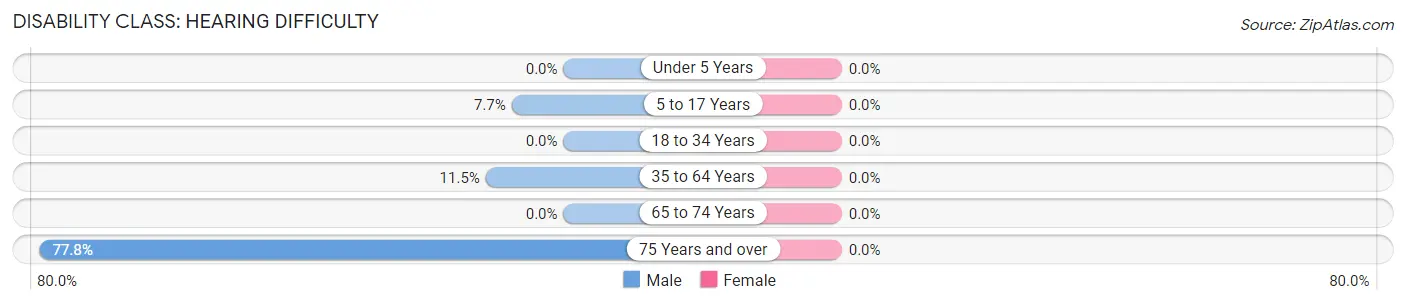
| Age Bracket | Male | Female |
| Under 5 Years | 0 (0.0%) | 0 (0.0%) |
| 5 to 17 Years | 1 (7.7%) | 0 (0.0%) |
| 18 to 34 Years | 0 (0.0%) | 0 (0.0%) |
| 35 to 64 Years | 3 (11.5%) | 0 (0.0%) |
| 65 to 74 Years | 0 (0.0%) | 0 (0.0%) |
| 75 Years and over | 7 (77.8%) | 0 (0.0%) |
Disability Class: Vision Difficulty
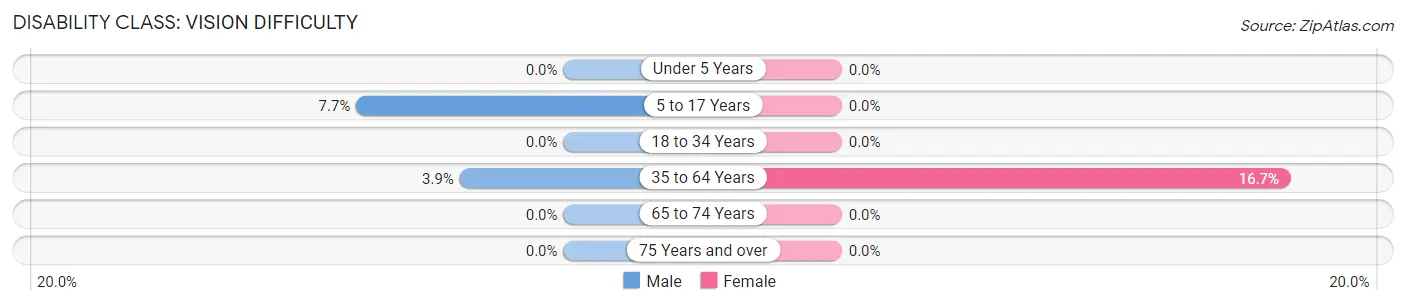
| Age Bracket | Male | Female |
| Under 5 Years | 0 (0.0%) | 0 (0.0%) |
| 5 to 17 Years | 1 (7.7%) | 0 (0.0%) |
| 18 to 34 Years | 0 (0.0%) | 0 (0.0%) |
| 35 to 64 Years | 1 (3.8%) | 4 (16.7%) |
| 65 to 74 Years | 0 (0.0%) | 0 (0.0%) |
| 75 Years and over | 0 (0.0%) | 0 (0.0%) |
Disability Class: Cognitive Difficulty
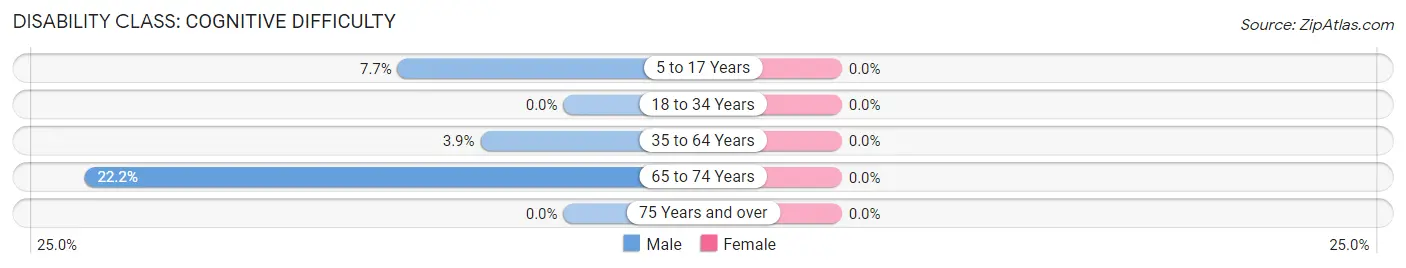
| Age Bracket | Male | Female |
| 5 to 17 Years | 1 (7.7%) | 0 (0.0%) |
| 18 to 34 Years | 0 (0.0%) | 0 (0.0%) |
| 35 to 64 Years | 1 (3.8%) | 0 (0.0%) |
| 65 to 74 Years | 2 (22.2%) | 0 (0.0%) |
| 75 Years and over | 0 (0.0%) | 0 (0.0%) |
Disability Class: Ambulatory Difficulty
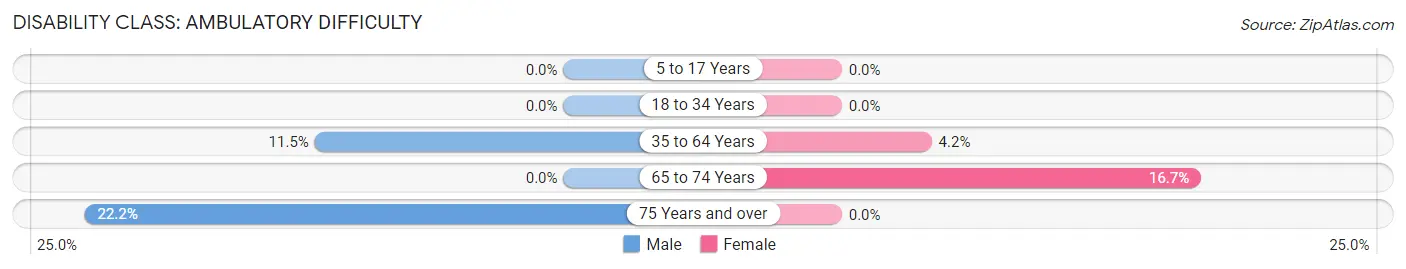
| Age Bracket | Male | Female |
| 5 to 17 Years | 0 (0.0%) | 0 (0.0%) |
| 18 to 34 Years | 0 (0.0%) | 0 (0.0%) |
| 35 to 64 Years | 3 (11.5%) | 1 (4.2%) |
| 65 to 74 Years | 0 (0.0%) | 1 (16.7%) |
| 75 Years and over | 2 (22.2%) | 0 (0.0%) |
Disability Class: Self-Care Difficulty
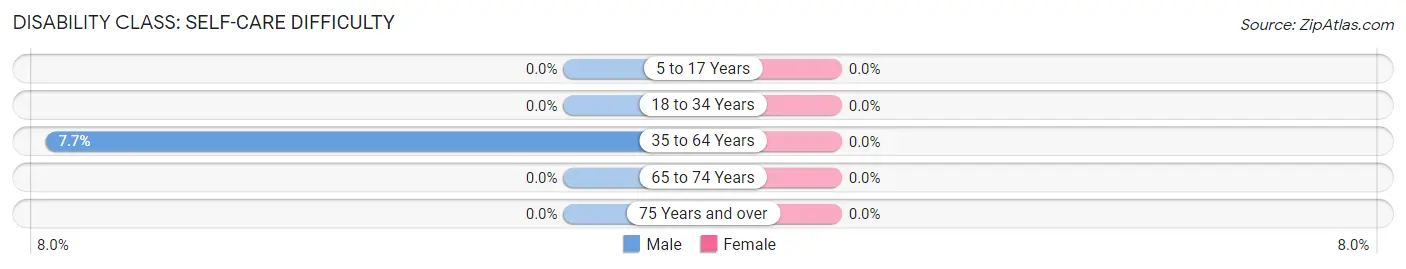
| Age Bracket | Male | Female |
| 5 to 17 Years | 0 (0.0%) | 0 (0.0%) |
| 18 to 34 Years | 0 (0.0%) | 0 (0.0%) |
| 35 to 64 Years | 2 (7.7%) | 0 (0.0%) |
| 65 to 74 Years | 0 (0.0%) | 0 (0.0%) |
| 75 Years and over | 0 (0.0%) | 0 (0.0%) |
Technology Access in Lincoln
Computing Device Access in Lincoln
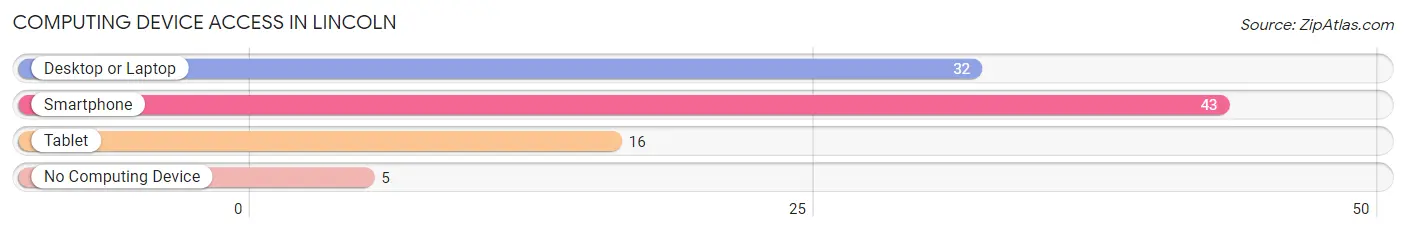
| Device Type | # Households | % Households |
| Desktop or Laptop | 32 | 64.0% |
| Smartphone | 43 | 86.0% |
| Tablet | 16 | 32.0% |
| No Computing Device | 5 | 10.0% |
| Total | 50 | 100.0% |
Internet Access in Lincoln
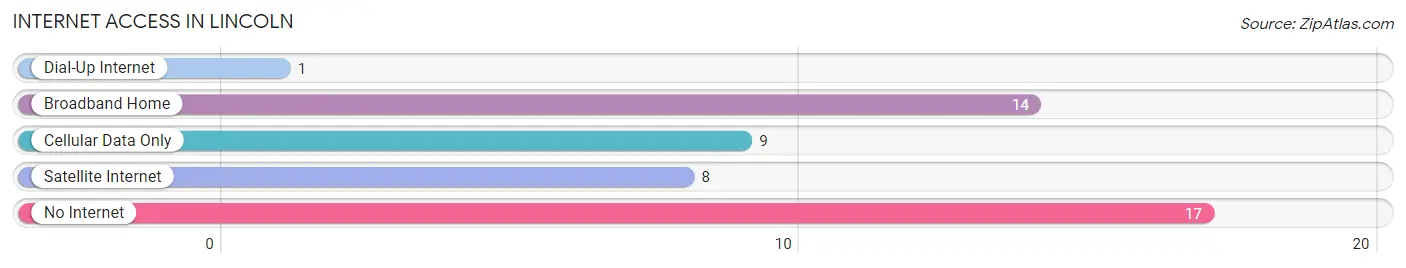
| Internet Type | # Households | % Households |
| Dial-Up Internet | 1 | 2.0% |
| Broadband Home | 14 | 28.0% |
| Cellular Data Only | 9 | 18.0% |
| Satellite Internet | 8 | 16.0% |
| No Internet | 17 | 34.0% |
| Total | 50 | 100.0% |
Lincoln Summary
Lincoln, Iowa is a small city located in the southeastern corner of the state, in the heart of the Midwest. It is the county seat of Tama County and is part of the Cedar Rapids Metropolitan Statistical Area. The city has a population of just over 1,000 people, making it one of the smallest cities in the state.
Geography
Lincoln is located in the southeastern corner of Iowa, in the heart of the Midwest. It is situated in the rolling hills of the Iowa River Valley, and is surrounded by farmland. The city is located at the intersection of U.S. Route 30 and Iowa Highway 21. The nearest major cities are Cedar Rapids, Iowa City, and Des Moines, all of which are about an hour away.
The climate in Lincoln is typical of the Midwest, with hot summers and cold winters. The average temperature in the summer is around 75 degrees Fahrenheit, and the average temperature in the winter is around 25 degrees Fahrenheit. The city receives an average of 36 inches of precipitation per year, with most of it falling in the spring and summer months.
Economy
Lincoln’s economy is largely based on agriculture and manufacturing. The city is home to several large agricultural companies, including Pioneer Hi-Bred International, Inc., and the Iowa Soybean Association. The city also has several manufacturing companies, including the Lincoln Manufacturing Company, which produces a variety of products, including furniture, tools, and automotive parts.
The city also has a thriving tourism industry, with several attractions, including the Tama County Historical Museum, the Lincoln County Fairgrounds, and the Lincoln County Speedway. The city also hosts several annual events, including the Lincoln County Fair, the Lincoln County Music Festival, and the Lincoln County Arts Festival.
Demographics
As of the 2010 census, the population of Lincoln was 1,037, with a population density of 1,092 people per square mile. The median age of the population was 38.7 years, and the median household income was $41,944. The racial makeup of the city was 97.2% White, 0.7% African American, 0.3% Native American, 0.2% Asian, 0.1% Pacific Islander, 0.7% from other races, and 0.9% from two or more races.
The city is served by the Tama County School District, which includes two elementary schools, one middle school, and one high school. The city also has several private schools, including the Lincoln Christian Academy and the Lincoln Lutheran School.
Conclusion
Lincoln, Iowa is a small city located in the southeastern corner of the state, in the heart of the Midwest. It is the county seat of Tama County and is part of the Cedar Rapids Metropolitan Statistical Area. The city has a population of just over 1,000 people, making it one of the smallest cities in the state. The economy of Lincoln is largely based on agriculture and manufacturing, and the city also has a thriving tourism industry. The population of the city is mostly white, with a median age of 38.7 years and a median household income of $41,944. The city is served by the Tama County School District, and also has several private schools.
Common Questions
What is Per Capita Income in Lincoln?
Per Capita income in Lincoln is $28,299.
What is the Median Family Income in Lincoln?
Median Family Income in Lincoln is $76,667.
What is the Median Household income in Lincoln?
Median Household Income in Lincoln is $57,500.
What is Income or Wage Gap in Lincoln?
Income or Wage Gap in Lincoln is 8.2%.
Women in Lincoln earn 91.8 cents for every dollar earned by a man.
What is Inequality or Gini Index in Lincoln?
Inequality or Gini Index in Lincoln is 0.34.
What is the Total Population of Lincoln?
Total Population of Lincoln is 118.
What is the Total Male Population of Lincoln?
Total Male Population of Lincoln is 73.
What is the Total Female Population of Lincoln?
Total Female Population of Lincoln is 45.
What is the Ratio of Males per 100 Females in Lincoln?
There are 162.22 Males per 100 Females in Lincoln.
What is the Ratio of Females per 100 Males in Lincoln?
There are 61.64 Females per 100 Males in Lincoln.
What is the Median Population Age in Lincoln?
Median Population Age in Lincoln is 54.0 Years.
What is the Average Family Size in Lincoln
Average Family Size in Lincoln is 2.8 People.
What is the Average Household Size in Lincoln
Average Household Size in Lincoln is 2.4 People.
How Large is the Labor Force in Lincoln?
There are 55 People in the Labor Forcein in Lincoln.
What is the Percentage of People in the Labor Force in Lincoln?
56.7% of People are in the Labor Force in Lincoln.