Olds, IA Map & Demographics
Olds Map
Olds Overview
$30,274
PER CAPITA INCOME
$87,500
AVG FAMILY INCOME
$64,583
AVG HOUSEHOLD INCOME
38.4%
WAGE / INCOME GAP [ % ]
61.6¢/ $1
WAGE / INCOME GAP [ $ ]
0.33
INEQUALITY / GINI INDEX
150
TOTAL POPULATION
84
MALE POPULATION
66
FEMALE POPULATION
127.27
MALES / 100 FEMALES
78.57
FEMALES / 100 MALES
33.4
MEDIAN AGE
2.9
AVG FAMILY SIZE
2.3
AVG HOUSEHOLD SIZE
91
LABOR FORCE [ PEOPLE ]
80.5%
PERCENT IN LABOR FORCE
Olds Zip Codes
Olds Area Codes
Income in Olds
Income Overview in Olds
Per Capita Income in Olds is $30,274, while median incomes of families and households are $87,500 and $64,583 respectively.
| Characteristic | Number | Measure |
| Per Capita Income | 150 | $30,274 |
| Median Family Income | 38 | $87,500 |
| Mean Family Income | 38 | $93,463 |
| Median Household Income | 65 | $64,583 |
| Mean Household Income | 65 | $73,328 |
| Income Deficit | 38 | $0 |
| Wage / Income Gap (%) | 150 | 38.39% |
| Wage / Income Gap ($) | 150 | 61.61¢ per $1 |
| Gini / Inequality Index | 150 | 0.33 |
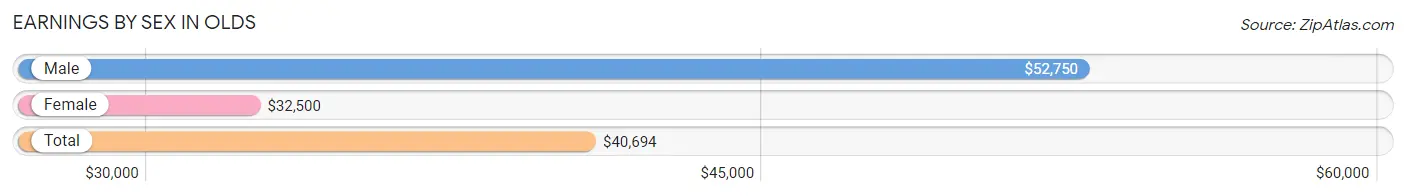
Earnings by Sex in Olds
Average Earnings in Olds are $40,694, $52,750 for men and $32,500 for women, a difference of 38.4%.
| Sex | Number | Average Earnings |
| Male | 51 (56.0%) | $52,750 |
| Female | 40 (44.0%) | $32,500 |
| Total | 91 (100.0%) | $40,694 |
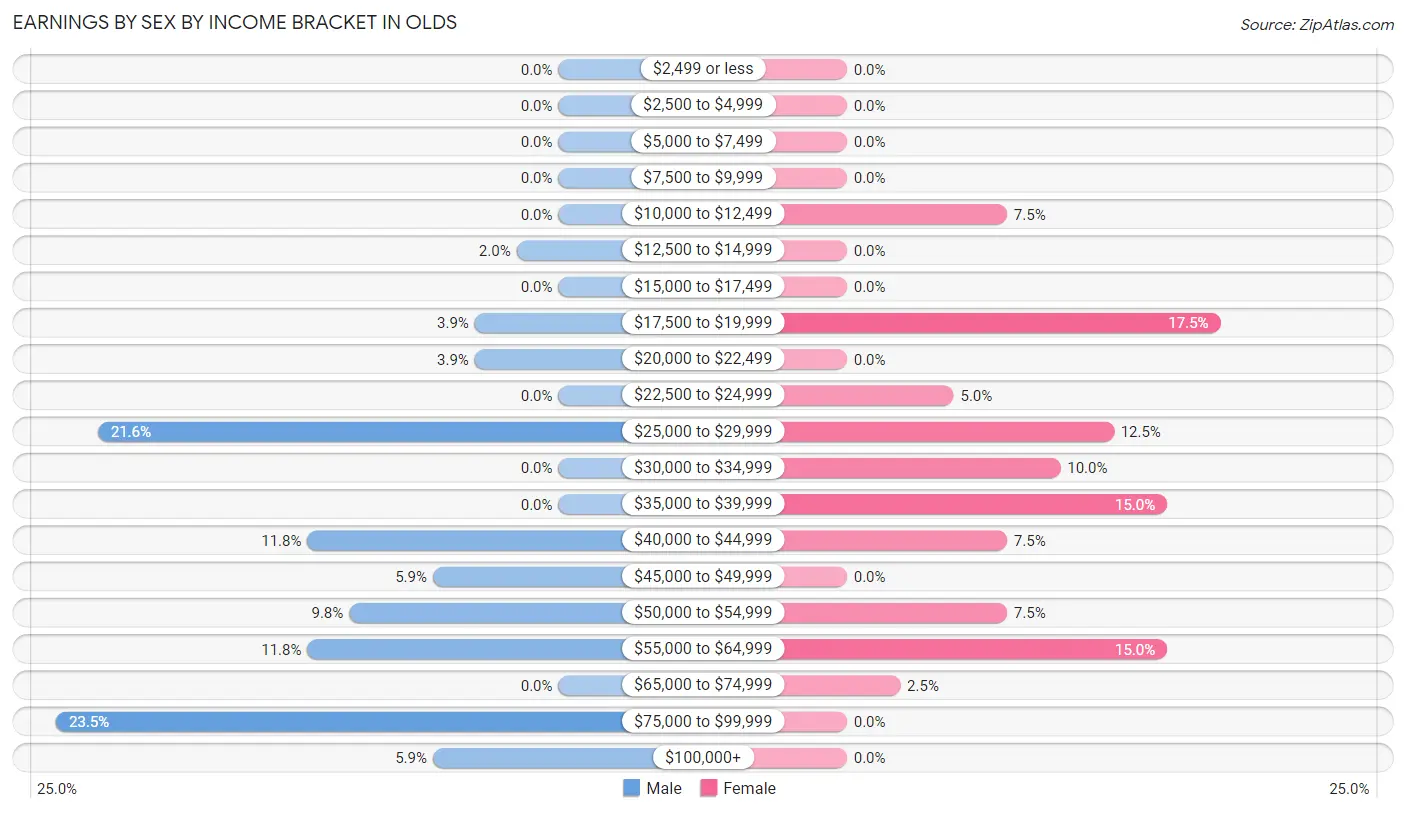
Earnings by Sex by Income Bracket in Olds
The most common earnings brackets in Olds are $75,000 to $99,999 for men (12 | 23.5%) and $17,500 to $19,999 for women (7 | 17.5%).
| Income | Male | Female |
| $2,499 or less | 0 (0.0%) | 0 (0.0%) |
| $2,500 to $4,999 | 0 (0.0%) | 0 (0.0%) |
| $5,000 to $7,499 | 0 (0.0%) | 0 (0.0%) |
| $7,500 to $9,999 | 0 (0.0%) | 0 (0.0%) |
| $10,000 to $12,499 | 0 (0.0%) | 3 (7.5%) |
| $12,500 to $14,999 | 1 (2.0%) | 0 (0.0%) |
| $15,000 to $17,499 | 0 (0.0%) | 0 (0.0%) |
| $17,500 to $19,999 | 2 (3.9%) | 7 (17.5%) |
| $20,000 to $22,499 | 2 (3.9%) | 0 (0.0%) |
| $22,500 to $24,999 | 0 (0.0%) | 2 (5.0%) |
| $25,000 to $29,999 | 11 (21.6%) | 5 (12.5%) |
| $30,000 to $34,999 | 0 (0.0%) | 4 (10.0%) |
| $35,000 to $39,999 | 0 (0.0%) | 6 (15.0%) |
| $40,000 to $44,999 | 6 (11.8%) | 3 (7.5%) |
| $45,000 to $49,999 | 3 (5.9%) | 0 (0.0%) |
| $50,000 to $54,999 | 5 (9.8%) | 3 (7.5%) |
| $55,000 to $64,999 | 6 (11.8%) | 6 (15.0%) |
| $65,000 to $74,999 | 0 (0.0%) | 1 (2.5%) |
| $75,000 to $99,999 | 12 (23.5%) | 0 (0.0%) |
| $100,000+ | 3 (5.9%) | 0 (0.0%) |
| Total | 51 (100.0%) | 40 (100.0%) |
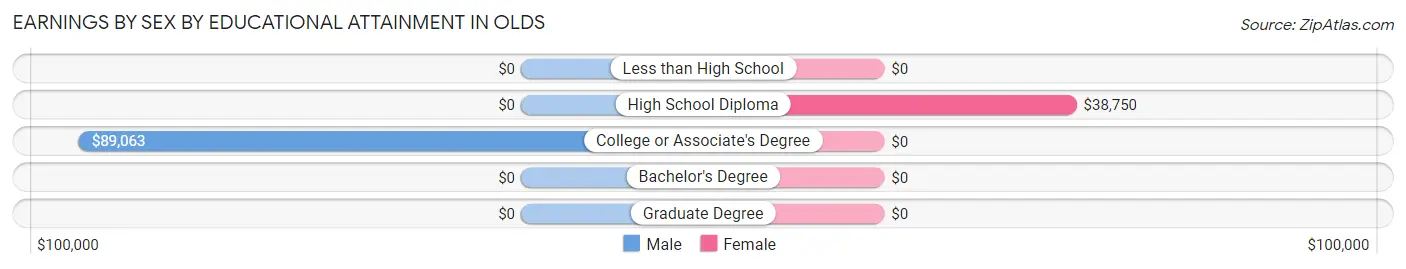
Earnings by Sex by Educational Attainment in Olds
Average earnings in Olds are $58,125 for men and $38,542 for women, a difference of 33.7%. Men with an educational attainment of college or associate's degree enjoy the highest average annual earnings of $89,063, while those with college or associate's degree education earn the least with $89,063. Women with an educational attainment of high school diploma earn the most with the average annual earnings of $38,750, while those with high school diploma education have the smallest earnings of $38,750.
| Educational Attainment | Male Income | Female Income |
| Less than High School | - | - |
| High School Diploma | - | - |
| College or Associate's Degree | $89,063 | $0 |
| Bachelor's Degree | - | - |
| Graduate Degree | - | - |
| Total | $58,125 | $38,542 |
Family Income in Olds
Family Income Brackets in Olds
According to the Olds family income data, there are 14 families falling into the $100,000 to $149,999 income range, which is the most common income bracket and makes up 36.8% of all families.
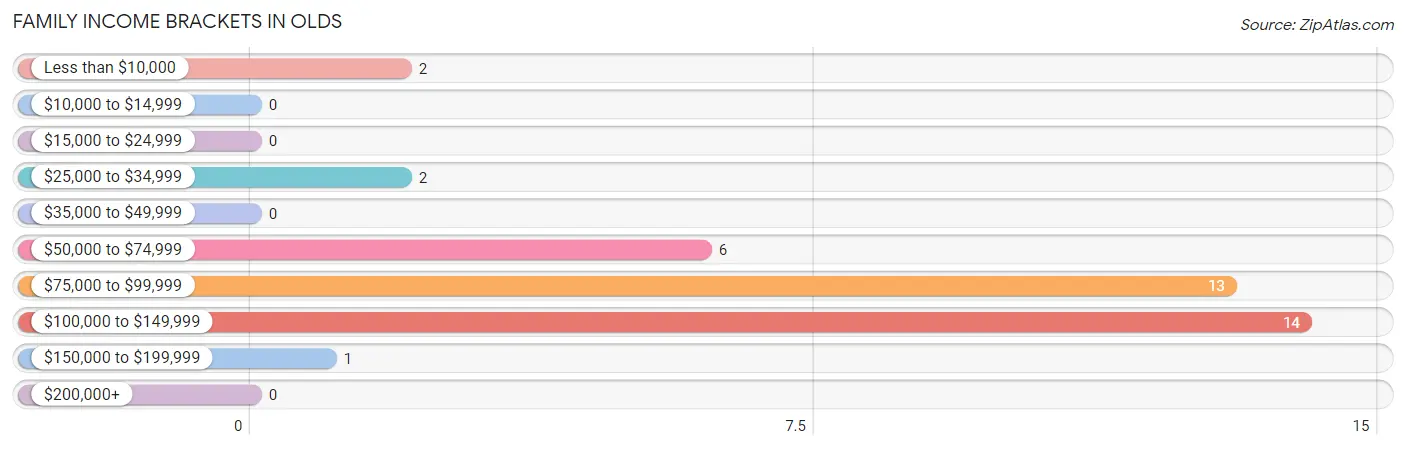
| Income Bracket | # Families | % Families |
| Less than $10,000 | 2 | 5.3% |
| $10,000 to $14,999 | 0 | 0.0% |
| $15,000 to $24,999 | 0 | 0.0% |
| $25,000 to $34,999 | 2 | 5.3% |
| $35,000 to $49,999 | 0 | 0.0% |
| $50,000 to $74,999 | 6 | 15.8% |
| $75,000 to $99,999 | 13 | 34.2% |
| $100,000 to $149,999 | 14 | 36.8% |
| $150,000 to $199,999 | 1 | 2.6% |
| $200,000+ | 0 | 0.0% |
Family Income by Famaliy Size in Olds
2-person families (22 | 57.9%) account for the highest median family income in Olds with $132,813 per family, while 2-person families (22 | 57.9%) have the highest median income of $66,406 per family member.
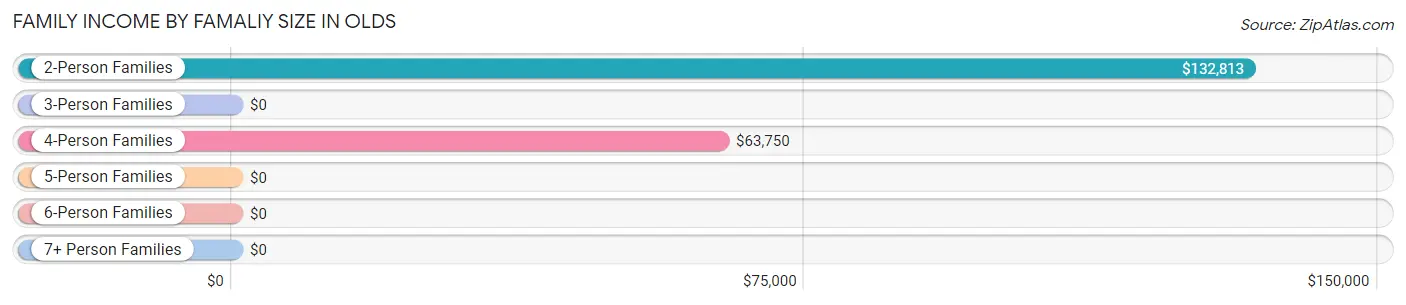
| Income Bracket | # Families | Median Income |
| 2-Person Families | 22 (57.9%) | $132,813 |
| 3-Person Families | 2 (5.3%) | $0 |
| 4-Person Families | 7 (18.4%) | $63,750 |
| 5-Person Families | 7 (18.4%) | $0 |
| 6-Person Families | 0 (0.0%) | $0 |
| 7+ Person Families | 0 (0.0%) | $0 |
| Total | 38 (100.0%) | $87,500 |
Family Income by Number of Earners in Olds
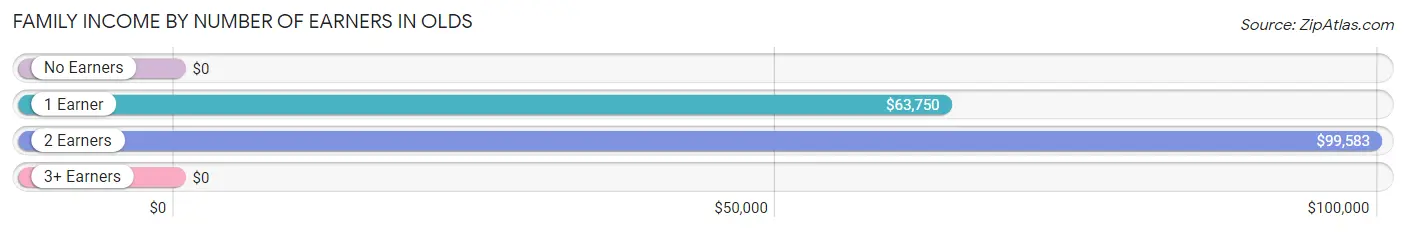
| Number of Earners | # Families | Median Income |
| No Earners | 4 (10.5%) | $0 |
| 1 Earner | 7 (18.4%) | $63,750 |
| 2 Earners | 27 (71.1%) | $99,583 |
| 3+ Earners | 0 (0.0%) | $0 |
| Total | 38 (100.0%) | $87,500 |
Household Income in Olds
Household Income Brackets in Olds
With 16 households falling in the category, the $100,000 to $149,999 income range is the most frequent in Olds, accounting for 24.6% of all households.
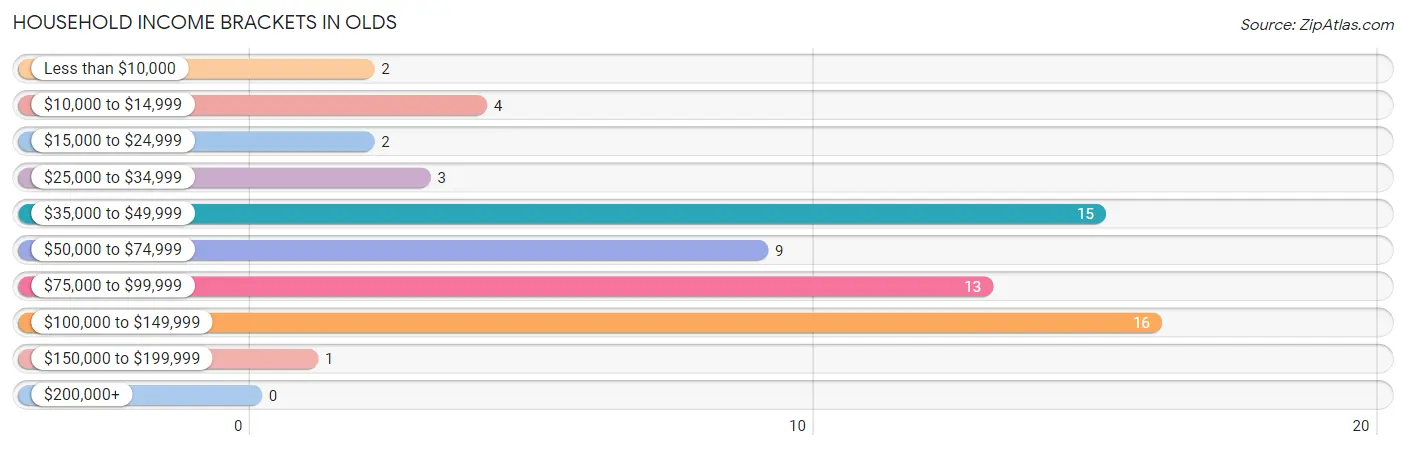
| Income Bracket | # Households | % Households |
| Less than $10,000 | 2 | 3.1% |
| $10,000 to $14,999 | 4 | 6.2% |
| $15,000 to $24,999 | 2 | 3.1% |
| $25,000 to $34,999 | 3 | 4.6% |
| $35,000 to $49,999 | 15 | 23.1% |
| $50,000 to $74,999 | 9 | 13.8% |
| $75,000 to $99,999 | 13 | 20.0% |
| $100,000 to $149,999 | 16 | 24.6% |
| $150,000 to $199,999 | 1 | 1.5% |
| $200,000+ | 0 | 0.0% |
Household Income by Householder Age in Olds
The median household income in Olds is $64,583, with the highest median household income of $78,500 found in the 25 to 44 years age bracket for the primary householder. A total of 26 households (40.0%) fall into this category. Meanwhile, the 15 to 24 years age bracket for the primary householder has the lowest median household income of $0, with 9 households (13.9%) in this group.
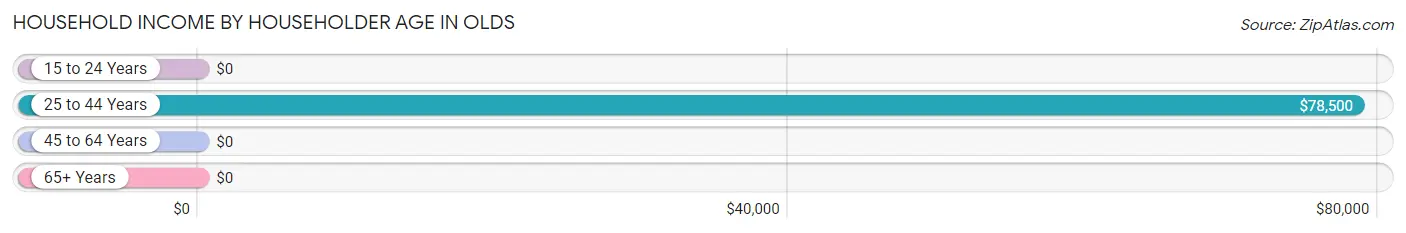
| Income Bracket | # Households | Median Income |
| 15 to 24 Years | 9 (13.9%) | $0 |
| 25 to 44 Years | 26 (40.0%) | $78,500 |
| 45 to 64 Years | 23 (35.4%) | $0 |
| 65+ Years | 7 (10.8%) | $0 |
| Total | 65 (100.0%) | $64,583 |
Poverty in Olds
Income Below Poverty by Sex and Age in Olds
With 10.7% poverty level for males and 15.1% for females among the residents of Olds, 6 to 11 year old males and 15 year old females are the most vulnerable to poverty, with 6 males (33.3%) and 3 females (100.0%) in their respective age groups living below the poverty level.
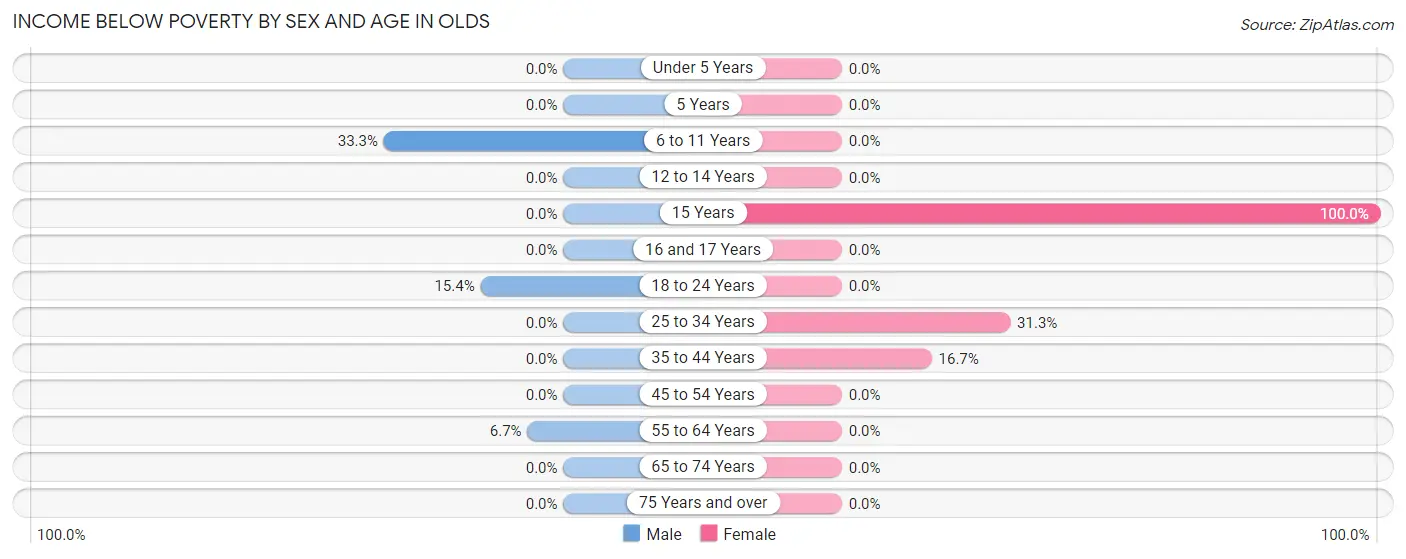
| Age Bracket | Male | Female |
| Under 5 Years | 0 (0.0%) | 0 (0.0%) |
| 5 Years | 0 (0.0%) | 0 (0.0%) |
| 6 to 11 Years | 6 (33.3%) | 0 (0.0%) |
| 12 to 14 Years | 0 (0.0%) | 0 (0.0%) |
| 15 Years | 0 (0.0%) | 3 (100.0%) |
| 16 and 17 Years | 0 (0.0%) | 0 (0.0%) |
| 18 to 24 Years | 2 (15.4%) | 0 (0.0%) |
| 25 to 34 Years | 0 (0.0%) | 5 (31.2%) |
| 35 to 44 Years | 0 (0.0%) | 2 (16.7%) |
| 45 to 54 Years | 0 (0.0%) | 0 (0.0%) |
| 55 to 64 Years | 1 (6.7%) | 0 (0.0%) |
| 65 to 74 Years | 0 (0.0%) | 0 (0.0%) |
| 75 Years and over | 0 (0.0%) | 0 (0.0%) |
| Total | 9 (10.7%) | 10 (15.1%) |
Income Above Poverty by Sex and Age in Olds
According to the poverty statistics in Olds, males aged under 5 years and females aged under 5 years are the age groups that are most secure financially, with 100.0% of males and 100.0% of females in these age groups living above the poverty line.
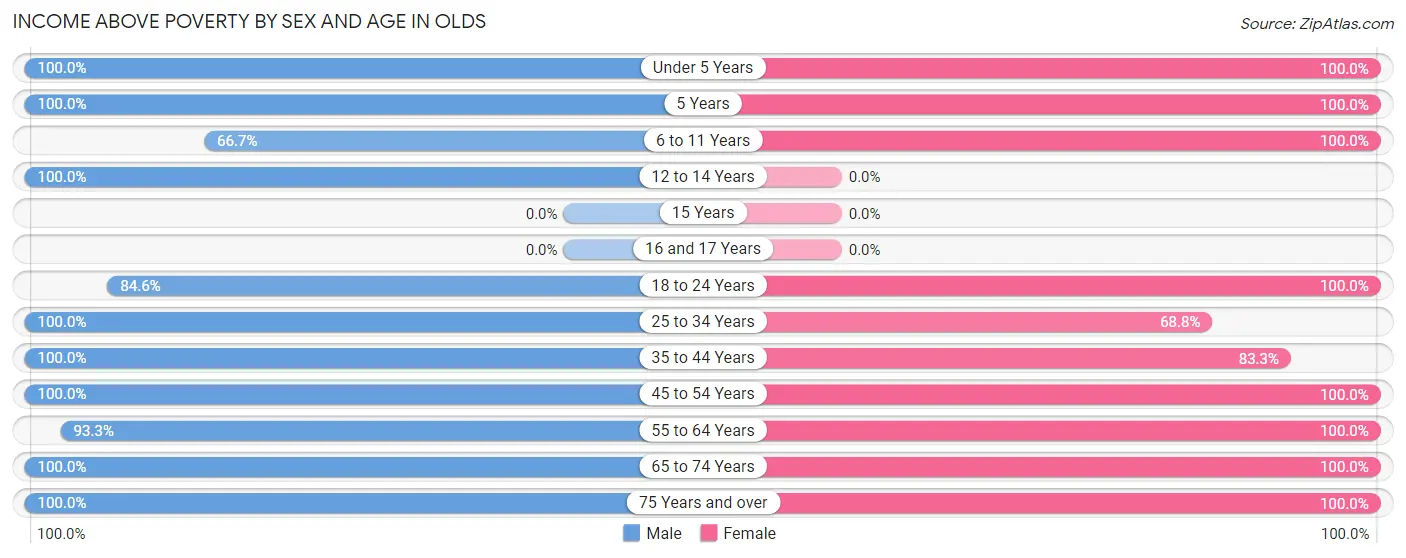
| Age Bracket | Male | Female |
| Under 5 Years | 2 (100.0%) | 2 (100.0%) |
| 5 Years | 2 (100.0%) | 1 (100.0%) |
| 6 to 11 Years | 12 (66.7%) | 2 (100.0%) |
| 12 to 14 Years | 7 (100.0%) | 0 (0.0%) |
| 15 Years | 0 (0.0%) | 0 (0.0%) |
| 16 and 17 Years | 0 (0.0%) | 0 (0.0%) |
| 18 to 24 Years | 11 (84.6%) | 7 (100.0%) |
| 25 to 34 Years | 5 (100.0%) | 11 (68.8%) |
| 35 to 44 Years | 12 (100.0%) | 10 (83.3%) |
| 45 to 54 Years | 7 (100.0%) | 2 (100.0%) |
| 55 to 64 Years | 14 (93.3%) | 12 (100.0%) |
| 65 to 74 Years | 1 (100.0%) | 5 (100.0%) |
| 75 Years and over | 2 (100.0%) | 4 (100.0%) |
| Total | 75 (89.3%) | 56 (84.9%) |
Income Below Poverty Among Married-Couple Families in Olds
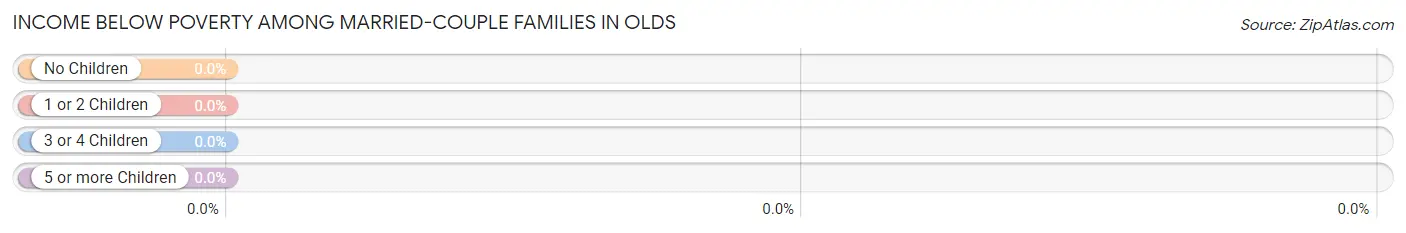
| Children | Above Poverty | Below Poverty |
| No Children | 24 (100.0%) | 0 (0.0%) |
| 1 or 2 Children | 2 (100.0%) | 0 (0.0%) |
| 3 or 4 Children | 5 (100.0%) | 0 (0.0%) |
| 5 or more Children | 0 (0.0%) | 0 (0.0%) |
| Total | 31 (100.0%) | 0 (0.0%) |
Income Below Poverty Among Single-Parent Households in Olds
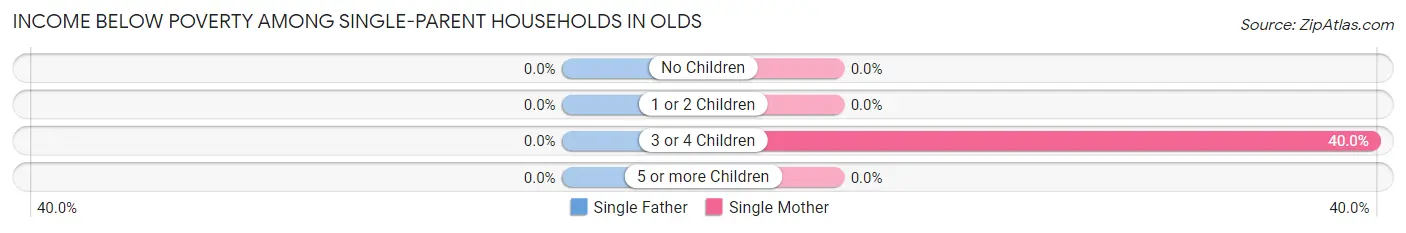
| Children | Single Father | Single Mother |
| No Children | 0 (0.0%) | 0 (0.0%) |
| 1 or 2 Children | 0 (0.0%) | 0 (0.0%) |
| 3 or 4 Children | 0 (0.0%) | 2 (40.0%) |
| 5 or more Children | 0 (0.0%) | 0 (0.0%) |
| Total | 0 (0.0%) | 2 (40.0%) |
Income Below Poverty Among Married-Couple vs Single-Parent Households in Olds
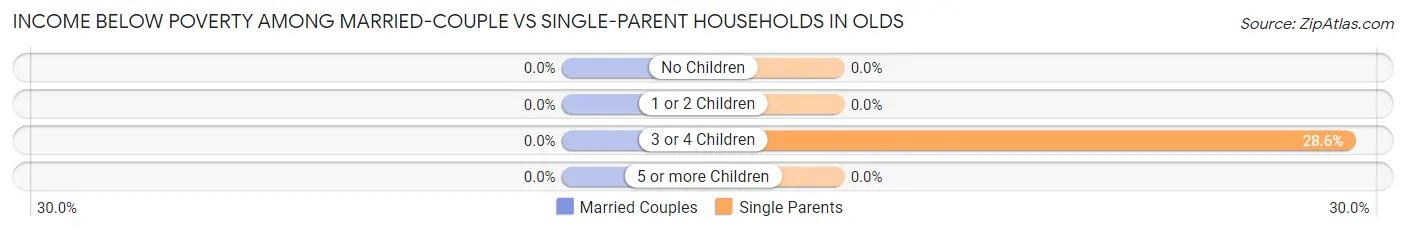
| Children | Married-Couple Families | Single-Parent Households |
| No Children | 0 (0.0%) | 0 (0.0%) |
| 1 or 2 Children | 0 (0.0%) | 0 (0.0%) |
| 3 or 4 Children | 0 (0.0%) | 2 (28.6%) |
| 5 or more Children | 0 (0.0%) | 0 (0.0%) |
| Total | 0 (0.0%) | 2 (28.6%) |
Race in Olds
The most populous races in Olds are White / Caucasian (137 | 91.3%), Black / African American (13 | 8.7%), and Hispanic or Latino (12 | 8.0%).
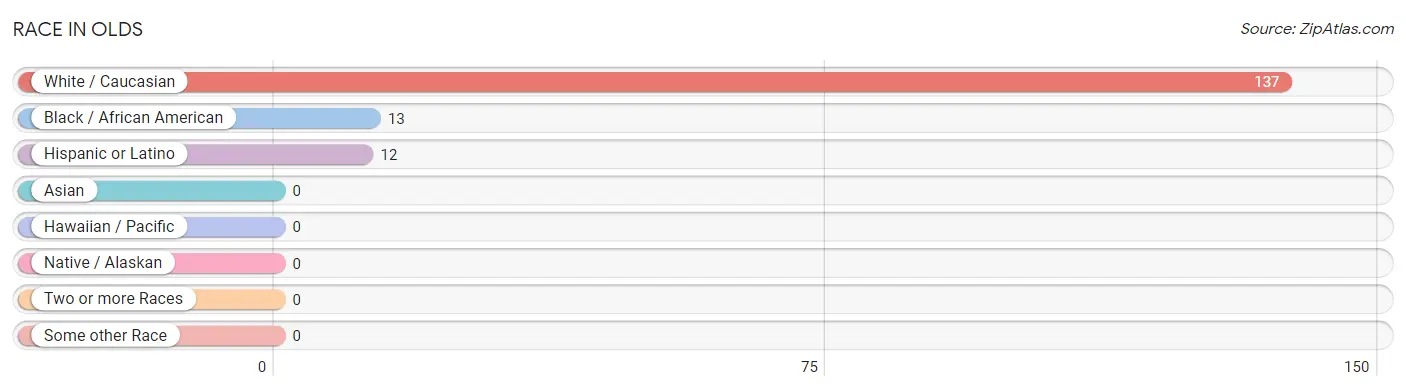
| Race | # Population | % Population |
| Asian | 0 | 0.0% |
| Black / African American | 13 | 8.7% |
| Hawaiian / Pacific | 0 | 0.0% |
| Hispanic or Latino | 12 | 8.0% |
| Native / Alaskan | 0 | 0.0% |
| White / Caucasian | 137 | 91.3% |
| Two or more Races | 0 | 0.0% |
| Some other Race | 0 | 0.0% |
| Total | 150 | 100.0% |
Ancestry in Olds
The most populous ancestries reported in Olds are German (30 | 20.0%), Dutch (28 | 18.7%), Russian (21 | 14.0%), English (19 | 12.7%), and Irish (17 | 11.3%), together accounting for 76.7% of all Olds residents.
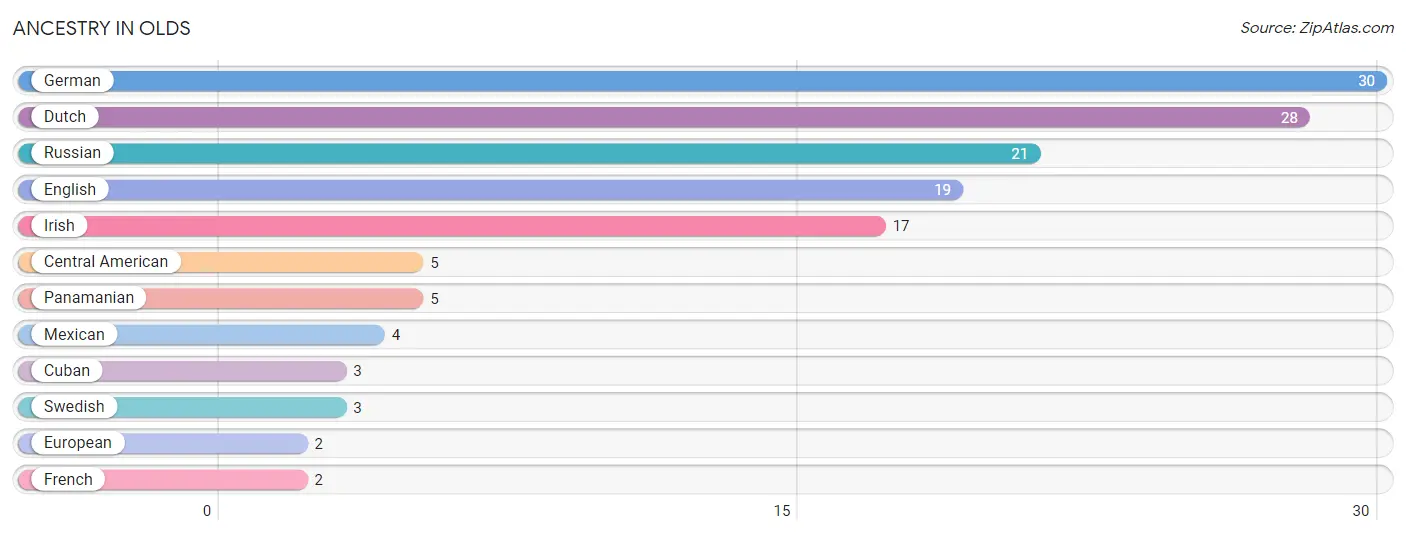
| Ancestry | # Population | % Population |
| Central American | 5 | 3.3% |
| Cuban | 3 | 2.0% |
| Dutch | 28 | 18.7% |
| English | 19 | 12.7% |
| European | 2 | 1.3% |
| French | 2 | 1.3% |
| German | 30 | 20.0% |
| Irish | 17 | 11.3% |
| Mexican | 4 | 2.7% |
| Panamanian | 5 | 3.3% |
| Russian | 21 | 14.0% |
| Swedish | 3 | 2.0% | View All 12 Rows |
Immigrants in Olds
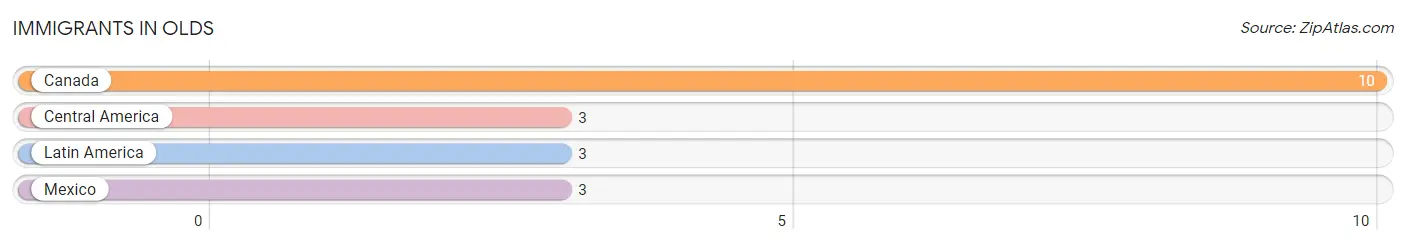
The most numerous immigrant groups reported in Olds came from Canada (10 | 6.7%), Central America (3 | 2.0%), Latin America (3 | 2.0%), and Mexico (3 | 2.0%), together accounting for 12.7% of all Olds residents.
| Immigration Origin | # Population | % Population |
| Canada | 10 | 6.7% |
| Central America | 3 | 2.0% |
| Latin America | 3 | 2.0% |
| Mexico | 3 | 2.0% | View All 4 Rows |
Sex and Age in Olds
Sex and Age in Olds
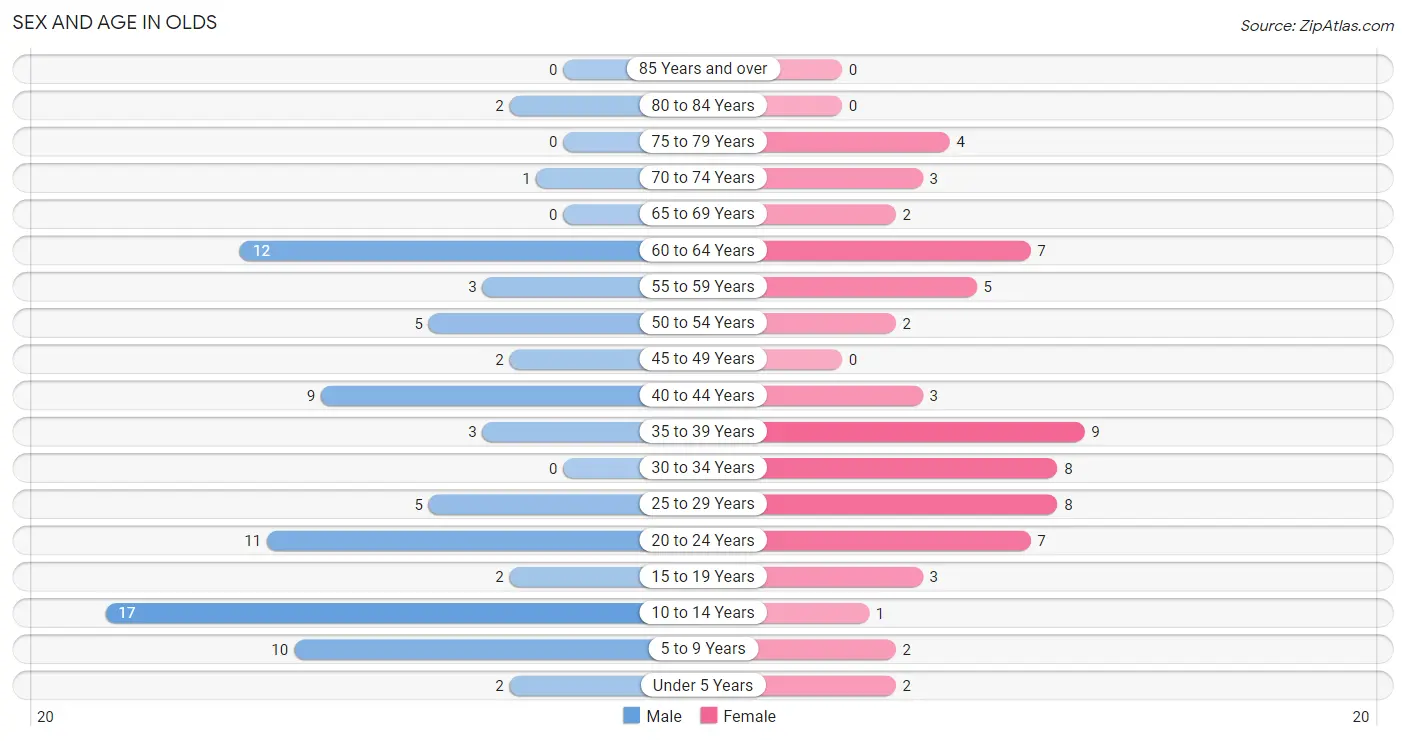
The most populous age groups in Olds are 10 to 14 Years (17 | 20.2%) for men and 35 to 39 Years (9 | 13.6%) for women.
| Age Bracket | Male | Female |
| Under 5 Years | 2 (2.4%) | 2 (3.0%) |
| 5 to 9 Years | 10 (11.9%) | 2 (3.0%) |
| 10 to 14 Years | 17 (20.2%) | 1 (1.5%) |
| 15 to 19 Years | 2 (2.4%) | 3 (4.5%) |
| 20 to 24 Years | 11 (13.1%) | 7 (10.6%) |
| 25 to 29 Years | 5 (5.9%) | 8 (12.1%) |
| 30 to 34 Years | 0 (0.0%) | 8 (12.1%) |
| 35 to 39 Years | 3 (3.6%) | 9 (13.6%) |
| 40 to 44 Years | 9 (10.7%) | 3 (4.5%) |
| 45 to 49 Years | 2 (2.4%) | 0 (0.0%) |
| 50 to 54 Years | 5 (5.9%) | 2 (3.0%) |
| 55 to 59 Years | 3 (3.6%) | 5 (7.6%) |
| 60 to 64 Years | 12 (14.3%) | 7 (10.6%) |
| 65 to 69 Years | 0 (0.0%) | 2 (3.0%) |
| 70 to 74 Years | 1 (1.2%) | 3 (4.5%) |
| 75 to 79 Years | 0 (0.0%) | 4 (6.1%) |
| 80 to 84 Years | 2 (2.4%) | 0 (0.0%) |
| 85 Years and over | 0 (0.0%) | 0 (0.0%) |
| Total | 84 (100.0%) | 66 (100.0%) |
Families and Households in Olds
Median Family Size in Olds
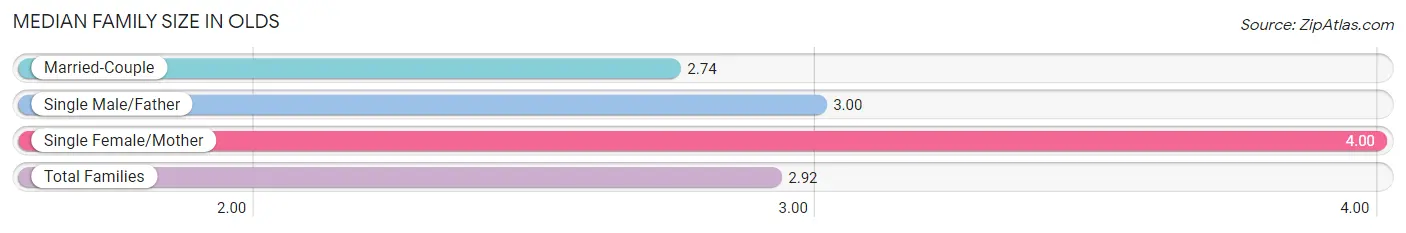
The median family size in Olds is 2.92 persons per family, with single female/mother families (5 | 13.2%) accounting for the largest median family size of 4 persons per family. On the other hand, married-couple families (31 | 81.6%) represent the smallest median family size with 2.74 persons per family.
| Family Type | # Families | Family Size |
| Married-Couple | 31 (81.6%) | 2.74 |
| Single Male/Father | 2 (5.3%) | 3.00 |
| Single Female/Mother | 5 (13.2%) | 4.00 |
| Total Families | 38 (100.0%) | 2.92 |
Median Household Size in Olds
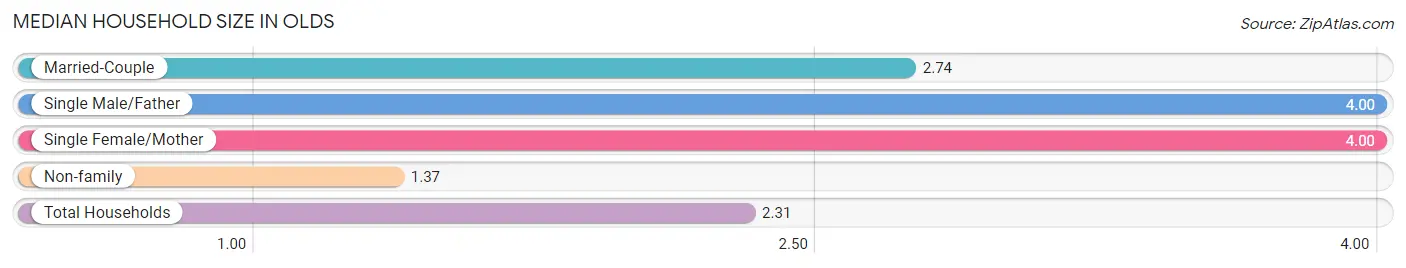
The median household size in Olds is 2.31 persons per household, with single male/father households (2 | 3.1%) accounting for the largest median household size of 4 persons per household. non-family households (27 | 41.5%) represent the smallest median household size with 1.37 persons per household.
| Household Type | # Households | Household Size |
| Married-Couple | 31 (47.7%) | 2.74 |
| Single Male/Father | 2 (3.1%) | 4.00 |
| Single Female/Mother | 5 (7.7%) | 4.00 |
| Non-family | 27 (41.5%) | 1.37 |
| Total Households | 65 (100.0%) | 2.31 |
Household Size by Marriage Status in Olds
Out of a total of 65 households in Olds, 38 (58.5%) are family households, while 27 (41.5%) are nonfamily households. The most numerous type of family households are 2-person households, comprising 22, and the most common type of nonfamily households are 1-person households, comprising 15.
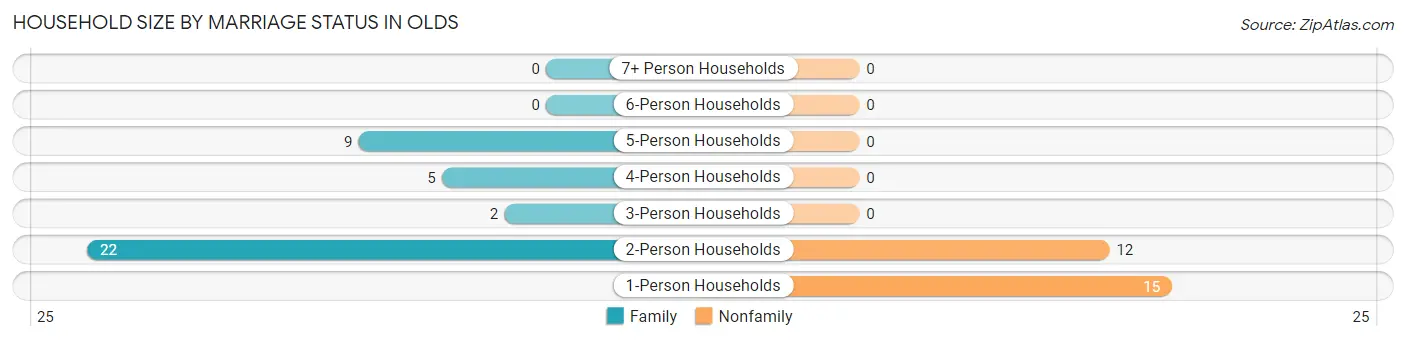
| Household Size | Family Households | Nonfamily Households |
| 1-Person Households | - | 15 (23.1%) |
| 2-Person Households | 22 (33.9%) | 12 (18.5%) |
| 3-Person Households | 2 (3.1%) | 0 (0.0%) |
| 4-Person Households | 5 (7.7%) | 0 (0.0%) |
| 5-Person Households | 9 (13.9%) | 0 (0.0%) |
| 6-Person Households | 0 (0.0%) | 0 (0.0%) |
| 7+ Person Households | 0 (0.0%) | 0 (0.0%) |
| Total | 38 (58.5%) | 27 (41.5%) |
Female Fertility in Olds
Fertility by Age in Olds
Average fertility rate in Olds is 132.0 births per 1,000 women. Women in the age bracket of 20 to 34 years have the highest fertility rate with 217.0 births per 1,000 women. Women in the age bracket of 20 to 34 years acount for 100.0% of all women with births.
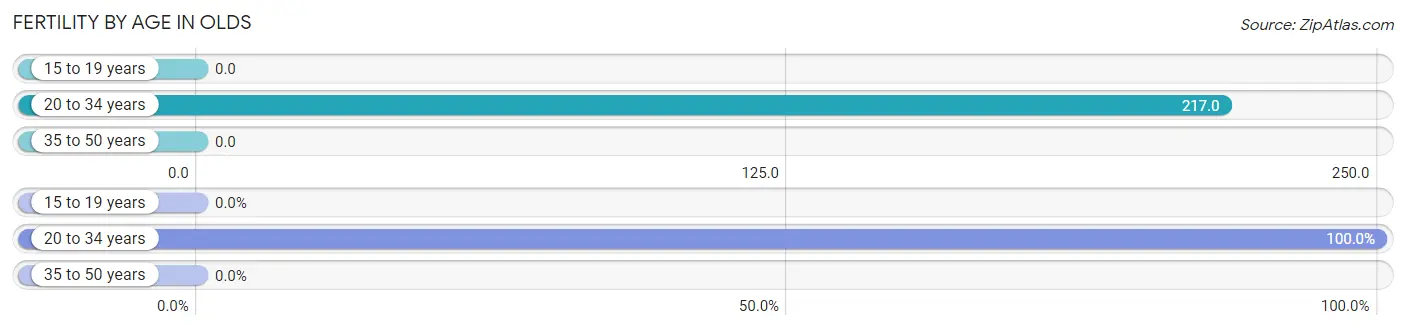
| Age Bracket | Women with Births | Births / 1,000 Women |
| 15 to 19 years | 0 (0.0%) | 0.0 |
| 20 to 34 years | 5 (100.0%) | 217.0 |
| 35 to 50 years | 0 (0.0%) | 0.0 |
| Total | 5 (100.0%) | 132.0 |
Fertility by Age by Marriage Status in Olds
60.0% of women with births (5) in Olds are married. The highest percentage of unmarried women with births falls into 20 to 34 years age bracket with 40.0% of them unmarried at the time of birth, while the lowest percentage of unmarried women with births belong to 20 to 34 years age bracket with 40.0% of them unmarried.
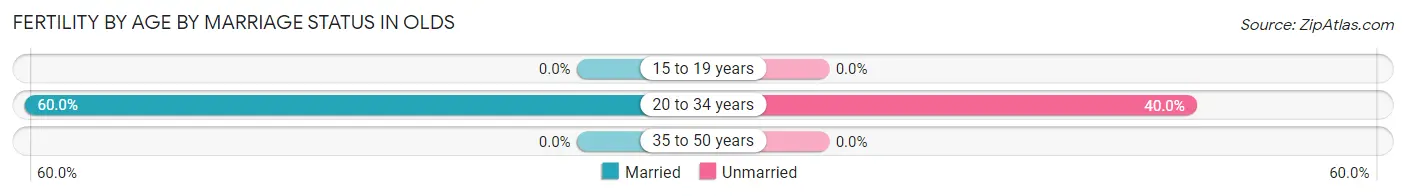
| Age Bracket | Married | Unmarried |
| 15 to 19 years | 0 (0.0%) | 0 (0.0%) |
| 20 to 34 years | 3 (60.0%) | 2 (40.0%) |
| 35 to 50 years | 0 (0.0%) | 0 (0.0%) |
| Total | 3 (60.0%) | 2 (40.0%) |
Fertility by Education in Olds
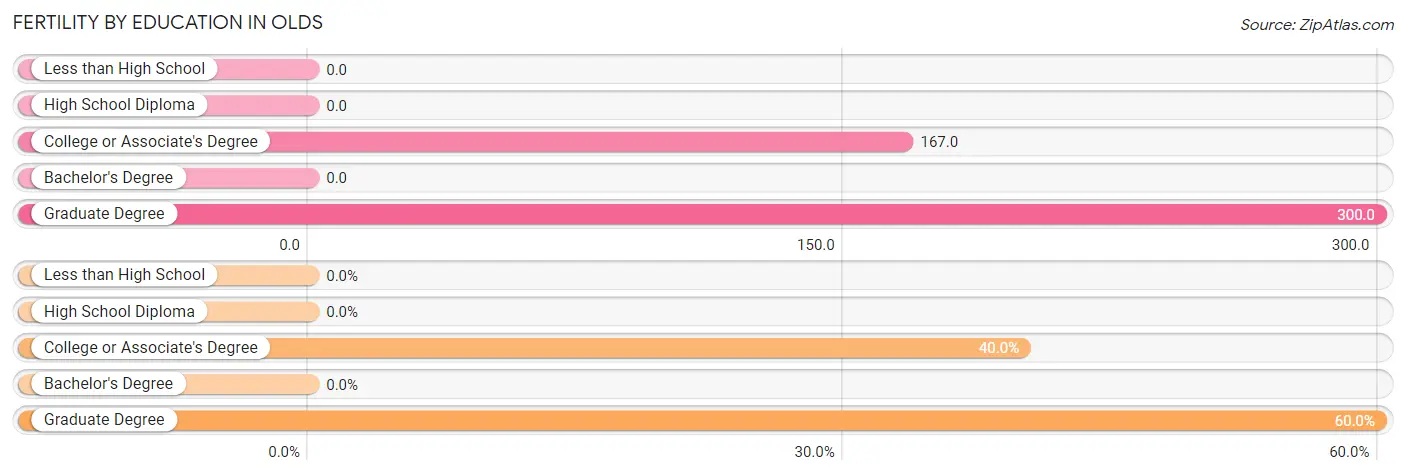
| Educational Attainment | Women with Births | Births / 1,000 Women |
| Less than High School | 0 (0.0%) | 0.0 |
| High School Diploma | 0 (0.0%) | 0.0 |
| College or Associate's Degree | 2 (40.0%) | 167.0 |
| Bachelor's Degree | 0 (0.0%) | 0.0 |
| Graduate Degree | 3 (60.0%) | 300.0 |
| Total | 5 (100.0%) | 132.0 |
Fertility by Education by Marriage Status in Olds
40.0% of women with births in Olds are unmarried. Women with the educational attainment of graduate degree are most likely to be married with 100.0% of them married at childbirth, while women with the educational attainment of college or associate's degree are least likely to be married with 100.0% of them unmarried at childbirth.
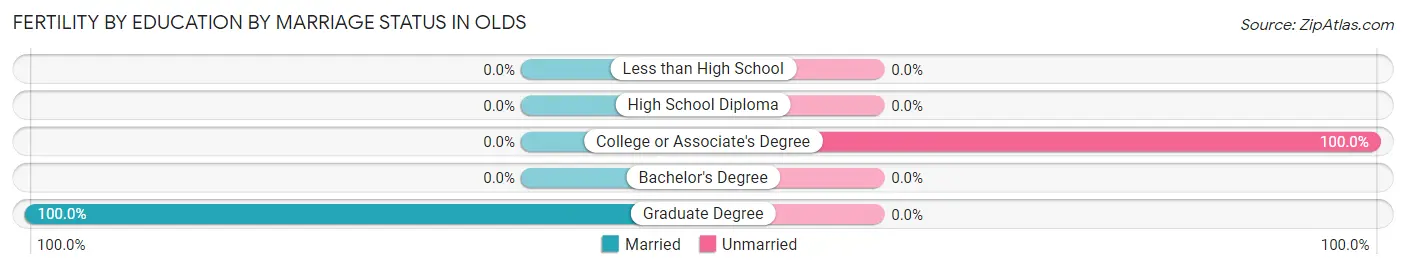
| Educational Attainment | Married | Unmarried |
| Less than High School | 0 (0.0%) | 0 (0.0%) |
| High School Diploma | 0 (0.0%) | 0 (0.0%) |
| College or Associate's Degree | 0 (0.0%) | 2 (100.0%) |
| Bachelor's Degree | 0 (0.0%) | 0 (0.0%) |
| Graduate Degree | 3 (100.0%) | 0 (0.0%) |
| Total | 3 (60.0%) | 2 (40.0%) |
Employment Characteristics in Olds
Employment by Class of Employer in Olds
Among the 90 employed individuals in Olds, private company employees (59 | 65.6%), not-for-profit organizations (15 | 16.7%), and state government employees (10 | 11.1%) make up the most common classes of employment.
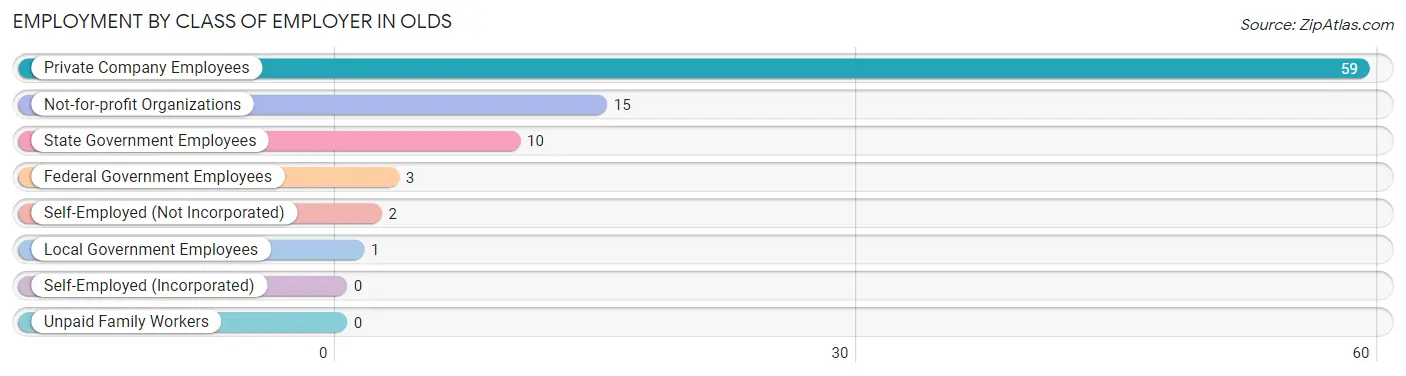
| Employer Class | # Employees | % Employees |
| Private Company Employees | 59 | 65.6% |
| Self-Employed (Incorporated) | 0 | 0.0% |
| Self-Employed (Not Incorporated) | 2 | 2.2% |
| Not-for-profit Organizations | 15 | 16.7% |
| Local Government Employees | 1 | 1.1% |
| State Government Employees | 10 | 11.1% |
| Federal Government Employees | 3 | 3.3% |
| Unpaid Family Workers | 0 | 0.0% |
| Total | 90 | 100.0% |
Employment Status by Age in Olds
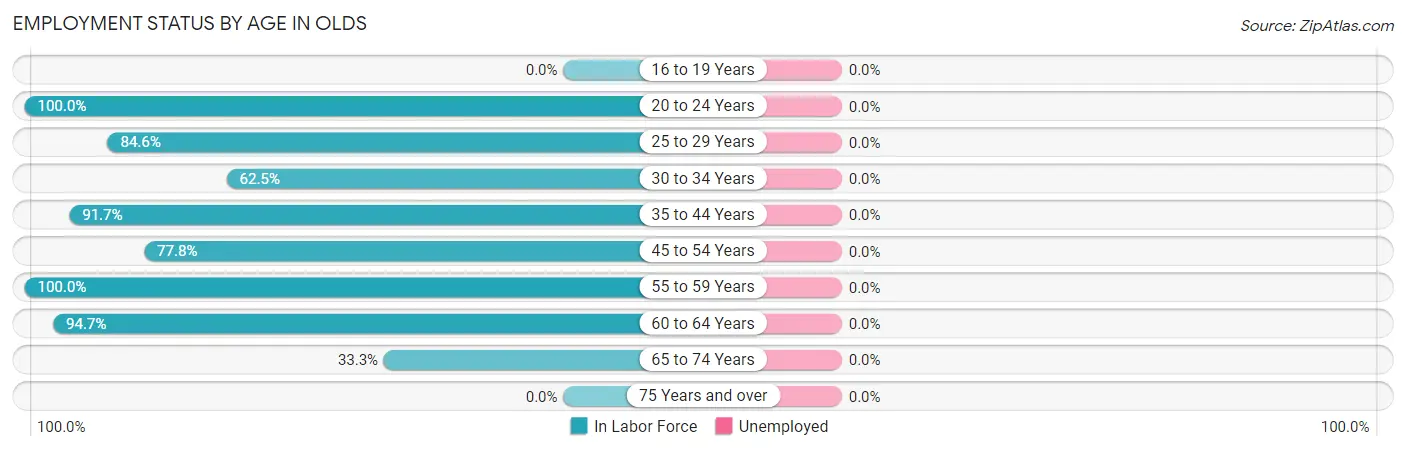
| Age Bracket | In Labor Force | Unemployed |
| 16 to 19 Years | 0 (0.0%) | 0 (0.0%) |
| 20 to 24 Years | 18 (100.0%) | 0 (0.0%) |
| 25 to 29 Years | 11 (84.6%) | 0 (0.0%) |
| 30 to 34 Years | 5 (62.5%) | 0 (0.0%) |
| 35 to 44 Years | 22 (91.7%) | 0 (0.0%) |
| 45 to 54 Years | 7 (77.8%) | 0 (0.0%) |
| 55 to 59 Years | 8 (100.0%) | 0 (0.0%) |
| 60 to 64 Years | 18 (94.7%) | 0 (0.0%) |
| 65 to 74 Years | 2 (33.3%) | 0 (0.0%) |
| 75 Years and over | 0 (0.0%) | 0 (0.0%) |
| Total | 91 (80.5%) | 0 (0.0%) |
Employment Status by Educational Attainment in Olds
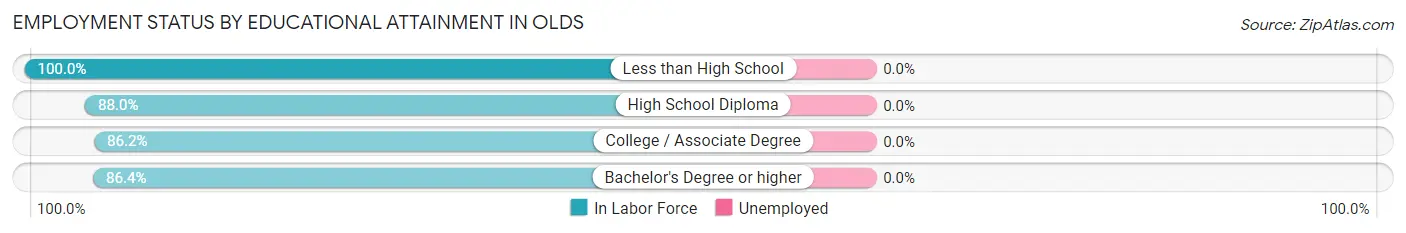
| Educational Attainment | In Labor Force | Unemployed |
| Less than High School | 5 (100.0%) | 0 (0.0%) |
| High School Diploma | 22 (88.0%) | 0 (0.0%) |
| College / Associate Degree | 25 (86.2%) | 0 (0.0%) |
| Bachelor's Degree or higher | 19 (86.4%) | 0 (0.0%) |
| Total | 71 (87.7%) | 0 (0.0%) |
Employment Occupations by Sex in Olds
Management, Business, Science and Arts Occupations
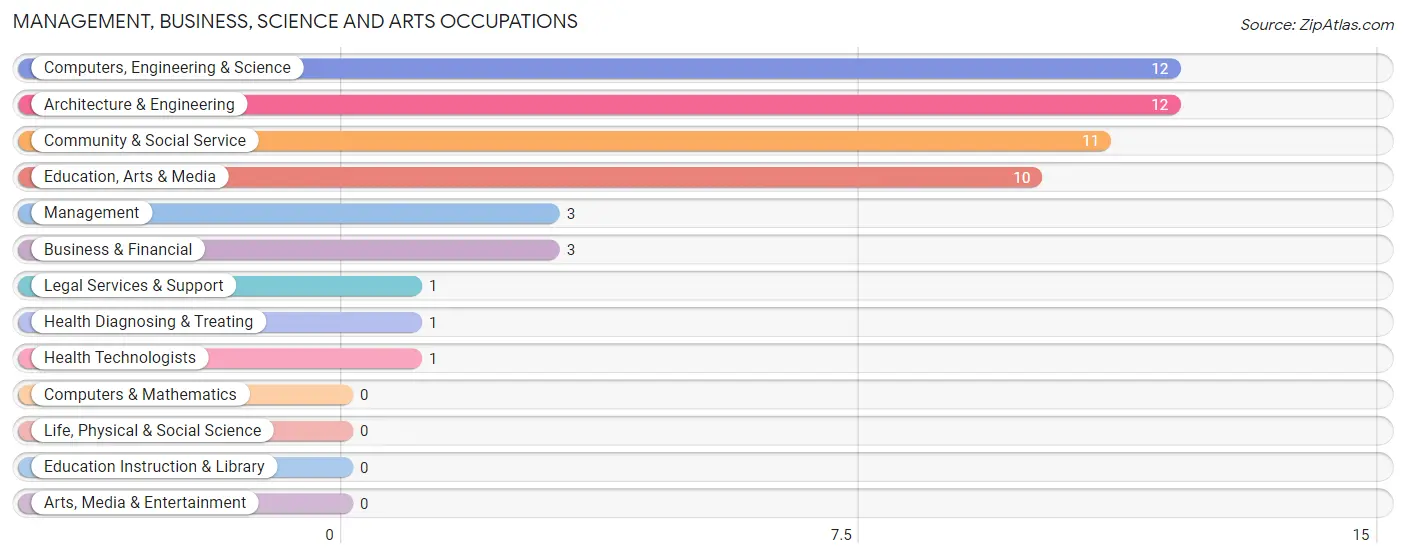
The most common Management, Business, Science and Arts occupations in Olds are Computers, Engineering & Science (12 | 13.2%), Architecture & Engineering (12 | 13.2%), Community & Social Service (11 | 12.1%), Education, Arts & Media (10 | 11.0%), and Management (3 | 3.3%).
Management, Business, Science and Arts Occupations by Sex
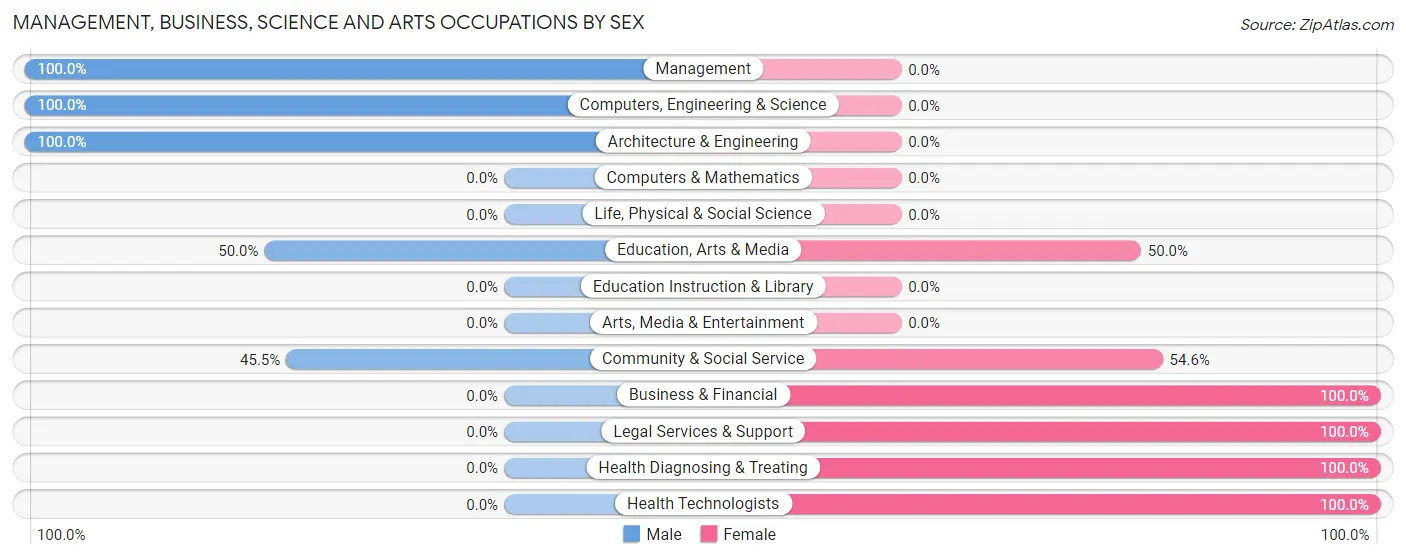
Within the Management, Business, Science and Arts occupations in Olds, the most male-oriented occupations are Management (100.0%), Computers, Engineering & Science (100.0%), and Architecture & Engineering (100.0%), while the most female-oriented occupations are Business & Financial (100.0%), Legal Services & Support (100.0%), and Health Diagnosing & Treating (100.0%).
| Occupation | Male | Female |
| Management | 3 (100.0%) | 0 (0.0%) |
| Business & Financial | 0 (0.0%) | 3 (100.0%) |
| Computers, Engineering & Science | 12 (100.0%) | 0 (0.0%) |
| Computers & Mathematics | 0 (0.0%) | 0 (0.0%) |
| Architecture & Engineering | 12 (100.0%) | 0 (0.0%) |
| Life, Physical & Social Science | 0 (0.0%) | 0 (0.0%) |
| Community & Social Service | 5 (45.5%) | 6 (54.5%) |
| Education, Arts & Media | 5 (50.0%) | 5 (50.0%) |
| Legal Services & Support | 0 (0.0%) | 1 (100.0%) |
| Education Instruction & Library | 0 (0.0%) | 0 (0.0%) |
| Arts, Media & Entertainment | 0 (0.0%) | 0 (0.0%) |
| Health Diagnosing & Treating | 0 (0.0%) | 1 (100.0%) |
| Health Technologists | 0 (0.0%) | 1 (100.0%) |
| Total (Category) | 20 (66.7%) | 10 (33.3%) |
| Total (Overall) | 51 (56.0%) | 40 (44.0%) |
Services Occupations
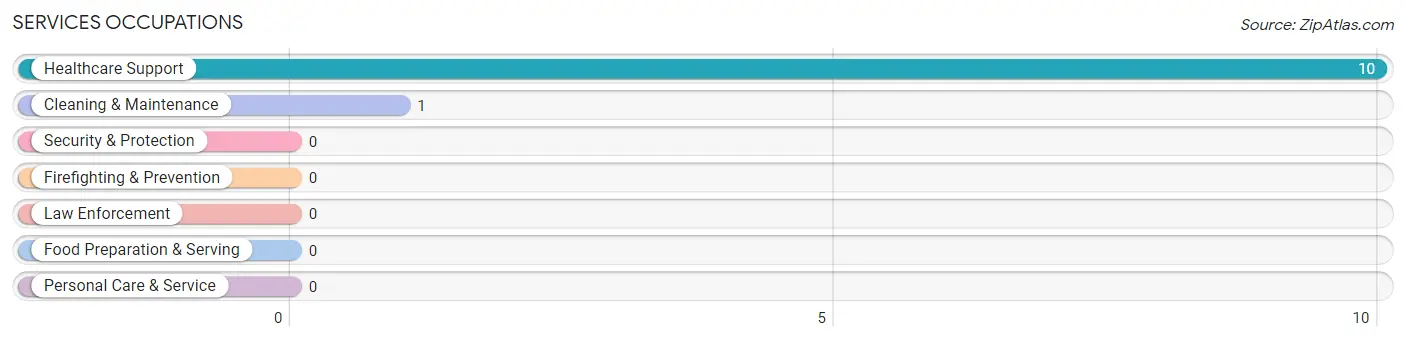
The most common Services occupations in Olds are Healthcare Support (10 | 11.0%), and Cleaning & Maintenance (1 | 1.1%).
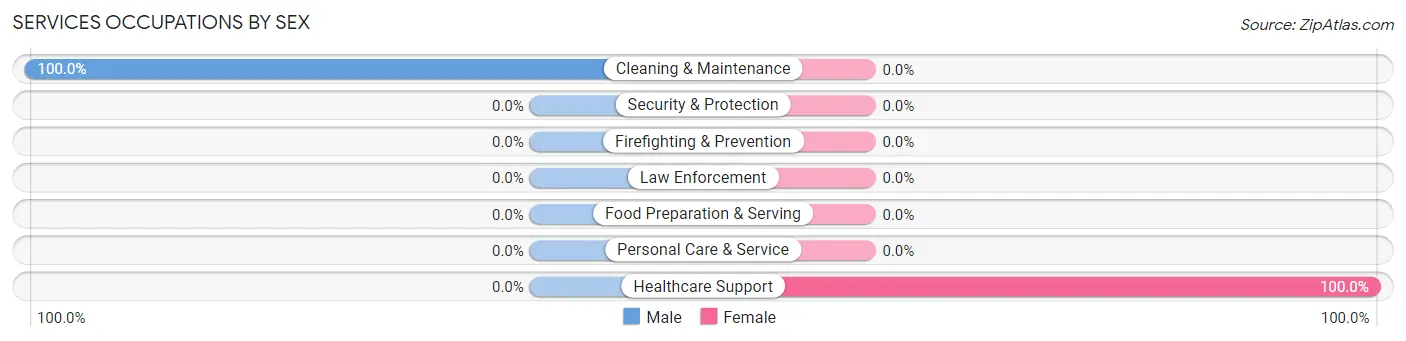
Services Occupations by Sex
| Occupation | Male | Female |
| Healthcare Support | 0 (0.0%) | 10 (100.0%) |
| Security & Protection | 0 (0.0%) | 0 (0.0%) |
| Firefighting & Prevention | 0 (0.0%) | 0 (0.0%) |
| Law Enforcement | 0 (0.0%) | 0 (0.0%) |
| Food Preparation & Serving | 0 (0.0%) | 0 (0.0%) |
| Cleaning & Maintenance | 1 (100.0%) | 0 (0.0%) |
| Personal Care & Service | 0 (0.0%) | 0 (0.0%) |
| Total (Category) | 1 (9.1%) | 10 (90.9%) |
| Total (Overall) | 51 (56.0%) | 40 (44.0%) |
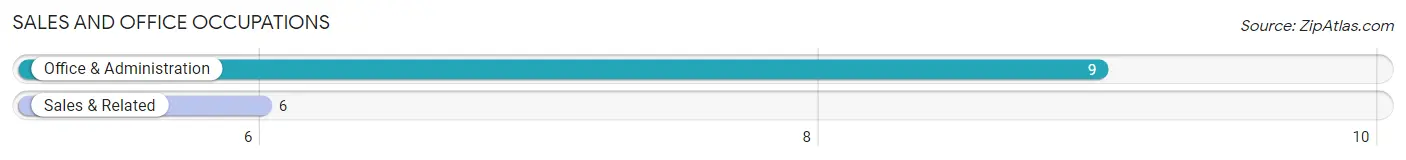
Sales and Office Occupations
The most common Sales and Office occupations in Olds are Office & Administration (9 | 9.9%), and Sales & Related (6 | 6.6%).
Sales and Office Occupations by Sex
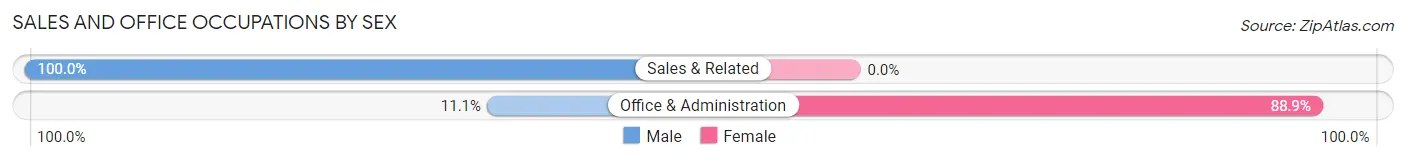
| Occupation | Male | Female |
| Sales & Related | 6 (100.0%) | 0 (0.0%) |
| Office & Administration | 1 (11.1%) | 8 (88.9%) |
| Total (Category) | 7 (46.7%) | 8 (53.3%) |
| Total (Overall) | 51 (56.0%) | 40 (44.0%) |
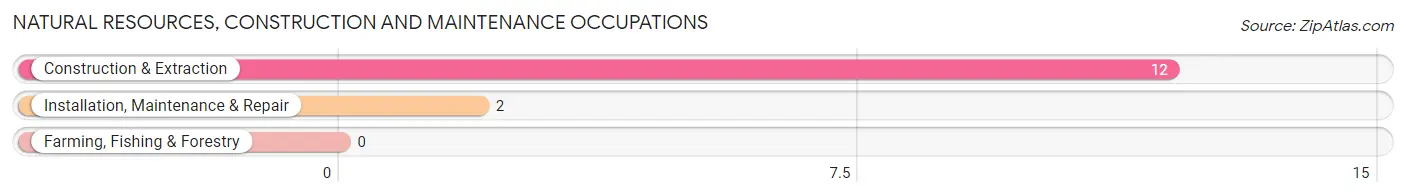
Natural Resources, Construction and Maintenance Occupations
The most common Natural Resources, Construction and Maintenance occupations in Olds are Construction & Extraction (12 | 13.2%), and Installation, Maintenance & Repair (2 | 2.2%).
Natural Resources, Construction and Maintenance Occupations by Sex
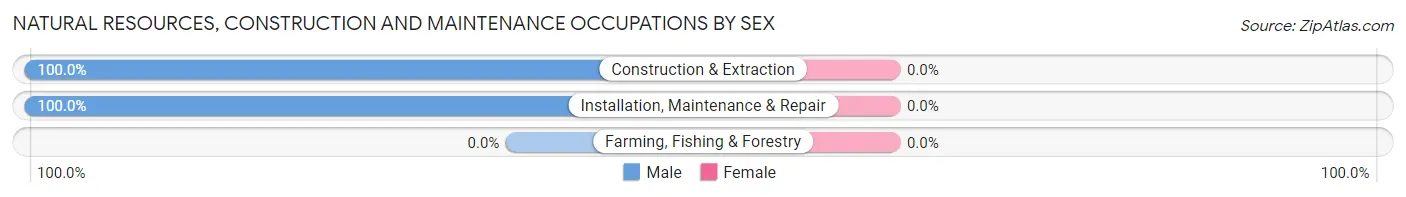
| Occupation | Male | Female |
| Farming, Fishing & Forestry | 0 (0.0%) | 0 (0.0%) |
| Construction & Extraction | 12 (100.0%) | 0 (0.0%) |
| Installation, Maintenance & Repair | 2 (100.0%) | 0 (0.0%) |
| Total (Category) | 14 (100.0%) | 0 (0.0%) |
| Total (Overall) | 51 (56.0%) | 40 (44.0%) |
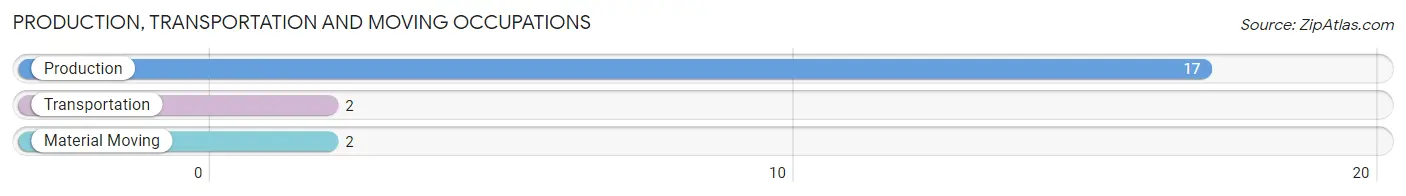
Production, Transportation and Moving Occupations
The most common Production, Transportation and Moving occupations in Olds are Production (17 | 18.7%), Transportation (2 | 2.2%), and Material Moving (2 | 2.2%).
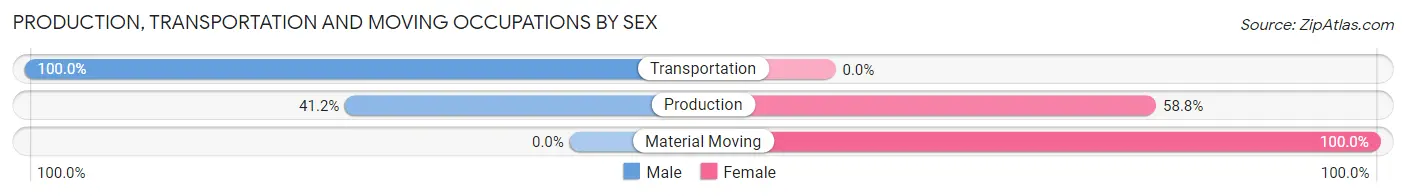
Production, Transportation and Moving Occupations by Sex
| Occupation | Male | Female |
| Production | 7 (41.2%) | 10 (58.8%) |
| Transportation | 2 (100.0%) | 0 (0.0%) |
| Material Moving | 0 (0.0%) | 2 (100.0%) |
| Total (Category) | 9 (42.9%) | 12 (57.1%) |
| Total (Overall) | 51 (56.0%) | 40 (44.0%) |
Employment Industries by Sex in Olds
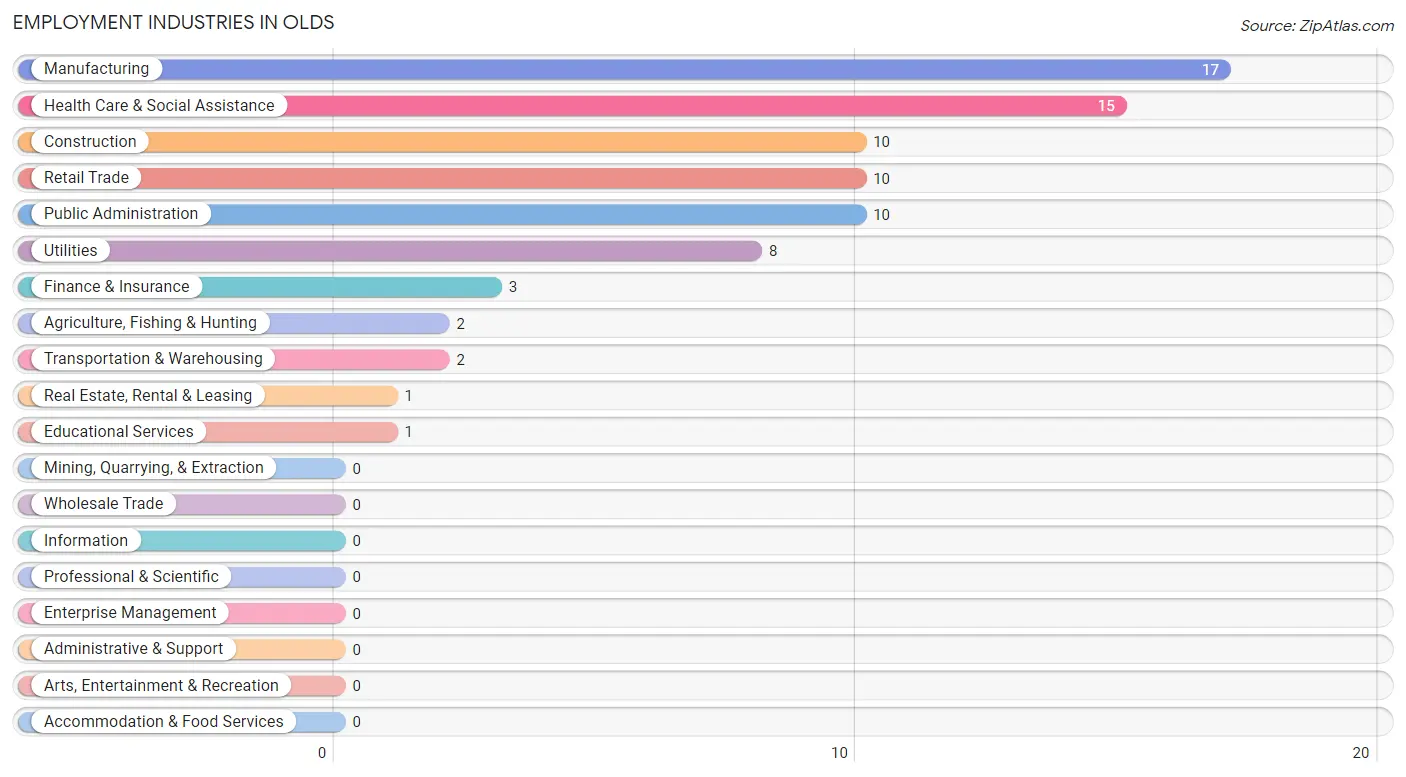
Employment Industries in Olds
The major employment industries in Olds include Manufacturing (17 | 18.7%), Health Care & Social Assistance (15 | 16.5%), Construction (10 | 11.0%), Retail Trade (10 | 11.0%), and Public Administration (10 | 11.0%).
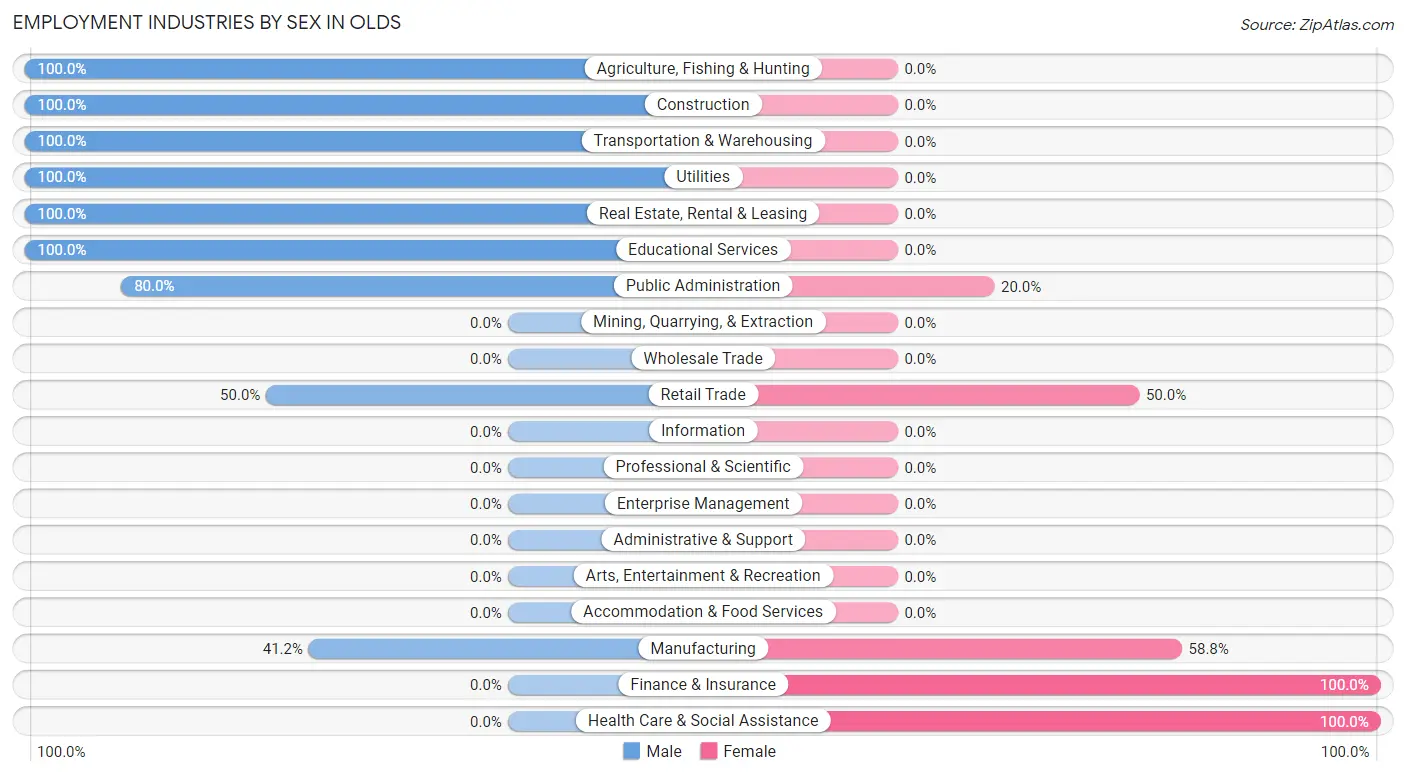
Employment Industries by Sex in Olds
The Olds industries that see more men than women are Agriculture, Fishing & Hunting (100.0%), Construction (100.0%), and Transportation & Warehousing (100.0%), whereas the industries that tend to have a higher number of women are Finance & Insurance (100.0%), Health Care & Social Assistance (100.0%), and Manufacturing (58.8%).
| Industry | Male | Female |
| Agriculture, Fishing & Hunting | 2 (100.0%) | 0 (0.0%) |
| Mining, Quarrying, & Extraction | 0 (0.0%) | 0 (0.0%) |
| Construction | 10 (100.0%) | 0 (0.0%) |
| Manufacturing | 7 (41.2%) | 10 (58.8%) |
| Wholesale Trade | 0 (0.0%) | 0 (0.0%) |
| Retail Trade | 5 (50.0%) | 5 (50.0%) |
| Transportation & Warehousing | 2 (100.0%) | 0 (0.0%) |
| Utilities | 8 (100.0%) | 0 (0.0%) |
| Information | 0 (0.0%) | 0 (0.0%) |
| Finance & Insurance | 0 (0.0%) | 3 (100.0%) |
| Real Estate, Rental & Leasing | 1 (100.0%) | 0 (0.0%) |
| Professional & Scientific | 0 (0.0%) | 0 (0.0%) |
| Enterprise Management | 0 (0.0%) | 0 (0.0%) |
| Administrative & Support | 0 (0.0%) | 0 (0.0%) |
| Educational Services | 1 (100.0%) | 0 (0.0%) |
| Health Care & Social Assistance | 0 (0.0%) | 15 (100.0%) |
| Arts, Entertainment & Recreation | 0 (0.0%) | 0 (0.0%) |
| Accommodation & Food Services | 0 (0.0%) | 0 (0.0%) |
| Public Administration | 8 (80.0%) | 2 (20.0%) |
| Total | 51 (56.0%) | 40 (44.0%) |
Education in Olds
School Enrollment in Olds
The most common levels of schooling among the 38 students in Olds are middle school (21 | 55.3%), elementary school (6 | 15.8%), and graduate / professional (5 | 13.2%).
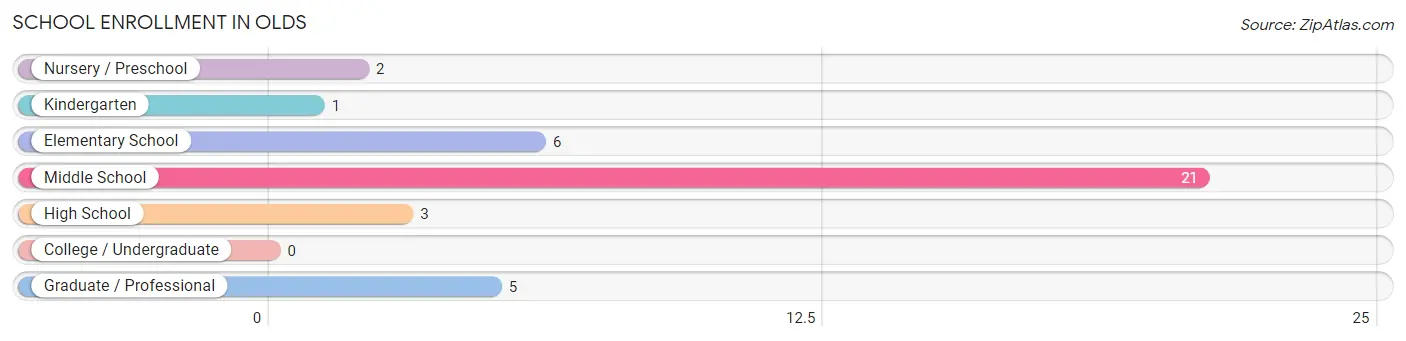
| School Level | # Students | % Students |
| Nursery / Preschool | 2 | 5.3% |
| Kindergarten | 1 | 2.6% |
| Elementary School | 6 | 15.8% |
| Middle School | 21 | 55.3% |
| High School | 3 | 7.9% |
| College / Undergraduate | 0 | 0.0% |
| Graduate / Professional | 5 | 13.2% |
| Total | 38 | 100.0% |
School Enrollment by Age by Funding Source in Olds
Out of a total of 38 students who are enrolled in schools in Olds, 5 (13.2%) attend a private institution, while the remaining 33 (86.8%) are enrolled in public schools. The age group of 35 years and over has the highest likelihood of being enrolled in private schools, with 5 (100.0% in the age bracket) enrolled. Conversely, the age group of 5 to 9 year old has the lowest likelihood of being enrolled in a private school, with 12 (100.0% in the age bracket) attending a public institution.
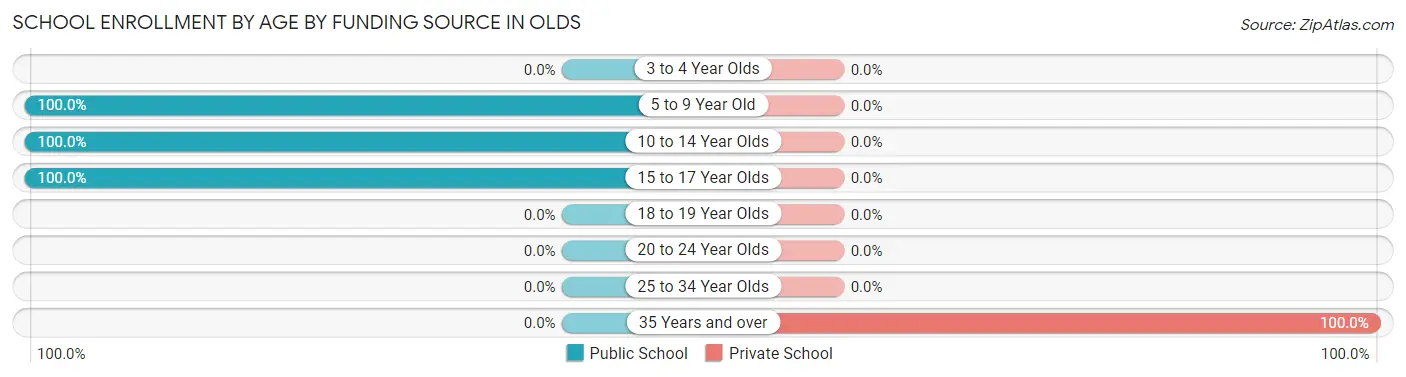
| Age Bracket | Public School | Private School |
| 3 to 4 Year Olds | 0 (0.0%) | 0 (0.0%) |
| 5 to 9 Year Old | 12 (100.0%) | 0 (0.0%) |
| 10 to 14 Year Olds | 18 (100.0%) | 0 (0.0%) |
| 15 to 17 Year Olds | 3 (100.0%) | 0 (0.0%) |
| 18 to 19 Year Olds | 0 (0.0%) | 0 (0.0%) |
| 20 to 24 Year Olds | 0 (0.0%) | 0 (0.0%) |
| 25 to 34 Year Olds | 0 (0.0%) | 0 (0.0%) |
| 35 Years and over | 0 (0.0%) | 5 (100.0%) |
| Total | 33 (86.8%) | 5 (13.2%) |
Educational Attainment by Field of Study in Olds
Liberal arts & history (10 | 41.7%), business (6 | 25.0%), science & technology (3 | 12.5%), physical & health sciences (1 | 4.2%), and psychology (1 | 4.2%) are the most common fields of study among 24 individuals in Olds who have obtained a bachelor's degree or higher.
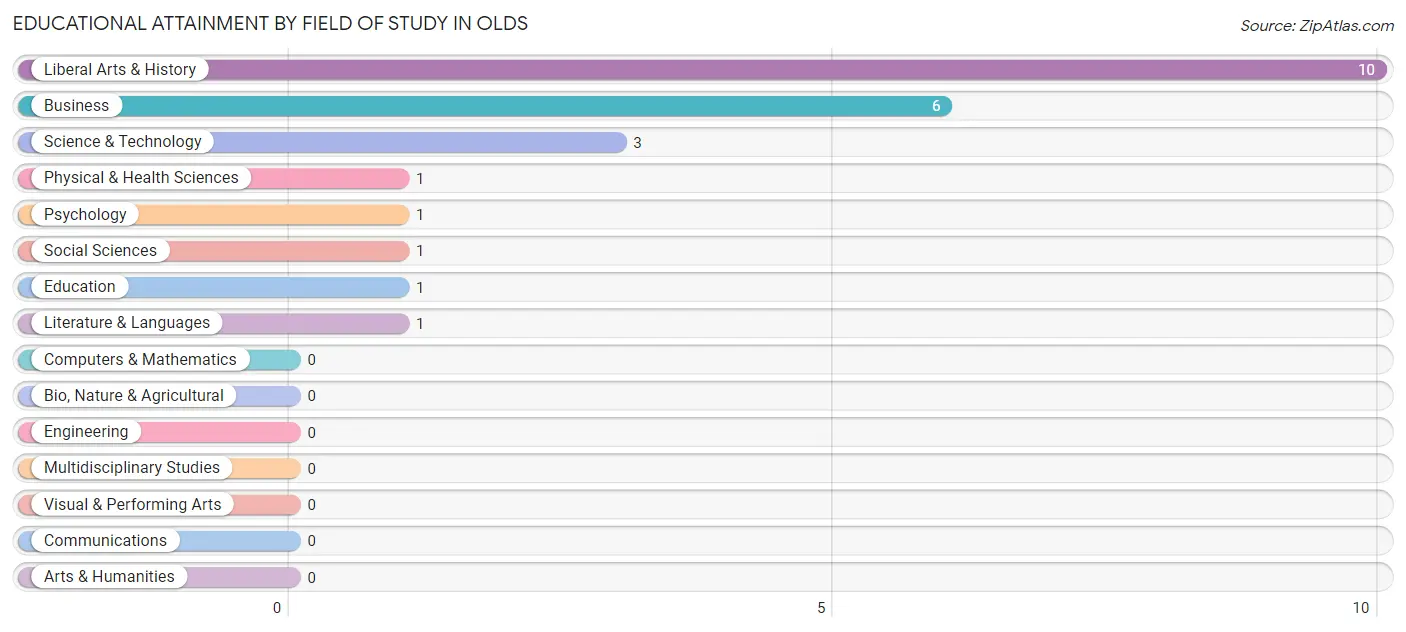
| Field of Study | # Graduates | % Graduates |
| Computers & Mathematics | 0 | 0.0% |
| Bio, Nature & Agricultural | 0 | 0.0% |
| Physical & Health Sciences | 1 | 4.2% |
| Psychology | 1 | 4.2% |
| Social Sciences | 1 | 4.2% |
| Engineering | 0 | 0.0% |
| Multidisciplinary Studies | 0 | 0.0% |
| Science & Technology | 3 | 12.5% |
| Business | 6 | 25.0% |
| Education | 1 | 4.2% |
| Literature & Languages | 1 | 4.2% |
| Liberal Arts & History | 10 | 41.7% |
| Visual & Performing Arts | 0 | 0.0% |
| Communications | 0 | 0.0% |
| Arts & Humanities | 0 | 0.0% |
| Total | 24 | 100.0% |
Transportation & Commute in Olds
Vehicle Availability by Sex in Olds
The most prevalent vehicle ownership categories in Olds are males with 2 vehicles (26, accounting for 52.0%) and females with 2 vehicles (22, making up 65.0%).
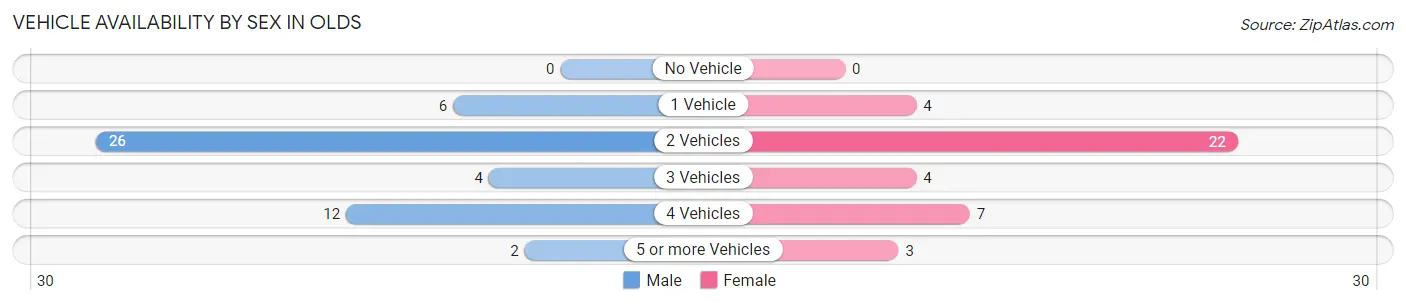
| Vehicles Available | Male | Female |
| No Vehicle | 0 (0.0%) | 0 (0.0%) |
| 1 Vehicle | 6 (12.0%) | 4 (10.0%) |
| 2 Vehicles | 26 (52.0%) | 22 (55.0%) |
| 3 Vehicles | 4 (8.0%) | 4 (10.0%) |
| 4 Vehicles | 12 (24.0%) | 7 (17.5%) |
| 5 or more Vehicles | 2 (4.0%) | 3 (7.5%) |
| Total | 50 (100.0%) | 40 (100.0%) |
Commute Time in Olds
The most frequently occuring commute durations in Olds are 15 to 19 minutes (24 commuters, 26.7%), 20 to 24 minutes (22 commuters, 24.4%), and 45 to 59 minutes (16 commuters, 17.8%).
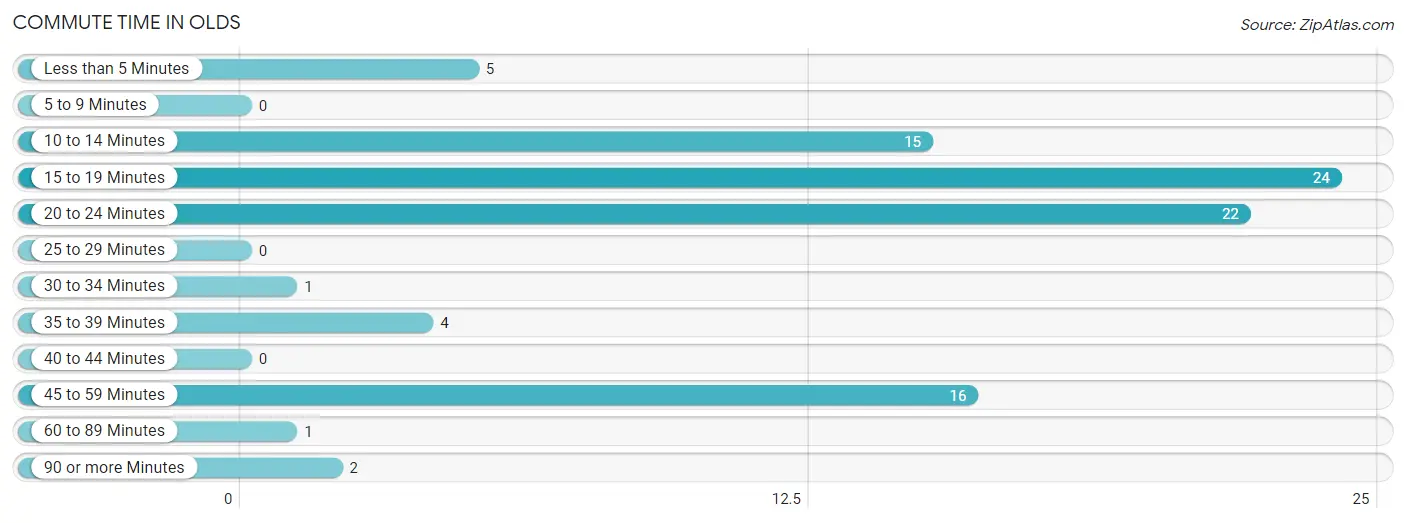
| Commute Time | # Commuters | % Commuters |
| Less than 5 Minutes | 5 | 5.6% |
| 5 to 9 Minutes | 0 | 0.0% |
| 10 to 14 Minutes | 15 | 16.7% |
| 15 to 19 Minutes | 24 | 26.7% |
| 20 to 24 Minutes | 22 | 24.4% |
| 25 to 29 Minutes | 0 | 0.0% |
| 30 to 34 Minutes | 1 | 1.1% |
| 35 to 39 Minutes | 4 | 4.4% |
| 40 to 44 Minutes | 0 | 0.0% |
| 45 to 59 Minutes | 16 | 17.8% |
| 60 to 89 Minutes | 1 | 1.1% |
| 90 or more Minutes | 2 | 2.2% |
Commute Time by Sex in Olds
The most common commute times in Olds are 20 to 24 minutes (22 commuters, 44.0%) for males and 45 to 59 minutes (13 commuters, 32.5%) for females.
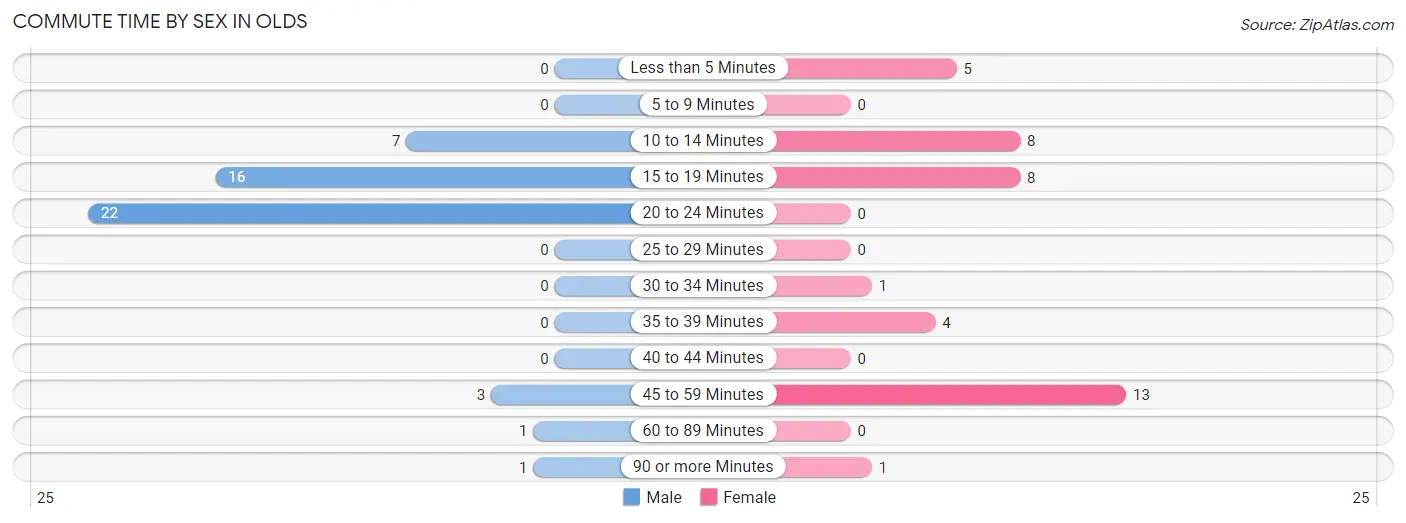
| Commute Time | Male | Female |
| Less than 5 Minutes | 0 (0.0%) | 5 (12.5%) |
| 5 to 9 Minutes | 0 (0.0%) | 0 (0.0%) |
| 10 to 14 Minutes | 7 (14.0%) | 8 (20.0%) |
| 15 to 19 Minutes | 16 (32.0%) | 8 (20.0%) |
| 20 to 24 Minutes | 22 (44.0%) | 0 (0.0%) |
| 25 to 29 Minutes | 0 (0.0%) | 0 (0.0%) |
| 30 to 34 Minutes | 0 (0.0%) | 1 (2.5%) |
| 35 to 39 Minutes | 0 (0.0%) | 4 (10.0%) |
| 40 to 44 Minutes | 0 (0.0%) | 0 (0.0%) |
| 45 to 59 Minutes | 3 (6.0%) | 13 (32.5%) |
| 60 to 89 Minutes | 1 (2.0%) | 0 (0.0%) |
| 90 or more Minutes | 1 (2.0%) | 1 (2.5%) |
Time of Departure to Work by Sex in Olds
The most frequent times of departure to work in Olds are 7:00 AM to 7:29 AM (11, 22.0%) for males and 7:00 AM to 7:29 AM (19, 47.5%) for females.
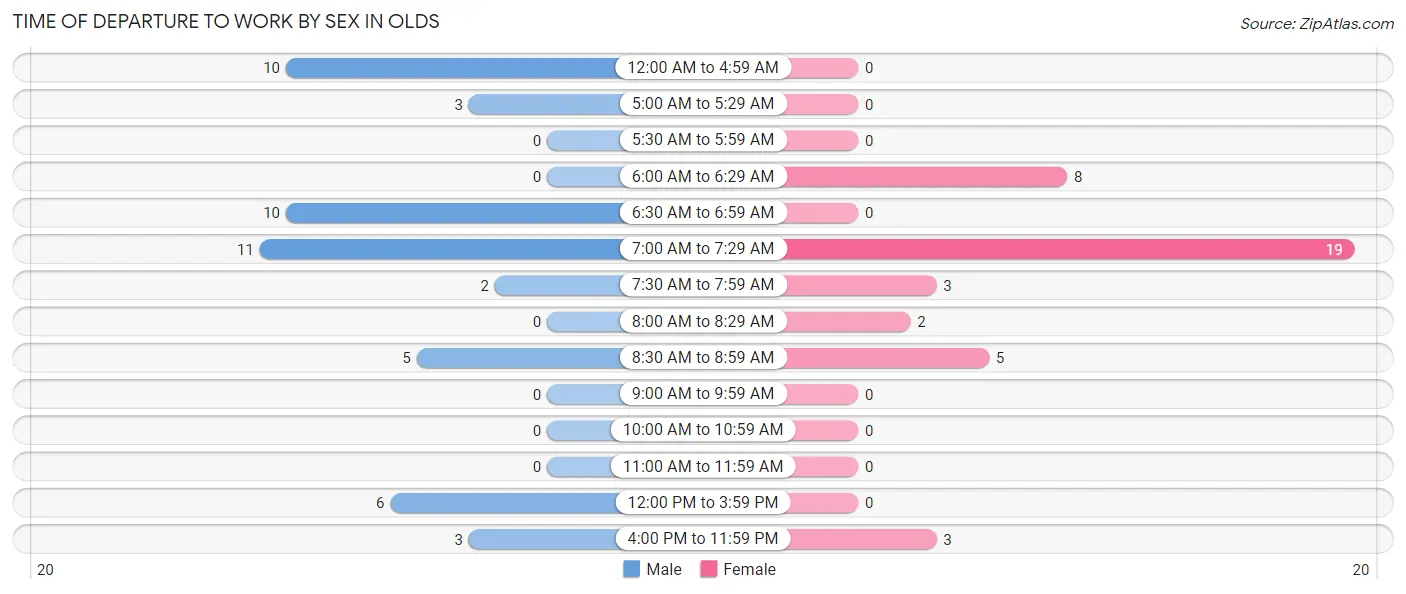
| Time of Departure | Male | Female |
| 12:00 AM to 4:59 AM | 10 (20.0%) | 0 (0.0%) |
| 5:00 AM to 5:29 AM | 3 (6.0%) | 0 (0.0%) |
| 5:30 AM to 5:59 AM | 0 (0.0%) | 0 (0.0%) |
| 6:00 AM to 6:29 AM | 0 (0.0%) | 8 (20.0%) |
| 6:30 AM to 6:59 AM | 10 (20.0%) | 0 (0.0%) |
| 7:00 AM to 7:29 AM | 11 (22.0%) | 19 (47.5%) |
| 7:30 AM to 7:59 AM | 2 (4.0%) | 3 (7.5%) |
| 8:00 AM to 8:29 AM | 0 (0.0%) | 2 (5.0%) |
| 8:30 AM to 8:59 AM | 5 (10.0%) | 5 (12.5%) |
| 9:00 AM to 9:59 AM | 0 (0.0%) | 0 (0.0%) |
| 10:00 AM to 10:59 AM | 0 (0.0%) | 0 (0.0%) |
| 11:00 AM to 11:59 AM | 0 (0.0%) | 0 (0.0%) |
| 12:00 PM to 3:59 PM | 6 (12.0%) | 0 (0.0%) |
| 4:00 PM to 11:59 PM | 3 (6.0%) | 3 (7.5%) |
| Total | 50 (100.0%) | 40 (100.0%) |
Housing Occupancy in Olds
Occupancy by Ownership in Olds
Of the total 65 dwellings in Olds, owner-occupied units account for 35 (53.8%), while renter-occupied units make up 30 (46.2%).
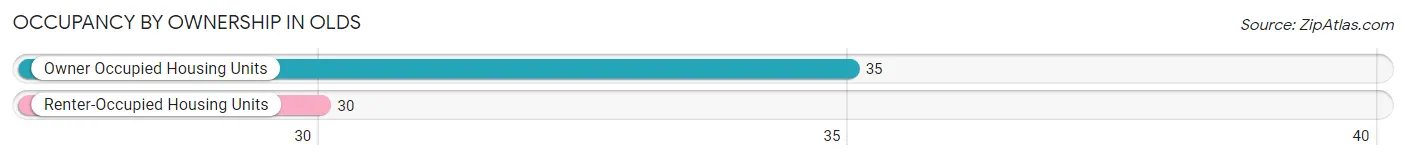
| Occupancy | # Housing Units | % Housing Units |
| Owner Occupied Housing Units | 35 | 53.8% |
| Renter-Occupied Housing Units | 30 | 46.2% |
| Total Occupied Housing Units | 65 | 100.0% |
Occupancy by Household Size in Olds
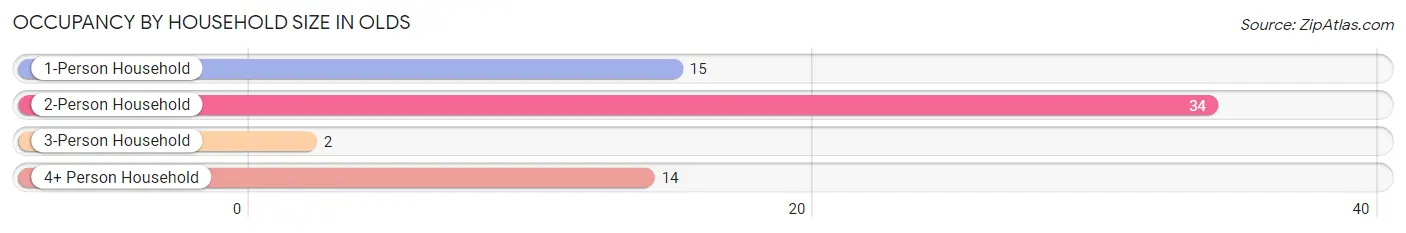
| Household Size | # Housing Units | % Housing Units |
| 1-Person Household | 15 | 23.1% |
| 2-Person Household | 34 | 52.3% |
| 3-Person Household | 2 | 3.1% |
| 4+ Person Household | 14 | 21.5% |
| Total Housing Units | 65 | 100.0% |
Occupancy by Ownership by Household Size in Olds
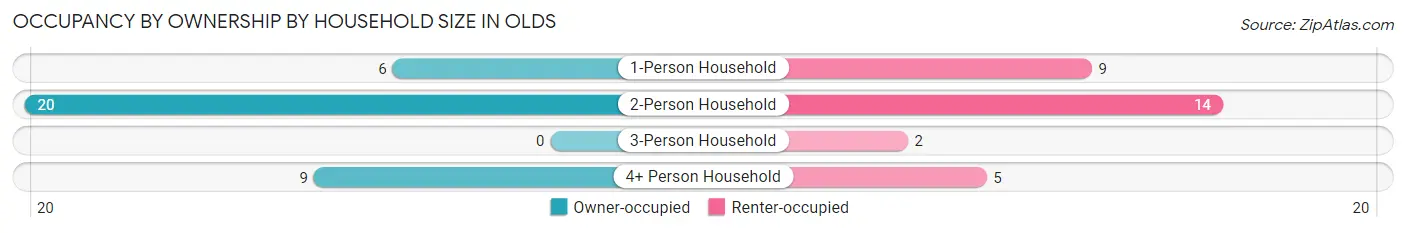
| Household Size | Owner-occupied | Renter-occupied |
| 1-Person Household | 6 (40.0%) | 9 (60.0%) |
| 2-Person Household | 20 (58.8%) | 14 (41.2%) |
| 3-Person Household | 0 (0.0%) | 2 (100.0%) |
| 4+ Person Household | 9 (64.3%) | 5 (35.7%) |
| Total Housing Units | 35 (53.8%) | 30 (46.2%) |
Occupancy by Educational Attainment in Olds
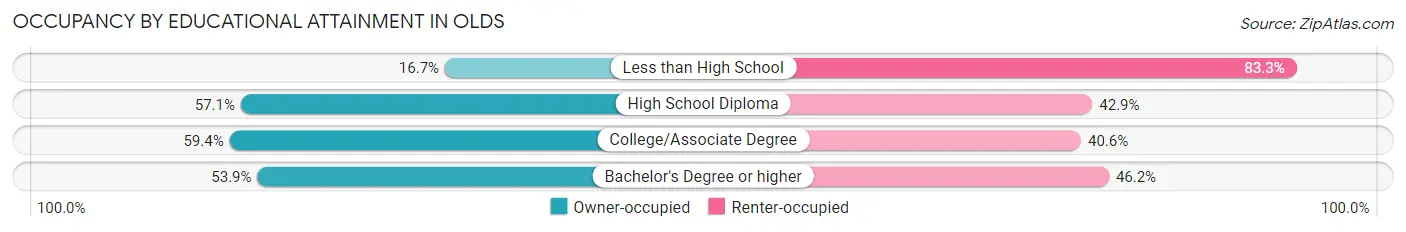
| Household Size | Owner-occupied | Renter-occupied |
| Less than High School | 1 (16.7%) | 5 (83.3%) |
| High School Diploma | 8 (57.1%) | 6 (42.9%) |
| College/Associate Degree | 19 (59.4%) | 13 (40.6%) |
| Bachelor's Degree or higher | 7 (53.8%) | 6 (46.2%) |
Occupancy by Age of Householder in Olds
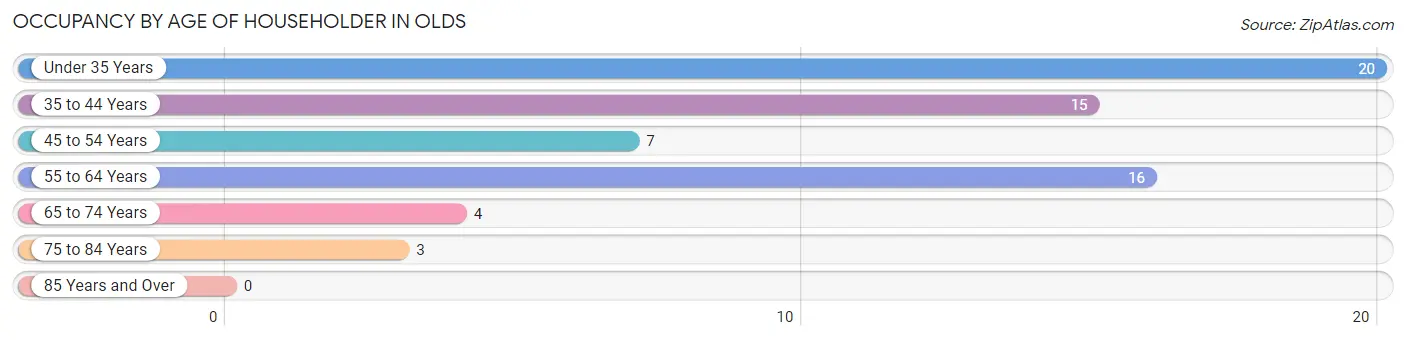
| Age Bracket | # Households | % Households |
| Under 35 Years | 20 | 30.8% |
| 35 to 44 Years | 15 | 23.1% |
| 45 to 54 Years | 7 | 10.8% |
| 55 to 64 Years | 16 | 24.6% |
| 65 to 74 Years | 4 | 6.1% |
| 75 to 84 Years | 3 | 4.6% |
| 85 Years and Over | 0 | 0.0% |
| Total | 65 | 100.0% |
Housing Finances in Olds
Median Income by Occupancy in Olds
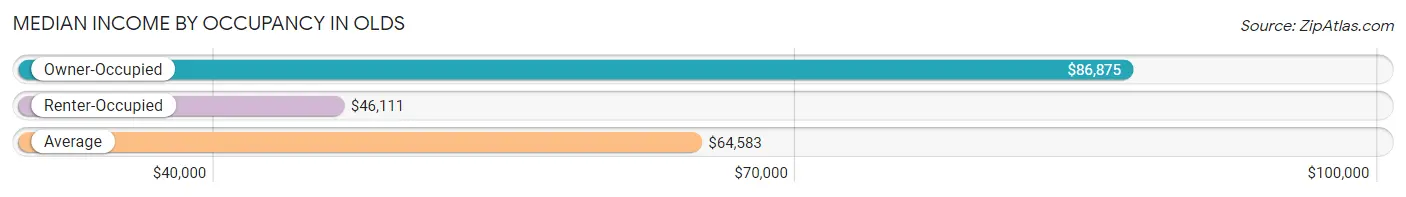
| Occupancy Type | # Households | Median Income |
| Owner-Occupied | 35 (53.8%) | $86,875 |
| Renter-Occupied | 30 (46.2%) | $46,111 |
| Average | 65 (100.0%) | $64,583 |
Occupancy by Householder Income Bracket in Olds
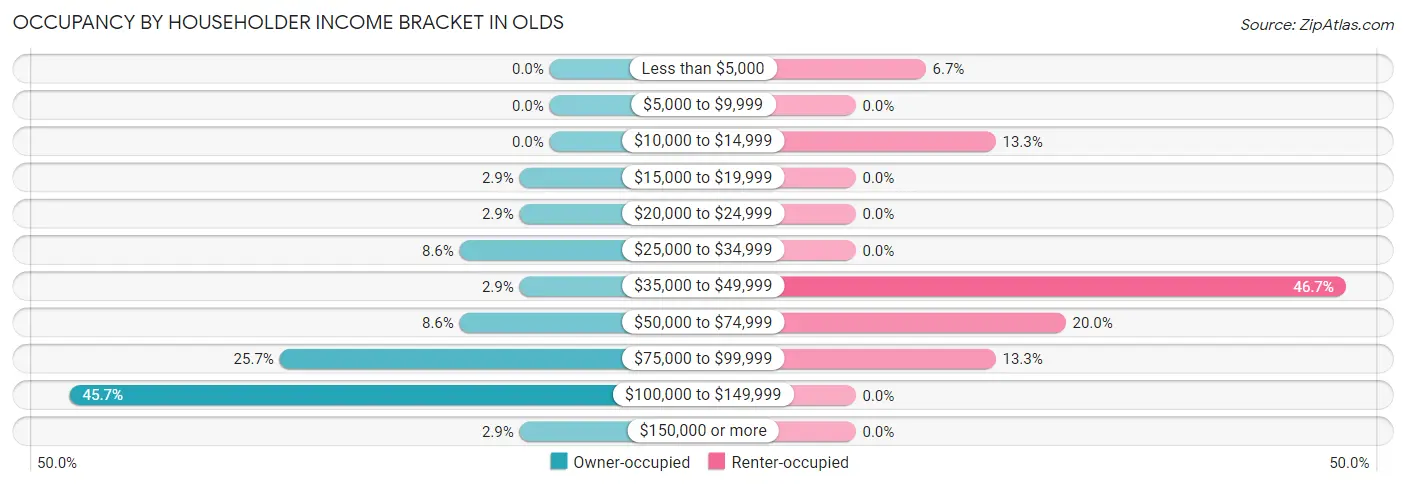
| Income Bracket | Owner-occupied | Renter-occupied |
| Less than $5,000 | 0 (0.0%) | 2 (6.7%) |
| $5,000 to $9,999 | 0 (0.0%) | 0 (0.0%) |
| $10,000 to $14,999 | 0 (0.0%) | 4 (13.3%) |
| $15,000 to $19,999 | 1 (2.9%) | 0 (0.0%) |
| $20,000 to $24,999 | 1 (2.9%) | 0 (0.0%) |
| $25,000 to $34,999 | 3 (8.6%) | 0 (0.0%) |
| $35,000 to $49,999 | 1 (2.9%) | 14 (46.7%) |
| $50,000 to $74,999 | 3 (8.6%) | 6 (20.0%) |
| $75,000 to $99,999 | 9 (25.7%) | 4 (13.3%) |
| $100,000 to $149,999 | 16 (45.7%) | 0 (0.0%) |
| $150,000 or more | 1 (2.9%) | 0 (0.0%) |
| Total | 35 (100.0%) | 30 (100.0%) |
Monthly Housing Cost Tiers in Olds
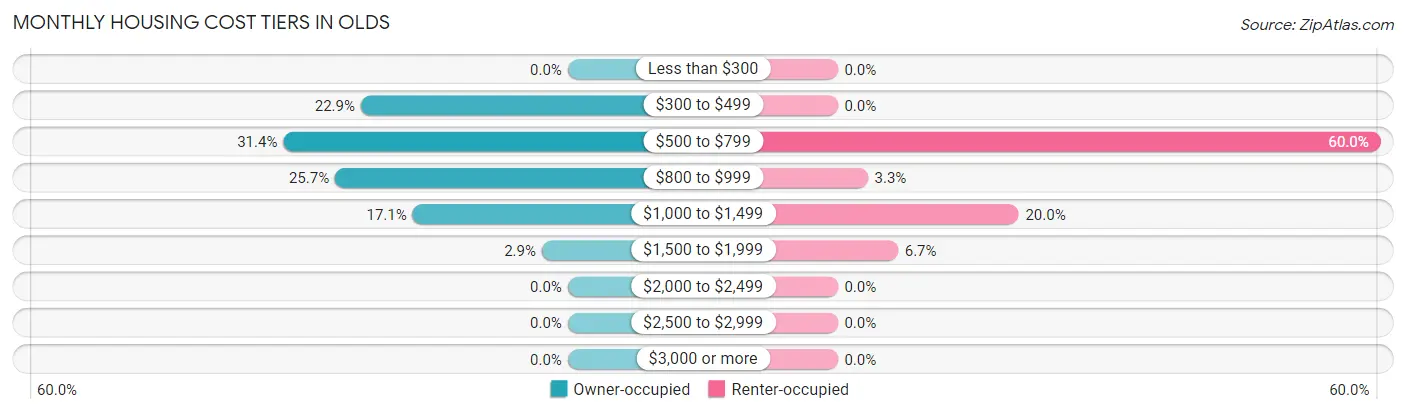
| Monthly Cost | Owner-occupied | Renter-occupied |
| Less than $300 | 0 (0.0%) | 0 (0.0%) |
| $300 to $499 | 8 (22.9%) | 0 (0.0%) |
| $500 to $799 | 11 (31.4%) | 18 (60.0%) |
| $800 to $999 | 9 (25.7%) | 1 (3.3%) |
| $1,000 to $1,499 | 6 (17.1%) | 6 (20.0%) |
| $1,500 to $1,999 | 1 (2.9%) | 2 (6.7%) |
| $2,000 to $2,499 | 0 (0.0%) | 0 (0.0%) |
| $2,500 to $2,999 | 0 (0.0%) | 0 (0.0%) |
| $3,000 or more | 0 (0.0%) | 0 (0.0%) |
| Total | 35 (100.0%) | 30 (100.0%) |
Physical Housing Characteristics in Olds
Housing Structures in Olds
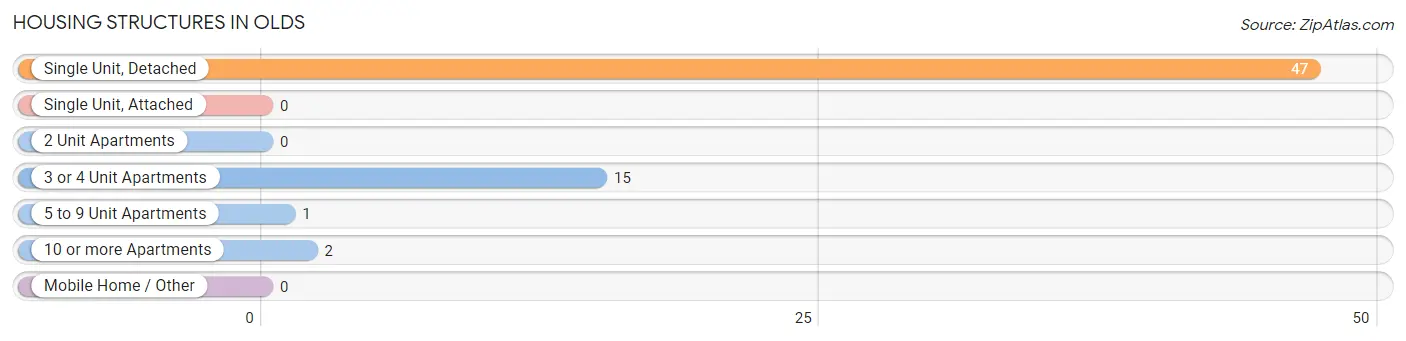
| Structure Type | # Housing Units | % Housing Units |
| Single Unit, Detached | 47 | 72.3% |
| Single Unit, Attached | 0 | 0.0% |
| 2 Unit Apartments | 0 | 0.0% |
| 3 or 4 Unit Apartments | 15 | 23.1% |
| 5 to 9 Unit Apartments | 1 | 1.5% |
| 10 or more Apartments | 2 | 3.1% |
| Mobile Home / Other | 0 | 0.0% |
| Total | 65 | 100.0% |
Housing Structures by Occupancy in Olds
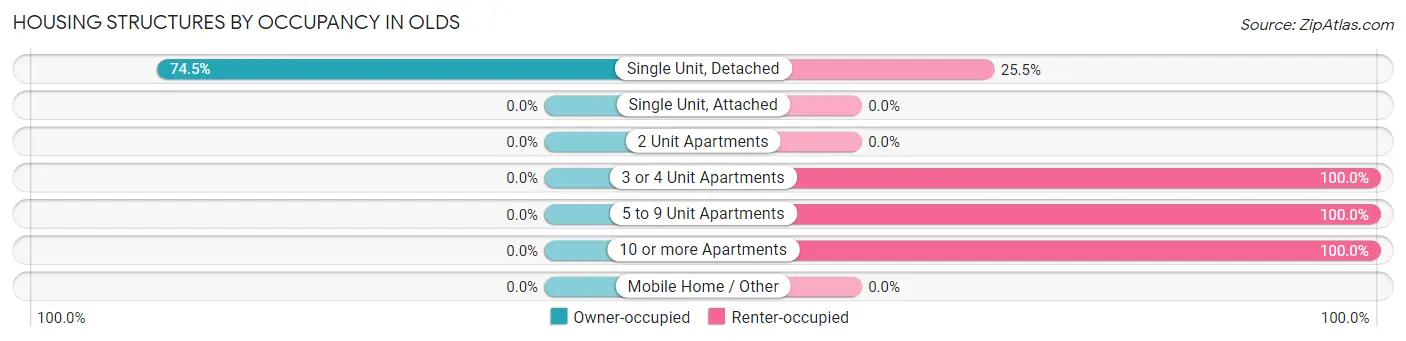
| Structure Type | Owner-occupied | Renter-occupied |
| Single Unit, Detached | 35 (74.5%) | 12 (25.5%) |
| Single Unit, Attached | 0 (0.0%) | 0 (0.0%) |
| 2 Unit Apartments | 0 (0.0%) | 0 (0.0%) |
| 3 or 4 Unit Apartments | 0 (0.0%) | 15 (100.0%) |
| 5 to 9 Unit Apartments | 0 (0.0%) | 1 (100.0%) |
| 10 or more Apartments | 0 (0.0%) | 2 (100.0%) |
| Mobile Home / Other | 0 (0.0%) | 0 (0.0%) |
| Total | 35 (53.8%) | 30 (46.2%) |
Housing Structures by Number of Rooms in Olds
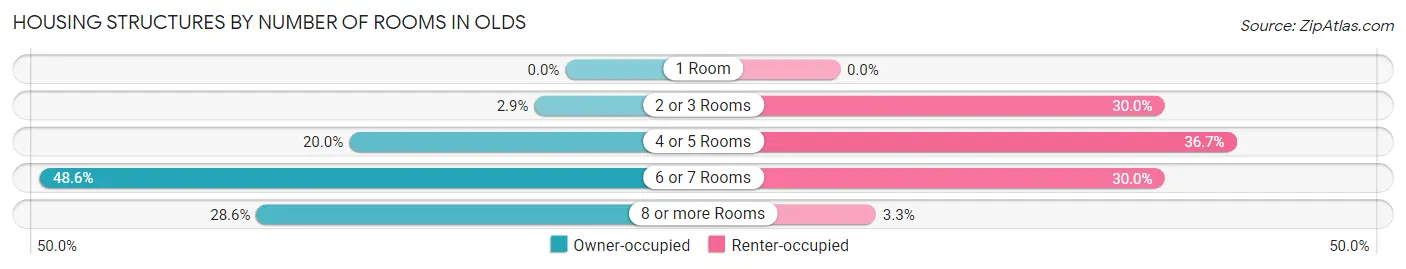
| Number of Rooms | Owner-occupied | Renter-occupied |
| 1 Room | 0 (0.0%) | 0 (0.0%) |
| 2 or 3 Rooms | 1 (2.9%) | 9 (30.0%) |
| 4 or 5 Rooms | 7 (20.0%) | 11 (36.7%) |
| 6 or 7 Rooms | 17 (48.6%) | 9 (30.0%) |
| 8 or more Rooms | 10 (28.6%) | 1 (3.3%) |
| Total | 35 (100.0%) | 30 (100.0%) |
Housing Structure by Heating Type in Olds
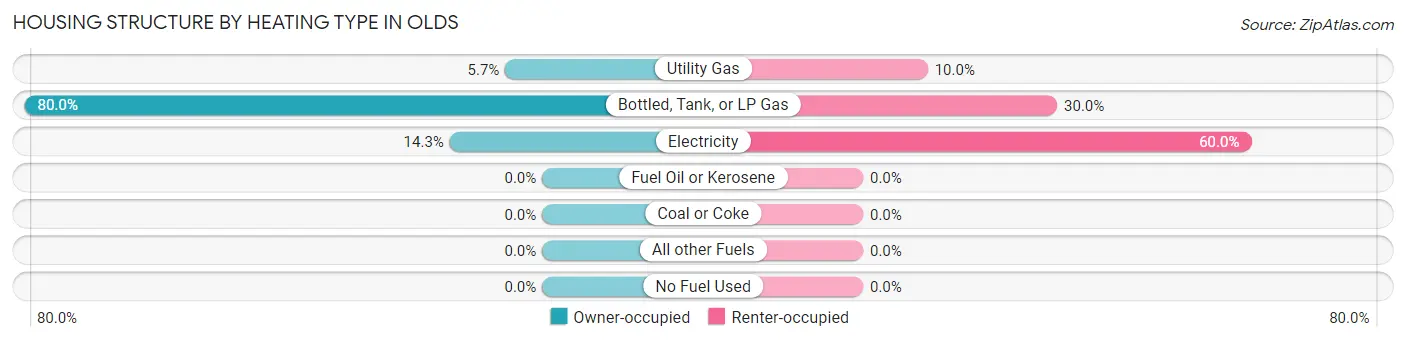
| Heating Type | Owner-occupied | Renter-occupied |
| Utility Gas | 2 (5.7%) | 3 (10.0%) |
| Bottled, Tank, or LP Gas | 28 (80.0%) | 9 (30.0%) |
| Electricity | 5 (14.3%) | 18 (60.0%) |
| Fuel Oil or Kerosene | 0 (0.0%) | 0 (0.0%) |
| Coal or Coke | 0 (0.0%) | 0 (0.0%) |
| All other Fuels | 0 (0.0%) | 0 (0.0%) |
| No Fuel Used | 0 (0.0%) | 0 (0.0%) |
| Total | 35 (100.0%) | 30 (100.0%) |
Household Vehicle Usage in Olds
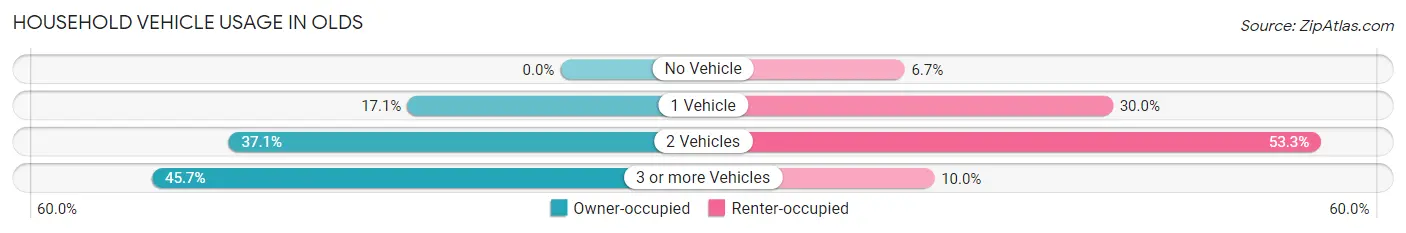
| Vehicles per Household | Owner-occupied | Renter-occupied |
| No Vehicle | 0 (0.0%) | 2 (6.7%) |
| 1 Vehicle | 6 (17.1%) | 9 (30.0%) |
| 2 Vehicles | 13 (37.1%) | 16 (53.3%) |
| 3 or more Vehicles | 16 (45.7%) | 3 (10.0%) |
| Total | 35 (100.0%) | 30 (100.0%) |
Real Estate & Mortgages in Olds
Real Estate and Mortgage Overview in Olds
| Characteristic | Without Mortgage | With Mortgage |
| Housing Units | 19 | 16 |
| Median Property Value | $112,500 | $129,200 |
| Median Household Income | - | - |
| Monthly Housing Costs | $515 | $0 |
| Real Estate Taxes | $1,661 | $2 |
Property Value by Mortgage Status in Olds
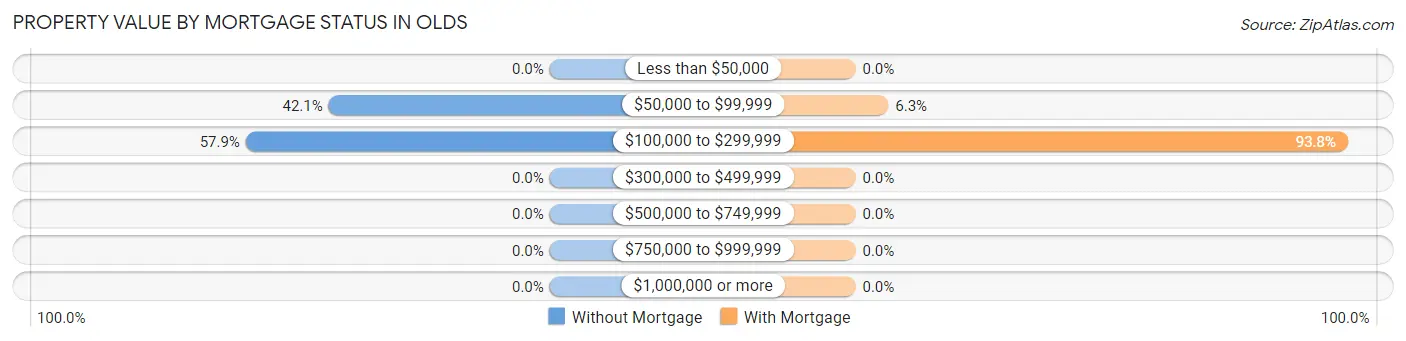
| Property Value | Without Mortgage | With Mortgage |
| Less than $50,000 | 0 (0.0%) | 0 (0.0%) |
| $50,000 to $99,999 | 8 (42.1%) | 1 (6.2%) |
| $100,000 to $299,999 | 11 (57.9%) | 15 (93.8%) |
| $300,000 to $499,999 | 0 (0.0%) | 0 (0.0%) |
| $500,000 to $749,999 | 0 (0.0%) | 0 (0.0%) |
| $750,000 to $999,999 | 0 (0.0%) | 0 (0.0%) |
| $1,000,000 or more | 0 (0.0%) | 0 (0.0%) |
| Total | 19 (100.0%) | 16 (100.0%) |
Household Income by Mortgage Status in Olds
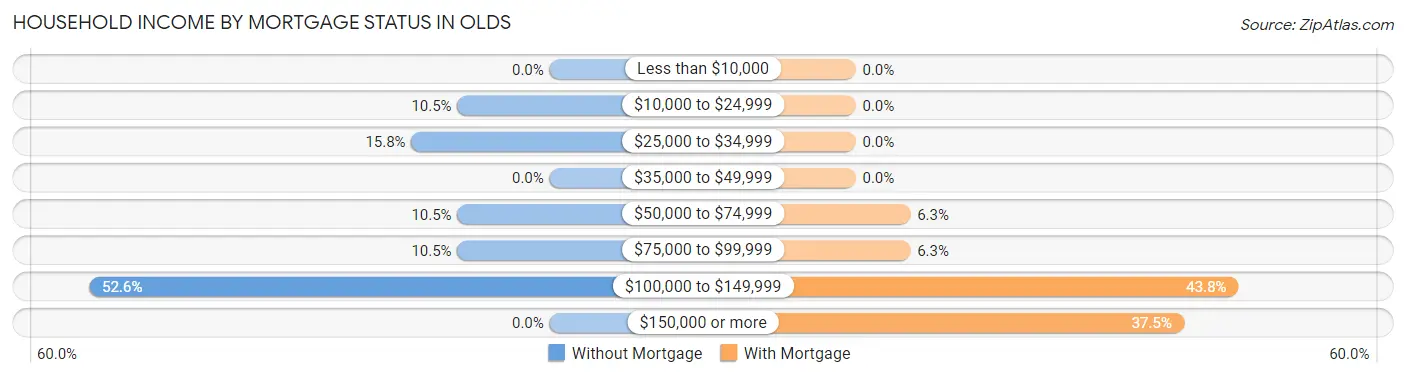
| Household Income | Without Mortgage | With Mortgage |
| Less than $10,000 | 0 (0.0%) | 0 (0.0%) |
| $10,000 to $24,999 | 2 (10.5%) | 0 (0.0%) |
| $25,000 to $34,999 | 3 (15.8%) | 0 (0.0%) |
| $35,000 to $49,999 | 0 (0.0%) | 0 (0.0%) |
| $50,000 to $74,999 | 2 (10.5%) | 1 (6.2%) |
| $75,000 to $99,999 | 2 (10.5%) | 1 (6.2%) |
| $100,000 to $149,999 | 10 (52.6%) | 7 (43.8%) |
| $150,000 or more | 0 (0.0%) | 6 (37.5%) |
| Total | 19 (100.0%) | 16 (100.0%) |
Property Value to Household Income Ratio in Olds
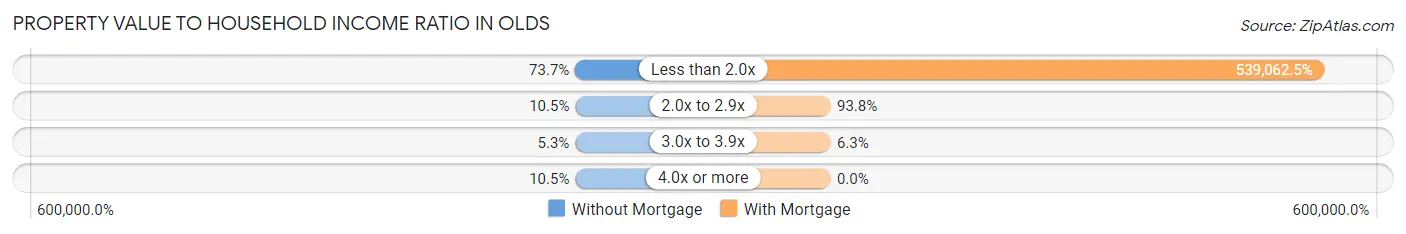
| Value-to-Income Ratio | Without Mortgage | With Mortgage |
| Less than 2.0x | 14 (73.7%) | 86,250 (539,062.5%) |
| 2.0x to 2.9x | 2 (10.5%) | 15 (93.8%) |
| 3.0x to 3.9x | 1 (5.3%) | 1 (6.2%) |
| 4.0x or more | 2 (10.5%) | 0 (0.0%) |
| Total | 19 (100.0%) | 16 (100.0%) |
Real Estate Taxes by Mortgage Status in Olds
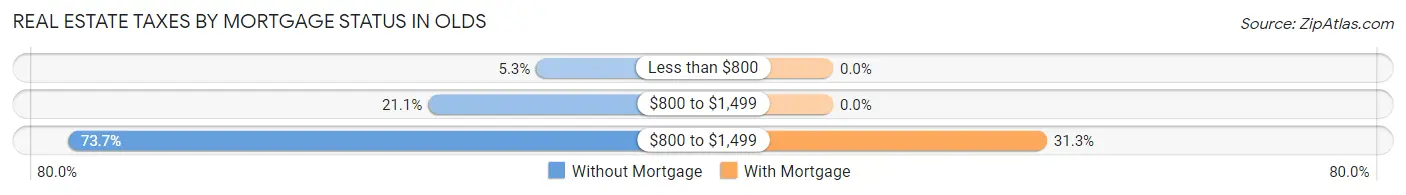
| Property Taxes | Without Mortgage | With Mortgage |
| Less than $800 | 1 (5.3%) | 0 (0.0%) |
| $800 to $1,499 | 4 (21.0%) | 0 (0.0%) |
| $800 to $1,499 | 14 (73.7%) | 5 (31.2%) |
| Total | 19 (100.0%) | 16 (100.0%) |
Health & Disability in Olds
Health Insurance Coverage by Age in Olds
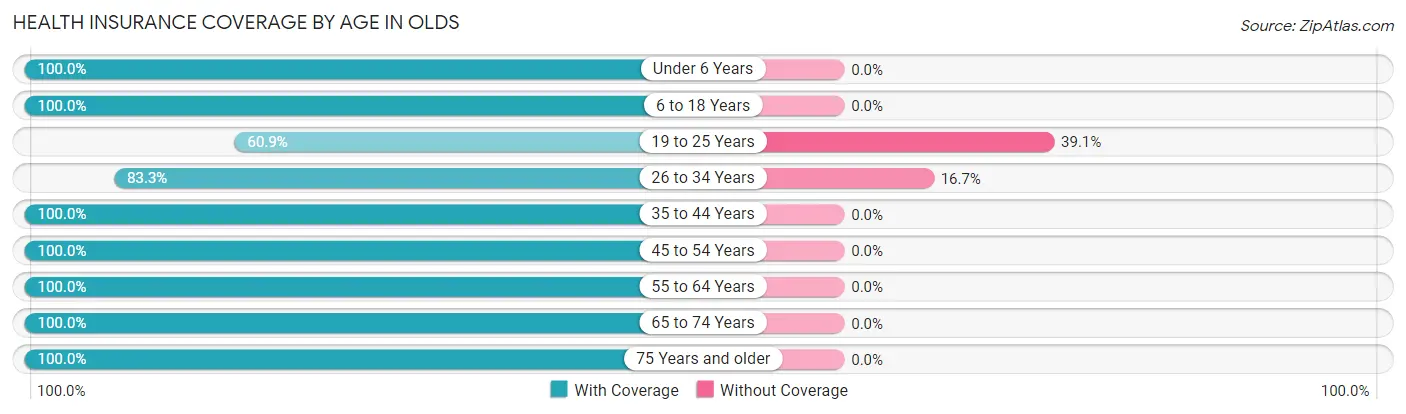
| Age Bracket | With Coverage | Without Coverage |
| Under 6 Years | 7 (100.0%) | 0 (0.0%) |
| 6 to 18 Years | 30 (100.0%) | 0 (0.0%) |
| 19 to 25 Years | 14 (60.9%) | 9 (39.1%) |
| 26 to 34 Years | 15 (83.3%) | 3 (16.7%) |
| 35 to 44 Years | 24 (100.0%) | 0 (0.0%) |
| 45 to 54 Years | 9 (100.0%) | 0 (0.0%) |
| 55 to 64 Years | 27 (100.0%) | 0 (0.0%) |
| 65 to 74 Years | 6 (100.0%) | 0 (0.0%) |
| 75 Years and older | 6 (100.0%) | 0 (0.0%) |
| Total | 138 (92.0%) | 12 (8.0%) |
Health Insurance Coverage by Citizenship Status in Olds
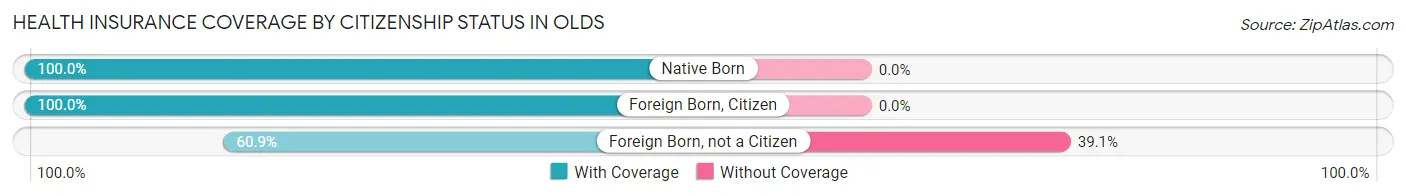
| Citizenship Status | With Coverage | Without Coverage |
| Native Born | 7 (100.0%) | 0 (0.0%) |
| Foreign Born, Citizen | 30 (100.0%) | 0 (0.0%) |
| Foreign Born, not a Citizen | 14 (60.9%) | 9 (39.1%) |
Health Insurance Coverage by Household Income in Olds
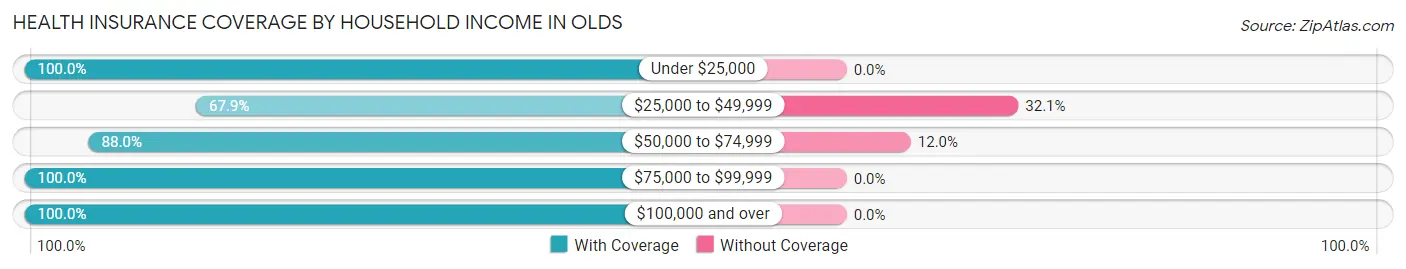
| Household Income | With Coverage | Without Coverage |
| Under $25,000 | 19 (100.0%) | 0 (0.0%) |
| $25,000 to $49,999 | 19 (67.9%) | 9 (32.1%) |
| $50,000 to $74,999 | 22 (88.0%) | 3 (12.0%) |
| $75,000 to $99,999 | 42 (100.0%) | 0 (0.0%) |
| $100,000 and over | 36 (100.0%) | 0 (0.0%) |
Public vs Private Health Insurance Coverage by Age in Olds
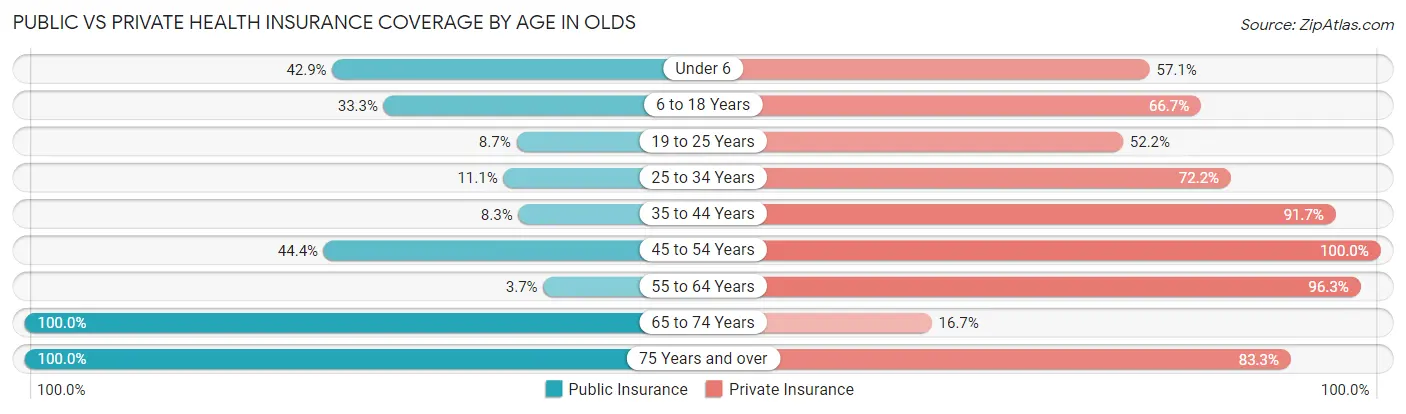
| Age Bracket | Public Insurance | Private Insurance |
| Under 6 | 3 (42.9%) | 4 (57.1%) |
| 6 to 18 Years | 10 (33.3%) | 20 (66.7%) |
| 19 to 25 Years | 2 (8.7%) | 12 (52.2%) |
| 25 to 34 Years | 2 (11.1%) | 13 (72.2%) |
| 35 to 44 Years | 2 (8.3%) | 22 (91.7%) |
| 45 to 54 Years | 4 (44.4%) | 9 (100.0%) |
| 55 to 64 Years | 1 (3.7%) | 26 (96.3%) |
| 65 to 74 Years | 6 (100.0%) | 1 (16.7%) |
| 75 Years and over | 6 (100.0%) | 5 (83.3%) |
| Total | 36 (24.0%) | 112 (74.7%) |
Disability Status by Sex by Age in Olds
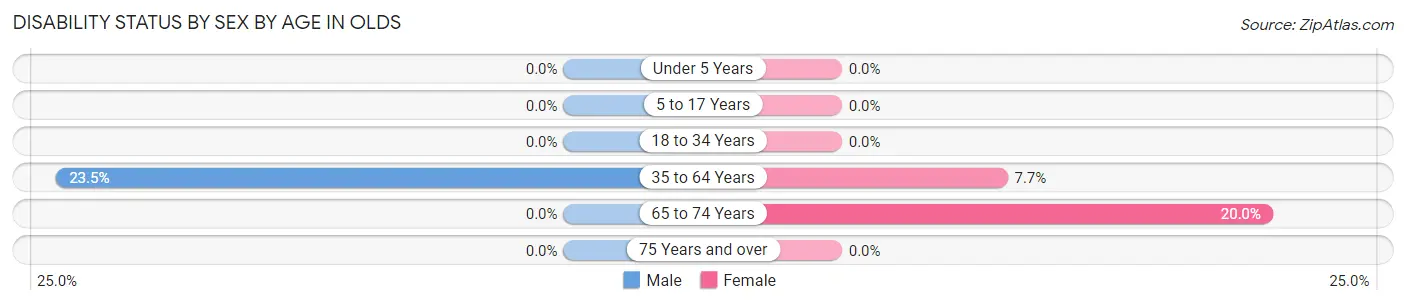
| Age Bracket | Male | Female |
| Under 5 Years | 0 (0.0%) | 0 (0.0%) |
| 5 to 17 Years | 0 (0.0%) | 0 (0.0%) |
| 18 to 34 Years | 0 (0.0%) | 0 (0.0%) |
| 35 to 64 Years | 8 (23.5%) | 2 (7.7%) |
| 65 to 74 Years | 0 (0.0%) | 1 (20.0%) |
| 75 Years and over | 0 (0.0%) | 0 (0.0%) |
Disability Class by Sex by Age in Olds
Disability Class: Hearing Difficulty
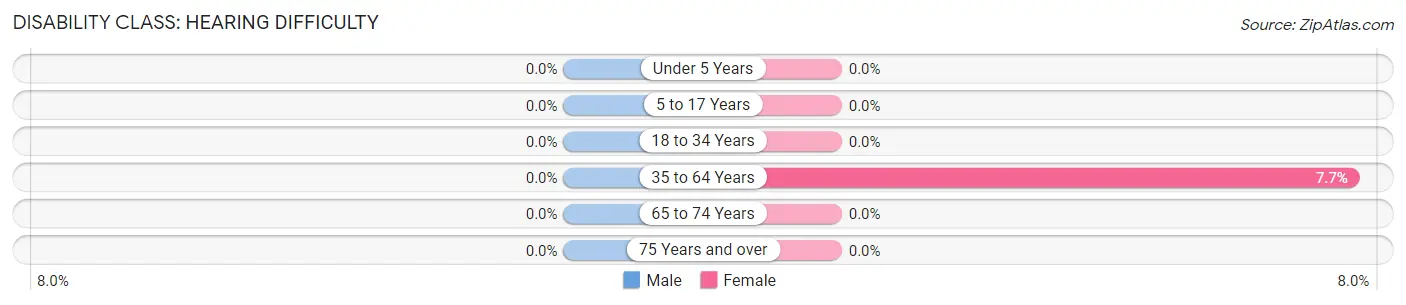
| Age Bracket | Male | Female |
| Under 5 Years | 0 (0.0%) | 0 (0.0%) |
| 5 to 17 Years | 0 (0.0%) | 0 (0.0%) |
| 18 to 34 Years | 0 (0.0%) | 0 (0.0%) |
| 35 to 64 Years | 0 (0.0%) | 2 (7.7%) |
| 65 to 74 Years | 0 (0.0%) | 0 (0.0%) |
| 75 Years and over | 0 (0.0%) | 0 (0.0%) |
Disability Class: Vision Difficulty
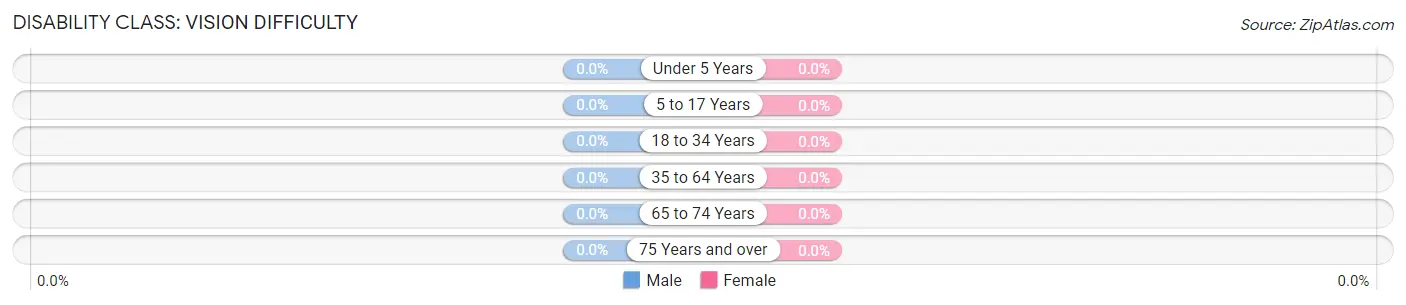
| Age Bracket | Male | Female |
| Under 5 Years | 0 (0.0%) | 0 (0.0%) |
| 5 to 17 Years | 0 (0.0%) | 0 (0.0%) |
| 18 to 34 Years | 0 (0.0%) | 0 (0.0%) |
| 35 to 64 Years | 0 (0.0%) | 0 (0.0%) |
| 65 to 74 Years | 0 (0.0%) | 0 (0.0%) |
| 75 Years and over | 0 (0.0%) | 0 (0.0%) |
Disability Class: Cognitive Difficulty
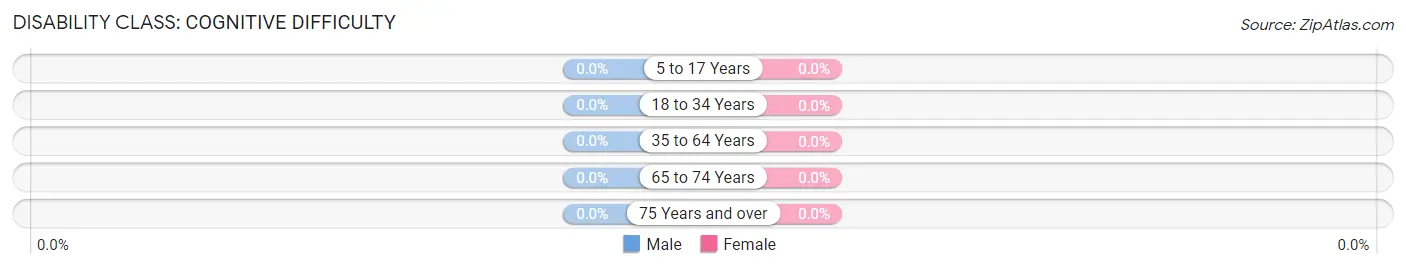
| Age Bracket | Male | Female |
| 5 to 17 Years | 0 (0.0%) | 0 (0.0%) |
| 18 to 34 Years | 0 (0.0%) | 0 (0.0%) |
| 35 to 64 Years | 0 (0.0%) | 0 (0.0%) |
| 65 to 74 Years | 0 (0.0%) | 0 (0.0%) |
| 75 Years and over | 0 (0.0%) | 0 (0.0%) |
Disability Class: Ambulatory Difficulty
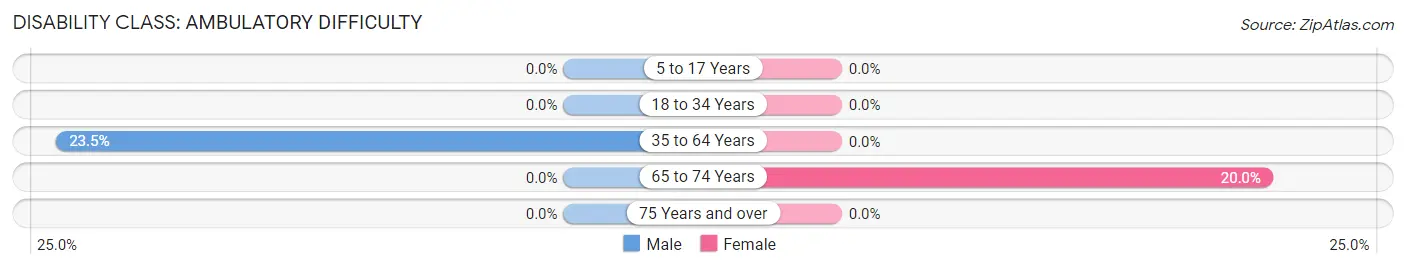
| Age Bracket | Male | Female |
| 5 to 17 Years | 0 (0.0%) | 0 (0.0%) |
| 18 to 34 Years | 0 (0.0%) | 0 (0.0%) |
| 35 to 64 Years | 8 (23.5%) | 0 (0.0%) |
| 65 to 74 Years | 0 (0.0%) | 1 (20.0%) |
| 75 Years and over | 0 (0.0%) | 0 (0.0%) |
Disability Class: Self-Care Difficulty
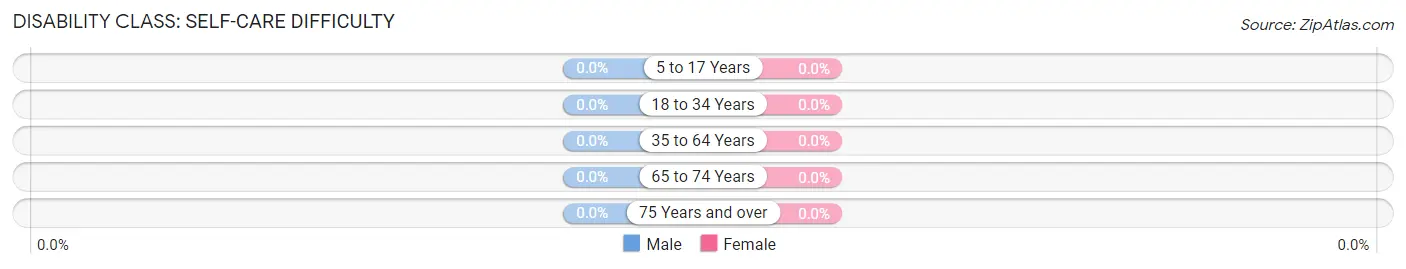
| Age Bracket | Male | Female |
| 5 to 17 Years | 0 (0.0%) | 0 (0.0%) |
| 18 to 34 Years | 0 (0.0%) | 0 (0.0%) |
| 35 to 64 Years | 0 (0.0%) | 0 (0.0%) |
| 65 to 74 Years | 0 (0.0%) | 0 (0.0%) |
| 75 Years and over | 0 (0.0%) | 0 (0.0%) |
Technology Access in Olds
Computing Device Access in Olds
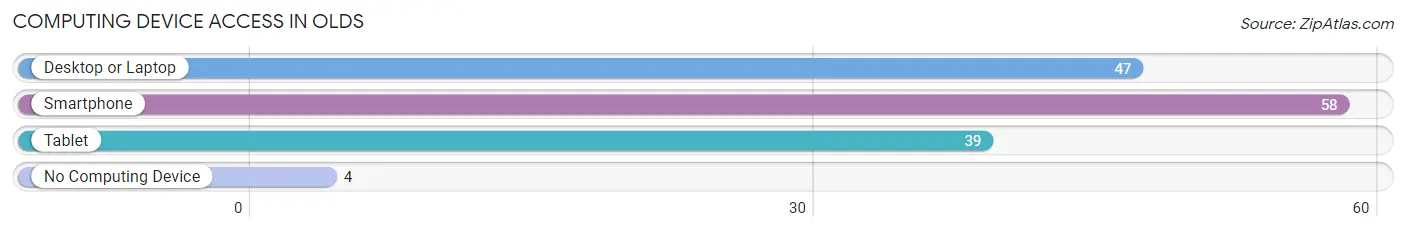
| Device Type | # Households | % Households |
| Desktop or Laptop | 47 | 72.3% |
| Smartphone | 58 | 89.2% |
| Tablet | 39 | 60.0% |
| No Computing Device | 4 | 6.1% |
| Total | 65 | 100.0% |
Internet Access in Olds
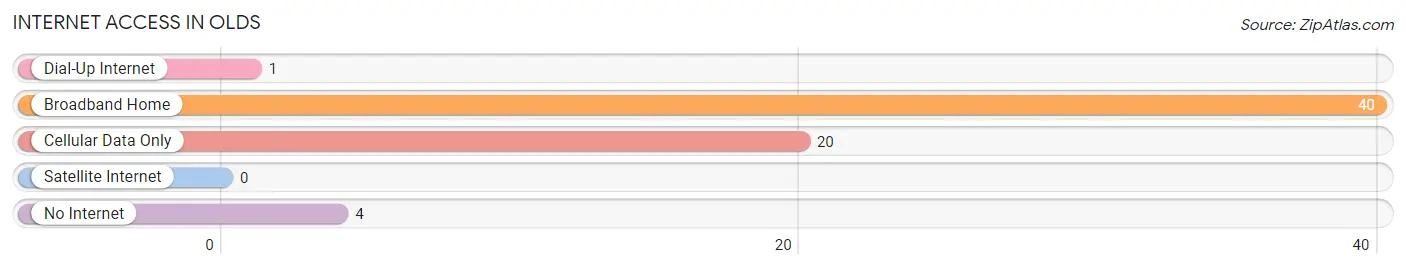
| Internet Type | # Households | % Households |
| Dial-Up Internet | 1 | 1.5% |
| Broadband Home | 40 | 61.5% |
| Cellular Data Only | 20 | 30.8% |
| Satellite Internet | 0 | 0.0% |
| No Internet | 4 | 6.1% |
| Total | 65 | 100.0% |
Olds Summary
Olds, Iowa is a small town located in the northwest corner of Iowa, in the county of Plymouth. It is situated on the banks of the Floyd River, and is surrounded by rolling hills and farmland. The town was founded in 1856 by a group of settlers from New York, and was named after one of the settlers, John Olds.
Olds has a population of just over 500 people, and is a predominantly white community. The median household income is $41,000, and the median age is 44. The town is served by two schools, Olds Elementary and Olds High School, and is home to a number of small businesses.
Geographically, Olds is located in the northwest corner of Iowa, in the county of Plymouth. It is situated on the banks of the Floyd River, and is surrounded by rolling hills and farmland. The town is located approximately 30 miles from Sioux City, and is within easy driving distance of Omaha, Nebraska.
The economy of Olds is largely based on agriculture. The town is home to a number of small farms, and the surrounding area is known for its production of corn, soybeans, and hogs. In addition, Olds is home to a number of small businesses, including a grocery store, a hardware store, and a restaurant.
Olds is a small, rural community with a strong sense of community. The town is home to a number of churches, and there are a number of community events held throughout the year. The town is also home to a number of recreational activities, including fishing, hunting, and camping.
Olds is a small town with a rich history and a strong sense of community. The town is home to a number of small businesses, and the surrounding area is known for its production of corn, soybeans, and hogs. The town is also home to a number of recreational activities, and is within easy driving distance of Omaha, Nebraska. Olds is a great place to live and work, and is a great example of a small town in Iowa.
Common Questions
What is Per Capita Income in Olds?
Per Capita income in Olds is $30,274.
What is the Median Family Income in Olds?
Median Family Income in Olds is $87,500.
What is the Median Household income in Olds?
Median Household Income in Olds is $64,583.
What is Income or Wage Gap in Olds?
Income or Wage Gap in Olds is 38.4%.
Women in Olds earn 61.6 cents for every dollar earned by a man.
What is Inequality or Gini Index in Olds?
Inequality or Gini Index in Olds is 0.33.
What is the Total Population of Olds?
Total Population of Olds is 150.
What is the Total Male Population of Olds?
Total Male Population of Olds is 84.
What is the Total Female Population of Olds?
Total Female Population of Olds is 66.
What is the Ratio of Males per 100 Females in Olds?
There are 127.27 Males per 100 Females in Olds.
What is the Ratio of Females per 100 Males in Olds?
There are 78.57 Females per 100 Males in Olds.
What is the Median Population Age in Olds?
Median Population Age in Olds is 33.4 Years.
What is the Average Family Size in Olds
Average Family Size in Olds is 2.9 People.
What is the Average Household Size in Olds
Average Household Size in Olds is 2.3 People.
How Large is the Labor Force in Olds?
There are 91 People in the Labor Forcein in Olds.
What is the Percentage of People in the Labor Force in Olds?
80.5% of People are in the Labor Force in Olds.