Little Sioux, IA Map & Demographics
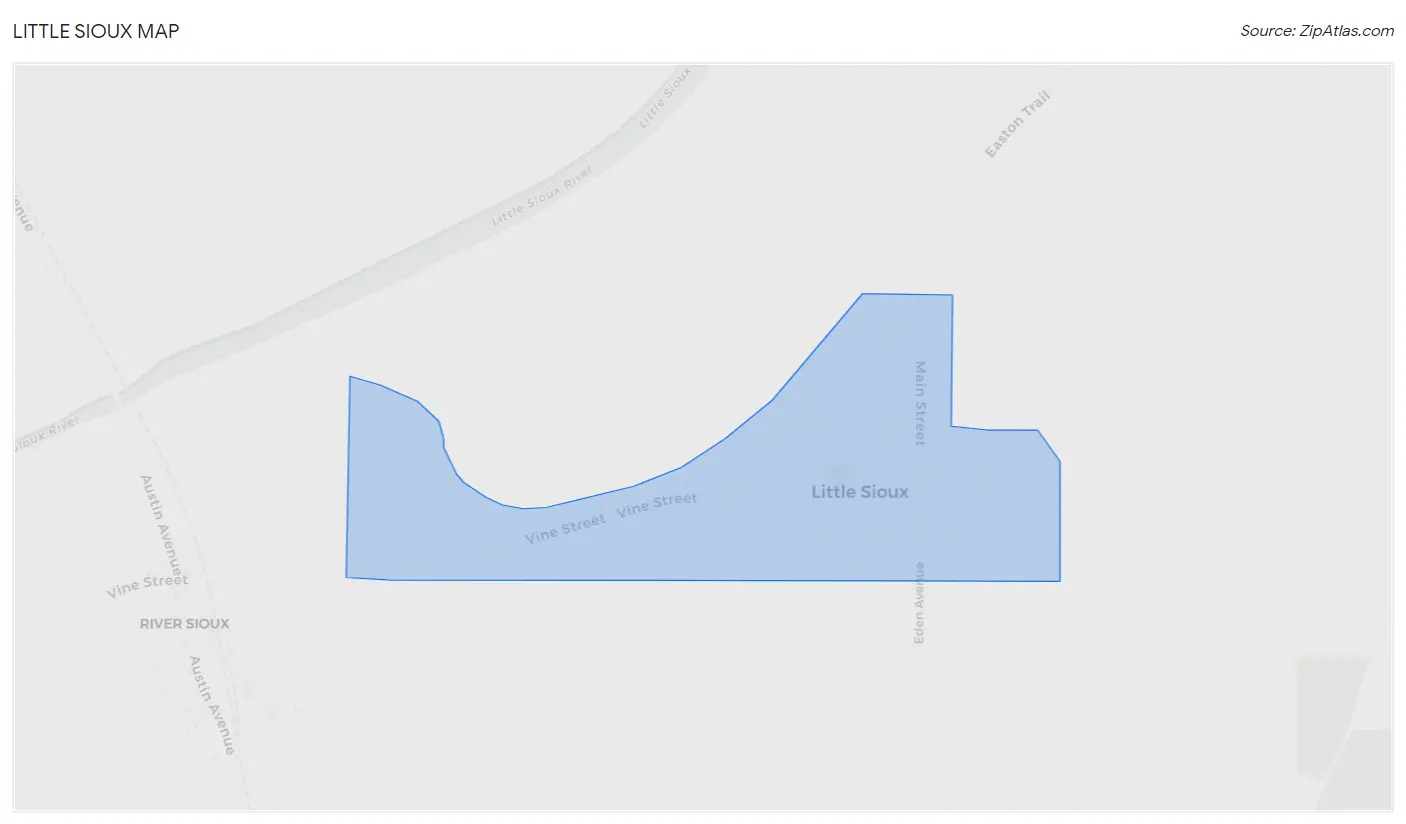
Little Sioux Map
Little Sioux Overview
$18,116
PER CAPITA INCOME
$60,625
AVG FAMILY INCOME
$38,000
AVG HOUSEHOLD INCOME
0.48
INEQUALITY / GINI INDEX
179
TOTAL POPULATION
79
MALE POPULATION
100
FEMALE POPULATION
79.00
MALES / 100 FEMALES
126.58
FEMALES / 100 MALES
40.4
MEDIAN AGE
4.1
AVG FAMILY SIZE
2.5
AVG HOUSEHOLD SIZE
51
LABOR FORCE [ PEOPLE ]
43.6%
PERCENT IN LABOR FORCE
Little Sioux Zip Codes
Little Sioux Area Codes
Income in Little Sioux
Income Overview in Little Sioux
Per Capita Income in Little Sioux is $18,116, while median incomes of families and households are $60,625 and $38,000 respectively.
| Characteristic | Number | Measure |
| Per Capita Income | 179 | $18,116 |
| Median Family Income | 32 | $60,625 |
| Mean Family Income | 32 | $66,359 |
| Median Household Income | 72 | $38,000 |
| Mean Household Income | 72 | $45,151 |
| Income Deficit | 32 | $0 |
| Wage / Income Gap (%) | 179 | 0.00% |
| Wage / Income Gap ($) | 179 | 100.00¢ per $1 |
| Gini / Inequality Index | 179 | 0.48 |
Earnings by Sex in Little Sioux
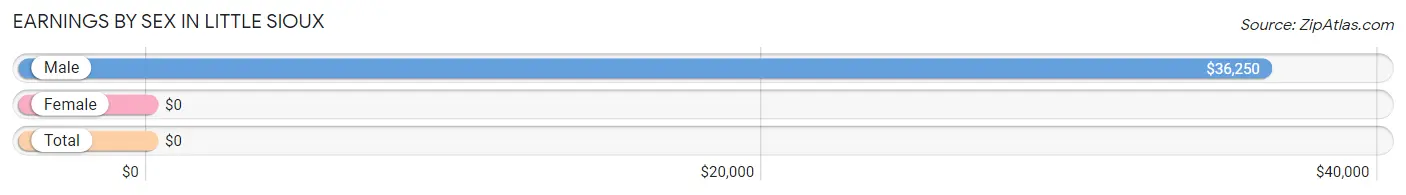
| Sex | Number | Average Earnings |
| Male | 18 (34.0%) | $36,250 |
| Female | 35 (66.0%) | $0 |
| Total | 53 (100.0%) | $0 |
Earnings by Sex by Income Bracket in Little Sioux
The most common earnings brackets in Little Sioux are $40,000 to $44,999 for men (5 | 27.8%) and $2,500 to $4,999 for women (8 | 22.9%).
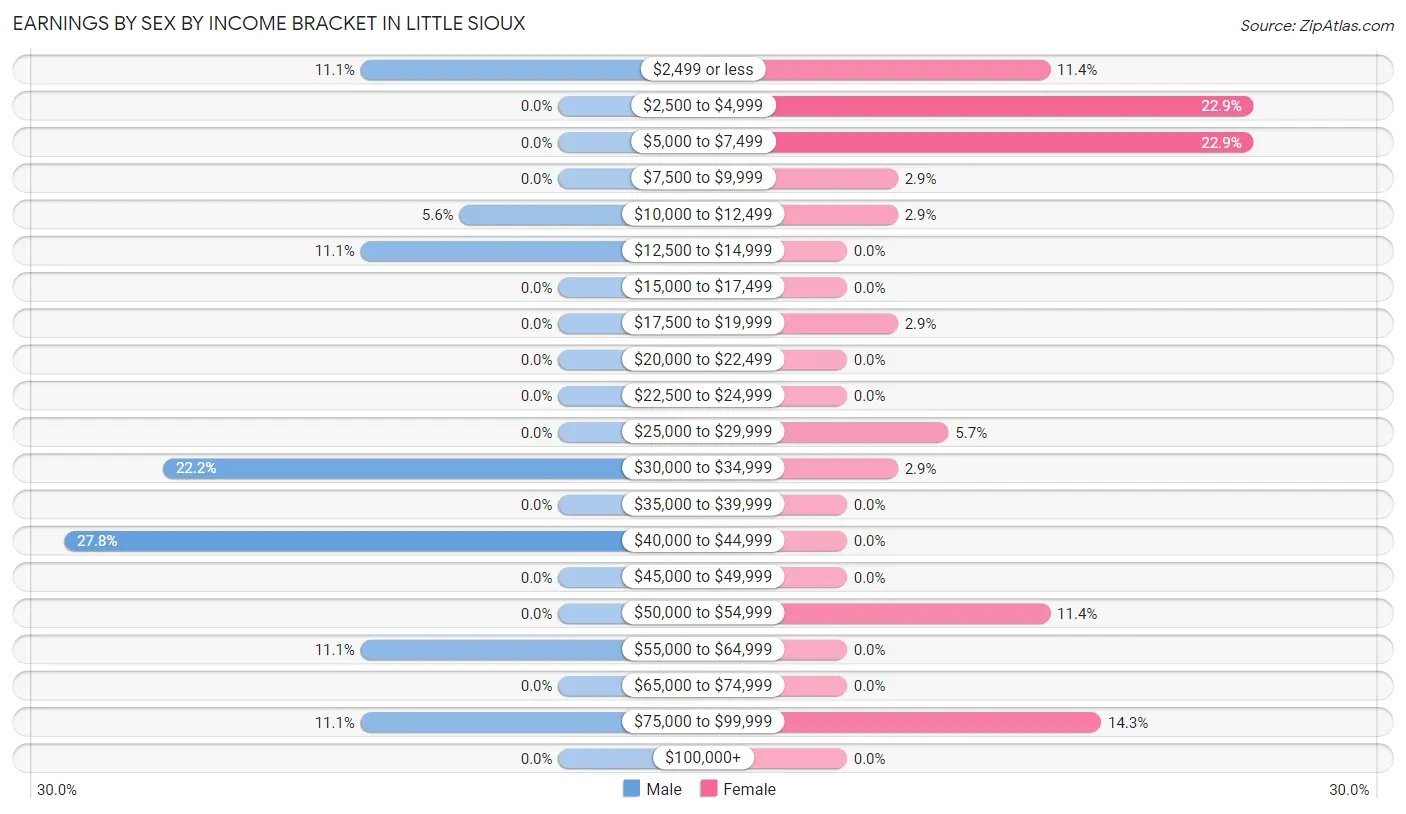
| Income | Male | Female |
| $2,499 or less | 2 (11.1%) | 4 (11.4%) |
| $2,500 to $4,999 | 0 (0.0%) | 8 (22.9%) |
| $5,000 to $7,499 | 0 (0.0%) | 8 (22.9%) |
| $7,500 to $9,999 | 0 (0.0%) | 1 (2.9%) |
| $10,000 to $12,499 | 1 (5.6%) | 1 (2.9%) |
| $12,500 to $14,999 | 2 (11.1%) | 0 (0.0%) |
| $15,000 to $17,499 | 0 (0.0%) | 0 (0.0%) |
| $17,500 to $19,999 | 0 (0.0%) | 1 (2.9%) |
| $20,000 to $22,499 | 0 (0.0%) | 0 (0.0%) |
| $22,500 to $24,999 | 0 (0.0%) | 0 (0.0%) |
| $25,000 to $29,999 | 0 (0.0%) | 2 (5.7%) |
| $30,000 to $34,999 | 4 (22.2%) | 1 (2.9%) |
| $35,000 to $39,999 | 0 (0.0%) | 0 (0.0%) |
| $40,000 to $44,999 | 5 (27.8%) | 0 (0.0%) |
| $45,000 to $49,999 | 0 (0.0%) | 0 (0.0%) |
| $50,000 to $54,999 | 0 (0.0%) | 4 (11.4%) |
| $55,000 to $64,999 | 2 (11.1%) | 0 (0.0%) |
| $65,000 to $74,999 | 0 (0.0%) | 0 (0.0%) |
| $75,000 to $99,999 | 2 (11.1%) | 5 (14.3%) |
| $100,000+ | 0 (0.0%) | 0 (0.0%) |
| Total | 18 (100.0%) | 35 (100.0%) |
Earnings by Sex by Educational Attainment in Little Sioux
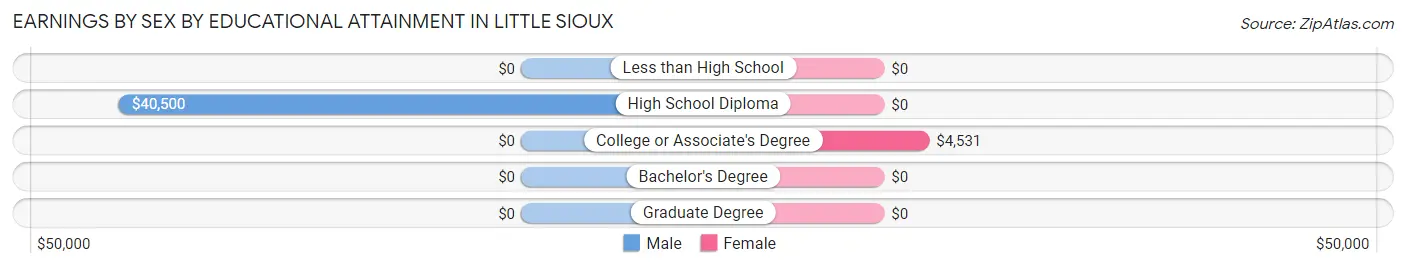
| Educational Attainment | Male Income | Female Income |
| Less than High School | - | - |
| High School Diploma | $40,500 | $0 |
| College or Associate's Degree | - | - |
| Bachelor's Degree | - | - |
| Graduate Degree | - | - |
| Total | $36,250 | $0 |
Family Income in Little Sioux
Family Income Brackets in Little Sioux
According to the Little Sioux family income data, there are 8 families falling into the $35,000 to $49,999 income range, which is the most common income bracket and makes up 25.0% of all families.
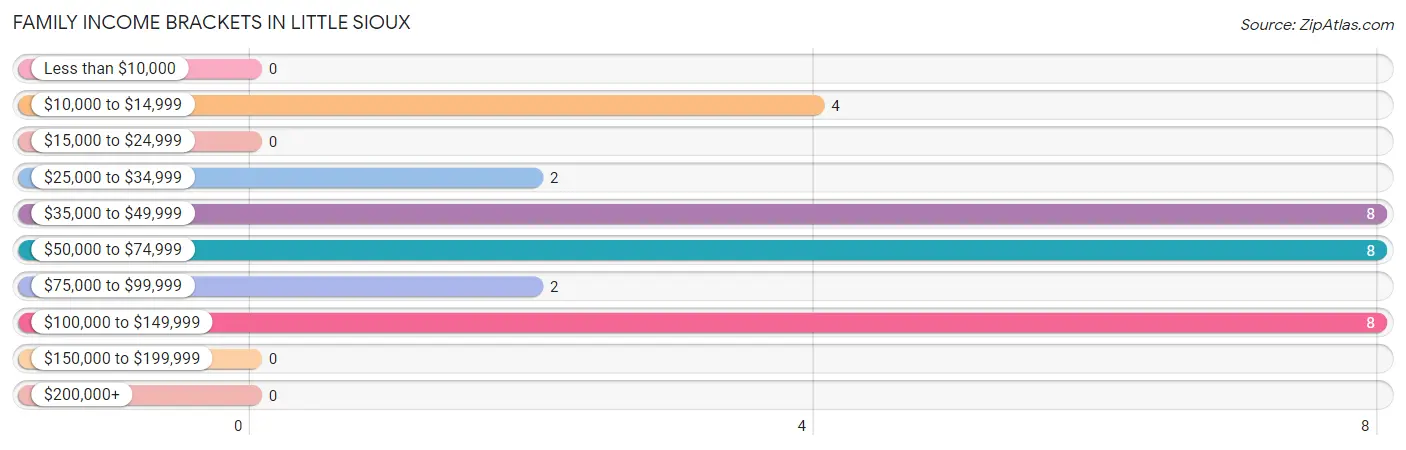
| Income Bracket | # Families | % Families |
| Less than $10,000 | 0 | 0.0% |
| $10,000 to $14,999 | 4 | 12.5% |
| $15,000 to $24,999 | 0 | 0.0% |
| $25,000 to $34,999 | 2 | 6.3% |
| $35,000 to $49,999 | 8 | 25.0% |
| $50,000 to $74,999 | 8 | 25.0% |
| $75,000 to $99,999 | 2 | 6.3% |
| $100,000 to $149,999 | 8 | 25.0% |
| $150,000 to $199,999 | 0 | 0.0% |
| $200,000+ | 0 | 0.0% |
Family Income by Famaliy Size in Little Sioux
4-person families (10 | 31.2%) account for the highest median family income in Little Sioux with $108,750 per family, while 4-person families (10 | 31.2%) have the highest median income of $27,188 per family member.
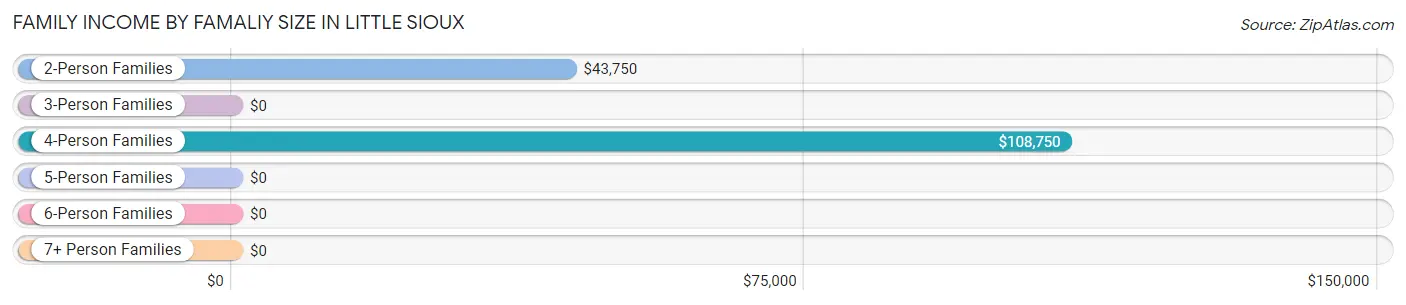
| Income Bracket | # Families | Median Income |
| 2-Person Families | 13 (40.6%) | $43,750 |
| 3-Person Families | 1 (3.1%) | $0 |
| 4-Person Families | 10 (31.2%) | $108,750 |
| 5-Person Families | 0 (0.0%) | $0 |
| 6-Person Families | 6 (18.8%) | $0 |
| 7+ Person Families | 2 (6.2%) | $0 |
| Total | 32 (100.0%) | $60,625 |
Family Income by Number of Earners in Little Sioux
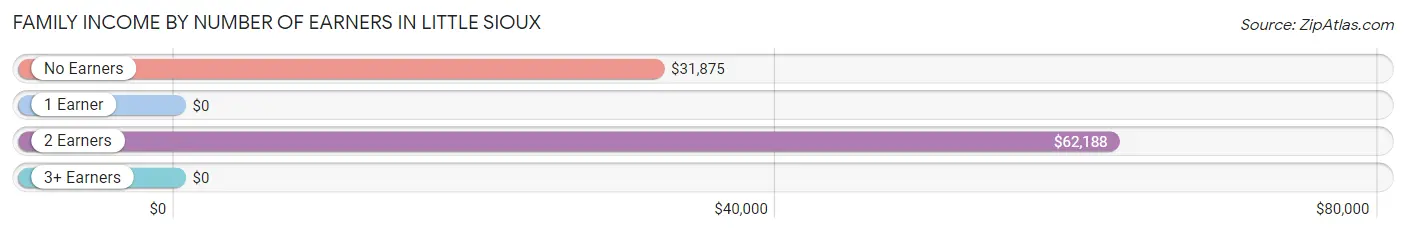
| Number of Earners | # Families | Median Income |
| No Earners | 11 (34.4%) | $31,875 |
| 1 Earner | 10 (31.2%) | $0 |
| 2 Earners | 11 (34.4%) | $62,188 |
| 3+ Earners | 0 (0.0%) | $0 |
| Total | 32 (100.0%) | $60,625 |
Household Income in Little Sioux
Household Income Brackets in Little Sioux
With 16 households falling in the category, the less than $10,000 income range is the most frequent in Little Sioux, accounting for 22.2% of all households.
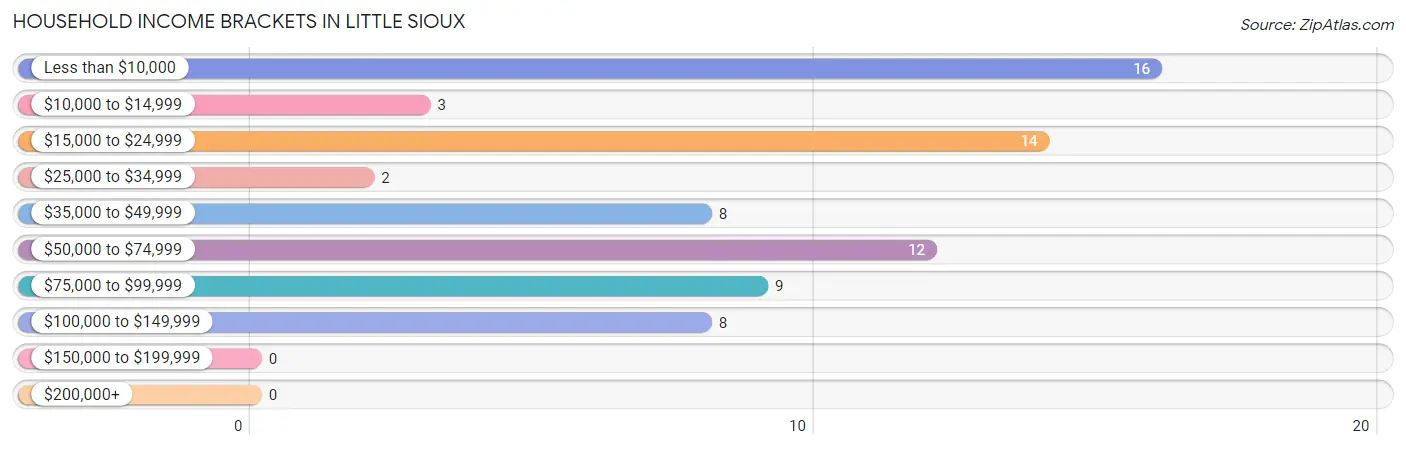
| Income Bracket | # Households | % Households |
| Less than $10,000 | 16 | 22.2% |
| $10,000 to $14,999 | 3 | 4.2% |
| $15,000 to $24,999 | 14 | 19.4% |
| $25,000 to $34,999 | 2 | 2.8% |
| $35,000 to $49,999 | 8 | 11.1% |
| $50,000 to $74,999 | 12 | 16.7% |
| $75,000 to $99,999 | 9 | 12.5% |
| $100,000 to $149,999 | 8 | 11.1% |
| $150,000 to $199,999 | 0 | 0.0% |
| $200,000+ | 0 | 0.0% |
Household Income by Householder Age in Little Sioux
The median household income in Little Sioux is $38,000, with the highest median household income of $60,938 found in the 25 to 44 years age bracket for the primary householder. A total of 17 households (23.6%) fall into this category.
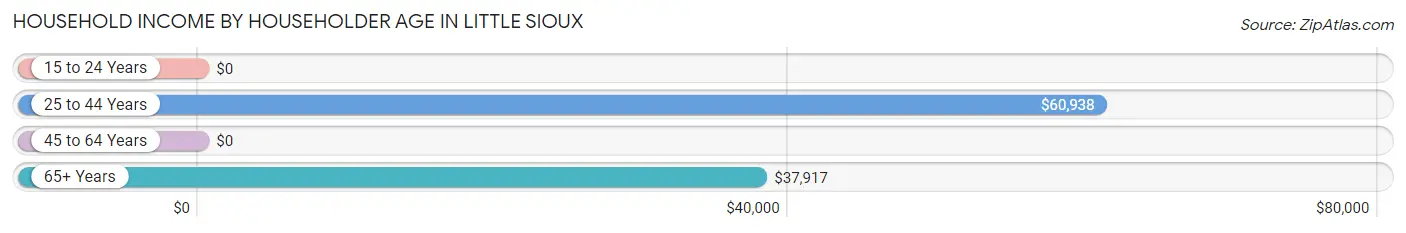
| Income Bracket | # Households | Median Income |
| 15 to 24 Years | 0 (0.0%) | $0 |
| 25 to 44 Years | 17 (23.6%) | $60,938 |
| 45 to 64 Years | 24 (33.3%) | $0 |
| 65+ Years | 31 (43.1%) | $37,917 |
| Total | 72 (100.0%) | $38,000 |
Poverty in Little Sioux
Income Below Poverty by Sex and Age in Little Sioux
With 16.5% poverty level for males and 20.0% for females among the residents of Little Sioux, 45 to 54 year old males and 25 to 34 year old females are the most vulnerable to poverty, with 3 males (37.5%) and 2 females (100.0%) in their respective age groups living below the poverty level.
| Age Bracket | Male | Female |
| Under 5 Years | 0 (0.0%) | 1 (10.0%) |
| 5 Years | 0 (0.0%) | 0 (0.0%) |
| 6 to 11 Years | 2 (15.4%) | 1 (9.1%) |
| 12 to 14 Years | 3 (17.6%) | 0 (0.0%) |
| 15 Years | 0 (0.0%) | 0 (0.0%) |
| 16 and 17 Years | 0 (0.0%) | 0 (0.0%) |
| 18 to 24 Years | 0 (0.0%) | 0 (0.0%) |
| 25 to 34 Years | 0 (0.0%) | 2 (100.0%) |
| 35 to 44 Years | 4 (30.8%) | 1 (4.8%) |
| 45 to 54 Years | 3 (37.5%) | 0 (0.0%) |
| 55 to 64 Years | 0 (0.0%) | 9 (64.3%) |
| 65 to 74 Years | 1 (10.0%) | 4 (26.7%) |
| 75 Years and over | 0 (0.0%) | 2 (18.2%) |
| Total | 13 (16.5%) | 20 (20.0%) |
Income Above Poverty by Sex and Age in Little Sioux
According to the poverty statistics in Little Sioux, males aged under 5 years and females aged 12 to 14 years are the age groups that are most secure financially, with 100.0% of males and 100.0% of females in these age groups living above the poverty line.
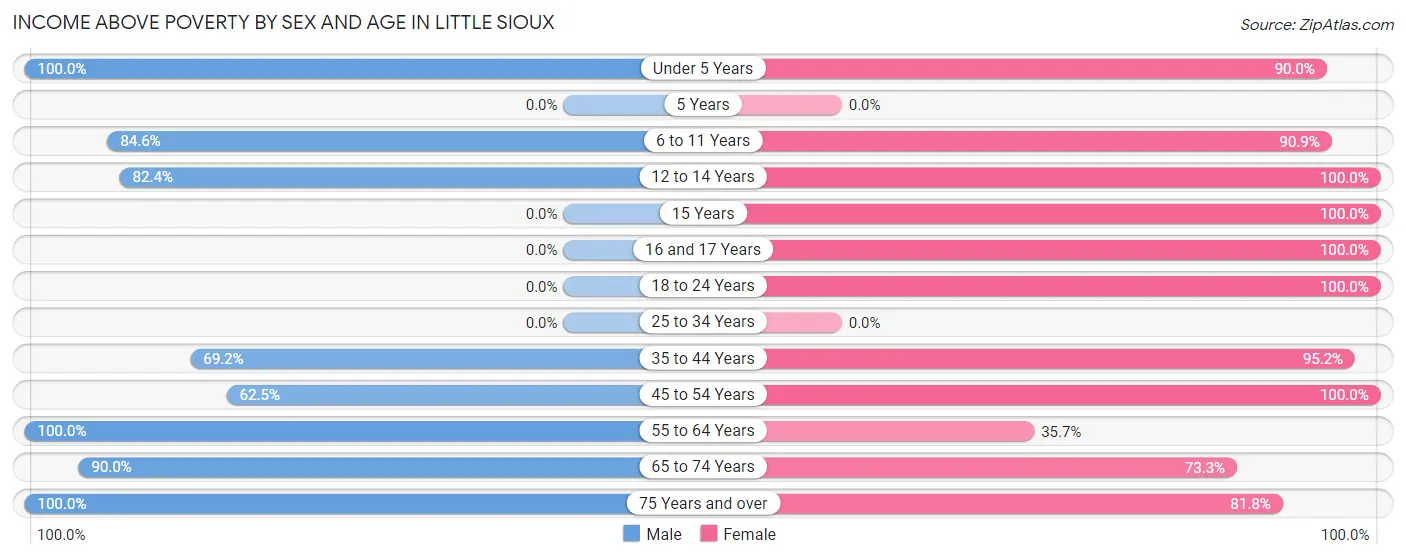
| Age Bracket | Male | Female |
| Under 5 Years | 4 (100.0%) | 9 (90.0%) |
| 5 Years | 0 (0.0%) | 0 (0.0%) |
| 6 to 11 Years | 11 (84.6%) | 10 (90.9%) |
| 12 to 14 Years | 14 (82.4%) | 4 (100.0%) |
| 15 Years | 0 (0.0%) | 3 (100.0%) |
| 16 and 17 Years | 0 (0.0%) | 4 (100.0%) |
| 18 to 24 Years | 0 (0.0%) | 4 (100.0%) |
| 25 to 34 Years | 0 (0.0%) | 0 (0.0%) |
| 35 to 44 Years | 9 (69.2%) | 20 (95.2%) |
| 45 to 54 Years | 5 (62.5%) | 1 (100.0%) |
| 55 to 64 Years | 4 (100.0%) | 5 (35.7%) |
| 65 to 74 Years | 9 (90.0%) | 11 (73.3%) |
| 75 Years and over | 10 (100.0%) | 9 (81.8%) |
| Total | 66 (83.5%) | 80 (80.0%) |
Income Below Poverty Among Married-Couple Families in Little Sioux
The poverty statistics for married-couple families in Little Sioux show that 9.1% or 2 of the total 22 families live below the poverty line. Families with 1 or 2 children have the highest poverty rate of 20.0%, comprising of 1 families. On the other hand, families with 3 or 4 children have the lowest poverty rate of 0.0%, which includes 0 families.
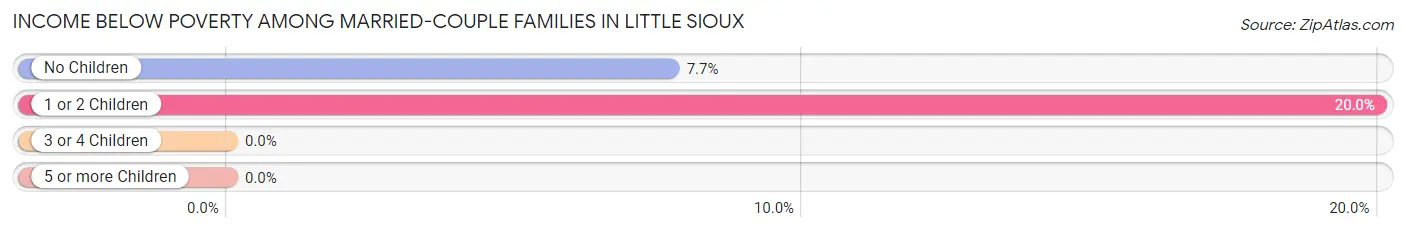
| Children | Above Poverty | Below Poverty |
| No Children | 12 (92.3%) | 1 (7.7%) |
| 1 or 2 Children | 4 (80.0%) | 1 (20.0%) |
| 3 or 4 Children | 2 (100.0%) | 0 (0.0%) |
| 5 or more Children | 2 (100.0%) | 0 (0.0%) |
| Total | 20 (90.9%) | 2 (9.1%) |
Income Below Poverty Among Single-Parent Households in Little Sioux
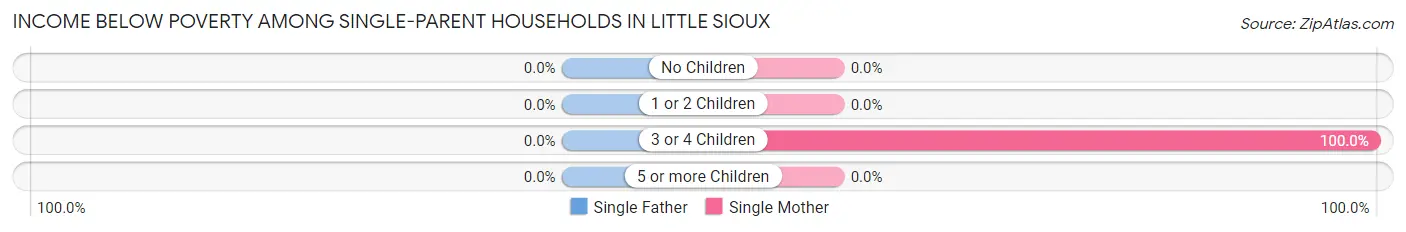
| Children | Single Father | Single Mother |
| No Children | 0 (0.0%) | 0 (0.0%) |
| 1 or 2 Children | 0 (0.0%) | 0 (0.0%) |
| 3 or 4 Children | 0 (0.0%) | 2 (100.0%) |
| 5 or more Children | 0 (0.0%) | 0 (0.0%) |
| Total | 0 (0.0%) | 2 (20.0%) |
Income Below Poverty Among Married-Couple vs Single-Parent Households in Little Sioux
The poverty data for Little Sioux shows that 2 of the married-couple family households (9.1%) and 2 of the single-parent households (20.0%) are living below the poverty level. Within the married-couple family households, those with 1 or 2 children have the highest poverty rate, with 1 households (20.0%) falling below the poverty line. Among the single-parent households, those with 3 or 4 children have the highest poverty rate, with 2 household (100.0%) living below poverty.
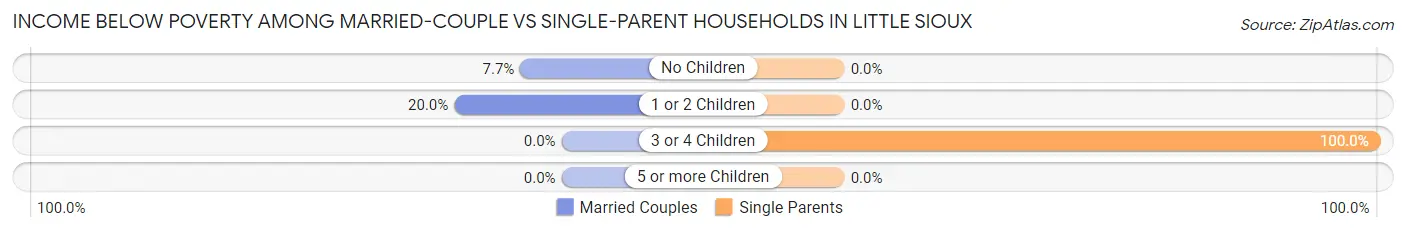
| Children | Married-Couple Families | Single-Parent Households |
| No Children | 1 (7.7%) | 0 (0.0%) |
| 1 or 2 Children | 1 (20.0%) | 0 (0.0%) |
| 3 or 4 Children | 0 (0.0%) | 2 (100.0%) |
| 5 or more Children | 0 (0.0%) | 0 (0.0%) |
| Total | 2 (9.1%) | 2 (20.0%) |
Race in Little Sioux
The most populous races in Little Sioux are White / Caucasian (161 | 89.9%), Hispanic or Latino (22 | 12.3%), and Black / African American (11 | 6.1%).
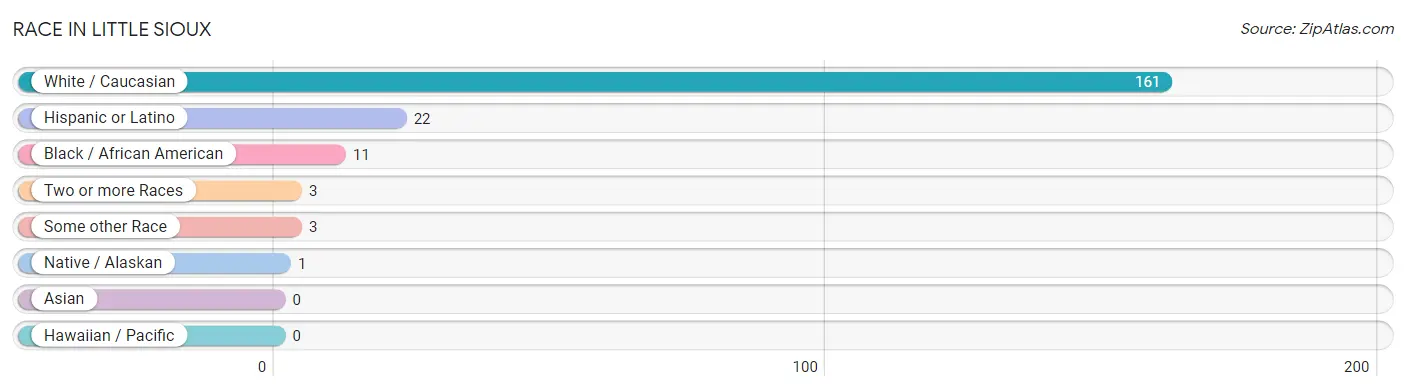
| Race | # Population | % Population |
| Asian | 0 | 0.0% |
| Black / African American | 11 | 6.1% |
| Hawaiian / Pacific | 0 | 0.0% |
| Hispanic or Latino | 22 | 12.3% |
| Native / Alaskan | 1 | 0.6% |
| White / Caucasian | 161 | 89.9% |
| Two or more Races | 3 | 1.7% |
| Some other Race | 3 | 1.7% |
| Total | 179 | 100.0% |
Ancestry in Little Sioux
The most populous ancestries reported in Little Sioux are Irish (36 | 20.1%), German (27 | 15.1%), Mexican (22 | 12.3%), Italian (19 | 10.6%), and African (11 | 6.1%), together accounting for 64.2% of all Little Sioux residents.
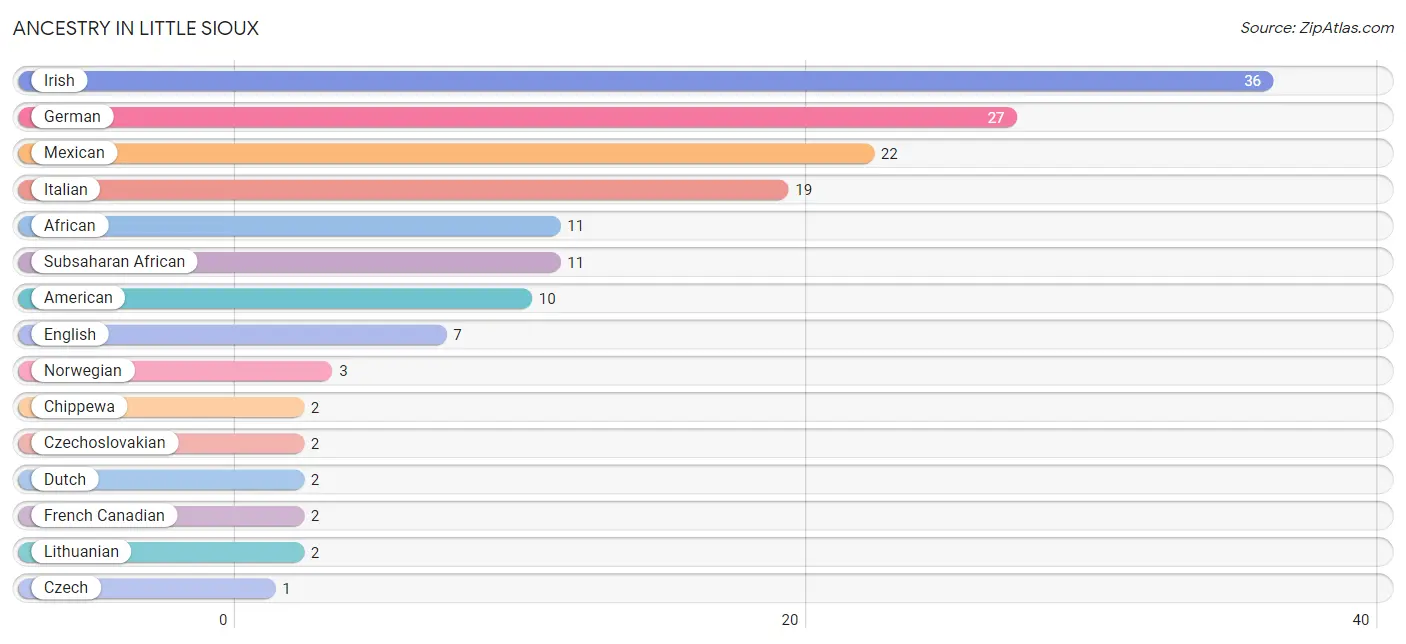
| Ancestry | # Population | % Population |
| African | 11 | 6.1% |
| American | 10 | 5.6% |
| Chippewa | 2 | 1.1% |
| Czech | 1 | 0.6% |
| Czechoslovakian | 2 | 1.1% |
| Danish | 1 | 0.6% |
| Dutch | 2 | 1.1% |
| English | 7 | 3.9% |
| French Canadian | 2 | 1.1% |
| German | 27 | 15.1% |
| Irish | 36 | 20.1% |
| Italian | 19 | 10.6% |
| Lithuanian | 2 | 1.1% |
| Mexican | 22 | 12.3% |
| Norwegian | 3 | 1.7% |
| Slavic | 1 | 0.6% |
| Subsaharan African | 11 | 6.1% | View All 17 Rows |
Immigrants in Little Sioux
The most numerous immigrant groups reported in Little Sioux came from Central America (4 | 2.2%), Latin America (4 | 2.2%), and Mexico (4 | 2.2%), together accounting for 6.7% of all Little Sioux residents.
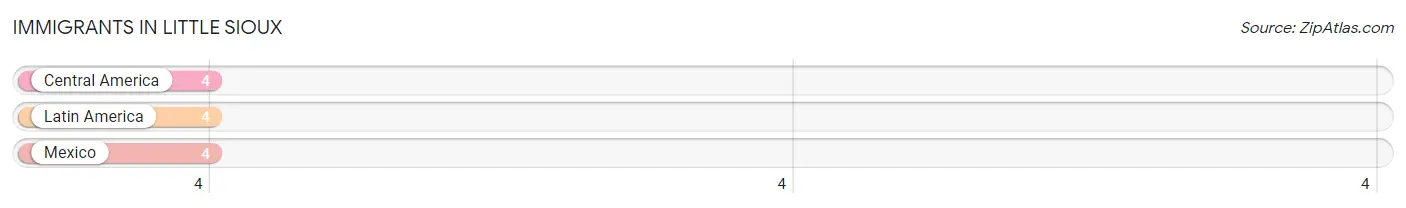
| Immigration Origin | # Population | % Population |
| Central America | 4 | 2.2% |
| Latin America | 4 | 2.2% |
| Mexico | 4 | 2.2% | View All 3 Rows |
Sex and Age in Little Sioux
Sex and Age in Little Sioux
The most populous age groups in Little Sioux are 10 to 14 Years (22 | 27.9%) for men and 40 to 44 Years (15 | 15.0%) for women.
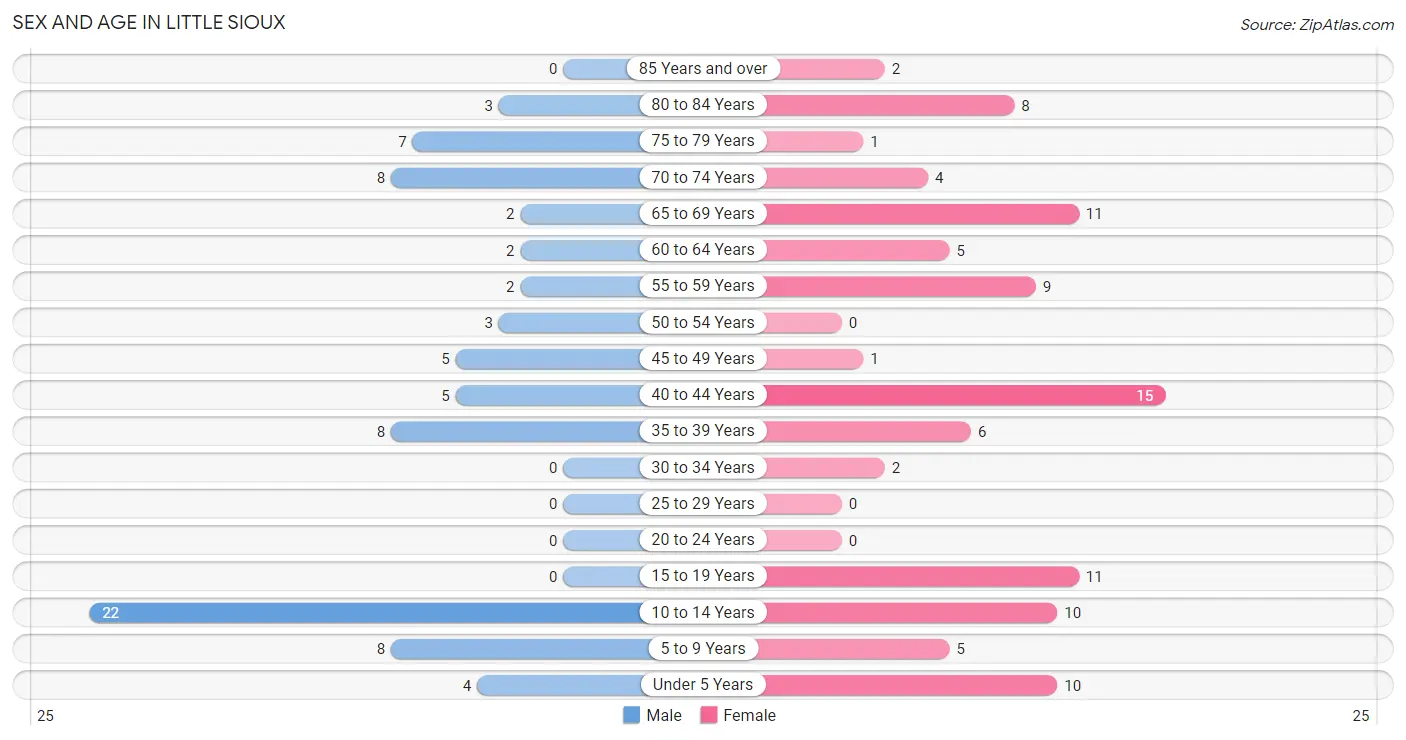
| Age Bracket | Male | Female |
| Under 5 Years | 4 (5.1%) | 10 (10.0%) |
| 5 to 9 Years | 8 (10.1%) | 5 (5.0%) |
| 10 to 14 Years | 22 (27.9%) | 10 (10.0%) |
| 15 to 19 Years | 0 (0.0%) | 11 (11.0%) |
| 20 to 24 Years | 0 (0.0%) | 0 (0.0%) |
| 25 to 29 Years | 0 (0.0%) | 0 (0.0%) |
| 30 to 34 Years | 0 (0.0%) | 2 (2.0%) |
| 35 to 39 Years | 8 (10.1%) | 6 (6.0%) |
| 40 to 44 Years | 5 (6.3%) | 15 (15.0%) |
| 45 to 49 Years | 5 (6.3%) | 1 (1.0%) |
| 50 to 54 Years | 3 (3.8%) | 0 (0.0%) |
| 55 to 59 Years | 2 (2.5%) | 9 (9.0%) |
| 60 to 64 Years | 2 (2.5%) | 5 (5.0%) |
| 65 to 69 Years | 2 (2.5%) | 11 (11.0%) |
| 70 to 74 Years | 8 (10.1%) | 4 (4.0%) |
| 75 to 79 Years | 7 (8.9%) | 1 (1.0%) |
| 80 to 84 Years | 3 (3.8%) | 8 (8.0%) |
| 85 Years and over | 0 (0.0%) | 2 (2.0%) |
| Total | 79 (100.0%) | 100 (100.0%) |
Families and Households in Little Sioux
Median Family Size in Little Sioux
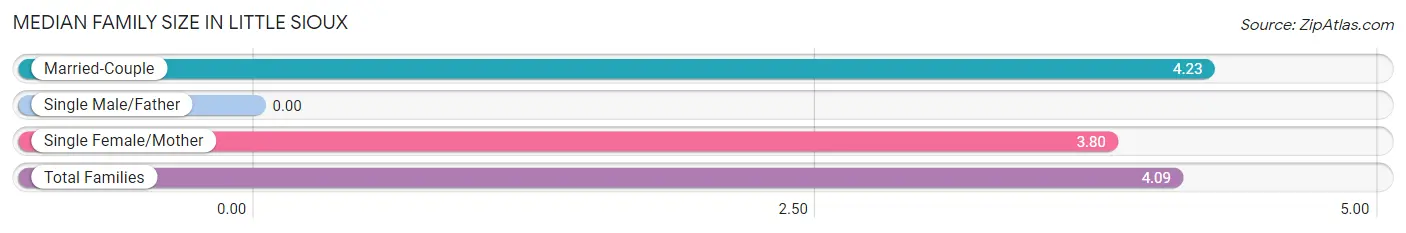
| Family Type | # Families | Family Size |
| Married-Couple | 22 (68.8%) | 4.23 |
| Single Male/Father | 0 (0.0%) | - |
| Single Female/Mother | 10 (31.2%) | 3.80 |
| Total Families | 32 (100.0%) | 4.09 |
Median Household Size in Little Sioux
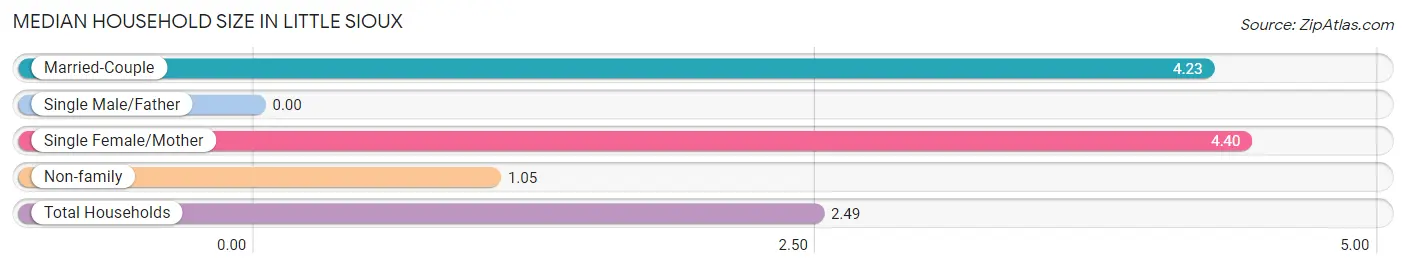
| Household Type | # Households | Household Size |
| Married-Couple | 22 (30.6%) | 4.23 |
| Single Male/Father | 0 (0.0%) | - |
| Single Female/Mother | 10 (13.9%) | 4.40 |
| Non-family | 40 (55.6%) | 1.05 |
| Total Households | 72 (100.0%) | 2.49 |
Household Size by Marriage Status in Little Sioux
Out of a total of 72 households in Little Sioux, 32 (44.4%) are family households, while 40 (55.6%) are nonfamily households. The most numerous type of family households are 2-person households, comprising 13, and the most common type of nonfamily households are 1-person households, comprising 38.
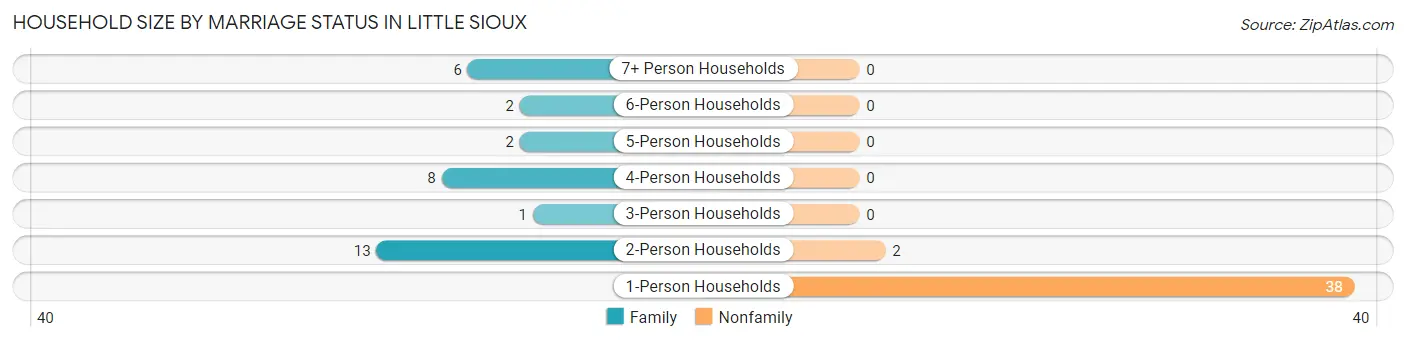
| Household Size | Family Households | Nonfamily Households |
| 1-Person Households | - | 38 (52.8%) |
| 2-Person Households | 13 (18.1%) | 2 (2.8%) |
| 3-Person Households | 1 (1.4%) | 0 (0.0%) |
| 4-Person Households | 8 (11.1%) | 0 (0.0%) |
| 5-Person Households | 2 (2.8%) | 0 (0.0%) |
| 6-Person Households | 2 (2.8%) | 0 (0.0%) |
| 7+ Person Households | 6 (8.3%) | 0 (0.0%) |
| Total | 32 (44.4%) | 40 (55.6%) |
Female Fertility in Little Sioux
Fertility by Age in Little Sioux
Average fertility rate in Little Sioux is 114.0 births per 1,000 women. Women in the age bracket of 35 to 50 years have the highest fertility rate with 182.0 births per 1,000 women. Women in the age bracket of 35 to 50 years acount for 100.0% of all women with births.
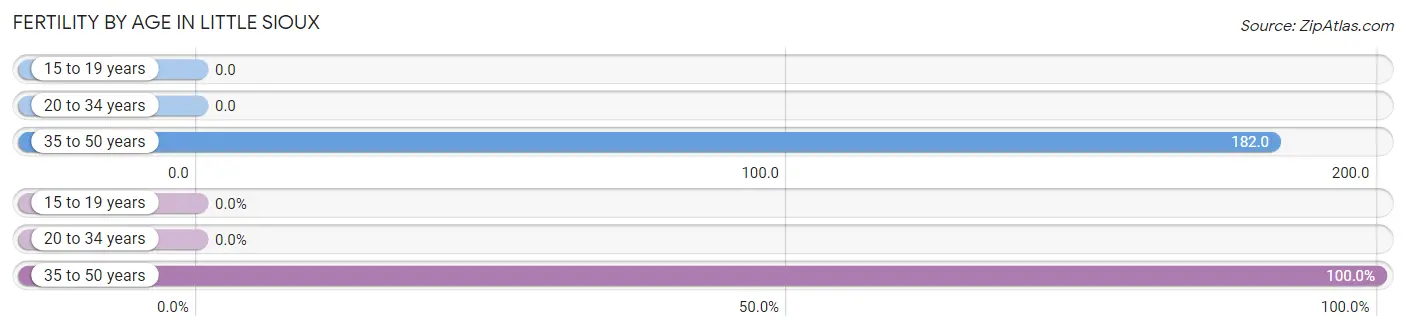
| Age Bracket | Women with Births | Births / 1,000 Women |
| 15 to 19 years | 0 (0.0%) | 0.0 |
| 20 to 34 years | 0 (0.0%) | 0.0 |
| 35 to 50 years | 4 (100.0%) | 182.0 |
| Total | 4 (100.0%) | 114.0 |
Fertility by Age by Marriage Status in Little Sioux
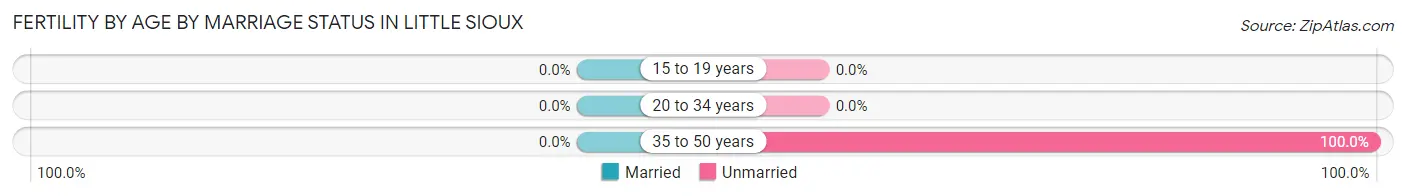
| Age Bracket | Married | Unmarried |
| 15 to 19 years | 0 (0.0%) | 0 (0.0%) |
| 20 to 34 years | 0 (0.0%) | 0 (0.0%) |
| 35 to 50 years | 0 (0.0%) | 4 (100.0%) |
| Total | 0 (0.0%) | 4 (100.0%) |
Fertility by Education in Little Sioux
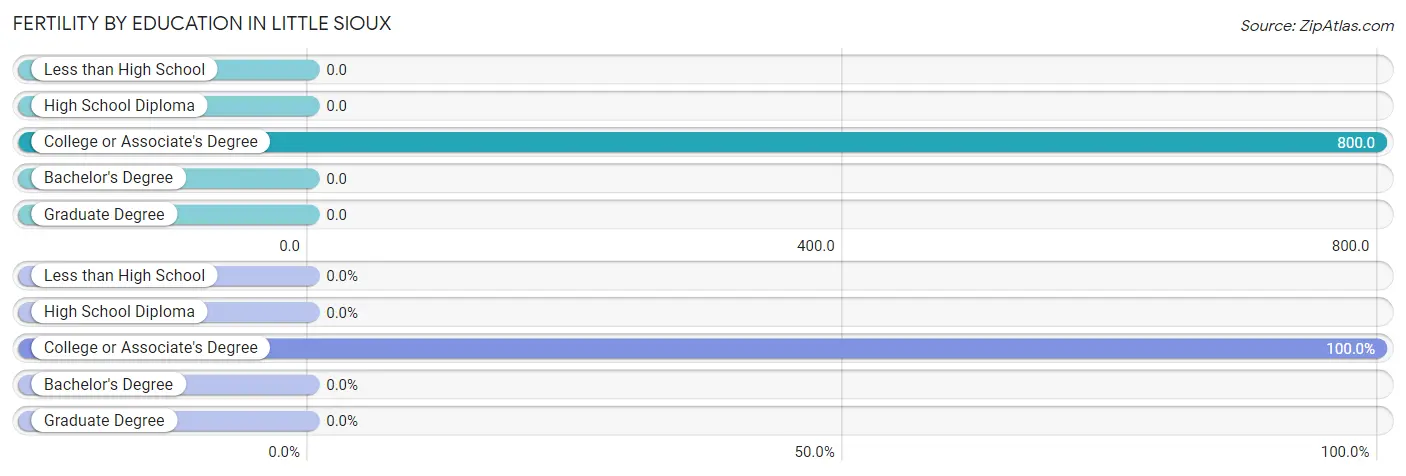
| Educational Attainment | Women with Births | Births / 1,000 Women |
| Less than High School | 0 (0.0%) | 0.0 |
| High School Diploma | 0 (0.0%) | 0.0 |
| College or Associate's Degree | 4 (100.0%) | 800.0 |
| Bachelor's Degree | 0 (0.0%) | 0.0 |
| Graduate Degree | 0 (0.0%) | 0.0 |
| Total | 4 (100.0%) | 114.0 |
Fertility by Education by Marriage Status in Little Sioux
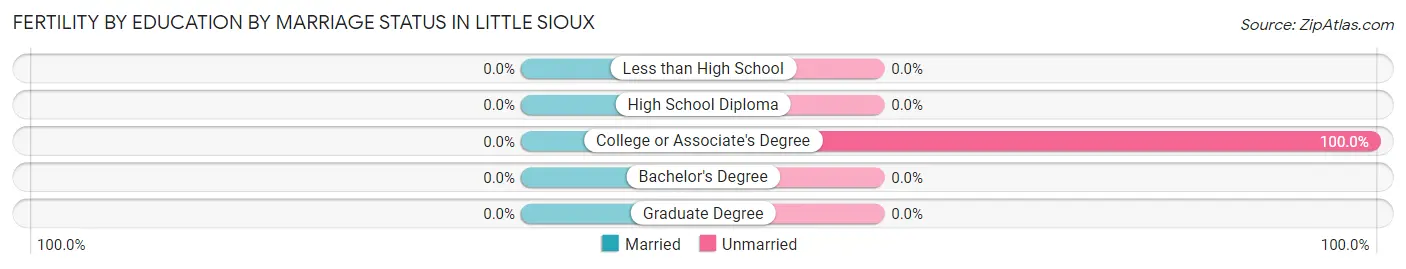
| Educational Attainment | Married | Unmarried |
| Less than High School | 0 (0.0%) | 0 (0.0%) |
| High School Diploma | 0 (0.0%) | 0 (0.0%) |
| College or Associate's Degree | 0 (0.0%) | 4 (100.0%) |
| Bachelor's Degree | 0 (0.0%) | 0 (0.0%) |
| Graduate Degree | 0 (0.0%) | 0 (0.0%) |
| Total | 0 (0.0%) | 4 (100.0%) |
Employment Characteristics in Little Sioux
Employment by Class of Employer in Little Sioux
Among the 51 employed individuals in Little Sioux, private company employees (33 | 64.7%), federal government employees (8 | 15.7%), and not-for-profit organizations (5 | 9.8%) make up the most common classes of employment.
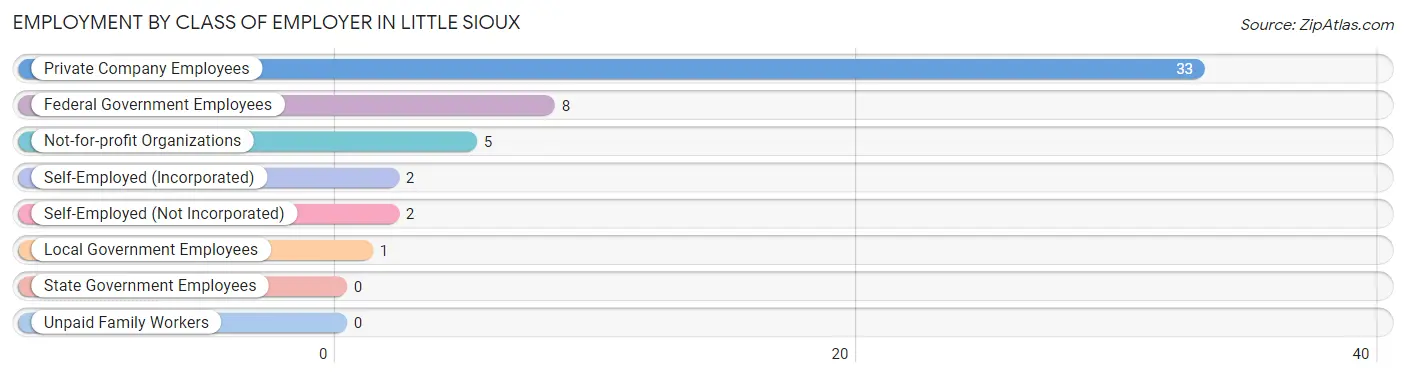
| Employer Class | # Employees | % Employees |
| Private Company Employees | 33 | 64.7% |
| Self-Employed (Incorporated) | 2 | 3.9% |
| Self-Employed (Not Incorporated) | 2 | 3.9% |
| Not-for-profit Organizations | 5 | 9.8% |
| Local Government Employees | 1 | 2.0% |
| State Government Employees | 0 | 0.0% |
| Federal Government Employees | 8 | 15.7% |
| Unpaid Family Workers | 0 | 0.0% |
| Total | 51 | 100.0% |
Employment Status by Age in Little Sioux
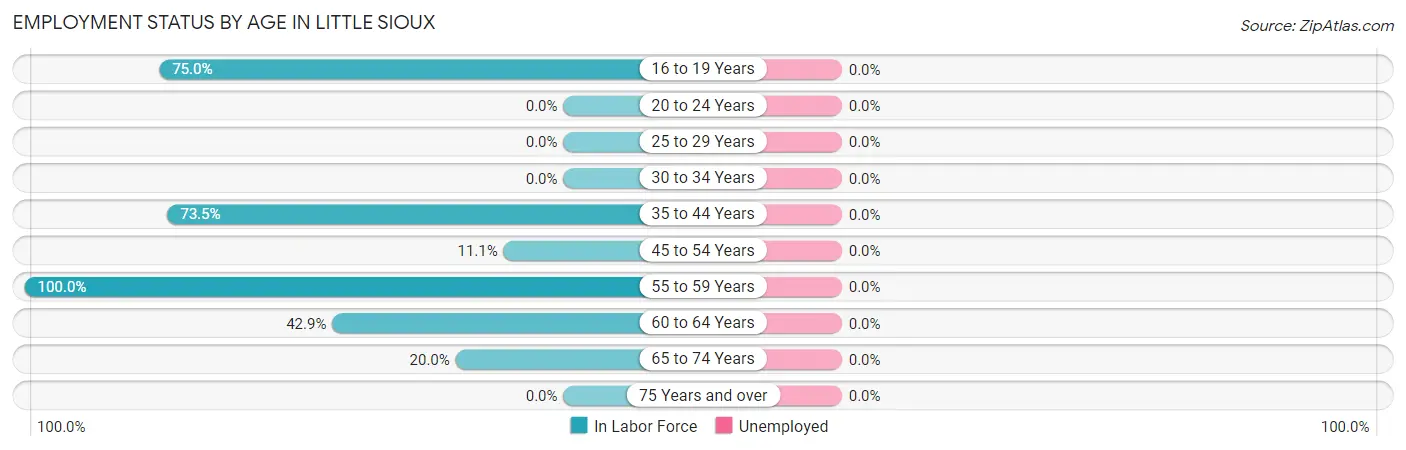
| Age Bracket | In Labor Force | Unemployed |
| 16 to 19 Years | 6 (75.0%) | 0 (0.0%) |
| 20 to 24 Years | 0 (0.0%) | 0 (0.0%) |
| 25 to 29 Years | 0 (0.0%) | 0 (0.0%) |
| 30 to 34 Years | 0 (0.0%) | 0 (0.0%) |
| 35 to 44 Years | 25 (73.5%) | 0 (0.0%) |
| 45 to 54 Years | 1 (11.1%) | 0 (0.0%) |
| 55 to 59 Years | 11 (100.0%) | 0 (0.0%) |
| 60 to 64 Years | 3 (42.9%) | 0 (0.0%) |
| 65 to 74 Years | 5 (20.0%) | 0 (0.0%) |
| 75 Years and over | 0 (0.0%) | 0 (0.0%) |
| Total | 51 (43.6%) | 0 (0.0%) |
Employment Status by Educational Attainment in Little Sioux
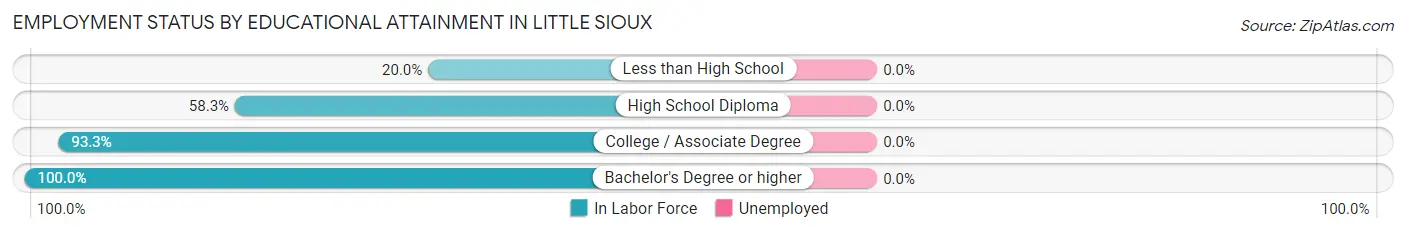
| Educational Attainment | In Labor Force | Unemployed |
| Less than High School | 3 (20.0%) | 0 (0.0%) |
| High School Diploma | 14 (58.3%) | 0 (0.0%) |
| College / Associate Degree | 14 (93.3%) | 0 (0.0%) |
| Bachelor's Degree or higher | 9 (100.0%) | 0 (0.0%) |
| Total | 40 (63.5%) | 0 (0.0%) |
Employment Occupations by Sex in Little Sioux
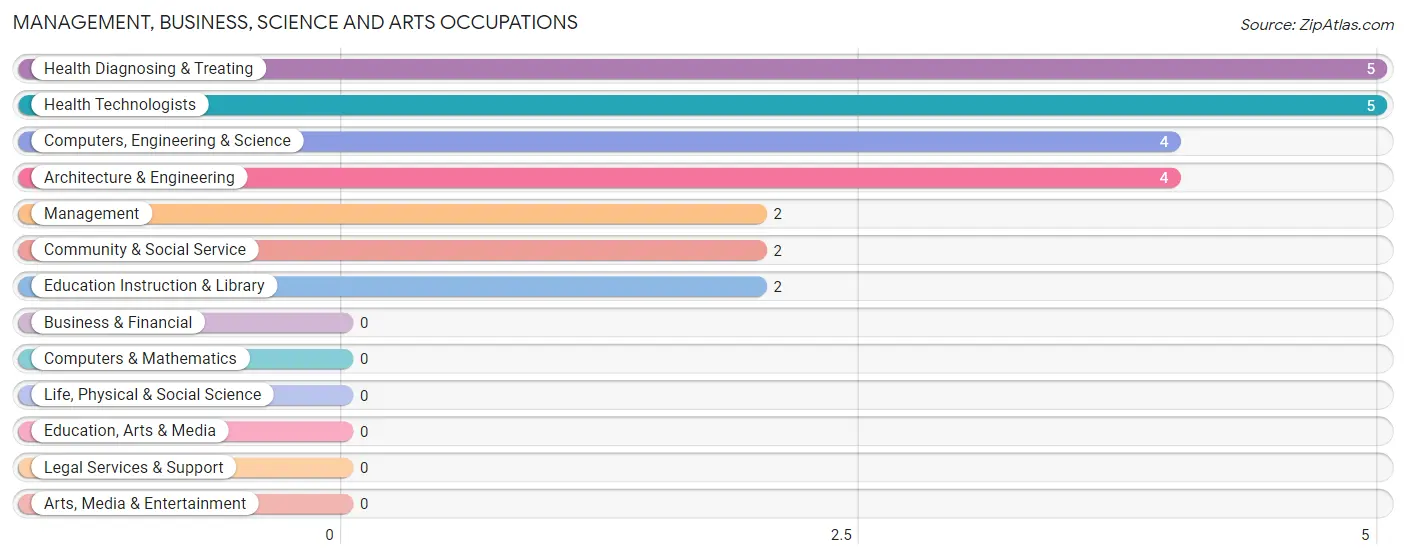
Management, Business, Science and Arts Occupations
The most common Management, Business, Science and Arts occupations in Little Sioux are Health Diagnosing & Treating (5 | 9.8%), Health Technologists (5 | 9.8%), Computers, Engineering & Science (4 | 7.8%), Architecture & Engineering (4 | 7.8%), and Management (2 | 3.9%).
Management, Business, Science and Arts Occupations by Sex
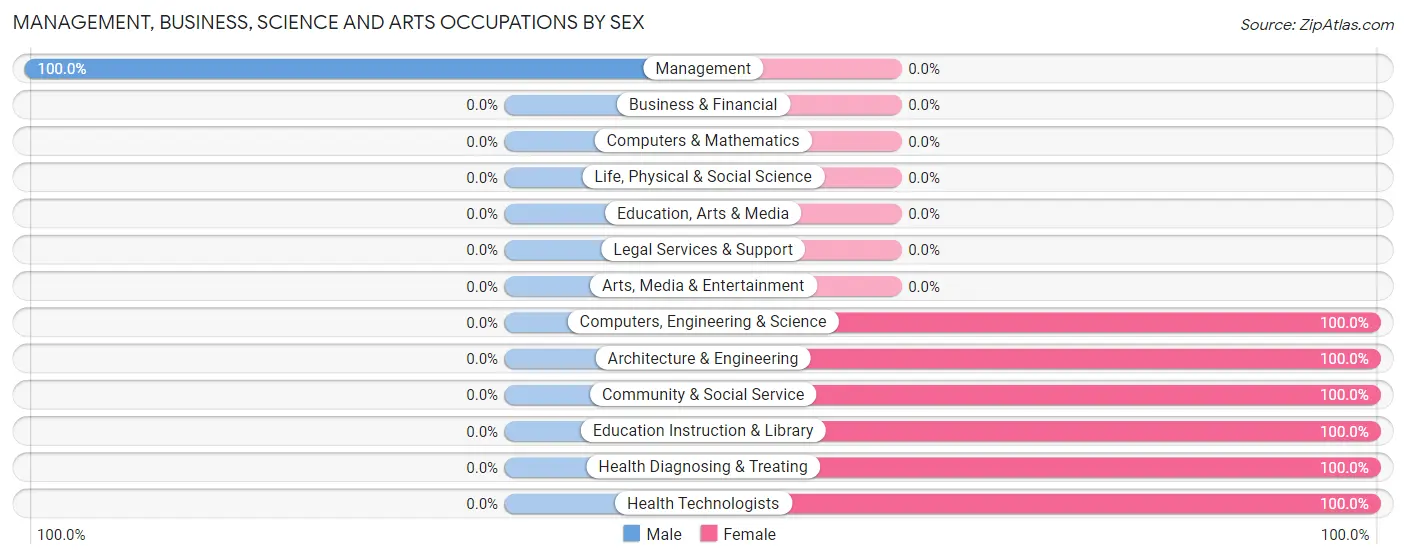
| Occupation | Male | Female |
| Management | 2 (100.0%) | 0 (0.0%) |
| Business & Financial | 0 (0.0%) | 0 (0.0%) |
| Computers, Engineering & Science | 0 (0.0%) | 4 (100.0%) |
| Computers & Mathematics | 0 (0.0%) | 0 (0.0%) |
| Architecture & Engineering | 0 (0.0%) | 4 (100.0%) |
| Life, Physical & Social Science | 0 (0.0%) | 0 (0.0%) |
| Community & Social Service | 0 (0.0%) | 2 (100.0%) |
| Education, Arts & Media | 0 (0.0%) | 0 (0.0%) |
| Legal Services & Support | 0 (0.0%) | 0 (0.0%) |
| Education Instruction & Library | 0 (0.0%) | 2 (100.0%) |
| Arts, Media & Entertainment | 0 (0.0%) | 0 (0.0%) |
| Health Diagnosing & Treating | 0 (0.0%) | 5 (100.0%) |
| Health Technologists | 0 (0.0%) | 5 (100.0%) |
| Total (Category) | 2 (15.4%) | 11 (84.6%) |
| Total (Overall) | 16 (31.4%) | 35 (68.6%) |
Services Occupations
The most common Services occupations in Little Sioux are Food Preparation & Serving (6 | 11.8%), Cleaning & Maintenance (2 | 3.9%), and Personal Care & Service (1 | 2.0%).
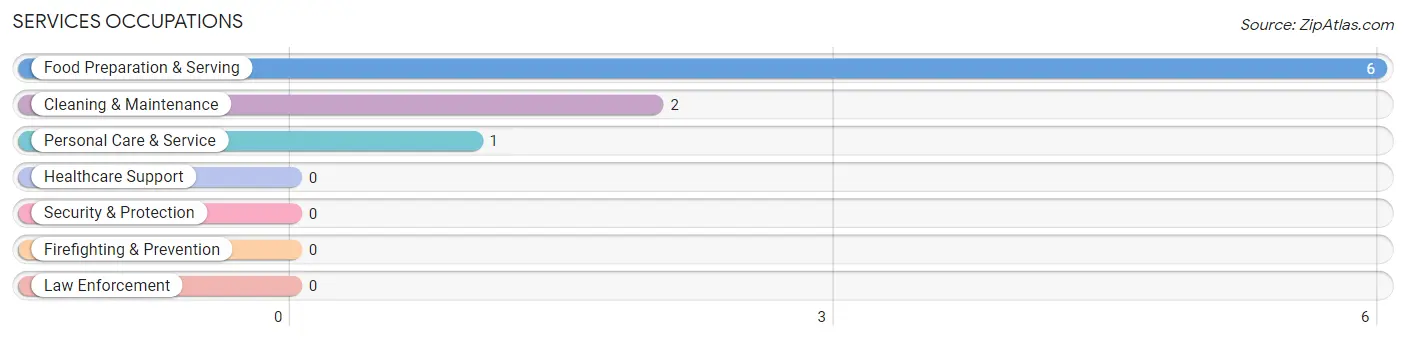
Services Occupations by Sex
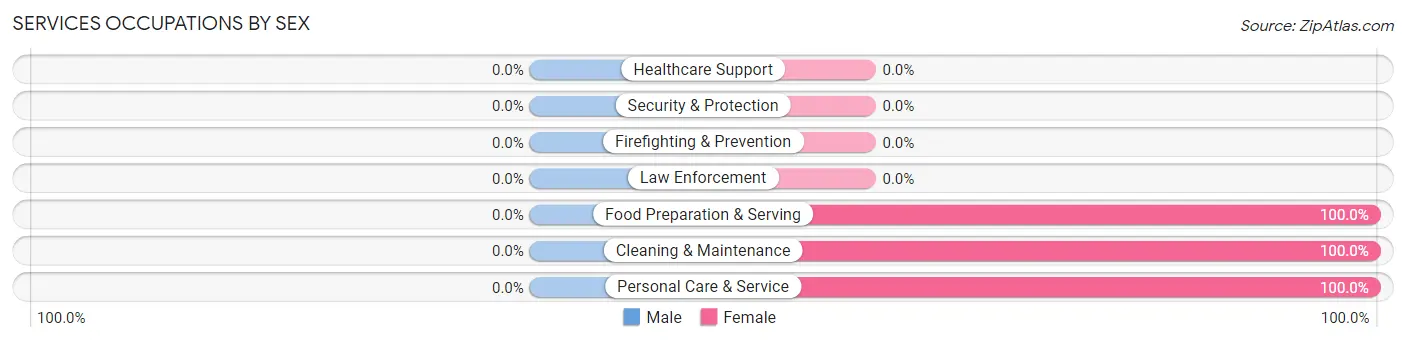
| Occupation | Male | Female |
| Healthcare Support | 0 (0.0%) | 0 (0.0%) |
| Security & Protection | 0 (0.0%) | 0 (0.0%) |
| Firefighting & Prevention | 0 (0.0%) | 0 (0.0%) |
| Law Enforcement | 0 (0.0%) | 0 (0.0%) |
| Food Preparation & Serving | 0 (0.0%) | 6 (100.0%) |
| Cleaning & Maintenance | 0 (0.0%) | 2 (100.0%) |
| Personal Care & Service | 0 (0.0%) | 1 (100.0%) |
| Total (Category) | 0 (0.0%) | 9 (100.0%) |
| Total (Overall) | 16 (31.4%) | 35 (68.6%) |
Sales and Office Occupations
The most common Sales and Office occupations in Little Sioux are , and Office & Administration (13 | 25.5%).
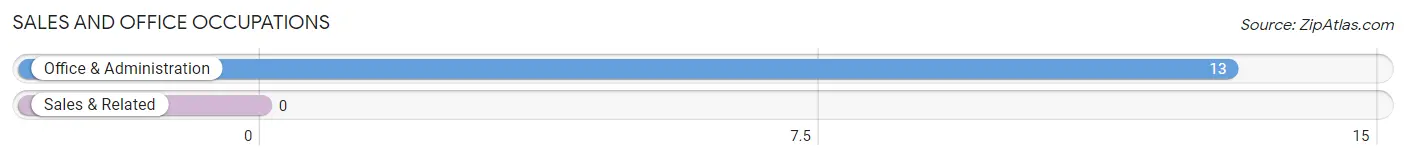
Sales and Office Occupations by Sex
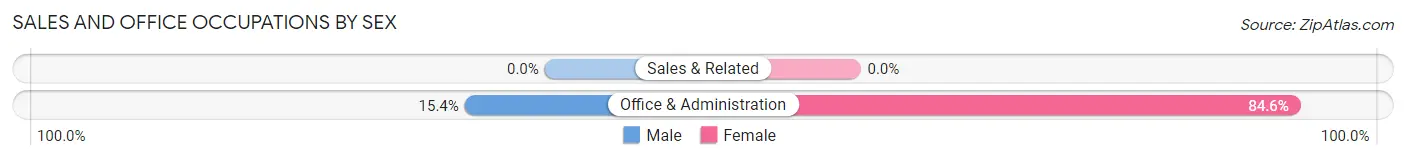
| Occupation | Male | Female |
| Sales & Related | 0 (0.0%) | 0 (0.0%) |
| Office & Administration | 2 (15.4%) | 11 (84.6%) |
| Total (Category) | 2 (15.4%) | 11 (84.6%) |
| Total (Overall) | 16 (31.4%) | 35 (68.6%) |
Natural Resources, Construction and Maintenance Occupations
The most common Natural Resources, Construction and Maintenance occupations in Little Sioux are , and Construction & Extraction (5 | 9.8%).
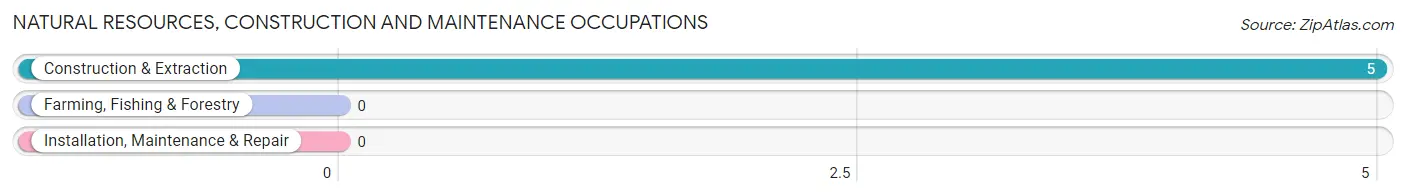
Natural Resources, Construction and Maintenance Occupations by Sex
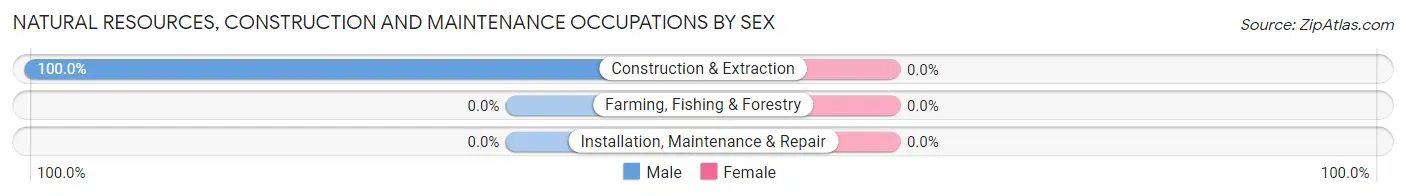
| Occupation | Male | Female |
| Farming, Fishing & Forestry | 0 (0.0%) | 0 (0.0%) |
| Construction & Extraction | 5 (100.0%) | 0 (0.0%) |
| Installation, Maintenance & Repair | 0 (0.0%) | 0 (0.0%) |
| Total (Category) | 5 (100.0%) | 0 (0.0%) |
| Total (Overall) | 16 (31.4%) | 35 (68.6%) |
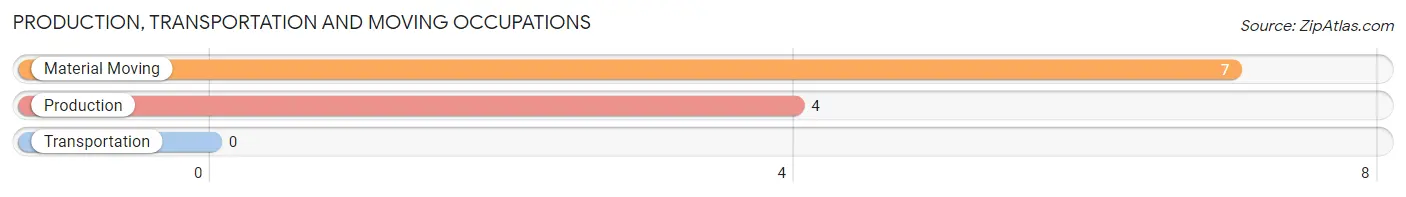
Production, Transportation and Moving Occupations
The most common Production, Transportation and Moving occupations in Little Sioux are Material Moving (7 | 13.7%), and Production (4 | 7.8%).
Production, Transportation and Moving Occupations by Sex
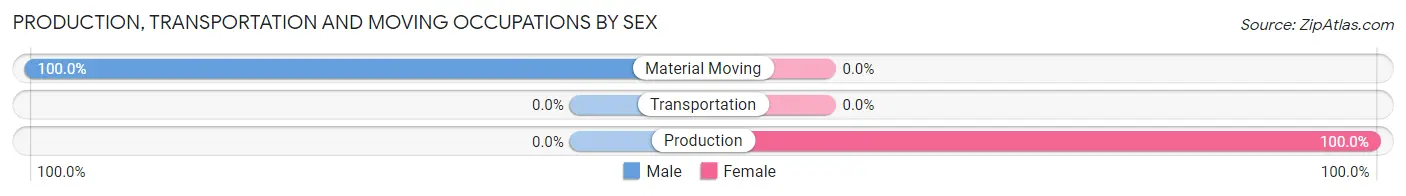
| Occupation | Male | Female |
| Production | 0 (0.0%) | 4 (100.0%) |
| Transportation | 0 (0.0%) | 0 (0.0%) |
| Material Moving | 7 (100.0%) | 0 (0.0%) |
| Total (Category) | 7 (63.6%) | 4 (36.4%) |
| Total (Overall) | 16 (31.4%) | 35 (68.6%) |
Employment Industries by Sex in Little Sioux
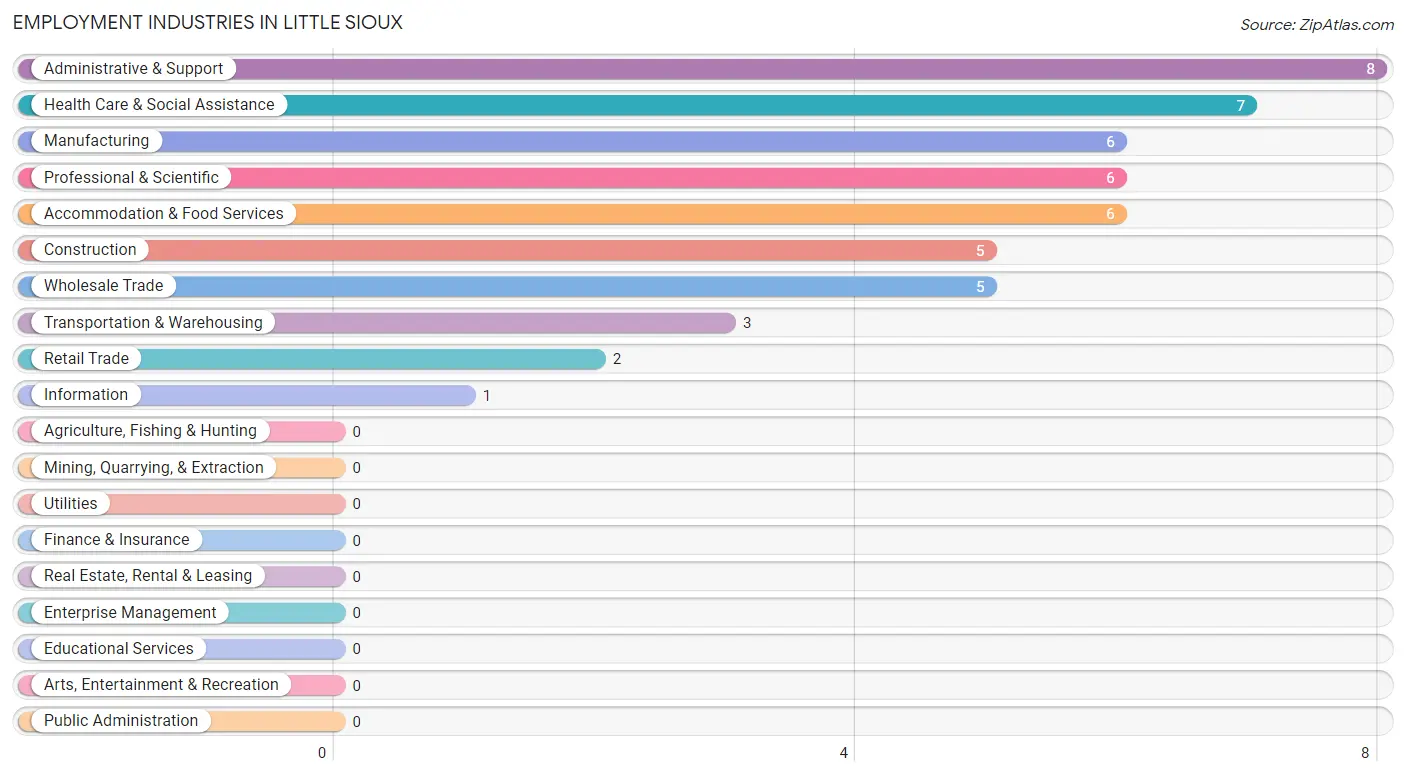
Employment Industries in Little Sioux
The major employment industries in Little Sioux include Administrative & Support (8 | 15.7%), Health Care & Social Assistance (7 | 13.7%), Manufacturing (6 | 11.8%), Professional & Scientific (6 | 11.8%), and Accommodation & Food Services (6 | 11.8%).
Employment Industries by Sex in Little Sioux
The Little Sioux industries that see more men than women are Construction (100.0%), Wholesale Trade (100.0%), and Retail Trade (100.0%), whereas the industries that tend to have a higher number of women are Information (100.0%), Professional & Scientific (100.0%), and Administrative & Support (100.0%).
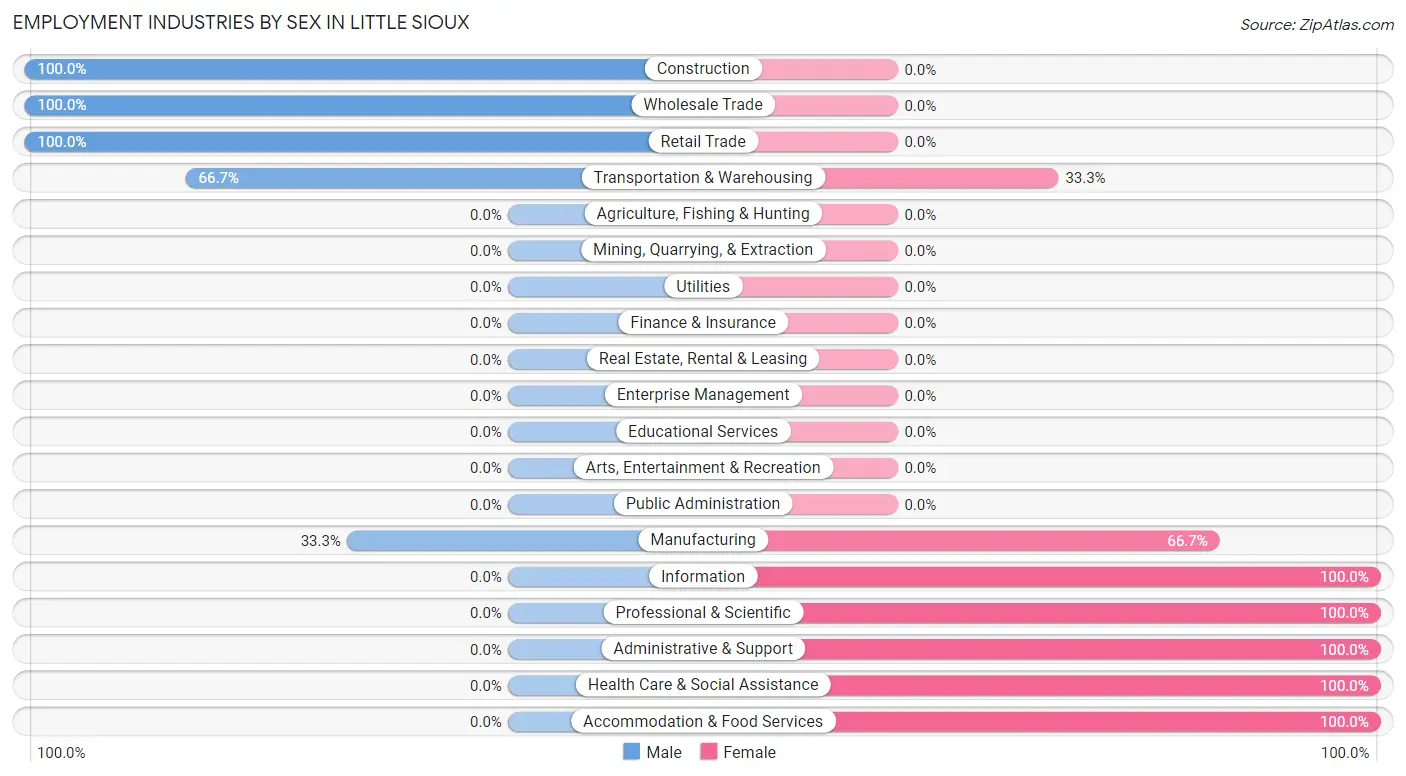
| Industry | Male | Female |
| Agriculture, Fishing & Hunting | 0 (0.0%) | 0 (0.0%) |
| Mining, Quarrying, & Extraction | 0 (0.0%) | 0 (0.0%) |
| Construction | 5 (100.0%) | 0 (0.0%) |
| Manufacturing | 2 (33.3%) | 4 (66.7%) |
| Wholesale Trade | 5 (100.0%) | 0 (0.0%) |
| Retail Trade | 2 (100.0%) | 0 (0.0%) |
| Transportation & Warehousing | 2 (66.7%) | 1 (33.3%) |
| Utilities | 0 (0.0%) | 0 (0.0%) |
| Information | 0 (0.0%) | 1 (100.0%) |
| Finance & Insurance | 0 (0.0%) | 0 (0.0%) |
| Real Estate, Rental & Leasing | 0 (0.0%) | 0 (0.0%) |
| Professional & Scientific | 0 (0.0%) | 6 (100.0%) |
| Enterprise Management | 0 (0.0%) | 0 (0.0%) |
| Administrative & Support | 0 (0.0%) | 8 (100.0%) |
| Educational Services | 0 (0.0%) | 0 (0.0%) |
| Health Care & Social Assistance | 0 (0.0%) | 7 (100.0%) |
| Arts, Entertainment & Recreation | 0 (0.0%) | 0 (0.0%) |
| Accommodation & Food Services | 0 (0.0%) | 6 (100.0%) |
| Public Administration | 0 (0.0%) | 0 (0.0%) |
| Total | 16 (31.4%) | 35 (68.6%) |
Education in Little Sioux
School Enrollment in Little Sioux
The most common levels of schooling among the 55 students in Little Sioux are middle school (29 | 52.7%), elementary school (12 | 21.8%), and high school (11 | 20.0%).
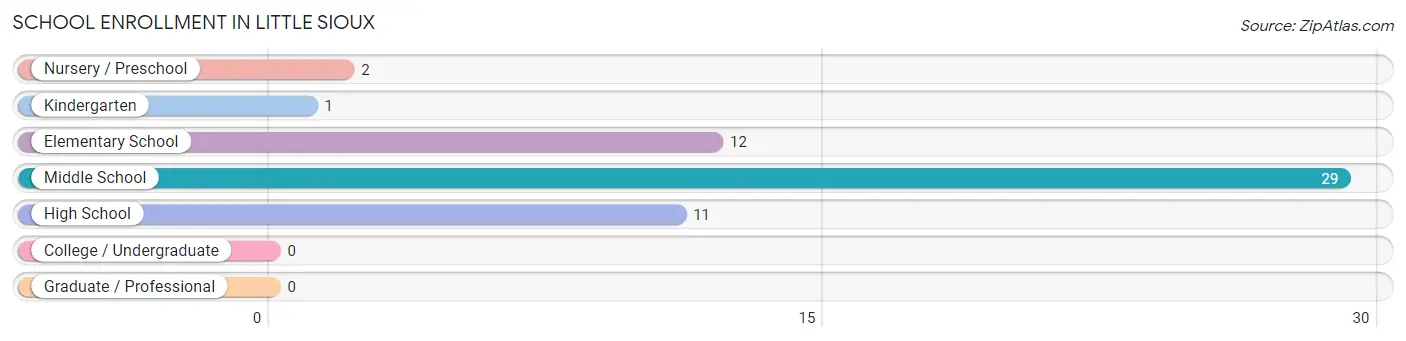
| School Level | # Students | % Students |
| Nursery / Preschool | 2 | 3.6% |
| Kindergarten | 1 | 1.8% |
| Elementary School | 12 | 21.8% |
| Middle School | 29 | 52.7% |
| High School | 11 | 20.0% |
| College / Undergraduate | 0 | 0.0% |
| Graduate / Professional | 0 | 0.0% |
| Total | 55 | 100.0% |
School Enrollment by Age by Funding Source in Little Sioux
Out of a total of 55 students who are enrolled in schools in Little Sioux, 3 (5.5%) attend a private institution, while the remaining 52 (94.5%) are enrolled in public schools. The age group of 15 to 17 year olds has the highest likelihood of being enrolled in private schools, with 3 (100.0% in the age bracket) enrolled. Conversely, the age group of 3 to 4 year olds has the lowest likelihood of being enrolled in a private school, with 2 (100.0% in the age bracket) attending a public institution.
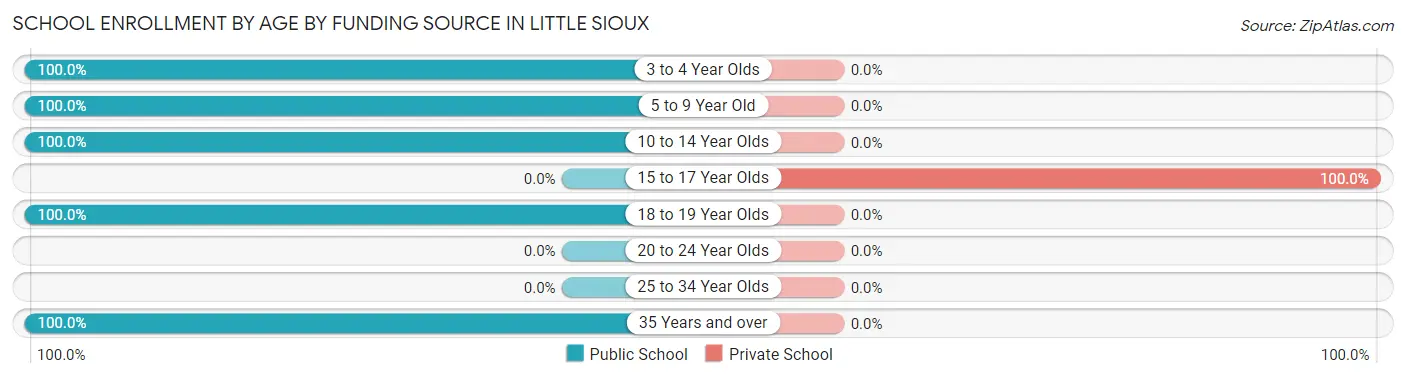
| Age Bracket | Public School | Private School |
| 3 to 4 Year Olds | 2 (100.0%) | 0 (0.0%) |
| 5 to 9 Year Old | 13 (100.0%) | 0 (0.0%) |
| 10 to 14 Year Olds | 32 (100.0%) | 0 (0.0%) |
| 15 to 17 Year Olds | 0 (0.0%) | 3 (100.0%) |
| 18 to 19 Year Olds | 4 (100.0%) | 0 (0.0%) |
| 20 to 24 Year Olds | 0 (0.0%) | 0 (0.0%) |
| 25 to 34 Year Olds | 0 (0.0%) | 0 (0.0%) |
| 35 Years and over | 1 (100.0%) | 0 (0.0%) |
| Total | 52 (94.5%) | 3 (5.5%) |
Educational Attainment by Field of Study in Little Sioux
Science & technology (5 | 55.6%), and business (4 | 44.4%) are the most common fields of study among 9 individuals in Little Sioux who have obtained a bachelor's degree or higher.
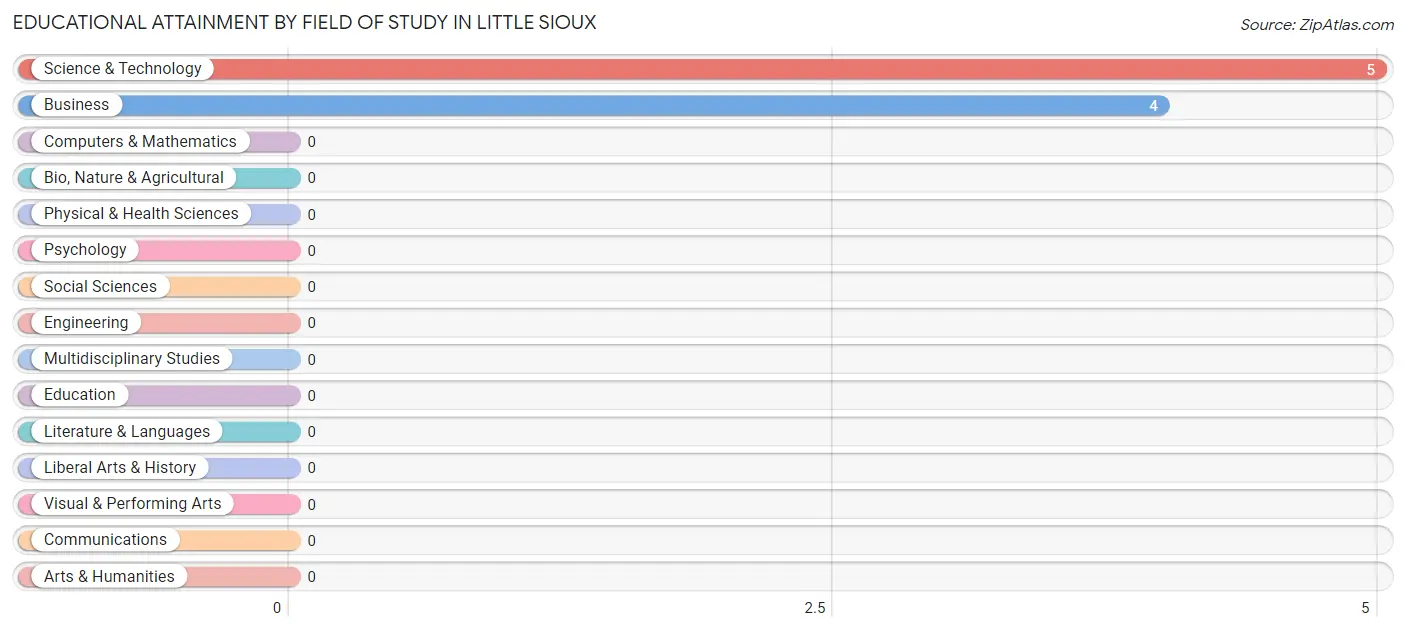
| Field of Study | # Graduates | % Graduates |
| Computers & Mathematics | 0 | 0.0% |
| Bio, Nature & Agricultural | 0 | 0.0% |
| Physical & Health Sciences | 0 | 0.0% |
| Psychology | 0 | 0.0% |
| Social Sciences | 0 | 0.0% |
| Engineering | 0 | 0.0% |
| Multidisciplinary Studies | 0 | 0.0% |
| Science & Technology | 5 | 55.6% |
| Business | 4 | 44.4% |
| Education | 0 | 0.0% |
| Literature & Languages | 0 | 0.0% |
| Liberal Arts & History | 0 | 0.0% |
| Visual & Performing Arts | 0 | 0.0% |
| Communications | 0 | 0.0% |
| Arts & Humanities | 0 | 0.0% |
| Total | 9 | 100.0% |
Transportation & Commute in Little Sioux
Vehicle Availability by Sex in Little Sioux
The most prevalent vehicle ownership categories in Little Sioux are males with 2 vehicles (8, accounting for 50.0%) and females with 2 vehicles (24, making up 22.9%).
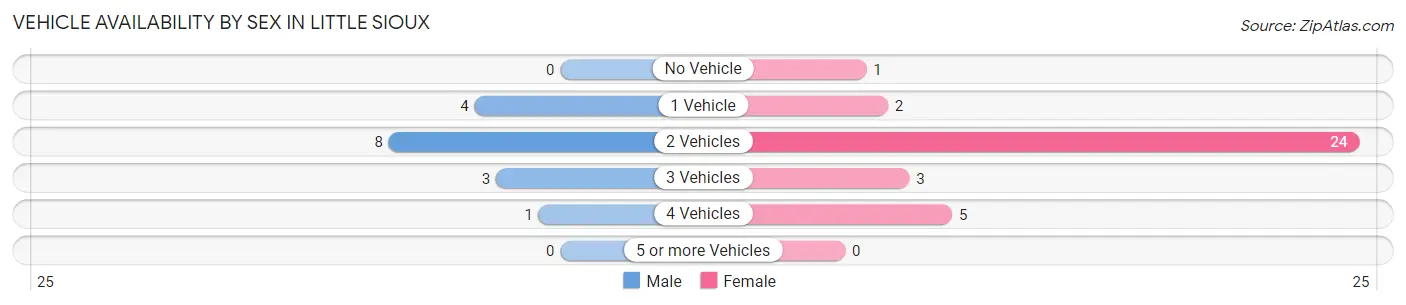
| Vehicles Available | Male | Female |
| No Vehicle | 0 (0.0%) | 1 (2.9%) |
| 1 Vehicle | 4 (25.0%) | 2 (5.7%) |
| 2 Vehicles | 8 (50.0%) | 24 (68.6%) |
| 3 Vehicles | 3 (18.8%) | 3 (8.6%) |
| 4 Vehicles | 1 (6.2%) | 5 (14.3%) |
| 5 or more Vehicles | 0 (0.0%) | 0 (0.0%) |
| Total | 16 (100.0%) | 35 (100.0%) |
Commute Time in Little Sioux
The most frequently occuring commute durations in Little Sioux are 45 to 59 minutes (17 commuters, 40.5%), 10 to 14 minutes (7 commuters, 16.7%), and 30 to 34 minutes (6 commuters, 14.3%).
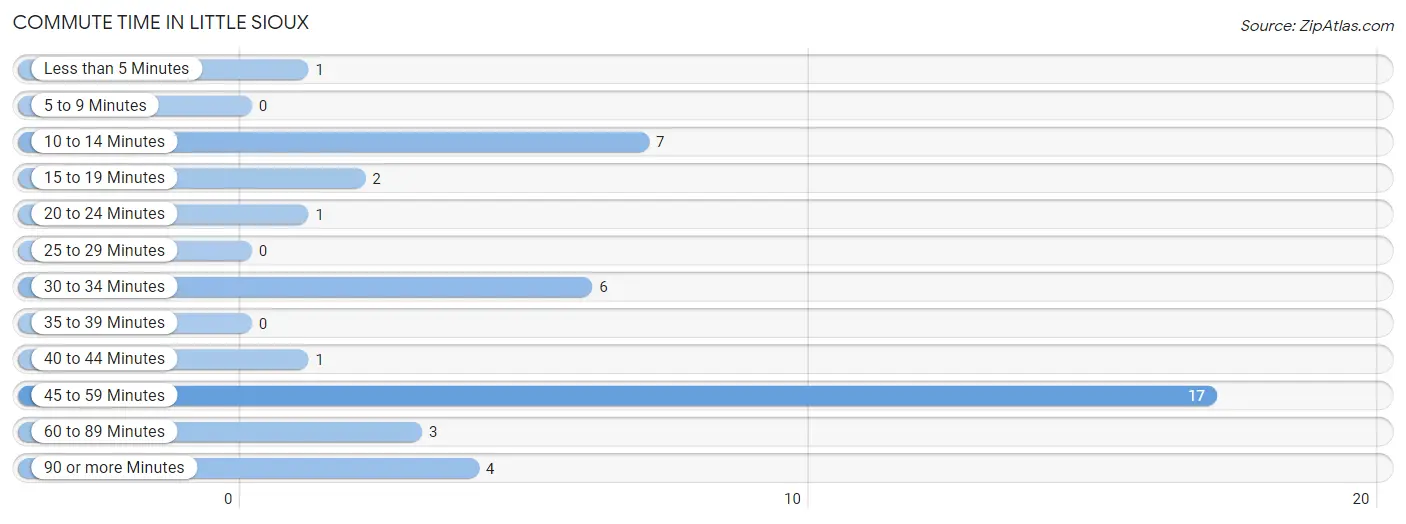
| Commute Time | # Commuters | % Commuters |
| Less than 5 Minutes | 1 | 2.4% |
| 5 to 9 Minutes | 0 | 0.0% |
| 10 to 14 Minutes | 7 | 16.7% |
| 15 to 19 Minutes | 2 | 4.8% |
| 20 to 24 Minutes | 1 | 2.4% |
| 25 to 29 Minutes | 0 | 0.0% |
| 30 to 34 Minutes | 6 | 14.3% |
| 35 to 39 Minutes | 0 | 0.0% |
| 40 to 44 Minutes | 1 | 2.4% |
| 45 to 59 Minutes | 17 | 40.5% |
| 60 to 89 Minutes | 3 | 7.1% |
| 90 or more Minutes | 4 | 9.5% |
Commute Time by Sex in Little Sioux
The most common commute times in Little Sioux are 45 to 59 minutes (6 commuters, 37.5%) for males and 45 to 59 minutes (11 commuters, 42.3%) for females.
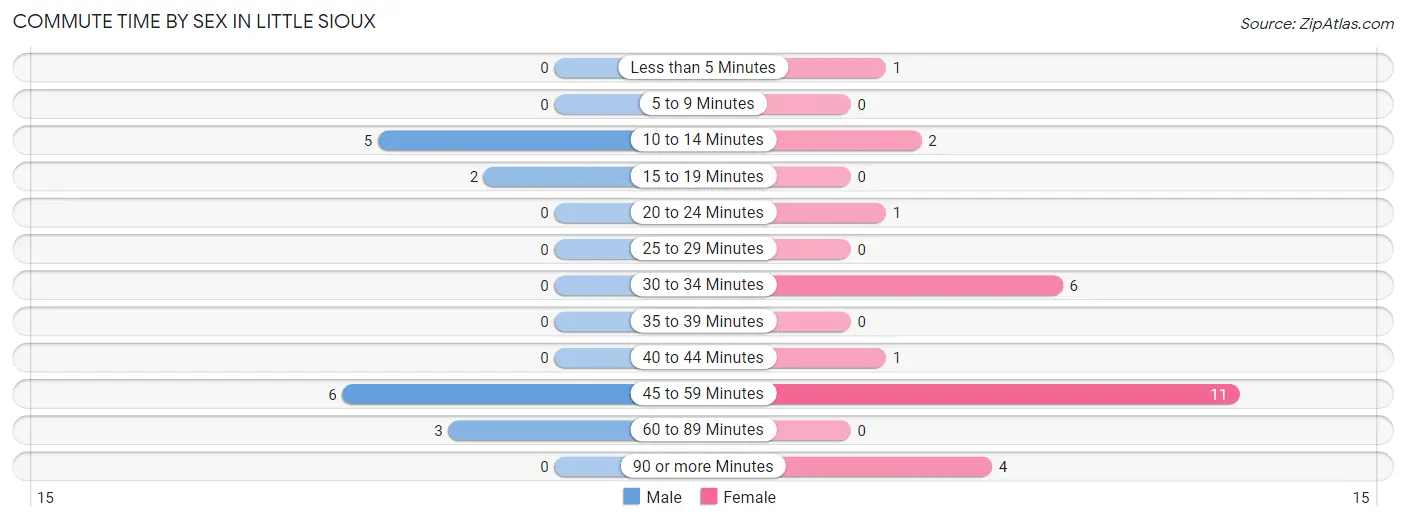
| Commute Time | Male | Female |
| Less than 5 Minutes | 0 (0.0%) | 1 (3.8%) |
| 5 to 9 Minutes | 0 (0.0%) | 0 (0.0%) |
| 10 to 14 Minutes | 5 (31.2%) | 2 (7.7%) |
| 15 to 19 Minutes | 2 (12.5%) | 0 (0.0%) |
| 20 to 24 Minutes | 0 (0.0%) | 1 (3.8%) |
| 25 to 29 Minutes | 0 (0.0%) | 0 (0.0%) |
| 30 to 34 Minutes | 0 (0.0%) | 6 (23.1%) |
| 35 to 39 Minutes | 0 (0.0%) | 0 (0.0%) |
| 40 to 44 Minutes | 0 (0.0%) | 1 (3.8%) |
| 45 to 59 Minutes | 6 (37.5%) | 11 (42.3%) |
| 60 to 89 Minutes | 3 (18.8%) | 0 (0.0%) |
| 90 or more Minutes | 0 (0.0%) | 4 (15.4%) |
Time of Departure to Work by Sex in Little Sioux
The most frequent times of departure to work in Little Sioux are 7:00 AM to 7:29 AM (10, 62.5%) for males and 4:00 PM to 11:59 PM (7, 26.9%) for females.
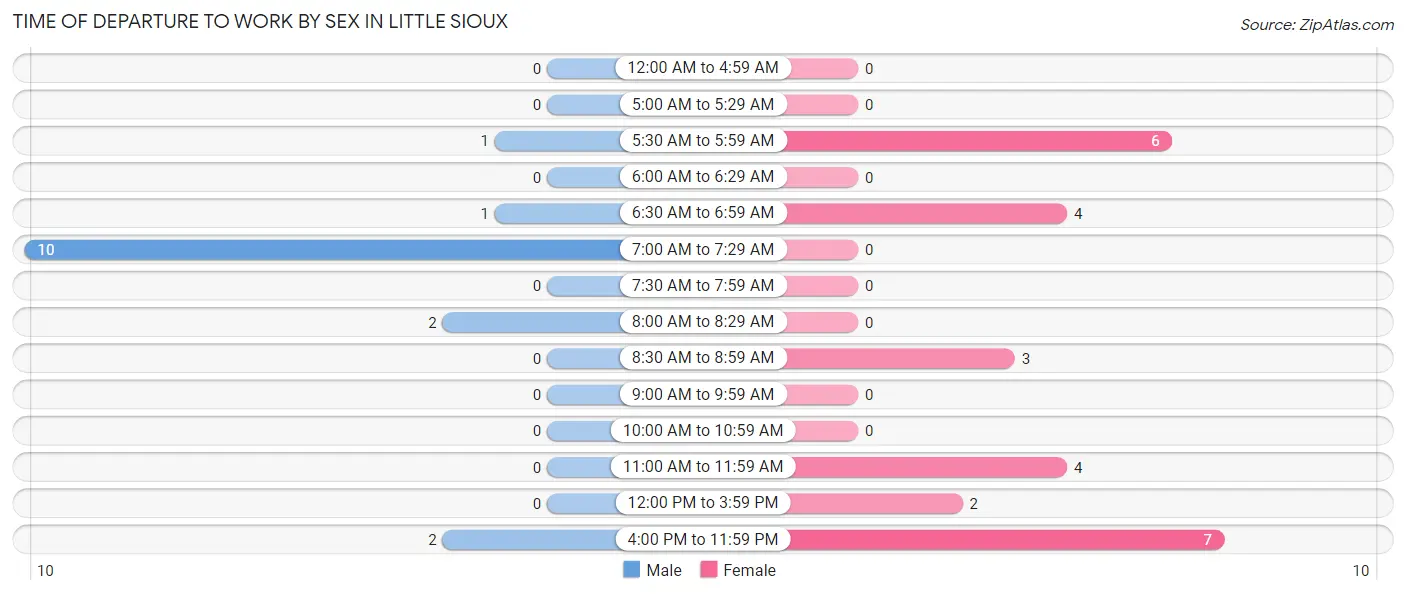
| Time of Departure | Male | Female |
| 12:00 AM to 4:59 AM | 0 (0.0%) | 0 (0.0%) |
| 5:00 AM to 5:29 AM | 0 (0.0%) | 0 (0.0%) |
| 5:30 AM to 5:59 AM | 1 (6.2%) | 6 (23.1%) |
| 6:00 AM to 6:29 AM | 0 (0.0%) | 0 (0.0%) |
| 6:30 AM to 6:59 AM | 1 (6.2%) | 4 (15.4%) |
| 7:00 AM to 7:29 AM | 10 (62.5%) | 0 (0.0%) |
| 7:30 AM to 7:59 AM | 0 (0.0%) | 0 (0.0%) |
| 8:00 AM to 8:29 AM | 2 (12.5%) | 0 (0.0%) |
| 8:30 AM to 8:59 AM | 0 (0.0%) | 3 (11.5%) |
| 9:00 AM to 9:59 AM | 0 (0.0%) | 0 (0.0%) |
| 10:00 AM to 10:59 AM | 0 (0.0%) | 0 (0.0%) |
| 11:00 AM to 11:59 AM | 0 (0.0%) | 4 (15.4%) |
| 12:00 PM to 3:59 PM | 0 (0.0%) | 2 (7.7%) |
| 4:00 PM to 11:59 PM | 2 (12.5%) | 7 (26.9%) |
| Total | 16 (100.0%) | 26 (100.0%) |
Housing Occupancy in Little Sioux
Occupancy by Ownership in Little Sioux
Of the total 72 dwellings in Little Sioux, owner-occupied units account for 57 (79.2%), while renter-occupied units make up 15 (20.8%).
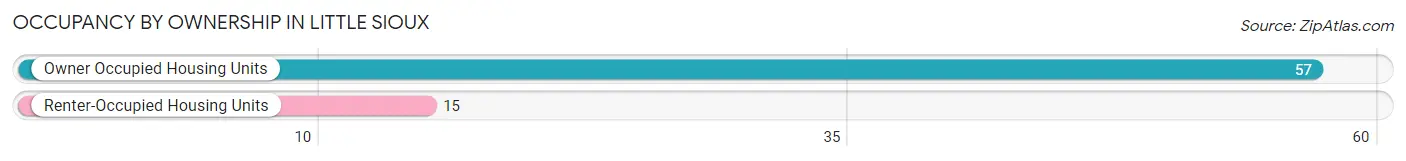
| Occupancy | # Housing Units | % Housing Units |
| Owner Occupied Housing Units | 57 | 79.2% |
| Renter-Occupied Housing Units | 15 | 20.8% |
| Total Occupied Housing Units | 72 | 100.0% |
Occupancy by Household Size in Little Sioux
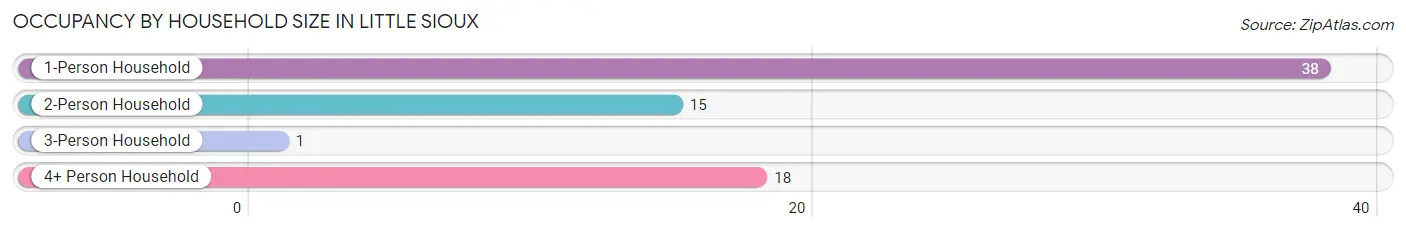
| Household Size | # Housing Units | % Housing Units |
| 1-Person Household | 38 | 52.8% |
| 2-Person Household | 15 | 20.8% |
| 3-Person Household | 1 | 1.4% |
| 4+ Person Household | 18 | 25.0% |
| Total Housing Units | 72 | 100.0% |
Occupancy by Ownership by Household Size in Little Sioux
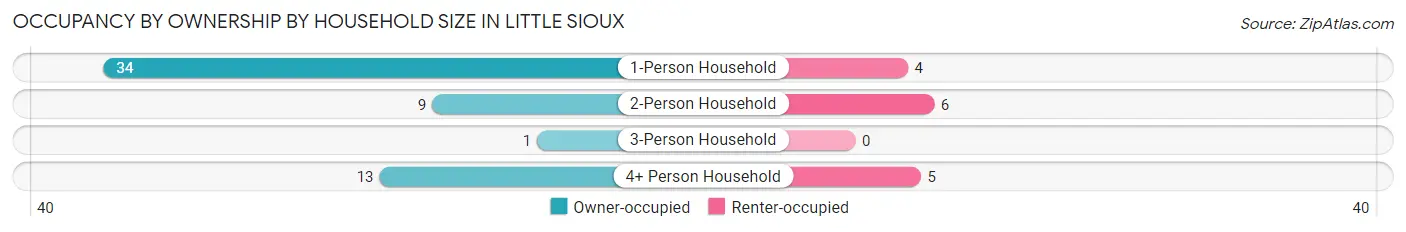
| Household Size | Owner-occupied | Renter-occupied |
| 1-Person Household | 34 (89.5%) | 4 (10.5%) |
| 2-Person Household | 9 (60.0%) | 6 (40.0%) |
| 3-Person Household | 1 (100.0%) | 0 (0.0%) |
| 4+ Person Household | 13 (72.2%) | 5 (27.8%) |
| Total Housing Units | 57 (79.2%) | 15 (20.8%) |
Occupancy by Educational Attainment in Little Sioux
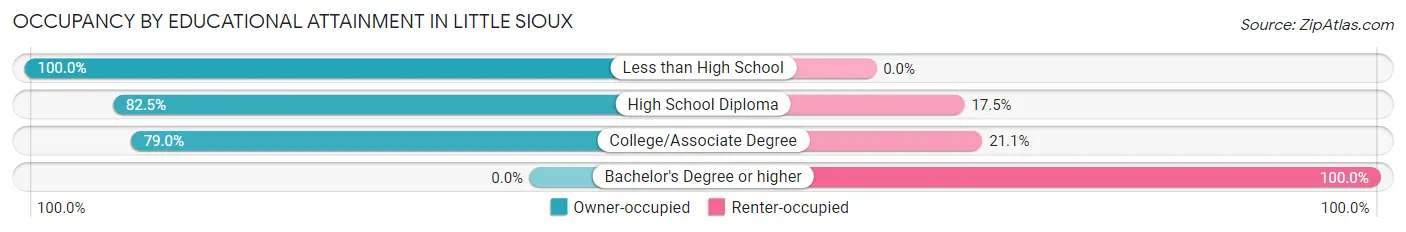
| Household Size | Owner-occupied | Renter-occupied |
| Less than High School | 9 (100.0%) | 0 (0.0%) |
| High School Diploma | 33 (82.5%) | 7 (17.5%) |
| College/Associate Degree | 15 (78.9%) | 4 (21.0%) |
| Bachelor's Degree or higher | 0 (0.0%) | 4 (100.0%) |
Occupancy by Age of Householder in Little Sioux
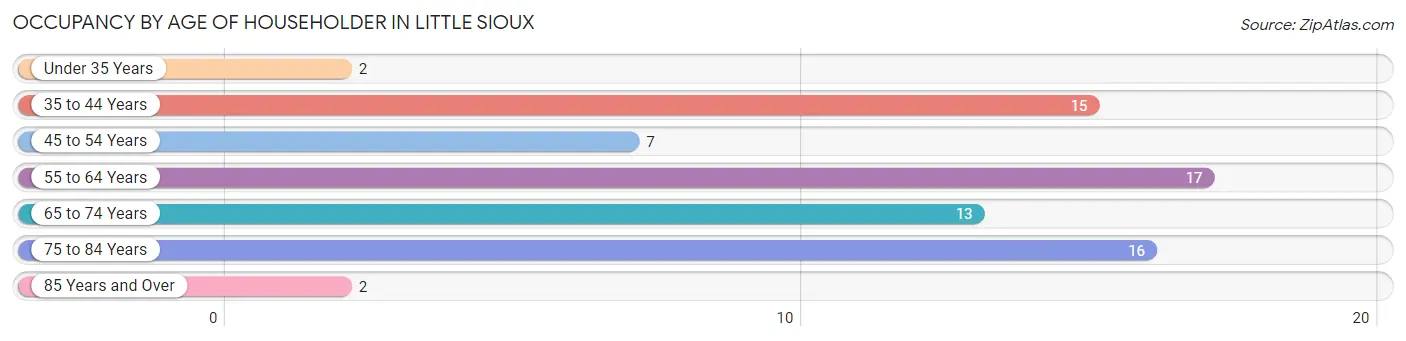
| Age Bracket | # Households | % Households |
| Under 35 Years | 2 | 2.8% |
| 35 to 44 Years | 15 | 20.8% |
| 45 to 54 Years | 7 | 9.7% |
| 55 to 64 Years | 17 | 23.6% |
| 65 to 74 Years | 13 | 18.1% |
| 75 to 84 Years | 16 | 22.2% |
| 85 Years and Over | 2 | 2.8% |
| Total | 72 | 100.0% |
Housing Finances in Little Sioux
Median Income by Occupancy in Little Sioux
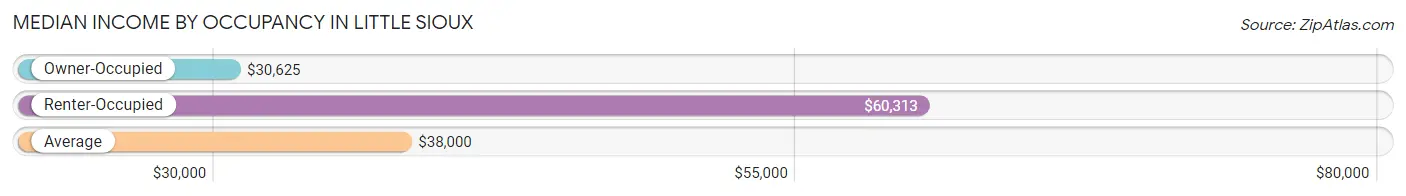
| Occupancy Type | # Households | Median Income |
| Owner-Occupied | 57 (79.2%) | $30,625 |
| Renter-Occupied | 15 (20.8%) | $60,313 |
| Average | 72 (100.0%) | $38,000 |
Occupancy by Householder Income Bracket in Little Sioux
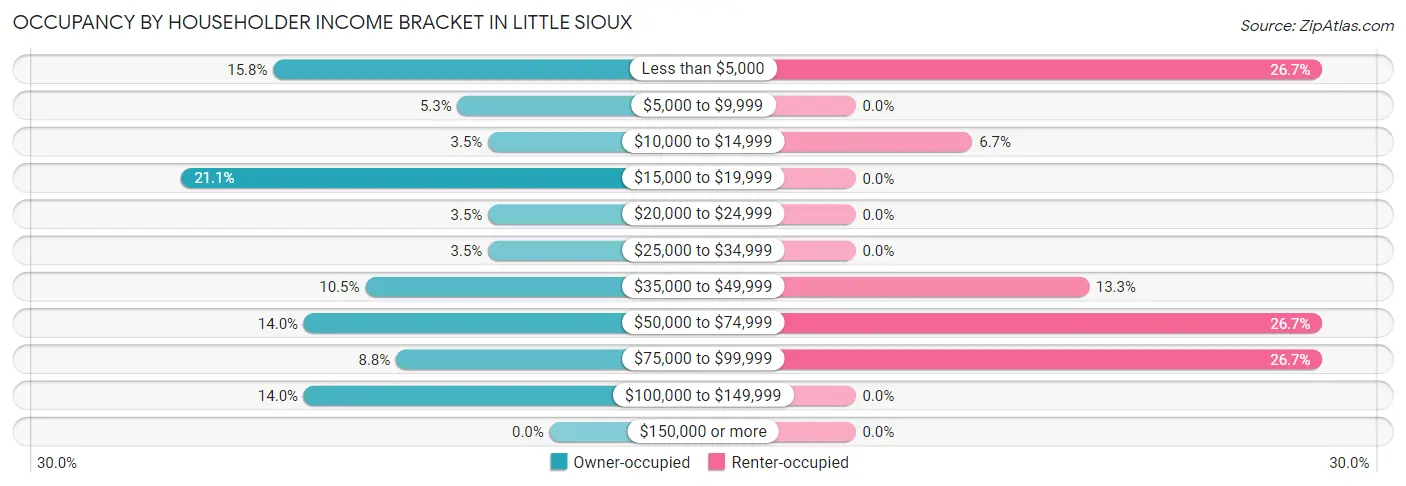
| Income Bracket | Owner-occupied | Renter-occupied |
| Less than $5,000 | 9 (15.8%) | 4 (26.7%) |
| $5,000 to $9,999 | 3 (5.3%) | 0 (0.0%) |
| $10,000 to $14,999 | 2 (3.5%) | 1 (6.7%) |
| $15,000 to $19,999 | 12 (21.0%) | 0 (0.0%) |
| $20,000 to $24,999 | 2 (3.5%) | 0 (0.0%) |
| $25,000 to $34,999 | 2 (3.5%) | 0 (0.0%) |
| $35,000 to $49,999 | 6 (10.5%) | 2 (13.3%) |
| $50,000 to $74,999 | 8 (14.0%) | 4 (26.7%) |
| $75,000 to $99,999 | 5 (8.8%) | 4 (26.7%) |
| $100,000 to $149,999 | 8 (14.0%) | 0 (0.0%) |
| $150,000 or more | 0 (0.0%) | 0 (0.0%) |
| Total | 57 (100.0%) | 15 (100.0%) |
Monthly Housing Cost Tiers in Little Sioux
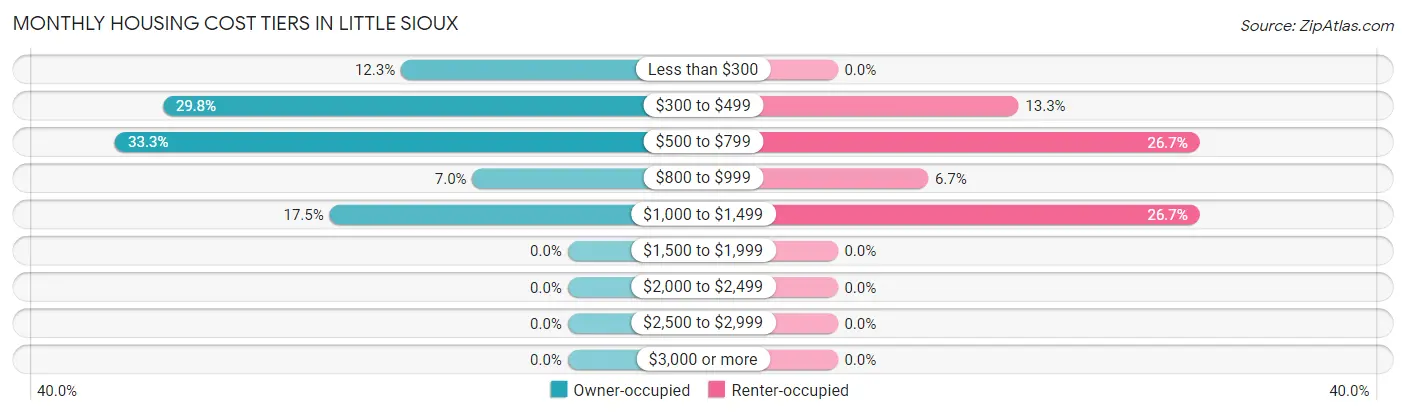
| Monthly Cost | Owner-occupied | Renter-occupied |
| Less than $300 | 7 (12.3%) | 0 (0.0%) |
| $300 to $499 | 17 (29.8%) | 2 (13.3%) |
| $500 to $799 | 19 (33.3%) | 4 (26.7%) |
| $800 to $999 | 4 (7.0%) | 1 (6.7%) |
| $1,000 to $1,499 | 10 (17.5%) | 4 (26.7%) |
| $1,500 to $1,999 | 0 (0.0%) | 0 (0.0%) |
| $2,000 to $2,499 | 0 (0.0%) | 0 (0.0%) |
| $2,500 to $2,999 | 0 (0.0%) | 0 (0.0%) |
| $3,000 or more | 0 (0.0%) | 0 (0.0%) |
| Total | 57 (100.0%) | 15 (100.0%) |
Physical Housing Characteristics in Little Sioux
Housing Structures in Little Sioux
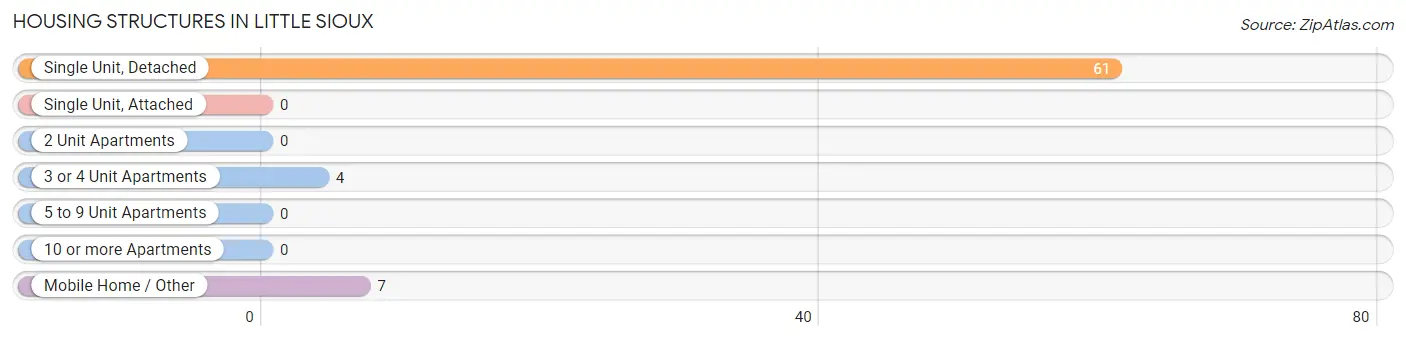
| Structure Type | # Housing Units | % Housing Units |
| Single Unit, Detached | 61 | 84.7% |
| Single Unit, Attached | 0 | 0.0% |
| 2 Unit Apartments | 0 | 0.0% |
| 3 or 4 Unit Apartments | 4 | 5.6% |
| 5 to 9 Unit Apartments | 0 | 0.0% |
| 10 or more Apartments | 0 | 0.0% |
| Mobile Home / Other | 7 | 9.7% |
| Total | 72 | 100.0% |
Housing Structures by Occupancy in Little Sioux
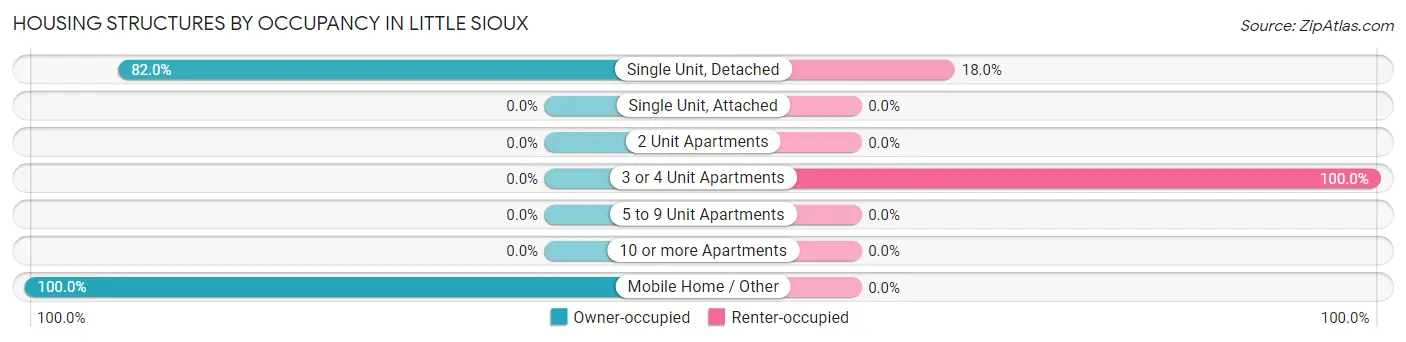
| Structure Type | Owner-occupied | Renter-occupied |
| Single Unit, Detached | 50 (82.0%) | 11 (18.0%) |
| Single Unit, Attached | 0 (0.0%) | 0 (0.0%) |
| 2 Unit Apartments | 0 (0.0%) | 0 (0.0%) |
| 3 or 4 Unit Apartments | 0 (0.0%) | 4 (100.0%) |
| 5 to 9 Unit Apartments | 0 (0.0%) | 0 (0.0%) |
| 10 or more Apartments | 0 (0.0%) | 0 (0.0%) |
| Mobile Home / Other | 7 (100.0%) | 0 (0.0%) |
| Total | 57 (79.2%) | 15 (20.8%) |
Housing Structures by Number of Rooms in Little Sioux
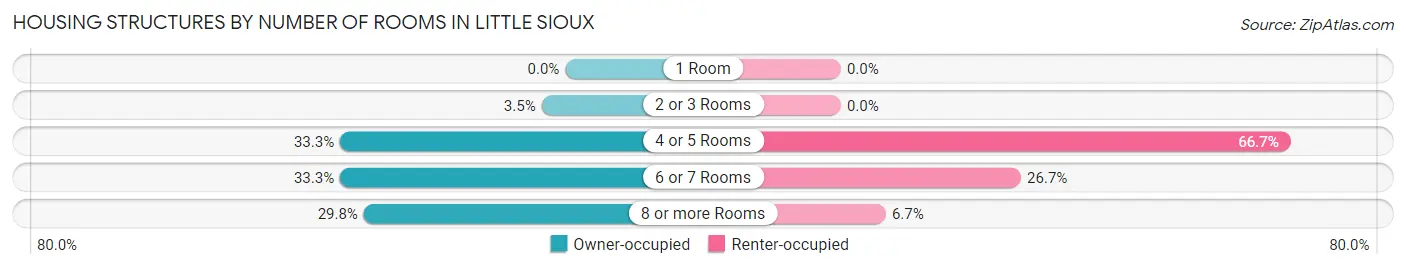
| Number of Rooms | Owner-occupied | Renter-occupied |
| 1 Room | 0 (0.0%) | 0 (0.0%) |
| 2 or 3 Rooms | 2 (3.5%) | 0 (0.0%) |
| 4 or 5 Rooms | 19 (33.3%) | 10 (66.7%) |
| 6 or 7 Rooms | 19 (33.3%) | 4 (26.7%) |
| 8 or more Rooms | 17 (29.8%) | 1 (6.7%) |
| Total | 57 (100.0%) | 15 (100.0%) |
Housing Structure by Heating Type in Little Sioux
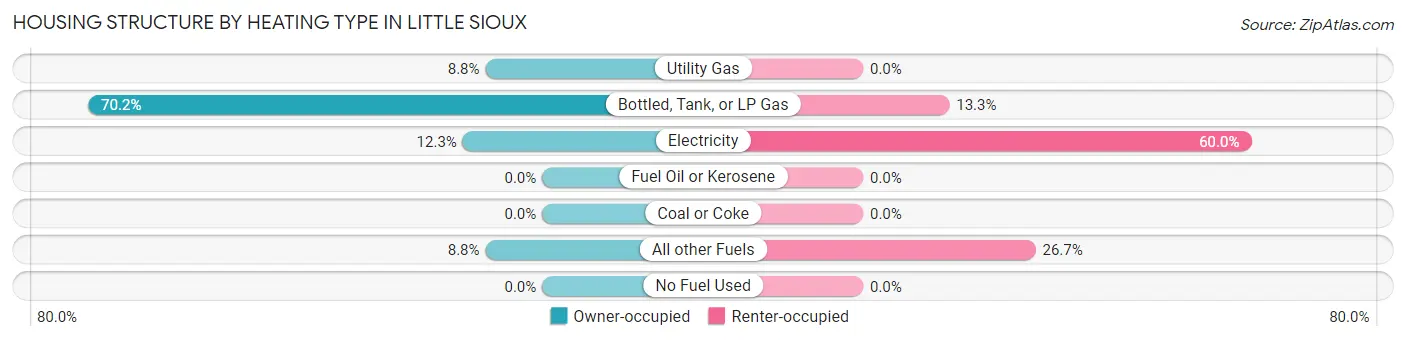
| Heating Type | Owner-occupied | Renter-occupied |
| Utility Gas | 5 (8.8%) | 0 (0.0%) |
| Bottled, Tank, or LP Gas | 40 (70.2%) | 2 (13.3%) |
| Electricity | 7 (12.3%) | 9 (60.0%) |
| Fuel Oil or Kerosene | 0 (0.0%) | 0 (0.0%) |
| Coal or Coke | 0 (0.0%) | 0 (0.0%) |
| All other Fuels | 5 (8.8%) | 4 (26.7%) |
| No Fuel Used | 0 (0.0%) | 0 (0.0%) |
| Total | 57 (100.0%) | 15 (100.0%) |
Household Vehicle Usage in Little Sioux
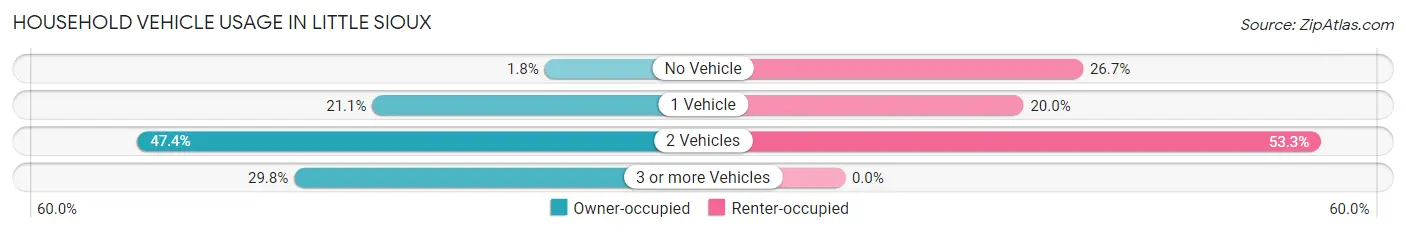
| Vehicles per Household | Owner-occupied | Renter-occupied |
| No Vehicle | 1 (1.8%) | 4 (26.7%) |
| 1 Vehicle | 12 (21.0%) | 3 (20.0%) |
| 2 Vehicles | 27 (47.4%) | 8 (53.3%) |
| 3 or more Vehicles | 17 (29.8%) | 0 (0.0%) |
| Total | 57 (100.0%) | 15 (100.0%) |
Real Estate & Mortgages in Little Sioux
Real Estate and Mortgage Overview in Little Sioux
| Characteristic | Without Mortgage | With Mortgage |
| Housing Units | 38 | 19 |
| Median Property Value | $36,400 | $23,600 |
| Median Household Income | $41,250 | $0 |
| Monthly Housing Costs | $456 | $0 |
| Real Estate Taxes | $500 | $0 |
Property Value by Mortgage Status in Little Sioux
| Property Value | Without Mortgage | With Mortgage |
| Less than $50,000 | 24 (63.2%) | 14 (73.7%) |
| $50,000 to $99,999 | 7 (18.4%) | 5 (26.3%) |
| $100,000 to $299,999 | 3 (7.9%) | 0 (0.0%) |
| $300,000 to $499,999 | 2 (5.3%) | 0 (0.0%) |
| $500,000 to $749,999 | 2 (5.3%) | 0 (0.0%) |
| $750,000 to $999,999 | 0 (0.0%) | 0 (0.0%) |
| $1,000,000 or more | 0 (0.0%) | 0 (0.0%) |
| Total | 38 (100.0%) | 19 (100.0%) |
Household Income by Mortgage Status in Little Sioux
| Household Income | Without Mortgage | With Mortgage |
| Less than $10,000 | 3 (7.9%) | 2 (10.5%) |
| $10,000 to $24,999 | 11 (28.9%) | 9 (47.4%) |
| $25,000 to $34,999 | 2 (5.3%) | 5 (26.3%) |
| $35,000 to $49,999 | 5 (13.2%) | 0 (0.0%) |
| $50,000 to $74,999 | 7 (18.4%) | 1 (5.3%) |
| $75,000 to $99,999 | 2 (5.3%) | 1 (5.3%) |
| $100,000 to $149,999 | 8 (21.0%) | 3 (15.8%) |
| $150,000 or more | 0 (0.0%) | 0 (0.0%) |
| Total | 38 (100.0%) | 19 (100.0%) |
Property Value to Household Income Ratio in Little Sioux
| Value-to-Income Ratio | Without Mortgage | With Mortgage |
| Less than 2.0x | 29 (76.3%) | 0 (0.0%) |
| 2.0x to 2.9x | 2 (5.3%) | 6 (31.6%) |
| 3.0x to 3.9x | 3 (7.9%) | 2 (10.5%) |
| 4.0x or more | 4 (10.5%) | 0 (0.0%) |
| Total | 38 (100.0%) | 19 (100.0%) |
Real Estate Taxes by Mortgage Status in Little Sioux
| Property Taxes | Without Mortgage | With Mortgage |
| Less than $800 | 22 (57.9%) | 1 (5.3%) |
| $800 to $1,499 | 11 (28.9%) | 10 (52.6%) |
| $800 to $1,499 | 2 (5.3%) | 8 (42.1%) |
| Total | 38 (100.0%) | 19 (100.0%) |
Health & Disability in Little Sioux
Health Insurance Coverage by Age in Little Sioux
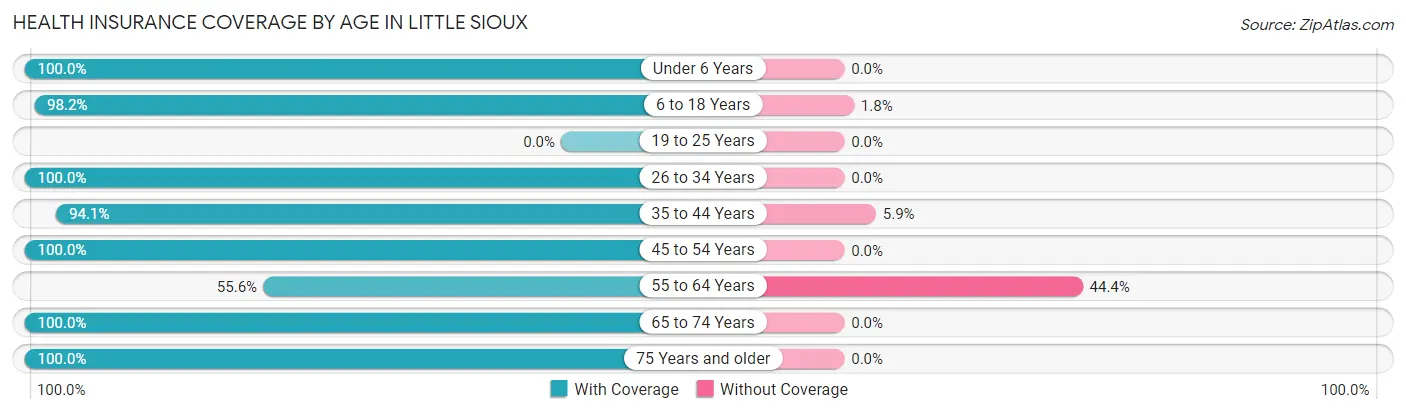
| Age Bracket | With Coverage | Without Coverage |
| Under 6 Years | 14 (100.0%) | 0 (0.0%) |
| 6 to 18 Years | 55 (98.2%) | 1 (1.8%) |
| 19 to 25 Years | 0 (0.0%) | 0 (0.0%) |
| 26 to 34 Years | 2 (100.0%) | 0 (0.0%) |
| 35 to 44 Years | 32 (94.1%) | 2 (5.9%) |
| 45 to 54 Years | 9 (100.0%) | 0 (0.0%) |
| 55 to 64 Years | 10 (55.6%) | 8 (44.4%) |
| 65 to 74 Years | 25 (100.0%) | 0 (0.0%) |
| 75 Years and older | 21 (100.0%) | 0 (0.0%) |
| Total | 168 (93.9%) | 11 (6.1%) |
Health Insurance Coverage by Citizenship Status in Little Sioux
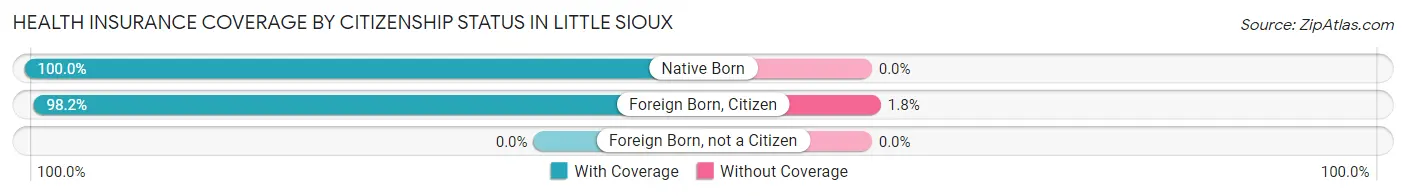
| Citizenship Status | With Coverage | Without Coverage |
| Native Born | 14 (100.0%) | 0 (0.0%) |
| Foreign Born, Citizen | 55 (98.2%) | 1 (1.8%) |
| Foreign Born, not a Citizen | 0 (0.0%) | 0 (0.0%) |
Health Insurance Coverage by Household Income in Little Sioux
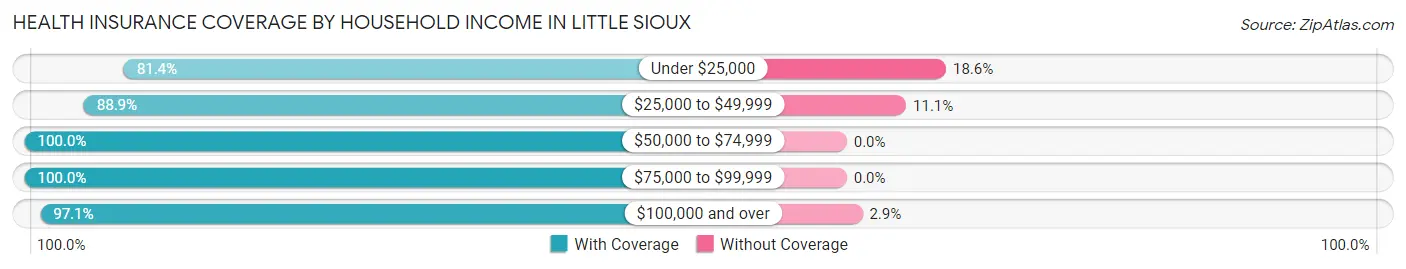
| Household Income | With Coverage | Without Coverage |
| Under $25,000 | 35 (81.4%) | 8 (18.6%) |
| $25,000 to $49,999 | 16 (88.9%) | 2 (11.1%) |
| $50,000 to $74,999 | 24 (100.0%) | 0 (0.0%) |
| $75,000 to $99,999 | 60 (100.0%) | 0 (0.0%) |
| $100,000 and over | 33 (97.1%) | 1 (2.9%) |
Public vs Private Health Insurance Coverage by Age in Little Sioux
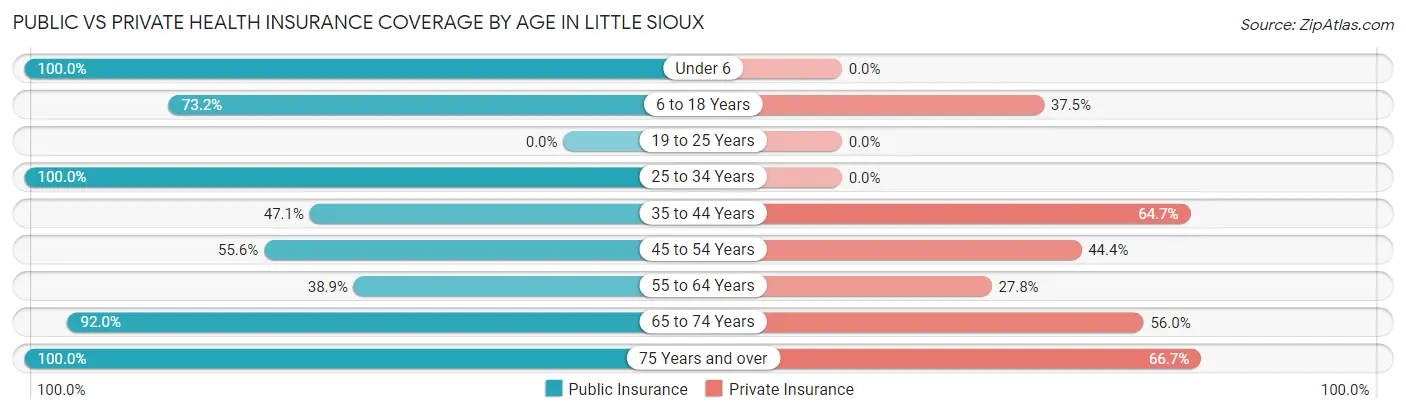
| Age Bracket | Public Insurance | Private Insurance |
| Under 6 | 14 (100.0%) | 0 (0.0%) |
| 6 to 18 Years | 41 (73.2%) | 21 (37.5%) |
| 19 to 25 Years | 0 (0.0%) | 0 (0.0%) |
| 25 to 34 Years | 2 (100.0%) | 0 (0.0%) |
| 35 to 44 Years | 16 (47.1%) | 22 (64.7%) |
| 45 to 54 Years | 5 (55.6%) | 4 (44.4%) |
| 55 to 64 Years | 7 (38.9%) | 5 (27.8%) |
| 65 to 74 Years | 23 (92.0%) | 14 (56.0%) |
| 75 Years and over | 21 (100.0%) | 14 (66.7%) |
| Total | 129 (72.1%) | 80 (44.7%) |
Disability Status by Sex by Age in Little Sioux
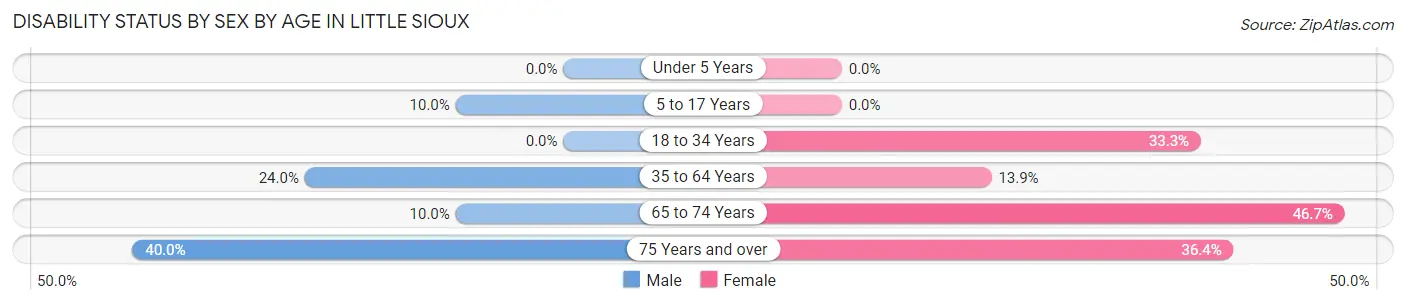
| Age Bracket | Male | Female |
| Under 5 Years | 0 (0.0%) | 0 (0.0%) |
| 5 to 17 Years | 3 (10.0%) | 0 (0.0%) |
| 18 to 34 Years | 0 (0.0%) | 2 (33.3%) |
| 35 to 64 Years | 6 (24.0%) | 5 (13.9%) |
| 65 to 74 Years | 1 (10.0%) | 7 (46.7%) |
| 75 Years and over | 4 (40.0%) | 4 (36.4%) |
Disability Class by Sex by Age in Little Sioux
Disability Class: Hearing Difficulty
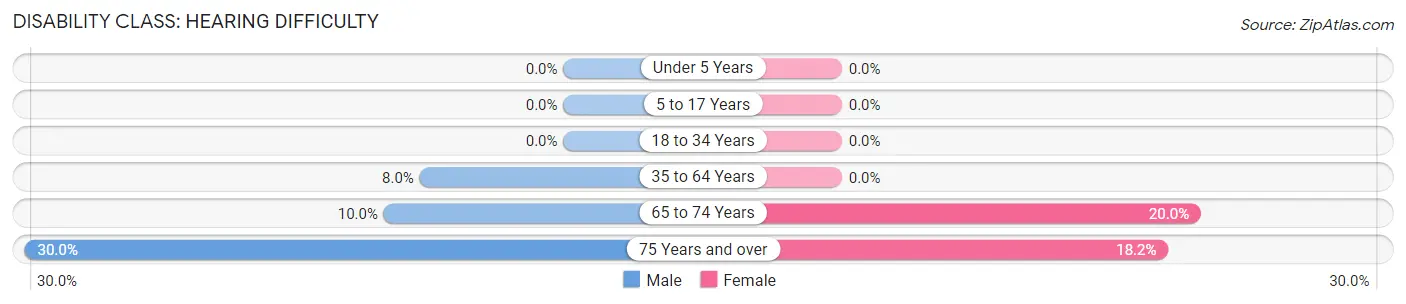
| Age Bracket | Male | Female |
| Under 5 Years | 0 (0.0%) | 0 (0.0%) |
| 5 to 17 Years | 0 (0.0%) | 0 (0.0%) |
| 18 to 34 Years | 0 (0.0%) | 0 (0.0%) |
| 35 to 64 Years | 2 (8.0%) | 0 (0.0%) |
| 65 to 74 Years | 1 (10.0%) | 3 (20.0%) |
| 75 Years and over | 3 (30.0%) | 2 (18.2%) |
Disability Class: Vision Difficulty
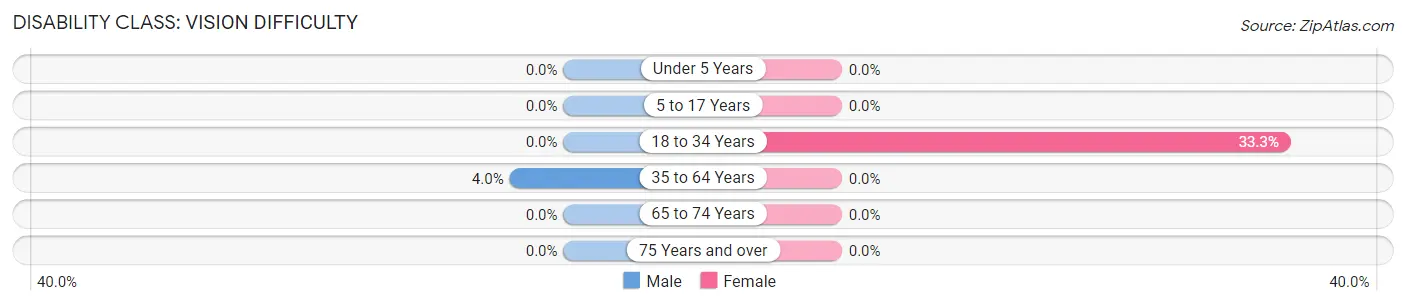
| Age Bracket | Male | Female |
| Under 5 Years | 0 (0.0%) | 0 (0.0%) |
| 5 to 17 Years | 0 (0.0%) | 0 (0.0%) |
| 18 to 34 Years | 0 (0.0%) | 2 (33.3%) |
| 35 to 64 Years | 1 (4.0%) | 0 (0.0%) |
| 65 to 74 Years | 0 (0.0%) | 0 (0.0%) |
| 75 Years and over | 0 (0.0%) | 0 (0.0%) |
Disability Class: Cognitive Difficulty
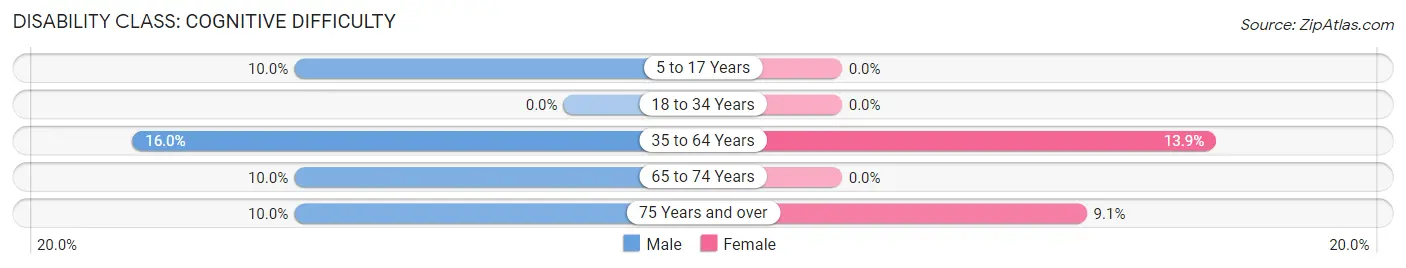
| Age Bracket | Male | Female |
| 5 to 17 Years | 3 (10.0%) | 0 (0.0%) |
| 18 to 34 Years | 0 (0.0%) | 0 (0.0%) |
| 35 to 64 Years | 4 (16.0%) | 5 (13.9%) |
| 65 to 74 Years | 1 (10.0%) | 0 (0.0%) |
| 75 Years and over | 1 (10.0%) | 1 (9.1%) |
Disability Class: Ambulatory Difficulty
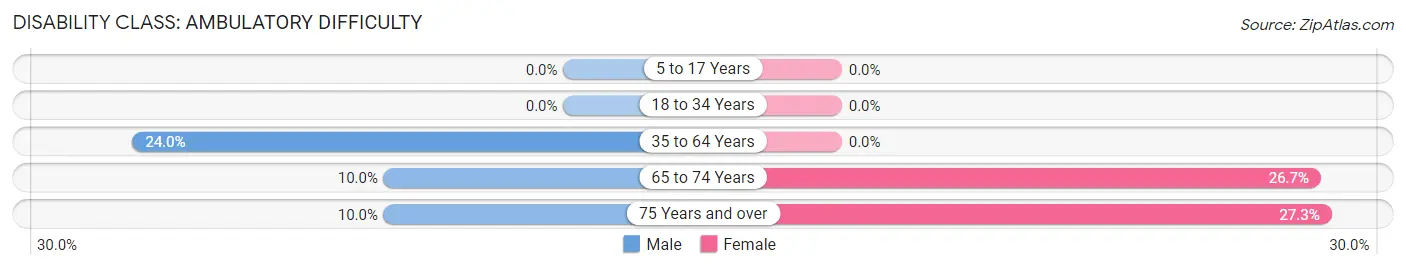
| Age Bracket | Male | Female |
| 5 to 17 Years | 0 (0.0%) | 0 (0.0%) |
| 18 to 34 Years | 0 (0.0%) | 0 (0.0%) |
| 35 to 64 Years | 6 (24.0%) | 0 (0.0%) |
| 65 to 74 Years | 1 (10.0%) | 4 (26.7%) |
| 75 Years and over | 1 (10.0%) | 3 (27.3%) |
Disability Class: Self-Care Difficulty
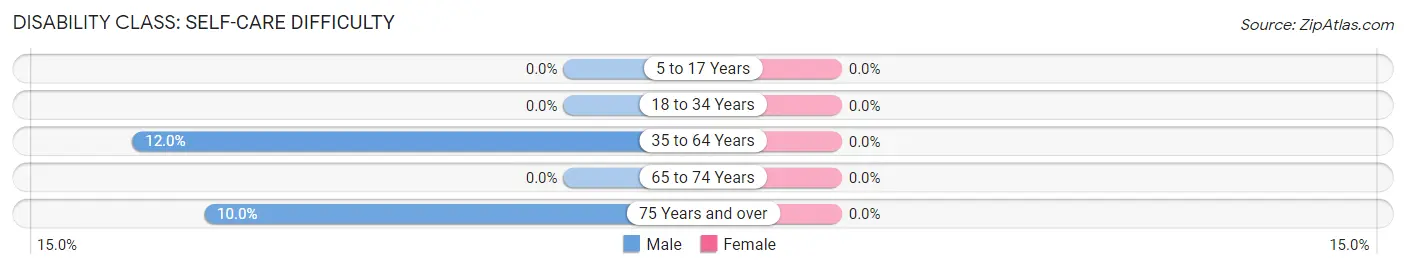
| Age Bracket | Male | Female |
| 5 to 17 Years | 0 (0.0%) | 0 (0.0%) |
| 18 to 34 Years | 0 (0.0%) | 0 (0.0%) |
| 35 to 64 Years | 3 (12.0%) | 0 (0.0%) |
| 65 to 74 Years | 0 (0.0%) | 0 (0.0%) |
| 75 Years and over | 1 (10.0%) | 0 (0.0%) |
Technology Access in Little Sioux
Computing Device Access in Little Sioux
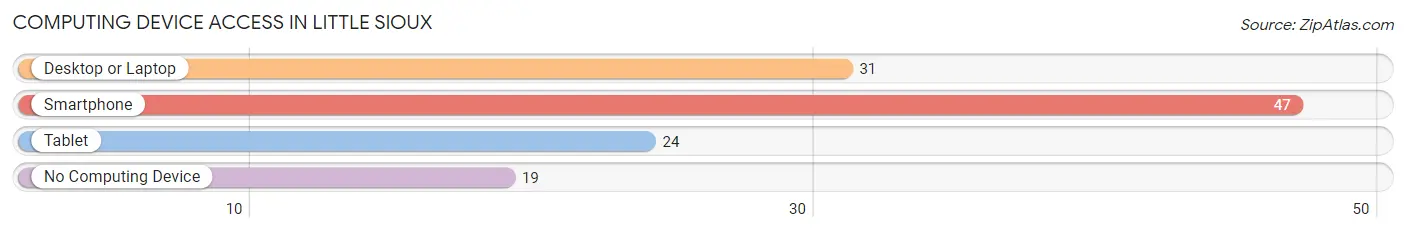
| Device Type | # Households | % Households |
| Desktop or Laptop | 31 | 43.1% |
| Smartphone | 47 | 65.3% |
| Tablet | 24 | 33.3% |
| No Computing Device | 19 | 26.4% |
| Total | 72 | 100.0% |
Internet Access in Little Sioux
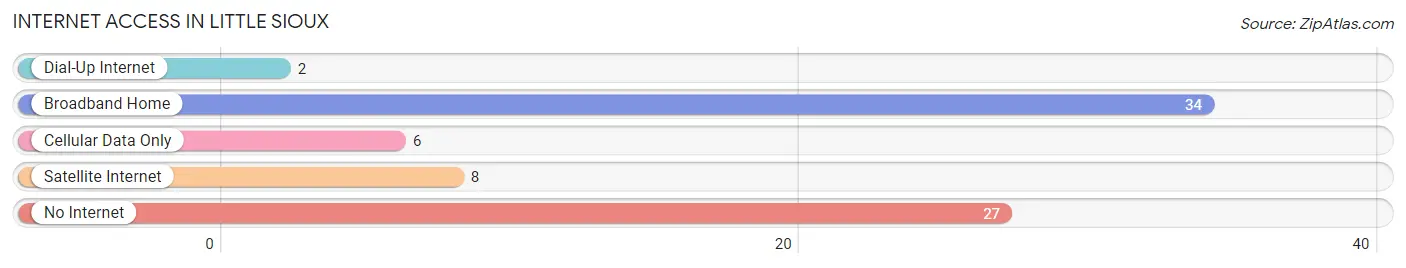
| Internet Type | # Households | % Households |
| Dial-Up Internet | 2 | 2.8% |
| Broadband Home | 34 | 47.2% |
| Cellular Data Only | 6 | 8.3% |
| Satellite Internet | 8 | 11.1% |
| No Internet | 27 | 37.5% |
| Total | 72 | 100.0% |
Little Sioux Summary
History
Little Sioux, Iowa is a small town located in Harrison County, Iowa. It is situated on the banks of the Little Sioux River, which is a tributary of the Missouri River. The town was founded in 1856 by a group of settlers from Ohio, led by William and Mary Ann Little. The town was named after the river, and the first post office was established in 1857.
The town grew slowly but steadily over the years, and by the early 1900s, it had become a thriving agricultural community. The town was home to several businesses, including a general store, a blacksmith shop, a hotel, and a sawmill. The town also had a school, a church, and a post office.
In the early 1900s, the town was also home to a large number of Native Americans, who had been relocated to the area from other parts of the country. The Native Americans were mainly members of the Omaha and Ponca tribes, and they lived in a small settlement near the town.
In the late 1940s, the town was hit by a devastating flood, which destroyed much of the town and caused extensive damage to the surrounding area. The town was rebuilt, but the population never fully recovered.
Geography
Little Sioux is located in the northwest corner of Harrison County, Iowa. It is situated on the banks of the Little Sioux River, which is a tributary of the Missouri River. The town is located about 25 miles south of Sioux City, Iowa, and about 50 miles north of Omaha, Nebraska.
The town is located in a rural area, and the surrounding landscape is mostly flat, with some rolling hills. The town is surrounded by farmland, and the main crops grown in the area are corn, soybeans, and hay.
Economy
The economy of Little Sioux is largely based on agriculture. The town is home to several farms, and the main crops grown in the area are corn, soybeans, and hay. The town also has a few small businesses, including a general store, a blacksmith shop, and a sawmill.
The town is also home to a few manufacturing companies, including a furniture factory and a plastics factory. The town also has a few restaurants and bars, as well as a few small shops.
Demographics
As of the 2010 census, the population of Little Sioux was 1,093. The racial makeup of the town was 97.3% White, 0.7% African American, 0.3% Native American, 0.2% Asian, 0.1% Pacific Islander, and 1.4% from other races. The median household income was $41,250, and the median family income was $48,750.
Conclusion
Little Sioux, Iowa is a small town located in Harrison County, Iowa. It is situated on the banks of the Little Sioux River, and it was founded in 1856 by a group of settlers from Ohio. The town has a long history of agriculture, and it is still largely based on farming today. The town also has a few small businesses, and the population is mostly White.
Common Questions
What is Per Capita Income in Little Sioux?
Per Capita income in Little Sioux is $18,116.
What is the Median Family Income in Little Sioux?
Median Family Income in Little Sioux is $60,625.
What is the Median Household income in Little Sioux?
Median Household Income in Little Sioux is $38,000.
What is Inequality or Gini Index in Little Sioux?
Inequality or Gini Index in Little Sioux is 0.48.
What is the Total Population of Little Sioux?
Total Population of Little Sioux is 179.
What is the Total Male Population of Little Sioux?
Total Male Population of Little Sioux is 79.
What is the Total Female Population of Little Sioux?
Total Female Population of Little Sioux is 100.
What is the Ratio of Males per 100 Females in Little Sioux?
There are 79.00 Males per 100 Females in Little Sioux.
What is the Ratio of Females per 100 Males in Little Sioux?
There are 126.58 Females per 100 Males in Little Sioux.
What is the Median Population Age in Little Sioux?
Median Population Age in Little Sioux is 40.4 Years.
What is the Average Family Size in Little Sioux
Average Family Size in Little Sioux is 4.1 People.
What is the Average Household Size in Little Sioux
Average Household Size in Little Sioux is 2.5 People.
How Large is the Labor Force in Little Sioux?
There are 51 People in the Labor Forcein in Little Sioux.
What is the Percentage of People in the Labor Force in Little Sioux?
43.6% of People are in the Labor Force in Little Sioux.