Bettendorf, IA Map & Demographics
Bettendorf Map
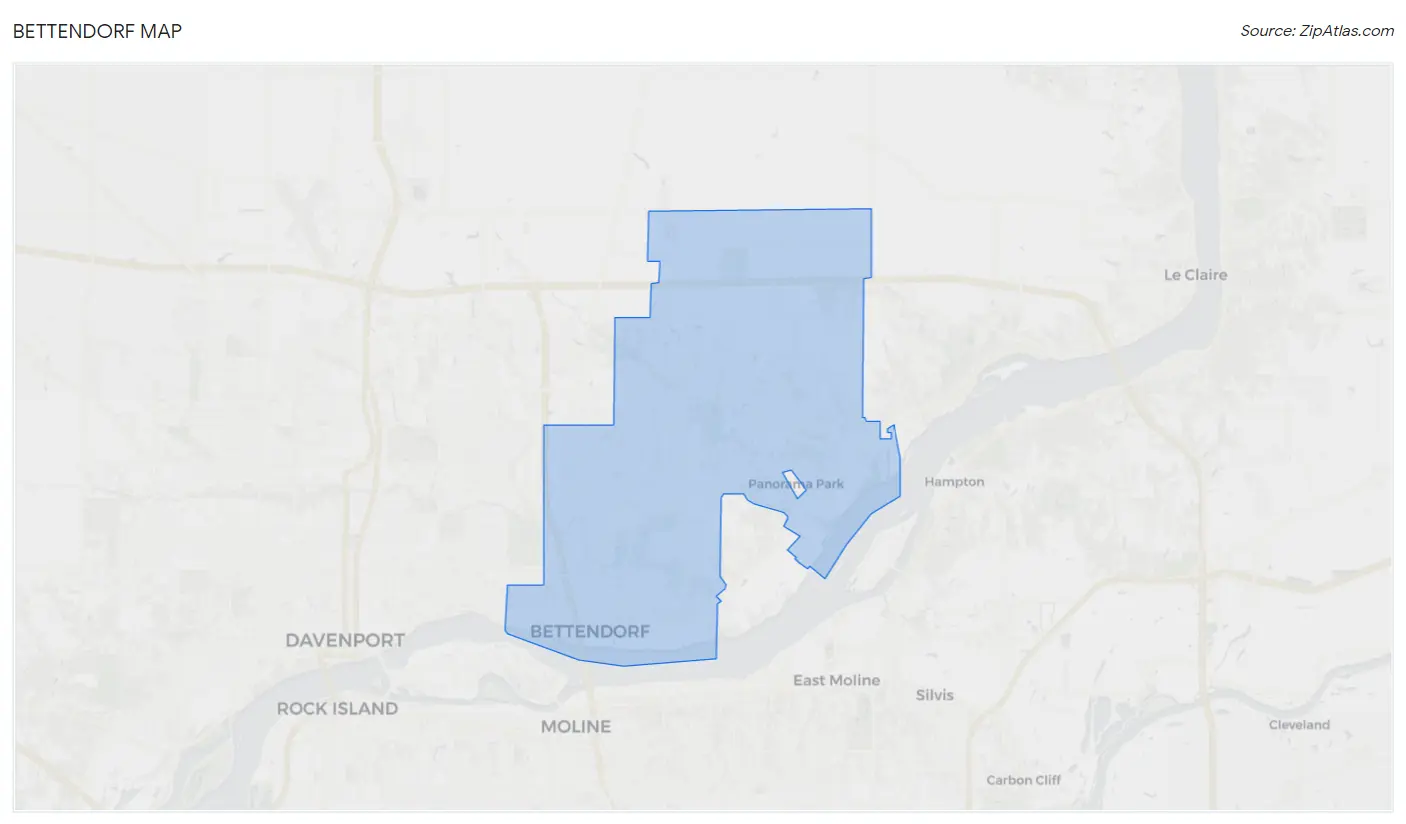
Bettendorf Overview
$52,830
PER CAPITA INCOME
$118,887
AVG FAMILY INCOME
$100,570
AVG HOUSEHOLD INCOME
37.2%
WAGE / INCOME GAP [ % ]
62.8¢/ $1
WAGE / INCOME GAP [ $ ]
$11,422
FAMILY INCOME DEFICIT
0.45
INEQUALITY / GINI INDEX
38,997
TOTAL POPULATION
18,922
MALE POPULATION
20,075
FEMALE POPULATION
94.26
MALES / 100 FEMALES
106.09
FEMALES / 100 MALES
39.2
MEDIAN AGE
3.0
AVG FAMILY SIZE
2.5
AVG HOUSEHOLD SIZE
20,266
LABOR FORCE [ PEOPLE ]
66.8%
PERCENT IN LABOR FORCE
2.4%
UNEMPLOYMENT RATE
Bettendorf Zip Codes
Bettendorf Area Codes
Income in Bettendorf
Income Overview in Bettendorf
Per Capita Income in Bettendorf is $52,830, while median incomes of families and households are $118,887 and $100,570 respectively.
| Characteristic | Number | Measure |
| Per Capita Income | 38,997 | $52,830 |
| Median Family Income | 10,606 | $118,887 |
| Mean Family Income | 10,606 | $155,849 |
| Median Household Income | 15,612 | $100,570 |
| Mean Household Income | 15,612 | $130,814 |
| Income Deficit | 10,606 | $11,422 |
| Wage / Income Gap (%) | 38,997 | 37.24% |
| Wage / Income Gap ($) | 38,997 | 62.76¢ per $1 |
| Gini / Inequality Index | 38,997 | 0.45 |
Earnings by Sex in Bettendorf
Average Earnings in Bettendorf are $56,351, $70,645 for men and $44,339 for women, a difference of 37.2%.
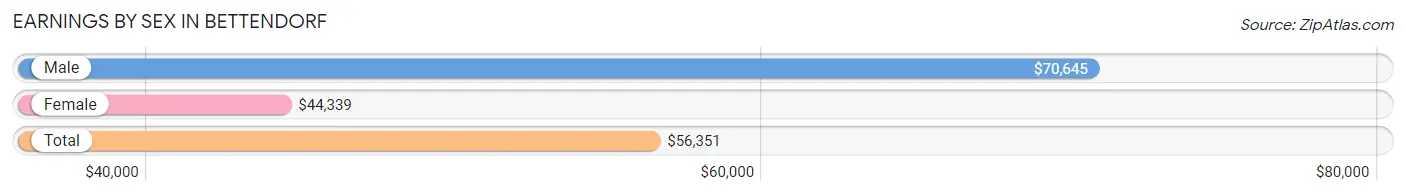
| Sex | Number | Average Earnings |
| Male | 11,397 (53.7%) | $70,645 |
| Female | 9,830 (46.3%) | $44,339 |
| Total | 21,227 (100.0%) | $56,351 |
Earnings by Sex by Income Bracket in Bettendorf
The most common earnings brackets in Bettendorf are $100,000+ for men (3,766 | 33.0%) and $100,000+ for women (1,583 | 16.1%).
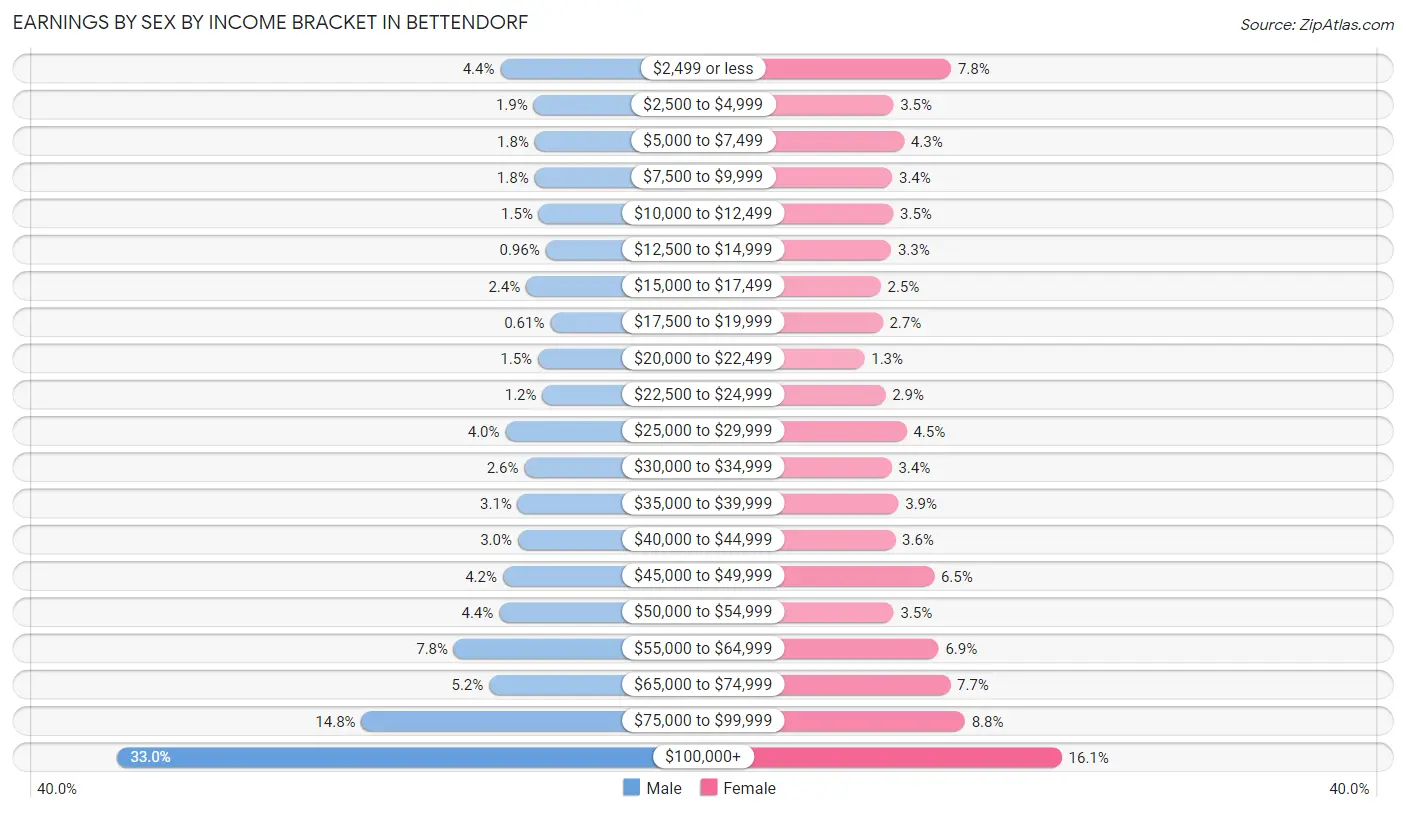
| Income | Male | Female |
| $2,499 or less | 496 (4.3%) | 768 (7.8%) |
| $2,500 to $4,999 | 212 (1.9%) | 342 (3.5%) |
| $5,000 to $7,499 | 202 (1.8%) | 421 (4.3%) |
| $7,500 to $9,999 | 204 (1.8%) | 333 (3.4%) |
| $10,000 to $12,499 | 168 (1.5%) | 341 (3.5%) |
| $12,500 to $14,999 | 109 (1.0%) | 325 (3.3%) |
| $15,000 to $17,499 | 276 (2.4%) | 249 (2.5%) |
| $17,500 to $19,999 | 69 (0.6%) | 262 (2.7%) |
| $20,000 to $22,499 | 174 (1.5%) | 129 (1.3%) |
| $22,500 to $24,999 | 137 (1.2%) | 283 (2.9%) |
| $25,000 to $29,999 | 453 (4.0%) | 439 (4.5%) |
| $30,000 to $34,999 | 291 (2.5%) | 329 (3.4%) |
| $35,000 to $39,999 | 348 (3.0%) | 379 (3.9%) |
| $40,000 to $44,999 | 346 (3.0%) | 356 (3.6%) |
| $45,000 to $49,999 | 474 (4.2%) | 642 (6.5%) |
| $50,000 to $54,999 | 506 (4.4%) | 344 (3.5%) |
| $55,000 to $64,999 | 892 (7.8%) | 675 (6.9%) |
| $65,000 to $74,999 | 592 (5.2%) | 761 (7.7%) |
| $75,000 to $99,999 | 1,682 (14.8%) | 869 (8.8%) |
| $100,000+ | 3,766 (33.0%) | 1,583 (16.1%) |
| Total | 11,397 (100.0%) | 9,830 (100.0%) |
Earnings by Sex by Educational Attainment in Bettendorf
Average earnings in Bettendorf are $79,797 for men and $49,803 for women, a difference of 37.6%. Men with an educational attainment of graduate degree enjoy the highest average annual earnings of $116,343, while those with high school diploma education earn the least with $51,063. Women with an educational attainment of graduate degree earn the most with the average annual earnings of $85,098, while those with high school diploma education have the smallest earnings of $32,440.
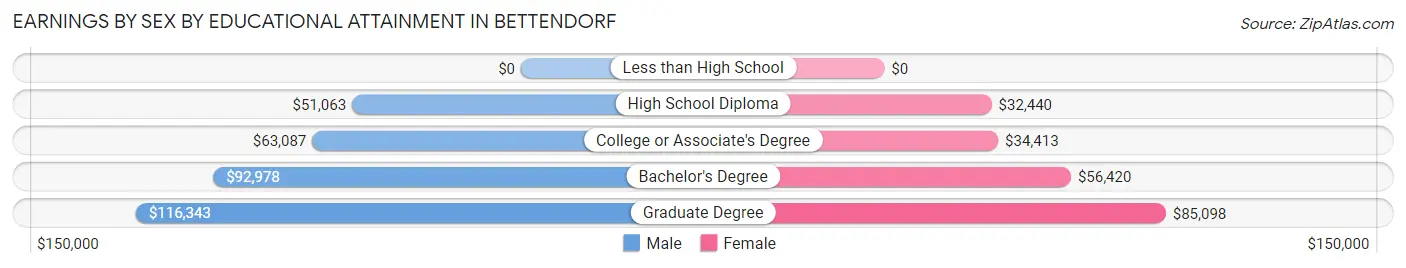
| Educational Attainment | Male Income | Female Income |
| Less than High School | - | - |
| High School Diploma | $51,063 | $32,440 |
| College or Associate's Degree | $63,087 | $34,413 |
| Bachelor's Degree | $92,978 | $56,420 |
| Graduate Degree | $116,343 | $85,098 |
| Total | $79,797 | $49,803 |
Family Income in Bettendorf
Family Income Brackets in Bettendorf
According to the Bettendorf family income data, there are 2,556 families falling into the $100,000 to $149,999 income range, which is the most common income bracket and makes up 24.1% of all families. Conversely, the $10,000 to $14,999 income bracket is the least frequent group with only 180 families (1.7%) belonging to this category.
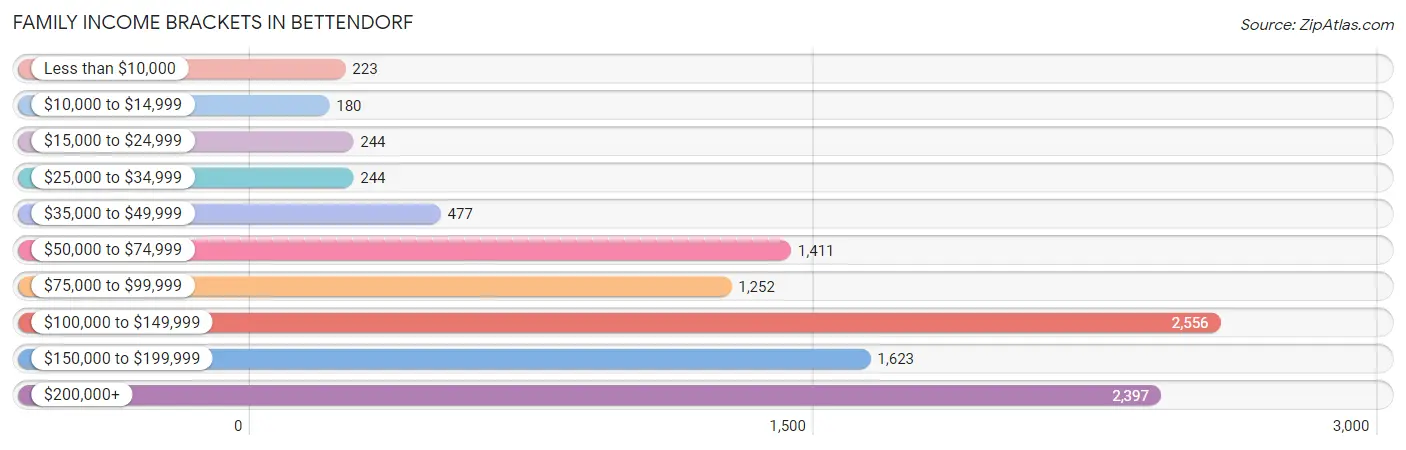
| Income Bracket | # Families | % Families |
| Less than $10,000 | 223 | 2.1% |
| $10,000 to $14,999 | 180 | 1.7% |
| $15,000 to $24,999 | 244 | 2.3% |
| $25,000 to $34,999 | 244 | 2.3% |
| $35,000 to $49,999 | 477 | 4.5% |
| $50,000 to $74,999 | 1,411 | 13.3% |
| $75,000 to $99,999 | 1,252 | 11.8% |
| $100,000 to $149,999 | 2,556 | 24.1% |
| $150,000 to $199,999 | 1,623 | 15.3% |
| $200,000+ | 2,397 | 22.6% |
Family Income by Famaliy Size in Bettendorf
5-person families (742 | 7.0%) account for the highest median family income in Bettendorf with $160,735 per family, while 2-person families (4,778 | 45.1%) have the highest median income of $51,105 per family member.
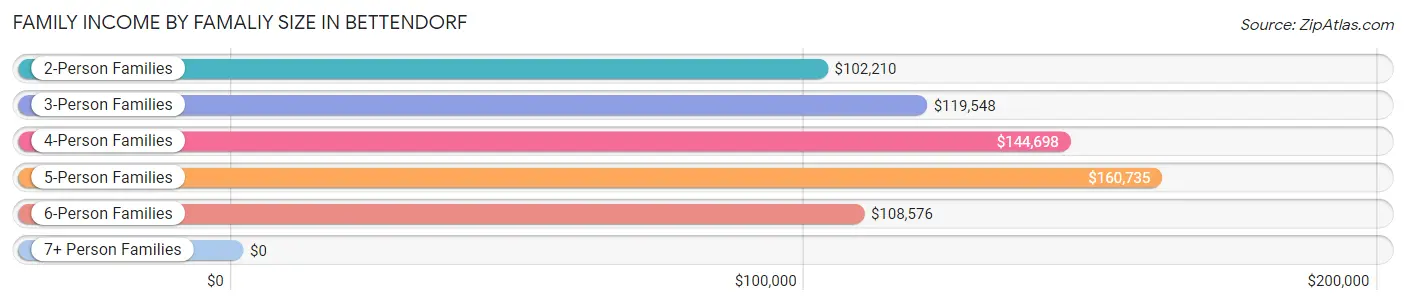
| Income Bracket | # Families | Median Income |
| 2-Person Families | 4,778 (45.1%) | $102,210 |
| 3-Person Families | 2,475 (23.3%) | $119,548 |
| 4-Person Families | 2,337 (22.0%) | $144,698 |
| 5-Person Families | 742 (7.0%) | $160,735 |
| 6-Person Families | 239 (2.2%) | $108,576 |
| 7+ Person Families | 35 (0.3%) | $0 |
| Total | 10,606 (100.0%) | $118,887 |
Family Income by Number of Earners in Bettendorf
The median family income in Bettendorf is $118,887, with families comprising 3+ earners (1,144) having the highest median family income of $180,921, while families with no earners (1,465) have the lowest median family income of $69,063, accounting for 10.8% and 13.8% of families, respectively.
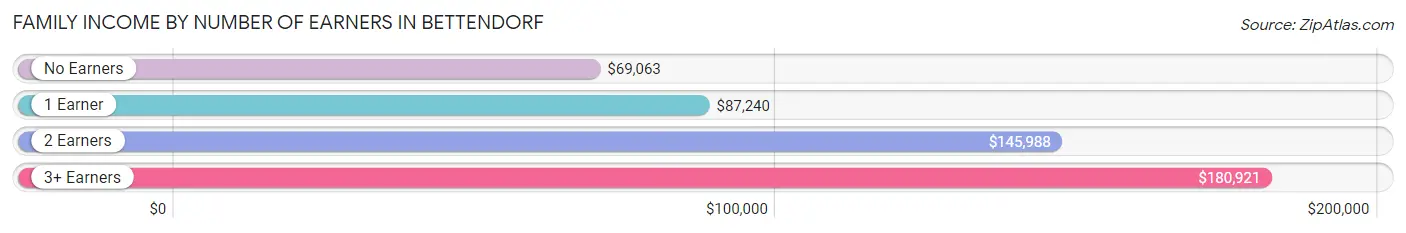
| Number of Earners | # Families | Median Income |
| No Earners | 1,465 (13.8%) | $69,063 |
| 1 Earner | 2,845 (26.8%) | $87,240 |
| 2 Earners | 5,152 (48.6%) | $145,988 |
| 3+ Earners | 1,144 (10.8%) | $180,921 |
| Total | 10,606 (100.0%) | $118,887 |
Household Income in Bettendorf
Household Income Brackets in Bettendorf
With 3,513 households falling in the category, the $100,000 to $149,999 income range is the most frequent in Bettendorf, accounting for 22.5% of all households. In contrast, only 328 households (2.1%) fall into the $10,000 to $14,999 income bracket, making it the least populous group.
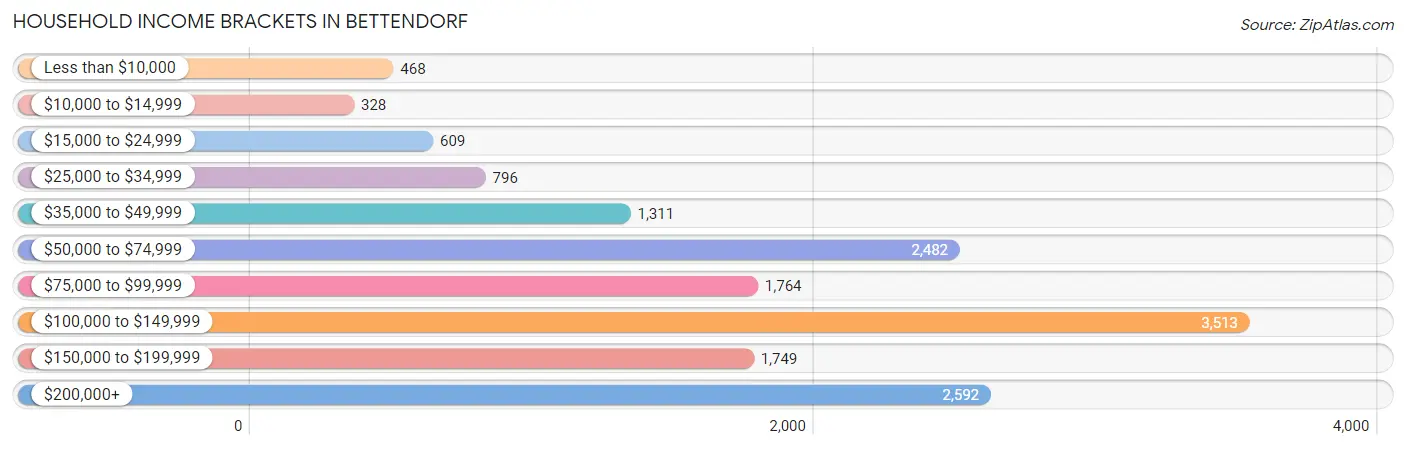
| Income Bracket | # Households | % Households |
| Less than $10,000 | 468 | 3.0% |
| $10,000 to $14,999 | 328 | 2.1% |
| $15,000 to $24,999 | 609 | 3.9% |
| $25,000 to $34,999 | 796 | 5.1% |
| $35,000 to $49,999 | 1,311 | 8.4% |
| $50,000 to $74,999 | 2,482 | 15.9% |
| $75,000 to $99,999 | 1,764 | 11.3% |
| $100,000 to $149,999 | 3,513 | 22.5% |
| $150,000 to $199,999 | 1,749 | 11.2% |
| $200,000+ | 2,592 | 16.6% |
Household Income by Householder Age in Bettendorf
The median household income in Bettendorf is $100,570, with the highest median household income of $131,076 found in the 45 to 64 years age bracket for the primary householder. A total of 5,525 households (35.4%) fall into this category. Meanwhile, the 15 to 24 years age bracket for the primary householder has the lowest median household income of $36,175, with 425 households (2.7%) in this group.
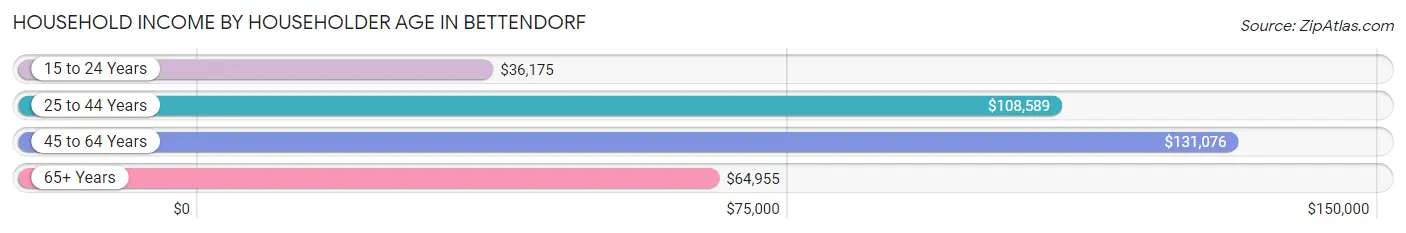
| Income Bracket | # Households | Median Income |
| 15 to 24 Years | 425 (2.7%) | $36,175 |
| 25 to 44 Years | 5,392 (34.5%) | $108,589 |
| 45 to 64 Years | 5,525 (35.4%) | $131,076 |
| 65+ Years | 4,270 (27.4%) | $64,955 |
| Total | 15,612 (100.0%) | $100,570 |
Poverty in Bettendorf
Income Below Poverty by Sex and Age in Bettendorf
With 5.2% poverty level for males and 9.4% for females among the residents of Bettendorf, 6 to 11 year old males and 18 to 24 year old females are the most vulnerable to poverty, with 229 males (13.5%) and 381 females (25.7%) in their respective age groups living below the poverty level.
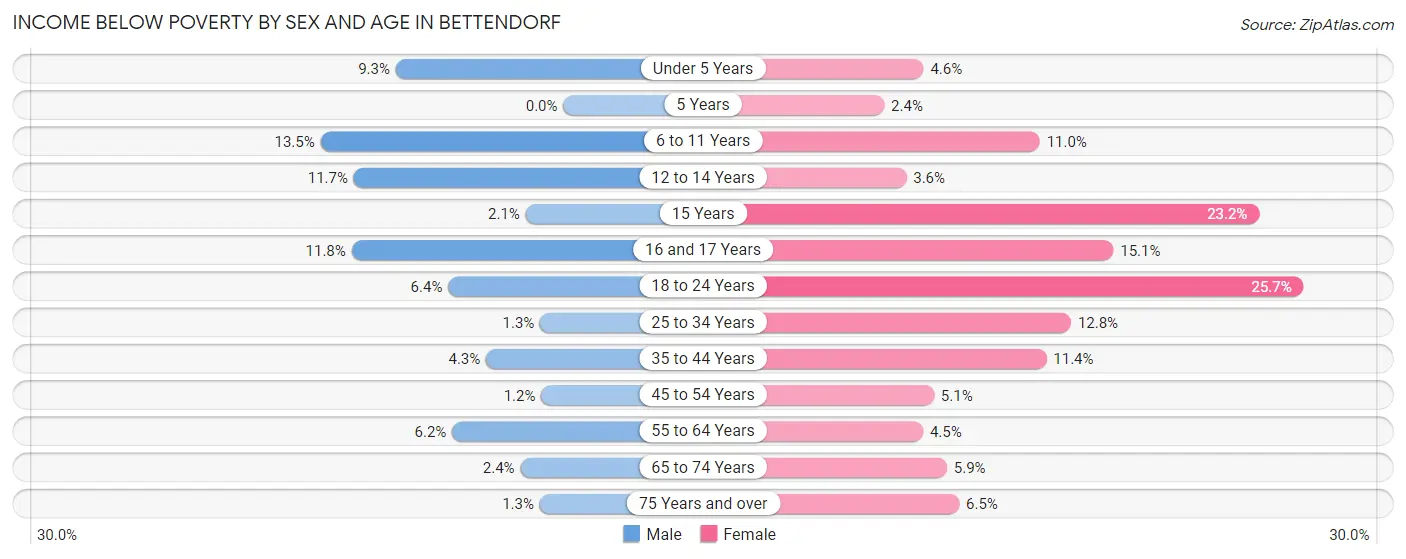
| Age Bracket | Male | Female |
| Under 5 Years | 108 (9.3%) | 51 (4.5%) |
| 5 Years | 0 (0.0%) | 5 (2.4%) |
| 6 to 11 Years | 229 (13.5%) | 170 (11.0%) |
| 12 to 14 Years | 100 (11.7%) | 38 (3.6%) |
| 15 Years | 6 (2.1%) | 56 (23.2%) |
| 16 and 17 Years | 68 (11.8%) | 116 (15.1%) |
| 18 to 24 Years | 81 (6.4%) | 381 (25.7%) |
| 25 to 34 Years | 29 (1.3%) | 260 (12.8%) |
| 35 to 44 Years | 112 (4.3%) | 336 (11.4%) |
| 45 to 54 Years | 30 (1.2%) | 132 (5.1%) |
| 55 to 64 Years | 155 (6.2%) | 97 (4.5%) |
| 65 to 74 Years | 40 (2.4%) | 125 (5.9%) |
| 75 Years and over | 15 (1.3%) | 105 (6.5%) |
| Total | 973 (5.2%) | 1,872 (9.4%) |
Income Above Poverty by Sex and Age in Bettendorf
According to the poverty statistics in Bettendorf, males aged 5 years and females aged 5 years are the age groups that are most secure financially, with 100.0% of males and 97.6% of females in these age groups living above the poverty line.
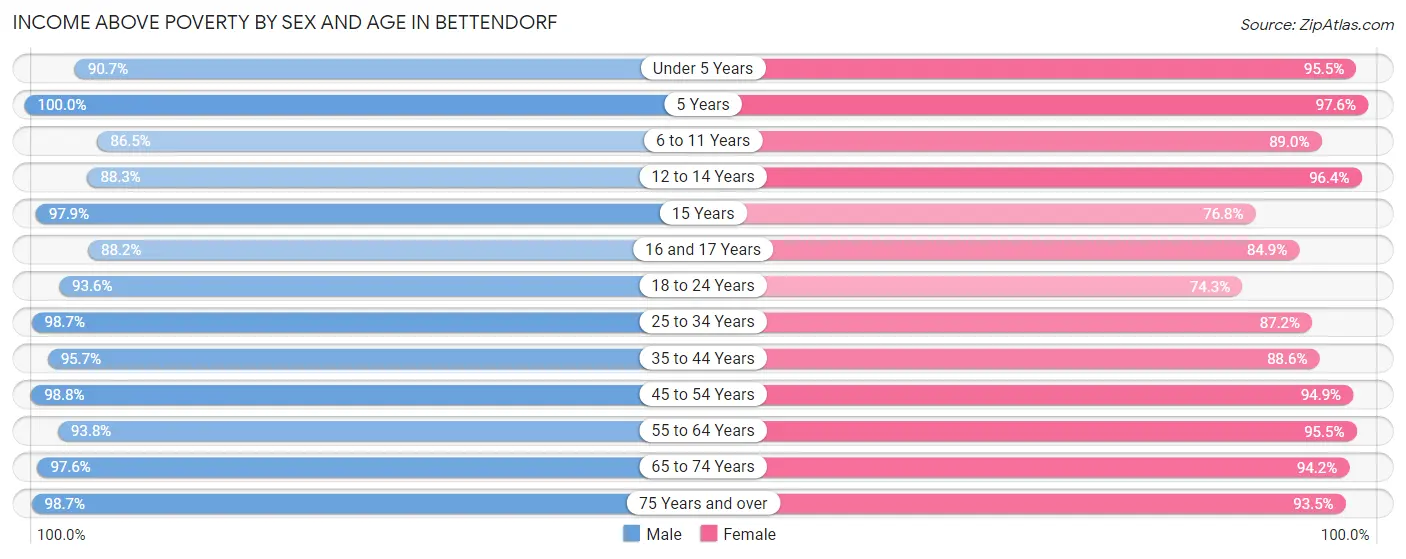
| Age Bracket | Male | Female |
| Under 5 Years | 1,050 (90.7%) | 1,071 (95.5%) |
| 5 Years | 369 (100.0%) | 207 (97.6%) |
| 6 to 11 Years | 1,465 (86.5%) | 1,373 (89.0%) |
| 12 to 14 Years | 757 (88.3%) | 1,021 (96.4%) |
| 15 Years | 280 (97.9%) | 185 (76.8%) |
| 16 and 17 Years | 509 (88.2%) | 651 (84.9%) |
| 18 to 24 Years | 1,182 (93.6%) | 1,101 (74.3%) |
| 25 to 34 Years | 2,222 (98.7%) | 1,778 (87.2%) |
| 35 to 44 Years | 2,492 (95.7%) | 2,614 (88.6%) |
| 45 to 54 Years | 2,413 (98.8%) | 2,442 (94.9%) |
| 55 to 64 Years | 2,348 (93.8%) | 2,047 (95.5%) |
| 65 to 74 Years | 1,636 (97.6%) | 2,011 (94.2%) |
| 75 Years and over | 1,133 (98.7%) | 1,502 (93.5%) |
| Total | 17,856 (94.8%) | 18,003 (90.6%) |
Income Below Poverty Among Married-Couple Families in Bettendorf
The poverty statistics for married-couple families in Bettendorf show that 1.1% or 91 of the total 8,511 families live below the poverty line. Families with 1 or 2 children have the highest poverty rate of 1.7%, comprising of 55 families. On the other hand, families with 3 or 4 children have the lowest poverty rate of 0.0%, which includes 0 families.
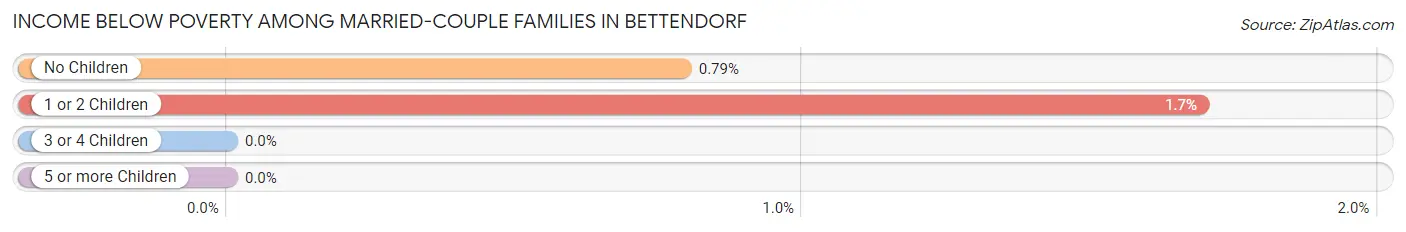
| Children | Above Poverty | Below Poverty |
| No Children | 4,515 (99.2%) | 36 (0.8%) |
| 1 or 2 Children | 3,190 (98.3%) | 55 (1.7%) |
| 3 or 4 Children | 709 (100.0%) | 0 (0.0%) |
| 5 or more Children | 6 (100.0%) | 0 (0.0%) |
| Total | 8,420 (98.9%) | 91 (1.1%) |
Income Below Poverty Among Single-Parent Households in Bettendorf
According to the poverty data in Bettendorf, 9.2% or 65 single-father households and 30.9% or 429 single-mother households are living below the poverty line. Among single-father households, those with 5 or more children have the highest poverty rate, with 17 households (100.0%) experiencing poverty. Likewise, among single-mother households, those with 1 or 2 children have the highest poverty rate, with 429 households (45.6%) falling below the poverty line.
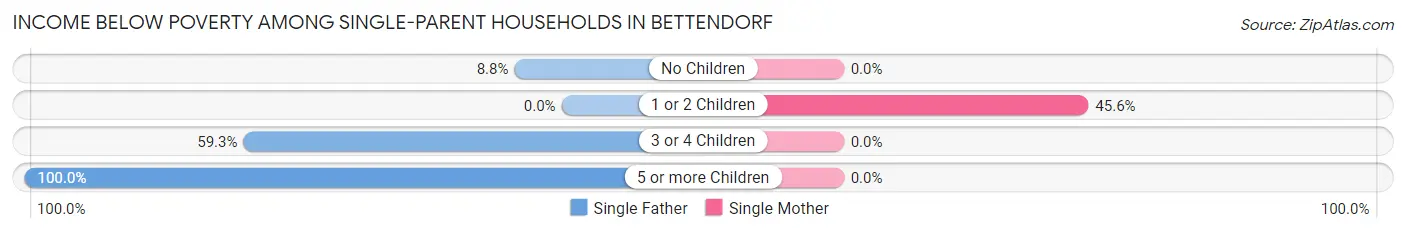
| Children | Single Father | Single Mother |
| No Children | 16 (8.8%) | 0 (0.0%) |
| 1 or 2 Children | 0 (0.0%) | 429 (45.6%) |
| 3 or 4 Children | 32 (59.3%) | 0 (0.0%) |
| 5 or more Children | 17 (100.0%) | 0 (0.0%) |
| Total | 65 (9.2%) | 429 (30.9%) |
Income Below Poverty Among Married-Couple vs Single-Parent Households in Bettendorf
The poverty data for Bettendorf shows that 91 of the married-couple family households (1.1%) and 494 of the single-parent households (23.6%) are living below the poverty level. Within the married-couple family households, those with 1 or 2 children have the highest poverty rate, with 55 households (1.7%) falling below the poverty line. Among the single-parent households, those with 5 or more children have the highest poverty rate, with 17 household (100.0%) living below poverty.
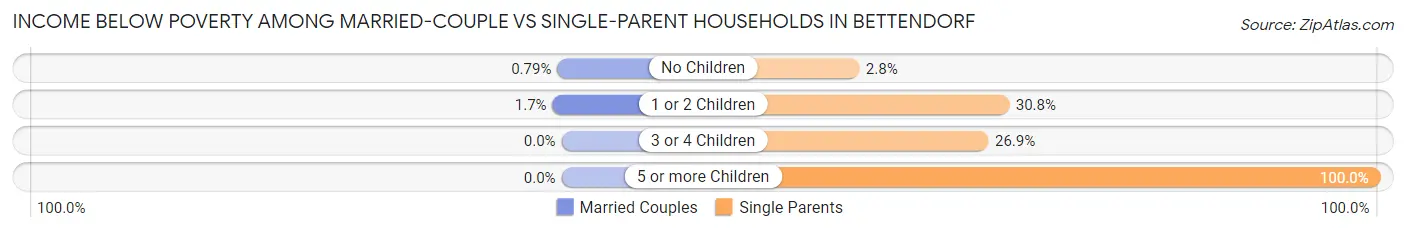
| Children | Married-Couple Families | Single-Parent Households |
| No Children | 36 (0.8%) | 16 (2.8%) |
| 1 or 2 Children | 55 (1.7%) | 429 (30.7%) |
| 3 or 4 Children | 0 (0.0%) | 32 (26.9%) |
| 5 or more Children | 0 (0.0%) | 17 (100.0%) |
| Total | 91 (1.1%) | 494 (23.6%) |
Race in Bettendorf
The most populous races in Bettendorf are White / Caucasian (33,182 | 85.1%), Asian (2,612 | 6.7%), and Two or more Races (2,224 | 5.7%).
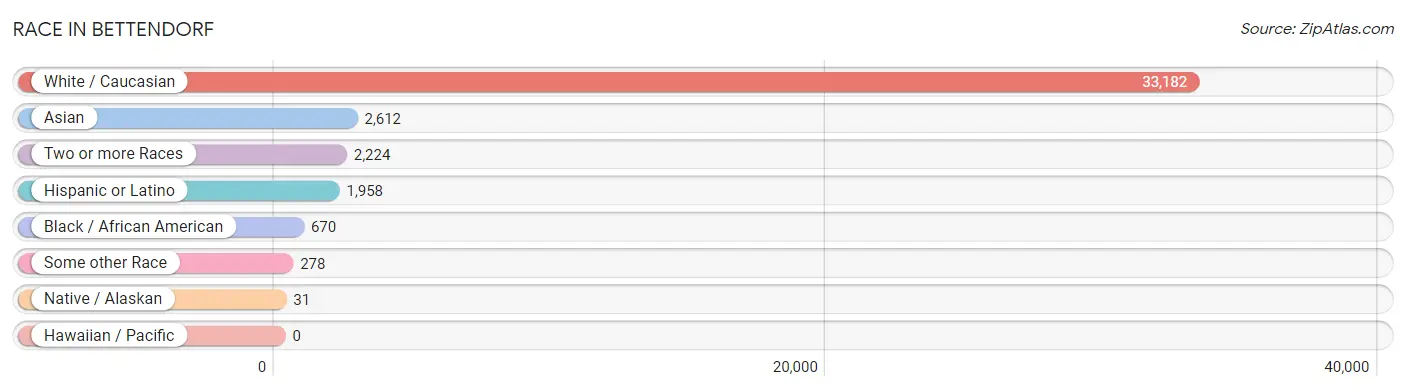
| Race | # Population | % Population |
| Asian | 2,612 | 6.7% |
| Black / African American | 670 | 1.7% |
| Hawaiian / Pacific | 0 | 0.0% |
| Hispanic or Latino | 1,958 | 5.0% |
| Native / Alaskan | 31 | 0.1% |
| White / Caucasian | 33,182 | 85.1% |
| Two or more Races | 2,224 | 5.7% |
| Some other Race | 278 | 0.7% |
| Total | 38,997 | 100.0% |
Ancestry in Bettendorf
The most populous ancestries reported in Bettendorf are German (12,986 | 33.3%), Irish (6,460 | 16.6%), English (4,065 | 10.4%), Mexican (1,655 | 4.2%), and Swedish (1,352 | 3.5%), together accounting for 68.0% of all Bettendorf residents.
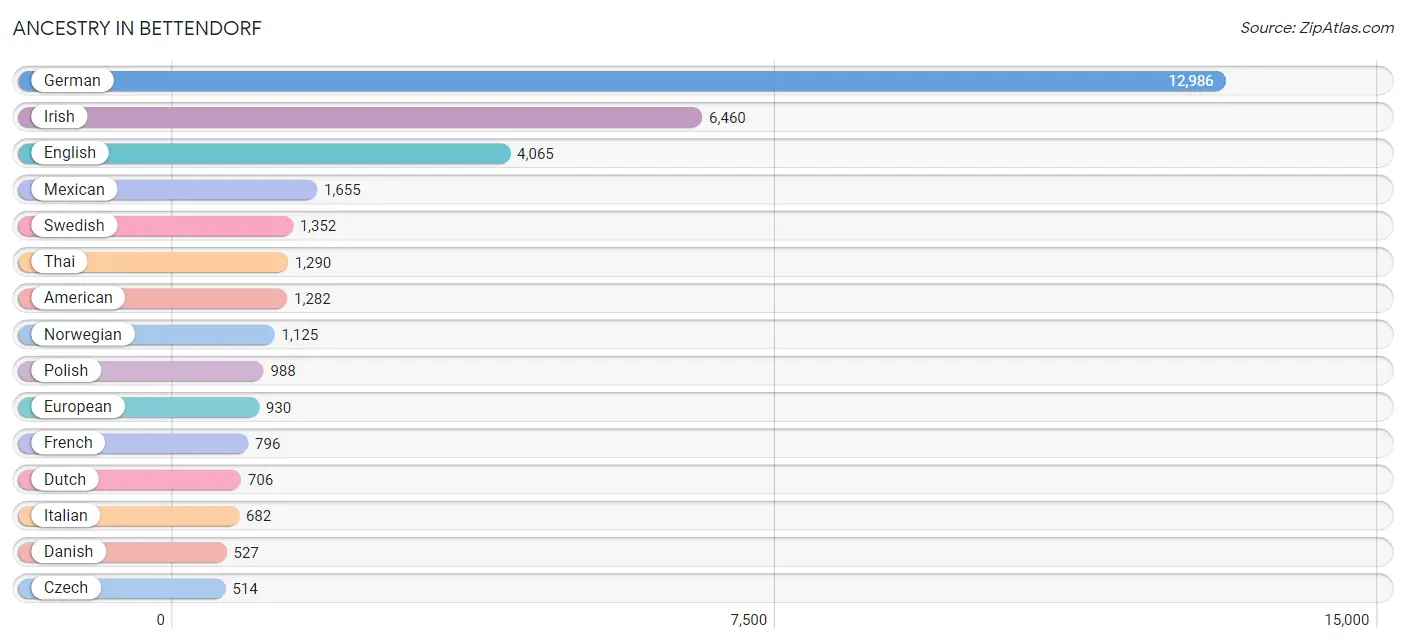
| Ancestry | # Population | % Population |
| American | 1,282 | 3.3% |
| Arab | 69 | 0.2% |
| Australian | 6 | 0.0% |
| Austrian | 31 | 0.1% |
| Belgian | 436 | 1.1% |
| Bhutanese | 107 | 0.3% |
| British | 222 | 0.6% |
| British West Indian | 14 | 0.0% |
| Burmese | 347 | 0.9% |
| Canadian | 17 | 0.0% |
| Central American | 83 | 0.2% |
| Cherokee | 63 | 0.2% |
| Chippewa | 2 | 0.0% |
| Choctaw | 22 | 0.1% |
| Colombian | 111 | 0.3% |
| Croatian | 195 | 0.5% |
| Cuban | 13 | 0.0% |
| Czech | 514 | 1.3% |
| Czechoslovakian | 13 | 0.0% |
| Danish | 527 | 1.3% |
| Dutch | 706 | 1.8% |
| Eastern European | 23 | 0.1% |
| Ecuadorian | 51 | 0.1% |
| Egyptian | 12 | 0.0% |
| English | 4,065 | 10.4% |
| Ethiopian | 1 | 0.0% |
| European | 930 | 2.4% |
| Finnish | 26 | 0.1% |
| French | 796 | 2.0% |
| French American Indian | 6 | 0.0% |
| French Canadian | 131 | 0.3% |
| German | 12,986 | 33.3% |
| Greek | 148 | 0.4% |
| Hungarian | 49 | 0.1% |
| Indian (Asian) | 362 | 0.9% |
| Indonesian | 1 | 0.0% |
| Iranian | 14 | 0.0% |
| Irish | 6,460 | 16.6% |
| Italian | 682 | 1.8% |
| Jamaican | 9 | 0.0% |
| Japanese | 64 | 0.2% |
| Korean | 164 | 0.4% |
| Laotian | 1 | 0.0% |
| Lithuanian | 65 | 0.2% |
| Luxembourger | 16 | 0.0% |
| Malaysian | 99 | 0.3% |
| Mexican | 1,655 | 4.2% |
| Mexican American Indian | 23 | 0.1% |
| Native Hawaiian | 20 | 0.1% |
| Northern European | 106 | 0.3% |
| Norwegian | 1,125 | 2.9% |
| Pakistani | 10 | 0.0% |
| Palestinian | 44 | 0.1% |
| Polish | 988 | 2.5% |
| Puerto Rican | 29 | 0.1% |
| Russian | 128 | 0.3% |
| Salvadoran | 83 | 0.2% |
| Samoan | 9 | 0.0% |
| Scandinavian | 151 | 0.4% |
| Scotch-Irish | 375 | 1.0% |
| Scottish | 486 | 1.3% |
| Sioux | 32 | 0.1% |
| Slovak | 8 | 0.0% |
| South American | 162 | 0.4% |
| Spanish | 11 | 0.0% |
| Spanish American Indian | 5 | 0.0% |
| Sri Lankan | 70 | 0.2% |
| Subsaharan African | 16 | 0.0% |
| Swedish | 1,352 | 3.5% |
| Swiss | 82 | 0.2% |
| Syrian | 13 | 0.0% |
| Thai | 1,290 | 3.3% |
| Vietnamese | 120 | 0.3% |
| Welsh | 229 | 0.6% |
| West Indian | 14 | 0.0% |
| Yugoslavian | 17 | 0.0% | View All 76 Rows |
Immigrants in Bettendorf
The most numerous immigrant groups reported in Bettendorf came from Asia (1,911 | 4.9%), South Central Asia (1,323 | 3.4%), India (779 | 2.0%), Eastern Asia (358 | 0.9%), and Europe (305 | 0.8%), together accounting for 12.0% of all Bettendorf residents.
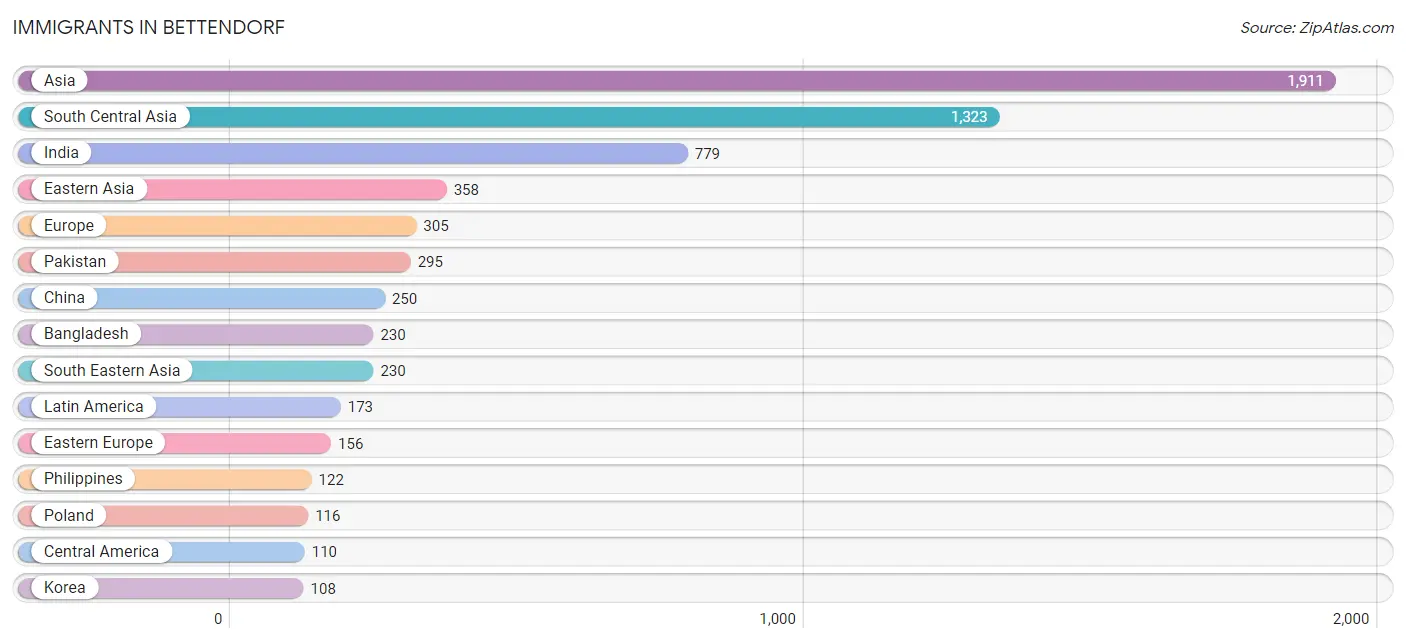
| Immigration Origin | # Population | % Population |
| Africa | 1 | 0.0% |
| Asia | 1,911 | 4.9% |
| Bangladesh | 230 | 0.6% |
| Bosnia and Herzegovina | 8 | 0.0% |
| Brazil | 5 | 0.0% |
| Cambodia | 26 | 0.1% |
| Canada | 72 | 0.2% |
| Caribbean | 23 | 0.1% |
| Central America | 110 | 0.3% |
| China | 250 | 0.6% |
| Colombia | 35 | 0.1% |
| Eastern Africa | 1 | 0.0% |
| Eastern Asia | 358 | 0.9% |
| Eastern Europe | 156 | 0.4% |
| El Salvador | 29 | 0.1% |
| England | 23 | 0.1% |
| Eritrea | 1 | 0.0% |
| Europe | 305 | 0.8% |
| Germany | 91 | 0.2% |
| Guatemala | 14 | 0.0% |
| Hong Kong | 45 | 0.1% |
| Hungary | 3 | 0.0% |
| India | 779 | 2.0% |
| Italy | 5 | 0.0% |
| Jamaica | 9 | 0.0% |
| Korea | 108 | 0.3% |
| Latin America | 173 | 0.4% |
| Mexico | 67 | 0.2% |
| Northern Europe | 53 | 0.1% |
| Pakistan | 295 | 0.8% |
| Philippines | 122 | 0.3% |
| Poland | 116 | 0.3% |
| Russia | 18 | 0.1% |
| South America | 40 | 0.1% |
| South Central Asia | 1,323 | 3.4% |
| South Eastern Asia | 230 | 0.6% |
| Southern Europe | 5 | 0.0% |
| Thailand | 64 | 0.2% |
| Uzbekistan | 13 | 0.0% |
| Vietnam | 18 | 0.1% |
| Western Europe | 91 | 0.2% | View All 41 Rows |
Sex and Age in Bettendorf
Sex and Age in Bettendorf
The most populous age groups in Bettendorf are 5 to 9 Years (1,501 | 7.9%) for men and 35 to 39 Years (1,745 | 8.7%) for women.
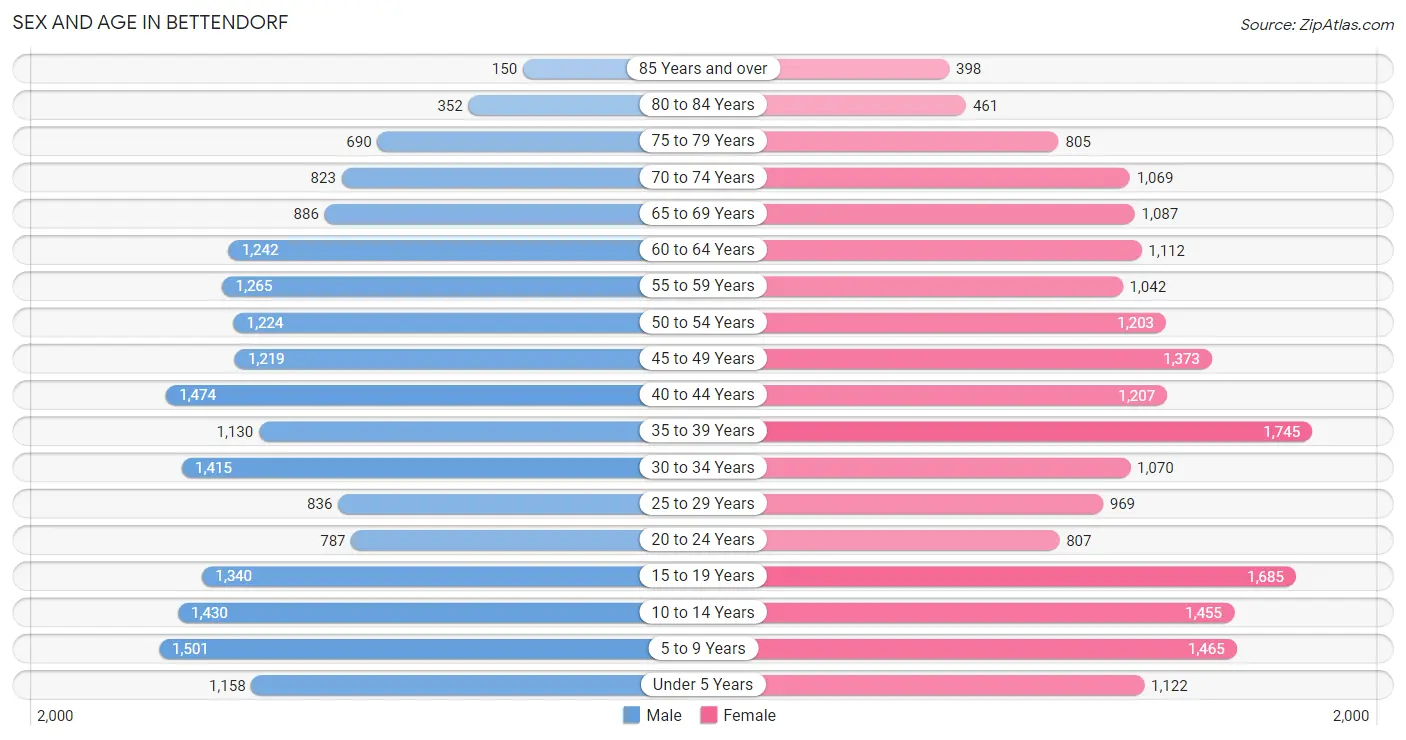
| Age Bracket | Male | Female |
| Under 5 Years | 1,158 (6.1%) | 1,122 (5.6%) |
| 5 to 9 Years | 1,501 (7.9%) | 1,465 (7.3%) |
| 10 to 14 Years | 1,430 (7.6%) | 1,455 (7.2%) |
| 15 to 19 Years | 1,340 (7.1%) | 1,685 (8.4%) |
| 20 to 24 Years | 787 (4.2%) | 807 (4.0%) |
| 25 to 29 Years | 836 (4.4%) | 969 (4.8%) |
| 30 to 34 Years | 1,415 (7.5%) | 1,070 (5.3%) |
| 35 to 39 Years | 1,130 (6.0%) | 1,745 (8.7%) |
| 40 to 44 Years | 1,474 (7.8%) | 1,207 (6.0%) |
| 45 to 49 Years | 1,219 (6.4%) | 1,373 (6.8%) |
| 50 to 54 Years | 1,224 (6.5%) | 1,203 (6.0%) |
| 55 to 59 Years | 1,265 (6.7%) | 1,042 (5.2%) |
| 60 to 64 Years | 1,242 (6.6%) | 1,112 (5.5%) |
| 65 to 69 Years | 886 (4.7%) | 1,087 (5.4%) |
| 70 to 74 Years | 823 (4.3%) | 1,069 (5.3%) |
| 75 to 79 Years | 690 (3.6%) | 805 (4.0%) |
| 80 to 84 Years | 352 (1.9%) | 461 (2.3%) |
| 85 Years and over | 150 (0.8%) | 398 (2.0%) |
| Total | 18,922 (100.0%) | 20,075 (100.0%) |
Families and Households in Bettendorf
Median Family Size in Bettendorf
The median family size in Bettendorf is 3.04 persons per family, with married-couple families (8,511 | 80.2%) accounting for the largest median family size of 3.09 persons per family. On the other hand, single male/father families (707 | 6.7%) represent the smallest median family size with 2.84 persons per family.
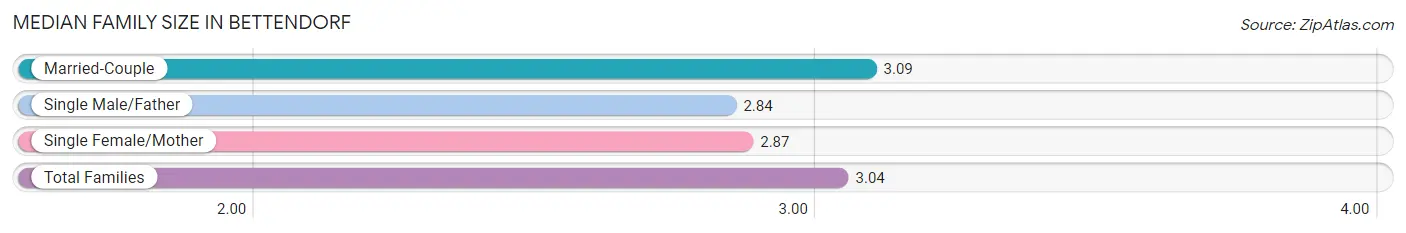
| Family Type | # Families | Family Size |
| Married-Couple | 8,511 (80.2%) | 3.09 |
| Single Male/Father | 707 (6.7%) | 2.84 |
| Single Female/Mother | 1,388 (13.1%) | 2.87 |
| Total Families | 10,606 (100.0%) | 3.04 |
Median Household Size in Bettendorf
The median household size in Bettendorf is 2.48 persons per household, with single male/father households (707 | 4.5%) accounting for the largest median household size of 3.37 persons per household. non-family households (5,006 | 32.1%) represent the smallest median household size with 1.17 persons per household.
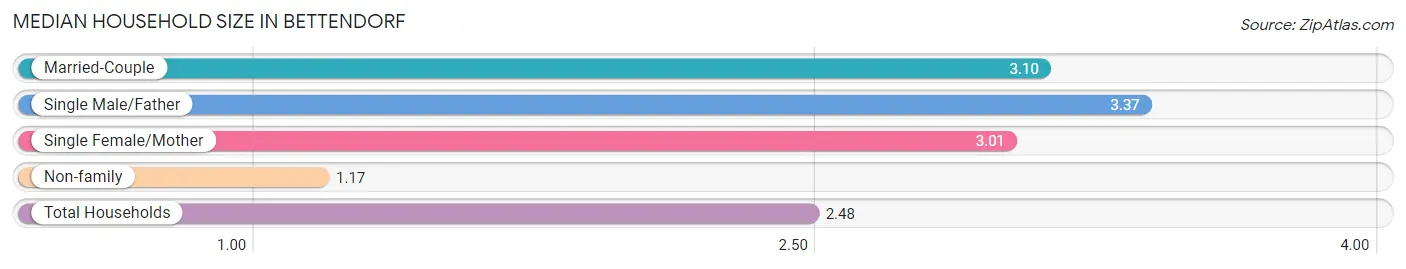
| Household Type | # Households | Household Size |
| Married-Couple | 8,511 (54.5%) | 3.10 |
| Single Male/Father | 707 (4.5%) | 3.37 |
| Single Female/Mother | 1,388 (8.9%) | 3.01 |
| Non-family | 5,006 (32.1%) | 1.17 |
| Total Households | 15,612 (100.0%) | 2.48 |
Household Size by Marriage Status in Bettendorf
Out of a total of 15,612 households in Bettendorf, 10,606 (67.9%) are family households, while 5,006 (32.1%) are nonfamily households. The most numerous type of family households are 2-person households, comprising 4,589, and the most common type of nonfamily households are 1-person households, comprising 4,294.
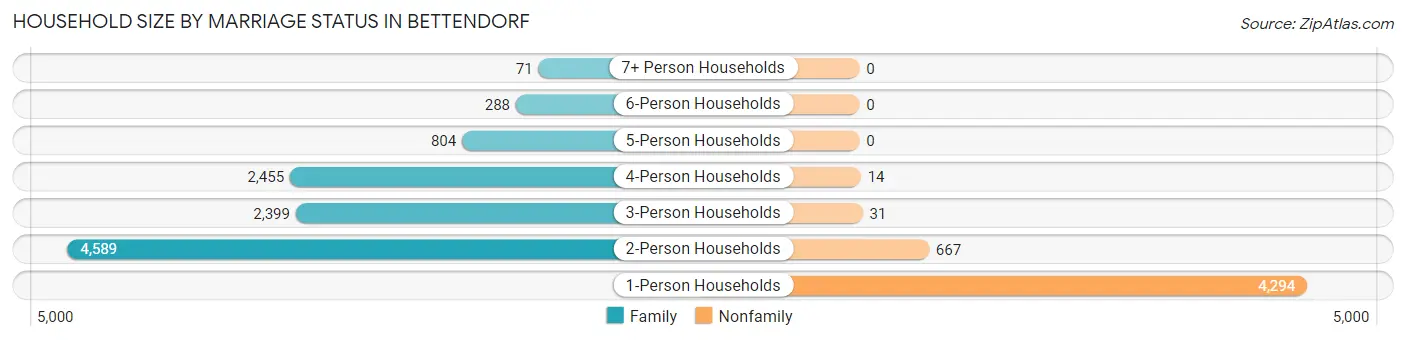
| Household Size | Family Households | Nonfamily Households |
| 1-Person Households | - | 4,294 (27.5%) |
| 2-Person Households | 4,589 (29.4%) | 667 (4.3%) |
| 3-Person Households | 2,399 (15.4%) | 31 (0.2%) |
| 4-Person Households | 2,455 (15.7%) | 14 (0.1%) |
| 5-Person Households | 804 (5.1%) | 0 (0.0%) |
| 6-Person Households | 288 (1.8%) | 0 (0.0%) |
| 7+ Person Households | 71 (0.4%) | 0 (0.0%) |
| Total | 10,606 (67.9%) | 5,006 (32.1%) |
Female Fertility in Bettendorf
Fertility by Age in Bettendorf
Average fertility rate in Bettendorf is 45.0 births per 1,000 women. Women in the age bracket of 20 to 34 years have the highest fertility rate with 113.0 births per 1,000 women. Women in the age bracket of 20 to 34 years acount for 77.9% of all women with births.
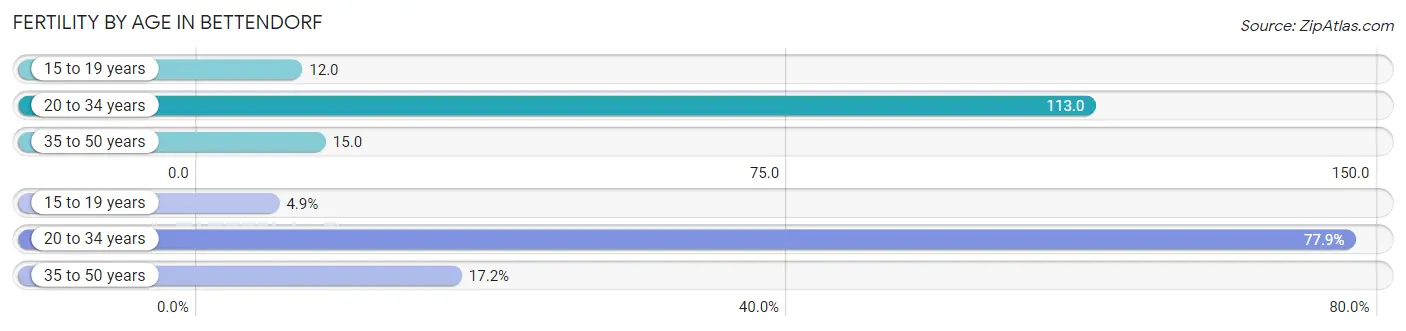
| Age Bracket | Women with Births | Births / 1,000 Women |
| 15 to 19 years | 20 (4.9%) | 12.0 |
| 20 to 34 years | 321 (77.9%) | 113.0 |
| 35 to 50 years | 71 (17.2%) | 15.0 |
| Total | 412 (100.0%) | 45.0 |
Fertility by Age by Marriage Status in Bettendorf
88.8% of women with births (412) in Bettendorf are married. The highest percentage of unmarried women with births falls into 15 to 19 years age bracket with 100.0% of them unmarried at the time of birth, while the lowest percentage of unmarried women with births belong to 35 to 50 years age bracket with 0.0% of them unmarried.
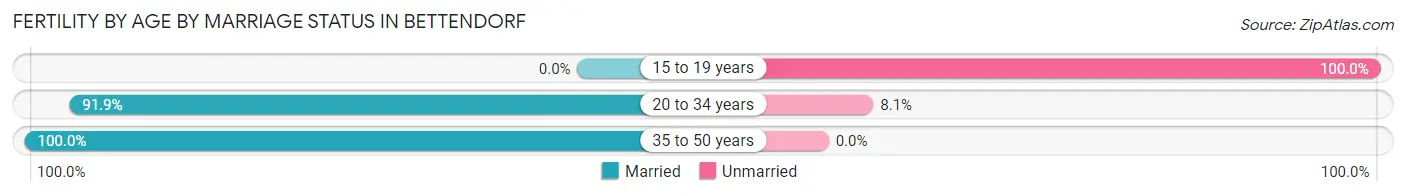
| Age Bracket | Married | Unmarried |
| 15 to 19 years | 0 (0.0%) | 20 (100.0%) |
| 20 to 34 years | 295 (91.9%) | 26 (8.1%) |
| 35 to 50 years | 71 (100.0%) | 0 (0.0%) |
| Total | 366 (88.8%) | 46 (11.2%) |
Fertility by Education in Bettendorf
Average fertility rate in Bettendorf is 45.0 births per 1,000 women. Women with the education attainment of bachelor's degree have the highest fertility rate of 78.0 births per 1,000 women, while women with the education attainment of less than high school have the lowest fertility at 14.0 births per 1,000 women. Women with the education attainment of bachelor's degree represent 47.1% of all women with births.
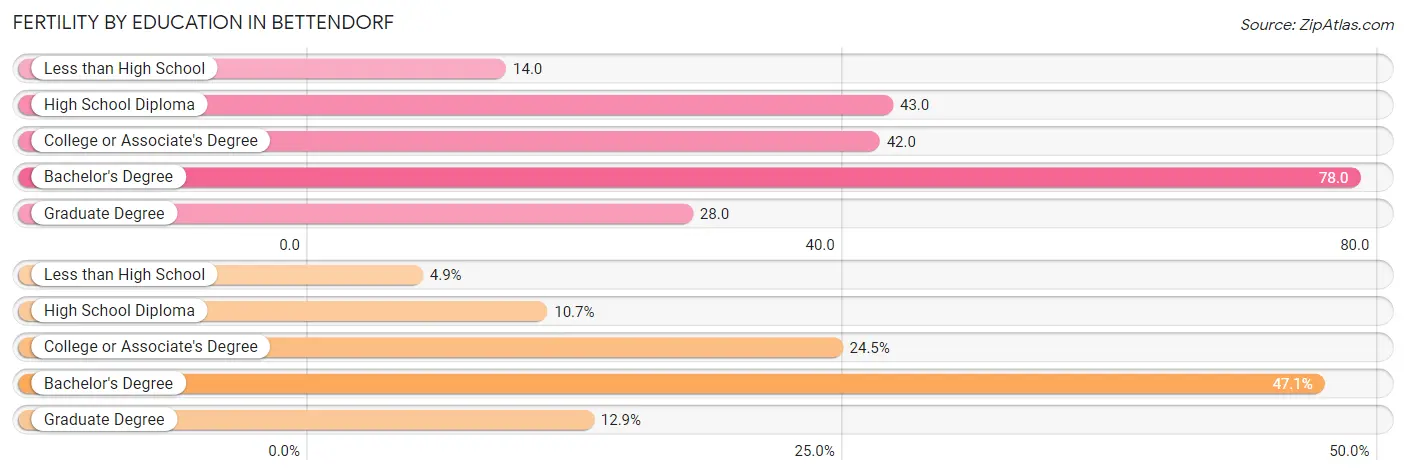
| Educational Attainment | Women with Births | Births / 1,000 Women |
| Less than High School | 20 (4.9%) | 14.0 |
| High School Diploma | 44 (10.7%) | 43.0 |
| College or Associate's Degree | 101 (24.5%) | 42.0 |
| Bachelor's Degree | 194 (47.1%) | 78.0 |
| Graduate Degree | 53 (12.9%) | 28.0 |
| Total | 412 (100.0%) | 45.0 |
Fertility by Education by Marriage Status in Bettendorf
11.2% of women with births in Bettendorf are unmarried. Women with the educational attainment of college or associate's degree are most likely to be married with 100.0% of them married at childbirth, while women with the educational attainment of less than high school are least likely to be married with 100.0% of them unmarried at childbirth.
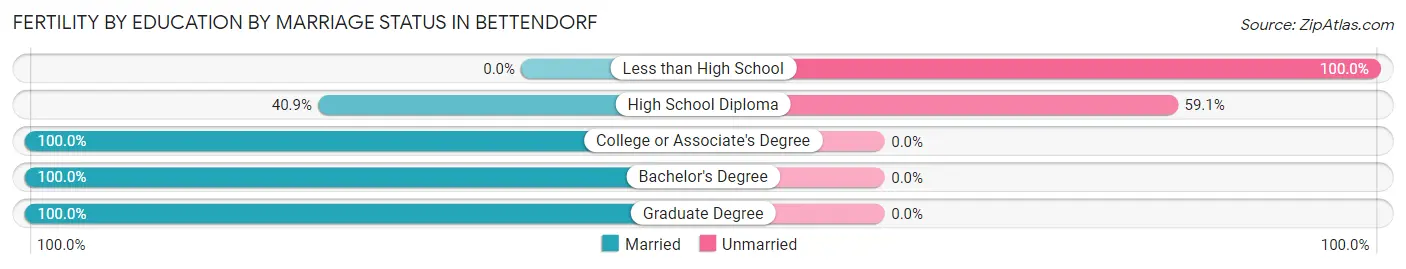
| Educational Attainment | Married | Unmarried |
| Less than High School | 0 (0.0%) | 20 (100.0%) |
| High School Diploma | 18 (40.9%) | 26 (59.1%) |
| College or Associate's Degree | 101 (100.0%) | 0 (0.0%) |
| Bachelor's Degree | 194 (100.0%) | 0 (0.0%) |
| Graduate Degree | 53 (100.0%) | 0 (0.0%) |
| Total | 366 (88.8%) | 46 (11.2%) |
Employment Characteristics in Bettendorf
Employment by Class of Employer in Bettendorf
Among the 19,436 employed individuals in Bettendorf, private company employees (13,022 | 67.0%), not-for-profit organizations (1,561 | 8.0%), and local government employees (1,425 | 7.3%) make up the most common classes of employment.
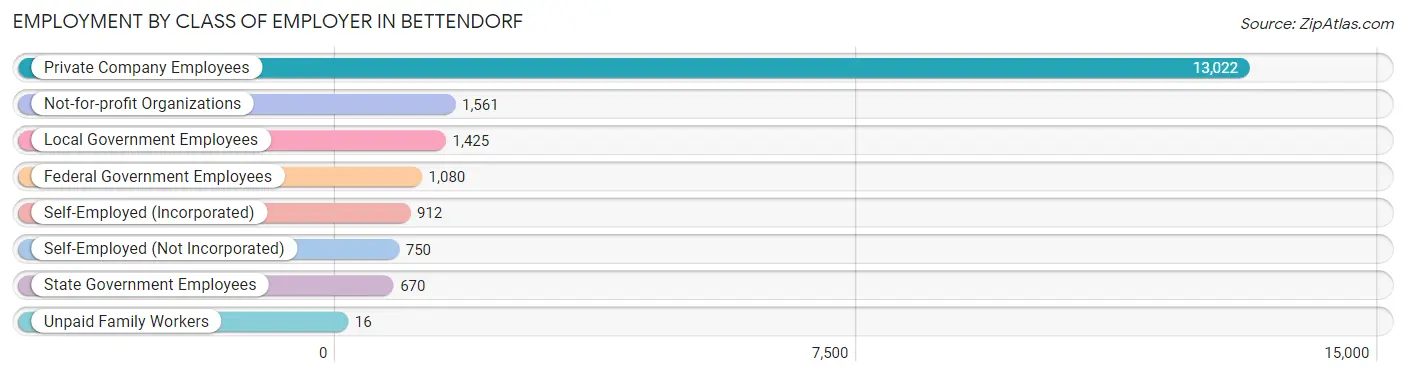
| Employer Class | # Employees | % Employees |
| Private Company Employees | 13,022 | 67.0% |
| Self-Employed (Incorporated) | 912 | 4.7% |
| Self-Employed (Not Incorporated) | 750 | 3.9% |
| Not-for-profit Organizations | 1,561 | 8.0% |
| Local Government Employees | 1,425 | 7.3% |
| State Government Employees | 670 | 3.5% |
| Federal Government Employees | 1,080 | 5.6% |
| Unpaid Family Workers | 16 | 0.1% |
| Total | 19,436 | 100.0% |
Employment Status by Age in Bettendorf
According to the labor force statistics for Bettendorf, out of the total population over 16 years of age (30,339), 66.8% or 20,266 individuals are in the labor force, with 2.4% or 486 of them unemployed. The age group with the highest labor force participation rate is 25 to 29 years, with 89.4% or 1,614 individuals in the labor force. Within the labor force, the 20 to 24 years age range has the highest percentage of unemployed individuals, with 12.8% or 172 of them being unemployed.
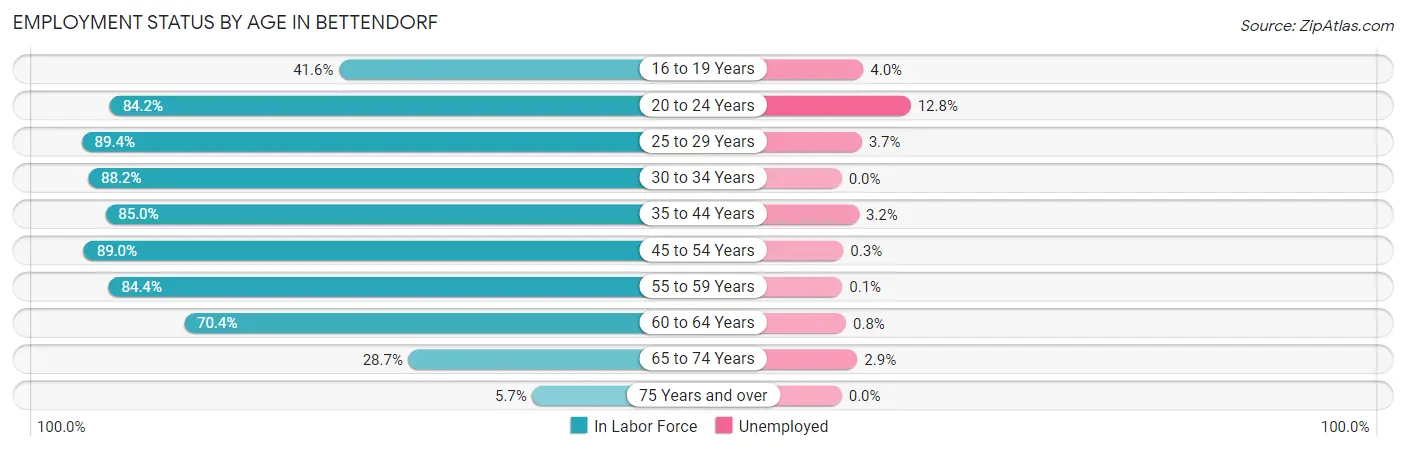
| Age Bracket | In Labor Force | Unemployed |
| 16 to 19 Years | 1,039 (41.6%) | 42 (4.0%) |
| 20 to 24 Years | 1,342 (84.2%) | 172 (12.8%) |
| 25 to 29 Years | 1,614 (89.4%) | 60 (3.7%) |
| 30 to 34 Years | 2,192 (88.2%) | 0 (0.0%) |
| 35 to 44 Years | 4,723 (85.0%) | 151 (3.2%) |
| 45 to 54 Years | 4,467 (89.0%) | 13 (0.3%) |
| 55 to 59 Years | 1,947 (84.4%) | 2 (0.1%) |
| 60 to 64 Years | 1,657 (70.4%) | 13 (0.8%) |
| 65 to 74 Years | 1,109 (28.7%) | 32 (2.9%) |
| 75 Years and over | 163 (5.7%) | 0 (0.0%) |
| Total | 20,266 (66.8%) | 486 (2.4%) |
Employment Status by Educational Attainment in Bettendorf
According to labor force statistics for Bettendorf, 85.0% of individuals (16,597) out of the total population between 25 and 64 years of age (19,526) are in the labor force, with 1.5% or 249 of them being unemployed. The group with the highest labor force participation rate are those with the educational attainment of bachelor's degree or higher, with 88.4% or 9,734 individuals in the labor force. Within the labor force, individuals with high school diploma education have the highest percentage of unemployment, with 4.4% or 100 of them being unemployed.
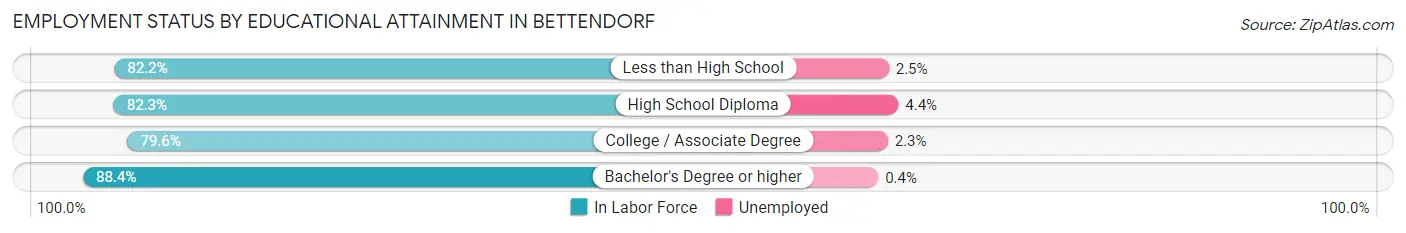
| Educational Attainment | In Labor Force | Unemployed |
| Less than High School | 366 (82.2%) | 11 (2.5%) |
| High School Diploma | 2,266 (82.3%) | 121 (4.4%) |
| College / Associate Degree | 4,232 (79.6%) | 122 (2.3%) |
| Bachelor's Degree or higher | 9,734 (88.4%) | 44 (0.4%) |
| Total | 16,597 (85.0%) | 293 (1.5%) |
Employment Occupations by Sex in Bettendorf
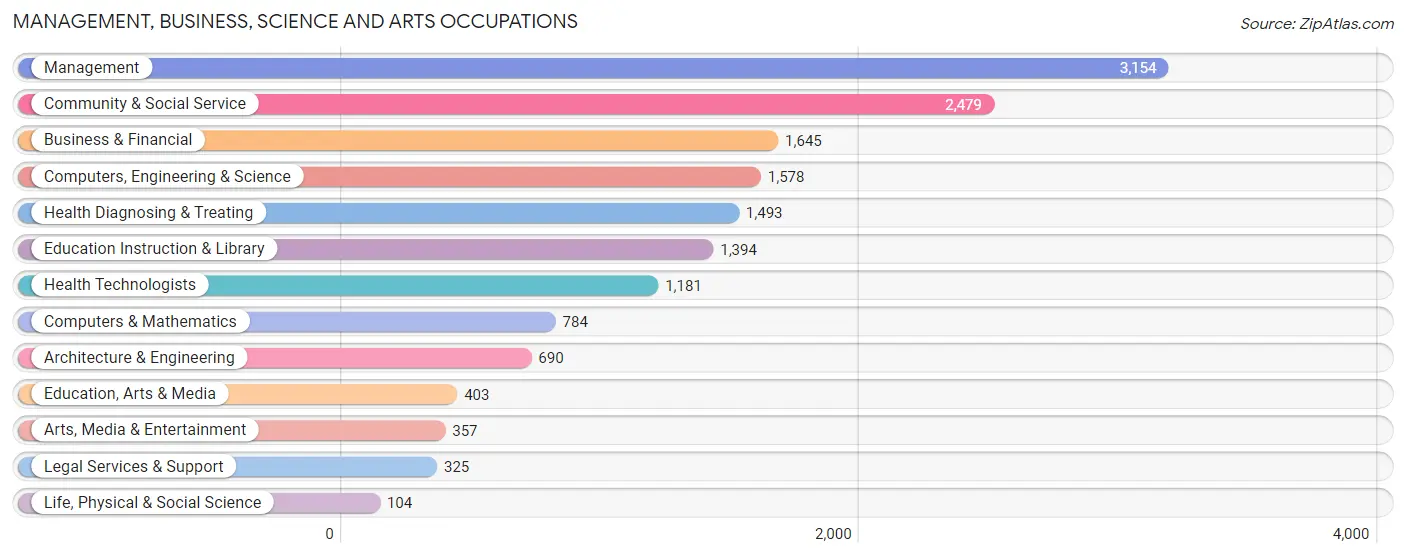
Management, Business, Science and Arts Occupations
The most common Management, Business, Science and Arts occupations in Bettendorf are Management (3,154 | 16.0%), Community & Social Service (2,479 | 12.6%), Business & Financial (1,645 | 8.3%), Computers, Engineering & Science (1,578 | 8.0%), and Health Diagnosing & Treating (1,493 | 7.6%).
Management, Business, Science and Arts Occupations by Sex
Within the Management, Business, Science and Arts occupations in Bettendorf, the most male-oriented occupations are Architecture & Engineering (94.2%), Computers, Engineering & Science (86.3%), and Computers & Mathematics (83.7%), while the most female-oriented occupations are Health Diagnosing & Treating (78.6%), Health Technologists (76.8%), and Education Instruction & Library (76.5%).
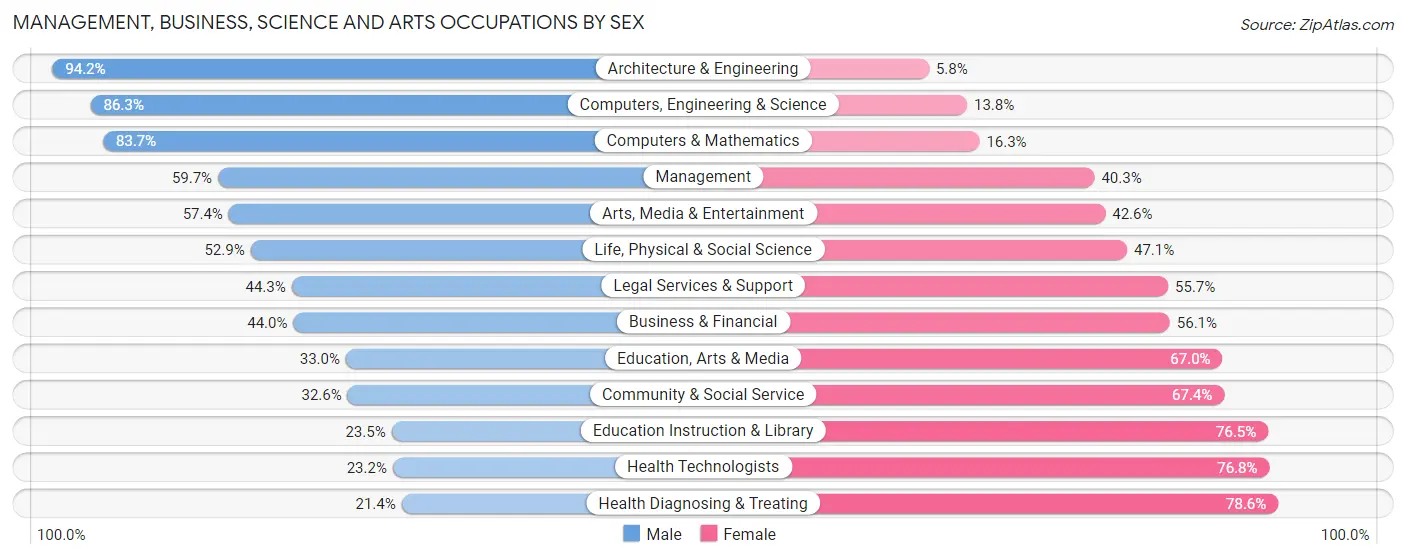
| Occupation | Male | Female |
| Management | 1,882 (59.7%) | 1,272 (40.3%) |
| Business & Financial | 723 (44.0%) | 922 (56.0%) |
| Computers, Engineering & Science | 1,361 (86.3%) | 217 (13.8%) |
| Computers & Mathematics | 656 (83.7%) | 128 (16.3%) |
| Architecture & Engineering | 650 (94.2%) | 40 (5.8%) |
| Life, Physical & Social Science | 55 (52.9%) | 49 (47.1%) |
| Community & Social Service | 809 (32.6%) | 1,670 (67.4%) |
| Education, Arts & Media | 133 (33.0%) | 270 (67.0%) |
| Legal Services & Support | 144 (44.3%) | 181 (55.7%) |
| Education Instruction & Library | 327 (23.5%) | 1,067 (76.5%) |
| Arts, Media & Entertainment | 205 (57.4%) | 152 (42.6%) |
| Health Diagnosing & Treating | 319 (21.4%) | 1,174 (78.6%) |
| Health Technologists | 274 (23.2%) | 907 (76.8%) |
| Total (Category) | 5,094 (49.2%) | 5,255 (50.8%) |
| Total (Overall) | 10,613 (53.8%) | 9,100 (46.2%) |
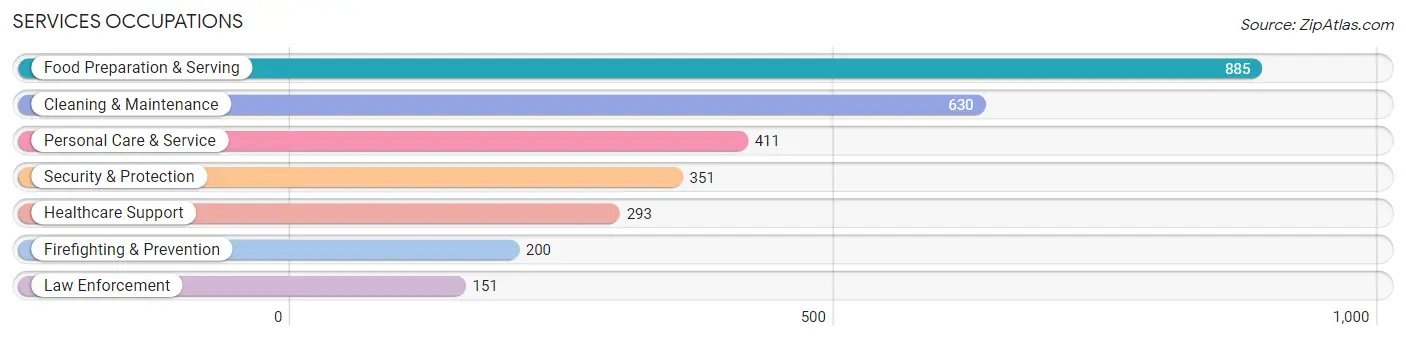
Services Occupations
The most common Services occupations in Bettendorf are Food Preparation & Serving (885 | 4.5%), Cleaning & Maintenance (630 | 3.2%), Personal Care & Service (411 | 2.1%), Security & Protection (351 | 1.8%), and Healthcare Support (293 | 1.5%).
Services Occupations by Sex
Within the Services occupations in Bettendorf, the most male-oriented occupations are Firefighting & Prevention (100.0%), Security & Protection (97.4%), and Law Enforcement (94.0%), while the most female-oriented occupations are Personal Care & Service (91.7%), Healthcare Support (88.4%), and Food Preparation & Serving (72.0%).
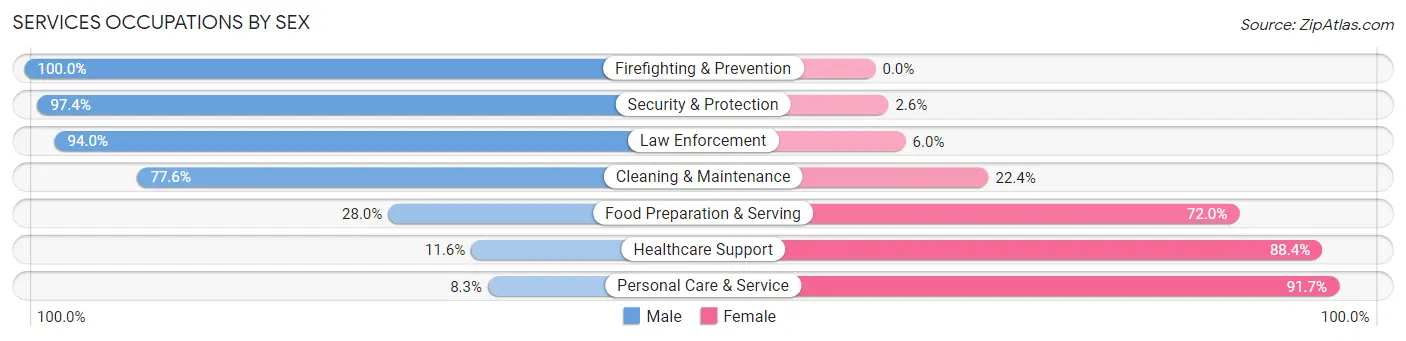
| Occupation | Male | Female |
| Healthcare Support | 34 (11.6%) | 259 (88.4%) |
| Security & Protection | 342 (97.4%) | 9 (2.6%) |
| Firefighting & Prevention | 200 (100.0%) | 0 (0.0%) |
| Law Enforcement | 142 (94.0%) | 9 (6.0%) |
| Food Preparation & Serving | 248 (28.0%) | 637 (72.0%) |
| Cleaning & Maintenance | 489 (77.6%) | 141 (22.4%) |
| Personal Care & Service | 34 (8.3%) | 377 (91.7%) |
| Total (Category) | 1,147 (44.6%) | 1,423 (55.4%) |
| Total (Overall) | 10,613 (53.8%) | 9,100 (46.2%) |
Sales and Office Occupations
The most common Sales and Office occupations in Bettendorf are Sales & Related (1,797 | 9.1%), and Office & Administration (1,691 | 8.6%).
Sales and Office Occupations by Sex
| Occupation | Male | Female |
| Sales & Related | 1,105 (61.5%) | 692 (38.5%) |
| Office & Administration | 540 (31.9%) | 1,151 (68.1%) |
| Total (Category) | 1,645 (47.2%) | 1,843 (52.8%) |
| Total (Overall) | 10,613 (53.8%) | 9,100 (46.2%) |
Natural Resources, Construction and Maintenance Occupations
The most common Natural Resources, Construction and Maintenance occupations in Bettendorf are Construction & Extraction (670 | 3.4%), Installation, Maintenance & Repair (318 | 1.6%), and Farming, Fishing & Forestry (37 | 0.2%).
Natural Resources, Construction and Maintenance Occupations by Sex
| Occupation | Male | Female |
| Farming, Fishing & Forestry | 20 (54.0%) | 17 (46.0%) |
| Construction & Extraction | 647 (96.6%) | 23 (3.4%) |
| Installation, Maintenance & Repair | 318 (100.0%) | 0 (0.0%) |
| Total (Category) | 985 (96.1%) | 40 (3.9%) |
| Total (Overall) | 10,613 (53.8%) | 9,100 (46.2%) |
Production, Transportation and Moving Occupations
The most common Production, Transportation and Moving occupations in Bettendorf are Production (1,085 | 5.5%), Material Moving (611 | 3.1%), and Transportation (585 | 3.0%).
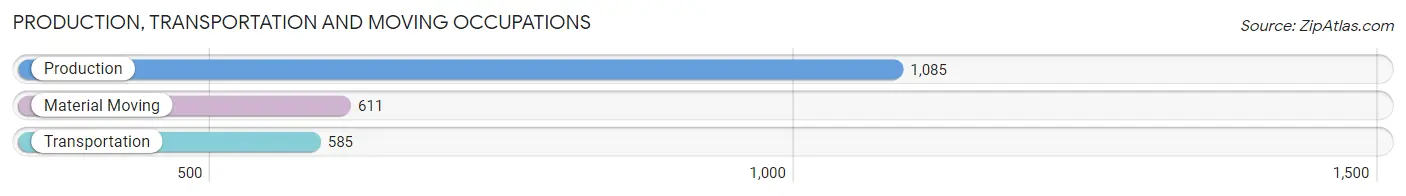
Production, Transportation and Moving Occupations by Sex
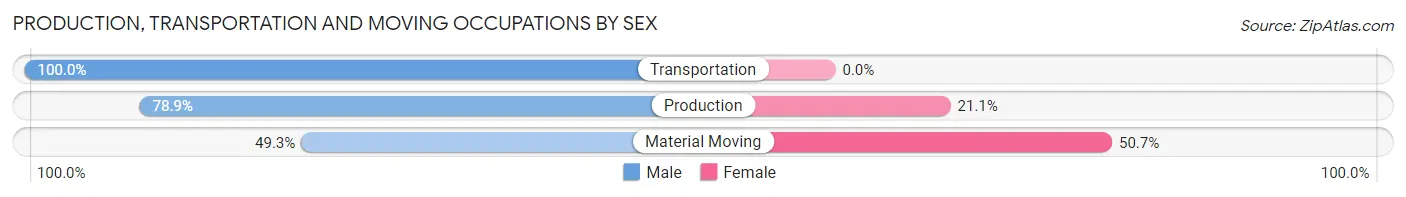
| Occupation | Male | Female |
| Production | 856 (78.9%) | 229 (21.1%) |
| Transportation | 585 (100.0%) | 0 (0.0%) |
| Material Moving | 301 (49.3%) | 310 (50.7%) |
| Total (Category) | 1,742 (76.4%) | 539 (23.6%) |
| Total (Overall) | 10,613 (53.8%) | 9,100 (46.2%) |
Employment Industries by Sex in Bettendorf
Employment Industries in Bettendorf
The major employment industries in Bettendorf include Manufacturing (3,368 | 17.1%), Health Care & Social Assistance (2,822 | 14.3%), Retail Trade (2,175 | 11.0%), Educational Services (1,791 | 9.1%), and Public Administration (1,315 | 6.7%).
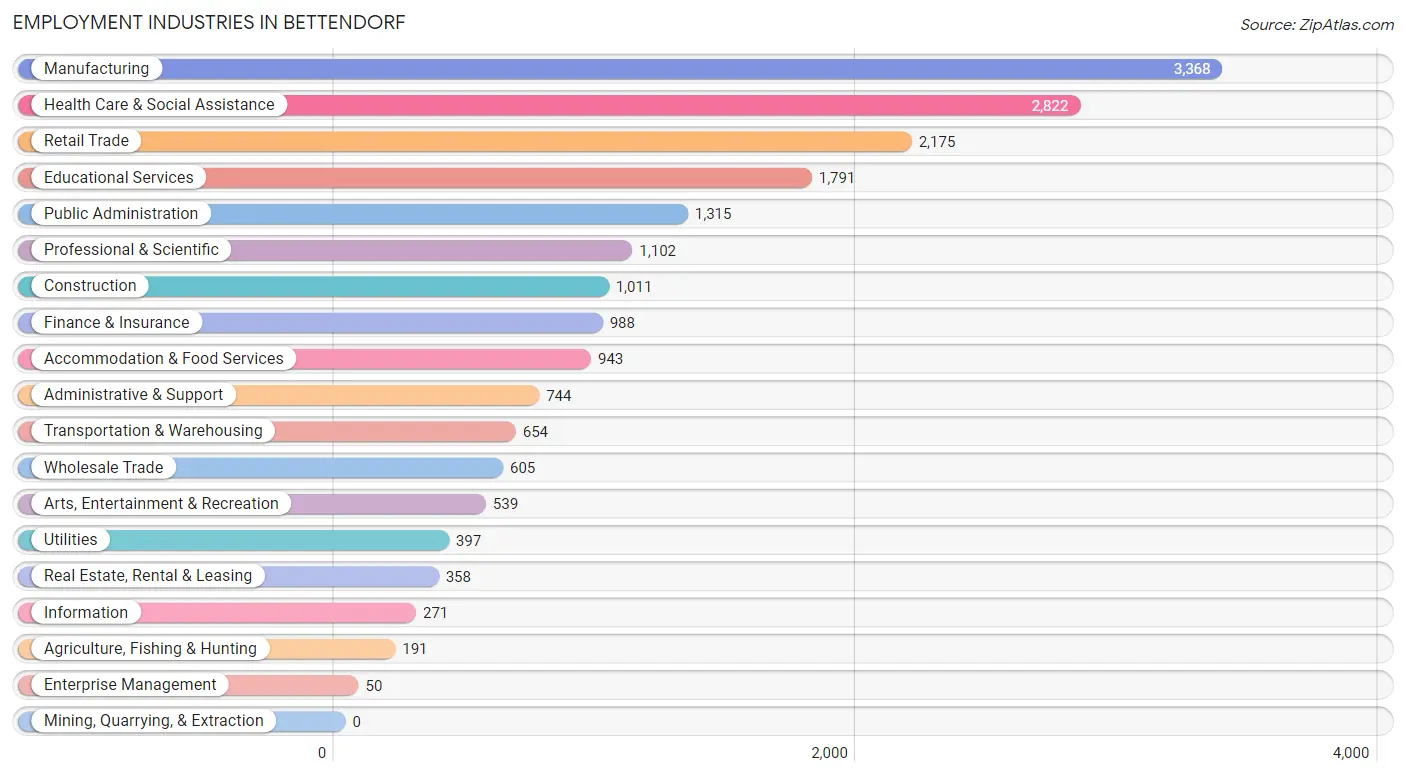
Employment Industries by Sex in Bettendorf
The Bettendorf industries that see more men than women are Utilities (87.9%), Construction (87.8%), and Transportation & Warehousing (80.1%), whereas the industries that tend to have a higher number of women are Health Care & Social Assistance (78.7%), Educational Services (74.7%), and Enterprise Management (66.0%).
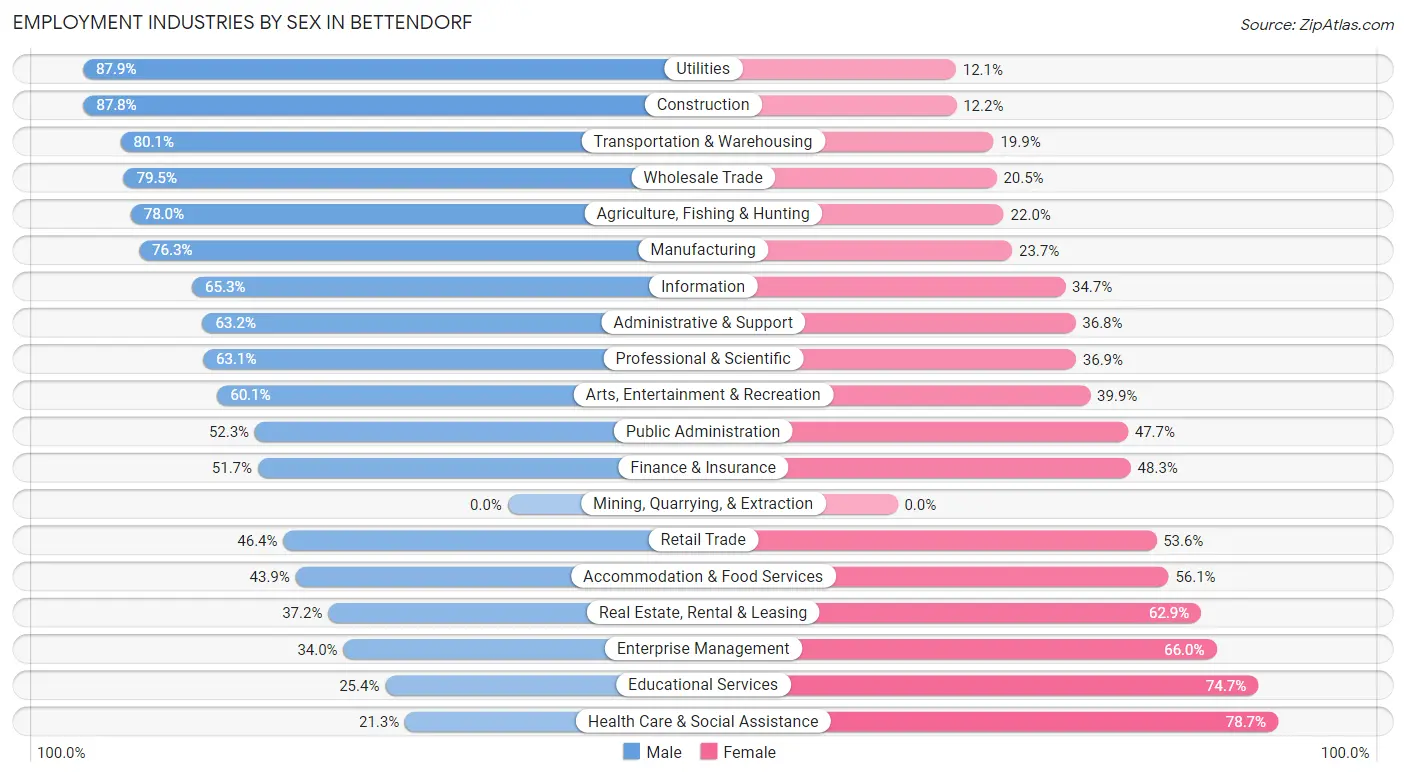
| Industry | Male | Female |
| Agriculture, Fishing & Hunting | 149 (78.0%) | 42 (22.0%) |
| Mining, Quarrying, & Extraction | 0 (0.0%) | 0 (0.0%) |
| Construction | 888 (87.8%) | 123 (12.2%) |
| Manufacturing | 2,569 (76.3%) | 799 (23.7%) |
| Wholesale Trade | 481 (79.5%) | 124 (20.5%) |
| Retail Trade | 1,010 (46.4%) | 1,165 (53.6%) |
| Transportation & Warehousing | 524 (80.1%) | 130 (19.9%) |
| Utilities | 349 (87.9%) | 48 (12.1%) |
| Information | 177 (65.3%) | 94 (34.7%) |
| Finance & Insurance | 511 (51.7%) | 477 (48.3%) |
| Real Estate, Rental & Leasing | 133 (37.1%) | 225 (62.8%) |
| Professional & Scientific | 695 (63.1%) | 407 (36.9%) |
| Enterprise Management | 17 (34.0%) | 33 (66.0%) |
| Administrative & Support | 470 (63.2%) | 274 (36.8%) |
| Educational Services | 454 (25.4%) | 1,337 (74.7%) |
| Health Care & Social Assistance | 600 (21.3%) | 2,222 (78.7%) |
| Arts, Entertainment & Recreation | 324 (60.1%) | 215 (39.9%) |
| Accommodation & Food Services | 414 (43.9%) | 529 (56.1%) |
| Public Administration | 688 (52.3%) | 627 (47.7%) |
| Total | 10,613 (53.8%) | 9,100 (46.2%) |
Education in Bettendorf
School Enrollment in Bettendorf
The most common levels of schooling among the 10,526 students in Bettendorf are high school (2,925 | 27.8%), middle school (2,229 | 21.2%), and elementary school (2,219 | 21.1%).
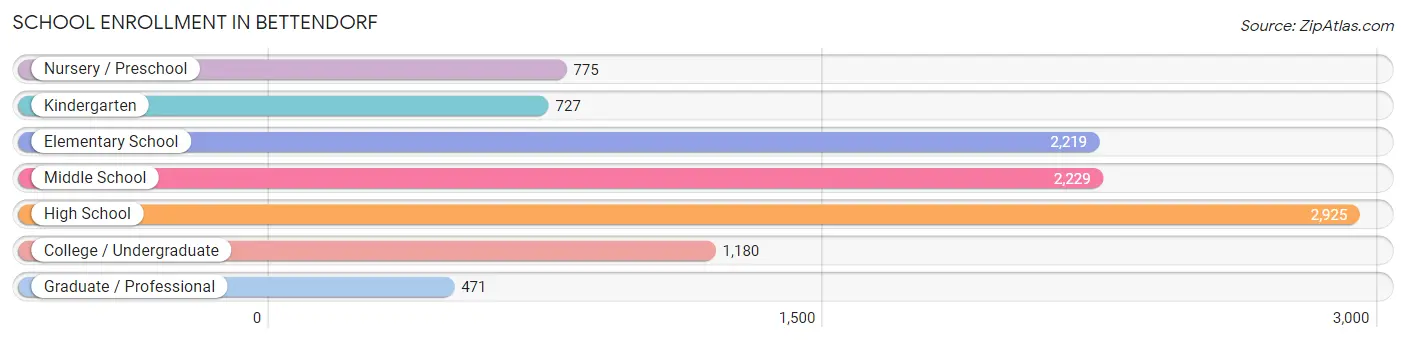
| School Level | # Students | % Students |
| Nursery / Preschool | 775 | 7.4% |
| Kindergarten | 727 | 6.9% |
| Elementary School | 2,219 | 21.1% |
| Middle School | 2,229 | 21.2% |
| High School | 2,925 | 27.8% |
| College / Undergraduate | 1,180 | 11.2% |
| Graduate / Professional | 471 | 4.5% |
| Total | 10,526 | 100.0% |
School Enrollment by Age by Funding Source in Bettendorf
Out of a total of 10,526 students who are enrolled in schools in Bettendorf, 1,316 (12.5%) attend a private institution, while the remaining 9,210 (87.5%) are enrolled in public schools. The age group of 3 to 4 year olds has the highest likelihood of being enrolled in private schools, with 272 (48.1% in the age bracket) enrolled. Conversely, the age group of 10 to 14 year olds has the lowest likelihood of being enrolled in a private school, with 2,803 (97.9% in the age bracket) attending a public institution.
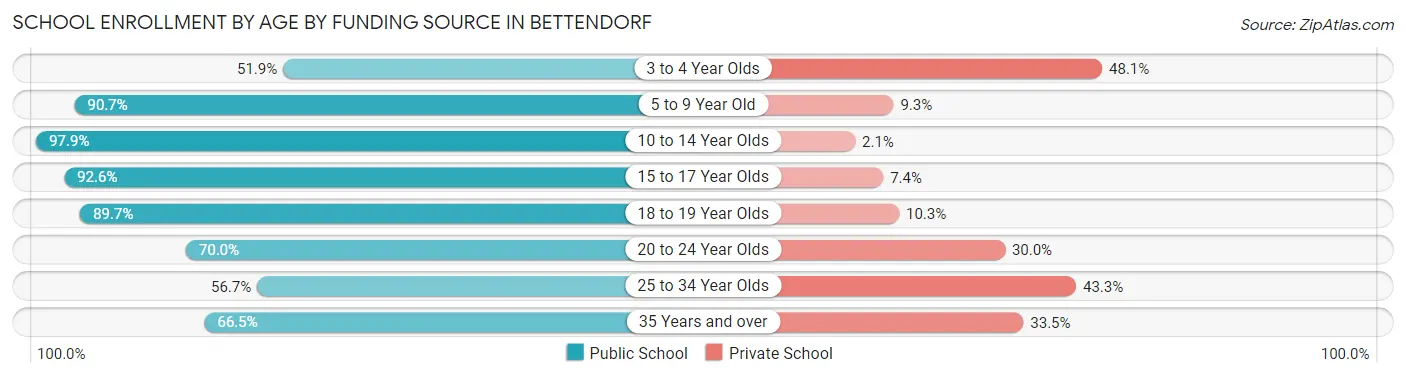
| Age Bracket | Public School | Private School |
| 3 to 4 Year Olds | 293 (51.9%) | 272 (48.1%) |
| 5 to 9 Year Old | 2,603 (90.7%) | 266 (9.3%) |
| 10 to 14 Year Olds | 2,803 (97.9%) | 61 (2.1%) |
| 15 to 17 Year Olds | 1,723 (92.6%) | 137 (7.4%) |
| 18 to 19 Year Olds | 895 (89.7%) | 103 (10.3%) |
| 20 to 24 Year Olds | 354 (70.0%) | 152 (30.0%) |
| 25 to 34 Year Olds | 207 (56.7%) | 158 (43.3%) |
| 35 Years and over | 332 (66.5%) | 167 (33.5%) |
| Total | 9,210 (87.5%) | 1,316 (12.5%) |
Educational Attainment by Field of Study in Bettendorf
Business (3,081 | 20.8%), education (1,858 | 12.5%), engineering (1,697 | 11.4%), science & technology (1,485 | 10.0%), and bio, nature & agricultural (964 | 6.5%) are the most common fields of study among 14,836 individuals in Bettendorf who have obtained a bachelor's degree or higher.
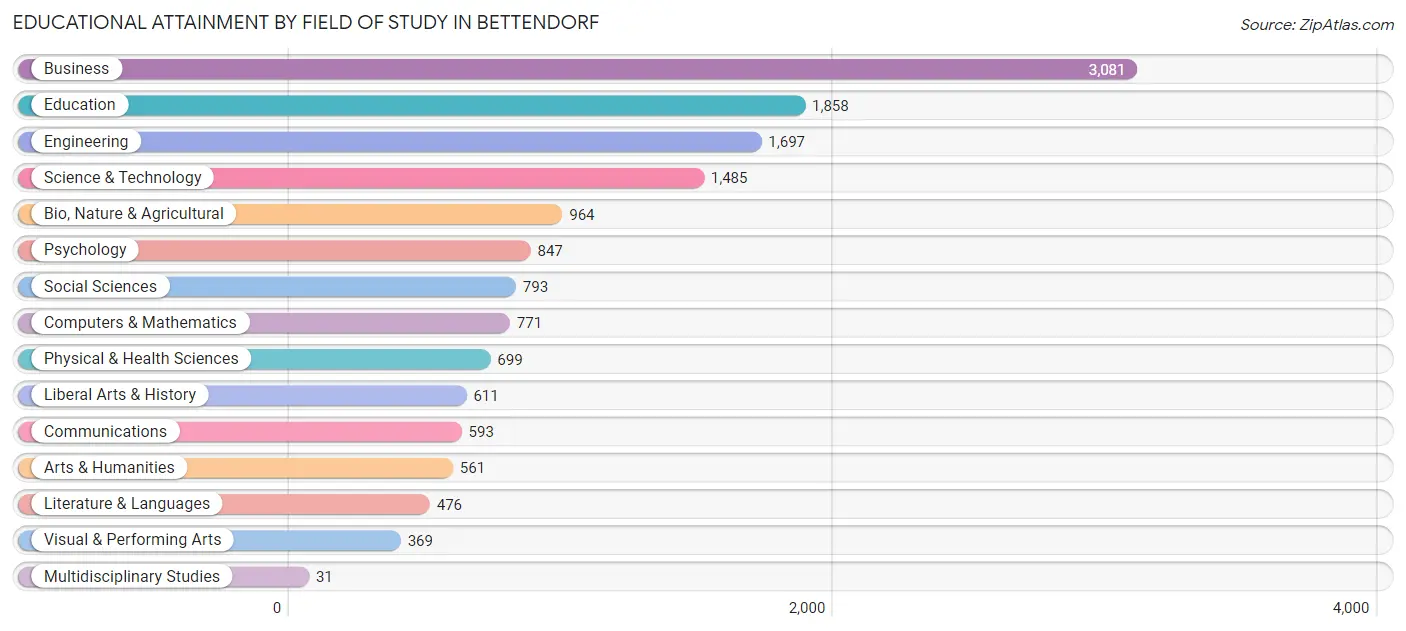
| Field of Study | # Graduates | % Graduates |
| Computers & Mathematics | 771 | 5.2% |
| Bio, Nature & Agricultural | 964 | 6.5% |
| Physical & Health Sciences | 699 | 4.7% |
| Psychology | 847 | 5.7% |
| Social Sciences | 793 | 5.3% |
| Engineering | 1,697 | 11.4% |
| Multidisciplinary Studies | 31 | 0.2% |
| Science & Technology | 1,485 | 10.0% |
| Business | 3,081 | 20.8% |
| Education | 1,858 | 12.5% |
| Literature & Languages | 476 | 3.2% |
| Liberal Arts & History | 611 | 4.1% |
| Visual & Performing Arts | 369 | 2.5% |
| Communications | 593 | 4.0% |
| Arts & Humanities | 561 | 3.8% |
| Total | 14,836 | 100.0% |
Transportation & Commute in Bettendorf
Vehicle Availability by Sex in Bettendorf
The most prevalent vehicle ownership categories in Bettendorf are males with 2 vehicles (5,164, accounting for 48.9%) and females with 2 vehicles (4,334, making up 58.2%).
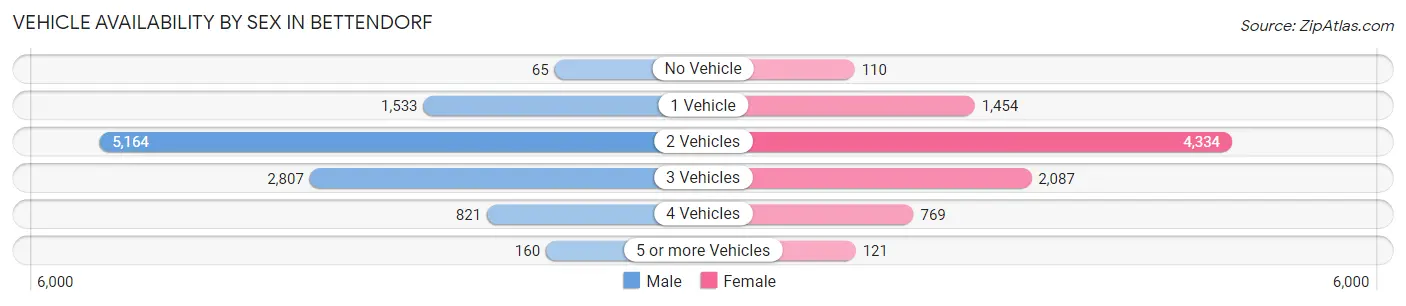
| Vehicles Available | Male | Female |
| No Vehicle | 65 (0.6%) | 110 (1.2%) |
| 1 Vehicle | 1,533 (14.5%) | 1,454 (16.4%) |
| 2 Vehicles | 5,164 (48.9%) | 4,334 (48.8%) |
| 3 Vehicles | 2,807 (26.6%) | 2,087 (23.5%) |
| 4 Vehicles | 821 (7.8%) | 769 (8.7%) |
| 5 or more Vehicles | 160 (1.5%) | 121 (1.4%) |
| Total | 10,550 (100.0%) | 8,875 (100.0%) |
Commute Time in Bettendorf
The most frequently occuring commute durations in Bettendorf are 15 to 19 minutes (4,123 commuters, 23.0%), 20 to 24 minutes (3,191 commuters, 17.8%), and 10 to 14 minutes (3,139 commuters, 17.5%).
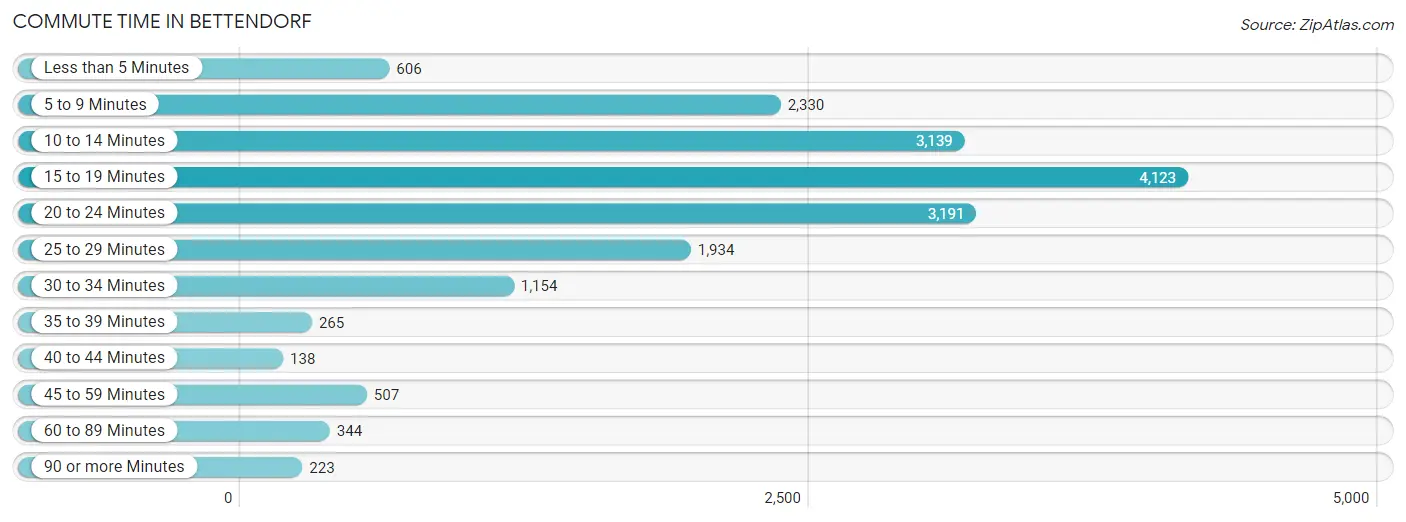
| Commute Time | # Commuters | % Commuters |
| Less than 5 Minutes | 606 | 3.4% |
| 5 to 9 Minutes | 2,330 | 13.0% |
| 10 to 14 Minutes | 3,139 | 17.5% |
| 15 to 19 Minutes | 4,123 | 23.0% |
| 20 to 24 Minutes | 3,191 | 17.8% |
| 25 to 29 Minutes | 1,934 | 10.8% |
| 30 to 34 Minutes | 1,154 | 6.4% |
| 35 to 39 Minutes | 265 | 1.5% |
| 40 to 44 Minutes | 138 | 0.8% |
| 45 to 59 Minutes | 507 | 2.8% |
| 60 to 89 Minutes | 344 | 1.9% |
| 90 or more Minutes | 223 | 1.2% |
Commute Time by Sex in Bettendorf
The most common commute times in Bettendorf are 15 to 19 minutes (2,162 commuters, 22.2%) for males and 15 to 19 minutes (1,961 commuters, 23.9%) for females.
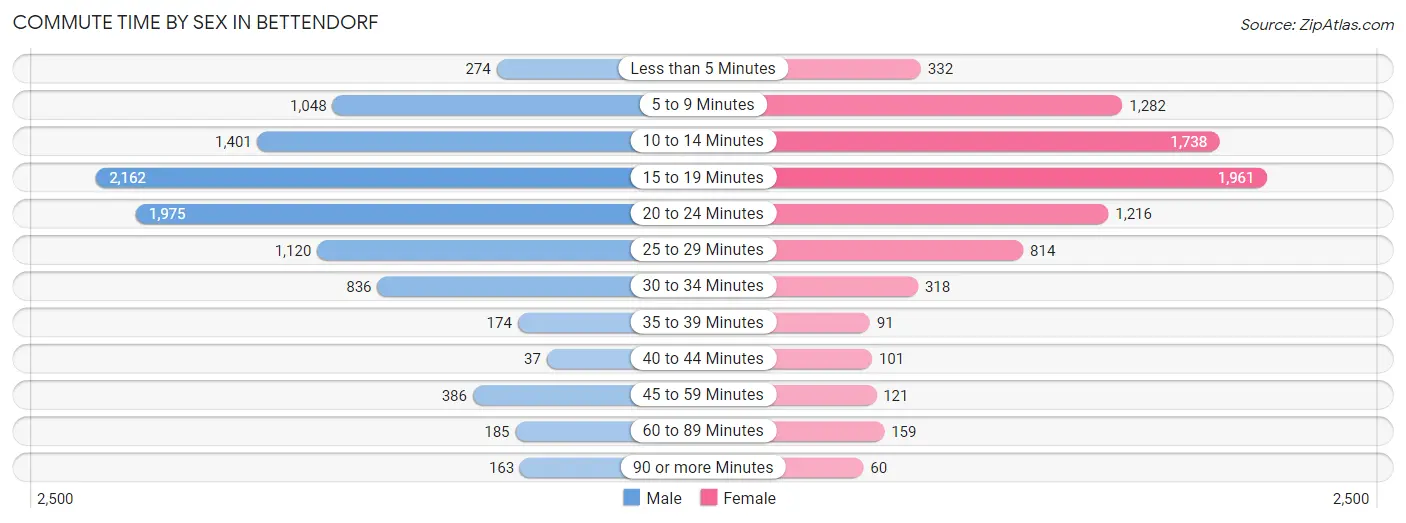
| Commute Time | Male | Female |
| Less than 5 Minutes | 274 (2.8%) | 332 (4.1%) |
| 5 to 9 Minutes | 1,048 (10.7%) | 1,282 (15.7%) |
| 10 to 14 Minutes | 1,401 (14.3%) | 1,738 (21.2%) |
| 15 to 19 Minutes | 2,162 (22.2%) | 1,961 (23.9%) |
| 20 to 24 Minutes | 1,975 (20.2%) | 1,216 (14.8%) |
| 25 to 29 Minutes | 1,120 (11.5%) | 814 (9.9%) |
| 30 to 34 Minutes | 836 (8.6%) | 318 (3.9%) |
| 35 to 39 Minutes | 174 (1.8%) | 91 (1.1%) |
| 40 to 44 Minutes | 37 (0.4%) | 101 (1.2%) |
| 45 to 59 Minutes | 386 (4.0%) | 121 (1.5%) |
| 60 to 89 Minutes | 185 (1.9%) | 159 (1.9%) |
| 90 or more Minutes | 163 (1.7%) | 60 (0.7%) |
Time of Departure to Work by Sex in Bettendorf
The most frequent times of departure to work in Bettendorf are 7:00 AM to 7:29 AM (1,564, 16.0%) for males and 7:30 AM to 7:59 AM (1,827, 22.3%) for females.
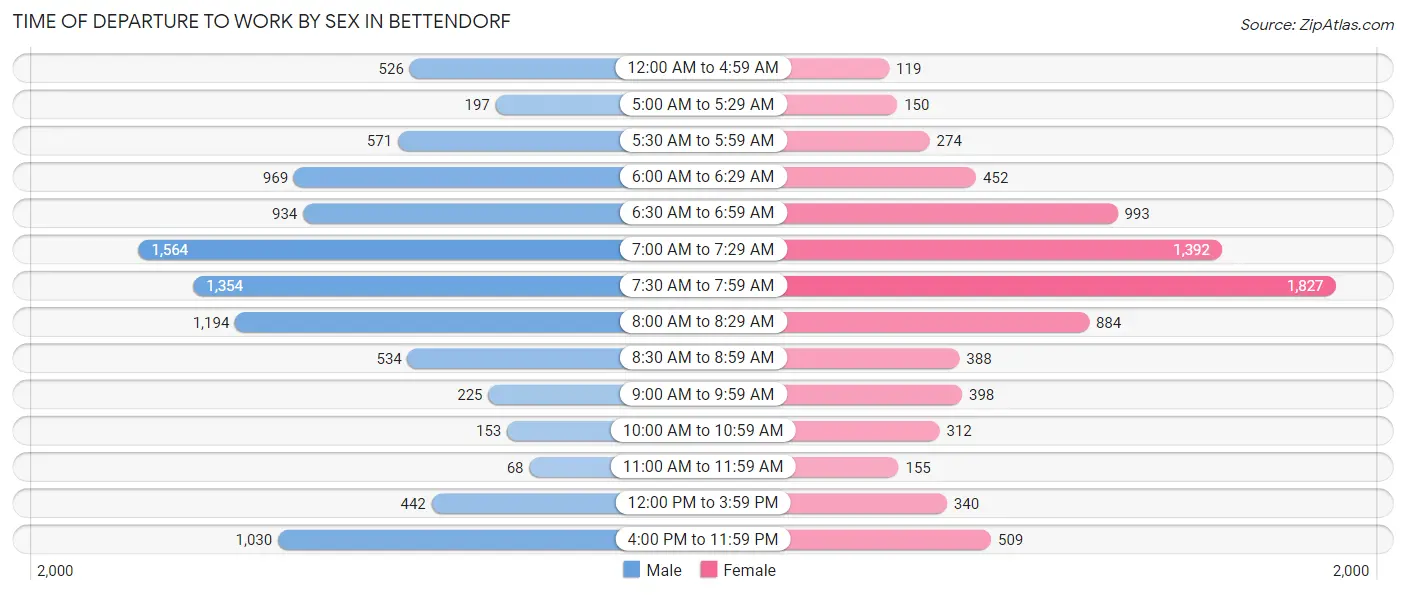
| Time of Departure | Male | Female |
| 12:00 AM to 4:59 AM | 526 (5.4%) | 119 (1.5%) |
| 5:00 AM to 5:29 AM | 197 (2.0%) | 150 (1.8%) |
| 5:30 AM to 5:59 AM | 571 (5.9%) | 274 (3.3%) |
| 6:00 AM to 6:29 AM | 969 (9.9%) | 452 (5.5%) |
| 6:30 AM to 6:59 AM | 934 (9.6%) | 993 (12.1%) |
| 7:00 AM to 7:29 AM | 1,564 (16.0%) | 1,392 (17.0%) |
| 7:30 AM to 7:59 AM | 1,354 (13.9%) | 1,827 (22.3%) |
| 8:00 AM to 8:29 AM | 1,194 (12.2%) | 884 (10.8%) |
| 8:30 AM to 8:59 AM | 534 (5.5%) | 388 (4.7%) |
| 9:00 AM to 9:59 AM | 225 (2.3%) | 398 (4.9%) |
| 10:00 AM to 10:59 AM | 153 (1.6%) | 312 (3.8%) |
| 11:00 AM to 11:59 AM | 68 (0.7%) | 155 (1.9%) |
| 12:00 PM to 3:59 PM | 442 (4.5%) | 340 (4.2%) |
| 4:00 PM to 11:59 PM | 1,030 (10.5%) | 509 (6.2%) |
| Total | 9,761 (100.0%) | 8,193 (100.0%) |
Housing Occupancy in Bettendorf
Occupancy by Ownership in Bettendorf
Of the total 15,612 dwellings in Bettendorf, owner-occupied units account for 11,838 (75.8%), while renter-occupied units make up 3,774 (24.2%).
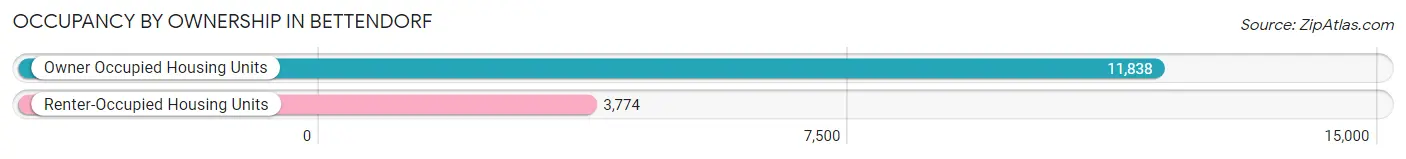
| Occupancy | # Housing Units | % Housing Units |
| Owner Occupied Housing Units | 11,838 | 75.8% |
| Renter-Occupied Housing Units | 3,774 | 24.2% |
| Total Occupied Housing Units | 15,612 | 100.0% |
Occupancy by Household Size in Bettendorf
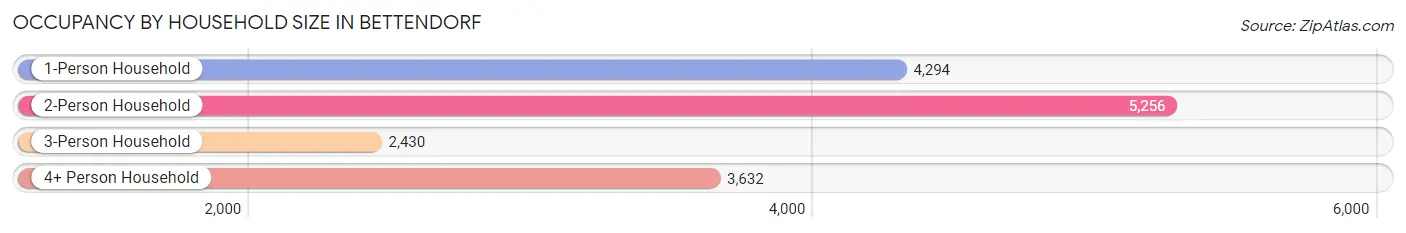
| Household Size | # Housing Units | % Housing Units |
| 1-Person Household | 4,294 | 27.5% |
| 2-Person Household | 5,256 | 33.7% |
| 3-Person Household | 2,430 | 15.6% |
| 4+ Person Household | 3,632 | 23.3% |
| Total Housing Units | 15,612 | 100.0% |
Occupancy by Ownership by Household Size in Bettendorf
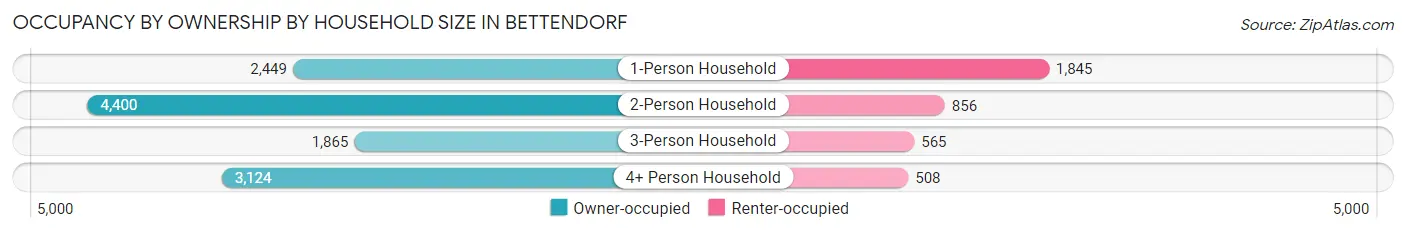
| Household Size | Owner-occupied | Renter-occupied |
| 1-Person Household | 2,449 (57.0%) | 1,845 (43.0%) |
| 2-Person Household | 4,400 (83.7%) | 856 (16.3%) |
| 3-Person Household | 1,865 (76.7%) | 565 (23.3%) |
| 4+ Person Household | 3,124 (86.0%) | 508 (14.0%) |
| Total Housing Units | 11,838 (75.8%) | 3,774 (24.2%) |
Occupancy by Educational Attainment in Bettendorf
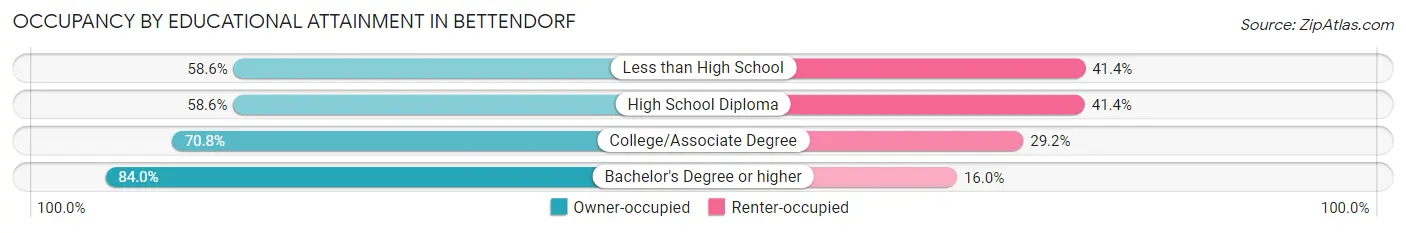
| Household Size | Owner-occupied | Renter-occupied |
| Less than High School | 219 (58.6%) | 155 (41.4%) |
| High School Diploma | 1,297 (58.6%) | 915 (41.4%) |
| College/Associate Degree | 3,327 (70.8%) | 1,370 (29.2%) |
| Bachelor's Degree or higher | 6,995 (84.0%) | 1,334 (16.0%) |
Occupancy by Age of Householder in Bettendorf
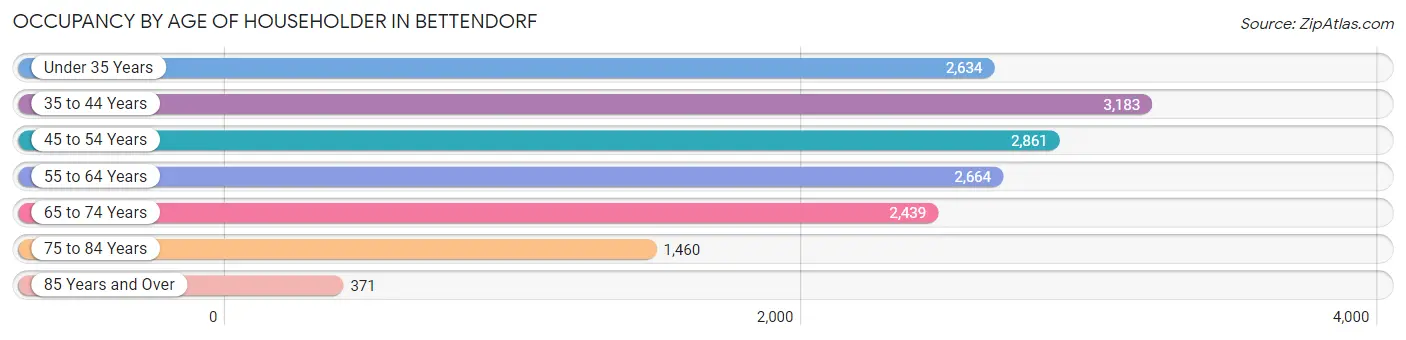
| Age Bracket | # Households | % Households |
| Under 35 Years | 2,634 | 16.9% |
| 35 to 44 Years | 3,183 | 20.4% |
| 45 to 54 Years | 2,861 | 18.3% |
| 55 to 64 Years | 2,664 | 17.1% |
| 65 to 74 Years | 2,439 | 15.6% |
| 75 to 84 Years | 1,460 | 9.3% |
| 85 Years and Over | 371 | 2.4% |
| Total | 15,612 | 100.0% |
Housing Finances in Bettendorf
Median Income by Occupancy in Bettendorf
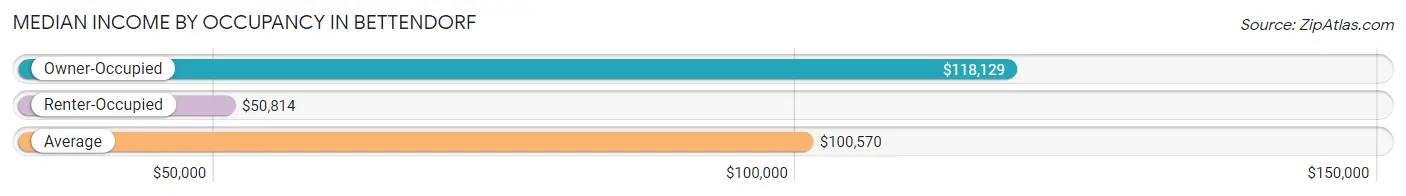
| Occupancy Type | # Households | Median Income |
| Owner-Occupied | 11,838 (75.8%) | $118,129 |
| Renter-Occupied | 3,774 (24.2%) | $50,814 |
| Average | 15,612 (100.0%) | $100,570 |
Occupancy by Householder Income Bracket in Bettendorf
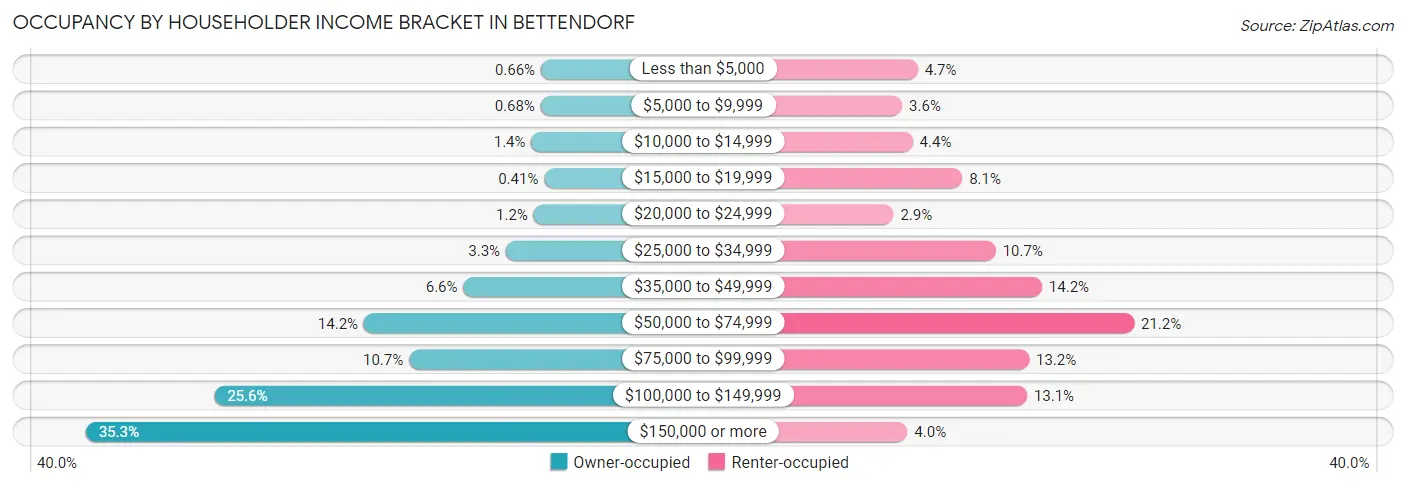
| Income Bracket | Owner-occupied | Renter-occupied |
| Less than $5,000 | 78 (0.7%) | 179 (4.7%) |
| $5,000 to $9,999 | 80 (0.7%) | 134 (3.5%) |
| $10,000 to $14,999 | 165 (1.4%) | 164 (4.3%) |
| $15,000 to $19,999 | 49 (0.4%) | 307 (8.1%) |
| $20,000 to $24,999 | 143 (1.2%) | 109 (2.9%) |
| $25,000 to $34,999 | 394 (3.3%) | 403 (10.7%) |
| $35,000 to $49,999 | 778 (6.6%) | 536 (14.2%) |
| $50,000 to $74,999 | 1,675 (14.1%) | 801 (21.2%) |
| $75,000 to $99,999 | 1,268 (10.7%) | 499 (13.2%) |
| $100,000 to $149,999 | 3,025 (25.6%) | 493 (13.1%) |
| $150,000 or more | 4,183 (35.3%) | 149 (4.0%) |
| Total | 11,838 (100.0%) | 3,774 (100.0%) |
Monthly Housing Cost Tiers in Bettendorf
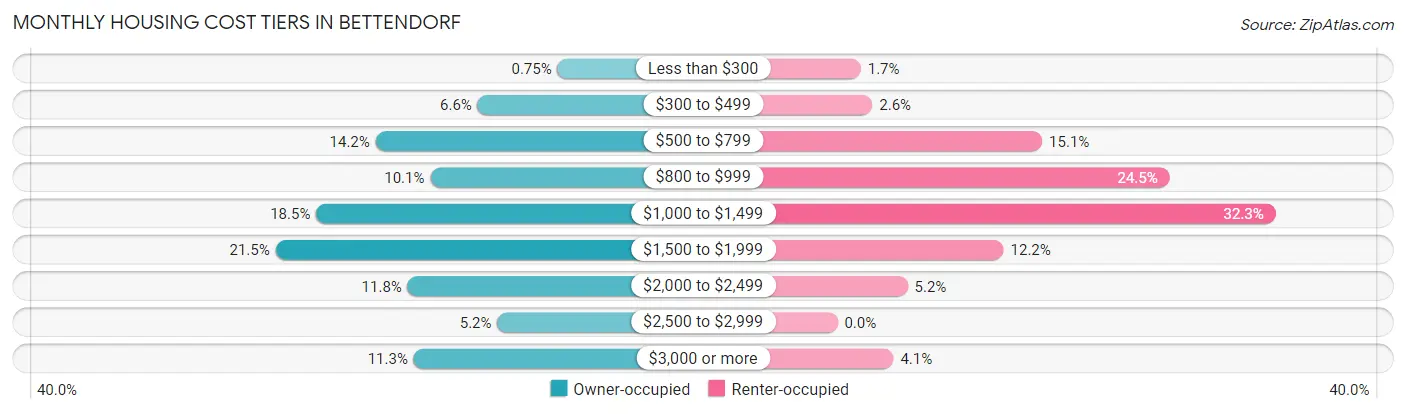
| Monthly Cost | Owner-occupied | Renter-occupied |
| Less than $300 | 89 (0.7%) | 65 (1.7%) |
| $300 to $499 | 785 (6.6%) | 97 (2.6%) |
| $500 to $799 | 1,675 (14.1%) | 569 (15.1%) |
| $800 to $999 | 1,198 (10.1%) | 923 (24.5%) |
| $1,000 to $1,499 | 2,192 (18.5%) | 1,218 (32.3%) |
| $1,500 to $1,999 | 2,547 (21.5%) | 462 (12.2%) |
| $2,000 to $2,499 | 1,396 (11.8%) | 195 (5.2%) |
| $2,500 to $2,999 | 613 (5.2%) | 0 (0.0%) |
| $3,000 or more | 1,343 (11.3%) | 156 (4.1%) |
| Total | 11,838 (100.0%) | 3,774 (100.0%) |
Physical Housing Characteristics in Bettendorf
Housing Structures in Bettendorf
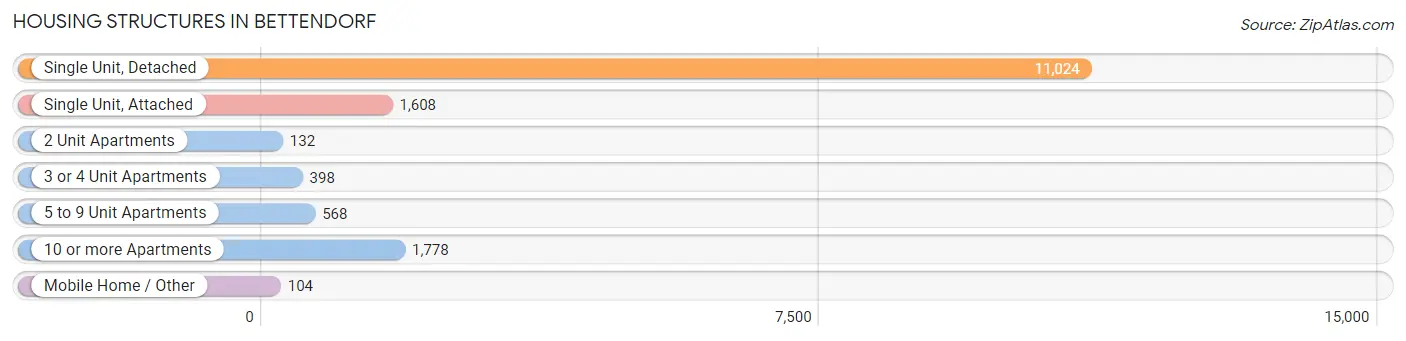
| Structure Type | # Housing Units | % Housing Units |
| Single Unit, Detached | 11,024 | 70.6% |
| Single Unit, Attached | 1,608 | 10.3% |
| 2 Unit Apartments | 132 | 0.9% |
| 3 or 4 Unit Apartments | 398 | 2.5% |
| 5 to 9 Unit Apartments | 568 | 3.6% |
| 10 or more Apartments | 1,778 | 11.4% |
| Mobile Home / Other | 104 | 0.7% |
| Total | 15,612 | 100.0% |
Housing Structures by Occupancy in Bettendorf
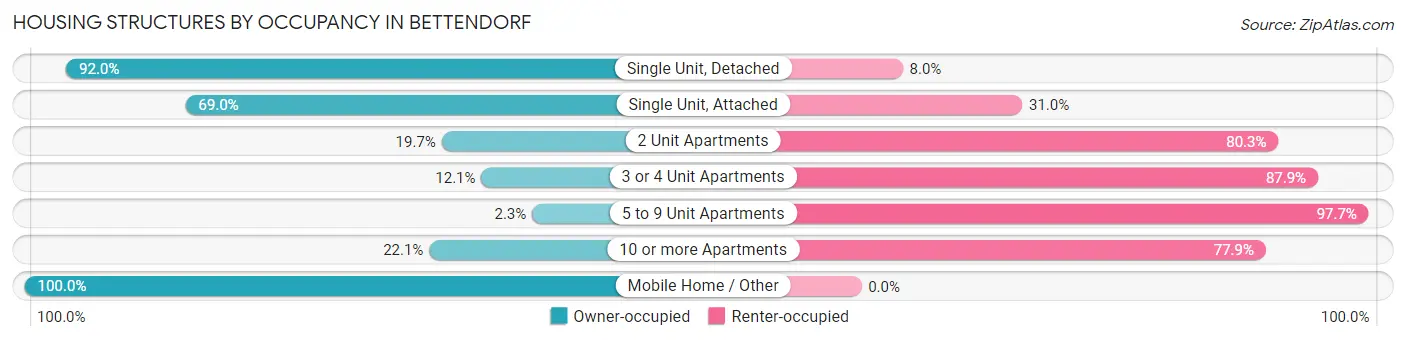
| Structure Type | Owner-occupied | Renter-occupied |
| Single Unit, Detached | 10,144 (92.0%) | 880 (8.0%) |
| Single Unit, Attached | 1,110 (69.0%) | 498 (31.0%) |
| 2 Unit Apartments | 26 (19.7%) | 106 (80.3%) |
| 3 or 4 Unit Apartments | 48 (12.1%) | 350 (87.9%) |
| 5 to 9 Unit Apartments | 13 (2.3%) | 555 (97.7%) |
| 10 or more Apartments | 393 (22.1%) | 1,385 (77.9%) |
| Mobile Home / Other | 104 (100.0%) | 0 (0.0%) |
| Total | 11,838 (75.8%) | 3,774 (24.2%) |
Housing Structures by Number of Rooms in Bettendorf
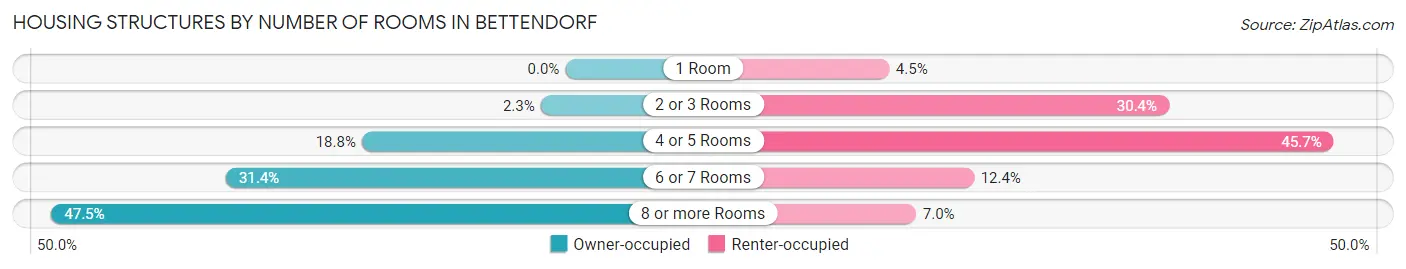
| Number of Rooms | Owner-occupied | Renter-occupied |
| 1 Room | 0 (0.0%) | 171 (4.5%) |
| 2 or 3 Rooms | 270 (2.3%) | 1,148 (30.4%) |
| 4 or 5 Rooms | 2,228 (18.8%) | 1,723 (45.7%) |
| 6 or 7 Rooms | 3,715 (31.4%) | 467 (12.4%) |
| 8 or more Rooms | 5,625 (47.5%) | 265 (7.0%) |
| Total | 11,838 (100.0%) | 3,774 (100.0%) |
Housing Structure by Heating Type in Bettendorf
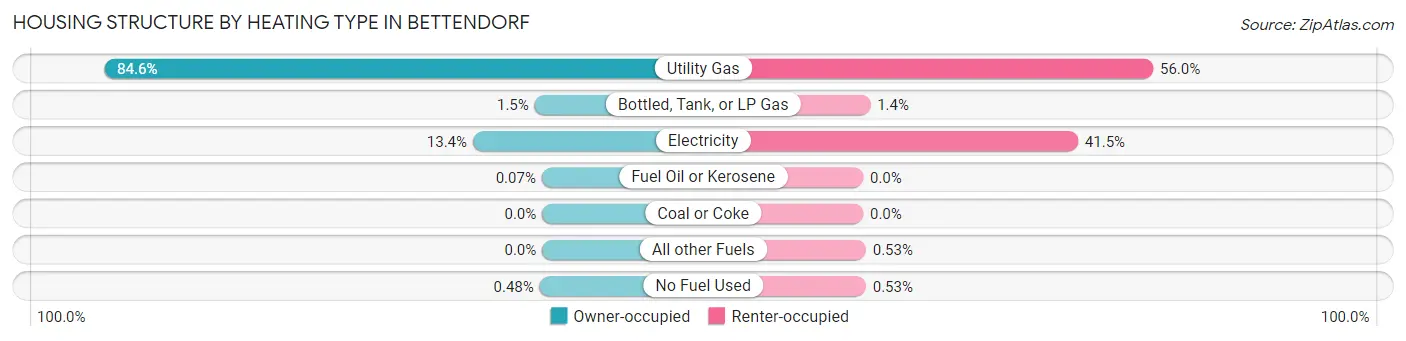
| Heating Type | Owner-occupied | Renter-occupied |
| Utility Gas | 10,017 (84.6%) | 2,115 (56.0%) |
| Bottled, Tank, or LP Gas | 172 (1.5%) | 52 (1.4%) |
| Electricity | 1,584 (13.4%) | 1,567 (41.5%) |
| Fuel Oil or Kerosene | 8 (0.1%) | 0 (0.0%) |
| Coal or Coke | 0 (0.0%) | 0 (0.0%) |
| All other Fuels | 0 (0.0%) | 20 (0.5%) |
| No Fuel Used | 57 (0.5%) | 20 (0.5%) |
| Total | 11,838 (100.0%) | 3,774 (100.0%) |
Household Vehicle Usage in Bettendorf
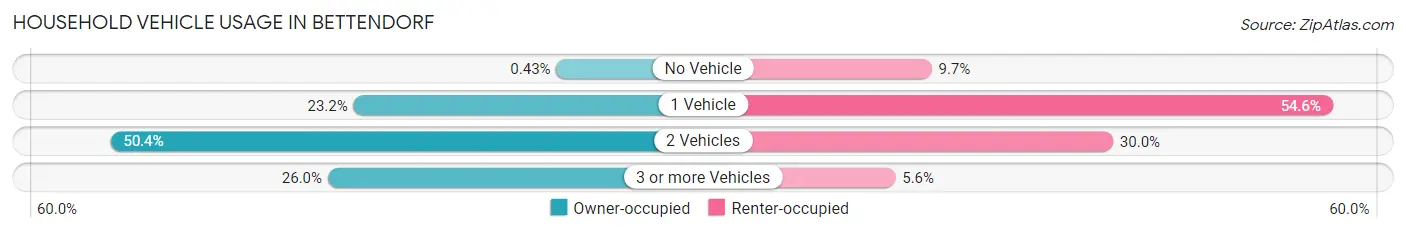
| Vehicles per Household | Owner-occupied | Renter-occupied |
| No Vehicle | 51 (0.4%) | 366 (9.7%) |
| 1 Vehicle | 2,740 (23.2%) | 2,062 (54.6%) |
| 2 Vehicles | 5,966 (50.4%) | 1,133 (30.0%) |
| 3 or more Vehicles | 3,081 (26.0%) | 213 (5.6%) |
| Total | 11,838 (100.0%) | 3,774 (100.0%) |
Real Estate & Mortgages in Bettendorf
Real Estate and Mortgage Overview in Bettendorf
| Characteristic | Without Mortgage | With Mortgage |
| Housing Units | 3,568 | 8,270 |
| Median Property Value | $256,500 | $284,600 |
| Median Household Income | $89,792 | $3,243 |
| Monthly Housing Costs | $684 | $1,327 |
| Real Estate Taxes | $4,088 | $304 |
Property Value by Mortgage Status in Bettendorf
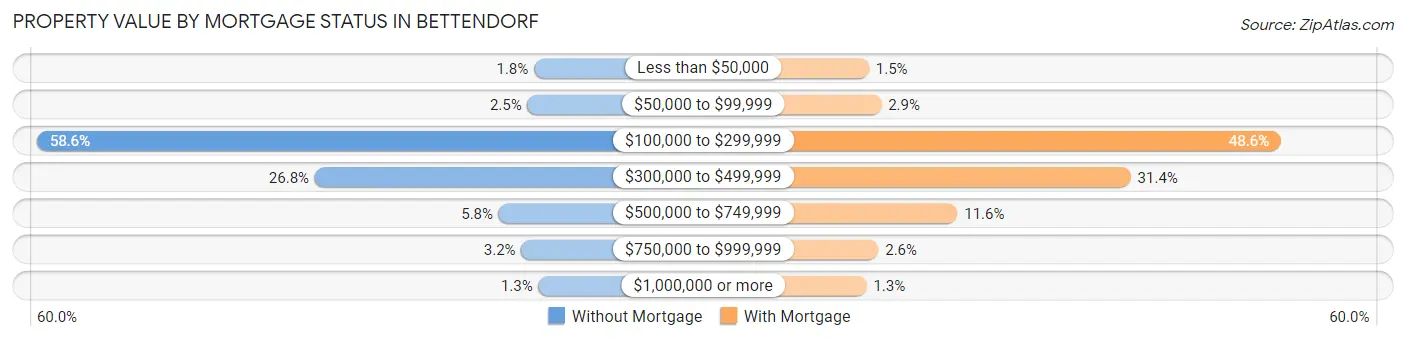
| Property Value | Without Mortgage | With Mortgage |
| Less than $50,000 | 63 (1.8%) | 126 (1.5%) |
| $50,000 to $99,999 | 90 (2.5%) | 242 (2.9%) |
| $100,000 to $299,999 | 2,091 (58.6%) | 4,022 (48.6%) |
| $300,000 to $499,999 | 957 (26.8%) | 2,600 (31.4%) |
| $500,000 to $749,999 | 207 (5.8%) | 962 (11.6%) |
| $750,000 to $999,999 | 115 (3.2%) | 215 (2.6%) |
| $1,000,000 or more | 45 (1.3%) | 103 (1.3%) |
| Total | 3,568 (100.0%) | 8,270 (100.0%) |
Household Income by Mortgage Status in Bettendorf
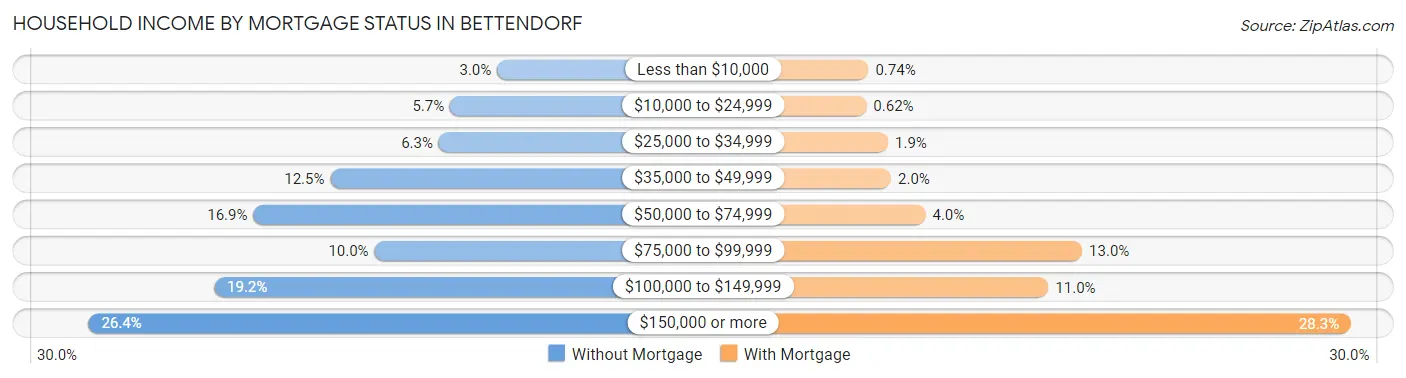
| Household Income | Without Mortgage | With Mortgage |
| Less than $10,000 | 107 (3.0%) | 61 (0.7%) |
| $10,000 to $24,999 | 203 (5.7%) | 51 (0.6%) |
| $25,000 to $34,999 | 226 (6.3%) | 154 (1.9%) |
| $35,000 to $49,999 | 447 (12.5%) | 168 (2.0%) |
| $50,000 to $74,999 | 604 (16.9%) | 331 (4.0%) |
| $75,000 to $99,999 | 357 (10.0%) | 1,071 (13.0%) |
| $100,000 to $149,999 | 684 (19.2%) | 911 (11.0%) |
| $150,000 or more | 940 (26.4%) | 2,341 (28.3%) |
| Total | 3,568 (100.0%) | 8,270 (100.0%) |
Property Value to Household Income Ratio in Bettendorf
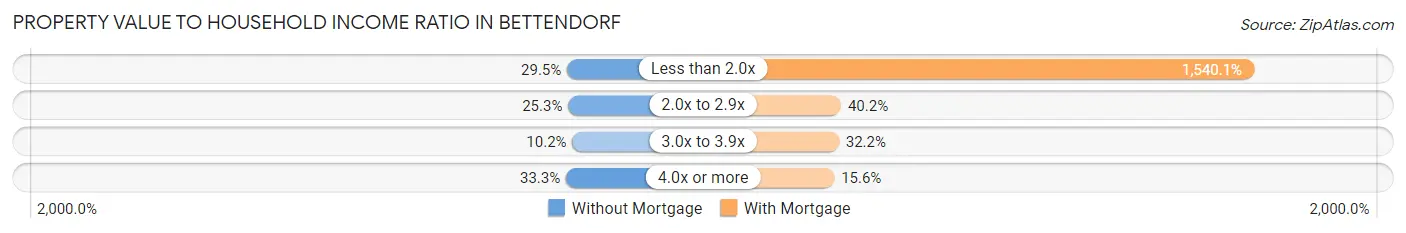
| Value-to-Income Ratio | Without Mortgage | With Mortgage |
| Less than 2.0x | 1,051 (29.5%) | 127,365 (1,540.1%) |
| 2.0x to 2.9x | 904 (25.3%) | 3,327 (40.2%) |
| 3.0x to 3.9x | 365 (10.2%) | 2,664 (32.2%) |
| 4.0x or more | 1,188 (33.3%) | 1,288 (15.6%) |
| Total | 3,568 (100.0%) | 8,270 (100.0%) |
Real Estate Taxes by Mortgage Status in Bettendorf
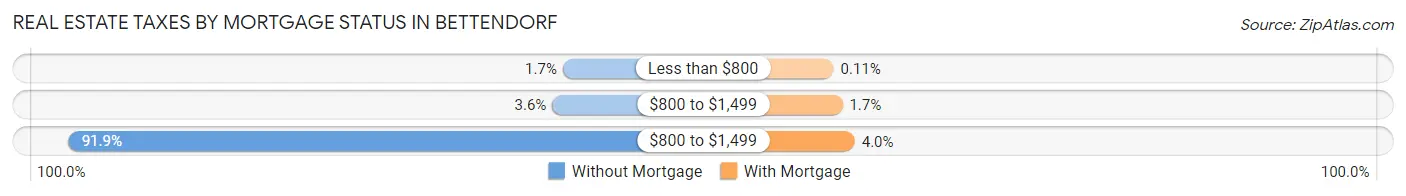
| Property Taxes | Without Mortgage | With Mortgage |
| Less than $800 | 61 (1.7%) | 9 (0.1%) |
| $800 to $1,499 | 130 (3.6%) | 142 (1.7%) |
| $800 to $1,499 | 3,280 (91.9%) | 328 (4.0%) |
| Total | 3,568 (100.0%) | 8,270 (100.0%) |
Health & Disability in Bettendorf
Health Insurance Coverage by Age in Bettendorf
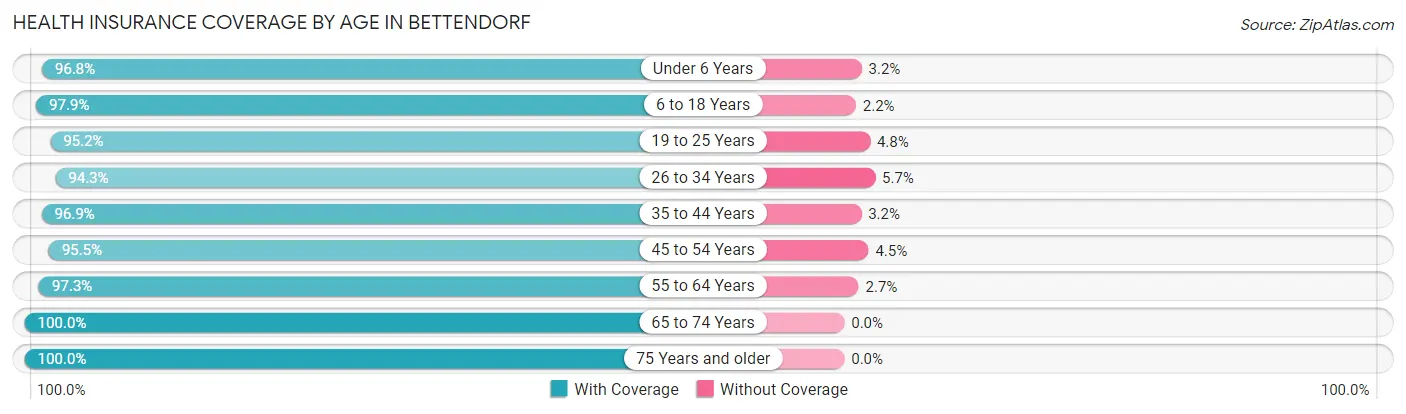
| Age Bracket | With Coverage | Without Coverage |
| Under 6 Years | 2,813 (96.8%) | 94 (3.2%) |
| 6 to 18 Years | 7,523 (97.9%) | 165 (2.1%) |
| 19 to 25 Years | 2,368 (95.2%) | 119 (4.8%) |
| 26 to 34 Years | 3,727 (94.3%) | 227 (5.7%) |
| 35 to 44 Years | 5,372 (96.9%) | 175 (3.2%) |
| 45 to 54 Years | 4,745 (95.5%) | 224 (4.5%) |
| 55 to 64 Years | 4,523 (97.3%) | 124 (2.7%) |
| 65 to 74 Years | 3,812 (100.0%) | 0 (0.0%) |
| 75 Years and older | 2,755 (100.0%) | 0 (0.0%) |
| Total | 37,638 (97.1%) | 1,128 (2.9%) |
Health Insurance Coverage by Citizenship Status in Bettendorf
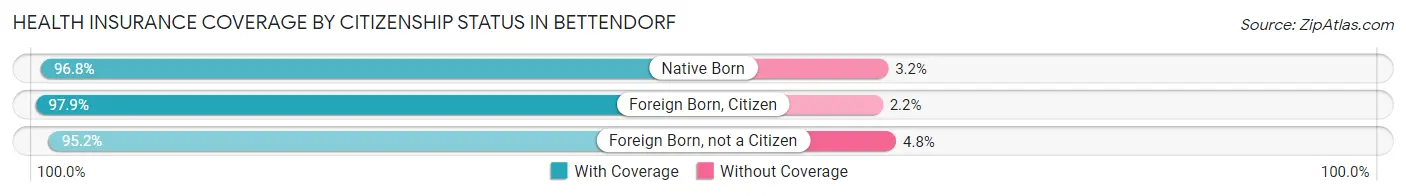
| Citizenship Status | With Coverage | Without Coverage |
| Native Born | 2,813 (96.8%) | 94 (3.2%) |
| Foreign Born, Citizen | 7,523 (97.9%) | 165 (2.1%) |
| Foreign Born, not a Citizen | 2,368 (95.2%) | 119 (4.8%) |
Health Insurance Coverage by Household Income in Bettendorf
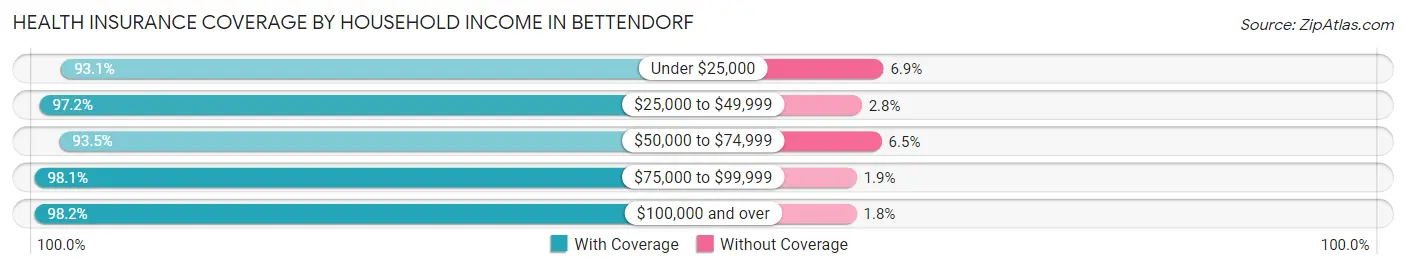
| Household Income | With Coverage | Without Coverage |
| Under $25,000 | 2,425 (93.1%) | 179 (6.9%) |
| $25,000 to $49,999 | 3,230 (97.2%) | 93 (2.8%) |
| $50,000 to $74,999 | 4,970 (93.5%) | 347 (6.5%) |
| $75,000 to $99,999 | 4,476 (98.1%) | 85 (1.9%) |
| $100,000 and over | 22,513 (98.2%) | 422 (1.8%) |
Public vs Private Health Insurance Coverage by Age in Bettendorf
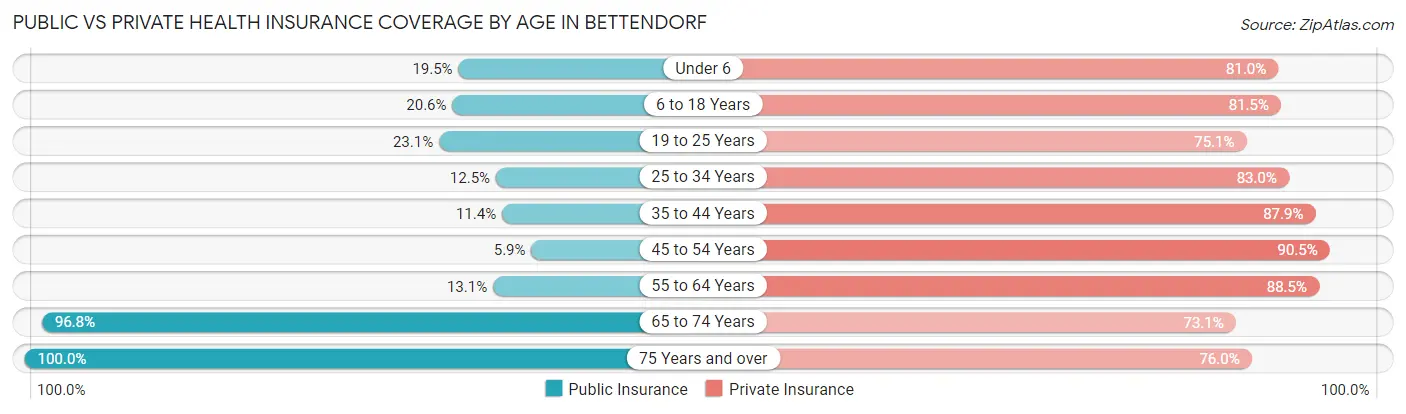
| Age Bracket | Public Insurance | Private Insurance |
| Under 6 | 566 (19.5%) | 2,354 (81.0%) |
| 6 to 18 Years | 1,584 (20.6%) | 6,264 (81.5%) |
| 19 to 25 Years | 574 (23.1%) | 1,867 (75.1%) |
| 25 to 34 Years | 495 (12.5%) | 3,280 (83.0%) |
| 35 to 44 Years | 632 (11.4%) | 4,874 (87.9%) |
| 45 to 54 Years | 295 (5.9%) | 4,499 (90.5%) |
| 55 to 64 Years | 607 (13.1%) | 4,114 (88.5%) |
| 65 to 74 Years | 3,690 (96.8%) | 2,786 (73.1%) |
| 75 Years and over | 2,755 (100.0%) | 2,095 (76.0%) |
| Total | 11,198 (28.9%) | 32,133 (82.9%) |
Disability Status by Sex by Age in Bettendorf
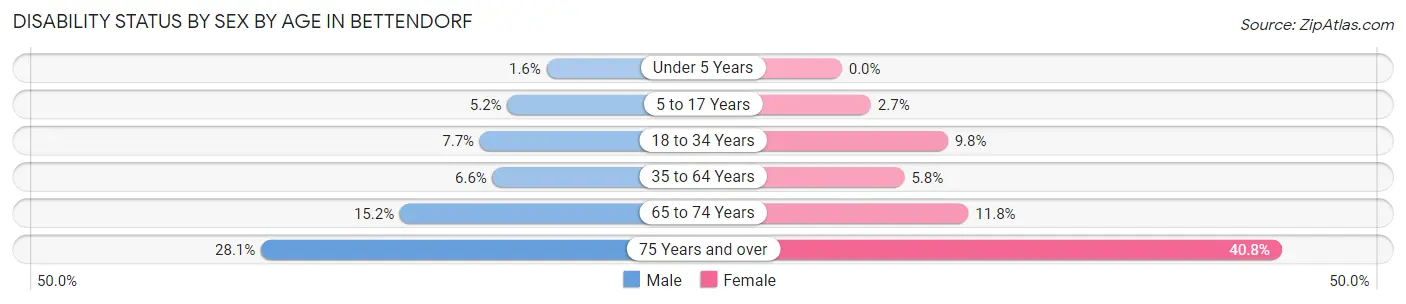
| Age Bracket | Male | Female |
| Under 5 Years | 18 (1.5%) | 0 (0.0%) |
| 5 to 17 Years | 197 (5.2%) | 106 (2.7%) |
| 18 to 34 Years | 272 (7.7%) | 346 (9.8%) |
| 35 to 64 Years | 492 (6.6%) | 446 (5.8%) |
| 65 to 74 Years | 254 (15.2%) | 251 (11.7%) |
| 75 Years and over | 322 (28.1%) | 656 (40.8%) |
Disability Class by Sex by Age in Bettendorf
Disability Class: Hearing Difficulty
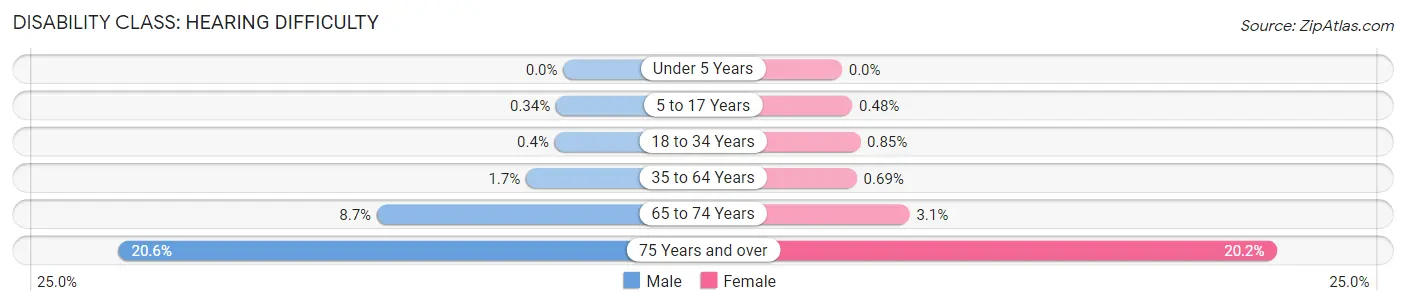
| Age Bracket | Male | Female |
| Under 5 Years | 0 (0.0%) | 0 (0.0%) |
| 5 to 17 Years | 13 (0.3%) | 19 (0.5%) |
| 18 to 34 Years | 14 (0.4%) | 30 (0.9%) |
| 35 to 64 Years | 130 (1.7%) | 53 (0.7%) |
| 65 to 74 Years | 145 (8.6%) | 67 (3.1%) |
| 75 Years and over | 237 (20.6%) | 324 (20.2%) |
Disability Class: Vision Difficulty
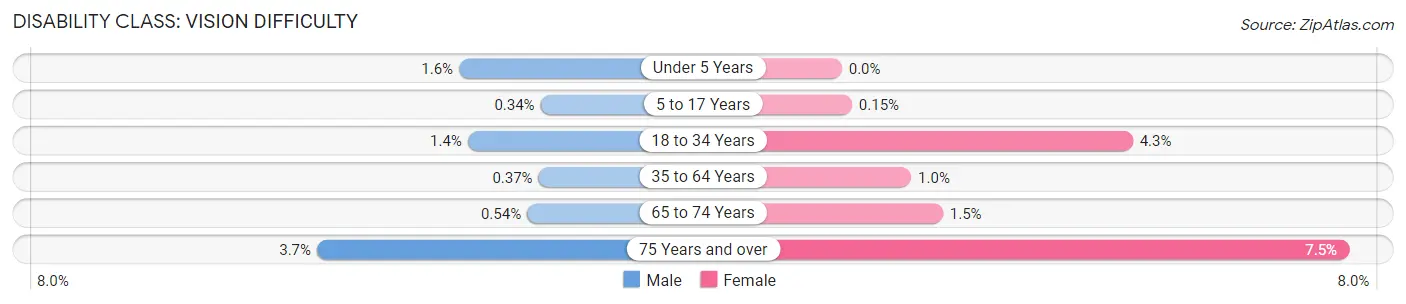
| Age Bracket | Male | Female |
| Under 5 Years | 18 (1.5%) | 0 (0.0%) |
| 5 to 17 Years | 13 (0.3%) | 6 (0.2%) |
| 18 to 34 Years | 50 (1.4%) | 152 (4.3%) |
| 35 to 64 Years | 28 (0.4%) | 79 (1.0%) |
| 65 to 74 Years | 9 (0.5%) | 32 (1.5%) |
| 75 Years and over | 42 (3.7%) | 121 (7.5%) |
Disability Class: Cognitive Difficulty
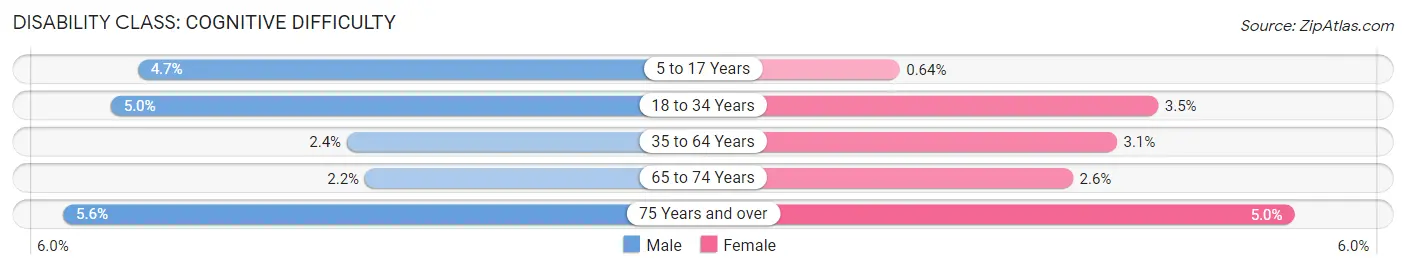
| Age Bracket | Male | Female |
| 5 to 17 Years | 180 (4.7%) | 25 (0.6%) |
| 18 to 34 Years | 177 (5.0%) | 124 (3.5%) |
| 35 to 64 Years | 181 (2.4%) | 235 (3.1%) |
| 65 to 74 Years | 37 (2.2%) | 55 (2.6%) |
| 75 Years and over | 64 (5.6%) | 81 (5.0%) |
Disability Class: Ambulatory Difficulty
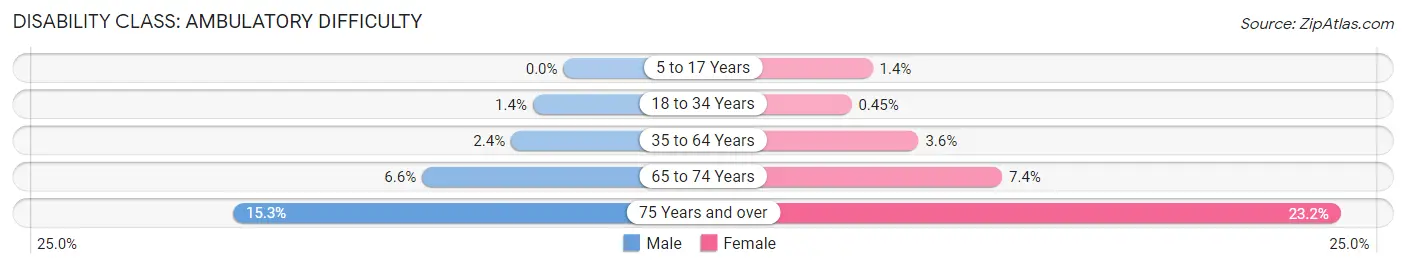
| Age Bracket | Male | Female |
| 5 to 17 Years | 0 (0.0%) | 56 (1.4%) |
| 18 to 34 Years | 50 (1.4%) | 16 (0.4%) |
| 35 to 64 Years | 182 (2.4%) | 273 (3.6%) |
| 65 to 74 Years | 110 (6.6%) | 159 (7.4%) |
| 75 Years and over | 176 (15.3%) | 372 (23.2%) |
Disability Class: Self-Care Difficulty
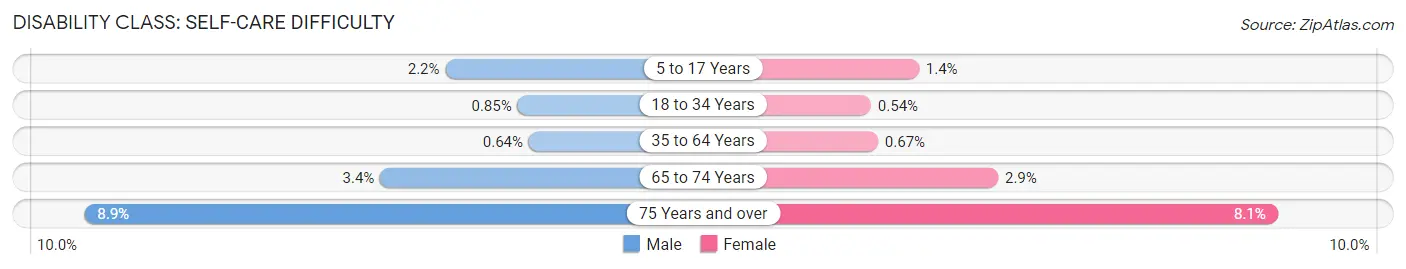
| Age Bracket | Male | Female |
| 5 to 17 Years | 83 (2.2%) | 56 (1.4%) |
| 18 to 34 Years | 30 (0.9%) | 19 (0.5%) |
| 35 to 64 Years | 48 (0.6%) | 51 (0.7%) |
| 65 to 74 Years | 57 (3.4%) | 62 (2.9%) |
| 75 Years and over | 102 (8.9%) | 130 (8.1%) |
Technology Access in Bettendorf
Computing Device Access in Bettendorf
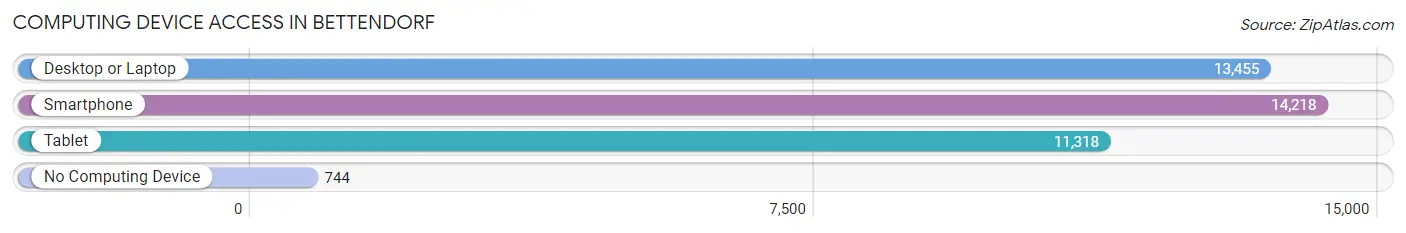
| Device Type | # Households | % Households |
| Desktop or Laptop | 13,455 | 86.2% |
| Smartphone | 14,218 | 91.1% |
| Tablet | 11,318 | 72.5% |
| No Computing Device | 744 | 4.8% |
| Total | 15,612 | 100.0% |
Internet Access in Bettendorf
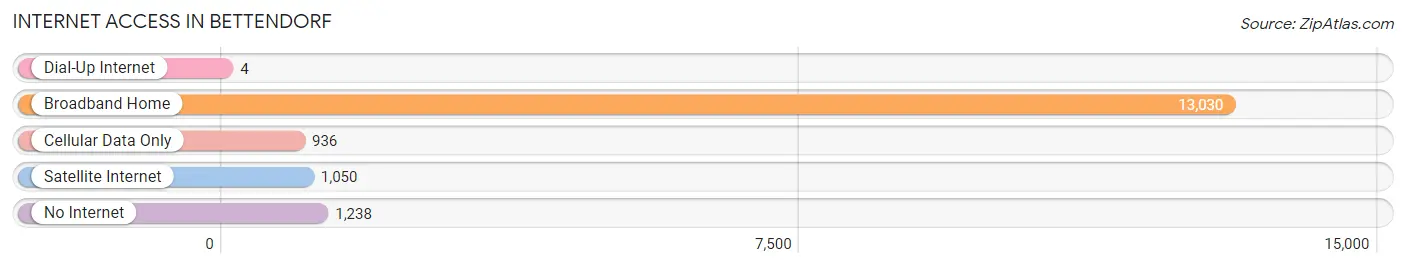
| Internet Type | # Households | % Households |
| Dial-Up Internet | 4 | 0.0% |
| Broadband Home | 13,030 | 83.5% |
| Cellular Data Only | 936 | 6.0% |
| Satellite Internet | 1,050 | 6.7% |
| No Internet | 1,238 | 7.9% |
| Total | 15,612 | 100.0% |
Bettendorf Summary
Bettendorf, Iowa is a city located in Scott County, Iowa, United States. It is part of the Quad Cities metropolitan area, which includes the cities of Davenport and Moline, Illinois. The population of Bettendorf was 33,217 at the 2010 census, and was estimated to be 35,505 by July 2019.
History
Bettendorf was founded in 1855 by William and Frederick Bettendorf, two German immigrants who had come to the United States in search of a better life. The brothers purchased land along the Mississippi River and built a small village, which they named after themselves. The village grew slowly, but steadily, and by the late 19th century, it had become a thriving community.
In the early 20th century, Bettendorf experienced a period of rapid growth. The city was incorporated in 1917, and by the 1950s, it had become a major industrial center. The city's population grew from just over 4,000 in 1950 to more than 33,000 by the 2010 census.
Geography
Bettendorf is located in eastern Iowa, along the Mississippi River. It is bordered by the cities of Davenport to the north, Moline to the east, and Rock Island to the south. The city covers an area of 16.3 square miles, with a population density of 2,039 people per square mile.
The city is located in the Central Lowland region of the United States, and is part of the Driftless Area, which is characterized by its rolling hills and valleys. The city is located on the western edge of the Quad Cities, and is home to several parks and recreational areas, including the Bettendorf Riverfront Park and the Bettendorf Nature Center.
Economy
Bettendorf's economy is largely based on manufacturing and services. The city is home to several major employers, including John Deere, Alcoa, and Tyson Foods. The city is also home to several smaller businesses, including restaurants, retail stores, and professional services.
The city's unemployment rate was 3.2% in 2019, which is lower than the national average of 3.7%. The median household income in Bettendorf was $63,845 in 2019, which is higher than the national median of $61,937.
Demographics
As of the 2010 census, there were 33,217 people, 13,845 households, and 8,945 families living in Bettendorf. The population density was 2,039 people per square mile. The racial makeup of the city was 90.2% White, 4.2% African American, 0.4% Native American, 2.2% Asian, 0.1% Pacific Islander, 1.2% from other races, and 1.7% from two or more races. Hispanic or Latino of any race were 3.7% of the population.
The median age in Bettendorf was 38.2 years. 22.2% of residents were under the age of 18; 8.2% were between the ages of 18 and 24; 28.2% were from 25 to 44; 25.7% were from 45 to 64; and 15.7% were 65 years of age or older. The gender makeup of the city was 48.7% male and 51.3% female.
The median income for a household in Bettendorf was $63,845 in 2019, which is higher than the national median of $61,937. The per capita income for the city was $30,945. About 5.2% of families and 7.3% of the population were below the poverty line, including 8.7% of those under age 18 and 5.2% of those age 65 or over.
Common Questions
What is Per Capita Income in Bettendorf?
Per Capita income in Bettendorf is $52,830.
What is the Median Family Income in Bettendorf?
Median Family Income in Bettendorf is $118,887.
What is the Median Household income in Bettendorf?
Median Household Income in Bettendorf is $100,570.
What is Income or Wage Gap in Bettendorf?
Income or Wage Gap in Bettendorf is 37.2%.
Women in Bettendorf earn 62.8 cents for every dollar earned by a man.
What is Family Income Deficit in Bettendorf?
Family Income Deficit in Bettendorf is $11,422.
Families that are below poverty line in Bettendorf earn $11,422 less on average than the poverty threshold level.
What is Inequality or Gini Index in Bettendorf?
Inequality or Gini Index in Bettendorf is 0.45.
What is the Total Population of Bettendorf?
Total Population of Bettendorf is 38,997.
What is the Total Male Population of Bettendorf?
Total Male Population of Bettendorf is 18,922.
What is the Total Female Population of Bettendorf?
Total Female Population of Bettendorf is 20,075.
What is the Ratio of Males per 100 Females in Bettendorf?
There are 94.26 Males per 100 Females in Bettendorf.
What is the Ratio of Females per 100 Males in Bettendorf?
There are 106.09 Females per 100 Males in Bettendorf.
What is the Median Population Age in Bettendorf?
Median Population Age in Bettendorf is 39.2 Years.
What is the Average Family Size in Bettendorf
Average Family Size in Bettendorf is 3.0 People.
What is the Average Household Size in Bettendorf
Average Household Size in Bettendorf is 2.5 People.
How Large is the Labor Force in Bettendorf?
There are 20,266 People in the Labor Forcein in Bettendorf.
What is the Percentage of People in the Labor Force in Bettendorf?
66.8% of People are in the Labor Force in Bettendorf.
What is the Unemployment Rate in Bettendorf?
Unemployment Rate in Bettendorf is 2.4%.