Asbury, IA Map & Demographics
Asbury Map
Asbury Overview
$47,989
PER CAPITA INCOME
$134,040
AVG FAMILY INCOME
$117,391
AVG HOUSEHOLD INCOME
41.1%
WAGE / INCOME GAP [ % ]
58.9¢/ $1
WAGE / INCOME GAP [ $ ]
0.41
INEQUALITY / GINI INDEX
5,890
TOTAL POPULATION
2,757
MALE POPULATION
3,133
FEMALE POPULATION
88.00
MALES / 100 FEMALES
113.64
FEMALES / 100 MALES
36.5
MEDIAN AGE
3.3
AVG FAMILY SIZE
2.9
AVG HOUSEHOLD SIZE
3,019
LABOR FORCE [ PEOPLE ]
72.4%
PERCENT IN LABOR FORCE
4.1%
UNEMPLOYMENT RATE
Asbury Area Codes
Income in Asbury
Income Overview in Asbury
Per Capita Income in Asbury is $47,989, while median incomes of families and households are $134,040 and $117,391 respectively.
| Characteristic | Number | Measure |
| Per Capita Income | 5,890 | $47,989 |
| Median Family Income | 1,647 | $134,040 |
| Mean Family Income | 1,647 | $152,997 |
| Median Household Income | 2,010 | $117,391 |
| Mean Household Income | 2,010 | $137,976 |
| Income Deficit | 1,647 | $0 |
| Wage / Income Gap (%) | 5,890 | 41.11% |
| Wage / Income Gap ($) | 5,890 | 58.89¢ per $1 |
| Gini / Inequality Index | 5,890 | 0.41 |
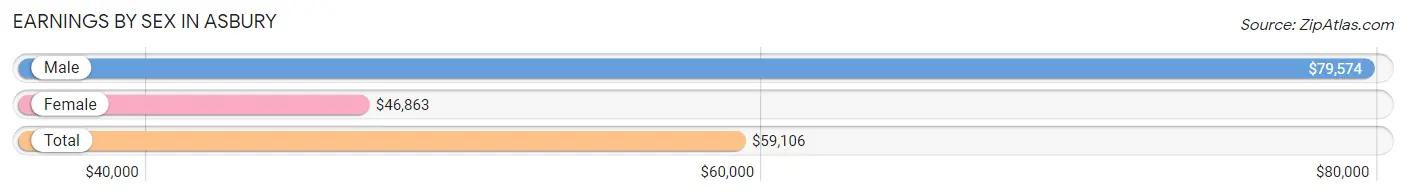
Earnings by Sex in Asbury
Average Earnings in Asbury are $59,106, $79,574 for men and $46,863 for women, a difference of 41.1%.
| Sex | Number | Average Earnings |
| Male | 1,706 (54.3%) | $79,574 |
| Female | 1,436 (45.7%) | $46,863 |
| Total | 3,142 (100.0%) | $59,106 |
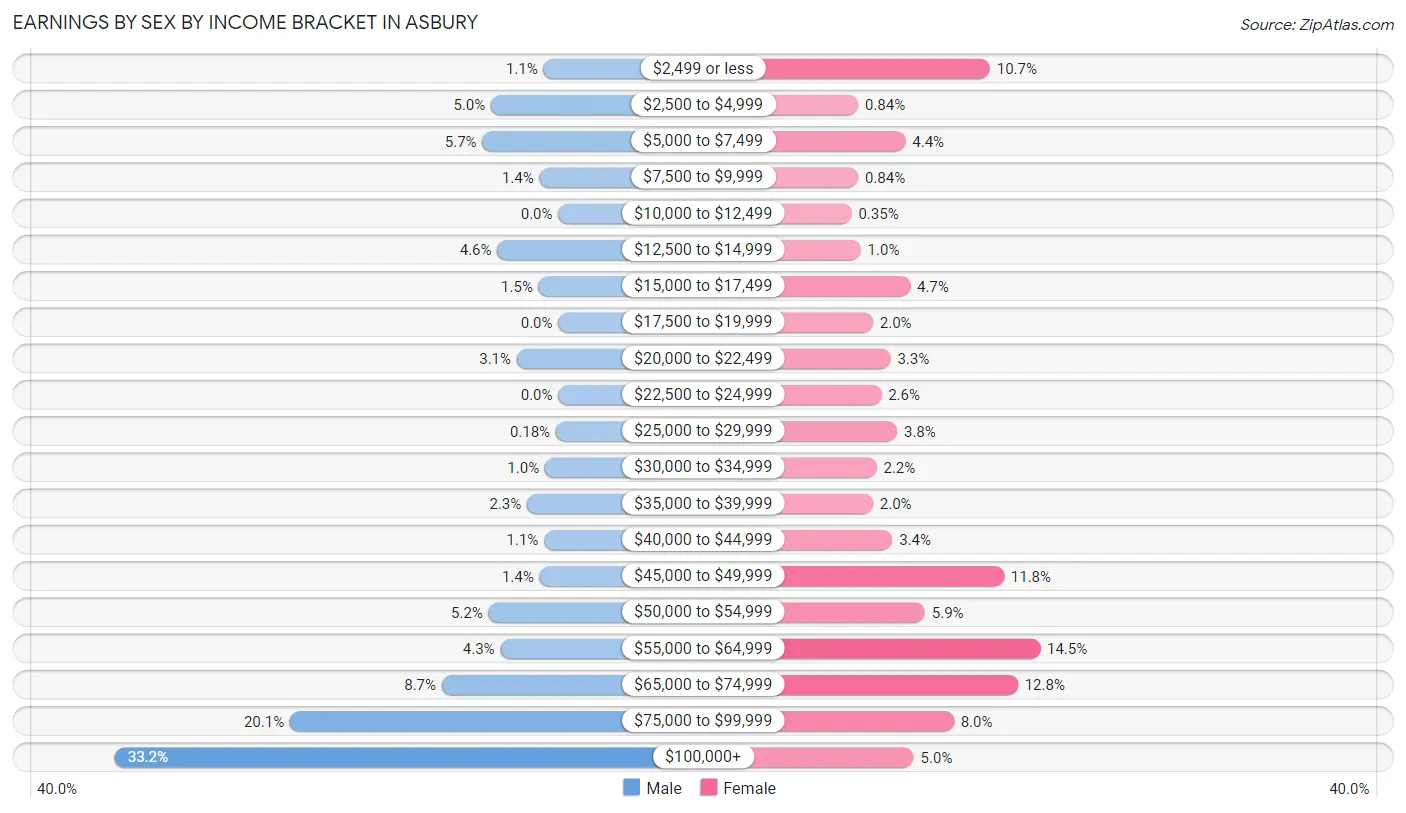
Earnings by Sex by Income Bracket in Asbury
The most common earnings brackets in Asbury are $100,000+ for men (567 | 33.2%) and $55,000 to $64,999 for women (208 | 14.5%).
| Income | Male | Female |
| $2,499 or less | 19 (1.1%) | 154 (10.7%) |
| $2,500 to $4,999 | 86 (5.0%) | 12 (0.8%) |
| $5,000 to $7,499 | 97 (5.7%) | 63 (4.4%) |
| $7,500 to $9,999 | 24 (1.4%) | 12 (0.8%) |
| $10,000 to $12,499 | 0 (0.0%) | 5 (0.4%) |
| $12,500 to $14,999 | 78 (4.6%) | 15 (1.0%) |
| $15,000 to $17,499 | 25 (1.5%) | 68 (4.7%) |
| $17,500 to $19,999 | 0 (0.0%) | 28 (1.9%) |
| $20,000 to $22,499 | 53 (3.1%) | 47 (3.3%) |
| $22,500 to $24,999 | 0 (0.0%) | 37 (2.6%) |
| $25,000 to $29,999 | 3 (0.2%) | 54 (3.8%) |
| $30,000 to $34,999 | 17 (1.0%) | 32 (2.2%) |
| $35,000 to $39,999 | 40 (2.3%) | 28 (1.9%) |
| $40,000 to $44,999 | 18 (1.1%) | 49 (3.4%) |
| $45,000 to $49,999 | 24 (1.4%) | 169 (11.8%) |
| $50,000 to $54,999 | 89 (5.2%) | 84 (5.9%) |
| $55,000 to $64,999 | 74 (4.3%) | 208 (14.5%) |
| $65,000 to $74,999 | 149 (8.7%) | 184 (12.8%) |
| $75,000 to $99,999 | 343 (20.1%) | 115 (8.0%) |
| $100,000+ | 567 (33.2%) | 72 (5.0%) |
| Total | 1,706 (100.0%) | 1,436 (100.0%) |
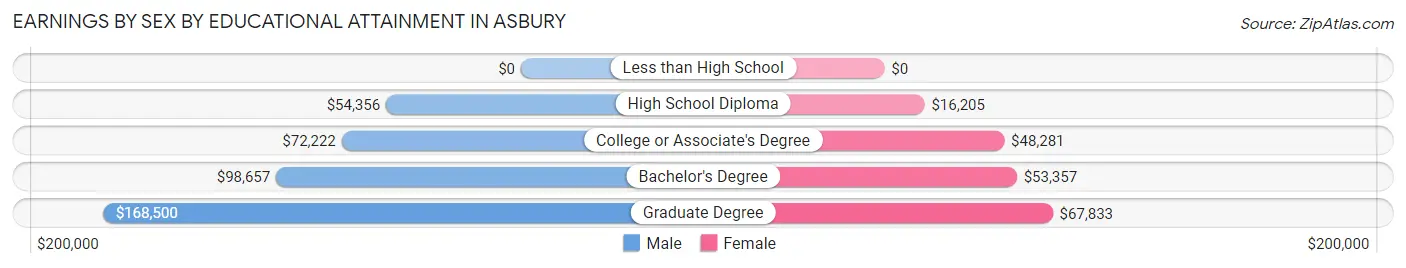
Earnings by Sex by Educational Attainment in Asbury
Average earnings in Asbury are $89,242 for men and $51,837 for women, a difference of 41.9%. Men with an educational attainment of graduate degree enjoy the highest average annual earnings of $168,500, while those with high school diploma education earn the least with $54,356. Women with an educational attainment of graduate degree earn the most with the average annual earnings of $67,833, while those with high school diploma education have the smallest earnings of $16,205.
| Educational Attainment | Male Income | Female Income |
| Less than High School | - | - |
| High School Diploma | $54,356 | $16,205 |
| College or Associate's Degree | $72,222 | $48,281 |
| Bachelor's Degree | $98,657 | $53,357 |
| Graduate Degree | $168,500 | $67,833 |
| Total | $89,242 | $51,837 |
Family Income in Asbury
Family Income Brackets in Asbury
According to the Asbury family income data, there are 567 families falling into the $100,000 to $149,999 income range, which is the most common income bracket and makes up 34.4% of all families.
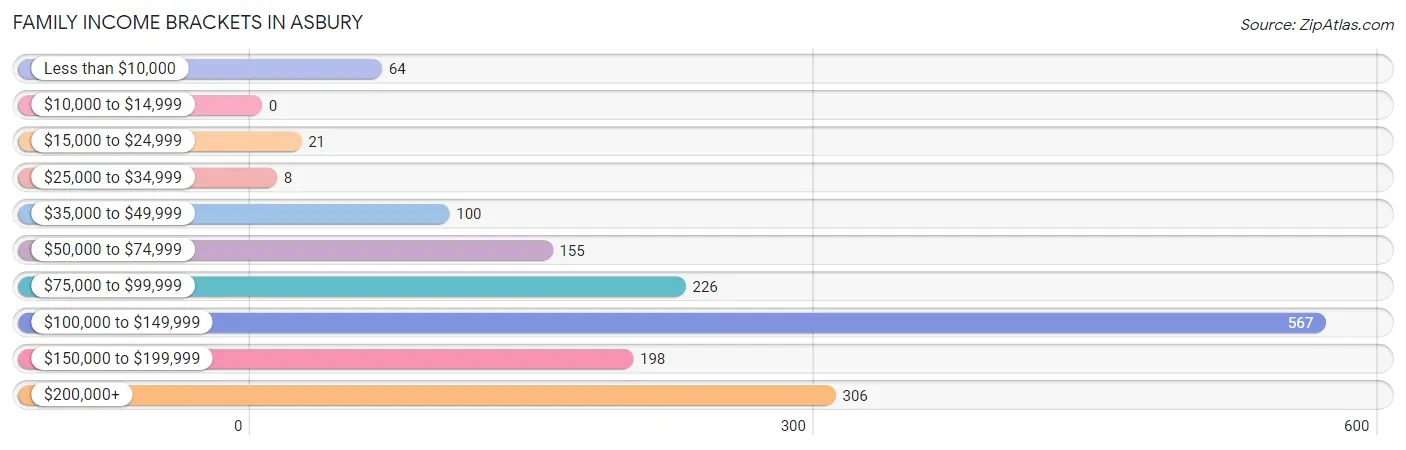
| Income Bracket | # Families | % Families |
| Less than $10,000 | 64 | 3.9% |
| $10,000 to $14,999 | 0 | 0.0% |
| $15,000 to $24,999 | 21 | 1.3% |
| $25,000 to $34,999 | 8 | 0.5% |
| $35,000 to $49,999 | 100 | 6.1% |
| $50,000 to $74,999 | 155 | 9.4% |
| $75,000 to $99,999 | 226 | 13.7% |
| $100,000 to $149,999 | 567 | 34.4% |
| $150,000 to $199,999 | 198 | 12.0% |
| $200,000+ | 306 | 18.6% |
Family Income by Famaliy Size in Asbury
4-person families (367 | 22.3%) account for the highest median family income in Asbury with $155,313 per family, while 2-person families (659 | 40.0%) have the highest median income of $54,522 per family member.
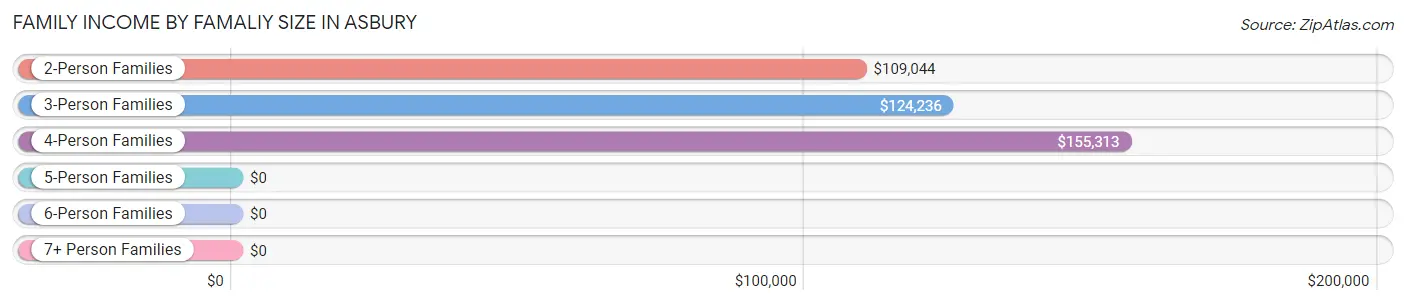
| Income Bracket | # Families | Median Income |
| 2-Person Families | 659 (40.0%) | $109,044 |
| 3-Person Families | 331 (20.1%) | $124,236 |
| 4-Person Families | 367 (22.3%) | $155,313 |
| 5-Person Families | 224 (13.6%) | $0 |
| 6-Person Families | 66 (4.0%) | $0 |
| 7+ Person Families | 0 (0.0%) | $0 |
| Total | 1,647 (100.0%) | $134,040 |
Family Income by Number of Earners in Asbury
The median family income in Asbury is $134,040, with families comprising 3+ earners (196) having the highest median family income of $197,321, while families with no earners (169) have the lowest median family income of $75,104, accounting for 11.9% and 10.3% of families, respectively.
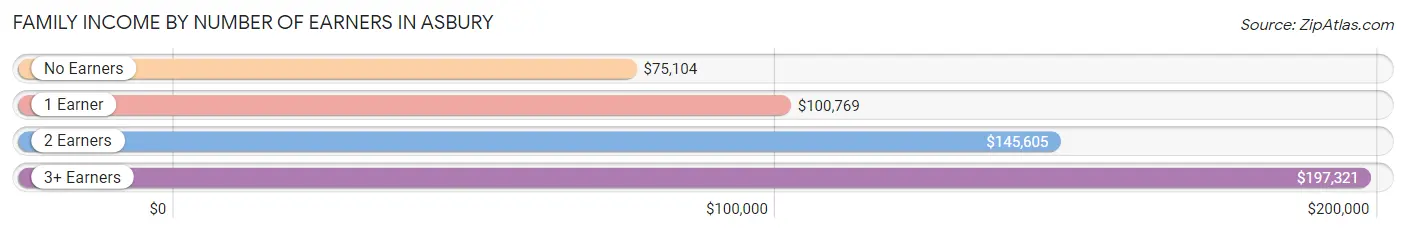
| Number of Earners | # Families | Median Income |
| No Earners | 169 (10.3%) | $75,104 |
| 1 Earner | 408 (24.8%) | $100,769 |
| 2 Earners | 874 (53.1%) | $145,605 |
| 3+ Earners | 196 (11.9%) | $197,321 |
| Total | 1,647 (100.0%) | $134,040 |
Household Income in Asbury
Household Income Brackets in Asbury
With 615 households falling in the category, the $100,000 to $149,999 income range is the most frequent in Asbury, accounting for 30.6% of all households. In contrast, only 38 households (1.9%) fall into the $25,000 to $34,999 income bracket, making it the least populous group.
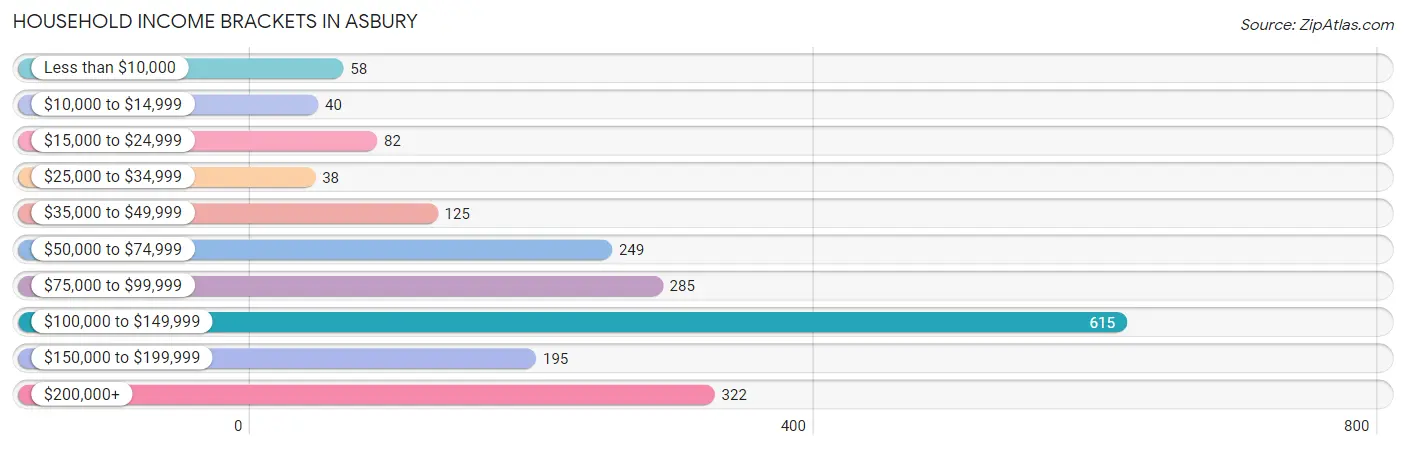
| Income Bracket | # Households | % Households |
| Less than $10,000 | 58 | 2.9% |
| $10,000 to $14,999 | 40 | 2.0% |
| $15,000 to $24,999 | 82 | 4.1% |
| $25,000 to $34,999 | 38 | 1.9% |
| $35,000 to $49,999 | 125 | 6.2% |
| $50,000 to $74,999 | 249 | 12.4% |
| $75,000 to $99,999 | 285 | 14.2% |
| $100,000 to $149,999 | 615 | 30.6% |
| $150,000 to $199,999 | 195 | 9.7% |
| $200,000+ | 322 | 16.0% |
Household Income by Householder Age in Asbury
The median household income in Asbury is $117,391, with the highest median household income of $140,208 found in the 45 to 64 years age bracket for the primary householder. A total of 735 households (36.6%) fall into this category. Meanwhile, the 15 to 24 years age bracket for the primary householder has the lowest median household income of $0, with 36 households (1.8%) in this group.
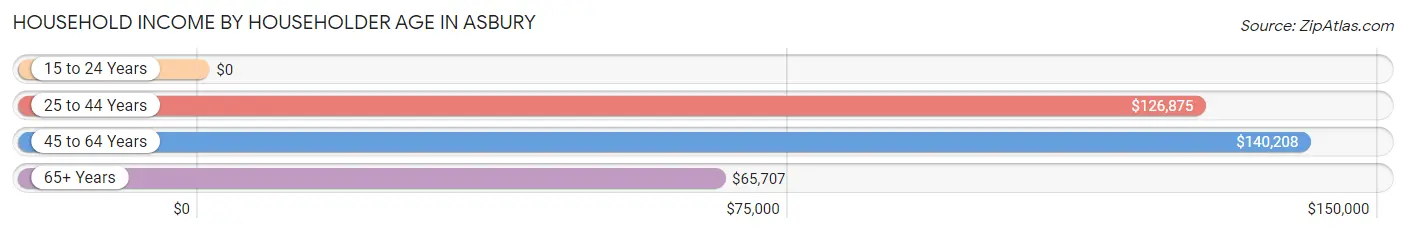
| Income Bracket | # Households | Median Income |
| 15 to 24 Years | 36 (1.8%) | $0 |
| 25 to 44 Years | 830 (41.3%) | $126,875 |
| 45 to 64 Years | 735 (36.6%) | $140,208 |
| 65+ Years | 409 (20.3%) | $65,707 |
| Total | 2,010 (100.0%) | $117,391 |
Poverty in Asbury
Income Below Poverty by Sex and Age in Asbury
With 6.6% poverty level for males and 4.6% for females among the residents of Asbury, 18 to 24 year old males and 18 to 24 year old females are the most vulnerable to poverty, with 68 males (47.9%) and 30 females (27.0%) in their respective age groups living below the poverty level.
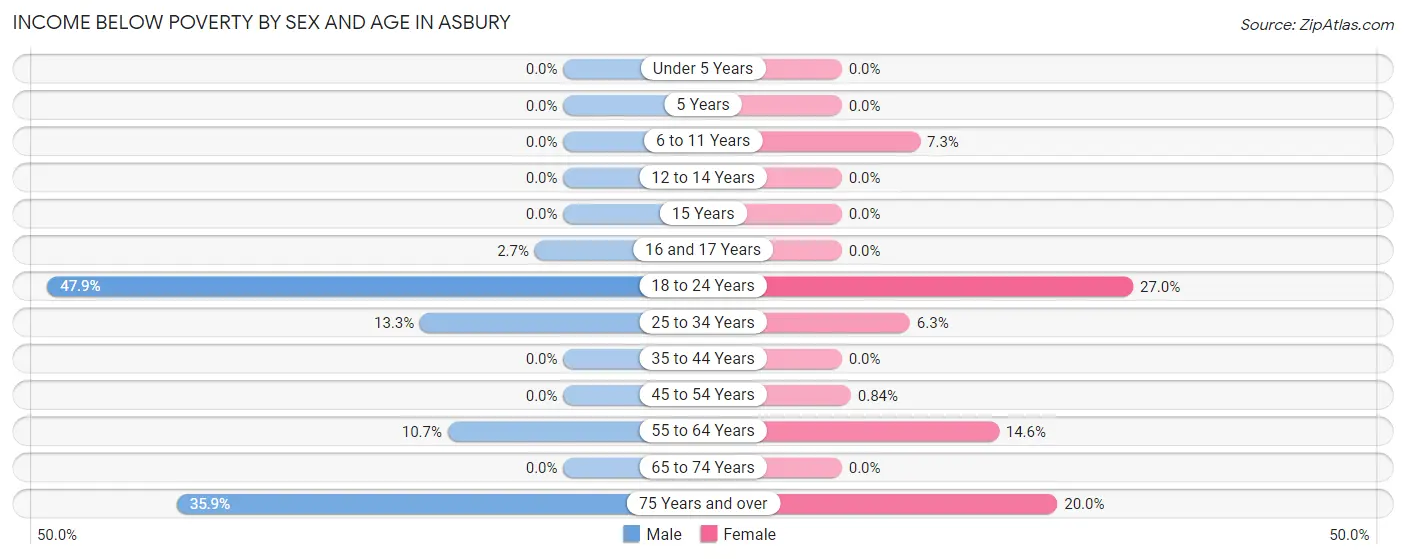
| Age Bracket | Male | Female |
| Under 5 Years | 0 (0.0%) | 0 (0.0%) |
| 5 Years | 0 (0.0%) | 0 (0.0%) |
| 6 to 11 Years | 0 (0.0%) | 20 (7.3%) |
| 12 to 14 Years | 0 (0.0%) | 0 (0.0%) |
| 15 Years | 0 (0.0%) | 0 (0.0%) |
| 16 and 17 Years | 4 (2.6%) | 0 (0.0%) |
| 18 to 24 Years | 68 (47.9%) | 30 (27.0%) |
| 25 to 34 Years | 31 (13.3%) | 18 (6.3%) |
| 35 to 44 Years | 0 (0.0%) | 0 (0.0%) |
| 45 to 54 Years | 0 (0.0%) | 3 (0.8%) |
| 55 to 64 Years | 46 (10.7%) | 44 (14.6%) |
| 65 to 74 Years | 0 (0.0%) | 0 (0.0%) |
| 75 Years and over | 33 (35.9%) | 27 (20.0%) |
| Total | 182 (6.6%) | 142 (4.6%) |
Income Above Poverty by Sex and Age in Asbury
According to the poverty statistics in Asbury, males aged under 5 years and females aged under 5 years are the age groups that are most secure financially, with 100.0% of males and 100.0% of females in these age groups living above the poverty line.
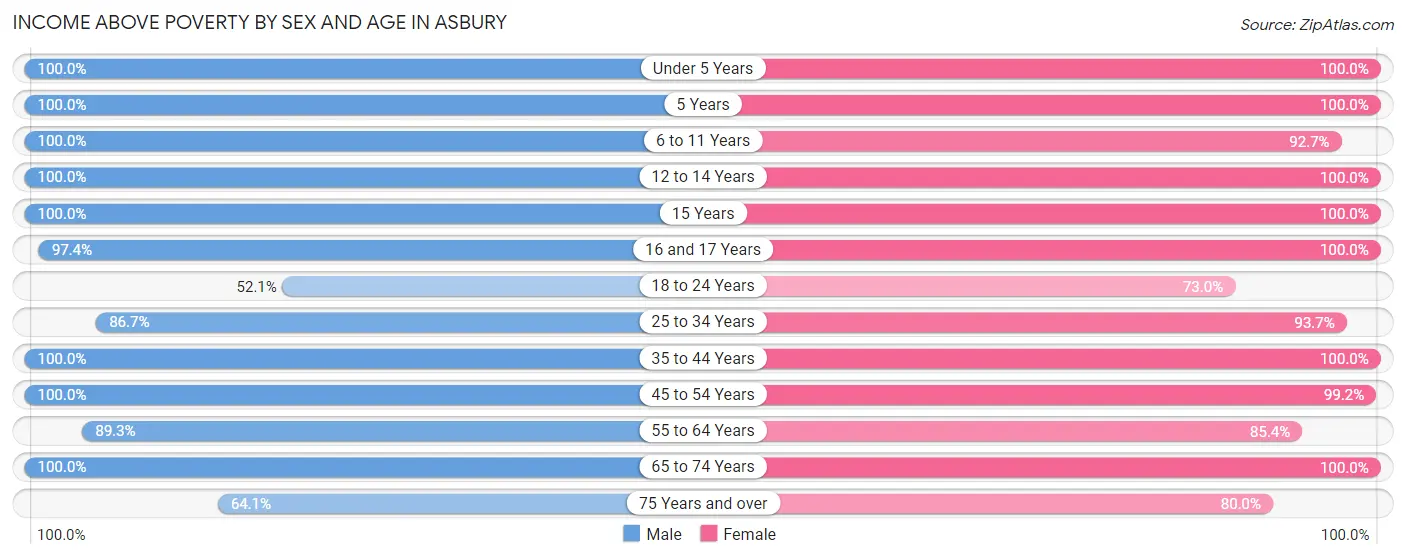
| Age Bracket | Male | Female |
| Under 5 Years | 244 (100.0%) | 357 (100.0%) |
| 5 Years | 77 (100.0%) | 132 (100.0%) |
| 6 to 11 Years | 292 (100.0%) | 255 (92.7%) |
| 12 to 14 Years | 79 (100.0%) | 134 (100.0%) |
| 15 Years | 26 (100.0%) | 104 (100.0%) |
| 16 and 17 Years | 147 (97.4%) | 86 (100.0%) |
| 18 to 24 Years | 74 (52.1%) | 81 (73.0%) |
| 25 to 34 Years | 202 (86.7%) | 267 (93.7%) |
| 35 to 44 Years | 502 (100.0%) | 565 (100.0%) |
| 45 to 54 Years | 292 (100.0%) | 355 (99.2%) |
| 55 to 64 Years | 383 (89.3%) | 258 (85.4%) |
| 65 to 74 Years | 198 (100.0%) | 259 (100.0%) |
| 75 Years and over | 59 (64.1%) | 108 (80.0%) |
| Total | 2,575 (93.4%) | 2,961 (95.4%) |
Income Below Poverty Among Married-Couple Families in Asbury
The poverty statistics for married-couple families in Asbury show that 4.5% or 66 of the total 1,468 families live below the poverty line. Families with no children have the highest poverty rate of 9.1%, comprising of 66 families. On the other hand, families with 1 or 2 children have the lowest poverty rate of 0.0%, which includes 0 families.
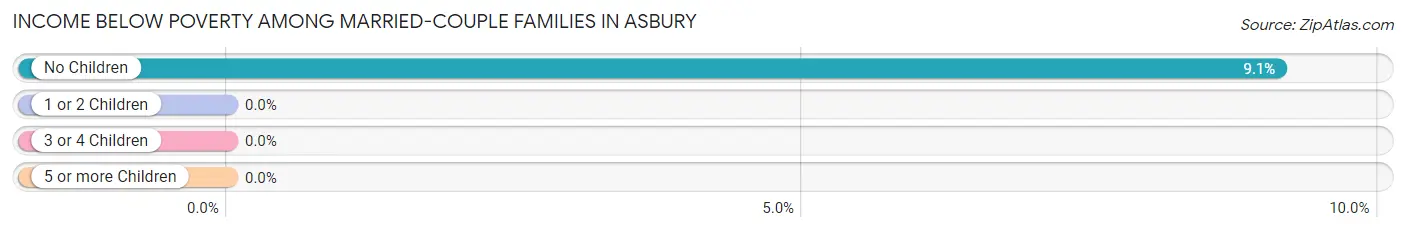
| Children | Above Poverty | Below Poverty |
| No Children | 657 (90.9%) | 66 (9.1%) |
| 1 or 2 Children | 512 (100.0%) | 0 (0.0%) |
| 3 or 4 Children | 233 (100.0%) | 0 (0.0%) |
| 5 or more Children | 0 (0.0%) | 0 (0.0%) |
| Total | 1,402 (95.5%) | 66 (4.5%) |
Income Below Poverty Among Single-Parent Households in Asbury
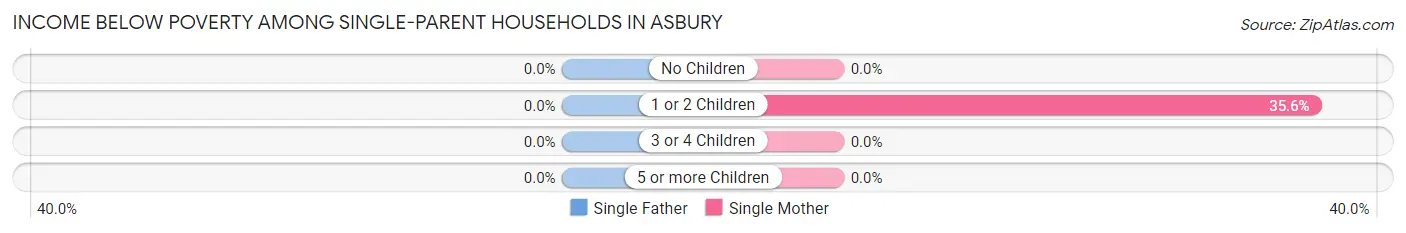
| Children | Single Father | Single Mother |
| No Children | 0 (0.0%) | 0 (0.0%) |
| 1 or 2 Children | 0 (0.0%) | 21 (35.6%) |
| 3 or 4 Children | 0 (0.0%) | 0 (0.0%) |
| 5 or more Children | 0 (0.0%) | 0 (0.0%) |
| Total | 0 (0.0%) | 21 (19.8%) |
Income Below Poverty Among Married-Couple vs Single-Parent Households in Asbury
The poverty data for Asbury shows that 66 of the married-couple family households (4.5%) and 21 of the single-parent households (11.7%) are living below the poverty level. Within the married-couple family households, those with no children have the highest poverty rate, with 66 households (9.1%) falling below the poverty line. Among the single-parent households, those with 1 or 2 children have the highest poverty rate, with 21 household (18.3%) living below poverty.
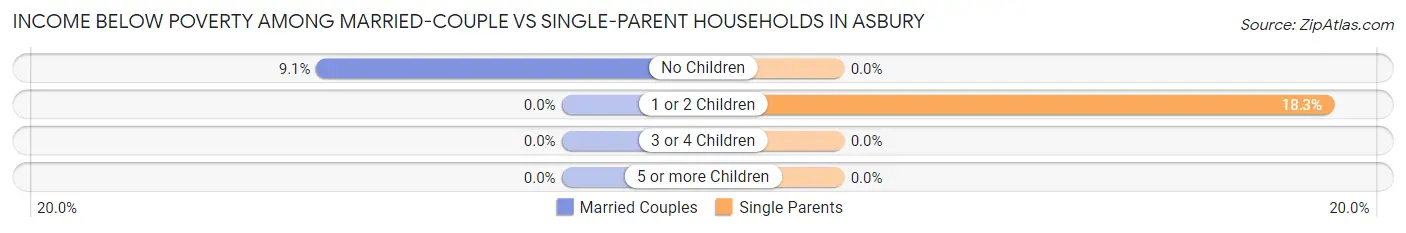
| Children | Married-Couple Families | Single-Parent Households |
| No Children | 66 (9.1%) | 0 (0.0%) |
| 1 or 2 Children | 0 (0.0%) | 21 (18.3%) |
| 3 or 4 Children | 0 (0.0%) | 0 (0.0%) |
| 5 or more Children | 0 (0.0%) | 0 (0.0%) |
| Total | 66 (4.5%) | 21 (11.7%) |
Race in Asbury
The most populous races in Asbury are White / Caucasian (5,362 | 91.0%), Asian (226 | 3.8%), and Black / African American (197 | 3.3%).
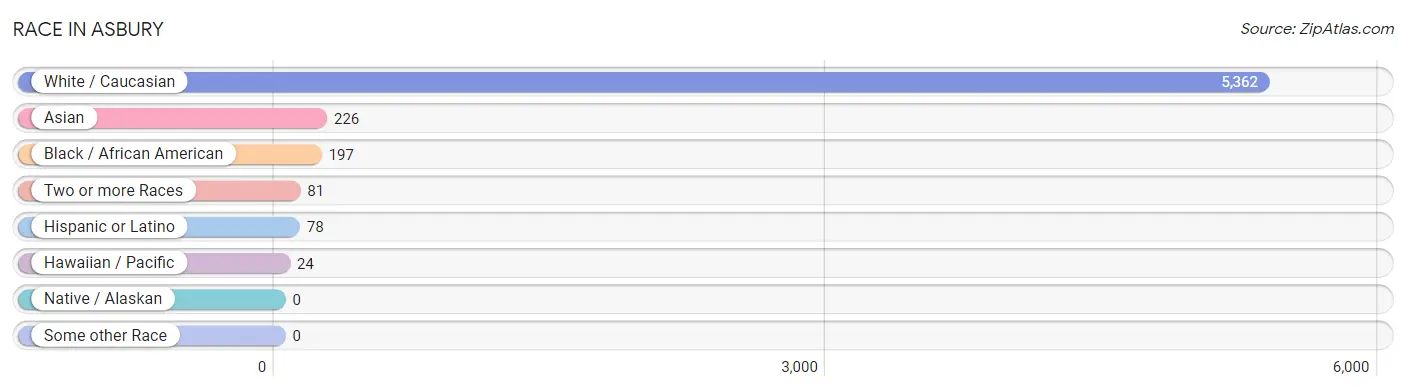
| Race | # Population | % Population |
| Asian | 226 | 3.8% |
| Black / African American | 197 | 3.3% |
| Hawaiian / Pacific | 24 | 0.4% |
| Hispanic or Latino | 78 | 1.3% |
| Native / Alaskan | 0 | 0.0% |
| White / Caucasian | 5,362 | 91.0% |
| Two or more Races | 81 | 1.4% |
| Some other Race | 0 | 0.0% |
| Total | 5,890 | 100.0% |
Ancestry in Asbury
The most populous ancestries reported in Asbury are German (3,152 | 53.5%), Irish (1,718 | 29.2%), English (758 | 12.9%), Thai (146 | 2.5%), and French (139 | 2.4%), together accounting for 100.4% of all Asbury residents.
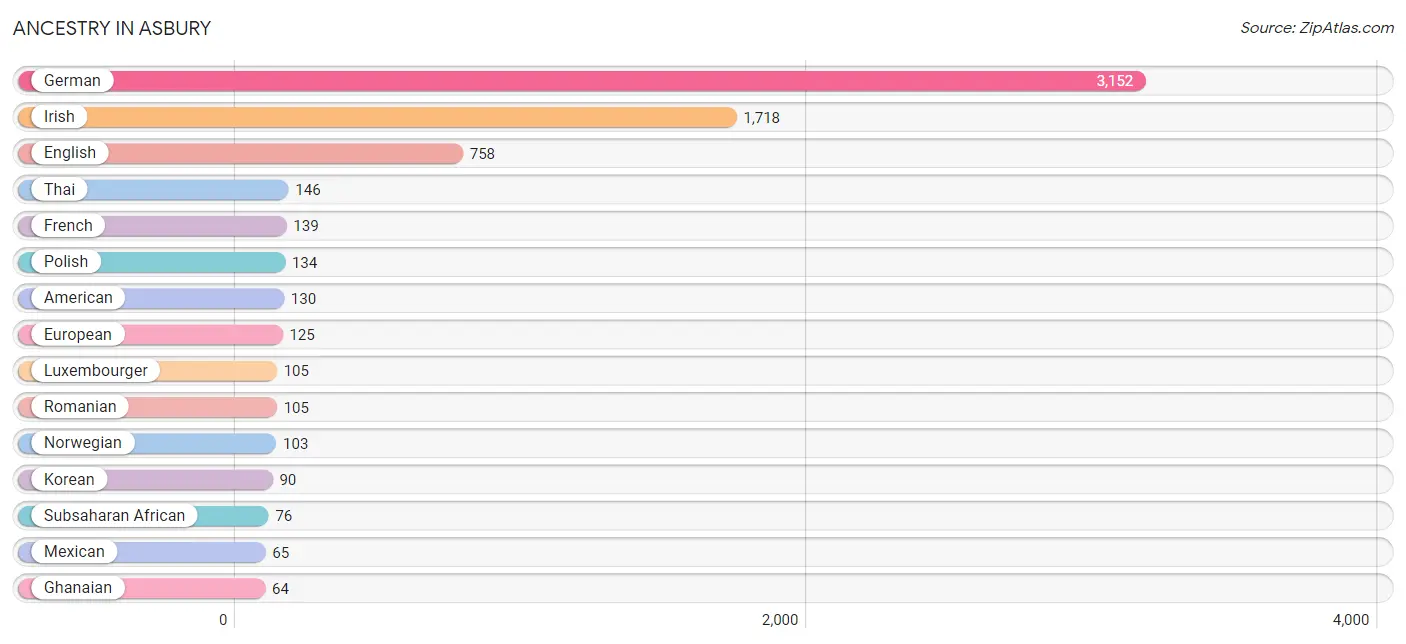
| Ancestry | # Population | % Population |
| American | 130 | 2.2% |
| Arab | 5 | 0.1% |
| Central American | 8 | 0.1% |
| Central American Indian | 7 | 0.1% |
| Colombian | 5 | 0.1% |
| Czech | 39 | 0.7% |
| Danish | 30 | 0.5% |
| Dutch | 32 | 0.5% |
| English | 758 | 12.9% |
| European | 125 | 2.1% |
| Finnish | 22 | 0.4% |
| French | 139 | 2.4% |
| German | 3,152 | 53.5% |
| Ghanaian | 64 | 1.1% |
| Greek | 5 | 0.1% |
| Guatemalan | 8 | 0.1% |
| Hungarian | 23 | 0.4% |
| Indian (Asian) | 16 | 0.3% |
| Irish | 1,718 | 29.2% |
| Italian | 21 | 0.4% |
| Korean | 90 | 1.5% |
| Latvian | 22 | 0.4% |
| Lebanese | 5 | 0.1% |
| Lithuanian | 14 | 0.2% |
| Luxembourger | 105 | 1.8% |
| Mexican | 65 | 1.1% |
| Norwegian | 103 | 1.8% |
| Polish | 134 | 2.3% |
| Romanian | 105 | 1.8% |
| Russian | 8 | 0.1% |
| Scotch-Irish | 22 | 0.4% |
| South African | 7 | 0.1% |
| South American | 5 | 0.1% |
| Subsaharan African | 76 | 1.3% |
| Swedish | 23 | 0.4% |
| Swiss | 18 | 0.3% |
| Thai | 146 | 2.5% |
| Ukrainian | 10 | 0.2% |
| Vietnamese | 11 | 0.2% | View All 39 Rows |
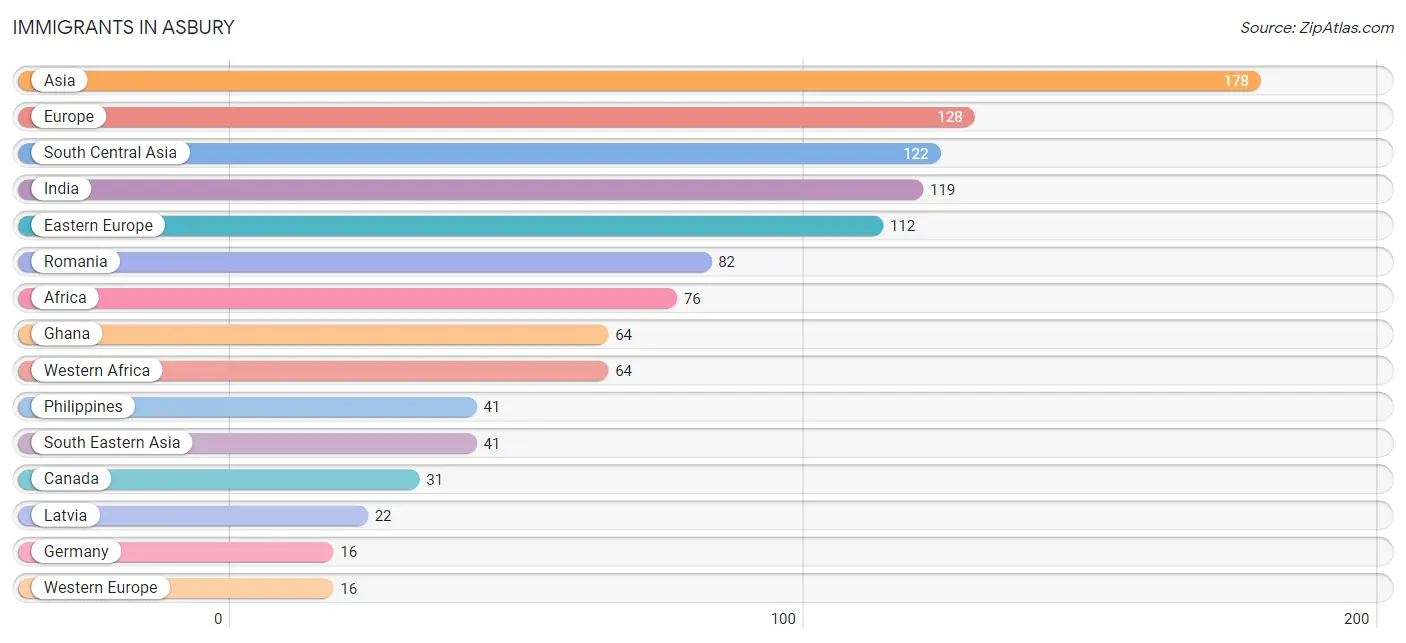
Immigrants in Asbury
The most numerous immigrant groups reported in Asbury came from Asia (178 | 3.0%), Europe (128 | 2.2%), South Central Asia (122 | 2.1%), India (119 | 2.0%), and Eastern Europe (112 | 1.9%), together accounting for 11.2% of all Asbury residents.
| Immigration Origin | # Population | % Population |
| Africa | 76 | 1.3% |
| Asia | 178 | 3.0% |
| Bangladesh | 3 | 0.1% |
| Cameroon | 5 | 0.1% |
| Canada | 31 | 0.5% |
| Central America | 7 | 0.1% |
| China | 15 | 0.3% |
| Eastern Asia | 15 | 0.3% |
| Eastern Europe | 112 | 1.9% |
| Europe | 128 | 2.2% |
| Germany | 16 | 0.3% |
| Ghana | 64 | 1.1% |
| Guatemala | 7 | 0.1% |
| India | 119 | 2.0% |
| Latin America | 7 | 0.1% |
| Latvia | 22 | 0.4% |
| Middle Africa | 5 | 0.1% |
| Philippines | 41 | 0.7% |
| Romania | 82 | 1.4% |
| Russia | 8 | 0.1% |
| South Africa | 7 | 0.1% |
| South Central Asia | 122 | 2.1% |
| South Eastern Asia | 41 | 0.7% |
| Western Africa | 64 | 1.1% |
| Western Europe | 16 | 0.3% | View All 25 Rows |
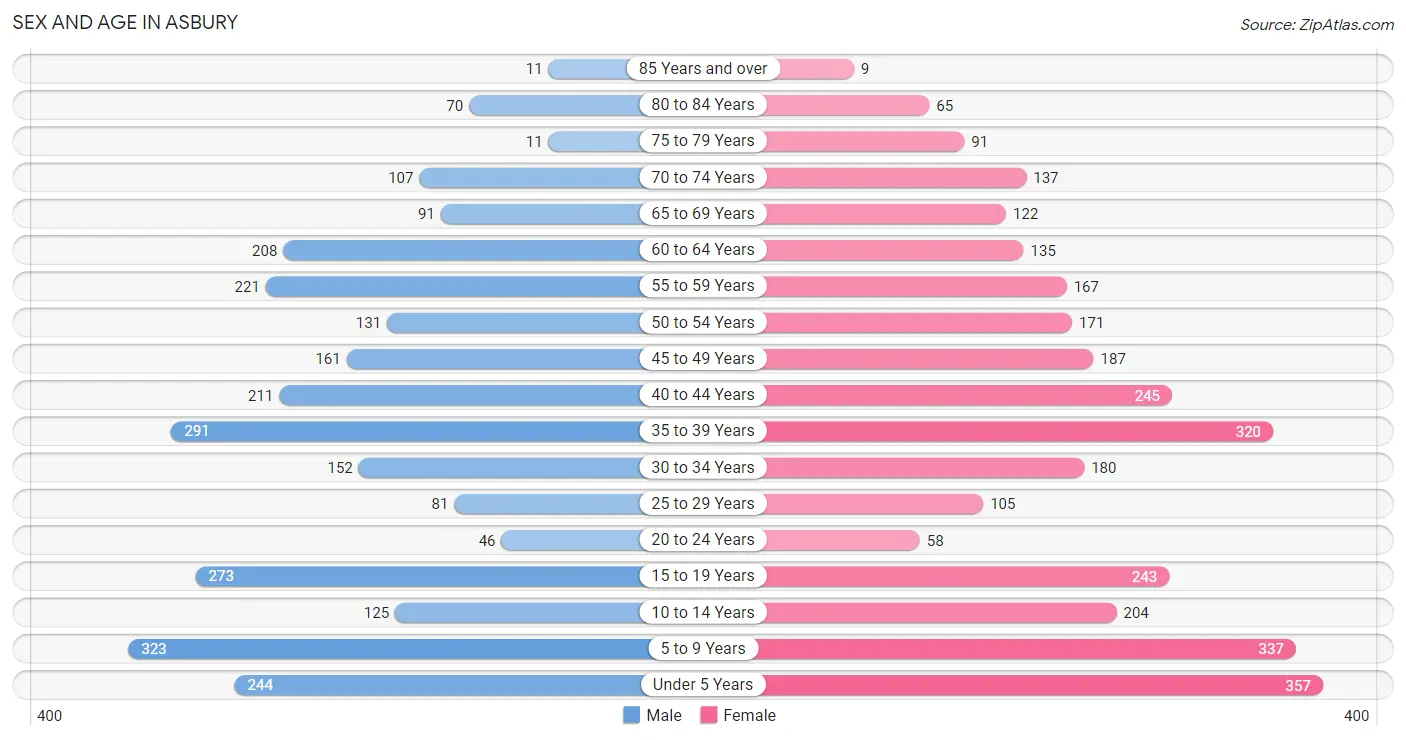
Sex and Age in Asbury
Sex and Age in Asbury
The most populous age groups in Asbury are 5 to 9 Years (323 | 11.7%) for men and Under 5 Years (357 | 11.4%) for women.
| Age Bracket | Male | Female |
| Under 5 Years | 244 (8.8%) | 357 (11.4%) |
| 5 to 9 Years | 323 (11.7%) | 337 (10.8%) |
| 10 to 14 Years | 125 (4.5%) | 204 (6.5%) |
| 15 to 19 Years | 273 (9.9%) | 243 (7.8%) |
| 20 to 24 Years | 46 (1.7%) | 58 (1.8%) |
| 25 to 29 Years | 81 (2.9%) | 105 (3.4%) |
| 30 to 34 Years | 152 (5.5%) | 180 (5.8%) |
| 35 to 39 Years | 291 (10.5%) | 320 (10.2%) |
| 40 to 44 Years | 211 (7.6%) | 245 (7.8%) |
| 45 to 49 Years | 161 (5.8%) | 187 (6.0%) |
| 50 to 54 Years | 131 (4.8%) | 171 (5.5%) |
| 55 to 59 Years | 221 (8.0%) | 167 (5.3%) |
| 60 to 64 Years | 208 (7.5%) | 135 (4.3%) |
| 65 to 69 Years | 91 (3.3%) | 122 (3.9%) |
| 70 to 74 Years | 107 (3.9%) | 137 (4.4%) |
| 75 to 79 Years | 11 (0.4%) | 91 (2.9%) |
| 80 to 84 Years | 70 (2.5%) | 65 (2.1%) |
| 85 Years and over | 11 (0.4%) | 9 (0.3%) |
| Total | 2,757 (100.0%) | 3,133 (100.0%) |
Families and Households in Asbury
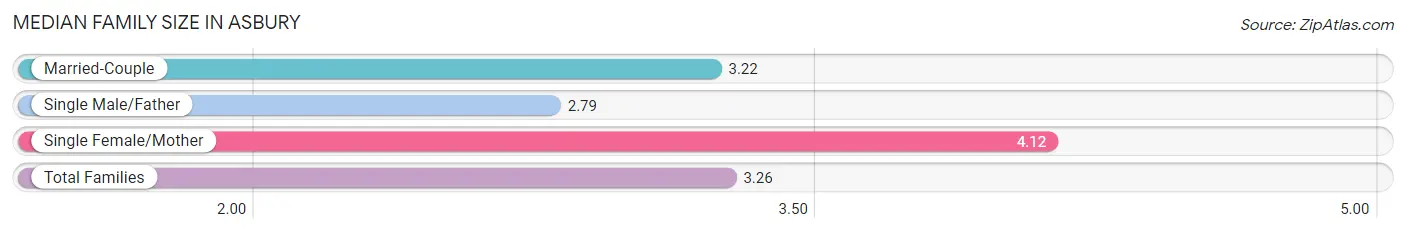
Median Family Size in Asbury
The median family size in Asbury is 3.26 persons per family, with single female/mother families (106 | 6.4%) accounting for the largest median family size of 4.12 persons per family. On the other hand, single male/father families (73 | 4.4%) represent the smallest median family size with 2.79 persons per family.
| Family Type | # Families | Family Size |
| Married-Couple | 1,468 (89.1%) | 3.22 |
| Single Male/Father | 73 (4.4%) | 2.79 |
| Single Female/Mother | 106 (6.4%) | 4.12 |
| Total Families | 1,647 (100.0%) | 3.26 |
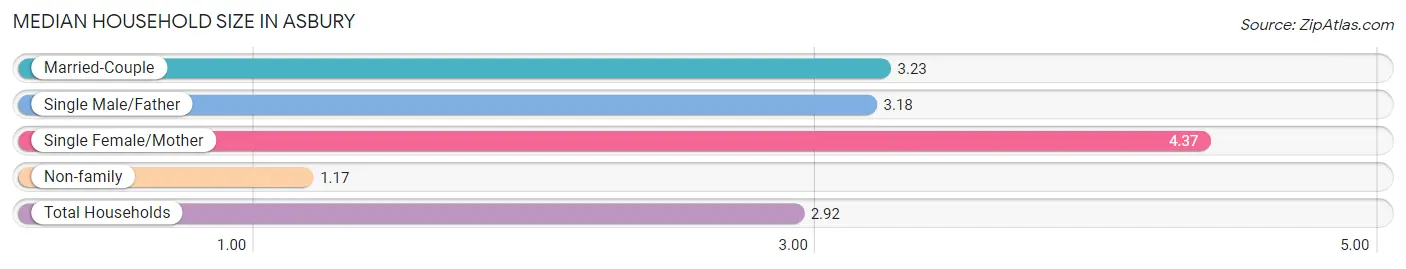
Median Household Size in Asbury
The median household size in Asbury is 2.92 persons per household, with single female/mother households (106 | 5.3%) accounting for the largest median household size of 4.37 persons per household. non-family households (363 | 18.1%) represent the smallest median household size with 1.17 persons per household.
| Household Type | # Households | Household Size |
| Married-Couple | 1,468 (73.0%) | 3.23 |
| Single Male/Father | 73 (3.6%) | 3.18 |
| Single Female/Mother | 106 (5.3%) | 4.37 |
| Non-family | 363 (18.1%) | 1.17 |
| Total Households | 2,010 (100.0%) | 2.92 |
Household Size by Marriage Status in Asbury
Out of a total of 2,010 households in Asbury, 1,647 (81.9%) are family households, while 363 (18.1%) are nonfamily households. The most numerous type of family households are 2-person households, comprising 641, and the most common type of nonfamily households are 1-person households, comprising 272.
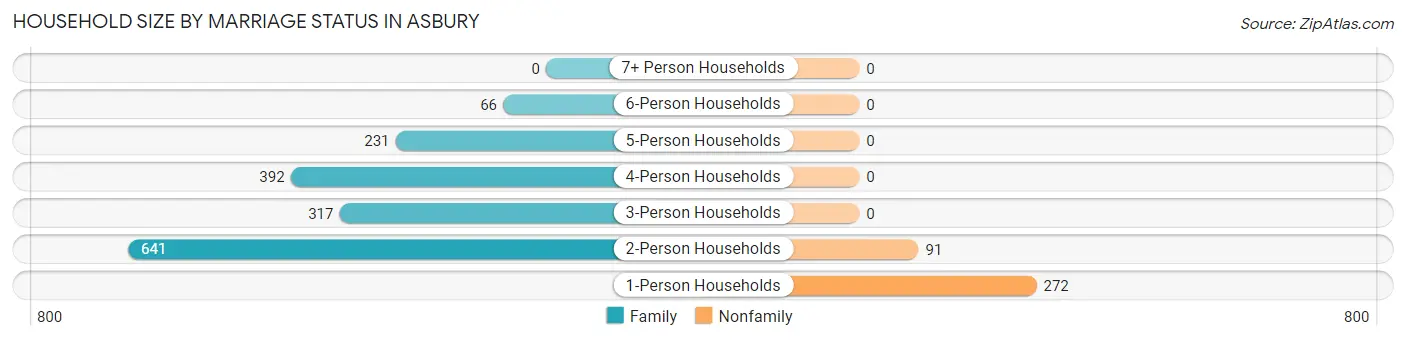
| Household Size | Family Households | Nonfamily Households |
| 1-Person Households | - | 272 (13.5%) |
| 2-Person Households | 641 (31.9%) | 91 (4.5%) |
| 3-Person Households | 317 (15.8%) | 0 (0.0%) |
| 4-Person Households | 392 (19.5%) | 0 (0.0%) |
| 5-Person Households | 231 (11.5%) | 0 (0.0%) |
| 6-Person Households | 66 (3.3%) | 0 (0.0%) |
| 7+ Person Households | 0 (0.0%) | 0 (0.0%) |
| Total | 1,647 (81.9%) | 363 (18.1%) |
Female Fertility in Asbury
Fertility by Age in Asbury
Average fertility rate in Asbury is 84.0 births per 1,000 women. Women in the age bracket of 15 to 19 years have the highest fertility rate with 218.0 births per 1,000 women. Women in the age bracket of 20 to 34 years acount for 53.1% of all women with births.
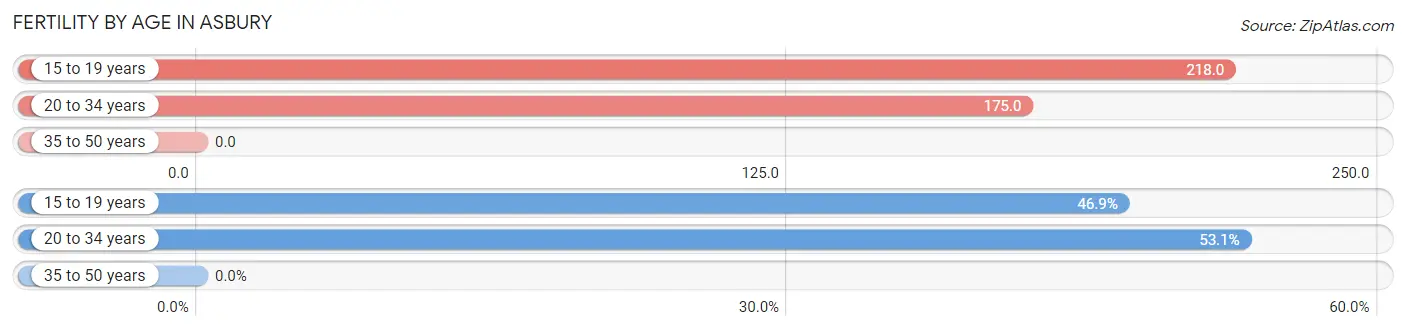
| Age Bracket | Women with Births | Births / 1,000 Women |
| 15 to 19 years | 53 (46.9%) | 218.0 |
| 20 to 34 years | 60 (53.1%) | 175.0 |
| 35 to 50 years | 0 (0.0%) | 0.0 |
| Total | 113 (100.0%) | 84.0 |
Fertility by Age by Marriage Status in Asbury
53.1% of women with births (113) in Asbury are married. The highest percentage of unmarried women with births falls into 15 to 19 years age bracket with 100.0% of them unmarried at the time of birth, while the lowest percentage of unmarried women with births belong to 20 to 34 years age bracket with 0.0% of them unmarried.
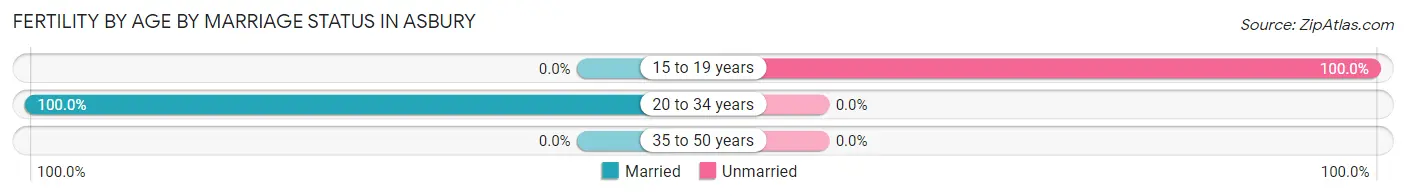
| Age Bracket | Married | Unmarried |
| 15 to 19 years | 0 (0.0%) | 53 (100.0%) |
| 20 to 34 years | 60 (100.0%) | 0 (0.0%) |
| 35 to 50 years | 0 (0.0%) | 0 (0.0%) |
| Total | 60 (53.1%) | 53 (46.9%) |
Fertility by Education in Asbury
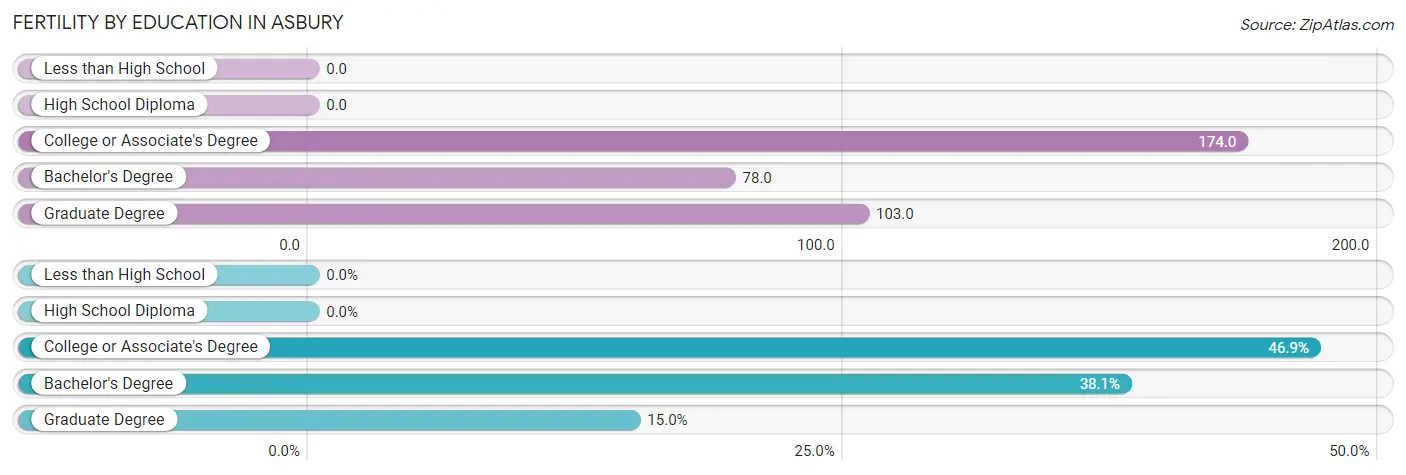
| Educational Attainment | Women with Births | Births / 1,000 Women |
| Less than High School | 0 (0.0%) | 0.0 |
| High School Diploma | 0 (0.0%) | 0.0 |
| College or Associate's Degree | 53 (46.9%) | 174.0 |
| Bachelor's Degree | 43 (38.1%) | 78.0 |
| Graduate Degree | 17 (15.0%) | 103.0 |
| Total | 113 (100.0%) | 84.0 |
Fertility by Education by Marriage Status in Asbury
46.9% of women with births in Asbury are unmarried. Women with the educational attainment of bachelor's degree are most likely to be married with 100.0% of them married at childbirth, while women with the educational attainment of college or associate's degree are least likely to be married with 100.0% of them unmarried at childbirth.
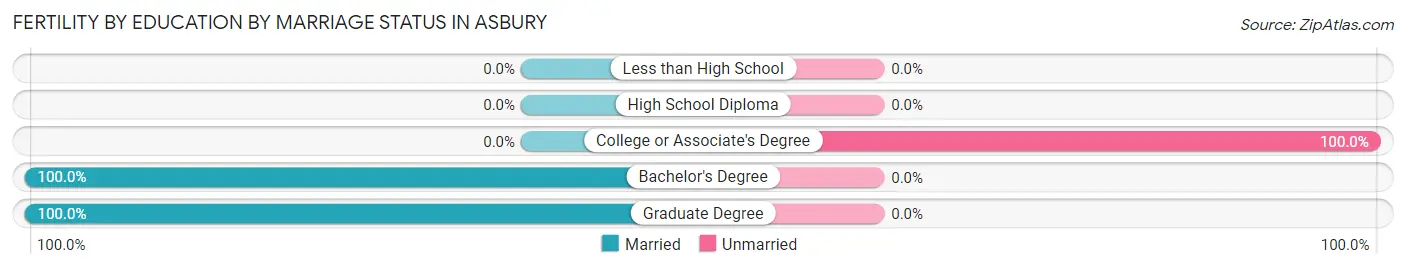
| Educational Attainment | Married | Unmarried |
| Less than High School | 0 (0.0%) | 0 (0.0%) |
| High School Diploma | 0 (0.0%) | 0 (0.0%) |
| College or Associate's Degree | 0 (0.0%) | 53 (100.0%) |
| Bachelor's Degree | 43 (100.0%) | 0 (0.0%) |
| Graduate Degree | 17 (100.0%) | 0 (0.0%) |
| Total | 60 (53.1%) | 53 (46.9%) |
Employment Characteristics in Asbury
Employment by Class of Employer in Asbury
Among the 2,866 employed individuals in Asbury, private company employees (2,174 | 75.8%), not-for-profit organizations (209 | 7.3%), and local government employees (200 | 7.0%) make up the most common classes of employment.
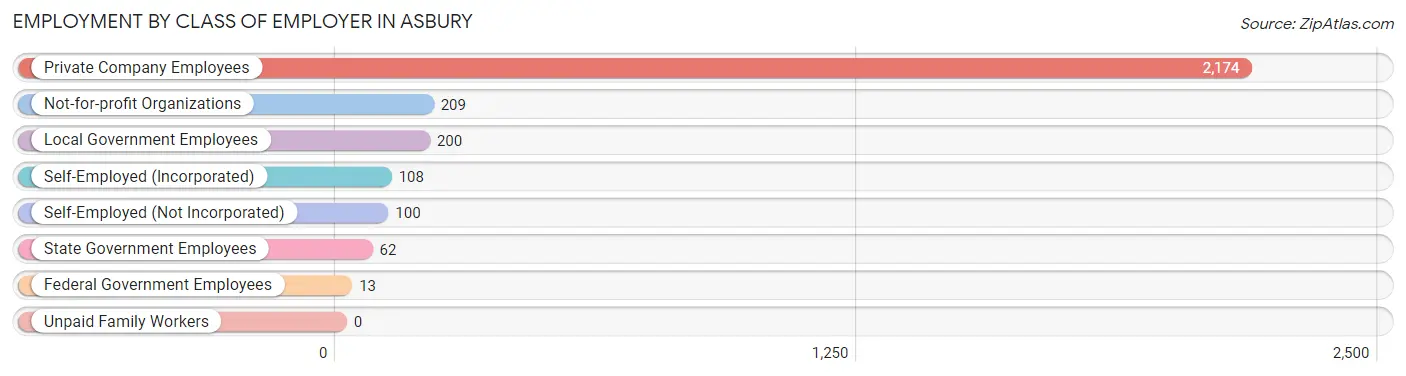
| Employer Class | # Employees | % Employees |
| Private Company Employees | 2,174 | 75.8% |
| Self-Employed (Incorporated) | 108 | 3.8% |
| Self-Employed (Not Incorporated) | 100 | 3.5% |
| Not-for-profit Organizations | 209 | 7.3% |
| Local Government Employees | 200 | 7.0% |
| State Government Employees | 62 | 2.2% |
| Federal Government Employees | 13 | 0.4% |
| Unpaid Family Workers | 0 | 0.0% |
| Total | 2,866 | 100.0% |
Employment Status by Age in Asbury
According to the labor force statistics for Asbury, out of the total population over 16 years of age (4,170), 72.4% or 3,019 individuals are in the labor force, with 4.1% or 124 of them unemployed. The age group with the highest labor force participation rate is 25 to 29 years, with 100.0% or 186 individuals in the labor force. Within the labor force, the 25 to 29 years age range has the highest percentage of unemployed individuals, with 29.6% or 55 of them being unemployed.
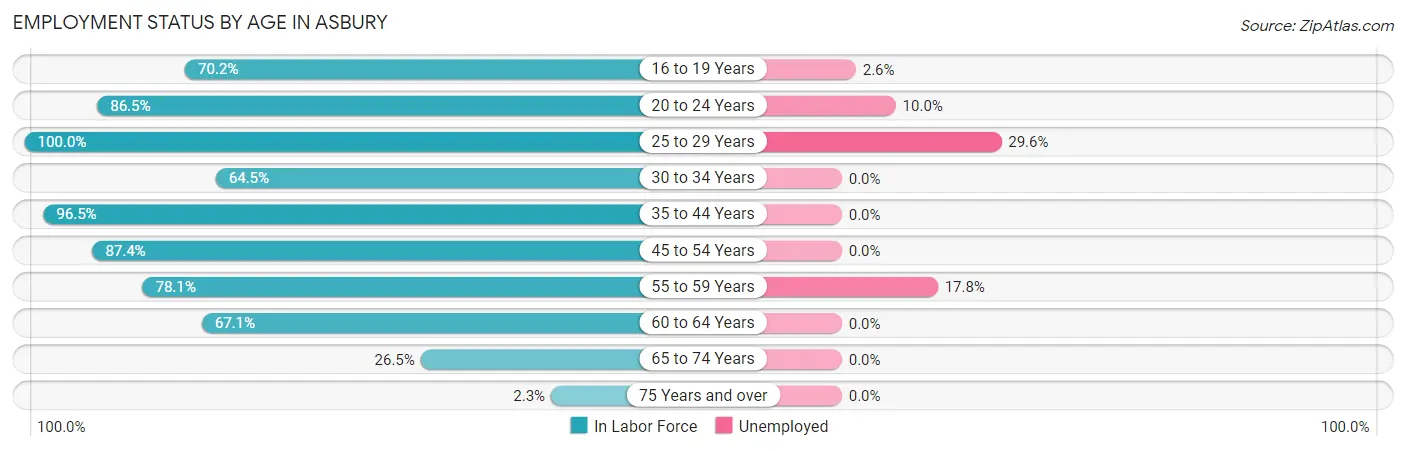
| Age Bracket | In Labor Force | Unemployed |
| 16 to 19 Years | 271 (70.2%) | 7 (2.6%) |
| 20 to 24 Years | 90 (86.5%) | 9 (10.0%) |
| 25 to 29 Years | 186 (100.0%) | 55 (29.6%) |
| 30 to 34 Years | 214 (64.5%) | 0 (0.0%) |
| 35 to 44 Years | 1,030 (96.5%) | 0 (0.0%) |
| 45 to 54 Years | 568 (87.4%) | 0 (0.0%) |
| 55 to 59 Years | 303 (78.1%) | 54 (17.8%) |
| 60 to 64 Years | 230 (67.1%) | 0 (0.0%) |
| 65 to 74 Years | 121 (26.5%) | 0 (0.0%) |
| 75 Years and over | 6 (2.3%) | 0 (0.0%) |
| Total | 3,019 (72.4%) | 124 (4.1%) |
Employment Status by Educational Attainment in Asbury
According to labor force statistics for Asbury, 85.3% of individuals (2,530) out of the total population between 25 and 64 years of age (2,966) are in the labor force, with 4.3% or 109 of them being unemployed. The group with the highest labor force participation rate are those with the educational attainment of bachelor's degree or higher, with 91.3% or 1,653 individuals in the labor force. Within the labor force, individuals with high school diploma education have the highest percentage of unemployment, with 17.2% or 55 of them being unemployed.
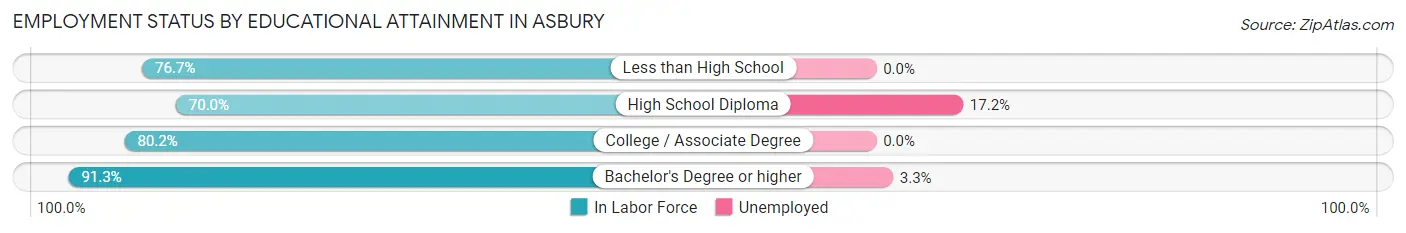
| Educational Attainment | In Labor Force | Unemployed |
| Less than High School | 33 (76.7%) | 0 (0.0%) |
| High School Diploma | 320 (70.0%) | 79 (17.2%) |
| College / Associate Degree | 525 (80.2%) | 0 (0.0%) |
| Bachelor's Degree or higher | 1,653 (91.3%) | 60 (3.3%) |
| Total | 2,530 (85.3%) | 128 (4.3%) |
Employment Occupations by Sex in Asbury
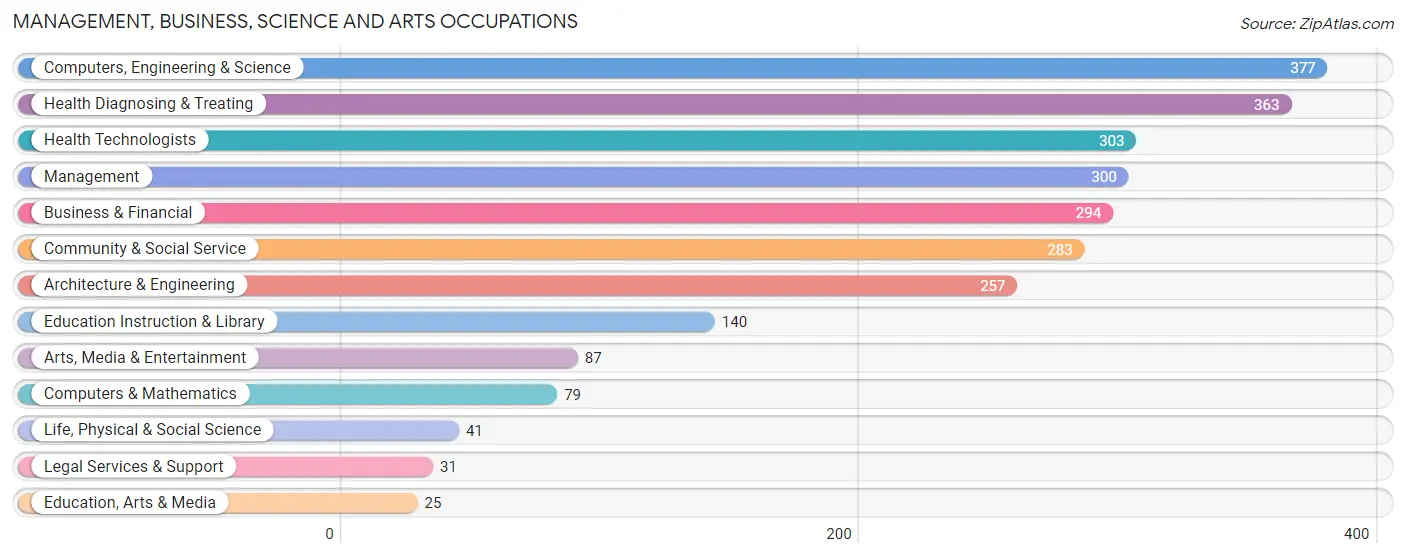
Management, Business, Science and Arts Occupations
The most common Management, Business, Science and Arts occupations in Asbury are Computers, Engineering & Science (377 | 13.0%), Health Diagnosing & Treating (363 | 12.5%), Health Technologists (303 | 10.5%), Management (300 | 10.4%), and Business & Financial (294 | 10.2%).
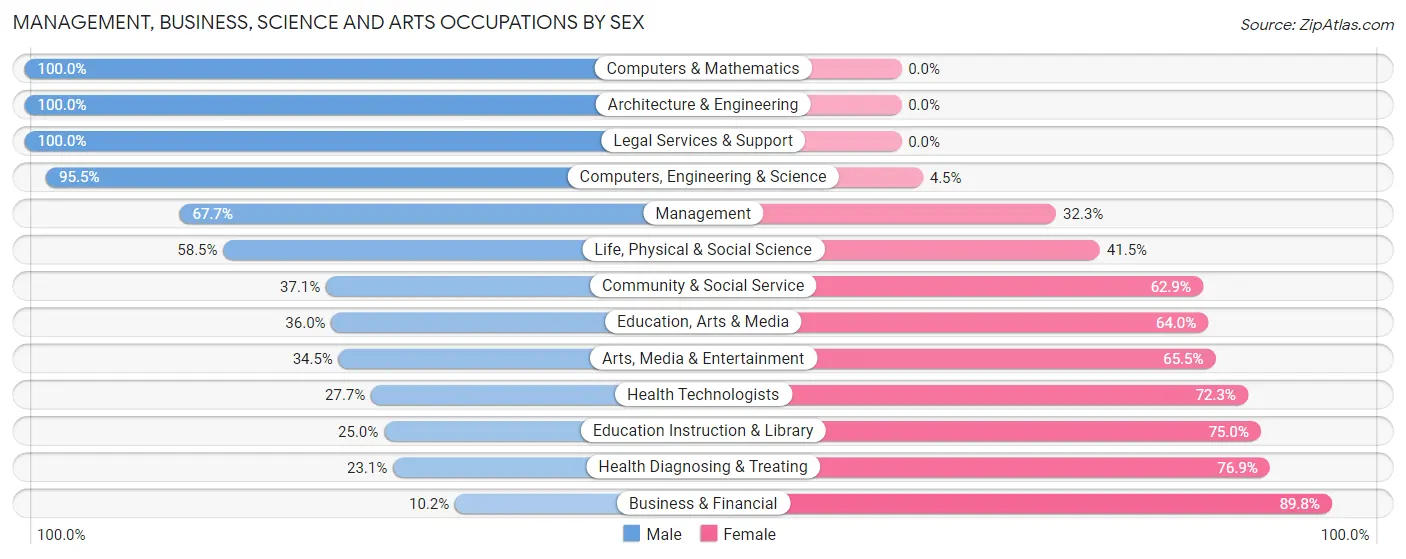
Management, Business, Science and Arts Occupations by Sex
Within the Management, Business, Science and Arts occupations in Asbury, the most male-oriented occupations are Computers & Mathematics (100.0%), Architecture & Engineering (100.0%), and Legal Services & Support (100.0%), while the most female-oriented occupations are Business & Financial (89.8%), Health Diagnosing & Treating (76.9%), and Education Instruction & Library (75.0%).
| Occupation | Male | Female |
| Management | 203 (67.7%) | 97 (32.3%) |
| Business & Financial | 30 (10.2%) | 264 (89.8%) |
| Computers, Engineering & Science | 360 (95.5%) | 17 (4.5%) |
| Computers & Mathematics | 79 (100.0%) | 0 (0.0%) |
| Architecture & Engineering | 257 (100.0%) | 0 (0.0%) |
| Life, Physical & Social Science | 24 (58.5%) | 17 (41.5%) |
| Community & Social Service | 105 (37.1%) | 178 (62.9%) |
| Education, Arts & Media | 9 (36.0%) | 16 (64.0%) |
| Legal Services & Support | 31 (100.0%) | 0 (0.0%) |
| Education Instruction & Library | 35 (25.0%) | 105 (75.0%) |
| Arts, Media & Entertainment | 30 (34.5%) | 57 (65.5%) |
| Health Diagnosing & Treating | 84 (23.1%) | 279 (76.9%) |
| Health Technologists | 84 (27.7%) | 219 (72.3%) |
| Total (Category) | 782 (48.4%) | 835 (51.6%) |
| Total (Overall) | 1,660 (57.4%) | 1,234 (42.6%) |
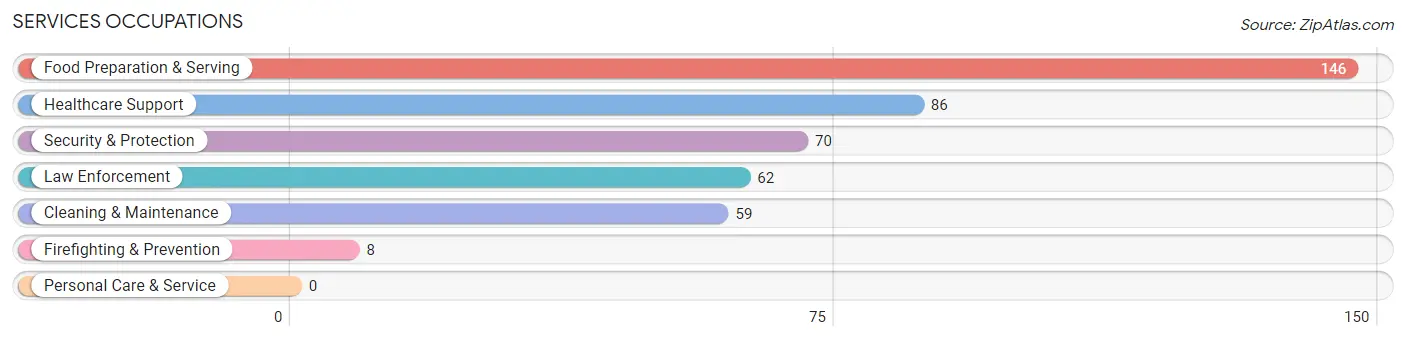
Services Occupations
The most common Services occupations in Asbury are Food Preparation & Serving (146 | 5.0%), Healthcare Support (86 | 3.0%), Security & Protection (70 | 2.4%), Law Enforcement (62 | 2.1%), and Cleaning & Maintenance (59 | 2.0%).
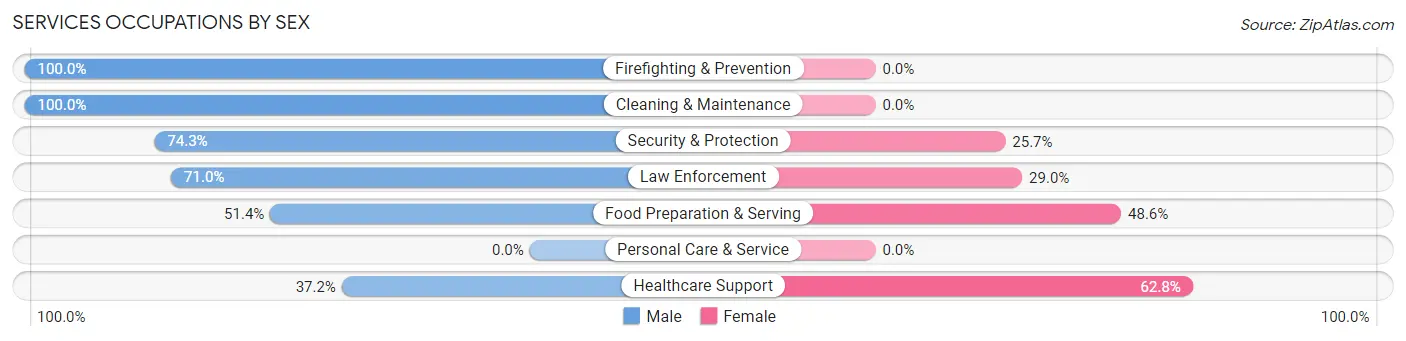
Services Occupations by Sex
Within the Services occupations in Asbury, the most male-oriented occupations are Firefighting & Prevention (100.0%), Cleaning & Maintenance (100.0%), and Security & Protection (74.3%), while the most female-oriented occupations are Healthcare Support (62.8%), Food Preparation & Serving (48.6%), and Law Enforcement (29.0%).
| Occupation | Male | Female |
| Healthcare Support | 32 (37.2%) | 54 (62.8%) |
| Security & Protection | 52 (74.3%) | 18 (25.7%) |
| Firefighting & Prevention | 8 (100.0%) | 0 (0.0%) |
| Law Enforcement | 44 (71.0%) | 18 (29.0%) |
| Food Preparation & Serving | 75 (51.4%) | 71 (48.6%) |
| Cleaning & Maintenance | 59 (100.0%) | 0 (0.0%) |
| Personal Care & Service | 0 (0.0%) | 0 (0.0%) |
| Total (Category) | 218 (60.4%) | 143 (39.6%) |
| Total (Overall) | 1,660 (57.4%) | 1,234 (42.6%) |
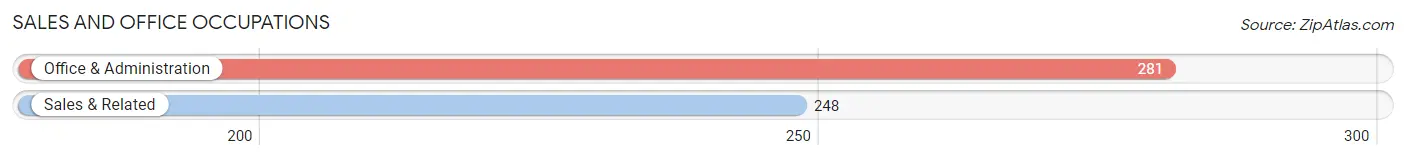
Sales and Office Occupations
The most common Sales and Office occupations in Asbury are Office & Administration (281 | 9.7%), and Sales & Related (248 | 8.6%).
Sales and Office Occupations by Sex
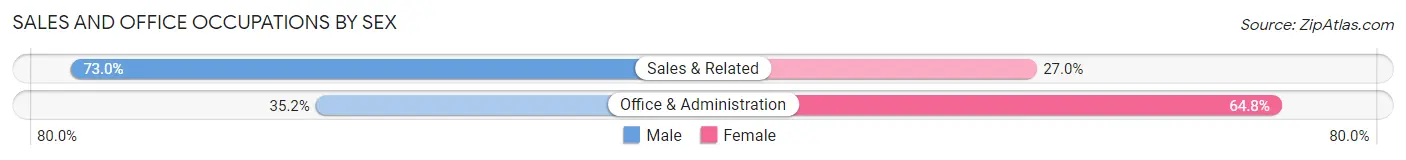
| Occupation | Male | Female |
| Sales & Related | 181 (73.0%) | 67 (27.0%) |
| Office & Administration | 99 (35.2%) | 182 (64.8%) |
| Total (Category) | 280 (52.9%) | 249 (47.1%) |
| Total (Overall) | 1,660 (57.4%) | 1,234 (42.6%) |
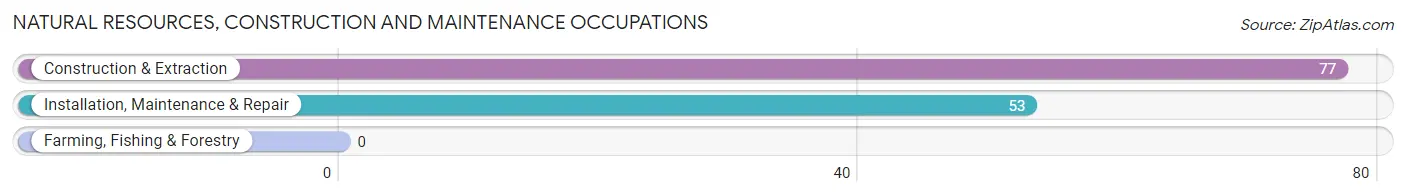
Natural Resources, Construction and Maintenance Occupations
The most common Natural Resources, Construction and Maintenance occupations in Asbury are Construction & Extraction (77 | 2.7%), and Installation, Maintenance & Repair (53 | 1.8%).
Natural Resources, Construction and Maintenance Occupations by Sex

| Occupation | Male | Female |
| Farming, Fishing & Forestry | 0 (0.0%) | 0 (0.0%) |
| Construction & Extraction | 77 (100.0%) | 0 (0.0%) |
| Installation, Maintenance & Repair | 53 (100.0%) | 0 (0.0%) |
| Total (Category) | 130 (100.0%) | 0 (0.0%) |
| Total (Overall) | 1,660 (57.4%) | 1,234 (42.6%) |
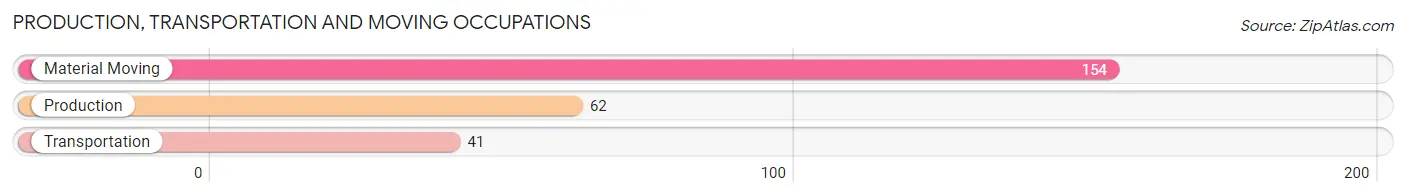
Production, Transportation and Moving Occupations
The most common Production, Transportation and Moving occupations in Asbury are Material Moving (154 | 5.3%), Production (62 | 2.1%), and Transportation (41 | 1.4%).
Production, Transportation and Moving Occupations by Sex
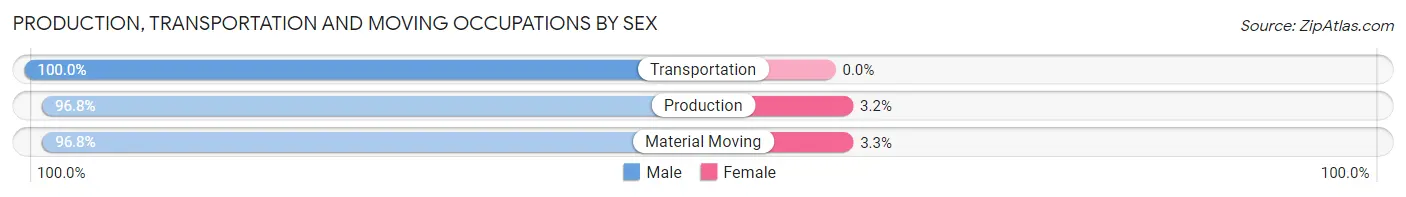
| Occupation | Male | Female |
| Production | 60 (96.8%) | 2 (3.2%) |
| Transportation | 41 (100.0%) | 0 (0.0%) |
| Material Moving | 149 (96.8%) | 5 (3.3%) |
| Total (Category) | 250 (97.3%) | 7 (2.7%) |
| Total (Overall) | 1,660 (57.4%) | 1,234 (42.6%) |
Employment Industries by Sex in Asbury
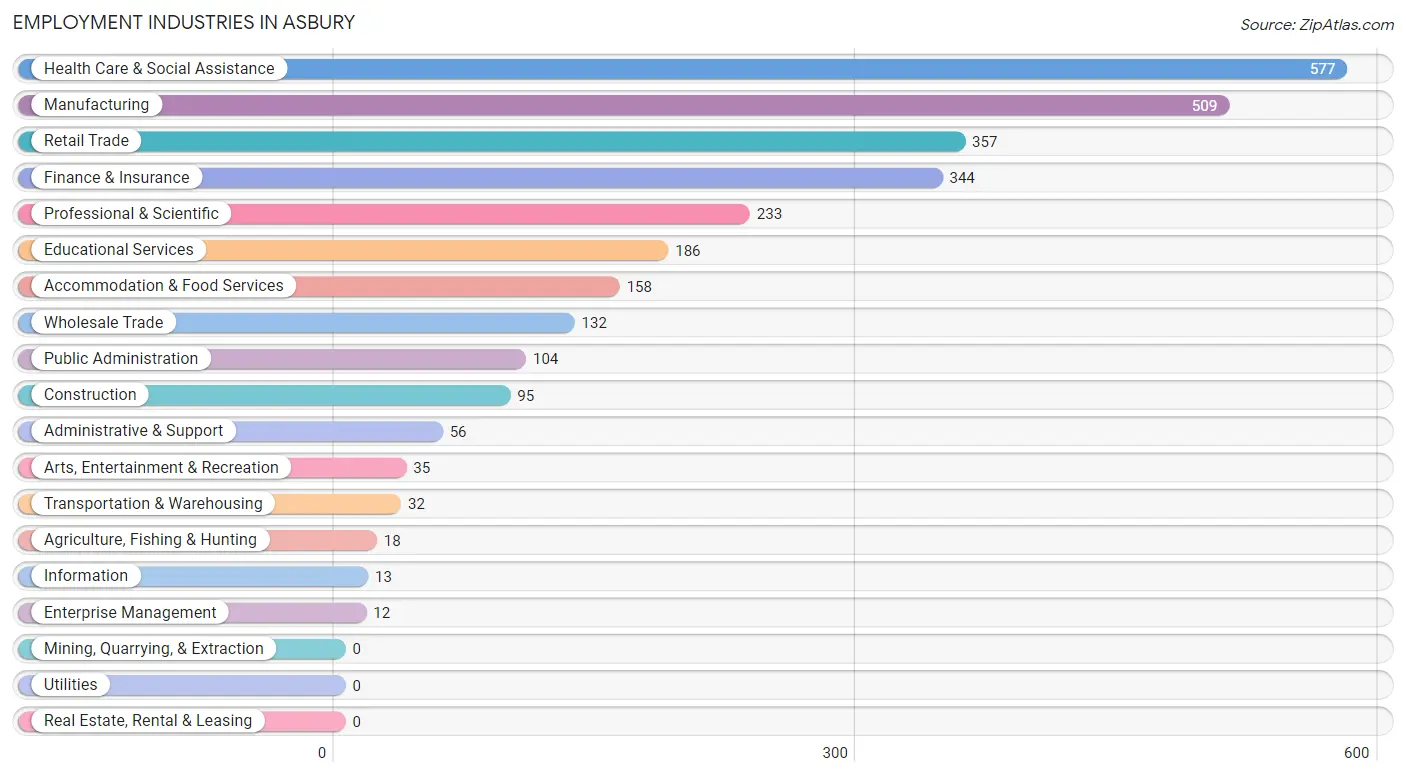
Employment Industries in Asbury
The major employment industries in Asbury include Health Care & Social Assistance (577 | 19.9%), Manufacturing (509 | 17.6%), Retail Trade (357 | 12.3%), Finance & Insurance (344 | 11.9%), and Professional & Scientific (233 | 8.1%).
Employment Industries by Sex in Asbury
The Asbury industries that see more men than women are Agriculture, Fishing & Hunting (100.0%), Construction (100.0%), and Wholesale Trade (100.0%), whereas the industries that tend to have a higher number of women are Information (100.0%), Educational Services (72.6%), and Finance & Insurance (71.2%).
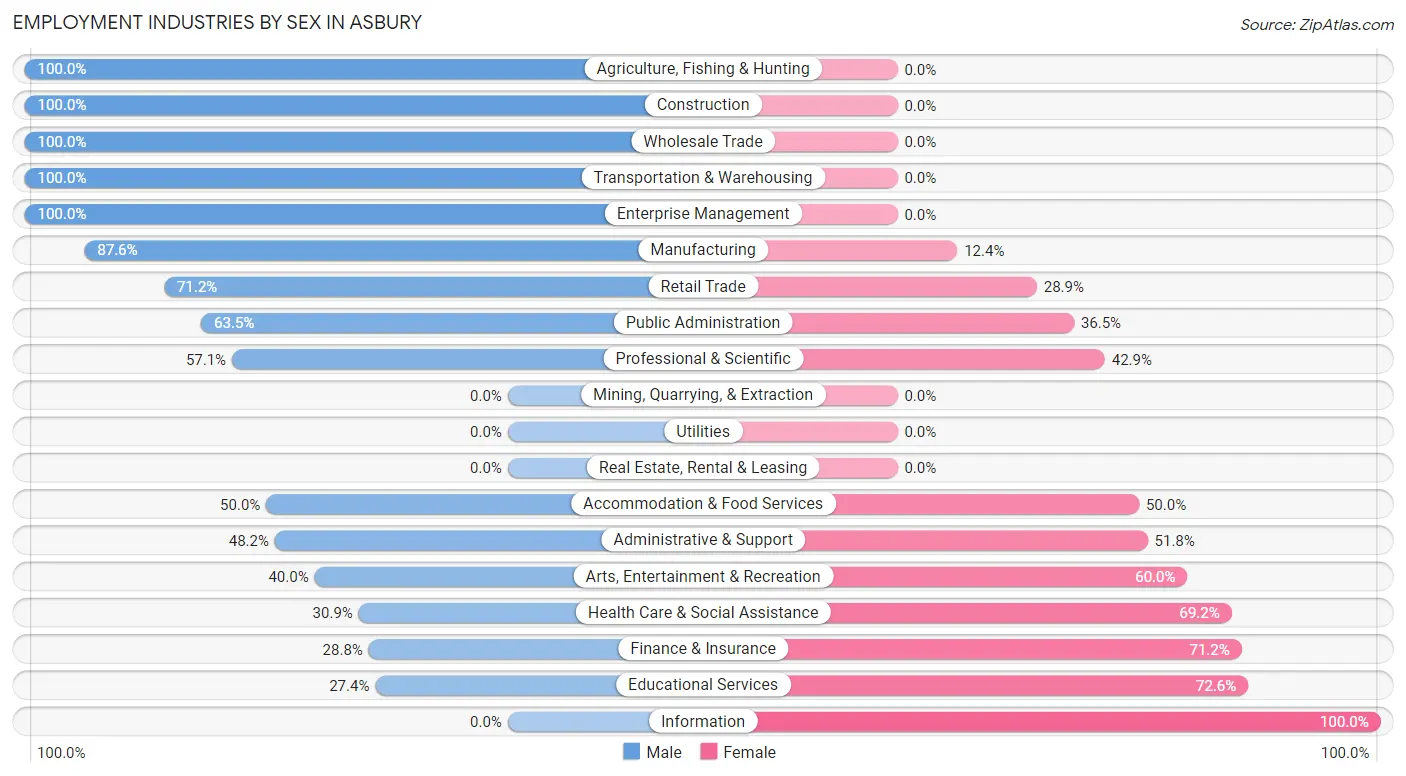
| Industry | Male | Female |
| Agriculture, Fishing & Hunting | 18 (100.0%) | 0 (0.0%) |
| Mining, Quarrying, & Extraction | 0 (0.0%) | 0 (0.0%) |
| Construction | 95 (100.0%) | 0 (0.0%) |
| Manufacturing | 446 (87.6%) | 63 (12.4%) |
| Wholesale Trade | 132 (100.0%) | 0 (0.0%) |
| Retail Trade | 254 (71.2%) | 103 (28.8%) |
| Transportation & Warehousing | 32 (100.0%) | 0 (0.0%) |
| Utilities | 0 (0.0%) | 0 (0.0%) |
| Information | 0 (0.0%) | 13 (100.0%) |
| Finance & Insurance | 99 (28.8%) | 245 (71.2%) |
| Real Estate, Rental & Leasing | 0 (0.0%) | 0 (0.0%) |
| Professional & Scientific | 133 (57.1%) | 100 (42.9%) |
| Enterprise Management | 12 (100.0%) | 0 (0.0%) |
| Administrative & Support | 27 (48.2%) | 29 (51.8%) |
| Educational Services | 51 (27.4%) | 135 (72.6%) |
| Health Care & Social Assistance | 178 (30.8%) | 399 (69.2%) |
| Arts, Entertainment & Recreation | 14 (40.0%) | 21 (60.0%) |
| Accommodation & Food Services | 79 (50.0%) | 79 (50.0%) |
| Public Administration | 66 (63.5%) | 38 (36.5%) |
| Total | 1,660 (57.4%) | 1,234 (42.6%) |
Education in Asbury
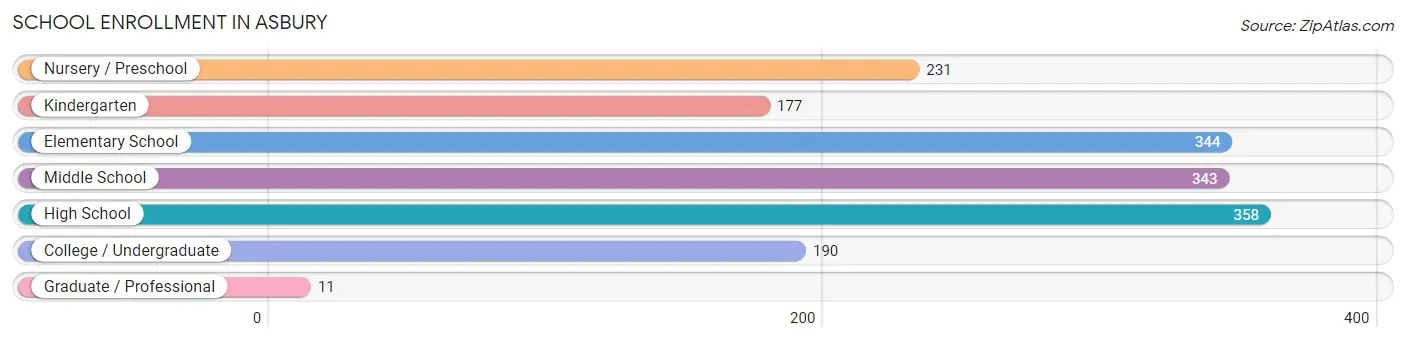
School Enrollment in Asbury
The most common levels of schooling among the 1,654 students in Asbury are high school (358 | 21.6%), elementary school (344 | 20.8%), and middle school (343 | 20.7%).
| School Level | # Students | % Students |
| Nursery / Preschool | 231 | 14.0% |
| Kindergarten | 177 | 10.7% |
| Elementary School | 344 | 20.8% |
| Middle School | 343 | 20.7% |
| High School | 358 | 21.6% |
| College / Undergraduate | 190 | 11.5% |
| Graduate / Professional | 11 | 0.7% |
| Total | 1,654 | 100.0% |
School Enrollment by Age by Funding Source in Asbury
Out of a total of 1,654 students who are enrolled in schools in Asbury, 197 (11.9%) attend a private institution, while the remaining 1,457 (88.1%) are enrolled in public schools. The age group of 25 to 34 year olds has the highest likelihood of being enrolled in private schools, with 11 (100.0% in the age bracket) enrolled. Conversely, the age group of 20 to 24 year olds has the lowest likelihood of being enrolled in a private school, with 54 (100.0% in the age bracket) attending a public institution.
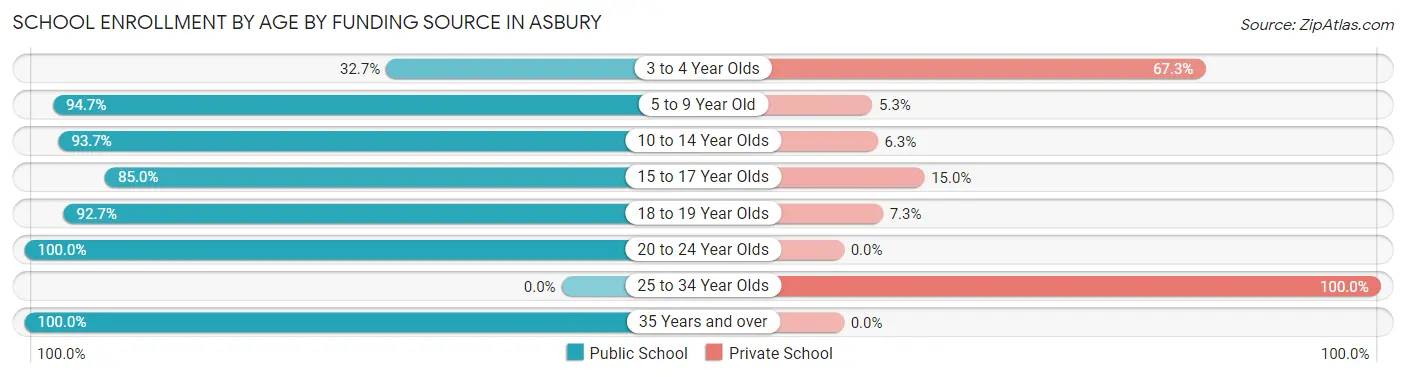
| Age Bracket | Public School | Private School |
| 3 to 4 Year Olds | 33 (32.7%) | 68 (67.3%) |
| 5 to 9 Year Old | 625 (94.7%) | 35 (5.3%) |
| 10 to 14 Year Olds | 297 (93.7%) | 20 (6.3%) |
| 15 to 17 Year Olds | 306 (85.0%) | 54 (15.0%) |
| 18 to 19 Year Olds | 102 (92.7%) | 8 (7.3%) |
| 20 to 24 Year Olds | 54 (100.0%) | 0 (0.0%) |
| 25 to 34 Year Olds | 0 (0.0%) | 11 (100.0%) |
| 35 Years and over | 41 (100.0%) | 0 (0.0%) |
| Total | 1,457 (88.1%) | 197 (11.9%) |
Educational Attainment by Field of Study in Asbury
Business (460 | 20.3%), engineering (343 | 15.1%), education (266 | 11.7%), science & technology (261 | 11.5%), and arts & humanities (172 | 7.6%) are the most common fields of study among 2,266 individuals in Asbury who have obtained a bachelor's degree or higher.
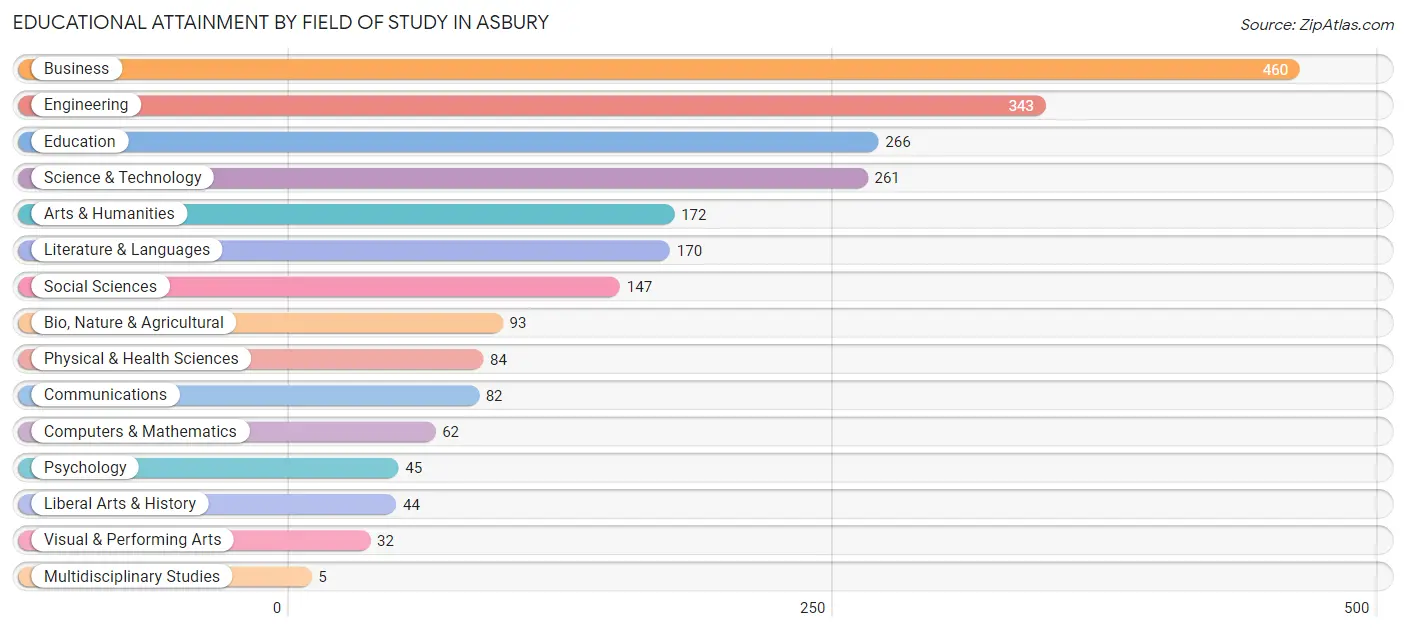
| Field of Study | # Graduates | % Graduates |
| Computers & Mathematics | 62 | 2.7% |
| Bio, Nature & Agricultural | 93 | 4.1% |
| Physical & Health Sciences | 84 | 3.7% |
| Psychology | 45 | 2.0% |
| Social Sciences | 147 | 6.5% |
| Engineering | 343 | 15.1% |
| Multidisciplinary Studies | 5 | 0.2% |
| Science & Technology | 261 | 11.5% |
| Business | 460 | 20.3% |
| Education | 266 | 11.7% |
| Literature & Languages | 170 | 7.5% |
| Liberal Arts & History | 44 | 1.9% |
| Visual & Performing Arts | 32 | 1.4% |
| Communications | 82 | 3.6% |
| Arts & Humanities | 172 | 7.6% |
| Total | 2,266 | 100.0% |
Transportation & Commute in Asbury
Vehicle Availability by Sex in Asbury
The most prevalent vehicle ownership categories in Asbury are males with 2 vehicles (907, accounting for 55.3%) and females with 2 vehicles (707, making up 74.0%).
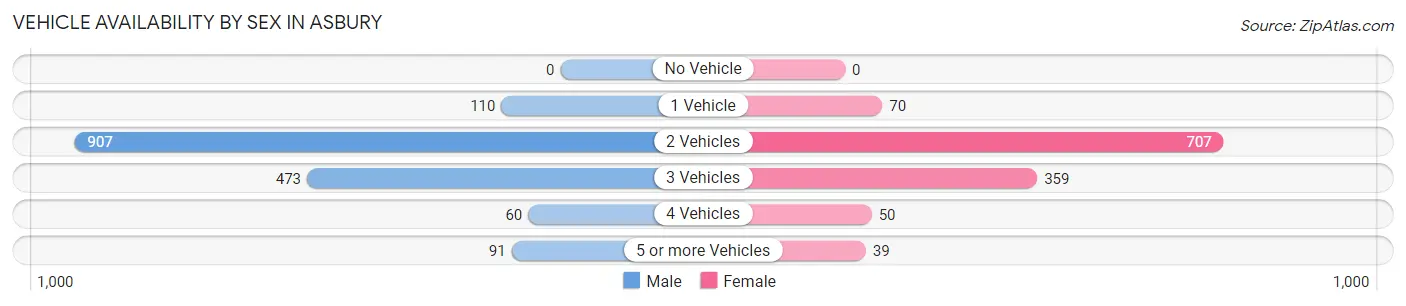
| Vehicles Available | Male | Female |
| No Vehicle | 0 (0.0%) | 0 (0.0%) |
| 1 Vehicle | 110 (6.7%) | 70 (5.7%) |
| 2 Vehicles | 907 (55.3%) | 707 (57.7%) |
| 3 Vehicles | 473 (28.8%) | 359 (29.3%) |
| 4 Vehicles | 60 (3.7%) | 50 (4.1%) |
| 5 or more Vehicles | 91 (5.6%) | 39 (3.2%) |
| Total | 1,641 (100.0%) | 1,225 (100.0%) |
Commute Time in Asbury
The most frequently occuring commute durations in Asbury are 10 to 14 minutes (747 commuters, 28.5%), 15 to 19 minutes (700 commuters, 26.7%), and 20 to 24 minutes (546 commuters, 20.8%).
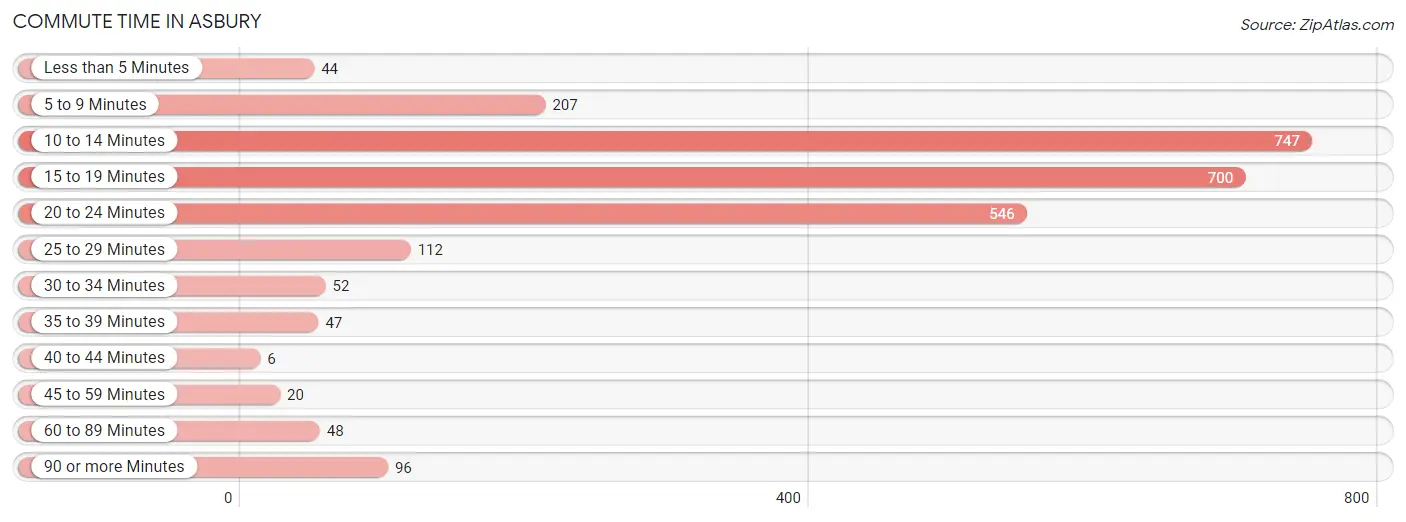
| Commute Time | # Commuters | % Commuters |
| Less than 5 Minutes | 44 | 1.7% |
| 5 to 9 Minutes | 207 | 7.9% |
| 10 to 14 Minutes | 747 | 28.5% |
| 15 to 19 Minutes | 700 | 26.7% |
| 20 to 24 Minutes | 546 | 20.8% |
| 25 to 29 Minutes | 112 | 4.3% |
| 30 to 34 Minutes | 52 | 2.0% |
| 35 to 39 Minutes | 47 | 1.8% |
| 40 to 44 Minutes | 6 | 0.2% |
| 45 to 59 Minutes | 20 | 0.8% |
| 60 to 89 Minutes | 48 | 1.8% |
| 90 or more Minutes | 96 | 3.7% |
Commute Time by Sex in Asbury
The most common commute times in Asbury are 15 to 19 minutes (494 commuters, 31.7%) for males and 10 to 14 minutes (452 commuters, 42.4%) for females.
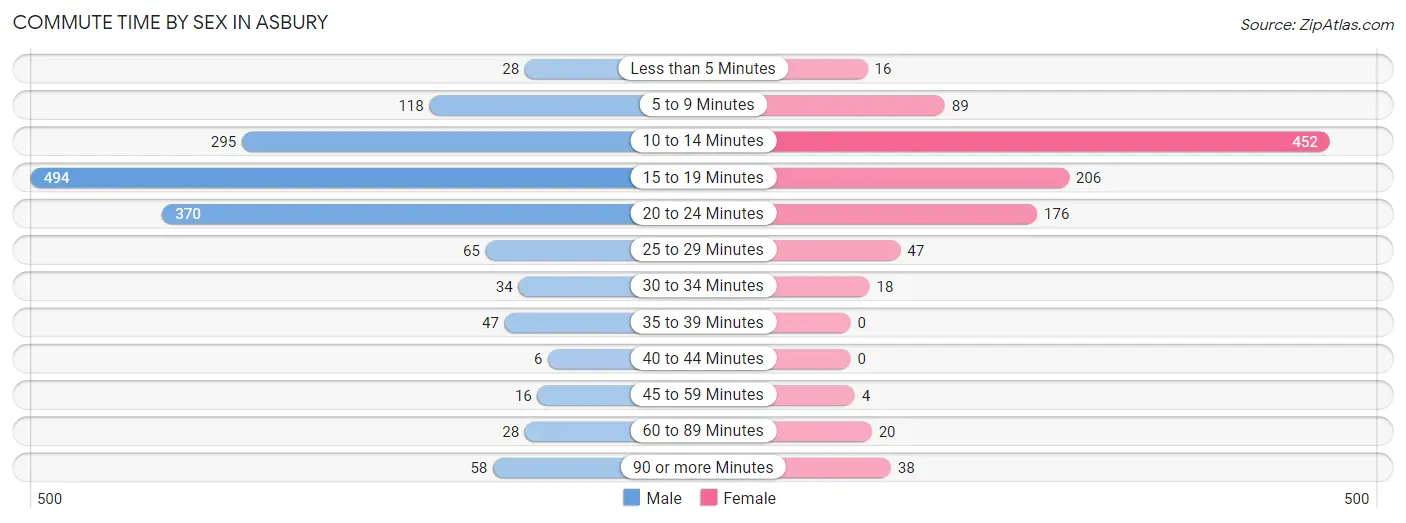
| Commute Time | Male | Female |
| Less than 5 Minutes | 28 (1.8%) | 16 (1.5%) |
| 5 to 9 Minutes | 118 (7.6%) | 89 (8.4%) |
| 10 to 14 Minutes | 295 (18.9%) | 452 (42.4%) |
| 15 to 19 Minutes | 494 (31.7%) | 206 (19.3%) |
| 20 to 24 Minutes | 370 (23.7%) | 176 (16.5%) |
| 25 to 29 Minutes | 65 (4.2%) | 47 (4.4%) |
| 30 to 34 Minutes | 34 (2.2%) | 18 (1.7%) |
| 35 to 39 Minutes | 47 (3.0%) | 0 (0.0%) |
| 40 to 44 Minutes | 6 (0.4%) | 0 (0.0%) |
| 45 to 59 Minutes | 16 (1.0%) | 4 (0.4%) |
| 60 to 89 Minutes | 28 (1.8%) | 20 (1.9%) |
| 90 or more Minutes | 58 (3.7%) | 38 (3.6%) |
Time of Departure to Work by Sex in Asbury
The most frequent times of departure to work in Asbury are 7:00 AM to 7:29 AM (383, 24.6%) for males and 7:30 AM to 7:59 AM (386, 36.2%) for females.
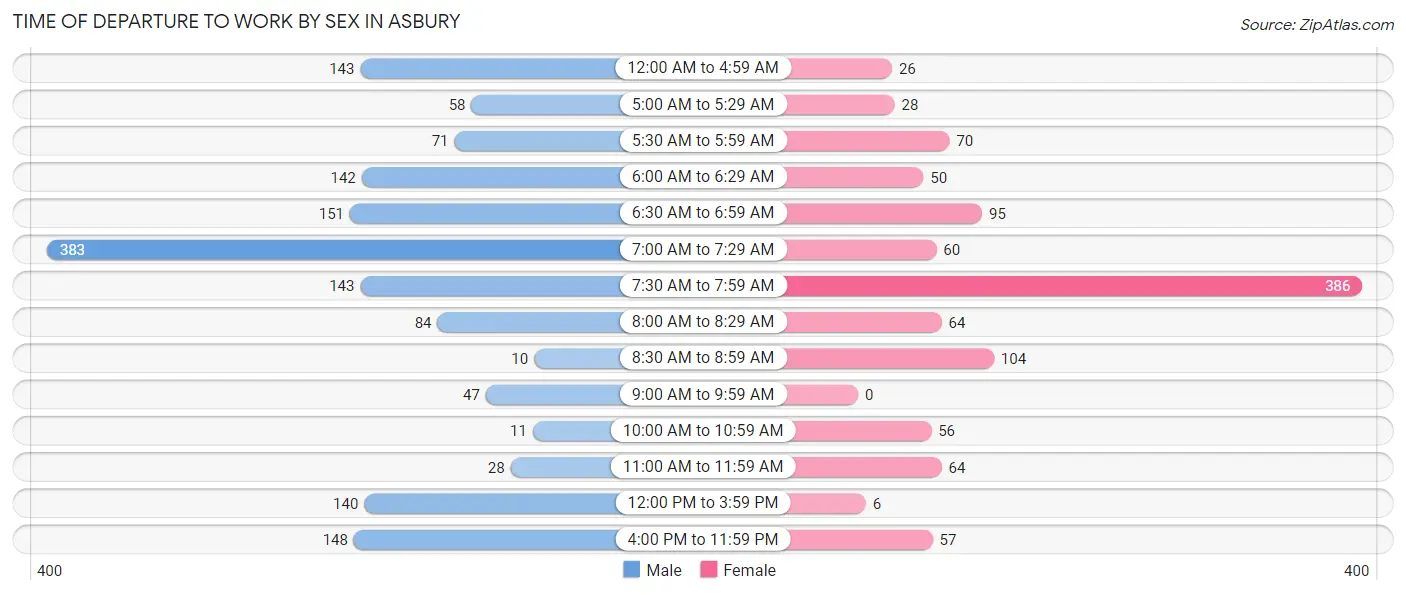
| Time of Departure | Male | Female |
| 12:00 AM to 4:59 AM | 143 (9.2%) | 26 (2.4%) |
| 5:00 AM to 5:29 AM | 58 (3.7%) | 28 (2.6%) |
| 5:30 AM to 5:59 AM | 71 (4.5%) | 70 (6.6%) |
| 6:00 AM to 6:29 AM | 142 (9.1%) | 50 (4.7%) |
| 6:30 AM to 6:59 AM | 151 (9.7%) | 95 (8.9%) |
| 7:00 AM to 7:29 AM | 383 (24.6%) | 60 (5.6%) |
| 7:30 AM to 7:59 AM | 143 (9.2%) | 386 (36.2%) |
| 8:00 AM to 8:29 AM | 84 (5.4%) | 64 (6.0%) |
| 8:30 AM to 8:59 AM | 10 (0.6%) | 104 (9.8%) |
| 9:00 AM to 9:59 AM | 47 (3.0%) | 0 (0.0%) |
| 10:00 AM to 10:59 AM | 11 (0.7%) | 56 (5.2%) |
| 11:00 AM to 11:59 AM | 28 (1.8%) | 64 (6.0%) |
| 12:00 PM to 3:59 PM | 140 (9.0%) | 6 (0.6%) |
| 4:00 PM to 11:59 PM | 148 (9.5%) | 57 (5.3%) |
| Total | 1,559 (100.0%) | 1,066 (100.0%) |
Housing Occupancy in Asbury
Occupancy by Ownership in Asbury
Of the total 2,010 dwellings in Asbury, owner-occupied units account for 1,864 (92.7%), while renter-occupied units make up 146 (7.3%).
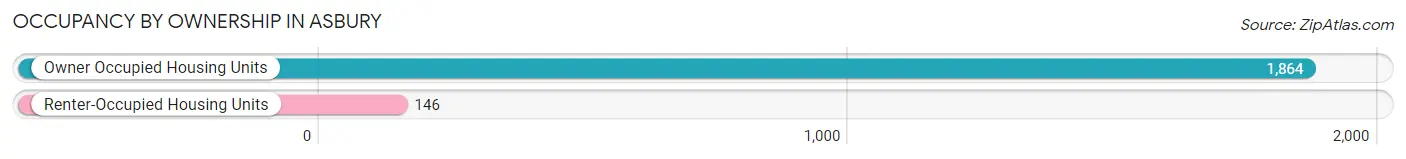
| Occupancy | # Housing Units | % Housing Units |
| Owner Occupied Housing Units | 1,864 | 92.7% |
| Renter-Occupied Housing Units | 146 | 7.3% |
| Total Occupied Housing Units | 2,010 | 100.0% |
Occupancy by Household Size in Asbury
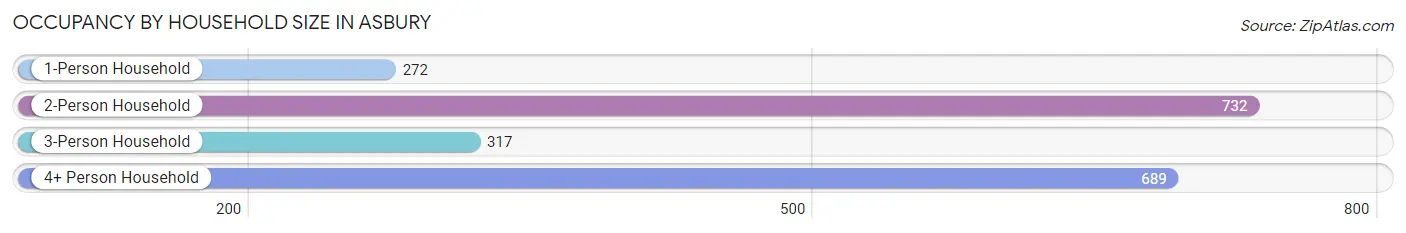
| Household Size | # Housing Units | % Housing Units |
| 1-Person Household | 272 | 13.5% |
| 2-Person Household | 732 | 36.4% |
| 3-Person Household | 317 | 15.8% |
| 4+ Person Household | 689 | 34.3% |
| Total Housing Units | 2,010 | 100.0% |
Occupancy by Ownership by Household Size in Asbury
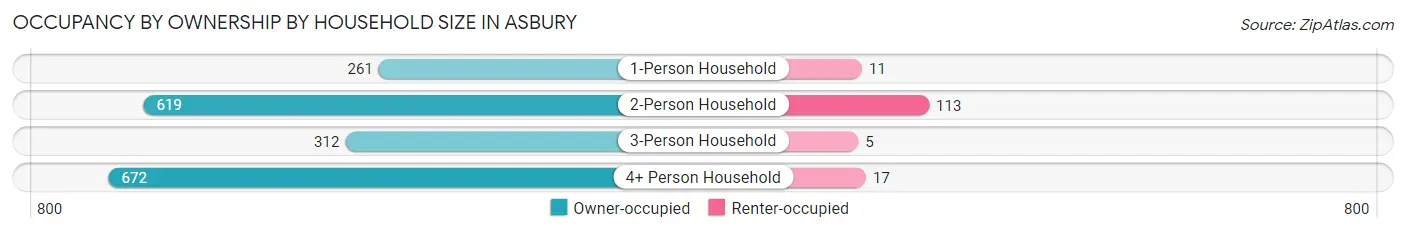
| Household Size | Owner-occupied | Renter-occupied |
| 1-Person Household | 261 (96.0%) | 11 (4.0%) |
| 2-Person Household | 619 (84.6%) | 113 (15.4%) |
| 3-Person Household | 312 (98.4%) | 5 (1.6%) |
| 4+ Person Household | 672 (97.5%) | 17 (2.5%) |
| Total Housing Units | 1,864 (92.7%) | 146 (7.3%) |
Occupancy by Educational Attainment in Asbury
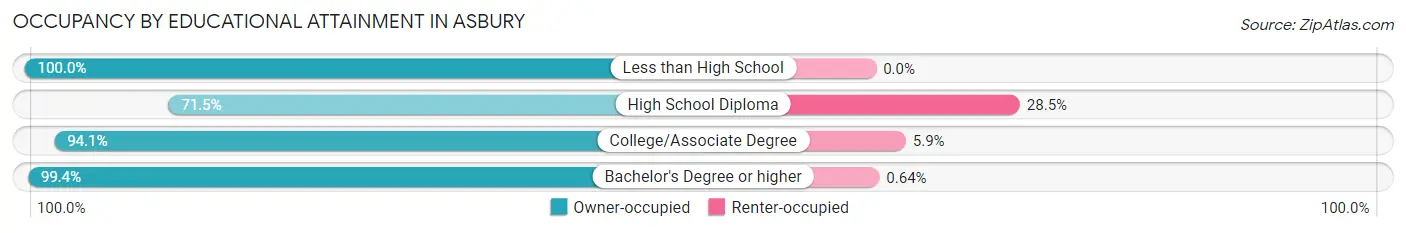
| Household Size | Owner-occupied | Renter-occupied |
| Less than High School | 33 (100.0%) | 0 (0.0%) |
| High School Diploma | 276 (71.5%) | 110 (28.5%) |
| College/Associate Degree | 464 (94.1%) | 29 (5.9%) |
| Bachelor's Degree or higher | 1,091 (99.4%) | 7 (0.6%) |
Occupancy by Age of Householder in Asbury
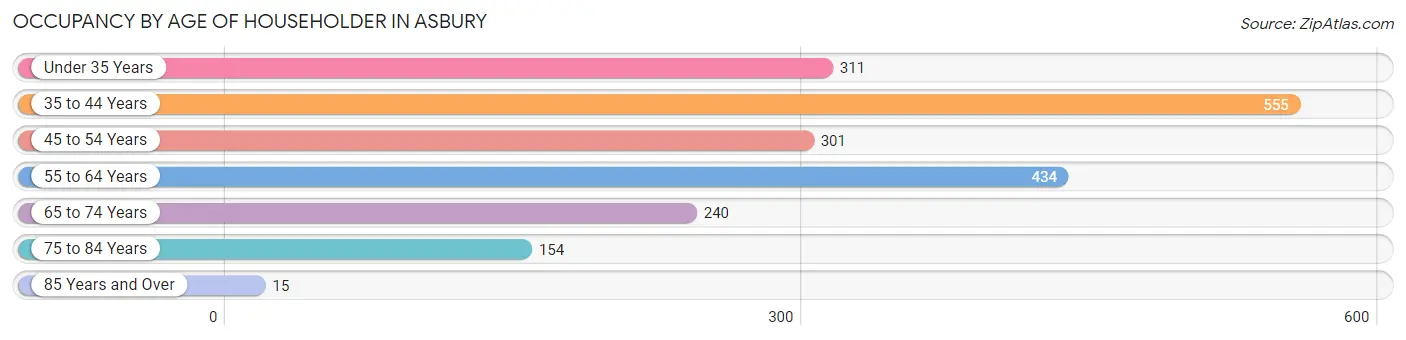
| Age Bracket | # Households | % Households |
| Under 35 Years | 311 | 15.5% |
| 35 to 44 Years | 555 | 27.6% |
| 45 to 54 Years | 301 | 15.0% |
| 55 to 64 Years | 434 | 21.6% |
| 65 to 74 Years | 240 | 11.9% |
| 75 to 84 Years | 154 | 7.7% |
| 85 Years and Over | 15 | 0.7% |
| Total | 2,010 | 100.0% |
Housing Finances in Asbury
Median Income by Occupancy in Asbury
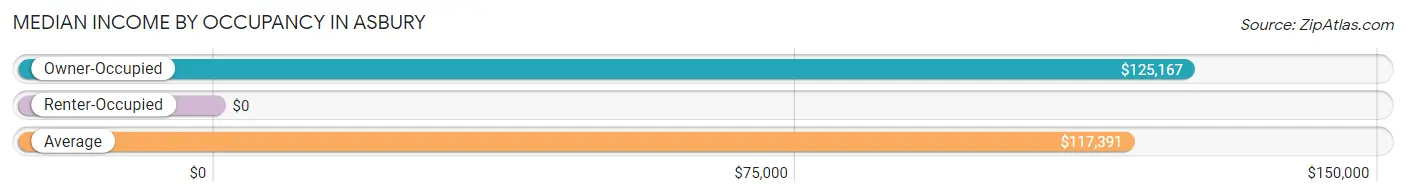
| Occupancy Type | # Households | Median Income |
| Owner-Occupied | 1,864 (92.7%) | $125,167 |
| Renter-Occupied | 146 (7.3%) | $0 |
| Average | 2,010 (100.0%) | $117,391 |
Occupancy by Householder Income Bracket in Asbury
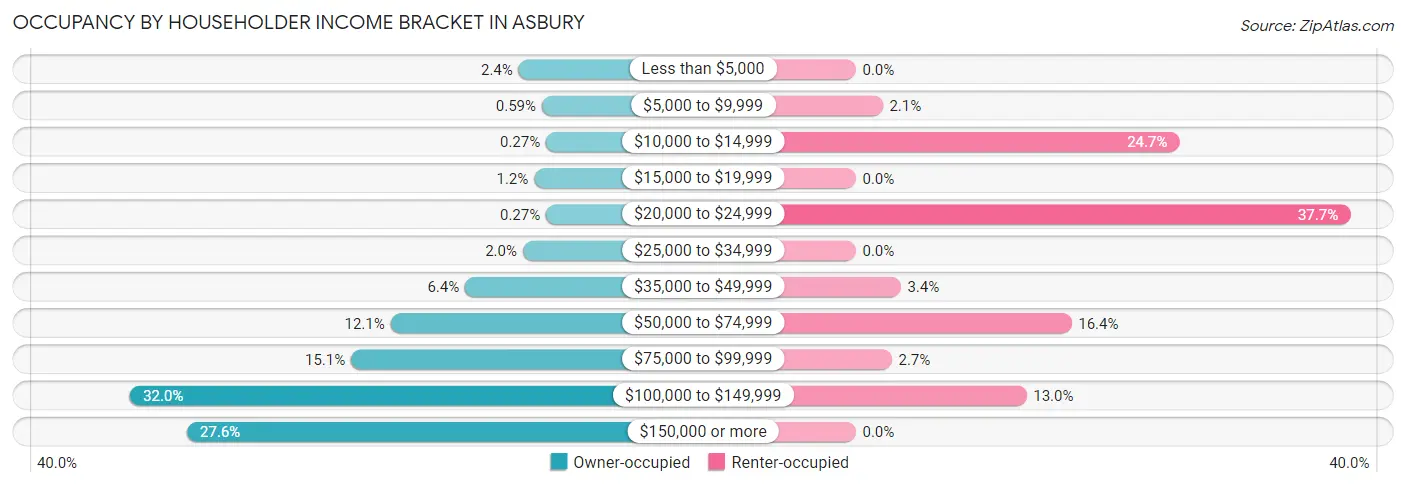
| Income Bracket | Owner-occupied | Renter-occupied |
| Less than $5,000 | 44 (2.4%) | 0 (0.0%) |
| $5,000 to $9,999 | 11 (0.6%) | 3 (2.1%) |
| $10,000 to $14,999 | 5 (0.3%) | 36 (24.7%) |
| $15,000 to $19,999 | 22 (1.2%) | 0 (0.0%) |
| $20,000 to $24,999 | 5 (0.3%) | 55 (37.7%) |
| $25,000 to $34,999 | 38 (2.0%) | 0 (0.0%) |
| $35,000 to $49,999 | 120 (6.4%) | 5 (3.4%) |
| $50,000 to $74,999 | 226 (12.1%) | 24 (16.4%) |
| $75,000 to $99,999 | 282 (15.1%) | 4 (2.7%) |
| $100,000 to $149,999 | 596 (32.0%) | 19 (13.0%) |
| $150,000 or more | 515 (27.6%) | 0 (0.0%) |
| Total | 1,864 (100.0%) | 146 (100.0%) |
Monthly Housing Cost Tiers in Asbury
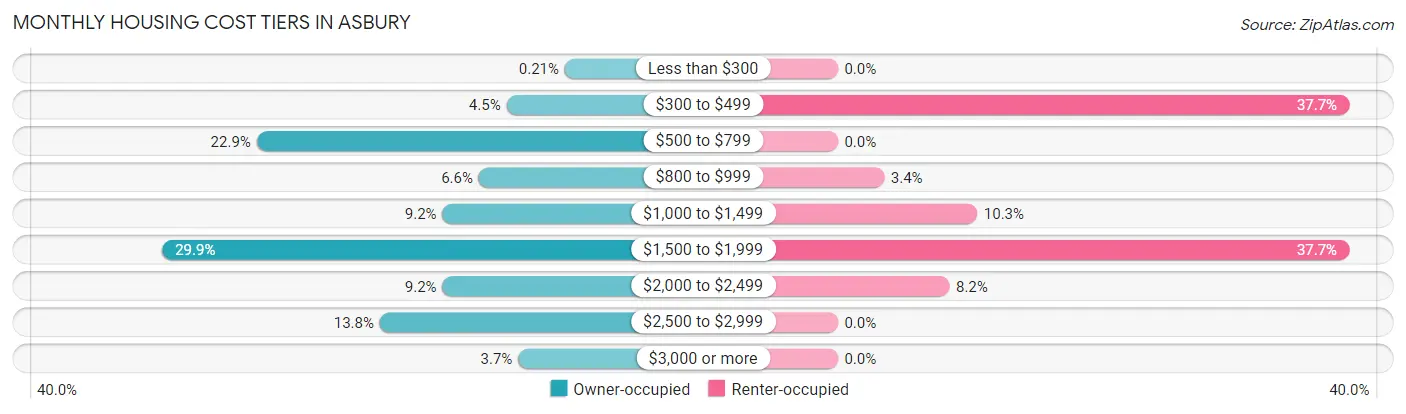
| Monthly Cost | Owner-occupied | Renter-occupied |
| Less than $300 | 4 (0.2%) | 0 (0.0%) |
| $300 to $499 | 84 (4.5%) | 55 (37.7%) |
| $500 to $799 | 427 (22.9%) | 0 (0.0%) |
| $800 to $999 | 122 (6.6%) | 5 (3.4%) |
| $1,000 to $1,499 | 172 (9.2%) | 15 (10.3%) |
| $1,500 to $1,999 | 557 (29.9%) | 55 (37.7%) |
| $2,000 to $2,499 | 172 (9.2%) | 12 (8.2%) |
| $2,500 to $2,999 | 258 (13.8%) | 0 (0.0%) |
| $3,000 or more | 68 (3.6%) | 0 (0.0%) |
| Total | 1,864 (100.0%) | 146 (100.0%) |
Physical Housing Characteristics in Asbury
Housing Structures in Asbury
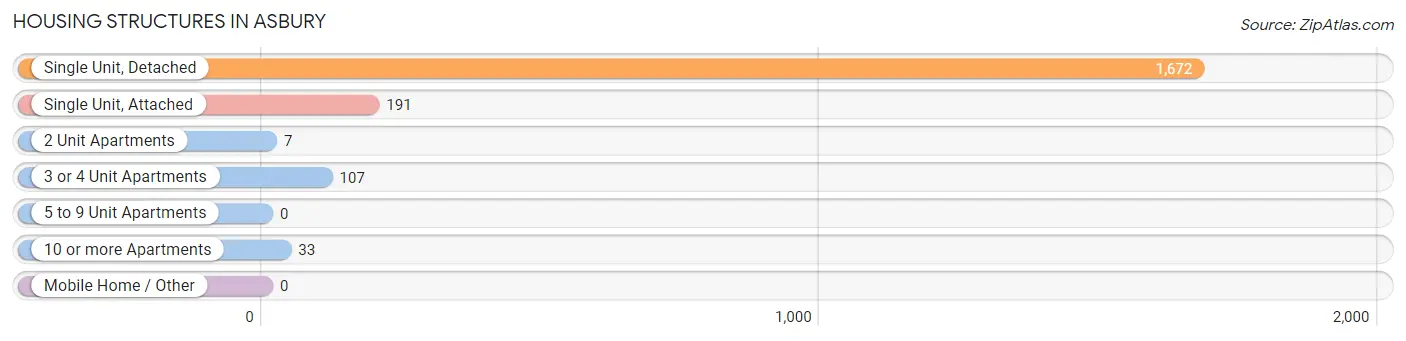
| Structure Type | # Housing Units | % Housing Units |
| Single Unit, Detached | 1,672 | 83.2% |
| Single Unit, Attached | 191 | 9.5% |
| 2 Unit Apartments | 7 | 0.4% |
| 3 or 4 Unit Apartments | 107 | 5.3% |
| 5 to 9 Unit Apartments | 0 | 0.0% |
| 10 or more Apartments | 33 | 1.6% |
| Mobile Home / Other | 0 | 0.0% |
| Total | 2,010 | 100.0% |
Housing Structures by Occupancy in Asbury
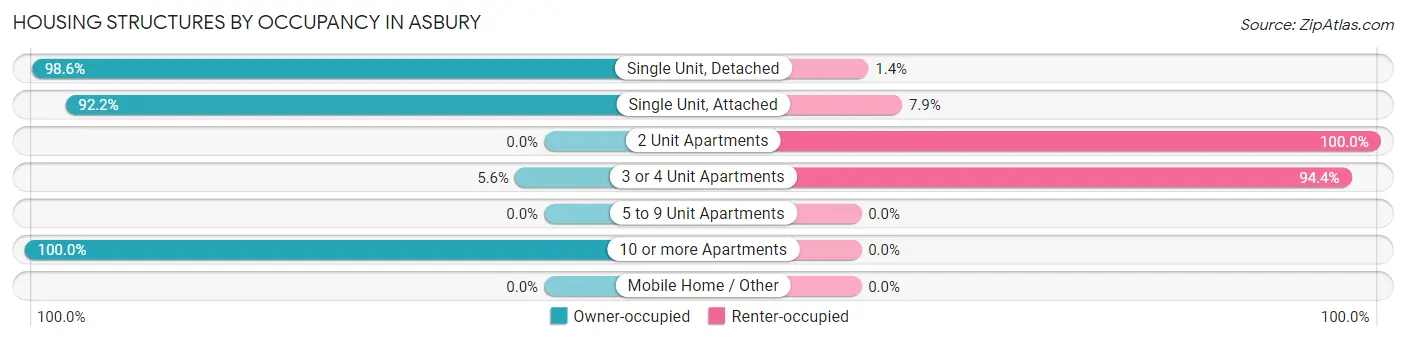
| Structure Type | Owner-occupied | Renter-occupied |
| Single Unit, Detached | 1,649 (98.6%) | 23 (1.4%) |
| Single Unit, Attached | 176 (92.1%) | 15 (7.9%) |
| 2 Unit Apartments | 0 (0.0%) | 7 (100.0%) |
| 3 or 4 Unit Apartments | 6 (5.6%) | 101 (94.4%) |
| 5 to 9 Unit Apartments | 0 (0.0%) | 0 (0.0%) |
| 10 or more Apartments | 33 (100.0%) | 0 (0.0%) |
| Mobile Home / Other | 0 (0.0%) | 0 (0.0%) |
| Total | 1,864 (92.7%) | 146 (7.3%) |
Housing Structures by Number of Rooms in Asbury
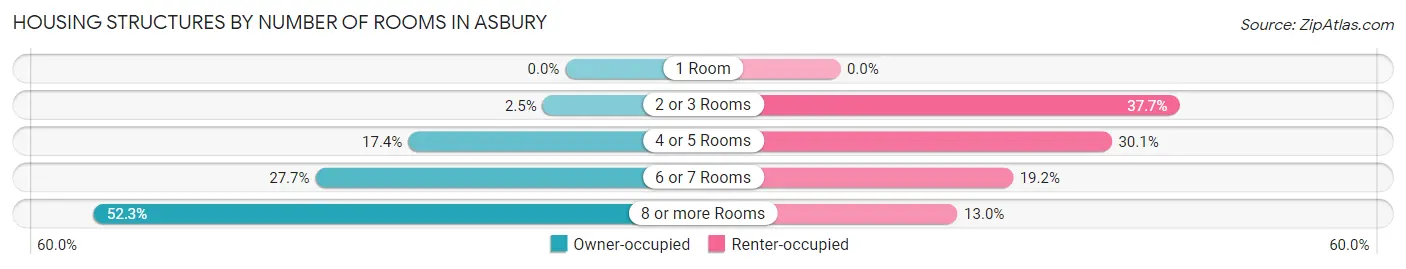
| Number of Rooms | Owner-occupied | Renter-occupied |
| 1 Room | 0 (0.0%) | 0 (0.0%) |
| 2 or 3 Rooms | 47 (2.5%) | 55 (37.7%) |
| 4 or 5 Rooms | 325 (17.4%) | 44 (30.1%) |
| 6 or 7 Rooms | 517 (27.7%) | 28 (19.2%) |
| 8 or more Rooms | 975 (52.3%) | 19 (13.0%) |
| Total | 1,864 (100.0%) | 146 (100.0%) |
Housing Structure by Heating Type in Asbury
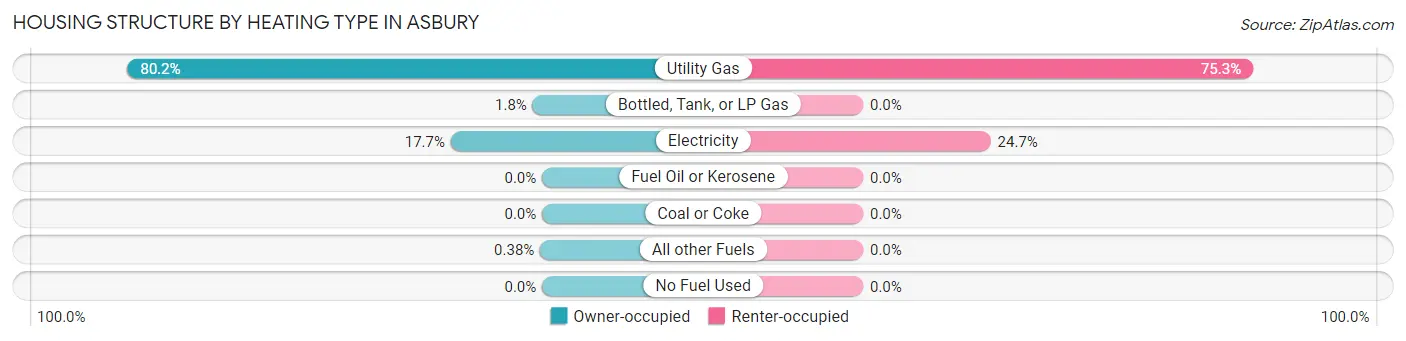
| Heating Type | Owner-occupied | Renter-occupied |
| Utility Gas | 1,494 (80.1%) | 110 (75.3%) |
| Bottled, Tank, or LP Gas | 34 (1.8%) | 0 (0.0%) |
| Electricity | 329 (17.6%) | 36 (24.7%) |
| Fuel Oil or Kerosene | 0 (0.0%) | 0 (0.0%) |
| Coal or Coke | 0 (0.0%) | 0 (0.0%) |
| All other Fuels | 7 (0.4%) | 0 (0.0%) |
| No Fuel Used | 0 (0.0%) | 0 (0.0%) |
| Total | 1,864 (100.0%) | 146 (100.0%) |
Household Vehicle Usage in Asbury
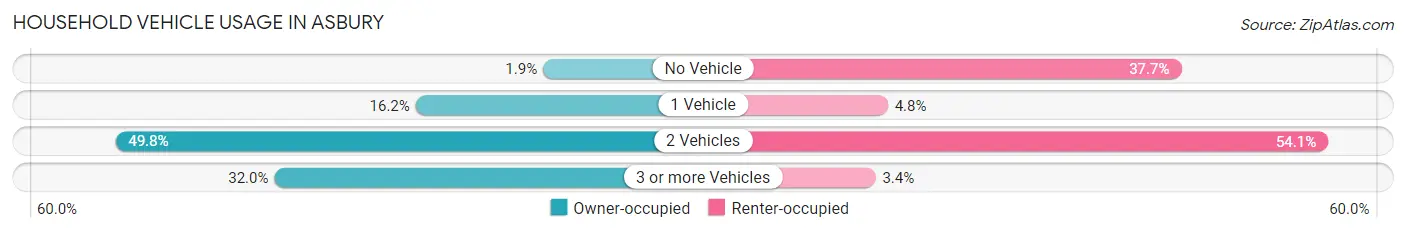
| Vehicles per Household | Owner-occupied | Renter-occupied |
| No Vehicle | 36 (1.9%) | 55 (37.7%) |
| 1 Vehicle | 302 (16.2%) | 7 (4.8%) |
| 2 Vehicles | 929 (49.8%) | 79 (54.1%) |
| 3 or more Vehicles | 597 (32.0%) | 5 (3.4%) |
| Total | 1,864 (100.0%) | 146 (100.0%) |
Real Estate & Mortgages in Asbury
Real Estate and Mortgage Overview in Asbury
| Characteristic | Without Mortgage | With Mortgage |
| Housing Units | 647 | 1,217 |
| Median Property Value | $269,100 | $295,500 |
| Median Household Income | $84,188 | $384 |
| Monthly Housing Costs | $666 | $68 |
| Real Estate Taxes | $3,685 | $0 |
Property Value by Mortgage Status in Asbury
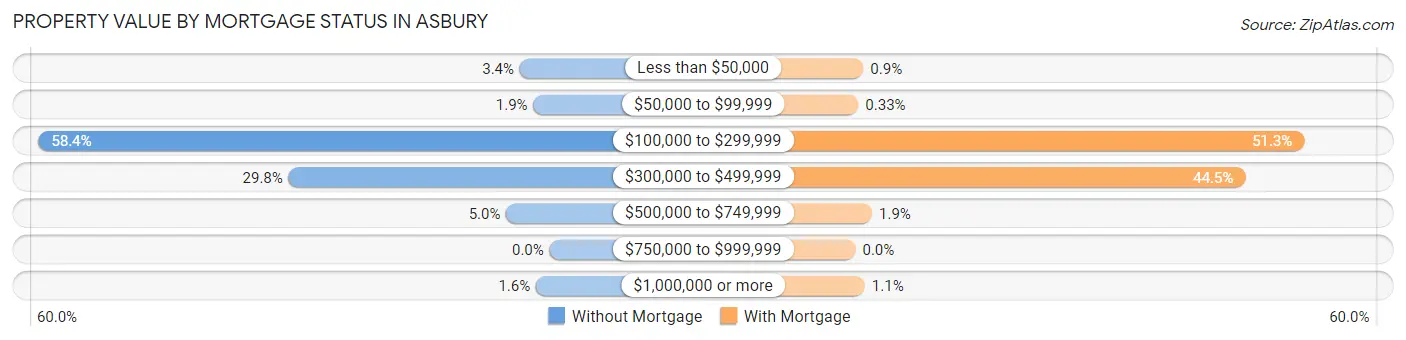
| Property Value | Without Mortgage | With Mortgage |
| Less than $50,000 | 22 (3.4%) | 11 (0.9%) |
| $50,000 to $99,999 | 12 (1.8%) | 4 (0.3%) |
| $100,000 to $299,999 | 378 (58.4%) | 624 (51.3%) |
| $300,000 to $499,999 | 193 (29.8%) | 542 (44.5%) |
| $500,000 to $749,999 | 32 (5.0%) | 23 (1.9%) |
| $750,000 to $999,999 | 0 (0.0%) | 0 (0.0%) |
| $1,000,000 or more | 10 (1.5%) | 13 (1.1%) |
| Total | 647 (100.0%) | 1,217 (100.0%) |
Household Income by Mortgage Status in Asbury
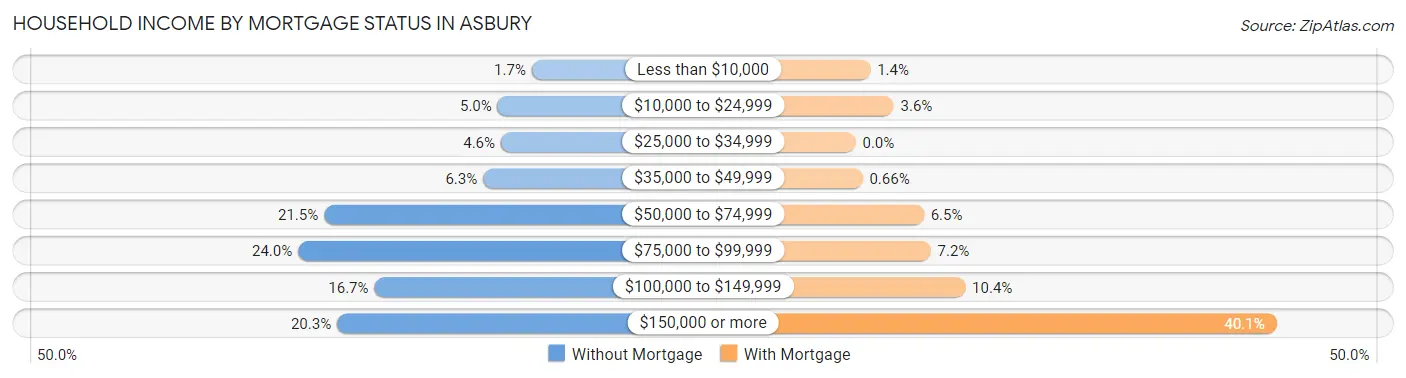
| Household Income | Without Mortgage | With Mortgage |
| Less than $10,000 | 11 (1.7%) | 17 (1.4%) |
| $10,000 to $24,999 | 32 (5.0%) | 44 (3.6%) |
| $25,000 to $34,999 | 30 (4.6%) | 0 (0.0%) |
| $35,000 to $49,999 | 41 (6.3%) | 8 (0.7%) |
| $50,000 to $74,999 | 139 (21.5%) | 79 (6.5%) |
| $75,000 to $99,999 | 155 (24.0%) | 87 (7.1%) |
| $100,000 to $149,999 | 108 (16.7%) | 127 (10.4%) |
| $150,000 or more | 131 (20.3%) | 488 (40.1%) |
| Total | 647 (100.0%) | 1,217 (100.0%) |
Property Value to Household Income Ratio in Asbury
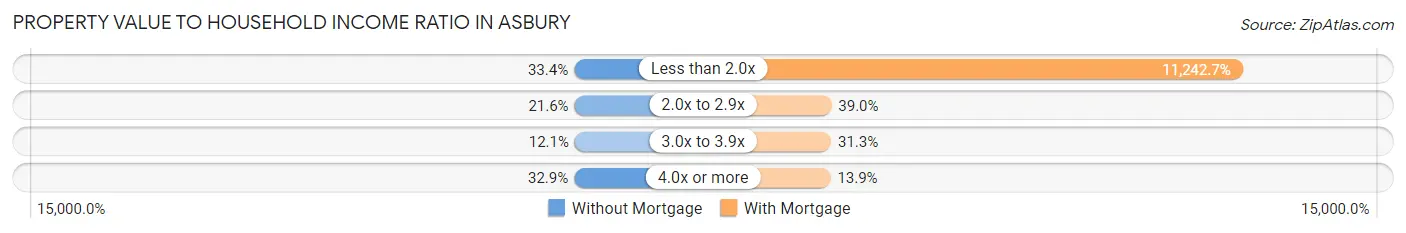
| Value-to-Income Ratio | Without Mortgage | With Mortgage |
| Less than 2.0x | 216 (33.4%) | 136,823 (11,242.7%) |
| 2.0x to 2.9x | 140 (21.6%) | 475 (39.0%) |
| 3.0x to 3.9x | 78 (12.1%) | 381 (31.3%) |
| 4.0x or more | 213 (32.9%) | 169 (13.9%) |
| Total | 647 (100.0%) | 1,217 (100.0%) |
Real Estate Taxes by Mortgage Status in Asbury

| Property Taxes | Without Mortgage | With Mortgage |
| Less than $800 | 30 (4.6%) | 0 (0.0%) |
| $800 to $1,499 | 37 (5.7%) | 0 (0.0%) |
| $800 to $1,499 | 580 (89.6%) | 31 (2.5%) |
| Total | 647 (100.0%) | 1,217 (100.0%) |
Health & Disability in Asbury
Health Insurance Coverage by Age in Asbury
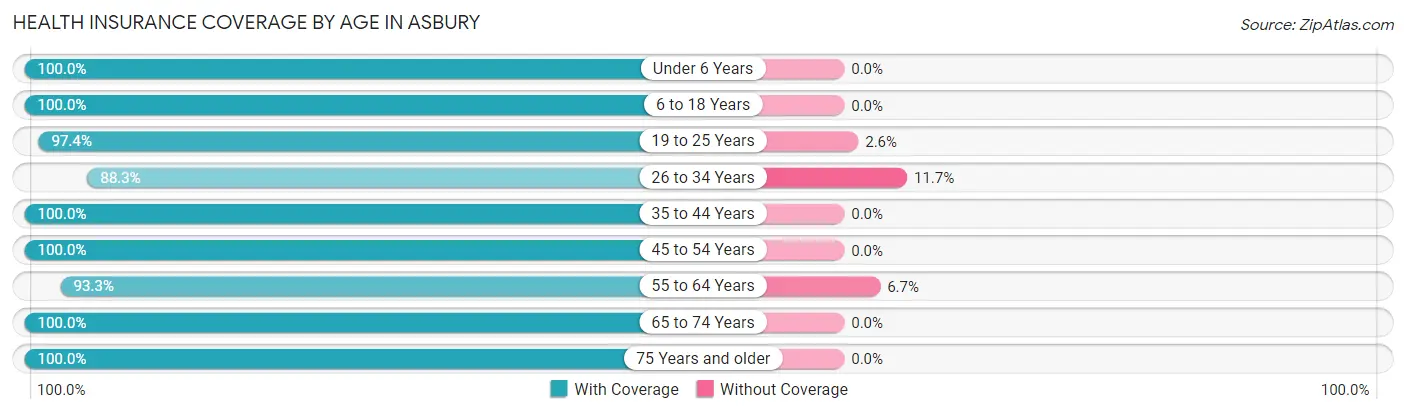
| Age Bracket | With Coverage | Without Coverage |
| Under 6 Years | 810 (100.0%) | 0 (0.0%) |
| 6 to 18 Years | 1,175 (100.0%) | 0 (0.0%) |
| 19 to 25 Years | 224 (97.4%) | 6 (2.6%) |
| 26 to 34 Years | 453 (88.3%) | 60 (11.7%) |
| 35 to 44 Years | 1,067 (100.0%) | 0 (0.0%) |
| 45 to 54 Years | 650 (100.0%) | 0 (0.0%) |
| 55 to 64 Years | 682 (93.3%) | 49 (6.7%) |
| 65 to 74 Years | 457 (100.0%) | 0 (0.0%) |
| 75 Years and older | 227 (100.0%) | 0 (0.0%) |
| Total | 5,745 (98.0%) | 115 (2.0%) |
Health Insurance Coverage by Citizenship Status in Asbury
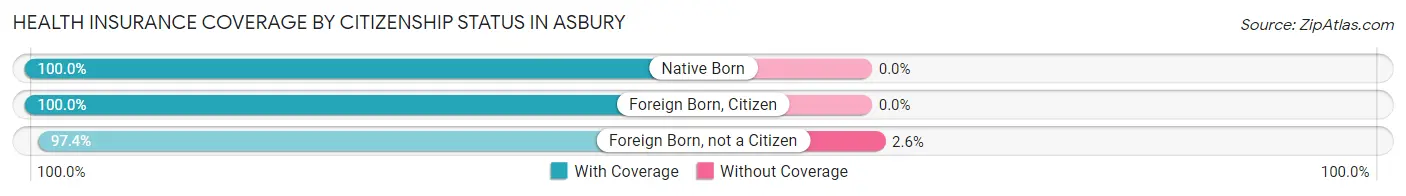
| Citizenship Status | With Coverage | Without Coverage |
| Native Born | 810 (100.0%) | 0 (0.0%) |
| Foreign Born, Citizen | 1,175 (100.0%) | 0 (0.0%) |
| Foreign Born, not a Citizen | 224 (97.4%) | 6 (2.6%) |
Health Insurance Coverage by Household Income in Asbury
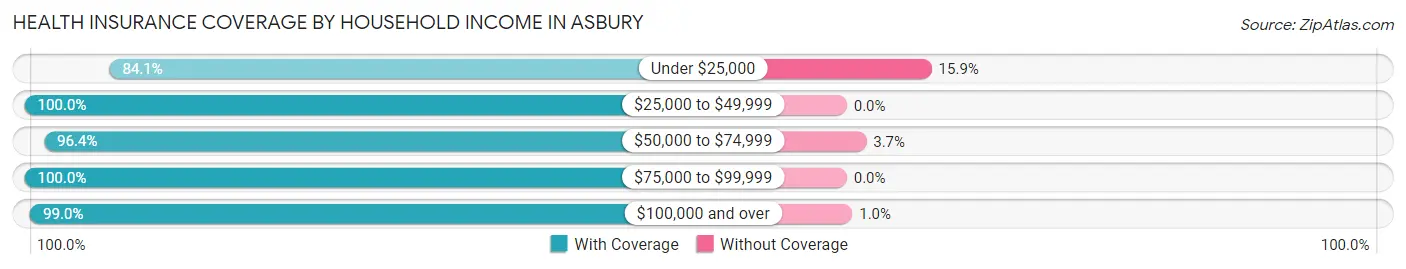
| Household Income | With Coverage | Without Coverage |
| Under $25,000 | 291 (84.1%) | 55 (15.9%) |
| $25,000 to $49,999 | 468 (100.0%) | 0 (0.0%) |
| $50,000 to $74,999 | 528 (96.4%) | 20 (3.6%) |
| $75,000 to $99,999 | 632 (100.0%) | 0 (0.0%) |
| $100,000 and over | 3,826 (99.0%) | 40 (1.0%) |
Public vs Private Health Insurance Coverage by Age in Asbury
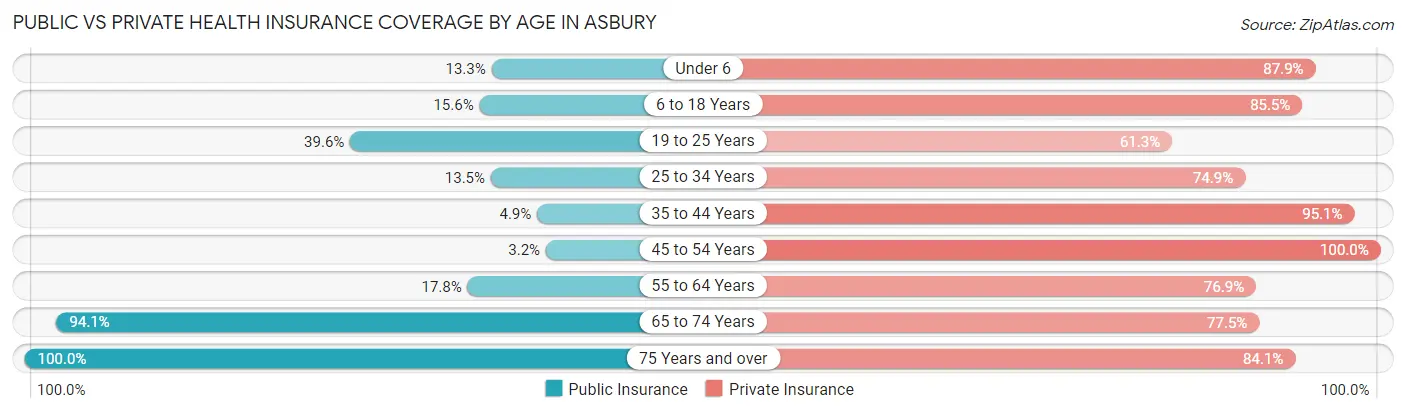
| Age Bracket | Public Insurance | Private Insurance |
| Under 6 | 108 (13.3%) | 712 (87.9%) |
| 6 to 18 Years | 183 (15.6%) | 1,004 (85.5%) |
| 19 to 25 Years | 91 (39.6%) | 141 (61.3%) |
| 25 to 34 Years | 69 (13.5%) | 384 (74.9%) |
| 35 to 44 Years | 52 (4.9%) | 1,015 (95.1%) |
| 45 to 54 Years | 21 (3.2%) | 650 (100.0%) |
| 55 to 64 Years | 130 (17.8%) | 562 (76.9%) |
| 65 to 74 Years | 430 (94.1%) | 354 (77.5%) |
| 75 Years and over | 227 (100.0%) | 191 (84.1%) |
| Total | 1,311 (22.4%) | 5,013 (85.6%) |
Disability Status by Sex by Age in Asbury
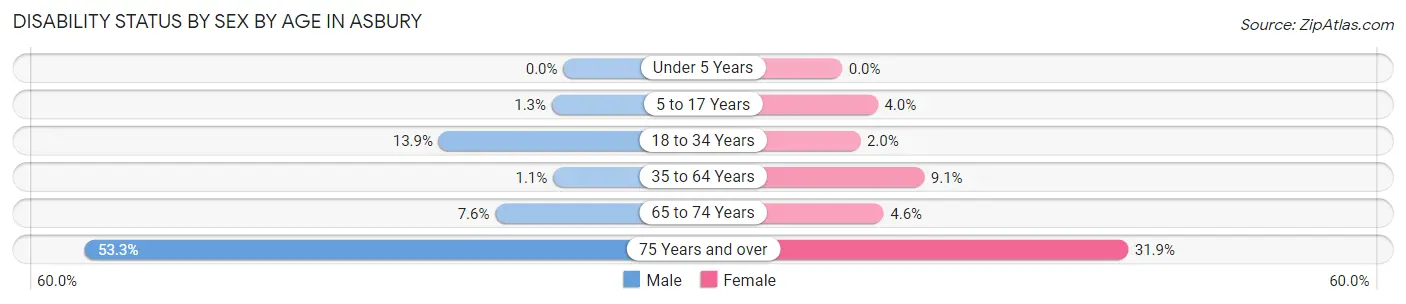
| Age Bracket | Male | Female |
| Under 5 Years | 0 (0.0%) | 0 (0.0%) |
| 5 to 17 Years | 8 (1.3%) | 29 (4.0%) |
| 18 to 34 Years | 52 (13.9%) | 8 (2.0%) |
| 35 to 64 Years | 14 (1.1%) | 112 (9.1%) |
| 65 to 74 Years | 15 (7.6%) | 12 (4.6%) |
| 75 Years and over | 49 (53.3%) | 43 (31.9%) |
Disability Class by Sex by Age in Asbury
Disability Class: Hearing Difficulty
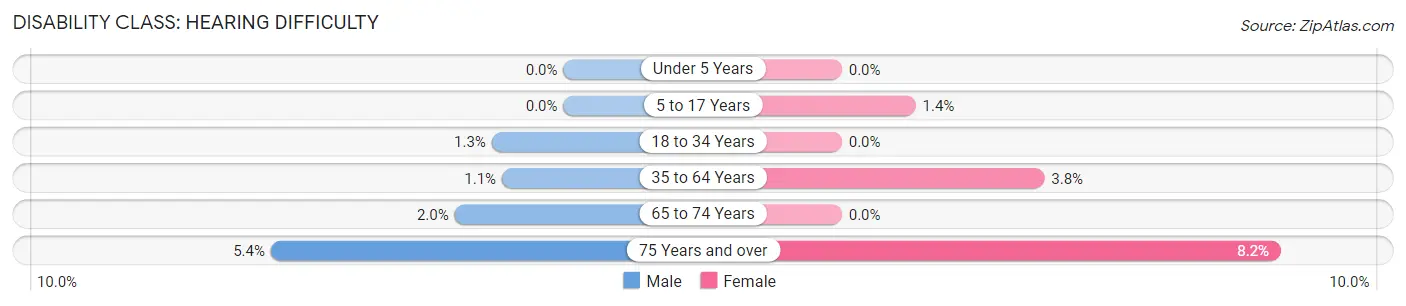
| Age Bracket | Male | Female |
| Under 5 Years | 0 (0.0%) | 0 (0.0%) |
| 5 to 17 Years | 0 (0.0%) | 10 (1.4%) |
| 18 to 34 Years | 5 (1.3%) | 0 (0.0%) |
| 35 to 64 Years | 14 (1.1%) | 46 (3.8%) |
| 65 to 74 Years | 4 (2.0%) | 0 (0.0%) |
| 75 Years and over | 5 (5.4%) | 11 (8.2%) |
Disability Class: Vision Difficulty
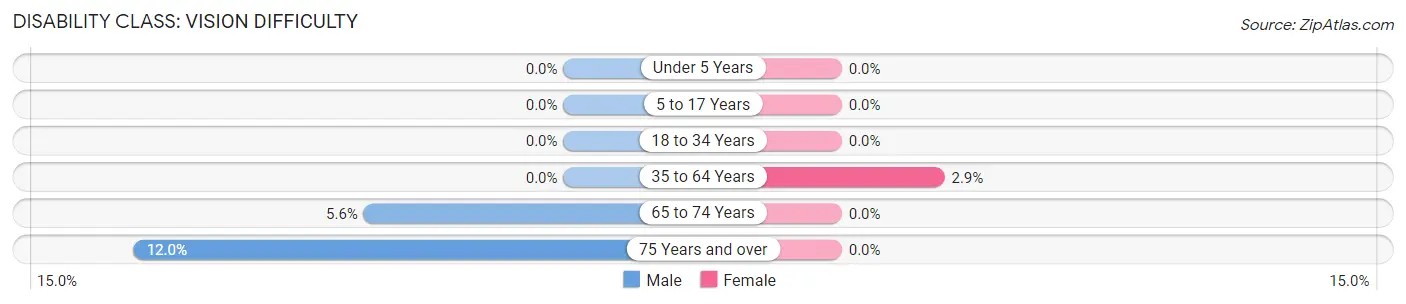
| Age Bracket | Male | Female |
| Under 5 Years | 0 (0.0%) | 0 (0.0%) |
| 5 to 17 Years | 0 (0.0%) | 0 (0.0%) |
| 18 to 34 Years | 0 (0.0%) | 0 (0.0%) |
| 35 to 64 Years | 0 (0.0%) | 35 (2.9%) |
| 65 to 74 Years | 11 (5.6%) | 0 (0.0%) |
| 75 Years and over | 11 (12.0%) | 0 (0.0%) |
Disability Class: Cognitive Difficulty
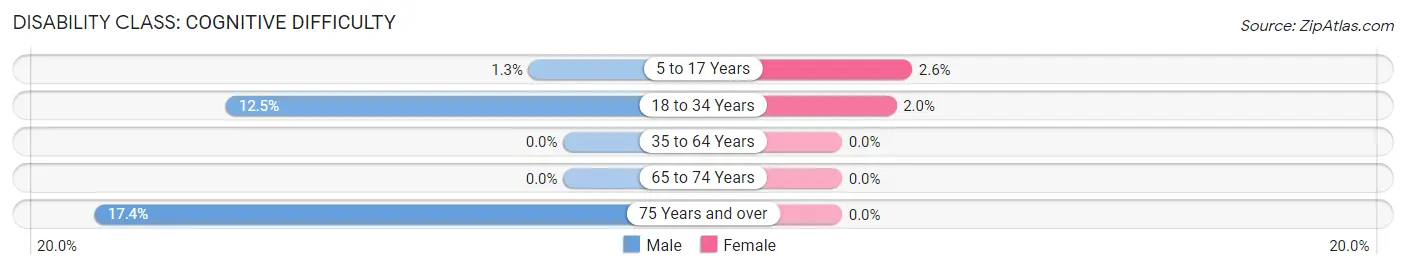
| Age Bracket | Male | Female |
| 5 to 17 Years | 8 (1.3%) | 19 (2.6%) |
| 18 to 34 Years | 47 (12.5%) | 8 (2.0%) |
| 35 to 64 Years | 0 (0.0%) | 0 (0.0%) |
| 65 to 74 Years | 0 (0.0%) | 0 (0.0%) |
| 75 Years and over | 16 (17.4%) | 0 (0.0%) |
Disability Class: Ambulatory Difficulty
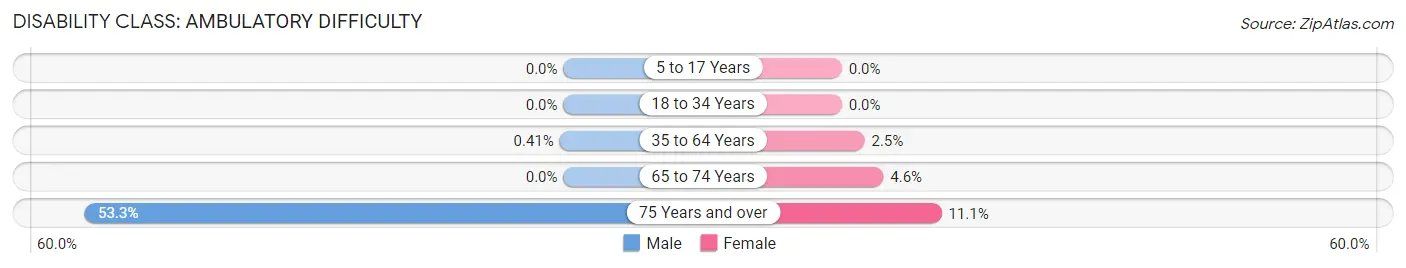
| Age Bracket | Male | Female |
| 5 to 17 Years | 0 (0.0%) | 0 (0.0%) |
| 18 to 34 Years | 0 (0.0%) | 0 (0.0%) |
| 35 to 64 Years | 5 (0.4%) | 31 (2.5%) |
| 65 to 74 Years | 0 (0.0%) | 12 (4.6%) |
| 75 Years and over | 49 (53.3%) | 15 (11.1%) |
Disability Class: Self-Care Difficulty
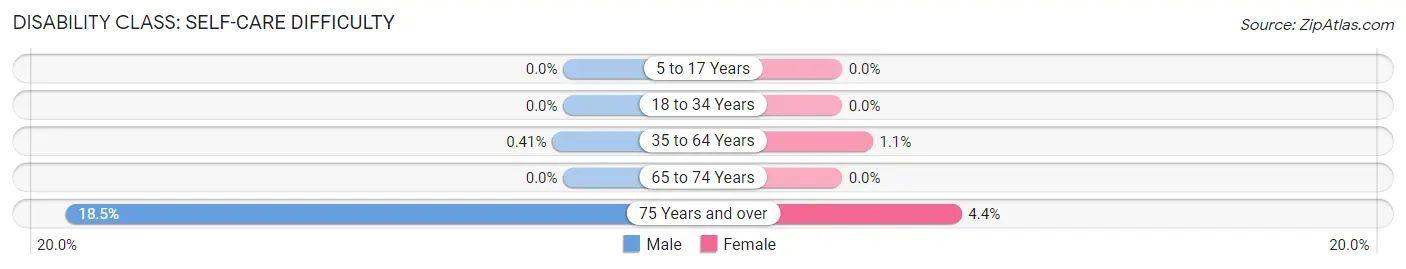
| Age Bracket | Male | Female |
| 5 to 17 Years | 0 (0.0%) | 0 (0.0%) |
| 18 to 34 Years | 0 (0.0%) | 0 (0.0%) |
| 35 to 64 Years | 5 (0.4%) | 14 (1.1%) |
| 65 to 74 Years | 0 (0.0%) | 0 (0.0%) |
| 75 Years and over | 17 (18.5%) | 6 (4.4%) |
Technology Access in Asbury
Computing Device Access in Asbury

| Device Type | # Households | % Households |
| Desktop or Laptop | 1,803 | 89.7% |
| Smartphone | 1,823 | 90.7% |
| Tablet | 1,602 | 79.7% |
| No Computing Device | 49 | 2.4% |
| Total | 2,010 | 100.0% |
Internet Access in Asbury
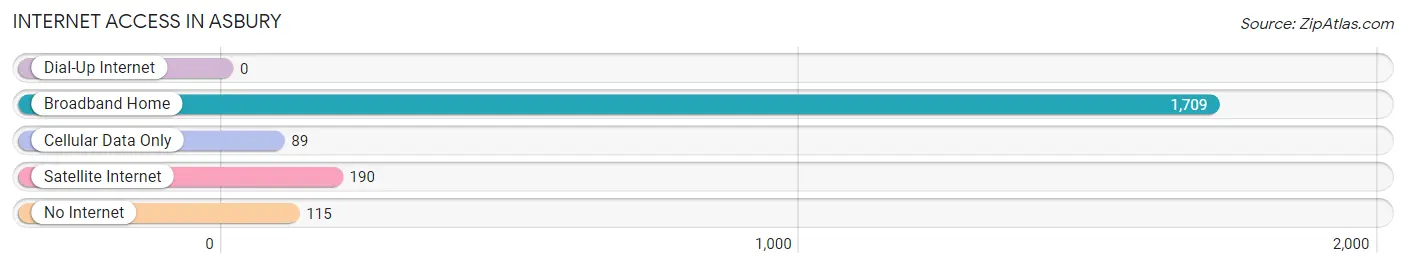
| Internet Type | # Households | % Households |
| Dial-Up Internet | 0 | 0.0% |
| Broadband Home | 1,709 | 85.0% |
| Cellular Data Only | 89 | 4.4% |
| Satellite Internet | 190 | 9.5% |
| No Internet | 115 | 5.7% |
| Total | 2,010 | 100.0% |
Asbury Summary
Asbury is a city located in Dubuque County, Iowa, United States. It is part of the Dubuque, Iowa Metropolitan Statistical Area. As of the 2010 census, the city had a population of 4,719.
History
Asbury was founded in 1855 by a group of German immigrants led by Father John Asmussen. The group purchased land from the local Native Americans and established a settlement. The settlement was named after Father Asmussen, who was a prominent figure in the area. The settlement grew quickly and by 1858, it had become a thriving community.
In 1867, the city was incorporated and the first mayor was elected. The city continued to grow and by the early 1900s, it had become a major industrial center. The city was home to several factories, including a brickyard, a flour mill, and a sawmill.
In the 1950s, the city began to experience a decline in its industrial base. Many of the factories closed and the population began to decline. However, in recent years, the city has seen a resurgence in its economy.
Geography
Asbury is located in the southwestern corner of Dubuque County, Iowa. It is situated along the Mississippi River, just north of the city of Dubuque. The city has a total area of 4.2 square miles, all of which is land.
The city is located in a hilly region of the state and is surrounded by rolling hills and valleys. The city is home to several parks, including Asbury Park, which is located along the Mississippi River.
Economy
Asbury is home to several businesses and industries. The city is home to several manufacturing companies, including a plastics manufacturer, a metal fabrication company, and a printing company. The city is also home to several retail stores, restaurants, and other businesses.
The city is also home to several educational institutions, including the University of Dubuque and the Asbury University. The city is also home to several medical facilities, including the Asbury Medical Center.
Demographics
As of the 2010 census, the city had a population of 4,719. The racial makeup of the city was 95.3% White, 0.7% African American, 0.3% Native American, 0.7% Asian, 0.1% Pacific Islander, 1.2% from other races, and 1.7% from two or more races. Hispanic or Latino of any race were 3.2% of the population.
The median income for a household in the city was $45,938 and the median income for a family was $54,938. The per capita income for the city was $21,938. About 6.2% of families and 8.2% of the population were below the poverty line, including 10.2% of those under age 18 and 6.2% of those age 65 or over.
Asbury is a diverse city with a strong economy and a vibrant culture. The city is home to several businesses, educational institutions, and medical facilities. The city is also home to several parks and recreational areas. Asbury is a great place to live, work, and play.
Common Questions
What is Per Capita Income in Asbury?
Per Capita income in Asbury is $47,989.
What is the Median Family Income in Asbury?
Median Family Income in Asbury is $134,040.
What is the Median Household income in Asbury?
Median Household Income in Asbury is $117,391.
What is Income or Wage Gap in Asbury?
Income or Wage Gap in Asbury is 41.1%.
Women in Asbury earn 58.9 cents for every dollar earned by a man.
What is Inequality or Gini Index in Asbury?
Inequality or Gini Index in Asbury is 0.41.
What is the Total Population of Asbury?
Total Population of Asbury is 5,890.
What is the Total Male Population of Asbury?
Total Male Population of Asbury is 2,757.
What is the Total Female Population of Asbury?
Total Female Population of Asbury is 3,133.
What is the Ratio of Males per 100 Females in Asbury?
There are 88.00 Males per 100 Females in Asbury.
What is the Ratio of Females per 100 Males in Asbury?
There are 113.64 Females per 100 Males in Asbury.
What is the Median Population Age in Asbury?
Median Population Age in Asbury is 36.5 Years.
What is the Average Family Size in Asbury
Average Family Size in Asbury is 3.3 People.
What is the Average Household Size in Asbury
Average Household Size in Asbury is 2.9 People.
How Large is the Labor Force in Asbury?
There are 3,019 People in the Labor Forcein in Asbury.
What is the Percentage of People in the Labor Force in Asbury?
72.4% of People are in the Labor Force in Asbury.
What is the Unemployment Rate in Asbury?
Unemployment Rate in Asbury is 4.1%.