Zip Codes with the Highest Percentage of Population Employed in Computer, Engineering & Science in Iowa
RELATED REPORTS & OPTIONS
Computer, Engineering & Science
Iowa
Compare Zip Codes
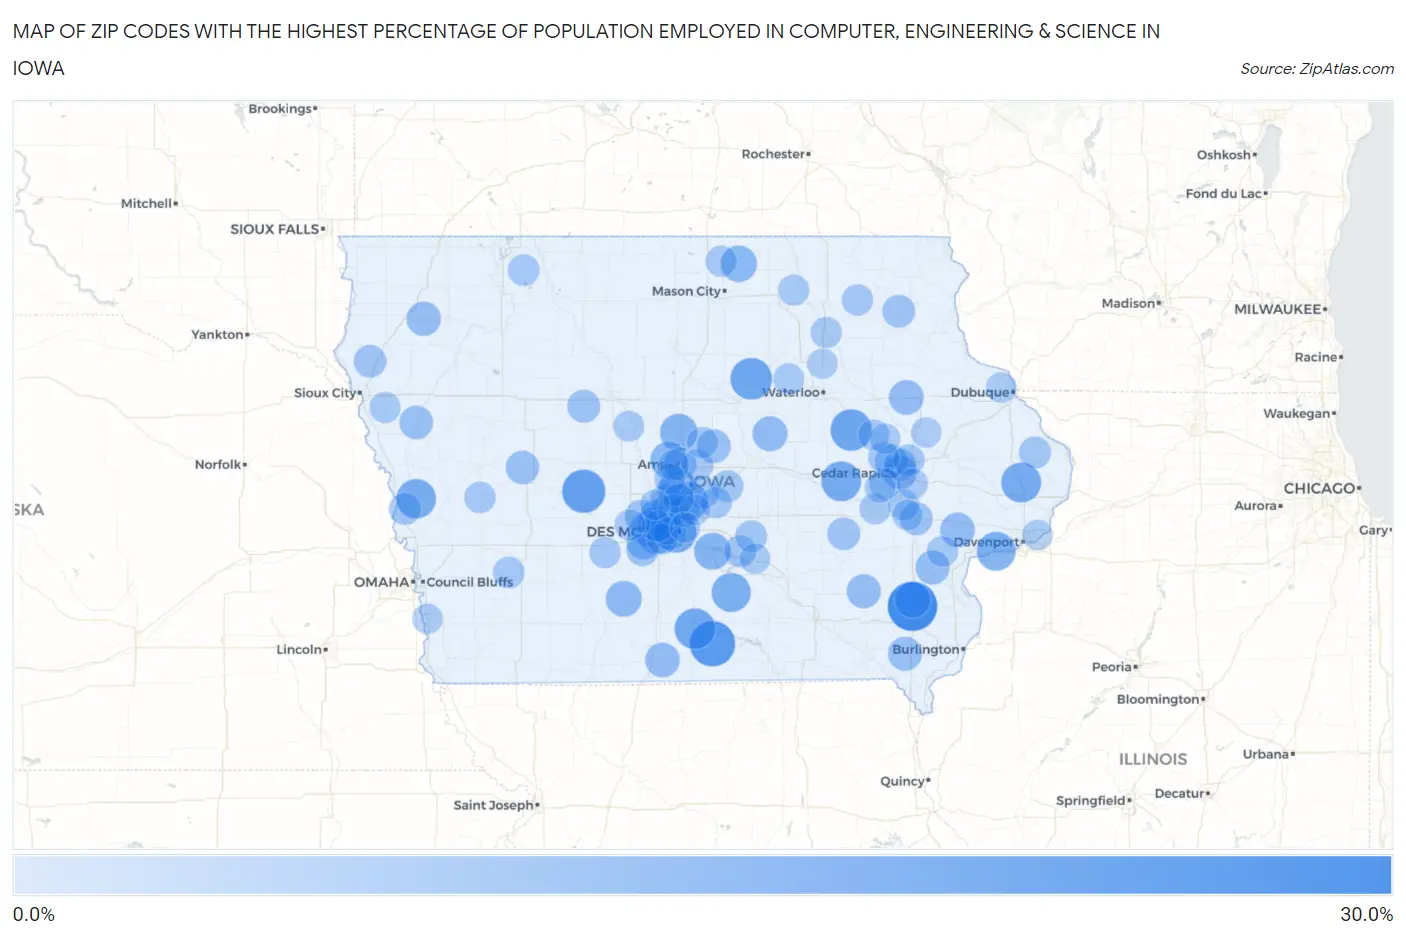
Map of Zip Codes with the Highest Percentage of Population Employed in Computer, Engineering & Science in Iowa
0.0%
30.0%
Zip Codes with the Highest Percentage of Population Employed in Computer, Engineering & Science in Iowa
| Zip Code | % Employed | vs State | vs National | |
| 1. | 52652 | 26.9% | 5.4%(+21.5)#1 | 6.8%(+20.2)#232 |
| 2. | 50165 | 22.7% | 5.4%(+17.3)#2 | 6.8%(+16.0)#360 |
| 3. | 50026 | 20.6% | 5.4%(+15.2)#3 | 6.8%(+13.9)#461 |
| 4. | 50608 | 19.0% | 5.4%(+13.6)#4 | 6.8%(+12.3)#587 |
| 5. | 52313 | 18.8% | 5.4%(+13.4)#5 | 6.8%(+12.1)#608 |
| 6. | 50068 | 18.1% | 5.4%(+12.7)#6 | 6.8%(+11.4)#668 |
| 7. | 50309 | 17.8% | 5.4%(+12.4)#7 | 6.8%(+11.0)#703 |
| 8. | 52774 | 17.3% | 5.4%(+11.9)#8 | 6.8%(+10.6)#771 |
| 9. | 52257 | 17.3% | 5.4%(+11.8)#9 | 6.8%(+10.5)#785 |
| 10. | 51564 | 16.9% | 5.4%(+11.5)#10 | 6.8%(+10.2)#824 |
| 11. | 50057 | 16.5% | 5.4%(+11.0)#11 | 6.8%(+9.70)#890 |
| 12. | 52759 | 16.2% | 5.4%(+10.8)#12 | 6.8%(+9.45)#923 |
| 13. | 50073 | 15.9% | 5.4%(+10.4)#13 | 6.8%(+9.10)#979 |
| 14. | 50231 | 14.9% | 5.4%(+9.43)#14 | 6.8%(+8.10)#1,141 |
| 15. | 50252 | 14.3% | 5.4%(+8.85)#15 | 6.8%(+7.52)#1,264 |
| 16. | 50014 | 14.2% | 5.4%(+8.72)#16 | 6.8%(+7.39)#1,298 |
| 17. | 50124 | 13.8% | 5.4%(+8.38)#17 | 6.8%(+7.05)#1,392 |
| 18. | 50440 | 13.8% | 5.4%(+8.31)#18 | 6.8%(+6.99)#1,418 |
| 19. | 50266 | 13.3% | 5.4%(+7.90)#19 | 6.8%(+6.57)#1,530 |
| 20. | 50149 | 13.3% | 5.4%(+7.83)#20 | 6.8%(+6.50)#1,553 |
| 21. | 52647 | 13.2% | 5.4%(+7.75)#21 | 6.8%(+6.42)#1,575 |
| 22. | 50131 | 12.6% | 5.4%(+7.19)#22 | 6.8%(+5.86)#1,781 |
| 23. | 50609 | 12.5% | 5.4%(+7.11)#23 | 6.8%(+5.78)#1,802 |
| 24. | 50263 | 12.3% | 5.4%(+6.82)#24 | 6.8%(+5.49)#1,918 |
| 25. | 50654 | 12.2% | 5.4%(+6.79)#25 | 6.8%(+5.46)#1,934 |
| 26. | 52720 | 12.1% | 5.4%(+6.69)#26 | 6.8%(+5.36)#1,974 |
| 27. | 50144 | 12.1% | 5.4%(+6.67)#27 | 6.8%(+5.34)#1,986 |
| 28. | 51022 | 11.8% | 5.4%(+6.40)#28 | 6.8%(+5.07)#2,118 |
| 29. | 50038 | 11.7% | 5.4%(+6.27)#29 | 6.8%(+4.95)#2,171 |
| 30. | 52739 | 11.6% | 5.4%(+6.17)#30 | 6.8%(+4.84)#2,234 |
| 31. | 52585 | 11.6% | 5.4%(+6.16)#31 | 6.8%(+4.83)#2,241 |
| 32. | 52631 | 11.5% | 5.4%(+6.10)#32 | 6.8%(+4.77)#2,281 |
| 33. | 50278 | 11.4% | 5.4%(+6.00)#33 | 6.8%(+4.67)#2,334 |
| 34. | 52401 | 11.3% | 5.4%(+5.87)#34 | 6.8%(+4.54)#2,405 |
| 35. | 51044 | 11.1% | 5.4%(+5.67)#35 | 6.8%(+4.35)#2,510 |
| 36. | 51444 | 10.9% | 5.4%(+5.51)#36 | 6.8%(+4.18)#2,608 |
| 37. | 52411 | 10.7% | 5.4%(+5.22)#37 | 6.8%(+3.89)#2,755 |
| 38. | 50111 | 10.6% | 5.4%(+5.20)#38 | 6.8%(+3.87)#2,777 |
| 39. | 50323 | 10.6% | 5.4%(+5.18)#39 | 6.8%(+3.85)#2,789 |
| 40. | 50312 | 10.6% | 5.4%(+5.18)#40 | 6.8%(+3.85)#2,791 |
| 41. | 50063 | 10.6% | 5.4%(+5.15)#41 | 6.8%(+3.82)#2,807 |
| 42. | 50586 | 10.6% | 5.4%(+5.14)#42 | 6.8%(+3.81)#2,813 |
| 43. | 52245 | 10.5% | 5.4%(+5.09)#43 | 6.8%(+3.76)#2,856 |
| 44. | 52135 | 10.4% | 5.4%(+4.95)#44 | 6.8%(+3.62)#2,943 |
| 45. | 52308 | 10.3% | 5.4%(+4.86)#45 | 6.8%(+3.53)#3,001 |
| 46. | 50010 | 10.3% | 5.4%(+4.82)#46 | 6.8%(+3.49)#3,033 |
| 47. | 51038 | 10.1% | 5.4%(+4.67)#47 | 6.8%(+3.34)#3,149 |
| 48. | 50161 | 10.0% | 5.4%(+4.54)#48 | 6.8%(+3.22)#3,235 |
| 49. | 50261 | 9.9% | 5.4%(+4.48)#49 | 6.8%(+3.15)#3,286 |
| 50. | 50226 | 9.9% | 5.4%(+4.45)#50 | 6.8%(+3.12)#3,307 |
| 51. | 52402 | 9.8% | 5.4%(+4.38)#51 | 6.8%(+3.06)#3,356 |
| 52. | 51557 | 9.7% | 5.4%(+4.25)#52 | 6.8%(+2.92)#3,455 |
| 53. | 50214 | 9.6% | 5.4%(+4.17)#53 | 6.8%(+2.84)#3,517 |
| 54. | 50234 | 9.5% | 5.4%(+4.11)#54 | 6.8%(+2.78)#3,563 |
| 55. | 50324 | 9.5% | 5.4%(+4.09)#55 | 6.8%(+2.77)#3,569 |
| 56. | 52074 | 9.5% | 5.4%(+4.06)#56 | 6.8%(+2.73)#3,605 |
| 57. | 50232 | 9.4% | 5.4%(+3.94)#57 | 6.8%(+2.61)#3,705 |
| 58. | 50023 | 9.3% | 5.4%(+3.82)#58 | 6.8%(+2.49)#3,821 |
| 59. | 51544 | 9.2% | 5.4%(+3.76)#59 | 6.8%(+2.43)#3,867 |
| 60. | 51364 | 9.2% | 5.4%(+3.74)#60 | 6.8%(+2.41)#3,887 |
| 61. | 50021 | 9.1% | 5.4%(+3.69)#61 | 6.8%(+2.36)#3,939 |
| 62. | 50201 | 9.1% | 5.4%(+3.66)#62 | 6.8%(+2.34)#3,959 |
| 63. | 50070 | 9.1% | 5.4%(+3.64)#63 | 6.8%(+2.31)#3,992 |
| 64. | 52302 | 9.1% | 5.4%(+3.63)#64 | 6.8%(+2.30)#4,004 |
| 65. | 52171 | 9.0% | 5.4%(+3.58)#65 | 6.8%(+2.25)#4,049 |
| 66. | 50265 | 9.0% | 5.4%(+3.58)#66 | 6.8%(+2.25)#4,054 |
| 67. | 50325 | 9.0% | 5.4%(+3.58)#67 | 6.8%(+2.25)#4,057 |
| 68. | 50244 | 9.0% | 5.4%(+3.55)#68 | 6.8%(+2.23)#4,076 |
| 69. | 51527 | 9.0% | 5.4%(+3.53)#69 | 6.8%(+2.20)#4,099 |
| 70. | 52324 | 8.9% | 5.4%(+3.51)#70 | 6.8%(+2.18)#4,123 |
| 71. | 50168 | 8.9% | 5.4%(+3.47)#71 | 6.8%(+2.14)#4,172 |
| 72. | 50448 | 8.8% | 5.4%(+3.36)#72 | 6.8%(+2.03)#4,267 |
| 73. | 50631 | 8.8% | 5.4%(+3.32)#73 | 6.8%(+1.99)#4,303 |
| 74. | 50154 | 8.7% | 5.4%(+3.31)#74 | 6.8%(+1.98)#4,314 |
| 75. | 52766 | 8.7% | 5.4%(+3.30)#75 | 6.8%(+1.98)#4,316 |
| 76. | 52228 | 8.7% | 5.4%(+3.28)#76 | 6.8%(+1.95)#4,351 |
| 77. | 52317 | 8.7% | 5.4%(+3.26)#77 | 6.8%(+1.94)#4,370 |
| 78. | 52236 | 8.6% | 5.4%(+3.21)#78 | 6.8%(+1.88)#4,435 |
| 79. | 51007 | 8.6% | 5.4%(+3.13)#79 | 6.8%(+1.81)#4,526 |
| 80. | 50620 | 8.6% | 5.4%(+3.13)#80 | 6.8%(+1.81)#4,527 |
| 81. | 52345 | 8.5% | 5.4%(+3.11)#81 | 6.8%(+1.78)#4,561 |
| 82. | 50012 | 8.5% | 5.4%(+3.08)#82 | 6.8%(+1.76)#4,589 |
| 83. | 50003 | 8.5% | 5.4%(+3.05)#83 | 6.8%(+1.72)#4,618 |
| 84. | 50660 | 8.5% | 5.4%(+3.04)#84 | 6.8%(+1.72)#4,625 |
| 85. | 50134 | 8.4% | 5.4%(+3.00)#85 | 6.8%(+1.67)#4,679 |
| 86. | 50530 | 8.4% | 5.4%(+2.96)#86 | 6.8%(+1.63)#4,714 |
| 87. | 52227 | 8.3% | 5.4%(+2.86)#87 | 6.8%(+1.53)#4,877 |
| 88. | 52213 | 8.3% | 5.4%(+2.84)#88 | 6.8%(+1.51)#4,905 |
| 89. | 50035 | 8.2% | 5.4%(+2.80)#89 | 6.8%(+1.48)#4,945 |
| 90. | 52351 | 8.2% | 5.4%(+2.78)#90 | 6.8%(+1.46)#4,967 |
| 91. | 50007 | 8.2% | 5.4%(+2.72)#91 | 6.8%(+1.39)#5,059 |
| 92. | 52002 | 8.1% | 5.4%(+2.67)#92 | 6.8%(+1.34)#5,116 |
| 93. | 52241 | 8.1% | 5.4%(+2.67)#93 | 6.8%(+1.34)#5,124 |
| 94. | 50219 | 8.1% | 5.4%(+2.65)#94 | 6.8%(+1.32)#5,155 |
| 95. | 52219 | 8.0% | 5.4%(+2.61)#95 | 6.8%(+1.28)#5,209 |
| 96. | 50317 | 8.0% | 5.4%(+2.61)#96 | 6.8%(+1.28)#5,214 |
| 97. | 51561 | 8.0% | 5.4%(+2.59)#97 | 6.8%(+1.26)#5,231 |
| 98. | 52722 | 8.0% | 5.4%(+2.58)#98 | 6.8%(+1.25)#5,252 |
| 99. | 50109 | 8.0% | 5.4%(+2.54)#99 | 6.8%(+1.22)#5,291 |
| 100. | 50622 | 7.9% | 5.4%(+2.51)#100 | 6.8%(+1.18)#5,344 |
Common Questions
What are the Top 10 Zip Codes with the Highest Percentage of Population Employed in Computer, Engineering & Science in Iowa?
Top 10 Zip Codes with the Highest Percentage of Population Employed in Computer, Engineering & Science in Iowa are:
What zip code has the Highest Percentage of Population Employed in Computer, Engineering & Science in Iowa?
52652 has the Highest Percentage of Population Employed in Computer, Engineering & Science in Iowa with 26.9%.
What is the Percentage of Population Employed in Computer, Engineering & Science in the State of Iowa?
Percentage of Population Employed in Computer, Engineering & Science in Iowa is 5.4%.
What is the Percentage of Population Employed in Computer, Engineering & Science in the United States?
Percentage of Population Employed in Computer, Engineering & Science in the United States is 6.8%.