Macon Bibb County, GA Map & Demographics
Macon Bibb County Map
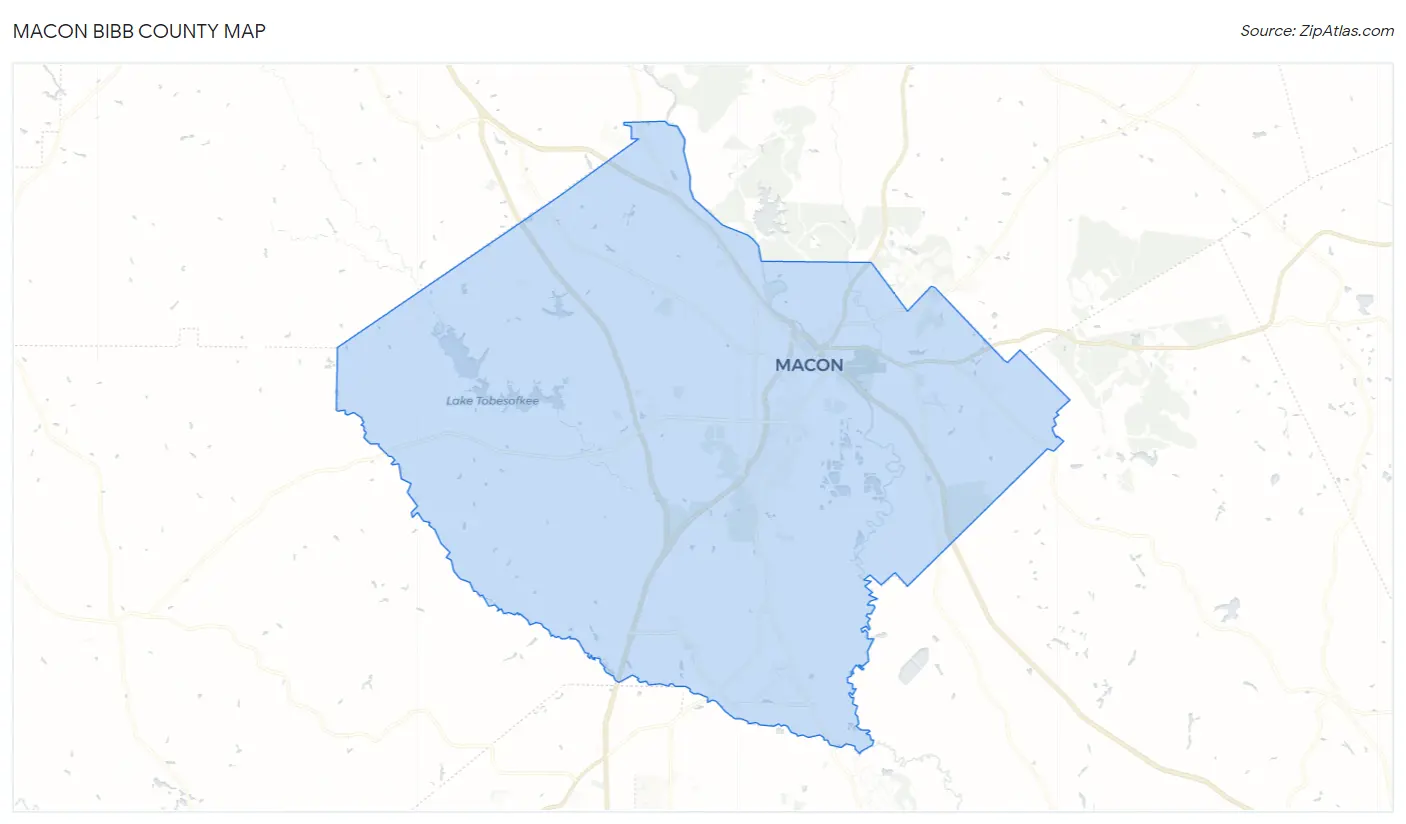
Macon Bibb County Overview
$30,115
PER CAPITA INCOME
$64,826
AVG FAMILY INCOME
$48,897
AVG HOUSEHOLD INCOME
20.6%
WAGE / INCOME GAP [ % ]
79.4¢/ $1
WAGE / INCOME GAP [ $ ]
$12,251
FAMILY INCOME DEFICIT
0.52
INEQUALITY / GINI INDEX
156,554
TOTAL POPULATION
73,881
MALE POPULATION
82,673
FEMALE POPULATION
89.37
MALES / 100 FEMALES
111.90
FEMALES / 100 MALES
36.5
MEDIAN AGE
3.3
AVG FAMILY SIZE
2.5
AVG HOUSEHOLD SIZE
70,526
LABOR FORCE [ PEOPLE ]
57.5%
PERCENT IN LABOR FORCE
7.5%
UNEMPLOYMENT RATE
Income in Macon Bibb County
Income Overview in Macon Bibb County
Per Capita Income in Macon Bibb County is $30,115, while median incomes of families and households are $64,826 and $48,897 respectively.
| Characteristic | Number | Measure |
| Per Capita Income | 156,554 | $30,115 |
| Median Family Income | 35,720 | $64,826 |
| Mean Family Income | 35,720 | $92,319 |
| Median Household Income | 59,480 | $48,897 |
| Mean Household Income | 59,480 | $74,427 |
| Income Deficit | 35,720 | $12,251 |
| Wage / Income Gap (%) | 156,554 | 20.60% |
| Wage / Income Gap ($) | 156,554 | 79.40¢ per $1 |
| Gini / Inequality Index | 156,554 | 0.52 |
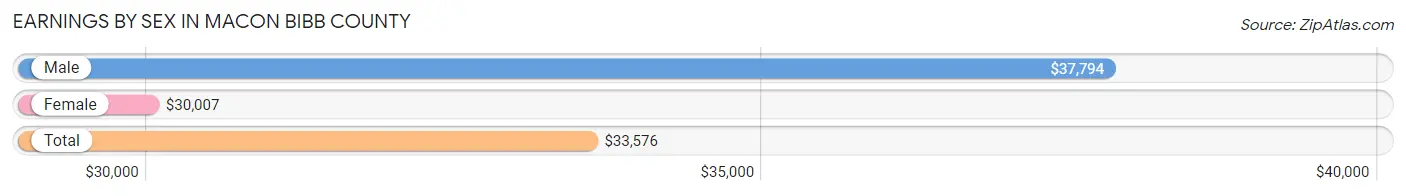
Earnings by Sex in Macon Bibb County
Average Earnings in Macon Bibb County are $33,576, $37,794 for men and $30,007 for women, a difference of 20.6%.
| Sex | Number | Average Earnings |
| Male | 34,833 (48.0%) | $37,794 |
| Female | 37,780 (52.0%) | $30,007 |
| Total | 72,613 (100.0%) | $33,576 |
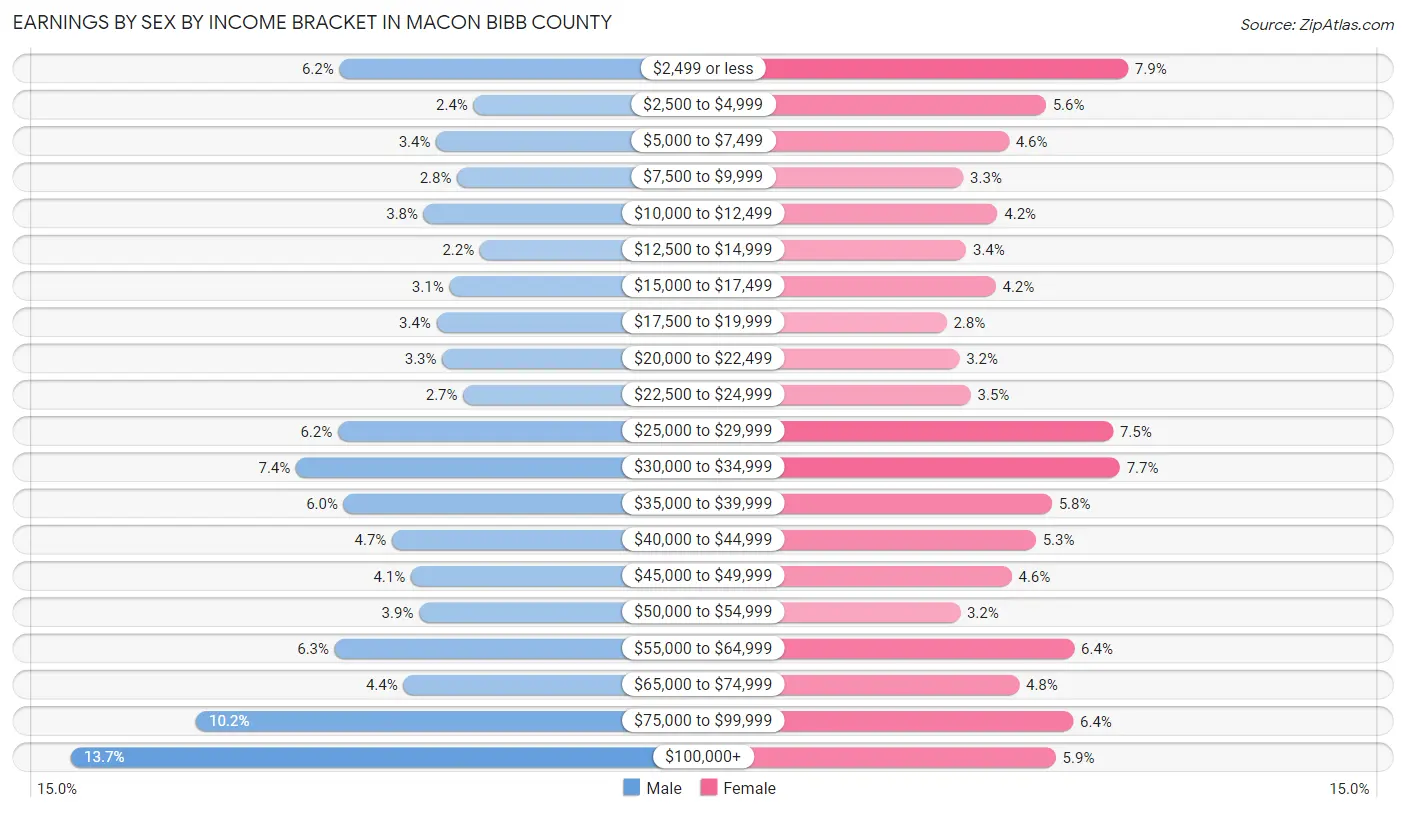
Earnings by Sex by Income Bracket in Macon Bibb County
The most common earnings brackets in Macon Bibb County are $100,000+ for men (4,770 | 13.7%) and $2,499 or less for women (2,983 | 7.9%).
| Income | Male | Female |
| $2,499 or less | 2,143 (6.1%) | 2,983 (7.9%) |
| $2,500 to $4,999 | 828 (2.4%) | 2,113 (5.6%) |
| $5,000 to $7,499 | 1,194 (3.4%) | 1,719 (4.5%) |
| $7,500 to $9,999 | 989 (2.8%) | 1,237 (3.3%) |
| $10,000 to $12,499 | 1,316 (3.8%) | 1,597 (4.2%) |
| $12,500 to $14,999 | 768 (2.2%) | 1,267 (3.4%) |
| $15,000 to $17,499 | 1,065 (3.1%) | 1,578 (4.2%) |
| $17,500 to $19,999 | 1,190 (3.4%) | 1,057 (2.8%) |
| $20,000 to $22,499 | 1,136 (3.3%) | 1,195 (3.2%) |
| $22,500 to $24,999 | 929 (2.7%) | 1,315 (3.5%) |
| $25,000 to $29,999 | 2,155 (6.2%) | 2,825 (7.5%) |
| $30,000 to $34,999 | 2,568 (7.4%) | 2,898 (7.7%) |
| $35,000 to $39,999 | 2,101 (6.0%) | 2,176 (5.8%) |
| $40,000 to $44,999 | 1,626 (4.7%) | 2,006 (5.3%) |
| $45,000 to $49,999 | 1,443 (4.1%) | 1,750 (4.6%) |
| $50,000 to $54,999 | 1,363 (3.9%) | 1,202 (3.2%) |
| $55,000 to $64,999 | 2,187 (6.3%) | 2,414 (6.4%) |
| $65,000 to $74,999 | 1,516 (4.3%) | 1,828 (4.8%) |
| $75,000 to $99,999 | 3,546 (10.2%) | 2,402 (6.4%) |
| $100,000+ | 4,770 (13.7%) | 2,218 (5.9%) |
| Total | 34,833 (100.0%) | 37,780 (100.0%) |
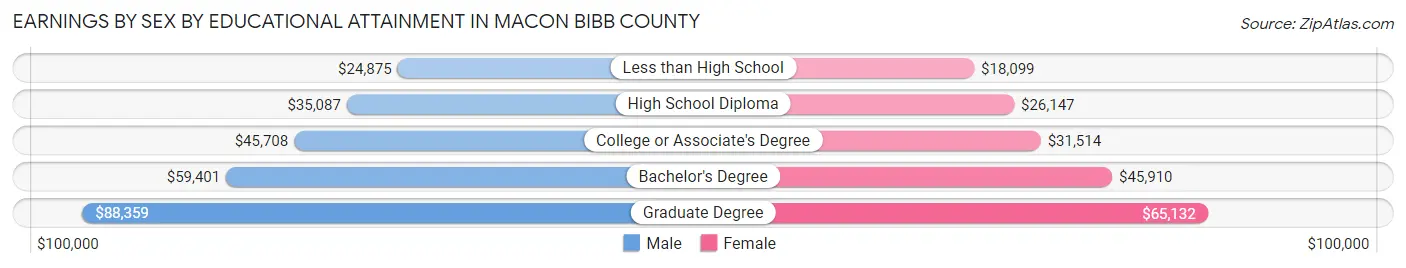
Earnings by Sex by Educational Attainment in Macon Bibb County
Average earnings in Macon Bibb County are $44,786 for men and $34,405 for women, a difference of 23.2%. Men with an educational attainment of graduate degree enjoy the highest average annual earnings of $88,359, while those with less than high school education earn the least with $24,875. Women with an educational attainment of graduate degree earn the most with the average annual earnings of $65,132, while those with less than high school education have the smallest earnings of $18,099.
| Educational Attainment | Male Income | Female Income |
| Less than High School | $24,875 | $18,099 |
| High School Diploma | $35,087 | $26,147 |
| College or Associate's Degree | $45,708 | $31,514 |
| Bachelor's Degree | $59,401 | $45,910 |
| Graduate Degree | $88,359 | $65,132 |
| Total | $44,786 | $34,405 |
Family Income in Macon Bibb County
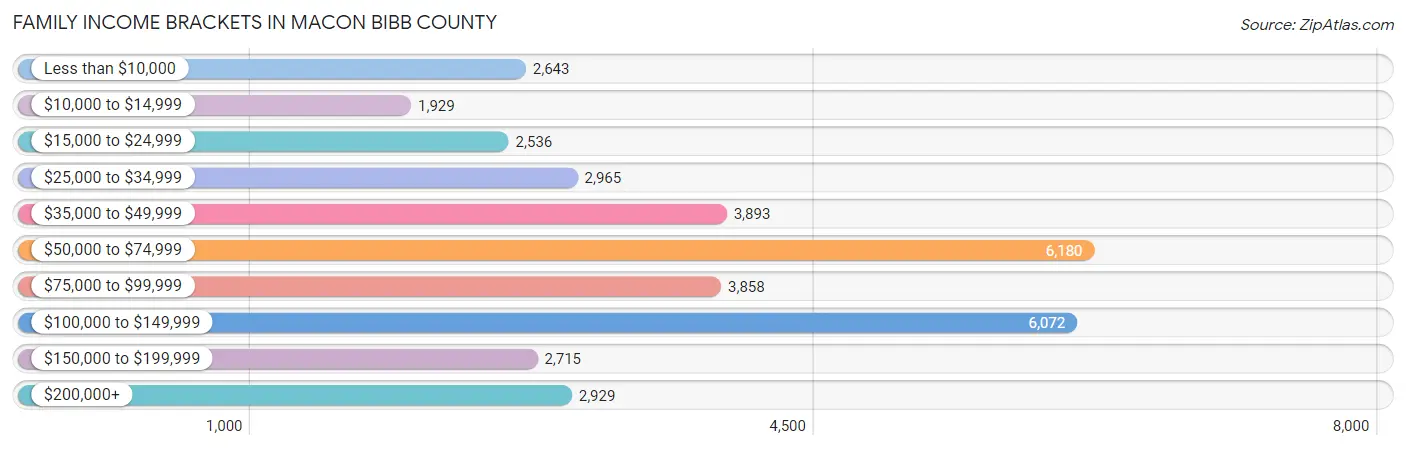
Family Income Brackets in Macon Bibb County
According to the Macon Bibb County family income data, there are 6,180 families falling into the $50,000 to $74,999 income range, which is the most common income bracket and makes up 17.3% of all families. Conversely, the $10,000 to $14,999 income bracket is the least frequent group with only 1,929 families (5.4%) belonging to this category.
| Income Bracket | # Families | % Families |
| Less than $10,000 | 2,643 | 7.4% |
| $10,000 to $14,999 | 1,929 | 5.4% |
| $15,000 to $24,999 | 2,536 | 7.1% |
| $25,000 to $34,999 | 2,965 | 8.3% |
| $35,000 to $49,999 | 3,893 | 10.9% |
| $50,000 to $74,999 | 6,180 | 17.3% |
| $75,000 to $99,999 | 3,858 | 10.8% |
| $100,000 to $149,999 | 6,072 | 17.0% |
| $150,000 to $199,999 | 2,715 | 7.6% |
| $200,000+ | 2,929 | 8.2% |
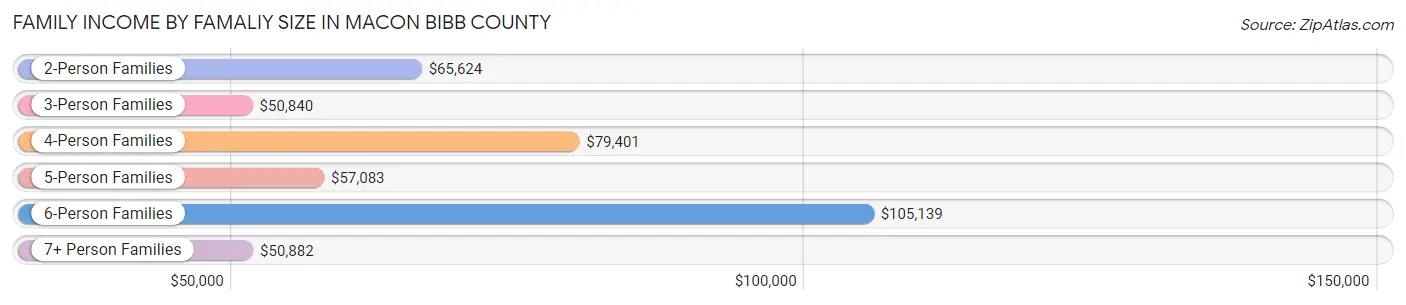
Family Income by Famaliy Size in Macon Bibb County
6-person families (722 | 2.0%) account for the highest median family income in Macon Bibb County with $105,139 per family, while 2-person families (18,344 | 51.3%) have the highest median income of $32,812 per family member.
| Income Bracket | # Families | Median Income |
| 2-Person Families | 18,344 (51.3%) | $65,624 |
| 3-Person Families | 8,135 (22.8%) | $50,840 |
| 4-Person Families | 5,439 (15.2%) | $79,401 |
| 5-Person Families | 2,490 (7.0%) | $57,083 |
| 6-Person Families | 722 (2.0%) | $105,139 |
| 7+ Person Families | 590 (1.7%) | $50,882 |
| Total | 35,720 (100.0%) | $64,826 |
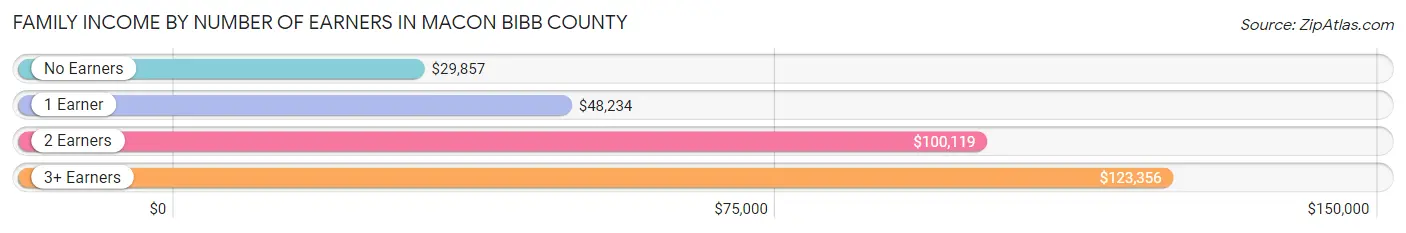
Family Income by Number of Earners in Macon Bibb County
The median family income in Macon Bibb County is $64,826, with families comprising 3+ earners (2,344) having the highest median family income of $123,356, while families with no earners (6,959) have the lowest median family income of $29,857, accounting for 6.6% and 19.5% of families, respectively.
| Number of Earners | # Families | Median Income |
| No Earners | 6,959 (19.5%) | $29,857 |
| 1 Earner | 14,188 (39.7%) | $48,234 |
| 2 Earners | 12,229 (34.2%) | $100,119 |
| 3+ Earners | 2,344 (6.6%) | $123,356 |
| Total | 35,720 (100.0%) | $64,826 |
Household Income in Macon Bibb County
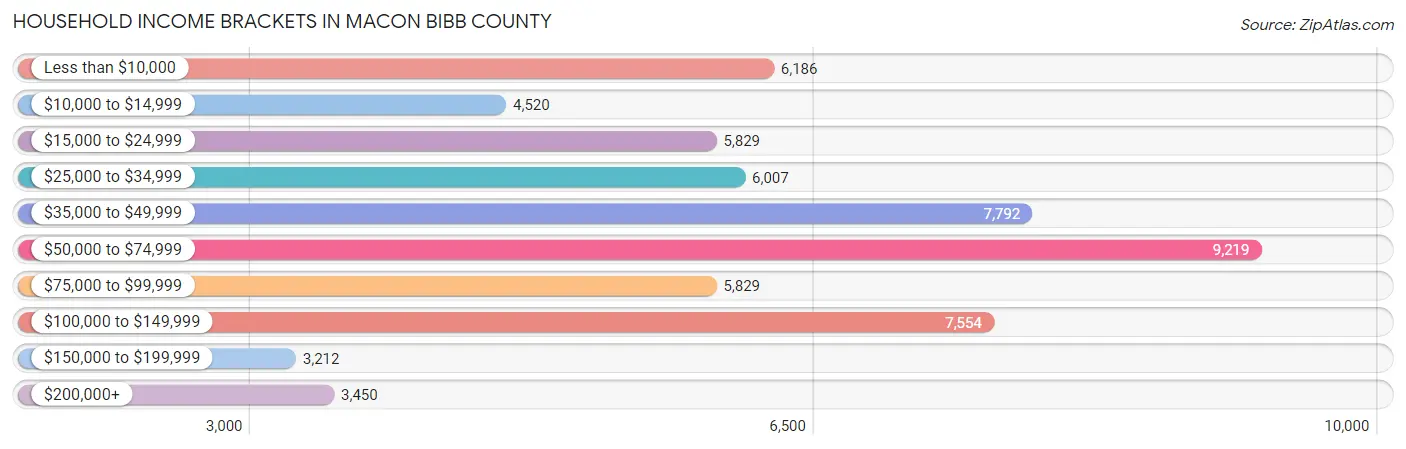
Household Income Brackets in Macon Bibb County
With 9,219 households falling in the category, the $50,000 to $74,999 income range is the most frequent in Macon Bibb County, accounting for 15.5% of all households. In contrast, only 3,212 households (5.4%) fall into the $150,000 to $199,999 income bracket, making it the least populous group.
| Income Bracket | # Households | % Households |
| Less than $10,000 | 6,186 | 10.4% |
| $10,000 to $14,999 | 4,520 | 7.6% |
| $15,000 to $24,999 | 5,829 | 9.8% |
| $25,000 to $34,999 | 6,007 | 10.1% |
| $35,000 to $49,999 | 7,792 | 13.1% |
| $50,000 to $74,999 | 9,219 | 15.5% |
| $75,000 to $99,999 | 5,829 | 9.8% |
| $100,000 to $149,999 | 7,554 | 12.7% |
| $150,000 to $199,999 | 3,212 | 5.4% |
| $200,000+ | 3,450 | 5.8% |
Household Income by Householder Age in Macon Bibb County
The median household income in Macon Bibb County is $48,897, with the highest median household income of $61,619 found in the 45 to 64 years age bracket for the primary householder. A total of 20,682 households (34.8%) fall into this category. Meanwhile, the 15 to 24 years age bracket for the primary householder has the lowest median household income of $24,777, with 2,479 households (4.2%) in this group.
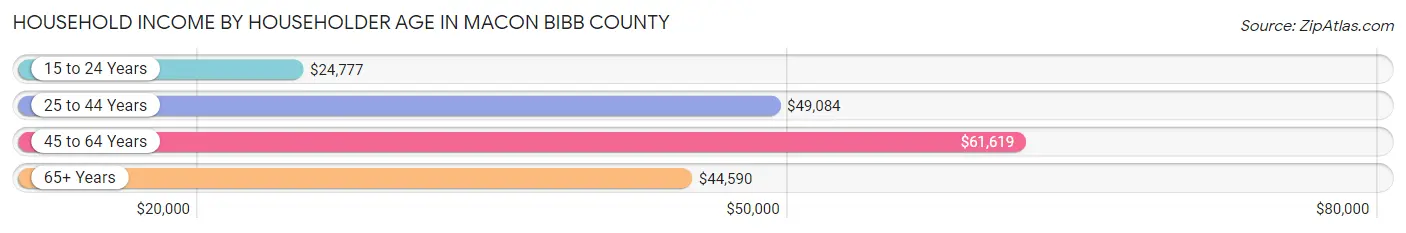
| Income Bracket | # Households | Median Income |
| 15 to 24 Years | 2,479 (4.2%) | $24,777 |
| 25 to 44 Years | 19,963 (33.6%) | $49,084 |
| 45 to 64 Years | 20,682 (34.8%) | $61,619 |
| 65+ Years | 16,356 (27.5%) | $44,590 |
| Total | 59,480 (100.0%) | $48,897 |
Poverty in Macon Bibb County
Income Below Poverty by Sex and Age in Macon Bibb County
With 22.6% poverty level for males and 27.2% for females among the residents of Macon Bibb County, 6 to 11 year old males and 6 to 11 year old females are the most vulnerable to poverty, with 2,804 males (42.7%) and 2,503 females (43.4%) in their respective age groups living below the poverty level.
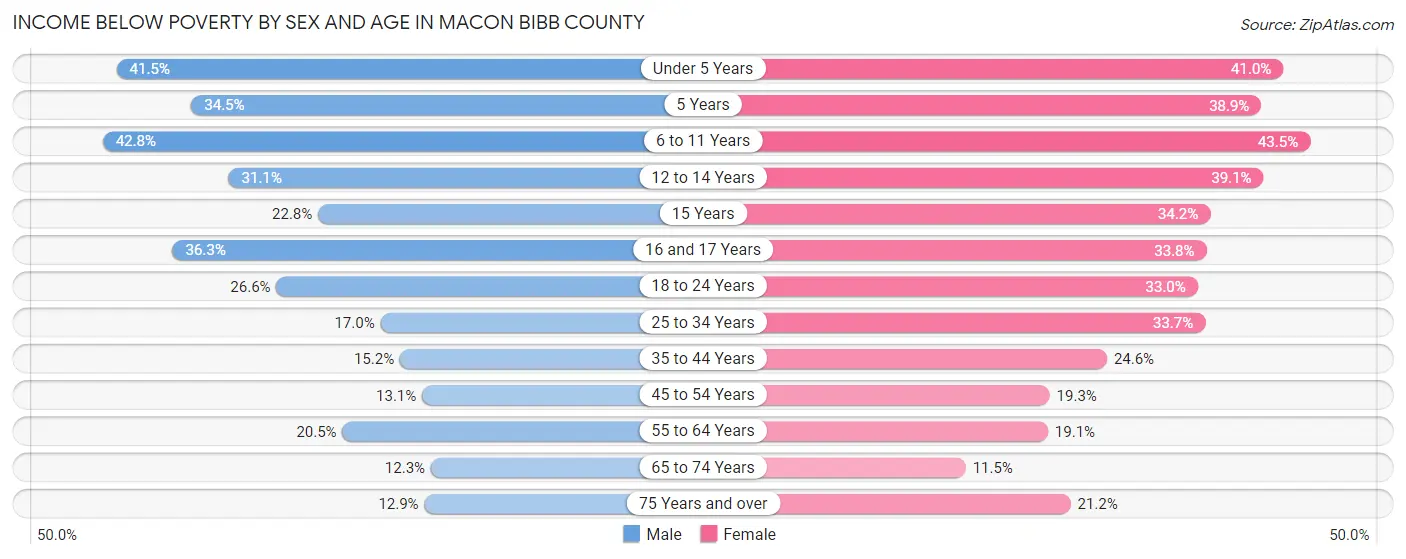
| Age Bracket | Male | Female |
| Under 5 Years | 2,053 (41.5%) | 1,925 (41.0%) |
| 5 Years | 223 (34.5%) | 462 (38.9%) |
| 6 to 11 Years | 2,804 (42.7%) | 2,503 (43.4%) |
| 12 to 14 Years | 1,067 (31.1%) | 1,425 (39.1%) |
| 15 Years | 239 (22.8%) | 363 (34.2%) |
| 16 and 17 Years | 758 (36.3%) | 642 (33.8%) |
| 18 to 24 Years | 1,676 (26.6%) | 2,105 (33.0%) |
| 25 to 34 Years | 1,722 (17.0%) | 3,936 (33.7%) |
| 35 to 44 Years | 1,235 (15.2%) | 2,345 (24.6%) |
| 45 to 54 Years | 1,079 (13.1%) | 1,826 (19.3%) |
| 55 to 64 Years | 1,782 (20.5%) | 1,977 (19.1%) |
| 65 to 74 Years | 815 (12.3%) | 930 (11.5%) |
| 75 Years and over | 448 (12.9%) | 1,301 (21.2%) |
| Total | 15,901 (22.6%) | 21,740 (27.2%) |
Income Above Poverty by Sex and Age in Macon Bibb County
According to the poverty statistics in Macon Bibb County, males aged 65 to 74 years and females aged 65 to 74 years are the age groups that are most secure financially, with 87.7% of males and 88.5% of females in these age groups living above the poverty line.
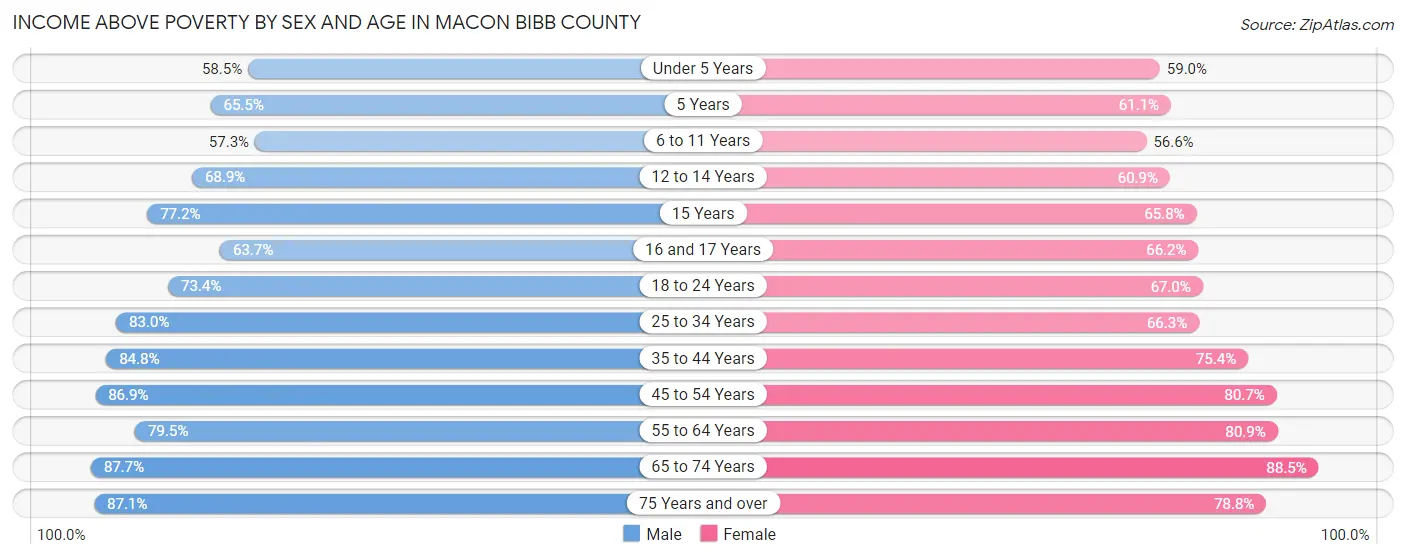
| Age Bracket | Male | Female |
| Under 5 Years | 2,899 (58.5%) | 2,775 (59.0%) |
| 5 Years | 423 (65.5%) | 725 (61.1%) |
| 6 to 11 Years | 3,755 (57.3%) | 3,258 (56.6%) |
| 12 to 14 Years | 2,367 (68.9%) | 2,217 (60.9%) |
| 15 Years | 811 (77.2%) | 699 (65.8%) |
| 16 and 17 Years | 1,332 (63.7%) | 1,256 (66.2%) |
| 18 to 24 Years | 4,618 (73.4%) | 4,269 (67.0%) |
| 25 to 34 Years | 8,425 (83.0%) | 7,739 (66.3%) |
| 35 to 44 Years | 6,910 (84.8%) | 7,183 (75.4%) |
| 45 to 54 Years | 7,151 (86.9%) | 7,640 (80.7%) |
| 55 to 64 Years | 6,910 (79.5%) | 8,360 (80.9%) |
| 65 to 74 Years | 5,819 (87.7%) | 7,154 (88.5%) |
| 75 Years and over | 3,028 (87.1%) | 4,827 (78.8%) |
| Total | 54,448 (77.4%) | 58,102 (72.8%) |
Income Below Poverty Among Married-Couple Families in Macon Bibb County
The poverty statistics for married-couple families in Macon Bibb County show that 5.0% or 1,035 of the total 20,678 families live below the poverty line. Families with 5 or more children have the highest poverty rate of 81.1%, comprising of 129 families. On the other hand, families with no children have the lowest poverty rate of 3.7%, which includes 490 families.
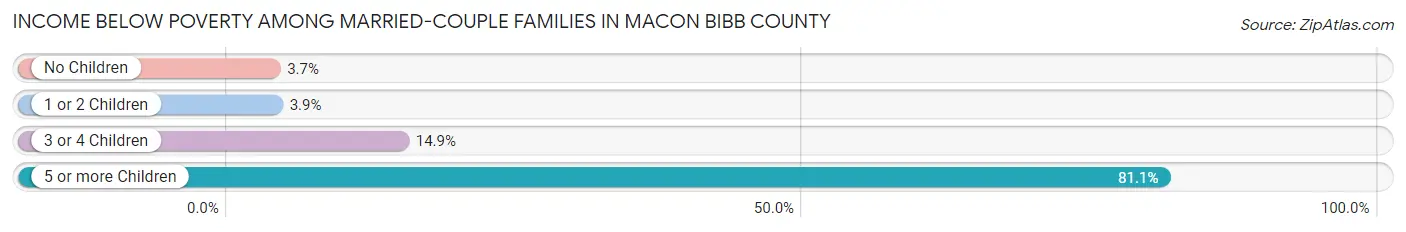
| Children | Above Poverty | Below Poverty |
| No Children | 12,853 (96.3%) | 490 (3.7%) |
| 1 or 2 Children | 5,700 (96.1%) | 231 (3.9%) |
| 3 or 4 Children | 1,060 (85.1%) | 185 (14.9%) |
| 5 or more Children | 30 (18.9%) | 129 (81.1%) |
| Total | 19,643 (95.0%) | 1,035 (5.0%) |
Income Below Poverty Among Single-Parent Households in Macon Bibb County
According to the poverty data in Macon Bibb County, 22.9% or 665 single-father households and 43.4% or 5,266 single-mother households are living below the poverty line. Among single-father households, those with 5 or more children have the highest poverty rate, with 2 households (100.0%) experiencing poverty. Likewise, among single-mother households, those with 5 or more children have the highest poverty rate, with 167 households (100.0%) falling below the poverty line.
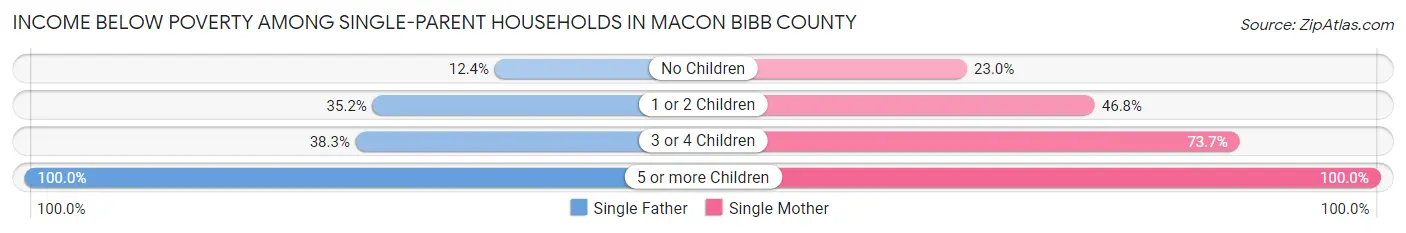
| Children | Single Father | Single Mother |
| No Children | 198 (12.4%) | 925 (23.0%) |
| 1 or 2 Children | 383 (35.2%) | 2,934 (46.8%) |
| 3 or 4 Children | 82 (38.3%) | 1,240 (73.7%) |
| 5 or more Children | 2 (100.0%) | 167 (100.0%) |
| Total | 665 (22.9%) | 5,266 (43.4%) |
Income Below Poverty Among Married-Couple vs Single-Parent Households in Macon Bibb County
The poverty data for Macon Bibb County shows that 1,035 of the married-couple family households (5.0%) and 5,931 of the single-parent households (39.4%) are living below the poverty level. Within the married-couple family households, those with 5 or more children have the highest poverty rate, with 129 households (81.1%) falling below the poverty line. Among the single-parent households, those with 5 or more children have the highest poverty rate, with 169 household (100.0%) living below poverty.
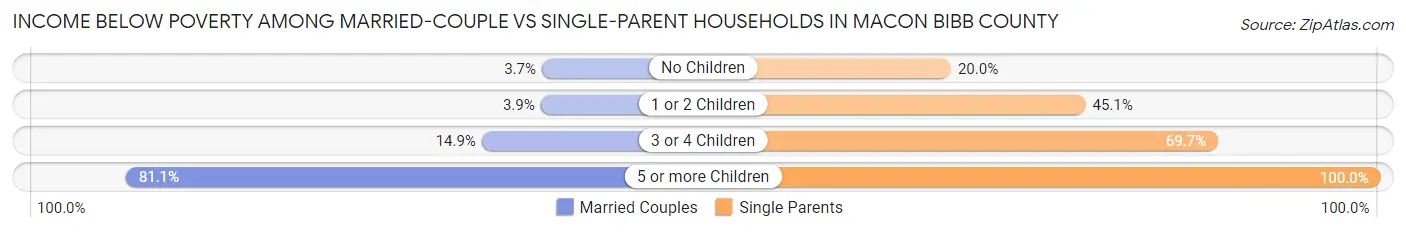
| Children | Married-Couple Families | Single-Parent Households |
| No Children | 490 (3.7%) | 1,123 (20.0%) |
| 1 or 2 Children | 231 (3.9%) | 3,317 (45.1%) |
| 3 or 4 Children | 185 (14.9%) | 1,322 (69.7%) |
| 5 or more Children | 129 (81.1%) | 169 (100.0%) |
| Total | 1,035 (5.0%) | 5,931 (39.4%) |
Race in Macon Bibb County
The most populous races in Macon Bibb County are Black / African American (85,028 | 54.3%), White / Caucasian (58,258 | 37.2%), and Two or more Races (6,347 | 4.1%).
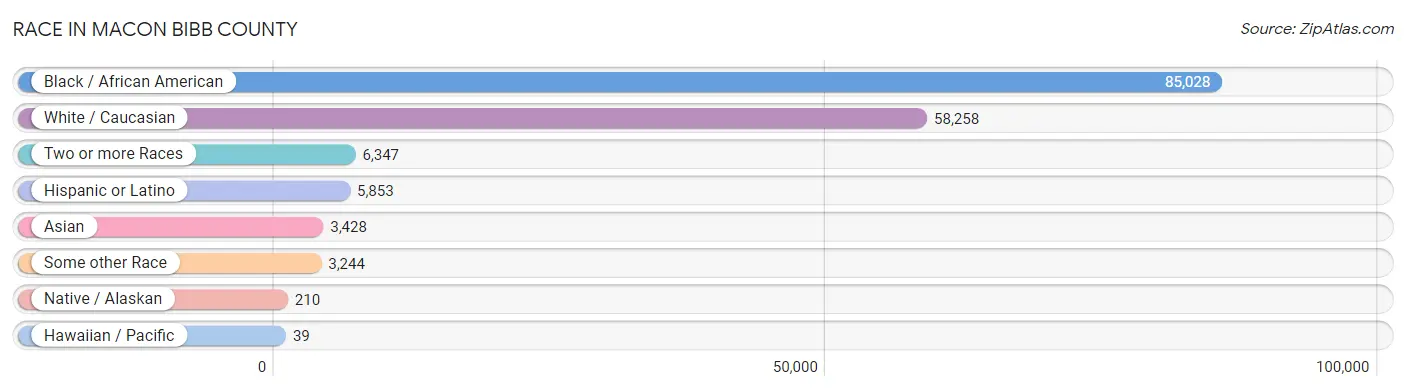
| Race | # Population | % Population |
| Asian | 3,428 | 2.2% |
| Black / African American | 85,028 | 54.3% |
| Hawaiian / Pacific | 39 | 0.0% |
| Hispanic or Latino | 5,853 | 3.7% |
| Native / Alaskan | 210 | 0.1% |
| White / Caucasian | 58,258 | 37.2% |
| Two or more Races | 6,347 | 4.1% |
| Some other Race | 3,244 | 2.1% |
| Total | 156,554 | 100.0% |
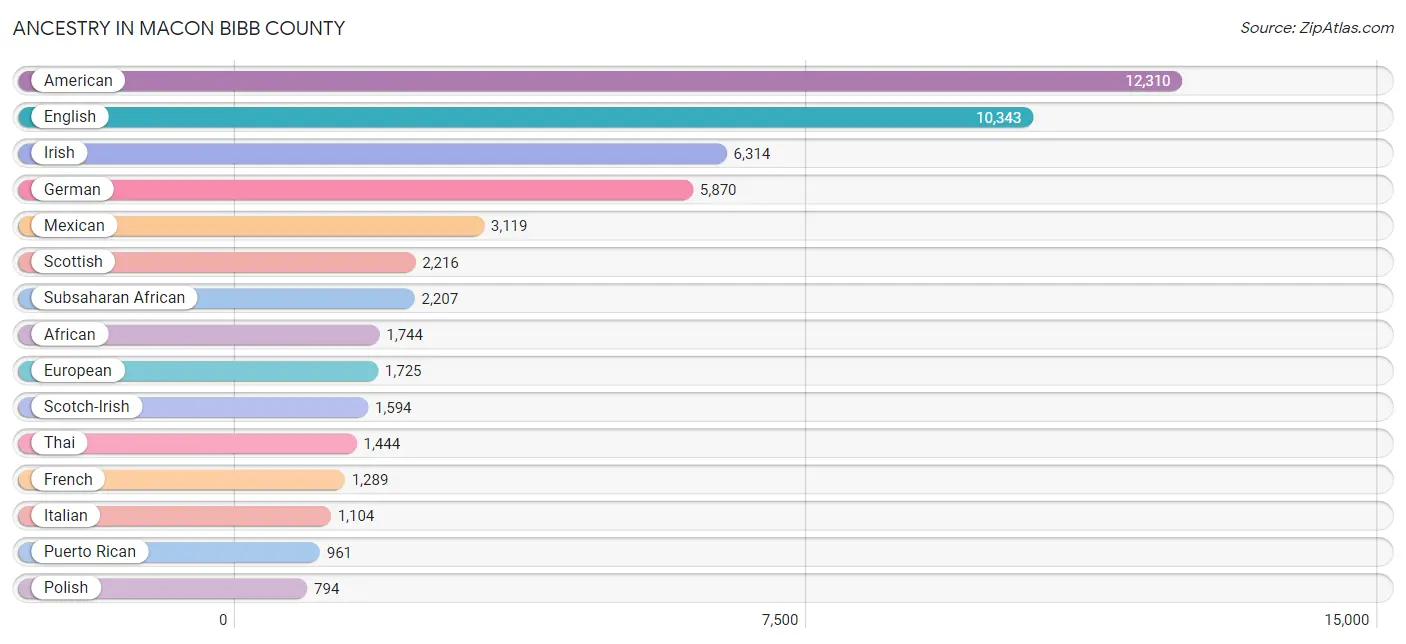
Ancestry in Macon Bibb County
The most populous ancestries reported in Macon Bibb County are American (12,310 | 7.9%), English (10,343 | 6.6%), Irish (6,314 | 4.0%), German (5,870 | 3.7%), and Mexican (3,119 | 2.0%), together accounting for 24.2% of all Macon Bibb County residents.
| Ancestry | # Population | % Population |
| African | 1,744 | 1.1% |
| American | 12,310 | 7.9% |
| Arab | 300 | 0.2% |
| Armenian | 6 | 0.0% |
| Australian | 13 | 0.0% |
| Austrian | 64 | 0.0% |
| Bahamian | 53 | 0.0% |
| Barbadian | 17 | 0.0% |
| Belgian | 45 | 0.0% |
| Bhutanese | 100 | 0.1% |
| Blackfeet | 28 | 0.0% |
| Brazilian | 43 | 0.0% |
| British | 579 | 0.4% |
| British West Indian | 16 | 0.0% |
| Burmese | 713 | 0.5% |
| Canadian | 67 | 0.0% |
| Celtic | 26 | 0.0% |
| Central American | 248 | 0.2% |
| Central American Indian | 37 | 0.0% |
| Cherokee | 719 | 0.5% |
| Chilean | 25 | 0.0% |
| Colombian | 63 | 0.0% |
| Comanche | 9 | 0.0% |
| Costa Rican | 7 | 0.0% |
| Creek | 88 | 0.1% |
| Croatian | 30 | 0.0% |
| Cuban | 528 | 0.3% |
| Czech | 293 | 0.2% |
| Czechoslovakian | 5 | 0.0% |
| Danish | 83 | 0.1% |
| Delaware | 28 | 0.0% |
| Dominican | 48 | 0.0% |
| Dutch | 420 | 0.3% |
| Eastern European | 114 | 0.1% |
| Ecuadorian | 22 | 0.0% |
| English | 10,343 | 6.6% |
| Ethiopian | 37 | 0.0% |
| European | 1,725 | 1.1% |
| Finnish | 45 | 0.0% |
| French | 1,289 | 0.8% |
| French Canadian | 77 | 0.1% |
| German | 5,870 | 3.7% |
| Ghanaian | 44 | 0.0% |
| Greek | 471 | 0.3% |
| Guamanian / Chamorro | 28 | 0.0% |
| Guatemalan | 128 | 0.1% |
| Guyanese | 46 | 0.0% |
| Haitian | 265 | 0.2% |
| Honduran | 48 | 0.0% |
| Hungarian | 75 | 0.1% |
| Icelander | 27 | 0.0% |
| Indian (Asian) | 495 | 0.3% |
| Indonesian | 12 | 0.0% |
| Iranian | 45 | 0.0% |
| Irish | 6,314 | 4.0% |
| Italian | 1,104 | 0.7% |
| Jamaican | 393 | 0.3% |
| Korean | 319 | 0.2% |
| Lebanese | 110 | 0.1% |
| Lithuanian | 1 | 0.0% |
| Malaysian | 236 | 0.2% |
| Mexican | 3,119 | 2.0% |
| Moroccan | 3 | 0.0% |
| Native Hawaiian | 11 | 0.0% |
| Navajo | 8 | 0.0% |
| Nicaraguan | 21 | 0.0% |
| Nigerian | 158 | 0.1% |
| Northern European | 79 | 0.1% |
| Norwegian | 347 | 0.2% |
| Pakistani | 95 | 0.1% |
| Panamanian | 23 | 0.0% |
| Pennsylvania German | 13 | 0.0% |
| Peruvian | 95 | 0.1% |
| Polish | 794 | 0.5% |
| Portuguese | 137 | 0.1% |
| Puerto Rican | 961 | 0.6% |
| Romanian | 33 | 0.0% |
| Russian | 104 | 0.1% |
| Salvadoran | 21 | 0.0% |
| Samoan | 18 | 0.0% |
| Scandinavian | 72 | 0.1% |
| Scotch-Irish | 1,594 | 1.0% |
| Scottish | 2,216 | 1.4% |
| Senegalese | 11 | 0.0% |
| Slavic | 55 | 0.0% |
| Slovak | 9 | 0.0% |
| South African | 33 | 0.0% |
| South American | 238 | 0.2% |
| Spaniard | 121 | 0.1% |
| Spanish | 114 | 0.1% |
| Sri Lankan | 528 | 0.3% |
| Subsaharan African | 2,207 | 1.4% |
| Swedish | 341 | 0.2% |
| Swiss | 38 | 0.0% |
| Syrian | 105 | 0.1% |
| Thai | 1,444 | 0.9% |
| Trinidadian and Tobagonian | 107 | 0.1% |
| U.S. Virgin Islander | 146 | 0.1% |
| Ukrainian | 37 | 0.0% |
| Uruguayan | 4 | 0.0% |
| Venezuelan | 29 | 0.0% |
| Welsh | 313 | 0.2% |
| West Indian | 94 | 0.1% | View All 103 Rows |
Immigrants in Macon Bibb County
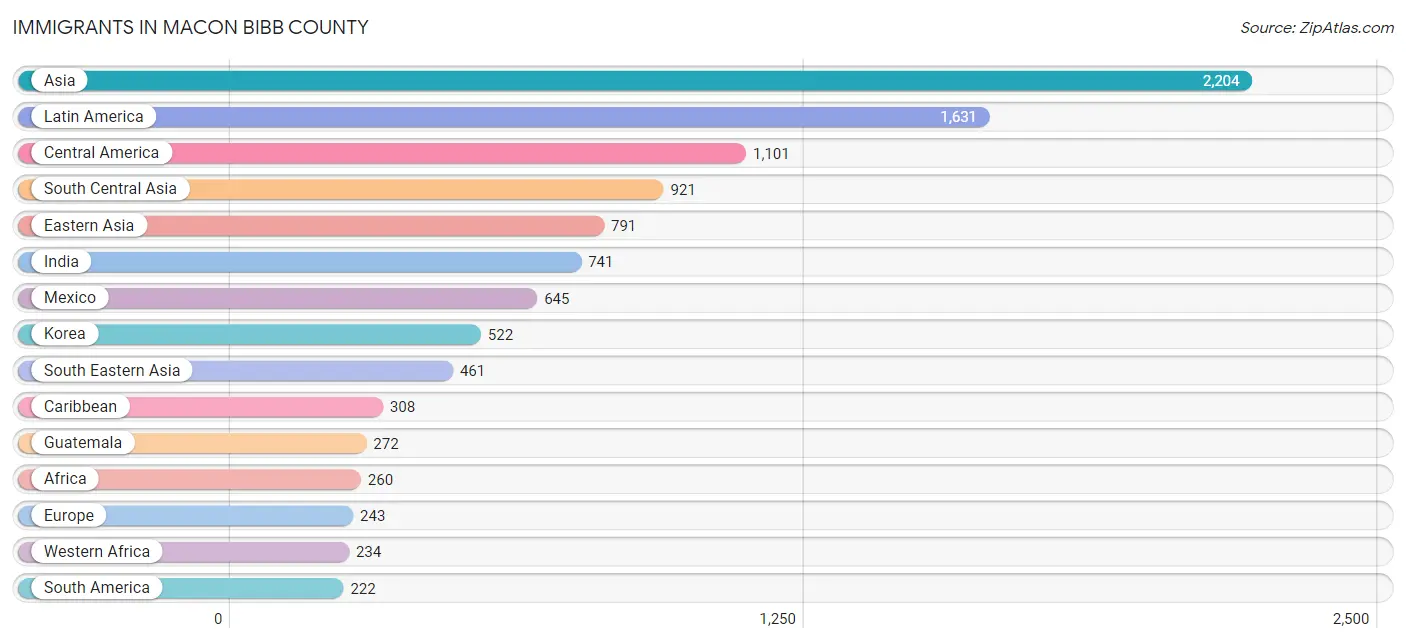
The most numerous immigrant groups reported in Macon Bibb County came from Asia (2,204 | 1.4%), Latin America (1,631 | 1.0%), Central America (1,101 | 0.7%), South Central Asia (921 | 0.6%), and Eastern Asia (791 | 0.5%), together accounting for 4.3% of all Macon Bibb County residents.
| Immigration Origin | # Population | % Population |
| Africa | 260 | 0.2% |
| Asia | 2,204 | 1.4% |
| Bahamas | 9 | 0.0% |
| Belgium | 5 | 0.0% |
| Brazil | 9 | 0.0% |
| Canada | 97 | 0.1% |
| Caribbean | 308 | 0.2% |
| Central America | 1,101 | 0.7% |
| China | 194 | 0.1% |
| Colombia | 82 | 0.1% |
| Costa Rica | 7 | 0.0% |
| Cuba | 84 | 0.1% |
| Eastern Africa | 16 | 0.0% |
| Eastern Asia | 791 | 0.5% |
| Eastern Europe | 3 | 0.0% |
| Ecuador | 10 | 0.0% |
| Egypt | 10 | 0.0% |
| El Salvador | 21 | 0.0% |
| Ethiopia | 16 | 0.0% |
| Europe | 243 | 0.2% |
| France | 20 | 0.0% |
| Germany | 109 | 0.1% |
| Ghana | 44 | 0.0% |
| Greece | 10 | 0.0% |
| Grenada | 12 | 0.0% |
| Guatemala | 272 | 0.2% |
| Guyana | 84 | 0.1% |
| Haiti | 26 | 0.0% |
| Honduras | 84 | 0.1% |
| India | 741 | 0.5% |
| Iran | 41 | 0.0% |
| Iraq | 12 | 0.0% |
| Italy | 19 | 0.0% |
| Jamaica | 44 | 0.0% |
| Japan | 75 | 0.1% |
| Korea | 522 | 0.3% |
| Laos | 13 | 0.0% |
| Latin America | 1,631 | 1.0% |
| Mexico | 645 | 0.4% |
| Nicaragua | 9 | 0.0% |
| Nigeria | 159 | 0.1% |
| Northern Africa | 10 | 0.0% |
| Northern Europe | 61 | 0.0% |
| Oceania | 184 | 0.1% |
| Pakistan | 139 | 0.1% |
| Panama | 63 | 0.0% |
| Peru | 8 | 0.0% |
| Philippines | 198 | 0.1% |
| Russia | 3 | 0.0% |
| Senegal | 11 | 0.0% |
| South America | 222 | 0.1% |
| South Central Asia | 921 | 0.6% |
| South Eastern Asia | 461 | 0.3% |
| Southern Europe | 45 | 0.0% |
| Spain | 16 | 0.0% |
| St. Vincent and the Grenadines | 4 | 0.0% |
| Taiwan | 48 | 0.0% |
| Trinidad and Tobago | 129 | 0.1% |
| Turkey | 19 | 0.0% |
| Venezuela | 29 | 0.0% |
| Vietnam | 209 | 0.1% |
| Western Africa | 234 | 0.2% |
| Western Asia | 31 | 0.0% |
| Western Europe | 134 | 0.1% | View All 64 Rows |
Sex and Age in Macon Bibb County
Sex and Age in Macon Bibb County
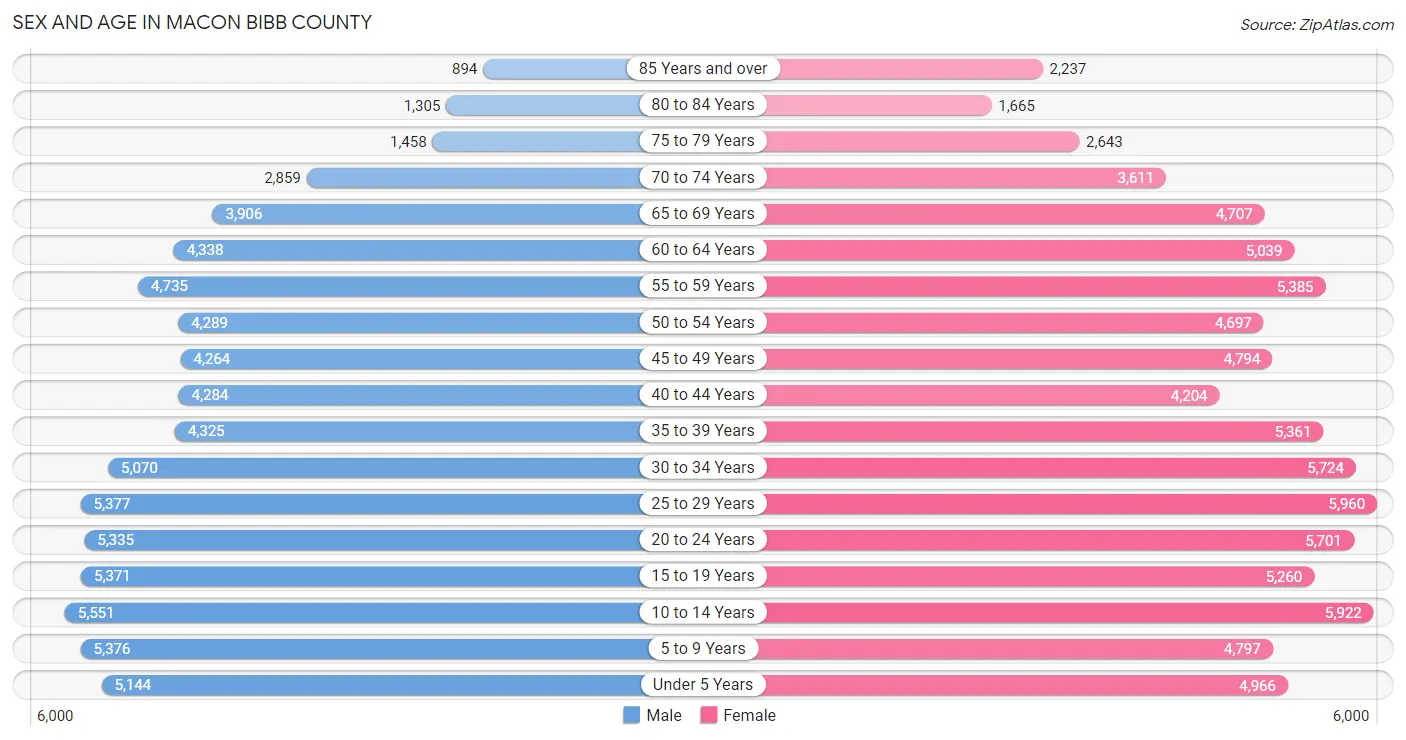
The most populous age groups in Macon Bibb County are 10 to 14 Years (5,551 | 7.5%) for men and 25 to 29 Years (5,960 | 7.2%) for women.
| Age Bracket | Male | Female |
| Under 5 Years | 5,144 (7.0%) | 4,966 (6.0%) |
| 5 to 9 Years | 5,376 (7.3%) | 4,797 (5.8%) |
| 10 to 14 Years | 5,551 (7.5%) | 5,922 (7.2%) |
| 15 to 19 Years | 5,371 (7.3%) | 5,260 (6.4%) |
| 20 to 24 Years | 5,335 (7.2%) | 5,701 (6.9%) |
| 25 to 29 Years | 5,377 (7.3%) | 5,960 (7.2%) |
| 30 to 34 Years | 5,070 (6.9%) | 5,724 (6.9%) |
| 35 to 39 Years | 4,325 (5.9%) | 5,361 (6.5%) |
| 40 to 44 Years | 4,284 (5.8%) | 4,204 (5.1%) |
| 45 to 49 Years | 4,264 (5.8%) | 4,794 (5.8%) |
| 50 to 54 Years | 4,289 (5.8%) | 4,697 (5.7%) |
| 55 to 59 Years | 4,735 (6.4%) | 5,385 (6.5%) |
| 60 to 64 Years | 4,338 (5.9%) | 5,039 (6.1%) |
| 65 to 69 Years | 3,906 (5.3%) | 4,707 (5.7%) |
| 70 to 74 Years | 2,859 (3.9%) | 3,611 (4.4%) |
| 75 to 79 Years | 1,458 (2.0%) | 2,643 (3.2%) |
| 80 to 84 Years | 1,305 (1.8%) | 1,665 (2.0%) |
| 85 Years and over | 894 (1.2%) | 2,237 (2.7%) |
| Total | 73,881 (100.0%) | 82,673 (100.0%) |
Families and Households in Macon Bibb County
Median Family Size in Macon Bibb County
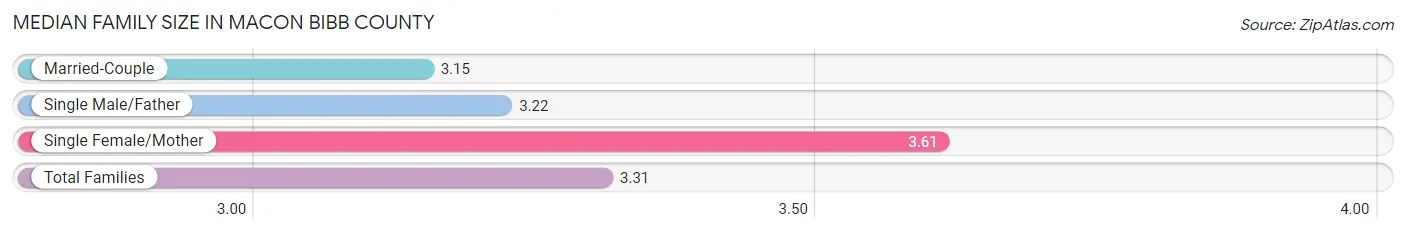
The median family size in Macon Bibb County is 3.31 persons per family, with single female/mother families (12,142 | 34.0%) accounting for the largest median family size of 3.61 persons per family. On the other hand, married-couple families (20,678 | 57.9%) represent the smallest median family size with 3.15 persons per family.
| Family Type | # Families | Family Size |
| Married-Couple | 20,678 (57.9%) | 3.15 |
| Single Male/Father | 2,900 (8.1%) | 3.22 |
| Single Female/Mother | 12,142 (34.0%) | 3.61 |
| Total Families | 35,720 (100.0%) | 3.31 |
Median Household Size in Macon Bibb County
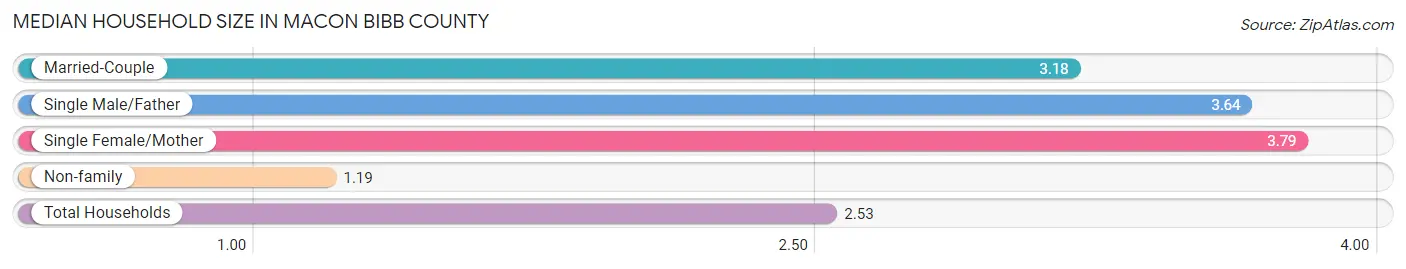
The median household size in Macon Bibb County is 2.53 persons per household, with single female/mother households (12,142 | 20.4%) accounting for the largest median household size of 3.79 persons per household. non-family households (23,760 | 40.0%) represent the smallest median household size with 1.19 persons per household.
| Household Type | # Households | Household Size |
| Married-Couple | 20,678 (34.8%) | 3.18 |
| Single Male/Father | 2,900 (4.9%) | 3.64 |
| Single Female/Mother | 12,142 (20.4%) | 3.79 |
| Non-family | 23,760 (40.0%) | 1.19 |
| Total Households | 59,480 (100.0%) | 2.53 |
Household Size by Marriage Status in Macon Bibb County
Out of a total of 59,480 households in Macon Bibb County, 35,720 (60.1%) are family households, while 23,760 (40.0%) are nonfamily households. The most numerous type of family households are 2-person households, comprising 16,802, and the most common type of nonfamily households are 1-person households, comprising 20,564.
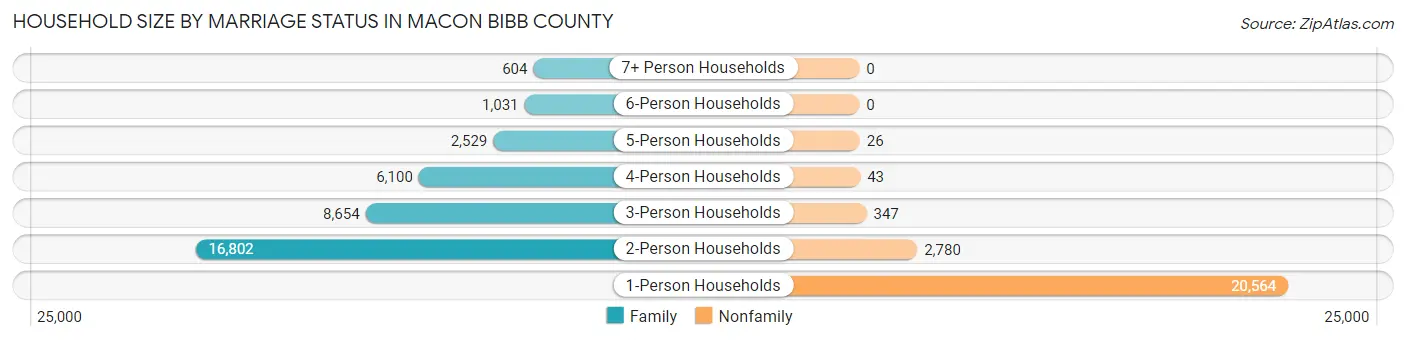
| Household Size | Family Households | Nonfamily Households |
| 1-Person Households | - | 20,564 (34.6%) |
| 2-Person Households | 16,802 (28.2%) | 2,780 (4.7%) |
| 3-Person Households | 8,654 (14.5%) | 347 (0.6%) |
| 4-Person Households | 6,100 (10.3%) | 43 (0.1%) |
| 5-Person Households | 2,529 (4.3%) | 26 (0.0%) |
| 6-Person Households | 1,031 (1.7%) | 0 (0.0%) |
| 7+ Person Households | 604 (1.0%) | 0 (0.0%) |
| Total | 35,720 (60.1%) | 23,760 (40.0%) |
Female Fertility in Macon Bibb County
Fertility by Age in Macon Bibb County
Average fertility rate in Macon Bibb County is 62.0 births per 1,000 women. Women in the age bracket of 20 to 34 years have the highest fertility rate with 110.0 births per 1,000 women. Women in the age bracket of 20 to 34 years acount for 80.5% of all women with births.
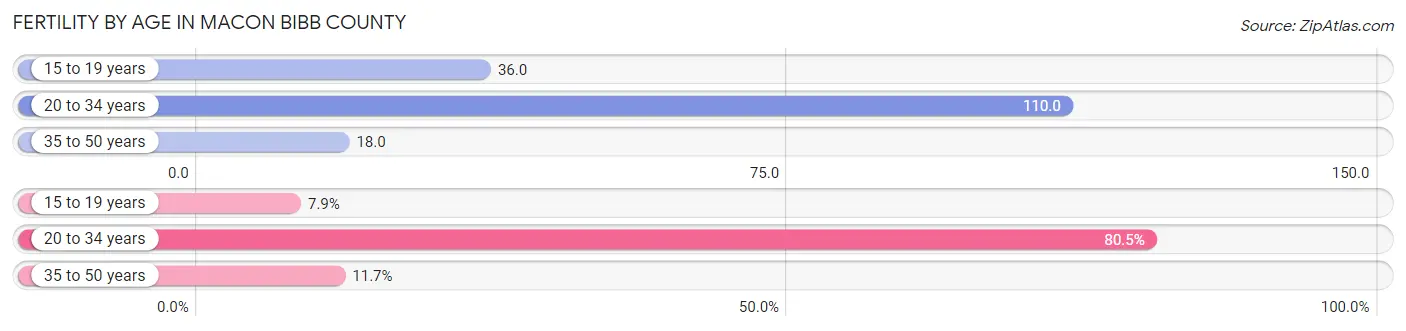
| Age Bracket | Women with Births | Births / 1,000 Women |
| 15 to 19 years | 187 (7.9%) | 36.0 |
| 20 to 34 years | 1,906 (80.5%) | 110.0 |
| 35 to 50 years | 276 (11.7%) | 18.0 |
| Total | 2,369 (100.0%) | 62.0 |
Fertility by Age by Marriage Status in Macon Bibb County
42.0% of women with births (2,369) in Macon Bibb County are married. The highest percentage of unmarried women with births falls into 15 to 19 years age bracket with 77.5% of them unmarried at the time of birth, while the lowest percentage of unmarried women with births belong to 35 to 50 years age bracket with 35.9% of them unmarried.
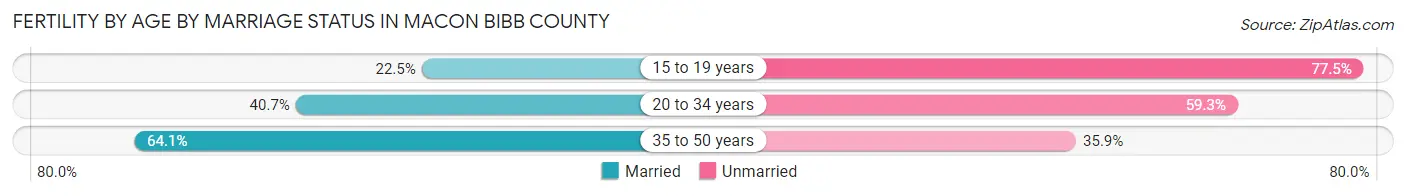
| Age Bracket | Married | Unmarried |
| 15 to 19 years | 42 (22.5%) | 145 (77.5%) |
| 20 to 34 years | 776 (40.7%) | 1,130 (59.3%) |
| 35 to 50 years | 177 (64.1%) | 99 (35.9%) |
| Total | 995 (42.0%) | 1,374 (58.0%) |
Fertility by Education in Macon Bibb County
Average fertility rate in Macon Bibb County is 62.0 births per 1,000 women. Women with the education attainment of high school diploma have the highest fertility rate of 95.0 births per 1,000 women, while women with the education attainment of graduate degree have the lowest fertility at 42.0 births per 1,000 women. Women with the education attainment of high school diploma represent 34.9% of all women with births.
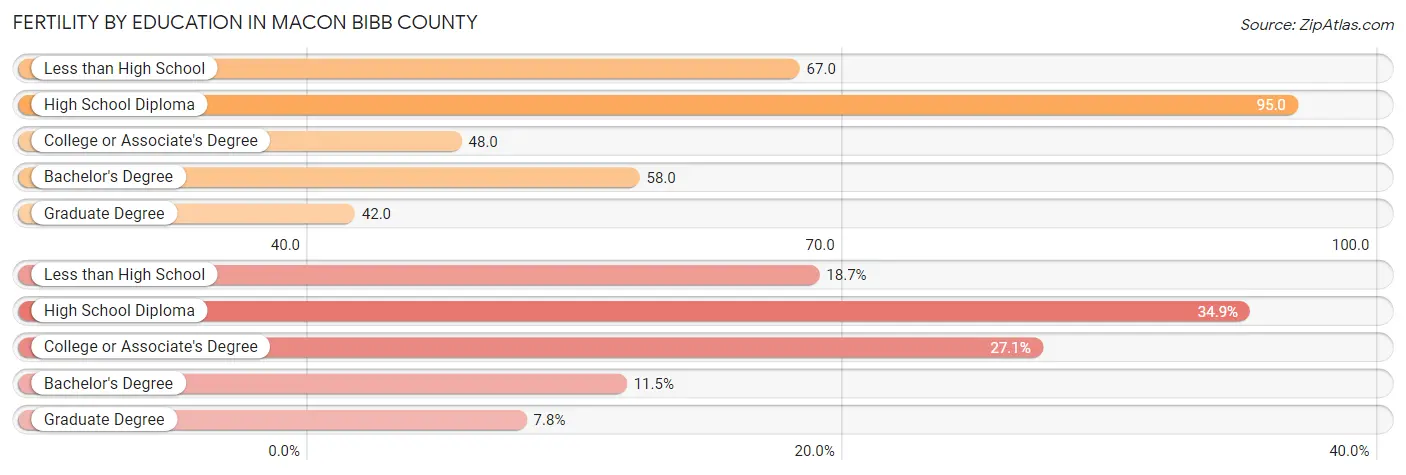
| Educational Attainment | Women with Births | Births / 1,000 Women |
| Less than High School | 444 (18.7%) | 67.0 |
| High School Diploma | 826 (34.9%) | 95.0 |
| College or Associate's Degree | 642 (27.1%) | 48.0 |
| Bachelor's Degree | 273 (11.5%) | 58.0 |
| Graduate Degree | 184 (7.8%) | 42.0 |
| Total | 2,369 (100.0%) | 62.0 |
Fertility by Education by Marriage Status in Macon Bibb County
58.0% of women with births in Macon Bibb County are unmarried. Women with the educational attainment of bachelor's degree are most likely to be married with 100.0% of them married at childbirth, while women with the educational attainment of less than high school are least likely to be married with 85.4% of them unmarried at childbirth.
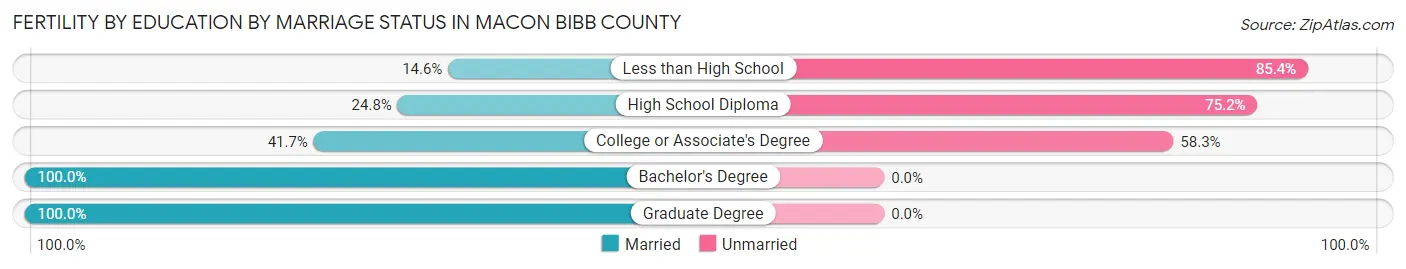
| Educational Attainment | Married | Unmarried |
| Less than High School | 65 (14.6%) | 379 (85.4%) |
| High School Diploma | 205 (24.8%) | 621 (75.2%) |
| College or Associate's Degree | 268 (41.7%) | 374 (58.3%) |
| Bachelor's Degree | 273 (100.0%) | 0 (0.0%) |
| Graduate Degree | 184 (100.0%) | 0 (0.0%) |
| Total | 995 (42.0%) | 1,374 (58.0%) |
Employment Characteristics in Macon Bibb County
Employment by Class of Employer in Macon Bibb County
Among the 63,811 employed individuals in Macon Bibb County, private company employees (43,297 | 67.8%), not-for-profit organizations (5,114 | 8.0%), and local government employees (3,661 | 5.7%) make up the most common classes of employment.
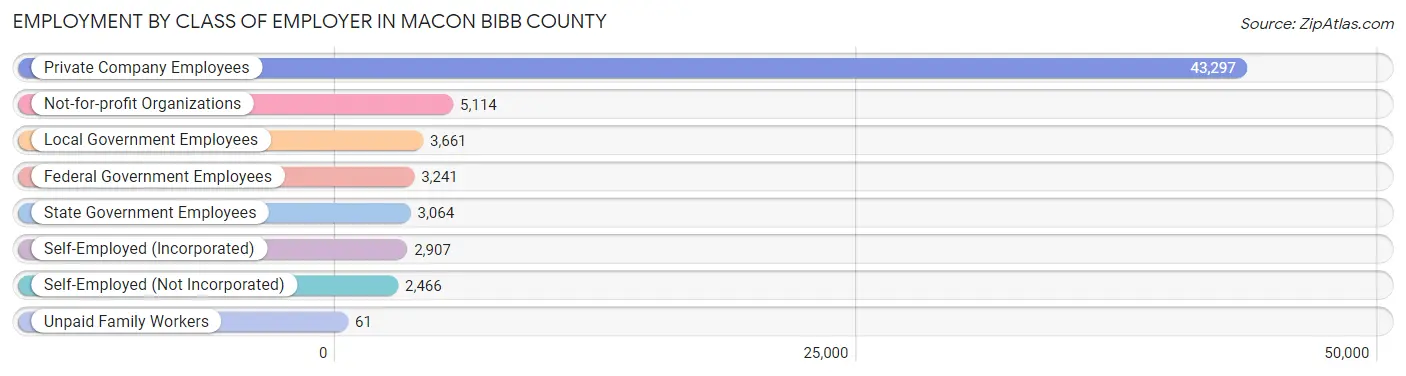
| Employer Class | # Employees | % Employees |
| Private Company Employees | 43,297 | 67.8% |
| Self-Employed (Incorporated) | 2,907 | 4.6% |
| Self-Employed (Not Incorporated) | 2,466 | 3.9% |
| Not-for-profit Organizations | 5,114 | 8.0% |
| Local Government Employees | 3,661 | 5.7% |
| State Government Employees | 3,064 | 4.8% |
| Federal Government Employees | 3,241 | 5.1% |
| Unpaid Family Workers | 61 | 0.1% |
| Total | 63,811 | 100.0% |
Employment Status by Age in Macon Bibb County
According to the labor force statistics for Macon Bibb County, out of the total population over 16 years of age (122,654), 57.5% or 70,526 individuals are in the labor force, with 7.5% or 5,289 of them unemployed. The age group with the highest labor force participation rate is 30 to 34 years, with 81.6% or 8,808 individuals in the labor force. Within the labor force, the 16 to 19 years age range has the highest percentage of unemployed individuals, with 28.2% or 866 of them being unemployed.
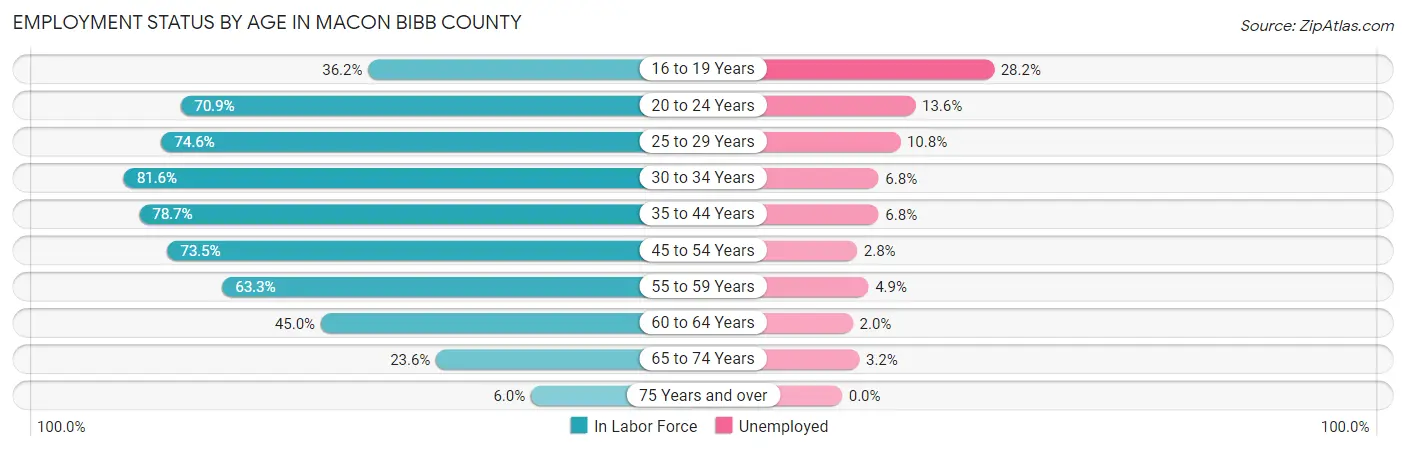
| Age Bracket | In Labor Force | Unemployed |
| 16 to 19 Years | 3,072 (36.2%) | 866 (28.2%) |
| 20 to 24 Years | 7,825 (70.9%) | 1,064 (13.6%) |
| 25 to 29 Years | 8,457 (74.6%) | 913 (10.8%) |
| 30 to 34 Years | 8,808 (81.6%) | 599 (6.8%) |
| 35 to 44 Years | 14,303 (78.7%) | 973 (6.8%) |
| 45 to 54 Years | 13,262 (73.5%) | 371 (2.8%) |
| 55 to 59 Years | 6,406 (63.3%) | 314 (4.9%) |
| 60 to 64 Years | 4,220 (45.0%) | 84 (2.0%) |
| 65 to 74 Years | 3,560 (23.6%) | 114 (3.2%) |
| 75 Years and over | 612 (6.0%) | 0 (0.0%) |
| Total | 70,526 (57.5%) | 5,289 (7.5%) |
Employment Status by Educational Attainment in Macon Bibb County
According to labor force statistics for Macon Bibb County, 71.2% of individuals (55,426) out of the total population between 25 and 64 years of age (77,846) are in the labor force, with 5.9% or 3,270 of them being unemployed. The group with the highest labor force participation rate are those with the educational attainment of bachelor's degree or higher, with 86.3% or 17,892 individuals in the labor force. Within the labor force, individuals with less than high school education have the highest percentage of unemployment, with 16.4% or 682 of them being unemployed.
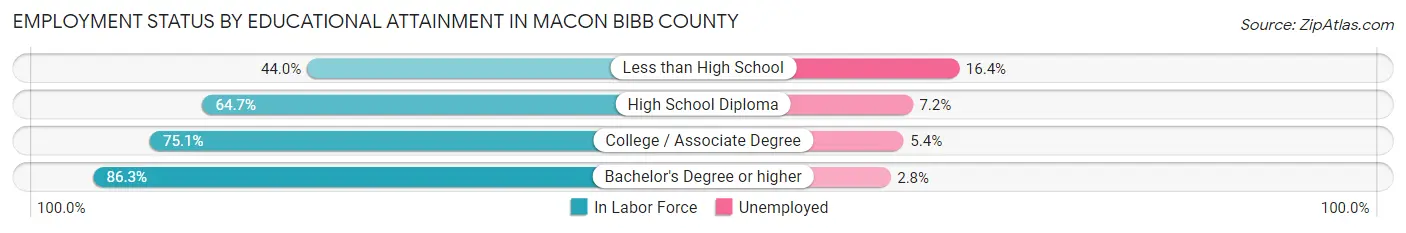
| Educational Attainment | In Labor Force | Unemployed |
| Less than High School | 4,160 (44.0%) | 1,551 (16.4%) |
| High School Diploma | 15,001 (64.7%) | 1,669 (7.2%) |
| College / Associate Degree | 18,380 (75.1%) | 1,322 (5.4%) |
| Bachelor's Degree or higher | 17,892 (86.3%) | 580 (2.8%) |
| Total | 55,426 (71.2%) | 4,593 (5.9%) |
Employment Occupations by Sex in Macon Bibb County
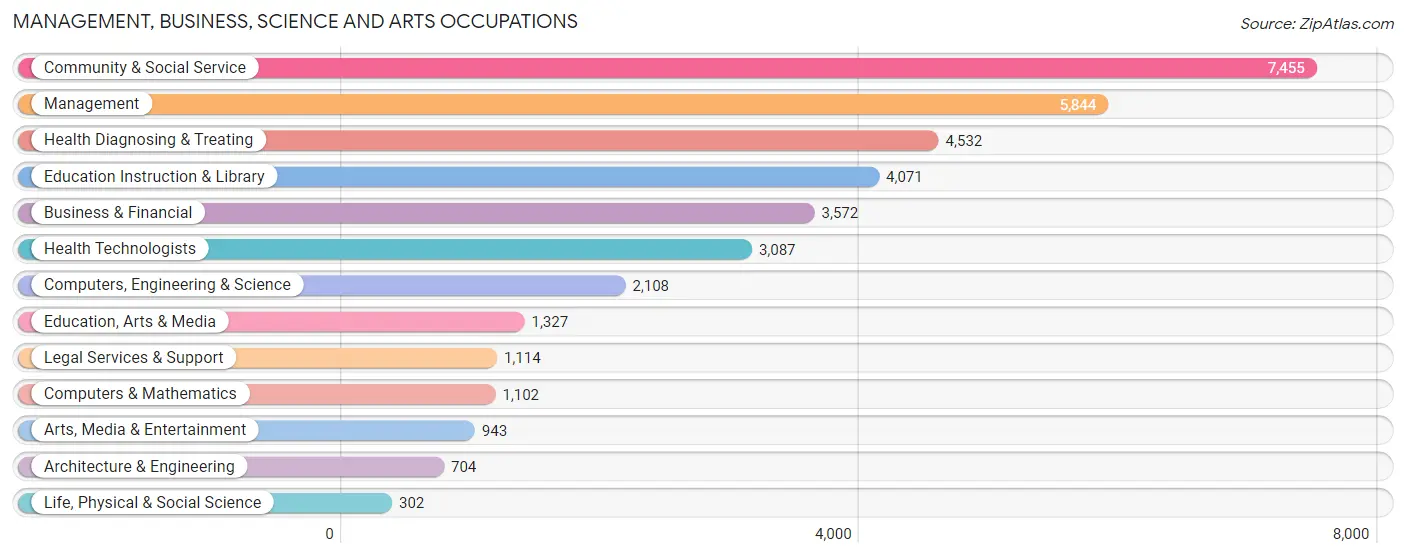
Management, Business, Science and Arts Occupations
The most common Management, Business, Science and Arts occupations in Macon Bibb County are Community & Social Service (7,455 | 11.5%), Management (5,844 | 9.0%), Health Diagnosing & Treating (4,532 | 7.0%), Education Instruction & Library (4,071 | 6.3%), and Business & Financial (3,572 | 5.5%).
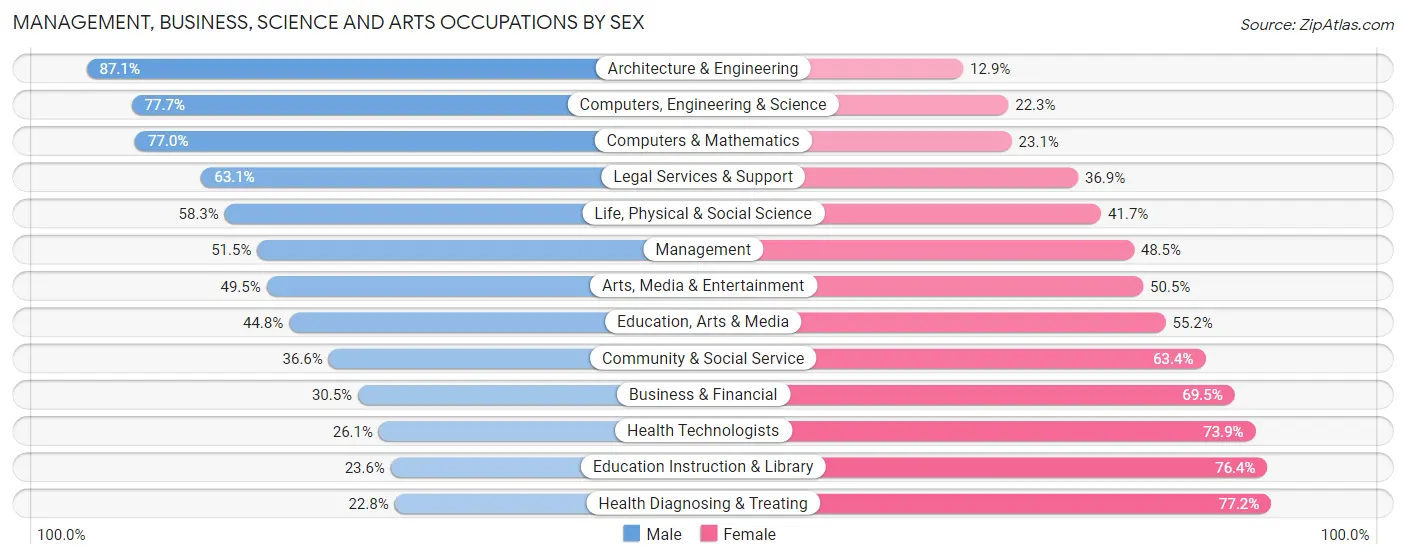
Management, Business, Science and Arts Occupations by Sex
Within the Management, Business, Science and Arts occupations in Macon Bibb County, the most male-oriented occupations are Architecture & Engineering (87.1%), Computers, Engineering & Science (77.7%), and Computers & Mathematics (76.9%), while the most female-oriented occupations are Health Diagnosing & Treating (77.2%), Education Instruction & Library (76.4%), and Health Technologists (73.9%).
| Occupation | Male | Female |
| Management | 3,008 (51.5%) | 2,836 (48.5%) |
| Business & Financial | 1,088 (30.5%) | 2,484 (69.5%) |
| Computers, Engineering & Science | 1,637 (77.7%) | 471 (22.3%) |
| Computers & Mathematics | 848 (76.9%) | 254 (23.1%) |
| Architecture & Engineering | 613 (87.1%) | 91 (12.9%) |
| Life, Physical & Social Science | 176 (58.3%) | 126 (41.7%) |
| Community & Social Service | 2,727 (36.6%) | 4,728 (63.4%) |
| Education, Arts & Media | 595 (44.8%) | 732 (55.2%) |
| Legal Services & Support | 703 (63.1%) | 411 (36.9%) |
| Education Instruction & Library | 962 (23.6%) | 3,109 (76.4%) |
| Arts, Media & Entertainment | 467 (49.5%) | 476 (50.5%) |
| Health Diagnosing & Treating | 1,035 (22.8%) | 3,497 (77.2%) |
| Health Technologists | 806 (26.1%) | 2,281 (73.9%) |
| Total (Category) | 9,495 (40.4%) | 14,016 (59.6%) |
| Total (Overall) | 31,349 (48.3%) | 33,585 (51.7%) |
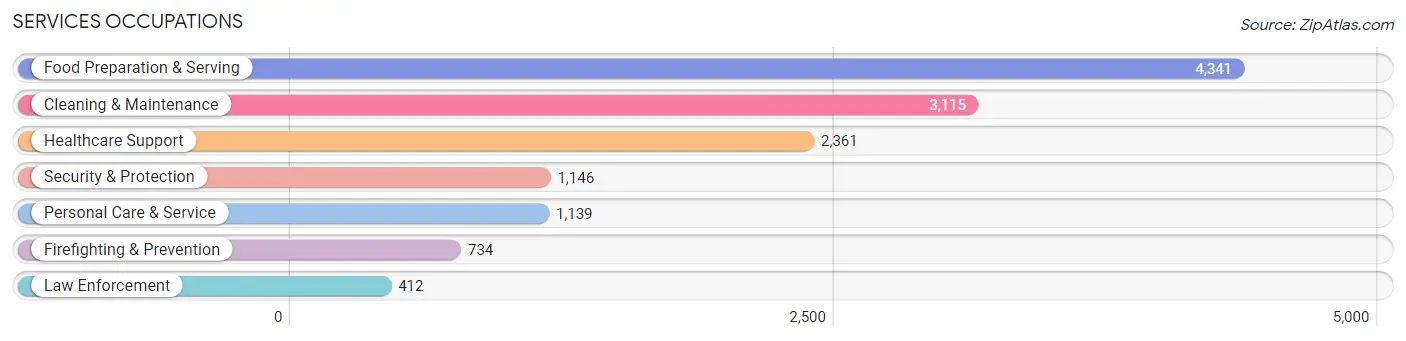
Services Occupations
The most common Services occupations in Macon Bibb County are Food Preparation & Serving (4,341 | 6.7%), Cleaning & Maintenance (3,115 | 4.8%), Healthcare Support (2,361 | 3.6%), Security & Protection (1,146 | 1.8%), and Personal Care & Service (1,139 | 1.8%).
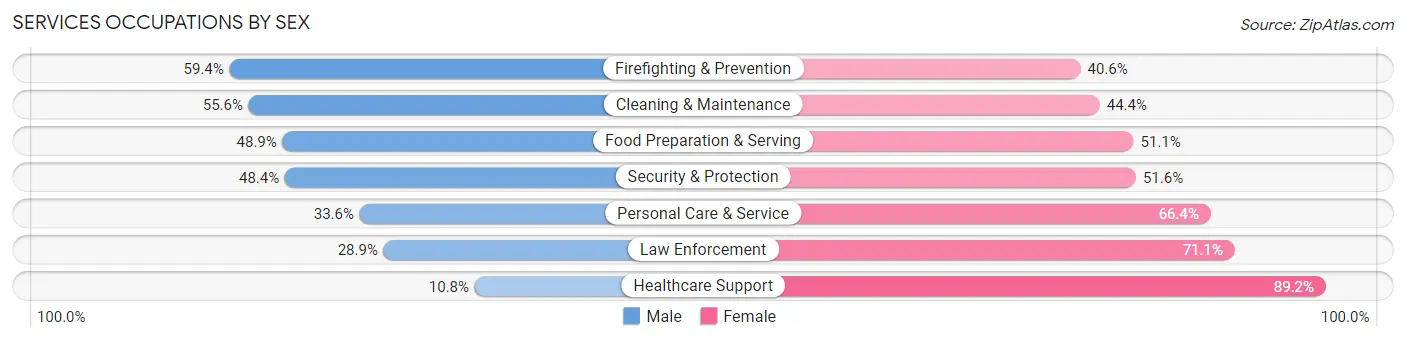
Services Occupations by Sex
Within the Services occupations in Macon Bibb County, the most male-oriented occupations are Firefighting & Prevention (59.4%), Cleaning & Maintenance (55.6%), and Food Preparation & Serving (48.9%), while the most female-oriented occupations are Healthcare Support (89.2%), Law Enforcement (71.1%), and Personal Care & Service (66.4%).
| Occupation | Male | Female |
| Healthcare Support | 256 (10.8%) | 2,105 (89.2%) |
| Security & Protection | 555 (48.4%) | 591 (51.6%) |
| Firefighting & Prevention | 436 (59.4%) | 298 (40.6%) |
| Law Enforcement | 119 (28.9%) | 293 (71.1%) |
| Food Preparation & Serving | 2,123 (48.9%) | 2,218 (51.1%) |
| Cleaning & Maintenance | 1,732 (55.6%) | 1,383 (44.4%) |
| Personal Care & Service | 383 (33.6%) | 756 (66.4%) |
| Total (Category) | 5,049 (41.7%) | 7,053 (58.3%) |
| Total (Overall) | 31,349 (48.3%) | 33,585 (51.7%) |
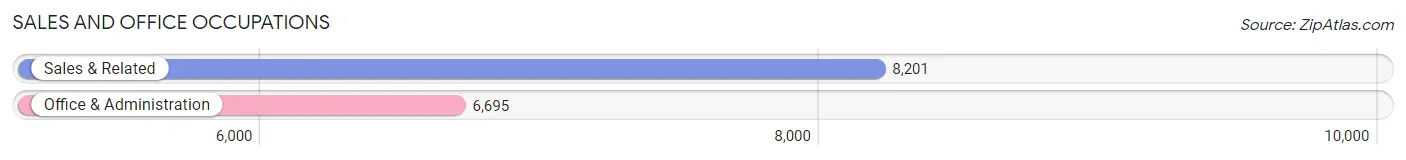
Sales and Office Occupations
The most common Sales and Office occupations in Macon Bibb County are Sales & Related (8,201 | 12.6%), and Office & Administration (6,695 | 10.3%).
Sales and Office Occupations by Sex
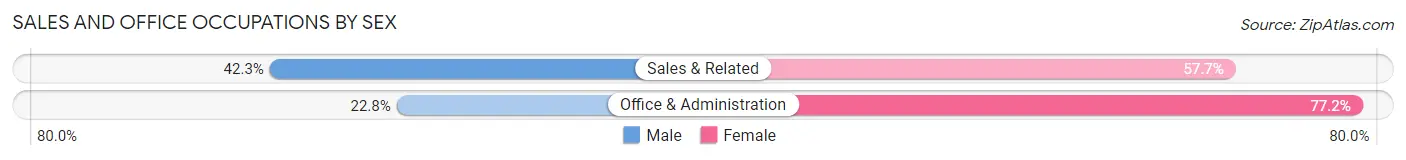
| Occupation | Male | Female |
| Sales & Related | 3,469 (42.3%) | 4,732 (57.7%) |
| Office & Administration | 1,525 (22.8%) | 5,170 (77.2%) |
| Total (Category) | 4,994 (33.5%) | 9,902 (66.5%) |
| Total (Overall) | 31,349 (48.3%) | 33,585 (51.7%) |
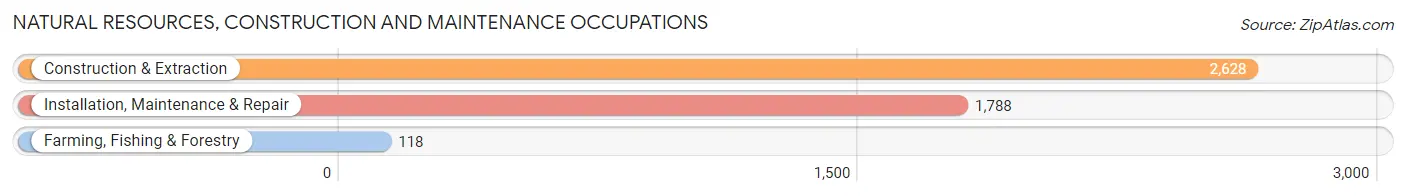
Natural Resources, Construction and Maintenance Occupations
The most common Natural Resources, Construction and Maintenance occupations in Macon Bibb County are Construction & Extraction (2,628 | 4.1%), Installation, Maintenance & Repair (1,788 | 2.8%), and Farming, Fishing & Forestry (118 | 0.2%).
Natural Resources, Construction and Maintenance Occupations by Sex
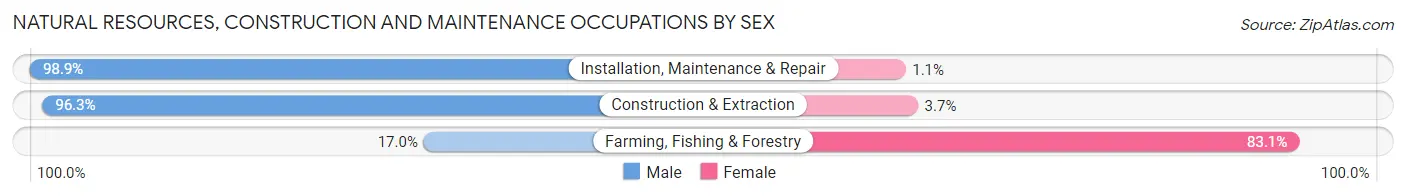
| Occupation | Male | Female |
| Farming, Fishing & Forestry | 20 (17.0%) | 98 (83.1%) |
| Construction & Extraction | 2,531 (96.3%) | 97 (3.7%) |
| Installation, Maintenance & Repair | 1,768 (98.9%) | 20 (1.1%) |
| Total (Category) | 4,319 (95.3%) | 215 (4.7%) |
| Total (Overall) | 31,349 (48.3%) | 33,585 (51.7%) |
Production, Transportation and Moving Occupations
The most common Production, Transportation and Moving occupations in Macon Bibb County are Production (3,676 | 5.7%), Material Moving (3,426 | 5.3%), and Transportation (2,789 | 4.3%).
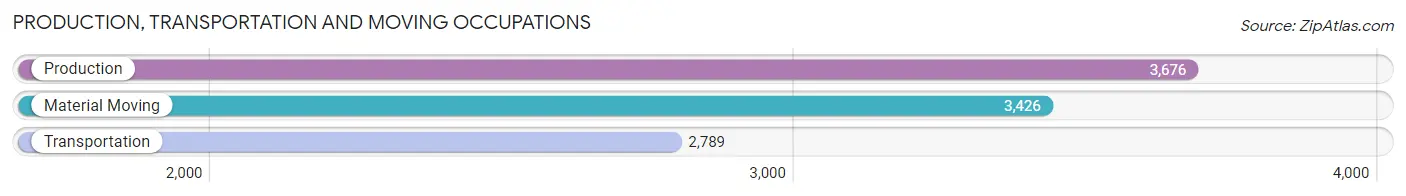
Production, Transportation and Moving Occupations by Sex
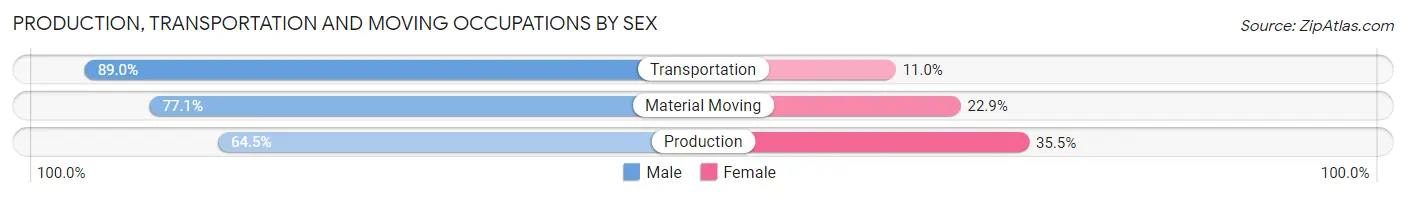
| Occupation | Male | Female |
| Production | 2,371 (64.5%) | 1,305 (35.5%) |
| Transportation | 2,481 (89.0%) | 308 (11.0%) |
| Material Moving | 2,640 (77.1%) | 786 (22.9%) |
| Total (Category) | 7,492 (75.7%) | 2,399 (24.2%) |
| Total (Overall) | 31,349 (48.3%) | 33,585 (51.7%) |
Employment Industries by Sex in Macon Bibb County
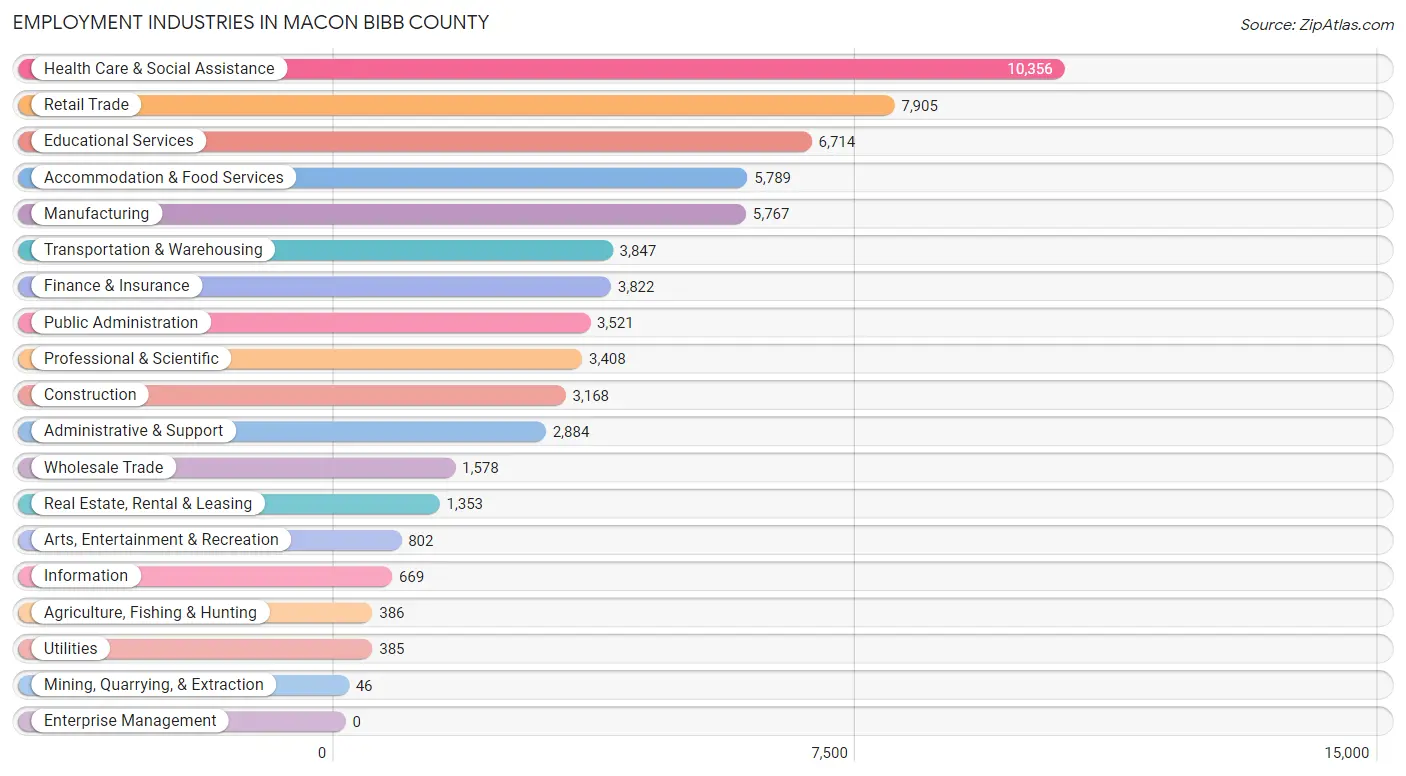
Employment Industries in Macon Bibb County
The major employment industries in Macon Bibb County include Health Care & Social Assistance (10,356 | 16.0%), Retail Trade (7,905 | 12.2%), Educational Services (6,714 | 10.3%), Accommodation & Food Services (5,789 | 8.9%), and Manufacturing (5,767 | 8.9%).
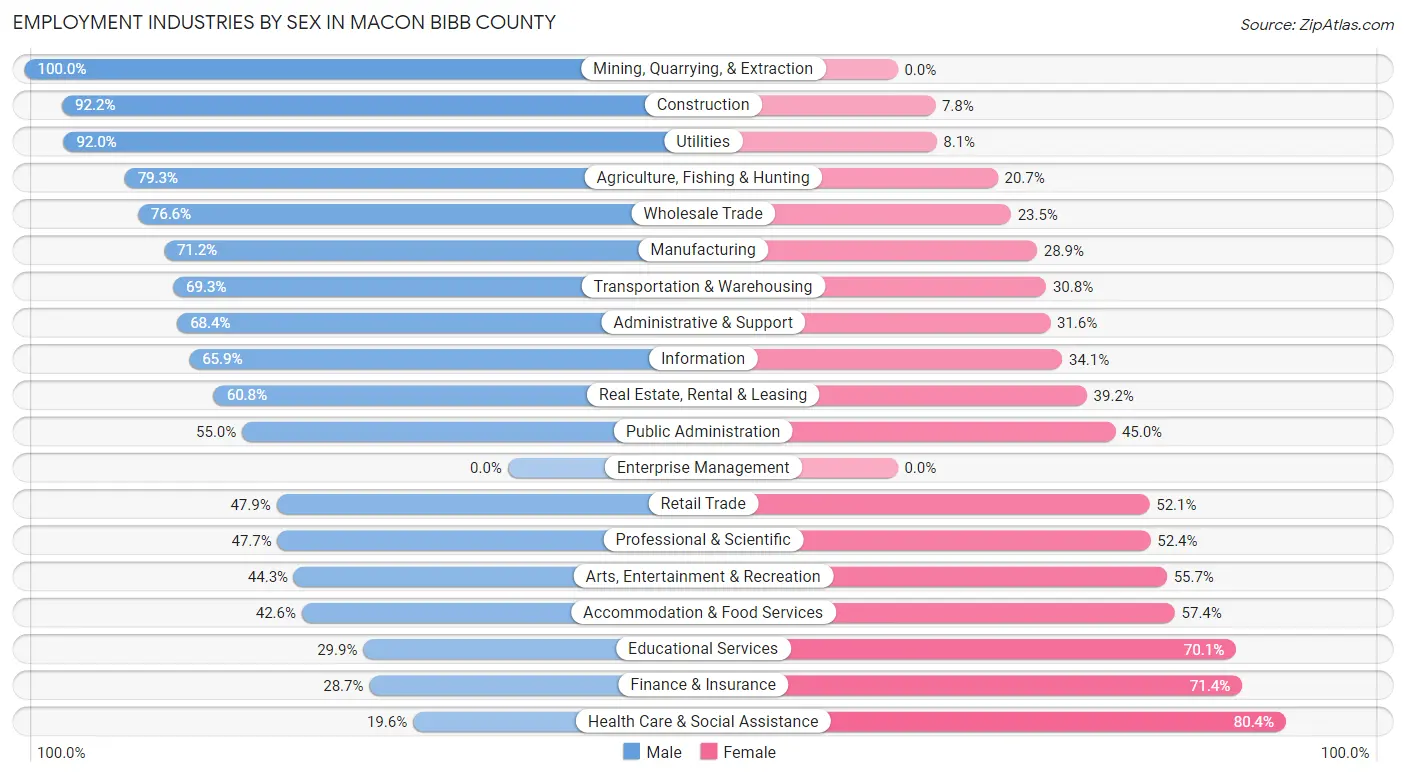
Employment Industries by Sex in Macon Bibb County
The Macon Bibb County industries that see more men than women are Mining, Quarrying, & Extraction (100.0%), Construction (92.2%), and Utilities (91.9%), whereas the industries that tend to have a higher number of women are Health Care & Social Assistance (80.4%), Finance & Insurance (71.4%), and Educational Services (70.1%).
| Industry | Male | Female |
| Agriculture, Fishing & Hunting | 306 (79.3%) | 80 (20.7%) |
| Mining, Quarrying, & Extraction | 46 (100.0%) | 0 (0.0%) |
| Construction | 2,922 (92.2%) | 246 (7.8%) |
| Manufacturing | 4,103 (71.2%) | 1,664 (28.8%) |
| Wholesale Trade | 1,208 (76.5%) | 370 (23.4%) |
| Retail Trade | 3,783 (47.9%) | 4,122 (52.1%) |
| Transportation & Warehousing | 2,664 (69.3%) | 1,183 (30.7%) |
| Utilities | 354 (91.9%) | 31 (8.1%) |
| Information | 441 (65.9%) | 228 (34.1%) |
| Finance & Insurance | 1,095 (28.6%) | 2,727 (71.4%) |
| Real Estate, Rental & Leasing | 823 (60.8%) | 530 (39.2%) |
| Professional & Scientific | 1,624 (47.6%) | 1,784 (52.3%) |
| Enterprise Management | 0 (0.0%) | 0 (0.0%) |
| Administrative & Support | 1,973 (68.4%) | 911 (31.6%) |
| Educational Services | 2,008 (29.9%) | 4,706 (70.1%) |
| Health Care & Social Assistance | 2,031 (19.6%) | 8,325 (80.4%) |
| Arts, Entertainment & Recreation | 355 (44.3%) | 447 (55.7%) |
| Accommodation & Food Services | 2,468 (42.6%) | 3,321 (57.4%) |
| Public Administration | 1,936 (55.0%) | 1,585 (45.0%) |
| Total | 31,349 (48.3%) | 33,585 (51.7%) |
Education in Macon Bibb County
School Enrollment in Macon Bibb County
The most common levels of schooling among the 39,861 students in Macon Bibb County are college / undergraduate (8,757 | 22.0%), middle school (8,608 | 21.6%), and elementary school (8,502 | 21.3%).
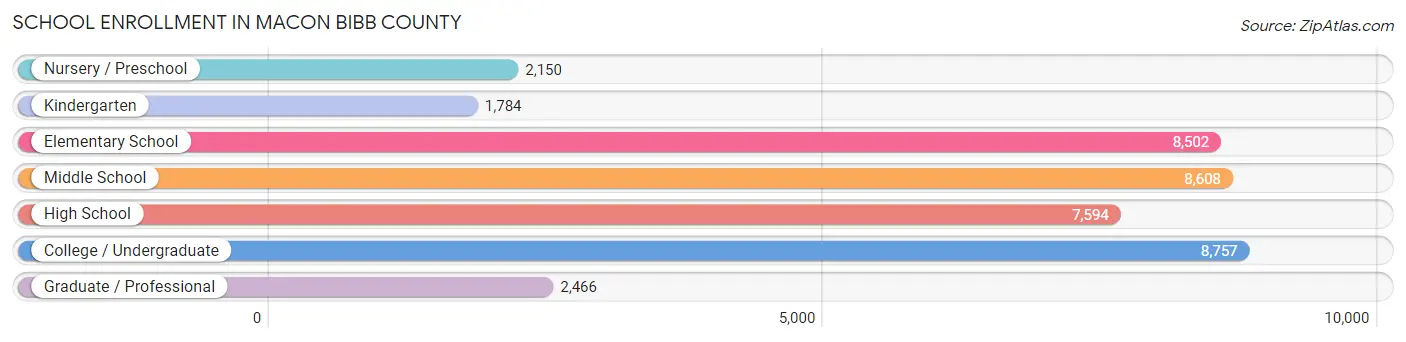
| School Level | # Students | % Students |
| Nursery / Preschool | 2,150 | 5.4% |
| Kindergarten | 1,784 | 4.5% |
| Elementary School | 8,502 | 21.3% |
| Middle School | 8,608 | 21.6% |
| High School | 7,594 | 19.1% |
| College / Undergraduate | 8,757 | 22.0% |
| Graduate / Professional | 2,466 | 6.2% |
| Total | 39,861 | 100.0% |
School Enrollment by Age by Funding Source in Macon Bibb County
Out of a total of 39,861 students who are enrolled in schools in Macon Bibb County, 9,646 (24.2%) attend a private institution, while the remaining 30,215 (75.8%) are enrolled in public schools. The age group of 18 to 19 year olds has the highest likelihood of being enrolled in private schools, with 1,468 (57.4% in the age bracket) enrolled. Conversely, the age group of 5 to 9 year old has the lowest likelihood of being enrolled in a private school, with 8,323 (87.2% in the age bracket) attending a public institution.
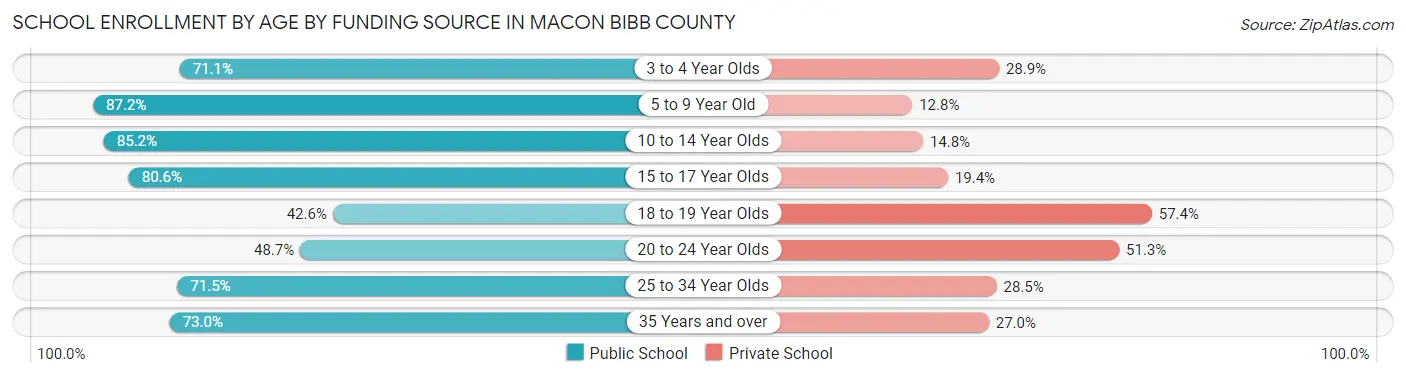
| Age Bracket | Public School | Private School |
| 3 to 4 Year Olds | 1,224 (71.1%) | 498 (28.9%) |
| 5 to 9 Year Old | 8,323 (87.2%) | 1,218 (12.8%) |
| 10 to 14 Year Olds | 9,099 (85.2%) | 1,577 (14.8%) |
| 15 to 17 Year Olds | 4,447 (80.6%) | 1,072 (19.4%) |
| 18 to 19 Year Olds | 1,090 (42.6%) | 1,468 (57.4%) |
| 20 to 24 Year Olds | 2,194 (48.7%) | 2,311 (51.3%) |
| 25 to 34 Year Olds | 1,962 (71.5%) | 781 (28.5%) |
| 35 Years and over | 1,895 (73.0%) | 702 (27.0%) |
| Total | 30,215 (75.8%) | 9,646 (24.2%) |
Educational Attainment by Field of Study in Macon Bibb County
Business (5,426 | 18.9%), education (3,904 | 13.6%), science & technology (3,032 | 10.6%), bio, nature & agricultural (2,271 | 7.9%), and arts & humanities (2,019 | 7.0%) are the most common fields of study among 28,706 individuals in Macon Bibb County who have obtained a bachelor's degree or higher.
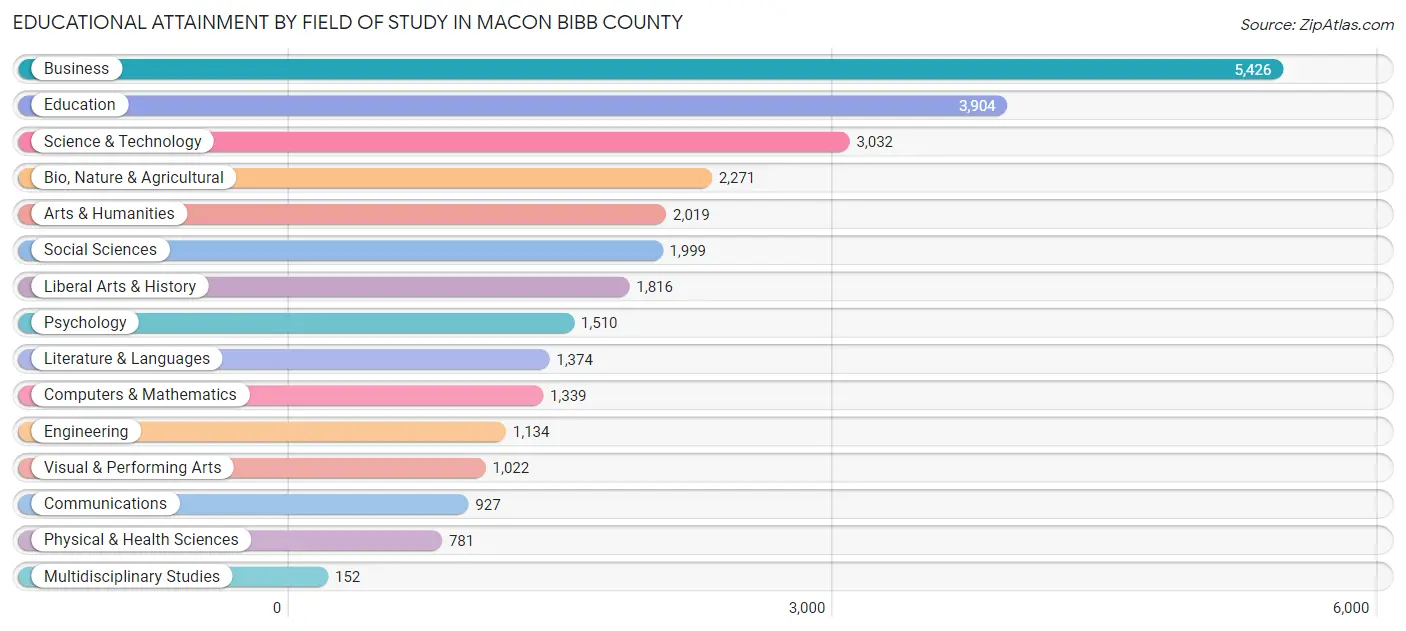
| Field of Study | # Graduates | % Graduates |
| Computers & Mathematics | 1,339 | 4.7% |
| Bio, Nature & Agricultural | 2,271 | 7.9% |
| Physical & Health Sciences | 781 | 2.7% |
| Psychology | 1,510 | 5.3% |
| Social Sciences | 1,999 | 7.0% |
| Engineering | 1,134 | 4.0% |
| Multidisciplinary Studies | 152 | 0.5% |
| Science & Technology | 3,032 | 10.6% |
| Business | 5,426 | 18.9% |
| Education | 3,904 | 13.6% |
| Literature & Languages | 1,374 | 4.8% |
| Liberal Arts & History | 1,816 | 6.3% |
| Visual & Performing Arts | 1,022 | 3.6% |
| Communications | 927 | 3.2% |
| Arts & Humanities | 2,019 | 7.0% |
| Total | 28,706 | 100.0% |
Transportation & Commute in Macon Bibb County
Vehicle Availability by Sex in Macon Bibb County
The most prevalent vehicle ownership categories in Macon Bibb County are males with 2 vehicles (12,842, accounting for 41.9%) and females with 2 vehicles (12,371, making up 40.2%).
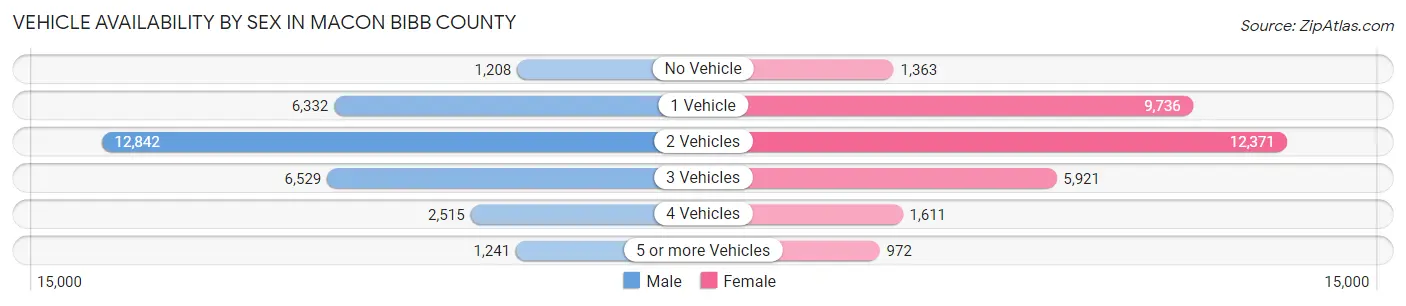
| Vehicles Available | Male | Female |
| No Vehicle | 1,208 (3.9%) | 1,363 (4.3%) |
| 1 Vehicle | 6,332 (20.6%) | 9,736 (30.4%) |
| 2 Vehicles | 12,842 (41.9%) | 12,371 (38.7%) |
| 3 Vehicles | 6,529 (21.3%) | 5,921 (18.5%) |
| 4 Vehicles | 2,515 (8.2%) | 1,611 (5.0%) |
| 5 or more Vehicles | 1,241 (4.1%) | 972 (3.0%) |
| Total | 30,667 (100.0%) | 31,974 (100.0%) |
Commute Time in Macon Bibb County
The most frequently occuring commute durations in Macon Bibb County are 15 to 19 minutes (12,617 commuters, 21.2%), 20 to 24 minutes (11,570 commuters, 19.4%), and 10 to 14 minutes (9,382 commuters, 15.7%).
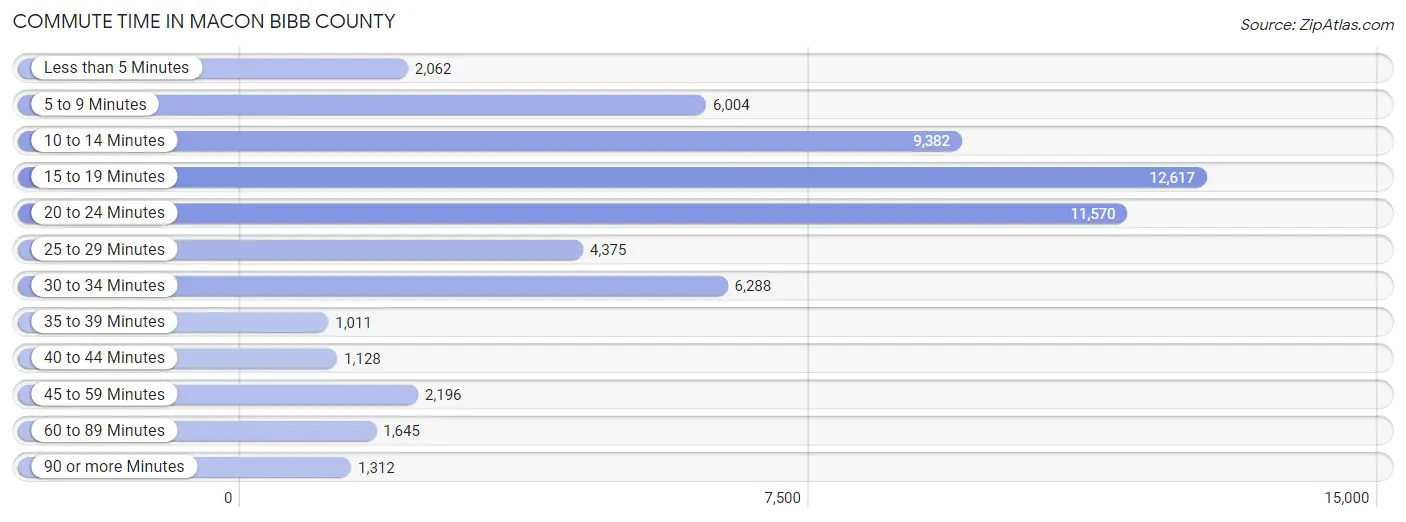
| Commute Time | # Commuters | % Commuters |
| Less than 5 Minutes | 2,062 | 3.5% |
| 5 to 9 Minutes | 6,004 | 10.1% |
| 10 to 14 Minutes | 9,382 | 15.7% |
| 15 to 19 Minutes | 12,617 | 21.2% |
| 20 to 24 Minutes | 11,570 | 19.4% |
| 25 to 29 Minutes | 4,375 | 7.3% |
| 30 to 34 Minutes | 6,288 | 10.5% |
| 35 to 39 Minutes | 1,011 | 1.7% |
| 40 to 44 Minutes | 1,128 | 1.9% |
| 45 to 59 Minutes | 2,196 | 3.7% |
| 60 to 89 Minutes | 1,645 | 2.8% |
| 90 or more Minutes | 1,312 | 2.2% |
Commute Time by Sex in Macon Bibb County
The most common commute times in Macon Bibb County are 15 to 19 minutes (5,855 commuters, 19.8%) for males and 15 to 19 minutes (6,762 commuters, 22.6%) for females.
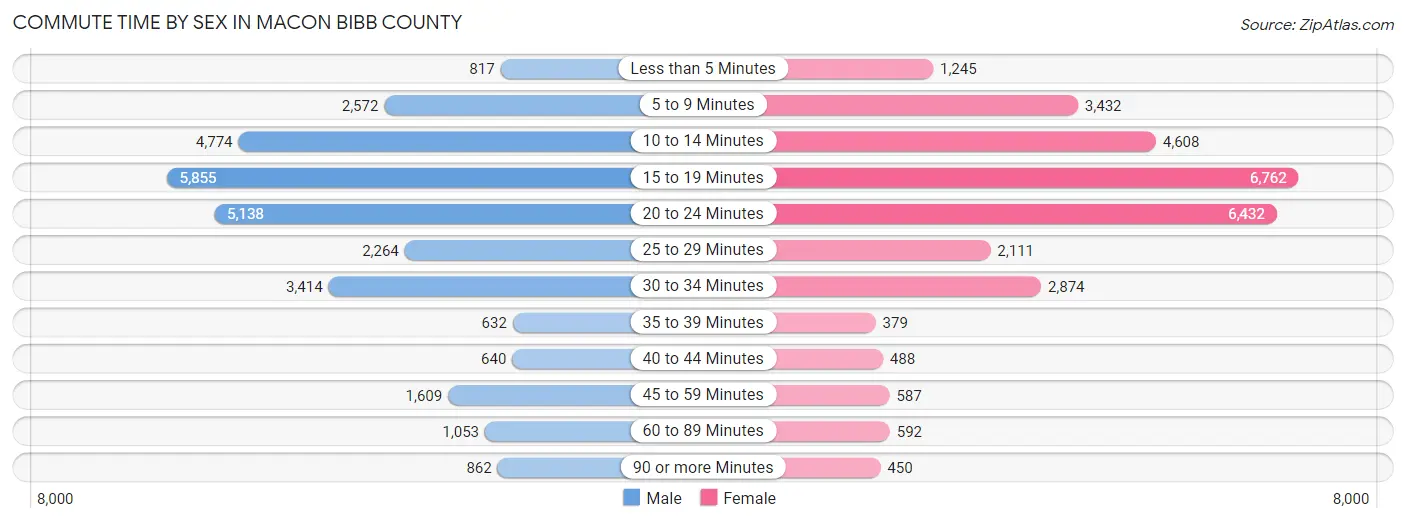
| Commute Time | Male | Female |
| Less than 5 Minutes | 817 (2.8%) | 1,245 (4.2%) |
| 5 to 9 Minutes | 2,572 (8.7%) | 3,432 (11.5%) |
| 10 to 14 Minutes | 4,774 (16.1%) | 4,608 (15.4%) |
| 15 to 19 Minutes | 5,855 (19.8%) | 6,762 (22.6%) |
| 20 to 24 Minutes | 5,138 (17.3%) | 6,432 (21.5%) |
| 25 to 29 Minutes | 2,264 (7.6%) | 2,111 (7.0%) |
| 30 to 34 Minutes | 3,414 (11.5%) | 2,874 (9.6%) |
| 35 to 39 Minutes | 632 (2.1%) | 379 (1.3%) |
| 40 to 44 Minutes | 640 (2.2%) | 488 (1.6%) |
| 45 to 59 Minutes | 1,609 (5.4%) | 587 (2.0%) |
| 60 to 89 Minutes | 1,053 (3.5%) | 592 (2.0%) |
| 90 or more Minutes | 862 (2.9%) | 450 (1.5%) |
Time of Departure to Work by Sex in Macon Bibb County
The most frequent times of departure to work in Macon Bibb County are 7:00 AM to 7:29 AM (4,276, 14.4%) for males and 8:00 AM to 8:29 AM (4,473, 14.9%) for females.
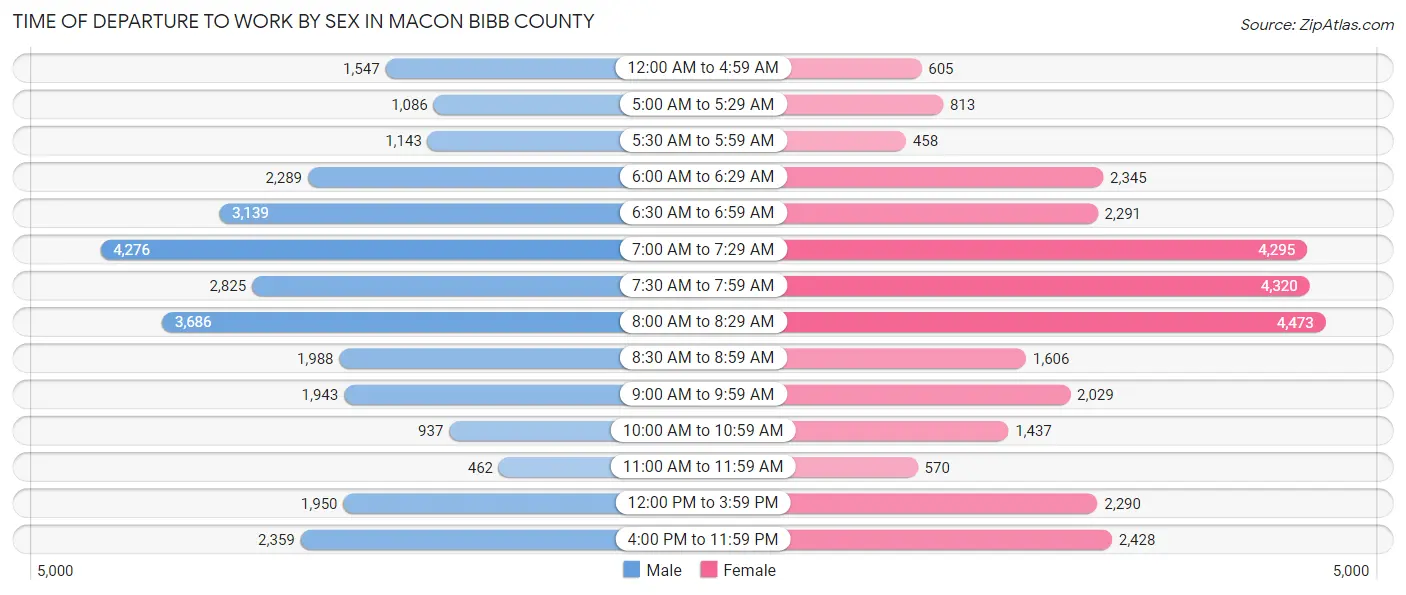
| Time of Departure | Male | Female |
| 12:00 AM to 4:59 AM | 1,547 (5.2%) | 605 (2.0%) |
| 5:00 AM to 5:29 AM | 1,086 (3.7%) | 813 (2.7%) |
| 5:30 AM to 5:59 AM | 1,143 (3.9%) | 458 (1.5%) |
| 6:00 AM to 6:29 AM | 2,289 (7.7%) | 2,345 (7.8%) |
| 6:30 AM to 6:59 AM | 3,139 (10.6%) | 2,291 (7.6%) |
| 7:00 AM to 7:29 AM | 4,276 (14.4%) | 4,295 (14.3%) |
| 7:30 AM to 7:59 AM | 2,825 (9.5%) | 4,320 (14.4%) |
| 8:00 AM to 8:29 AM | 3,686 (12.4%) | 4,473 (14.9%) |
| 8:30 AM to 8:59 AM | 1,988 (6.7%) | 1,606 (5.4%) |
| 9:00 AM to 9:59 AM | 1,943 (6.6%) | 2,029 (6.8%) |
| 10:00 AM to 10:59 AM | 937 (3.2%) | 1,437 (4.8%) |
| 11:00 AM to 11:59 AM | 462 (1.6%) | 570 (1.9%) |
| 12:00 PM to 3:59 PM | 1,950 (6.6%) | 2,290 (7.6%) |
| 4:00 PM to 11:59 PM | 2,359 (8.0%) | 2,428 (8.1%) |
| Total | 29,630 (100.0%) | 29,960 (100.0%) |
Housing Occupancy in Macon Bibb County
Occupancy by Ownership in Macon Bibb County
Of the total 59,480 dwellings in Macon Bibb County, owner-occupied units account for 31,315 (52.6%), while renter-occupied units make up 28,165 (47.3%).
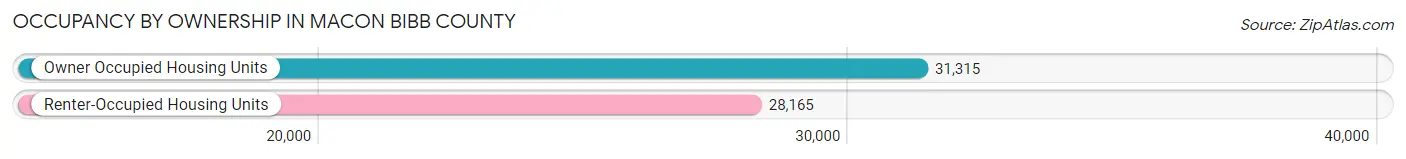
| Occupancy | # Housing Units | % Housing Units |
| Owner Occupied Housing Units | 31,315 | 52.6% |
| Renter-Occupied Housing Units | 28,165 | 47.3% |
| Total Occupied Housing Units | 59,480 | 100.0% |
Occupancy by Household Size in Macon Bibb County
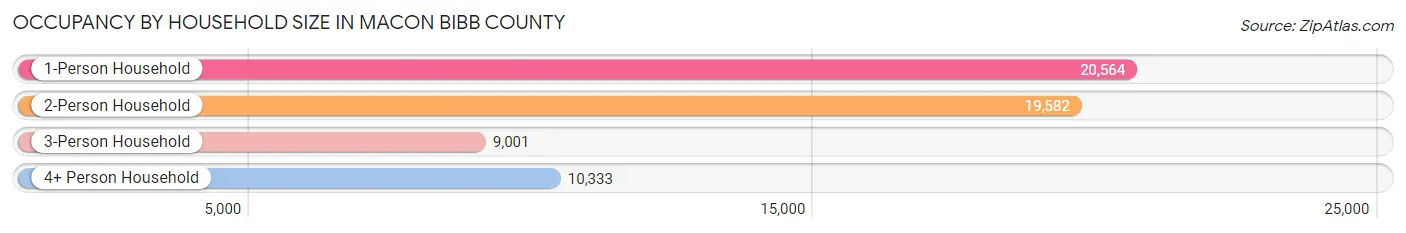
| Household Size | # Housing Units | % Housing Units |
| 1-Person Household | 20,564 | 34.6% |
| 2-Person Household | 19,582 | 32.9% |
| 3-Person Household | 9,001 | 15.1% |
| 4+ Person Household | 10,333 | 17.4% |
| Total Housing Units | 59,480 | 100.0% |
Occupancy by Ownership by Household Size in Macon Bibb County
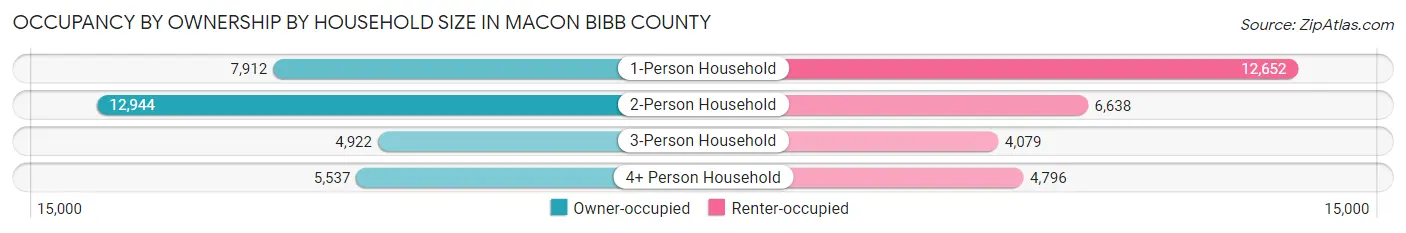
| Household Size | Owner-occupied | Renter-occupied |
| 1-Person Household | 7,912 (38.5%) | 12,652 (61.5%) |
| 2-Person Household | 12,944 (66.1%) | 6,638 (33.9%) |
| 3-Person Household | 4,922 (54.7%) | 4,079 (45.3%) |
| 4+ Person Household | 5,537 (53.6%) | 4,796 (46.4%) |
| Total Housing Units | 31,315 (52.6%) | 28,165 (47.3%) |
Occupancy by Educational Attainment in Macon Bibb County
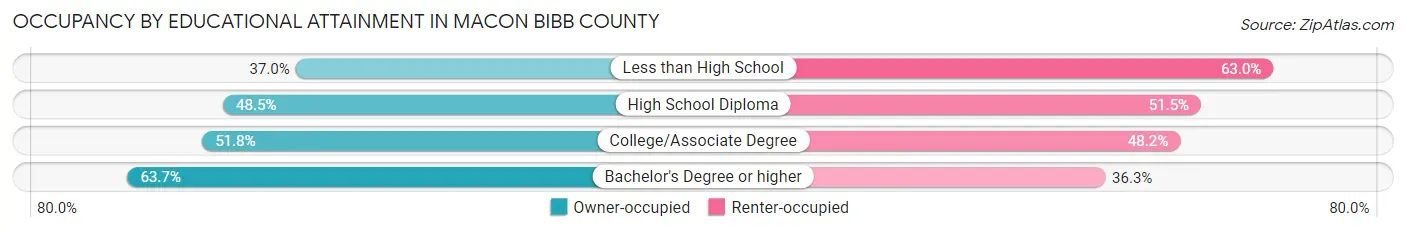
| Household Size | Owner-occupied | Renter-occupied |
| Less than High School | 2,561 (37.0%) | 4,355 (63.0%) |
| High School Diploma | 7,905 (48.5%) | 8,393 (51.5%) |
| College/Associate Degree | 9,817 (51.8%) | 9,126 (48.2%) |
| Bachelor's Degree or higher | 11,032 (63.7%) | 6,291 (36.3%) |
Occupancy by Age of Householder in Macon Bibb County
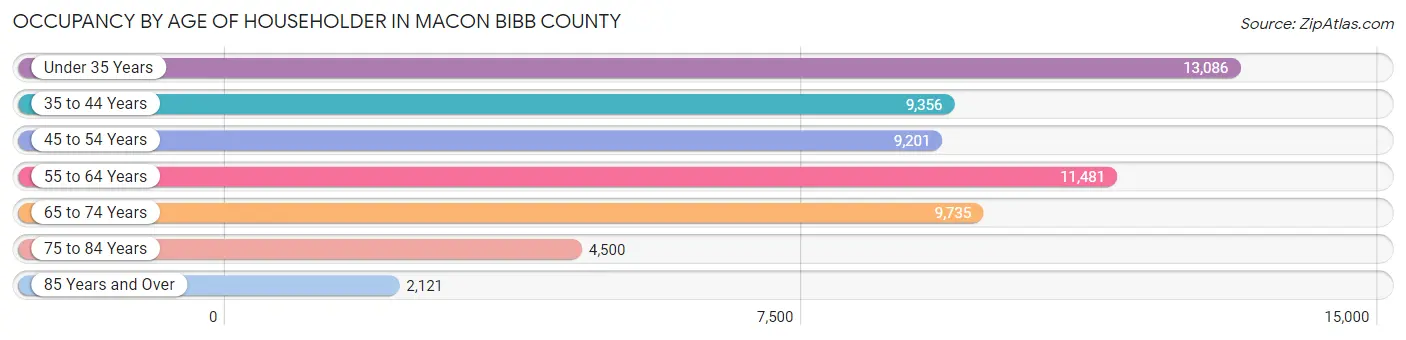
| Age Bracket | # Households | % Households |
| Under 35 Years | 13,086 | 22.0% |
| 35 to 44 Years | 9,356 | 15.7% |
| 45 to 54 Years | 9,201 | 15.5% |
| 55 to 64 Years | 11,481 | 19.3% |
| 65 to 74 Years | 9,735 | 16.4% |
| 75 to 84 Years | 4,500 | 7.6% |
| 85 Years and Over | 2,121 | 3.6% |
| Total | 59,480 | 100.0% |
Housing Finances in Macon Bibb County
Median Income by Occupancy in Macon Bibb County
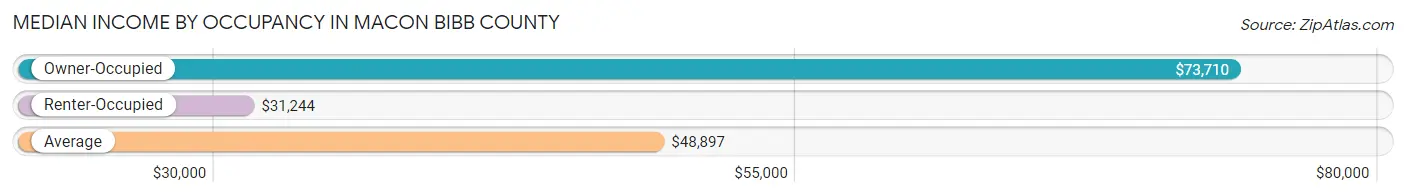
| Occupancy Type | # Households | Median Income |
| Owner-Occupied | 31,315 (52.6%) | $73,710 |
| Renter-Occupied | 28,165 (47.3%) | $31,244 |
| Average | 59,480 (100.0%) | $48,897 |
Occupancy by Householder Income Bracket in Macon Bibb County
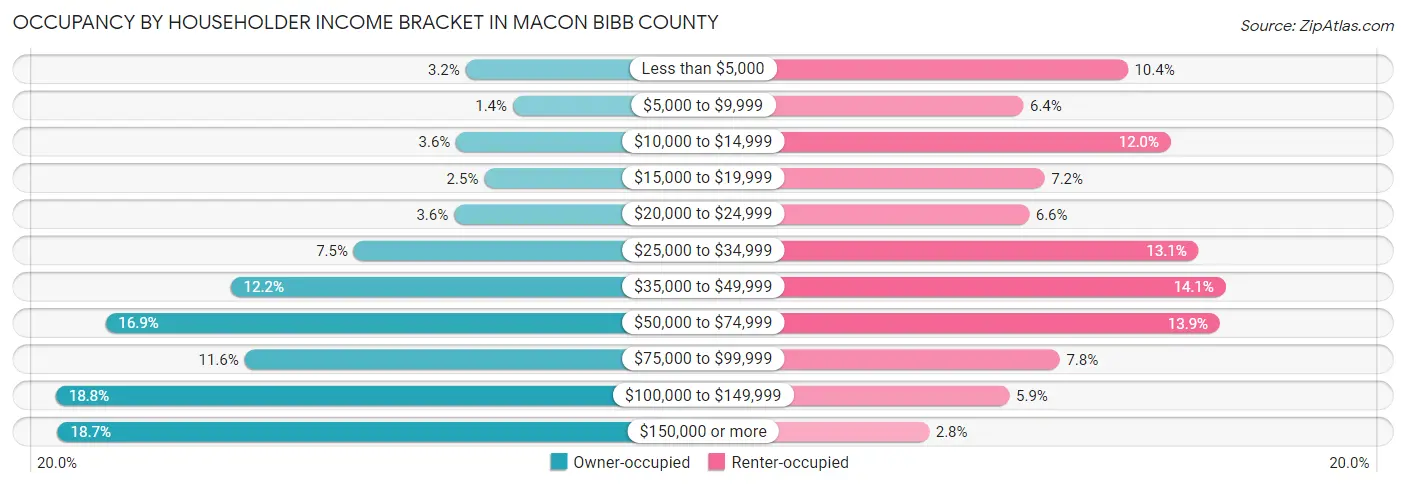
| Income Bracket | Owner-occupied | Renter-occupied |
| Less than $5,000 | 1,003 (3.2%) | 2,918 (10.4%) |
| $5,000 to $9,999 | 439 (1.4%) | 1,797 (6.4%) |
| $10,000 to $14,999 | 1,115 (3.6%) | 3,384 (12.0%) |
| $15,000 to $19,999 | 779 (2.5%) | 2,024 (7.2%) |
| $20,000 to $24,999 | 1,141 (3.6%) | 1,859 (6.6%) |
| $25,000 to $34,999 | 2,336 (7.5%) | 3,681 (13.1%) |
| $35,000 to $49,999 | 3,806 (12.1%) | 3,970 (14.1%) |
| $50,000 to $74,999 | 5,299 (16.9%) | 3,909 (13.9%) |
| $75,000 to $99,999 | 3,639 (11.6%) | 2,189 (7.8%) |
| $100,000 to $149,999 | 5,889 (18.8%) | 1,647 (5.9%) |
| $150,000 or more | 5,869 (18.7%) | 787 (2.8%) |
| Total | 31,315 (100.0%) | 28,165 (100.0%) |
Monthly Housing Cost Tiers in Macon Bibb County
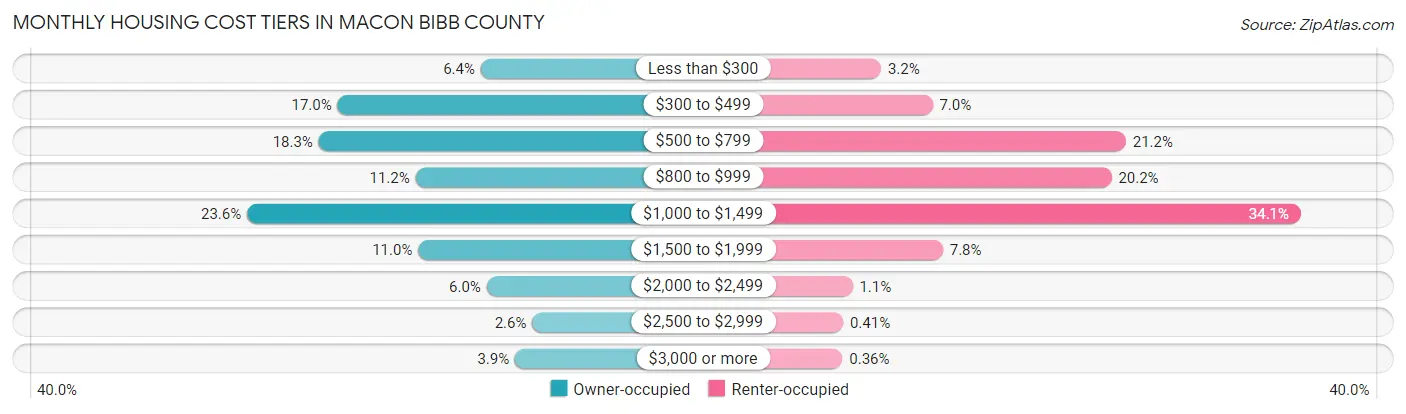
| Monthly Cost | Owner-occupied | Renter-occupied |
| Less than $300 | 2,005 (6.4%) | 903 (3.2%) |
| $300 to $499 | 5,307 (17.0%) | 1,971 (7.0%) |
| $500 to $799 | 5,743 (18.3%) | 5,981 (21.2%) |
| $800 to $999 | 3,511 (11.2%) | 5,684 (20.2%) |
| $1,000 to $1,499 | 7,397 (23.6%) | 9,613 (34.1%) |
| $1,500 to $1,999 | 3,449 (11.0%) | 2,185 (7.8%) |
| $2,000 to $2,499 | 1,869 (6.0%) | 314 (1.1%) |
| $2,500 to $2,999 | 818 (2.6%) | 115 (0.4%) |
| $3,000 or more | 1,216 (3.9%) | 102 (0.4%) |
| Total | 31,315 (100.0%) | 28,165 (100.0%) |
Physical Housing Characteristics in Macon Bibb County
Housing Structures in Macon Bibb County
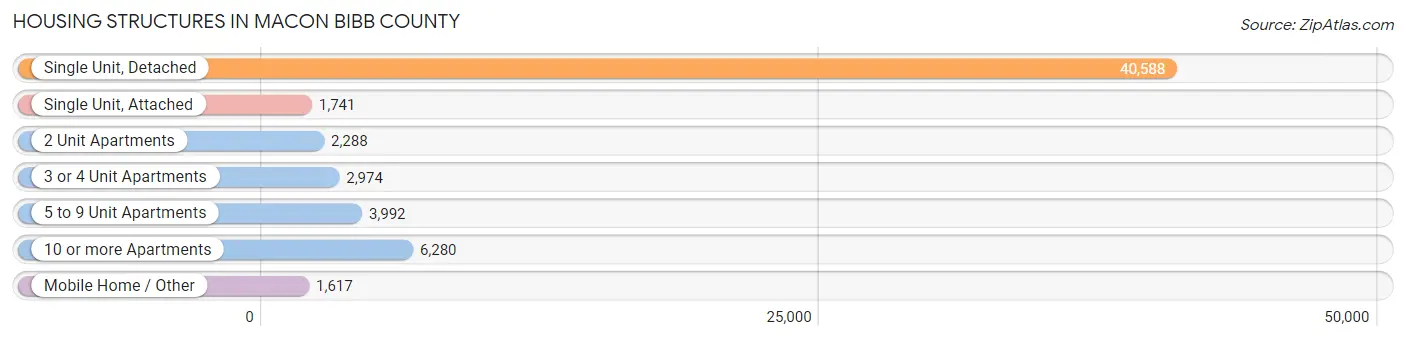
| Structure Type | # Housing Units | % Housing Units |
| Single Unit, Detached | 40,588 | 68.2% |
| Single Unit, Attached | 1,741 | 2.9% |
| 2 Unit Apartments | 2,288 | 3.8% |
| 3 or 4 Unit Apartments | 2,974 | 5.0% |
| 5 to 9 Unit Apartments | 3,992 | 6.7% |
| 10 or more Apartments | 6,280 | 10.6% |
| Mobile Home / Other | 1,617 | 2.7% |
| Total | 59,480 | 100.0% |
Housing Structures by Occupancy in Macon Bibb County
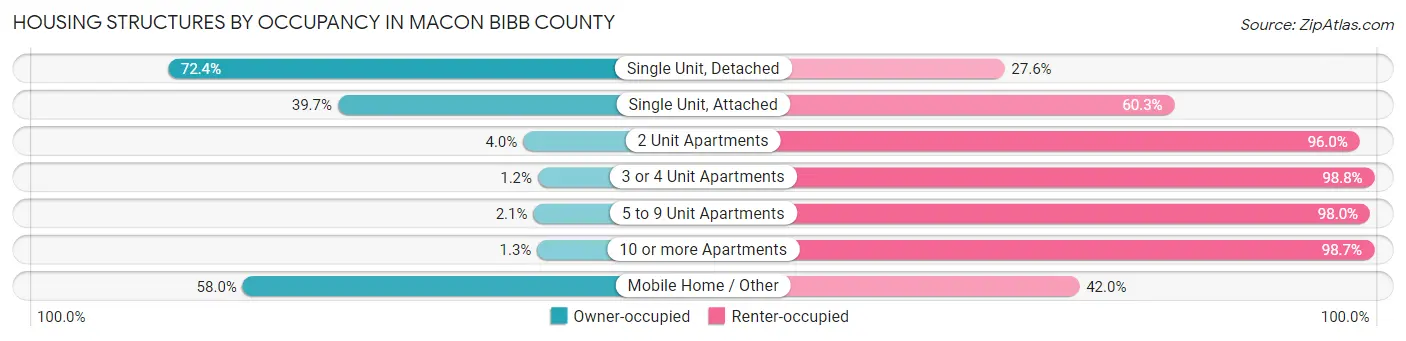
| Structure Type | Owner-occupied | Renter-occupied |
| Single Unit, Detached | 29,395 (72.4%) | 11,193 (27.6%) |
| Single Unit, Attached | 691 (39.7%) | 1,050 (60.3%) |
| 2 Unit Apartments | 92 (4.0%) | 2,196 (96.0%) |
| 3 or 4 Unit Apartments | 35 (1.2%) | 2,939 (98.8%) |
| 5 to 9 Unit Apartments | 82 (2.1%) | 3,910 (98.0%) |
| 10 or more Apartments | 82 (1.3%) | 6,198 (98.7%) |
| Mobile Home / Other | 938 (58.0%) | 679 (42.0%) |
| Total | 31,315 (52.6%) | 28,165 (47.3%) |
Housing Structures by Number of Rooms in Macon Bibb County
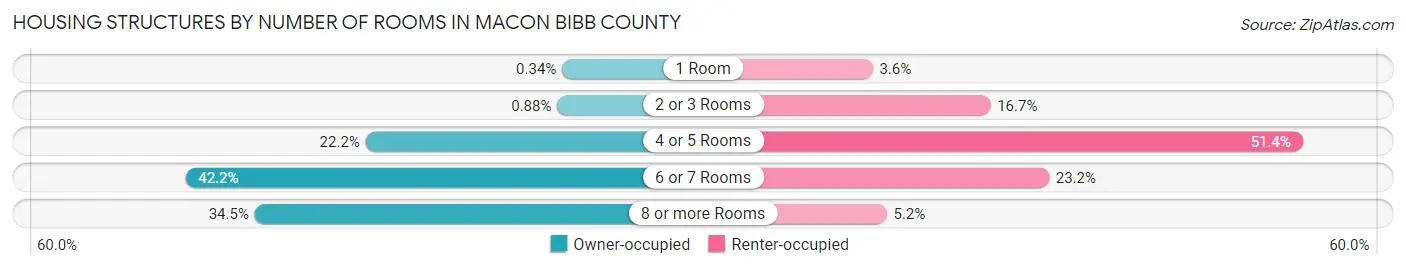
| Number of Rooms | Owner-occupied | Renter-occupied |
| 1 Room | 108 (0.3%) | 1,016 (3.6%) |
| 2 or 3 Rooms | 277 (0.9%) | 4,698 (16.7%) |
| 4 or 5 Rooms | 6,936 (22.2%) | 14,466 (51.4%) |
| 6 or 7 Rooms | 13,203 (42.2%) | 6,528 (23.2%) |
| 8 or more Rooms | 10,791 (34.5%) | 1,457 (5.2%) |
| Total | 31,315 (100.0%) | 28,165 (100.0%) |
Housing Structure by Heating Type in Macon Bibb County
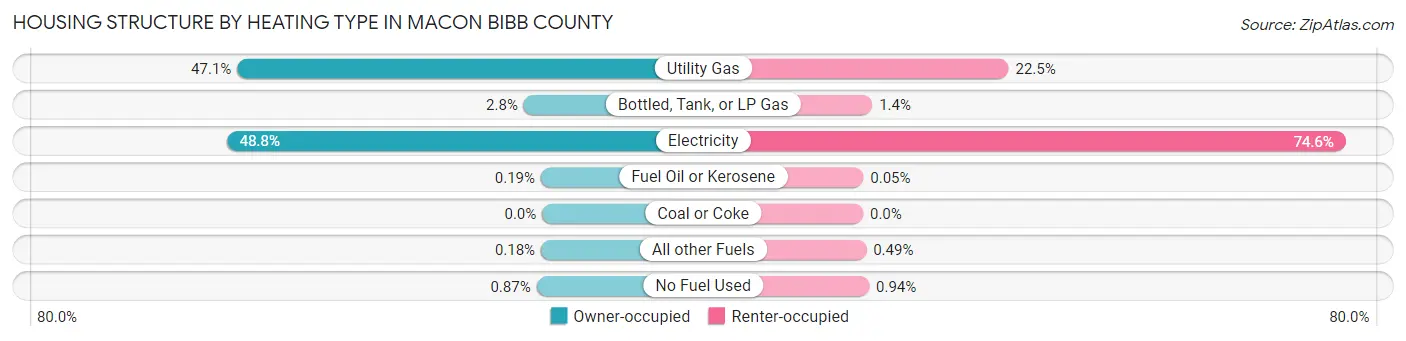
| Heating Type | Owner-occupied | Renter-occupied |
| Utility Gas | 14,763 (47.1%) | 6,334 (22.5%) |
| Bottled, Tank, or LP Gas | 890 (2.8%) | 399 (1.4%) |
| Electricity | 15,274 (48.8%) | 21,015 (74.6%) |
| Fuel Oil or Kerosene | 60 (0.2%) | 13 (0.1%) |
| Coal or Coke | 0 (0.0%) | 0 (0.0%) |
| All other Fuels | 56 (0.2%) | 138 (0.5%) |
| No Fuel Used | 272 (0.9%) | 266 (0.9%) |
| Total | 31,315 (100.0%) | 28,165 (100.0%) |
Household Vehicle Usage in Macon Bibb County
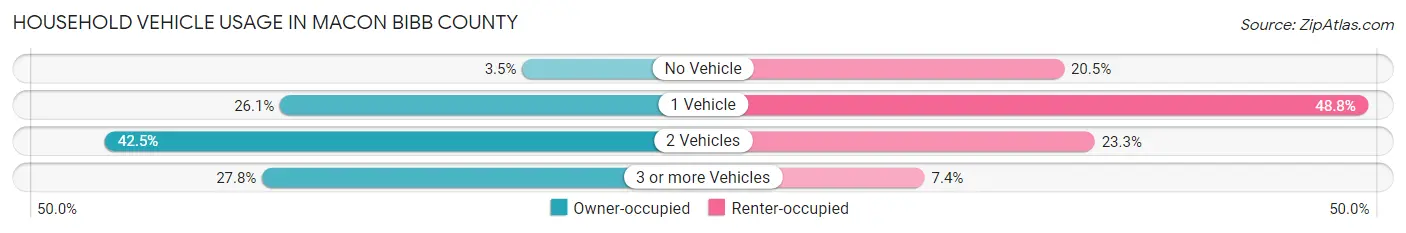
| Vehicles per Household | Owner-occupied | Renter-occupied |
| No Vehicle | 1,107 (3.5%) | 5,760 (20.4%) |
| 1 Vehicle | 8,187 (26.1%) | 13,742 (48.8%) |
| 2 Vehicles | 13,308 (42.5%) | 6,568 (23.3%) |
| 3 or more Vehicles | 8,713 (27.8%) | 2,095 (7.4%) |
| Total | 31,315 (100.0%) | 28,165 (100.0%) |
Real Estate & Mortgages in Macon Bibb County
Real Estate and Mortgage Overview in Macon Bibb County
| Characteristic | Without Mortgage | With Mortgage |
| Housing Units | 13,292 | 18,023 |
| Median Property Value | $134,300 | $165,200 |
| Median Household Income | $52,930 | $3,964 |
| Monthly Housing Costs | $484 | $1,180 |
| Real Estate Taxes | $1,388 | $396 |
Property Value by Mortgage Status in Macon Bibb County
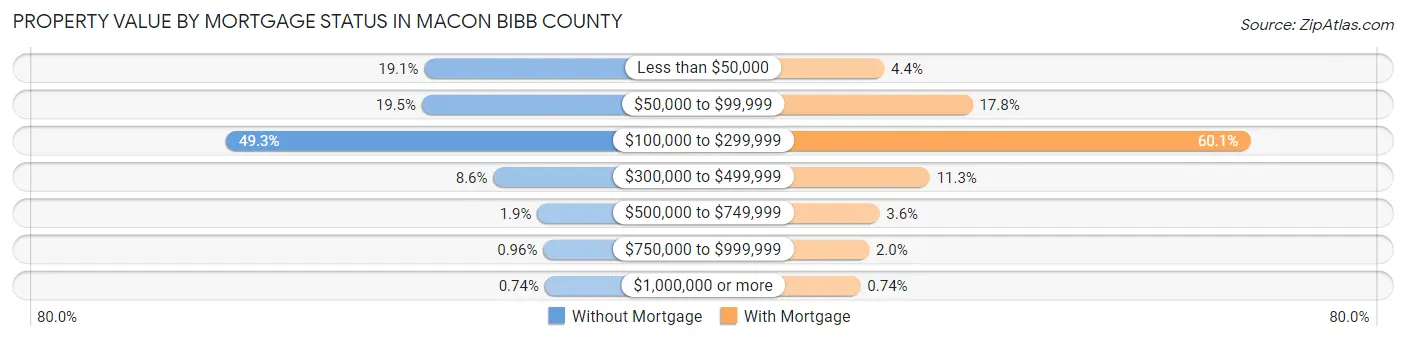
| Property Value | Without Mortgage | With Mortgage |
| Less than $50,000 | 2,538 (19.1%) | 786 (4.4%) |
| $50,000 to $99,999 | 2,588 (19.5%) | 3,212 (17.8%) |
| $100,000 to $299,999 | 6,552 (49.3%) | 10,834 (60.1%) |
| $300,000 to $499,999 | 1,139 (8.6%) | 2,036 (11.3%) |
| $500,000 to $749,999 | 248 (1.9%) | 655 (3.6%) |
| $750,000 to $999,999 | 128 (1.0%) | 367 (2.0%) |
| $1,000,000 or more | 99 (0.7%) | 133 (0.7%) |
| Total | 13,292 (100.0%) | 18,023 (100.0%) |
Household Income by Mortgage Status in Macon Bibb County
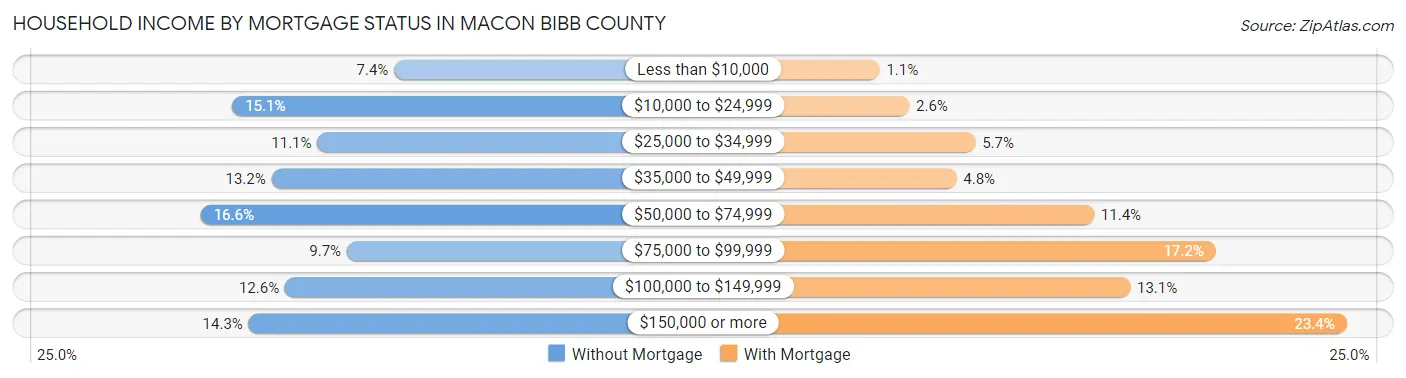
| Household Income | Without Mortgage | With Mortgage |
| Less than $10,000 | 983 (7.4%) | 205 (1.1%) |
| $10,000 to $24,999 | 2,008 (15.1%) | 459 (2.5%) |
| $25,000 to $34,999 | 1,470 (11.1%) | 1,027 (5.7%) |
| $35,000 to $49,999 | 1,760 (13.2%) | 866 (4.8%) |
| $50,000 to $74,999 | 2,208 (16.6%) | 2,046 (11.4%) |
| $75,000 to $99,999 | 1,283 (9.7%) | 3,091 (17.2%) |
| $100,000 to $149,999 | 1,675 (12.6%) | 2,356 (13.1%) |
| $150,000 or more | 1,905 (14.3%) | 4,214 (23.4%) |
| Total | 13,292 (100.0%) | 18,023 (100.0%) |
Property Value to Household Income Ratio in Macon Bibb County
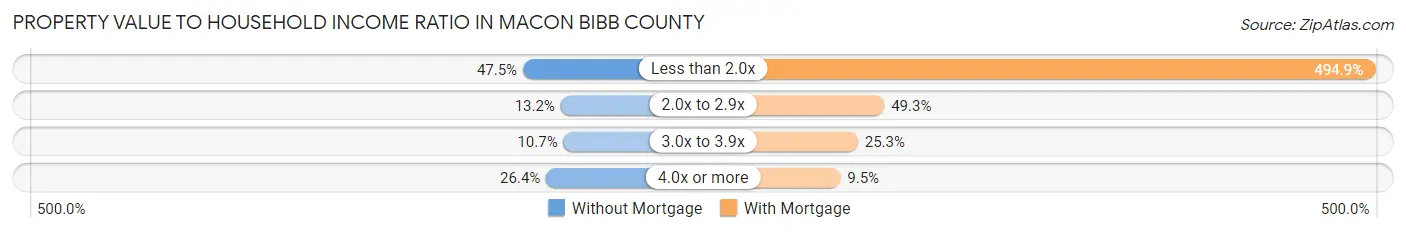
| Value-to-Income Ratio | Without Mortgage | With Mortgage |
| Less than 2.0x | 6,310 (47.5%) | 89,199 (494.9%) |
| 2.0x to 2.9x | 1,752 (13.2%) | 8,891 (49.3%) |
| 3.0x to 3.9x | 1,418 (10.7%) | 4,561 (25.3%) |
| 4.0x or more | 3,507 (26.4%) | 1,703 (9.5%) |
| Total | 13,292 (100.0%) | 18,023 (100.0%) |
Real Estate Taxes by Mortgage Status in Macon Bibb County
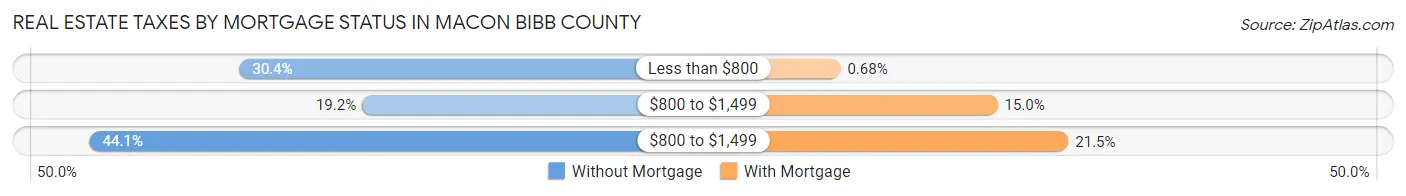
| Property Taxes | Without Mortgage | With Mortgage |
| Less than $800 | 4,040 (30.4%) | 122 (0.7%) |
| $800 to $1,499 | 2,551 (19.2%) | 2,707 (15.0%) |
| $800 to $1,499 | 5,856 (44.1%) | 3,874 (21.5%) |
| Total | 13,292 (100.0%) | 18,023 (100.0%) |
Health & Disability in Macon Bibb County
Health Insurance Coverage by Age in Macon Bibb County
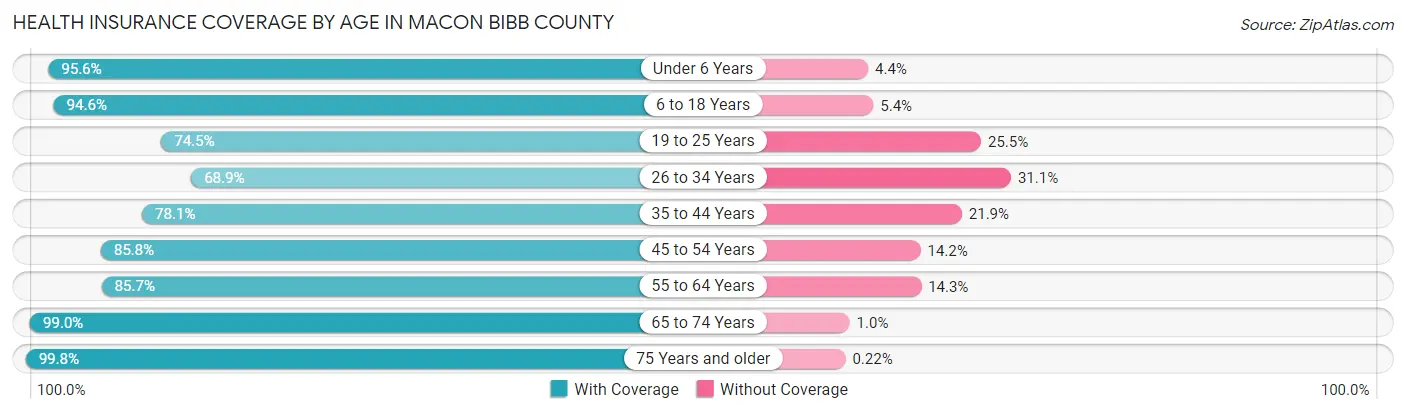
| Age Bracket | With Coverage | Without Coverage |
| Under 6 Years | 11,431 (95.6%) | 531 (4.4%) |
| 6 to 18 Years | 26,586 (94.6%) | 1,524 (5.4%) |
| 19 to 25 Years | 11,116 (74.5%) | 3,805 (25.5%) |
| 26 to 34 Years | 13,615 (68.9%) | 6,140 (31.1%) |
| 35 to 44 Years | 13,727 (78.1%) | 3,854 (21.9%) |
| 45 to 54 Years | 15,139 (85.8%) | 2,509 (14.2%) |
| 55 to 64 Years | 16,301 (85.7%) | 2,728 (14.3%) |
| 65 to 74 Years | 14,571 (99.0%) | 147 (1.0%) |
| 75 Years and older | 9,583 (99.8%) | 21 (0.2%) |
| Total | 132,069 (86.1%) | 21,259 (13.9%) |
Health Insurance Coverage by Citizenship Status in Macon Bibb County
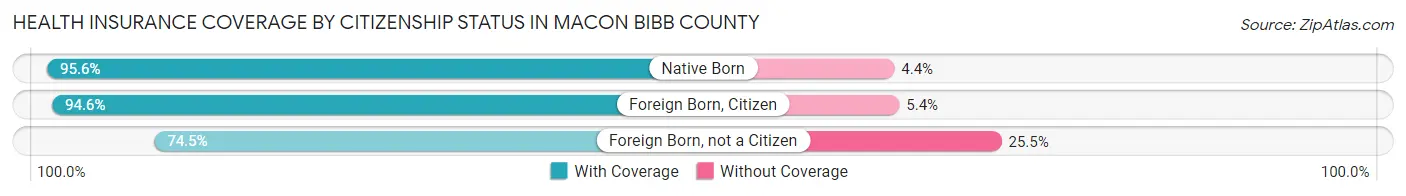
| Citizenship Status | With Coverage | Without Coverage |
| Native Born | 11,431 (95.6%) | 531 (4.4%) |
| Foreign Born, Citizen | 26,586 (94.6%) | 1,524 (5.4%) |
| Foreign Born, not a Citizen | 11,116 (74.5%) | 3,805 (25.5%) |
Health Insurance Coverage by Household Income in Macon Bibb County
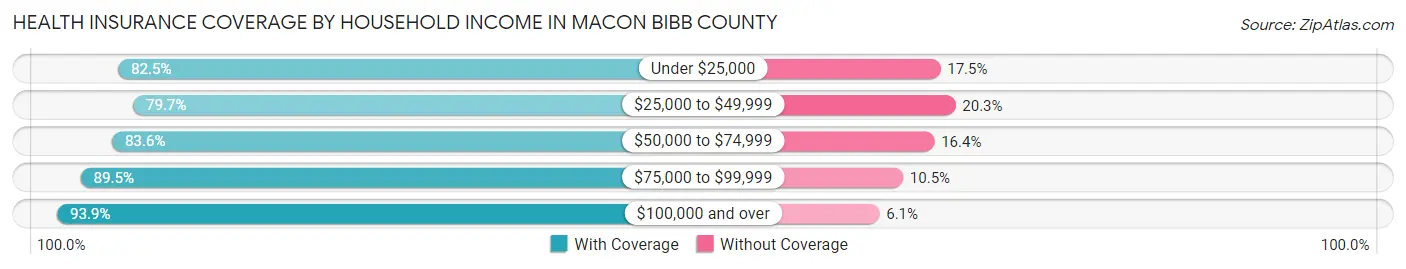
| Household Income | With Coverage | Without Coverage |
| Under $25,000 | 27,619 (82.5%) | 5,865 (17.5%) |
| $25,000 to $49,999 | 26,153 (79.7%) | 6,677 (20.3%) |
| $50,000 to $74,999 | 21,062 (83.6%) | 4,126 (16.4%) |
| $75,000 to $99,999 | 13,659 (89.5%) | 1,605 (10.5%) |
| $100,000 and over | 40,832 (93.9%) | 2,649 (6.1%) |
Public vs Private Health Insurance Coverage by Age in Macon Bibb County
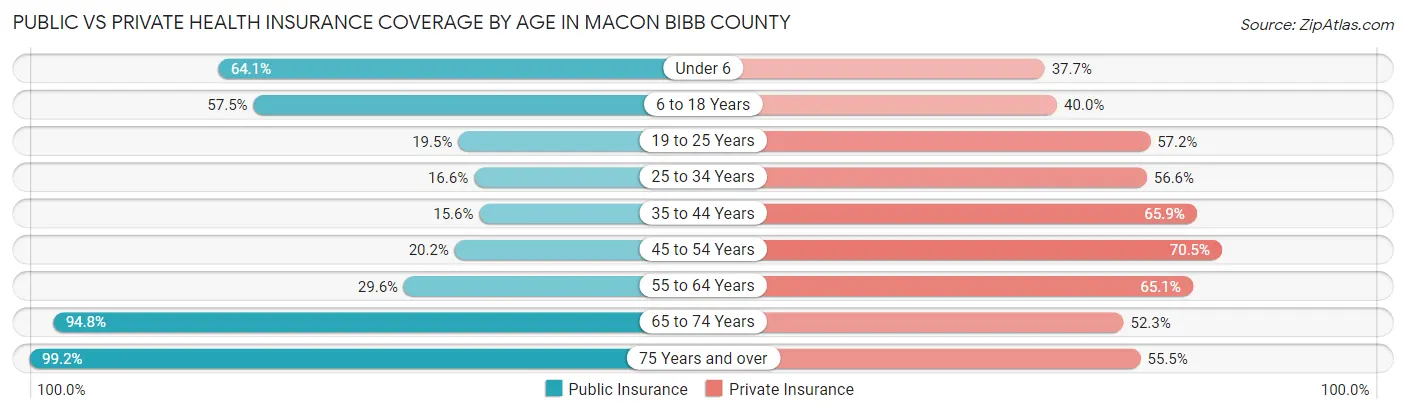
| Age Bracket | Public Insurance | Private Insurance |
| Under 6 | 7,673 (64.1%) | 4,506 (37.7%) |
| 6 to 18 Years | 16,173 (57.5%) | 11,236 (40.0%) |
| 19 to 25 Years | 2,911 (19.5%) | 8,541 (57.2%) |
| 25 to 34 Years | 3,278 (16.6%) | 11,186 (56.6%) |
| 35 to 44 Years | 2,744 (15.6%) | 11,579 (65.9%) |
| 45 to 54 Years | 3,560 (20.2%) | 12,449 (70.5%) |
| 55 to 64 Years | 5,633 (29.6%) | 12,390 (65.1%) |
| 65 to 74 Years | 13,949 (94.8%) | 7,697 (52.3%) |
| 75 Years and over | 9,522 (99.2%) | 5,327 (55.5%) |
| Total | 65,443 (42.7%) | 84,911 (55.4%) |
Disability Status by Sex by Age in Macon Bibb County
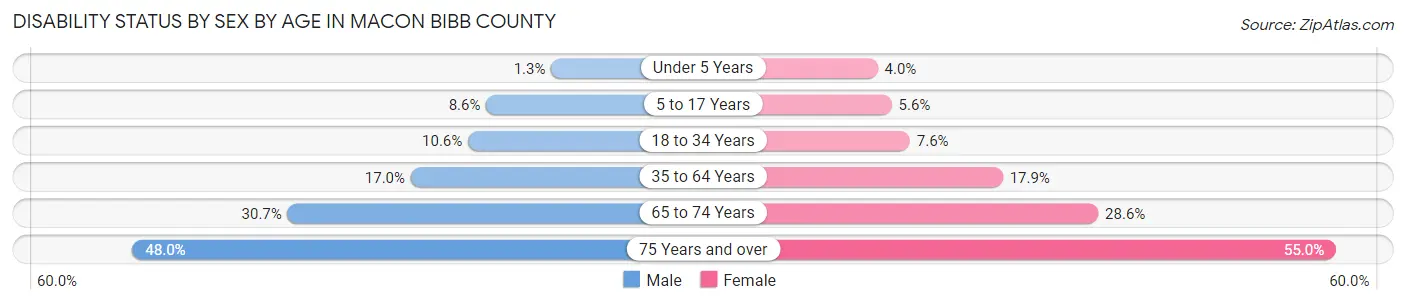
| Age Bracket | Male | Female |
| Under 5 Years | 69 (1.3%) | 198 (4.0%) |
| 5 to 17 Years | 1,206 (8.6%) | 759 (5.6%) |
| 18 to 34 Years | 1,839 (10.6%) | 1,484 (7.6%) |
| 35 to 64 Years | 4,239 (17.0%) | 5,250 (17.9%) |
| 65 to 74 Years | 2,037 (30.7%) | 2,308 (28.5%) |
| 75 Years and over | 1,668 (48.0%) | 3,373 (55.0%) |
Disability Class by Sex by Age in Macon Bibb County
Disability Class: Hearing Difficulty
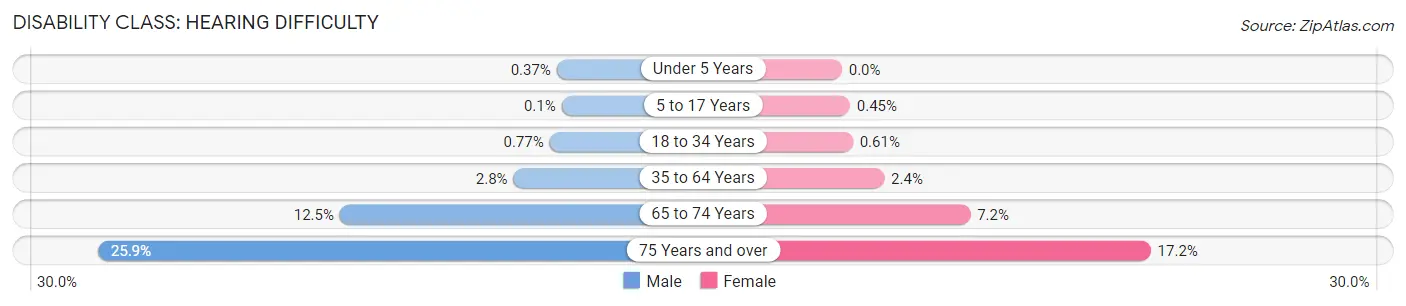
| Age Bracket | Male | Female |
| Under 5 Years | 19 (0.4%) | 0 (0.0%) |
| 5 to 17 Years | 14 (0.1%) | 61 (0.4%) |
| 18 to 34 Years | 133 (0.8%) | 120 (0.6%) |
| 35 to 64 Years | 694 (2.8%) | 691 (2.4%) |
| 65 to 74 Years | 826 (12.4%) | 578 (7.1%) |
| 75 Years and over | 901 (25.9%) | 1,054 (17.2%) |
Disability Class: Vision Difficulty
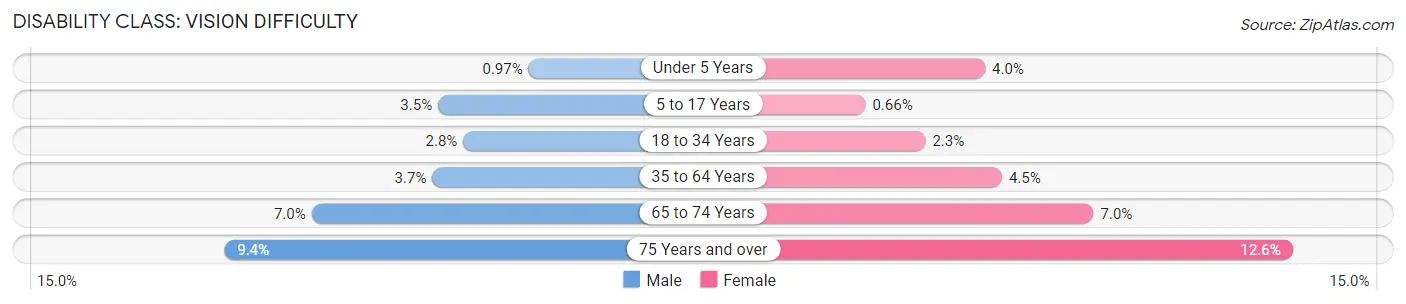
| Age Bracket | Male | Female |
| Under 5 Years | 50 (1.0%) | 198 (4.0%) |
| 5 to 17 Years | 491 (3.5%) | 90 (0.7%) |
| 18 to 34 Years | 484 (2.8%) | 457 (2.3%) |
| 35 to 64 Years | 910 (3.6%) | 1,307 (4.5%) |
| 65 to 74 Years | 465 (7.0%) | 567 (7.0%) |
| 75 Years and over | 328 (9.4%) | 769 (12.6%) |
Disability Class: Cognitive Difficulty
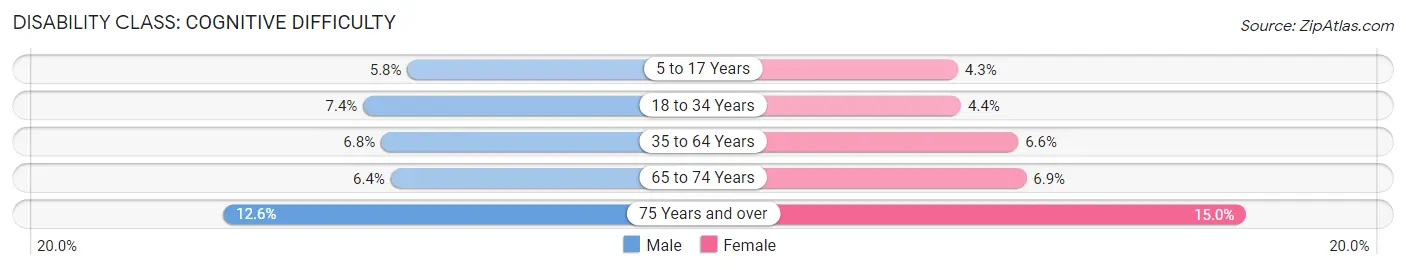
| Age Bracket | Male | Female |
| 5 to 17 Years | 814 (5.8%) | 590 (4.3%) |
| 18 to 34 Years | 1,289 (7.4%) | 868 (4.4%) |
| 35 to 64 Years | 1,690 (6.8%) | 1,920 (6.6%) |
| 65 to 74 Years | 425 (6.4%) | 554 (6.9%) |
| 75 Years and over | 439 (12.6%) | 920 (15.0%) |
Disability Class: Ambulatory Difficulty
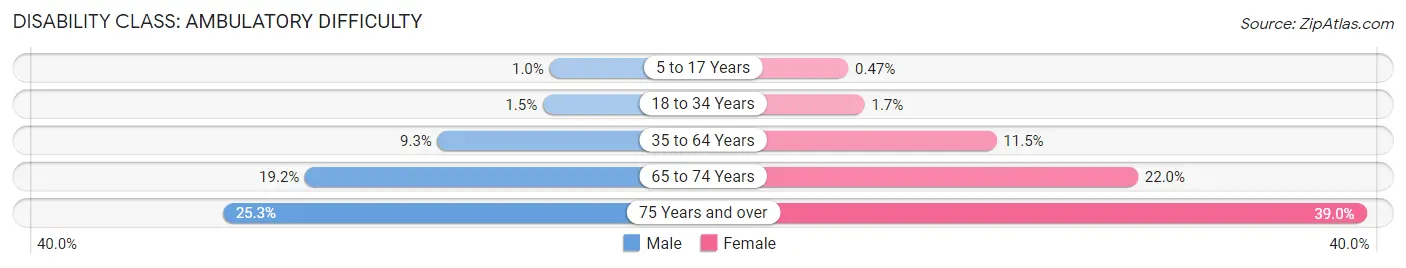
| Age Bracket | Male | Female |
| 5 to 17 Years | 144 (1.0%) | 64 (0.5%) |
| 18 to 34 Years | 261 (1.5%) | 331 (1.7%) |
| 35 to 64 Years | 2,330 (9.3%) | 3,363 (11.5%) |
| 65 to 74 Years | 1,272 (19.2%) | 1,777 (22.0%) |
| 75 Years and over | 879 (25.3%) | 2,387 (39.0%) |
Disability Class: Self-Care Difficulty
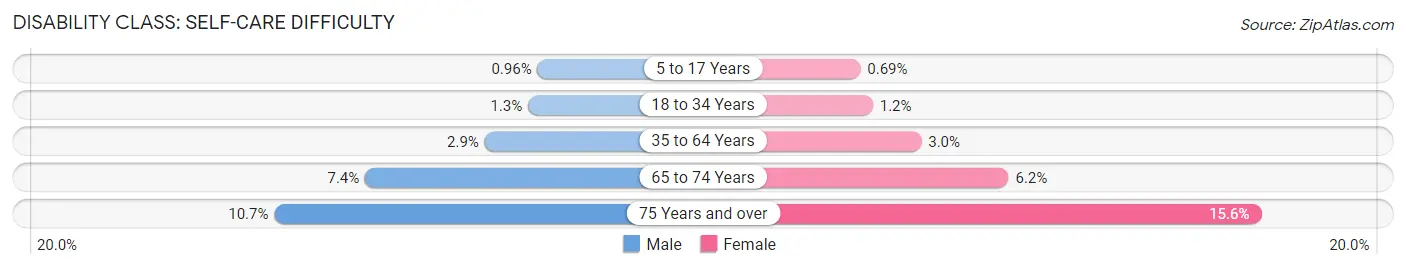
| Age Bracket | Male | Female |
| 5 to 17 Years | 135 (1.0%) | 95 (0.7%) |
| 18 to 34 Years | 228 (1.3%) | 225 (1.1%) |
| 35 to 64 Years | 730 (2.9%) | 864 (2.9%) |
| 65 to 74 Years | 488 (7.4%) | 500 (6.2%) |
| 75 Years and over | 373 (10.7%) | 954 (15.6%) |
Technology Access in Macon Bibb County
Computing Device Access in Macon Bibb County
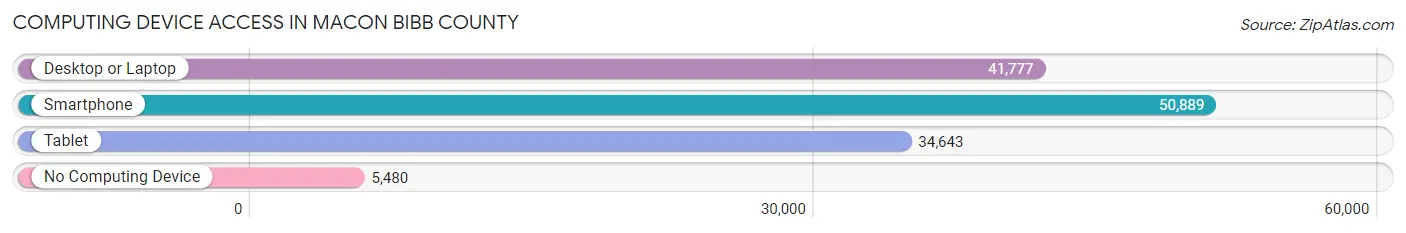
| Device Type | # Households | % Households |
| Desktop or Laptop | 41,777 | 70.2% |
| Smartphone | 50,889 | 85.6% |
| Tablet | 34,643 | 58.2% |
| No Computing Device | 5,480 | 9.2% |
| Total | 59,480 | 100.0% |
Internet Access in Macon Bibb County
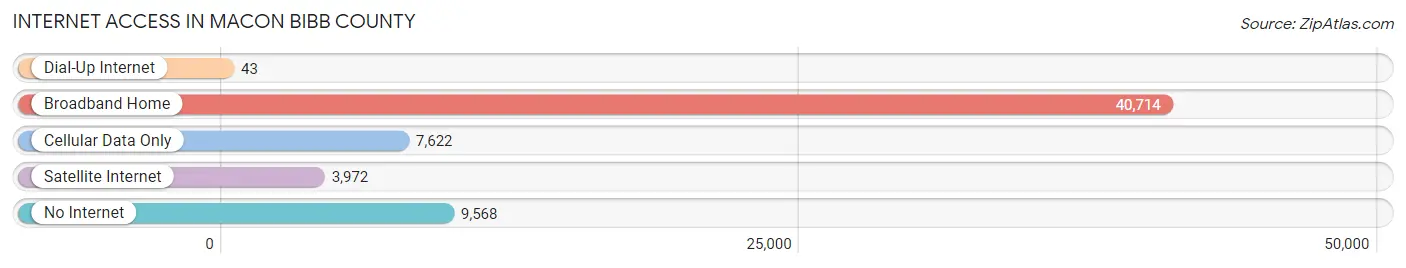
| Internet Type | # Households | % Households |
| Dial-Up Internet | 43 | 0.1% |
| Broadband Home | 40,714 | 68.4% |
| Cellular Data Only | 7,622 | 12.8% |
| Satellite Internet | 3,972 | 6.7% |
| No Internet | 9,568 | 16.1% |
| Total | 59,480 | 100.0% |
Macon Bibb County Summary
Macon Bibb County, Georgia is located in the central part of the state, approximately 85 miles south of Atlanta. It is the county seat of Bibb County and is the second largest city in the state. The city is situated along the Ocmulgee River and is home to a population of approximately 155,547 people.
History
Macon was founded in 1823 and was named after North Carolina statesman Nathaniel Macon. The city was originally a trading post and was the site of the first state-chartered university in Georgia, Mercer University. During the Civil War, Macon was a major supply center for the Confederate Army and was the site of several battles. After the war, the city experienced a period of growth and development, becoming a major industrial center.
Geography
Macon is located in the central part of the state, approximately 85 miles south of Atlanta. It is situated along the Ocmulgee River and is surrounded by several smaller towns and cities, including Warner Robins, Forsyth, and Gray. The city covers an area of approximately 97 square miles and has an elevation of approximately 300 feet.
Economy
Macon’s economy is largely based on manufacturing, healthcare, and education. The city is home to several major employers, including Robins Air Force Base, Navistar, and the Medical Center of Central Georgia. The city also has a thriving tourism industry, with several attractions, including the Tubman African American Museum, the Georgia Music Hall of Fame, and the Ocmulgee National Monument.
Demographics
As of the 2010 census, Macon had a population of 155,547 people. The racial makeup of the city was 54.3% African American, 37.2% White, 2.2% Asian, 0.3% Native American, and 5.9% from other races. The median household income was $31,945 and the median age was 33.7 years.
Conclusion
Macon Bibb County, Georgia is a vibrant city with a rich history and a diverse economy. It is home to a population of approximately 155,547 people and is the second largest city in the state. The city is situated along the Ocmulgee River and is home to several major employers, including Robins Air Force Base, Navistar, and the Medical Center of Central Georgia. The city also has a thriving tourism industry, with several attractions, including the Tubman African American Museum, the Georgia Music Hall of Fame, and the Ocmulgee National Monument.
Common Questions
What is Per Capita Income in Macon Bibb County?
Per Capita income in Macon Bibb County is $30,115.
What is the Median Family Income in Macon Bibb County?
Median Family Income in Macon Bibb County is $64,826.
What is the Median Household income in Macon Bibb County?
Median Household Income in Macon Bibb County is $48,897.
What is Income or Wage Gap in Macon Bibb County?
Income or Wage Gap in Macon Bibb County is 20.6%.
Women in Macon Bibb County earn 79.4 cents for every dollar earned by a man.
What is Family Income Deficit in Macon Bibb County?
Family Income Deficit in Macon Bibb County is $12,251.
Families that are below poverty line in Macon Bibb County earn $12,251 less on average than the poverty threshold level.
What is Inequality or Gini Index in Macon Bibb County?
Inequality or Gini Index in Macon Bibb County is 0.52.
What is the Total Population of Macon Bibb County?
Total Population of Macon Bibb County is 156,554.
What is the Total Male Population of Macon Bibb County?
Total Male Population of Macon Bibb County is 73,881.
What is the Total Female Population of Macon Bibb County?
Total Female Population of Macon Bibb County is 82,673.
What is the Ratio of Males per 100 Females in Macon Bibb County?
There are 89.37 Males per 100 Females in Macon Bibb County.
What is the Ratio of Females per 100 Males in Macon Bibb County?
There are 111.90 Females per 100 Males in Macon Bibb County.
What is the Median Population Age in Macon Bibb County?
Median Population Age in Macon Bibb County is 36.5 Years.
What is the Average Family Size in Macon Bibb County
Average Family Size in Macon Bibb County is 3.3 People.
What is the Average Household Size in Macon Bibb County
Average Household Size in Macon Bibb County is 2.5 People.
How Large is the Labor Force in Macon Bibb County?
There are 70,526 People in the Labor Forcein in Macon Bibb County.
What is the Percentage of People in the Labor Force in Macon Bibb County?
57.5% of People are in the Labor Force in Macon Bibb County.
What is the Unemployment Rate in Macon Bibb County?
Unemployment Rate in Macon Bibb County is 7.5%.