Sunnyside, GA Map & Demographics
Sunnyside Map
Sunnyside Overview
$30,199
PER CAPITA INCOME
$42,045
AVG HOUSEHOLD INCOME
0.48
INEQUALITY / GINI INDEX
962
TOTAL POPULATION
254
MALE POPULATION
708
FEMALE POPULATION
35.88
MALES / 100 FEMALES
278.74
FEMALES / 100 MALES
44.3
MEDIAN AGE
2.5
AVG FAMILY SIZE
2.4
AVG HOUSEHOLD SIZE
397
LABOR FORCE [ PEOPLE ]
47.6%
PERCENT IN LABOR FORCE
Income in Sunnyside
Income Overview in Sunnyside
| Characteristic | Number | Measure |
| Per Capita Income | 962 | $30,199 |
| Median Family Income | 344 | $0 |
| Mean Family Income | 344 | $72,040 |
| Median Household Income | 408 | $42,045 |
| Mean Household Income | 408 | $67,872 |
| Income Deficit | 344 | $0 |
| Wage / Income Gap (%) | 962 | 0.00% |
| Wage / Income Gap ($) | 962 | 100.00¢ per $1 |
| Gini / Inequality Index | 962 | 0.48 |
Earnings by Sex in Sunnyside
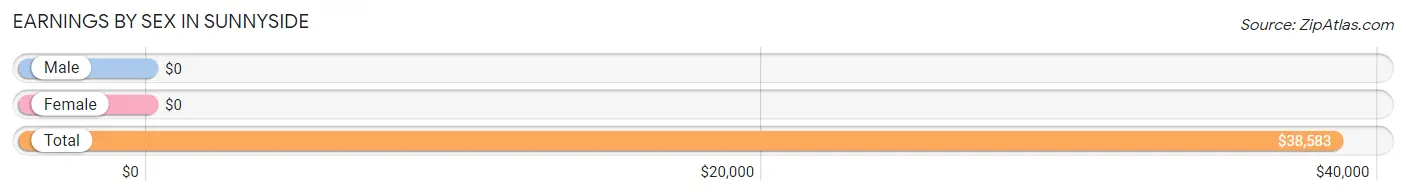
| Sex | Number | Average Earnings |
| Male | 136 (32.9%) | $0 |
| Female | 278 (67.1%) | $0 |
| Total | 414 (100.0%) | $38,583 |
Earnings by Sex by Income Bracket in Sunnyside
The most common earnings brackets in Sunnyside are $65,000 to $74,999 for men (39 | 28.7%) and $12,500 to $14,999 for women (103 | 37.0%).
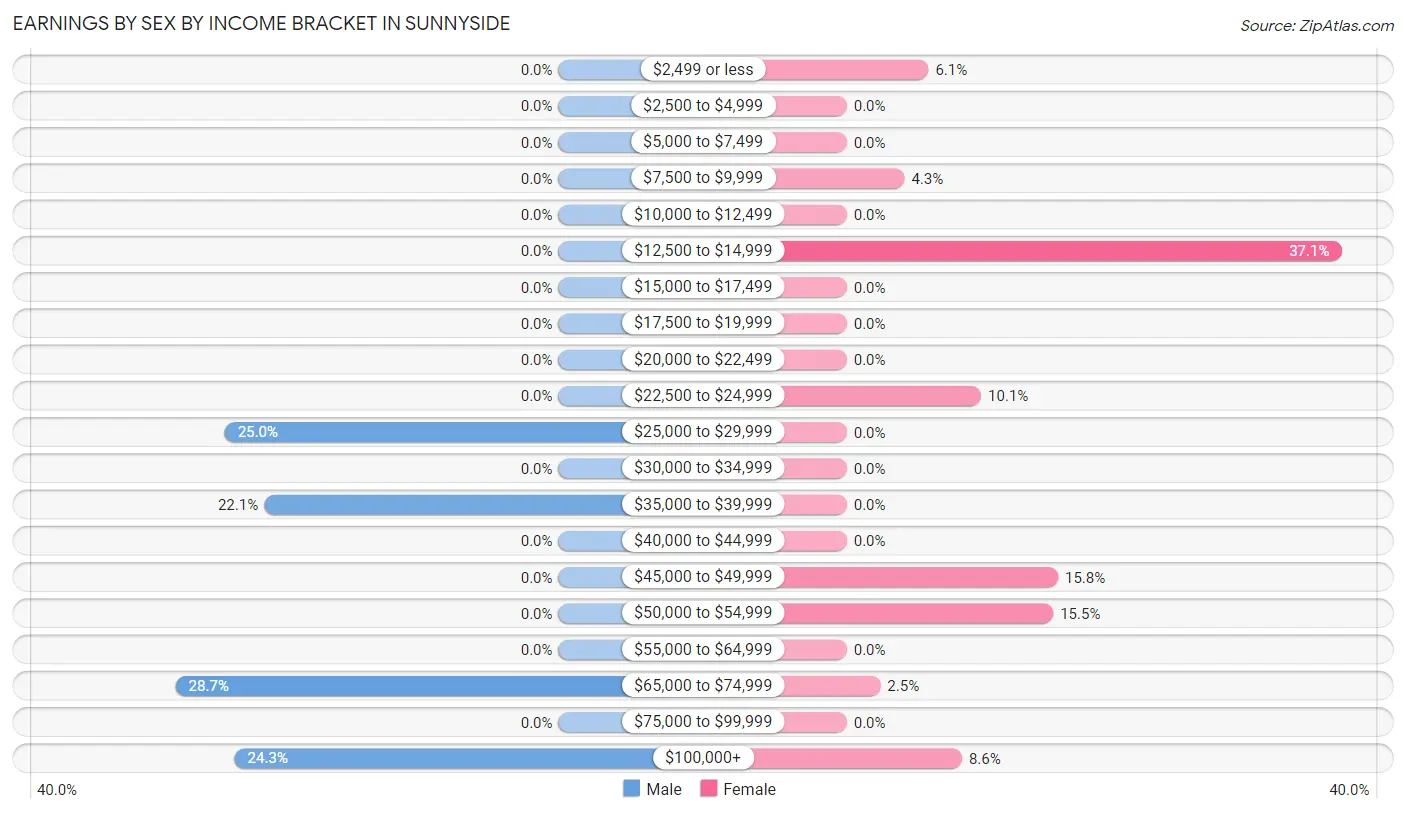
| Income | Male | Female |
| $2,499 or less | 0 (0.0%) | 17 (6.1%) |
| $2,500 to $4,999 | 0 (0.0%) | 0 (0.0%) |
| $5,000 to $7,499 | 0 (0.0%) | 0 (0.0%) |
| $7,500 to $9,999 | 0 (0.0%) | 12 (4.3%) |
| $10,000 to $12,499 | 0 (0.0%) | 0 (0.0%) |
| $12,500 to $14,999 | 0 (0.0%) | 103 (37.0%) |
| $15,000 to $17,499 | 0 (0.0%) | 0 (0.0%) |
| $17,500 to $19,999 | 0 (0.0%) | 0 (0.0%) |
| $20,000 to $22,499 | 0 (0.0%) | 0 (0.0%) |
| $22,500 to $24,999 | 0 (0.0%) | 28 (10.1%) |
| $25,000 to $29,999 | 34 (25.0%) | 0 (0.0%) |
| $30,000 to $34,999 | 0 (0.0%) | 0 (0.0%) |
| $35,000 to $39,999 | 30 (22.1%) | 0 (0.0%) |
| $40,000 to $44,999 | 0 (0.0%) | 0 (0.0%) |
| $45,000 to $49,999 | 0 (0.0%) | 44 (15.8%) |
| $50,000 to $54,999 | 0 (0.0%) | 43 (15.5%) |
| $55,000 to $64,999 | 0 (0.0%) | 0 (0.0%) |
| $65,000 to $74,999 | 39 (28.7%) | 7 (2.5%) |
| $75,000 to $99,999 | 0 (0.0%) | 0 (0.0%) |
| $100,000+ | 33 (24.3%) | 24 (8.6%) |
| Total | 136 (100.0%) | 278 (100.0%) |
Earnings by Sex by Educational Attainment in Sunnyside
| Educational Attainment | Male Income | Female Income |
| Less than High School | - | - |
| High School Diploma | - | - |
| College or Associate's Degree | - | - |
| Bachelor's Degree | - | - |
| Graduate Degree | - | - |
| Total | - | - |
Family Income in Sunnyside
Family Income Brackets in Sunnyside
According to the Sunnyside family income data, there are 103 families falling into the $10,000 to $14,999 income range, which is the most common income bracket and makes up 29.9% of all families.
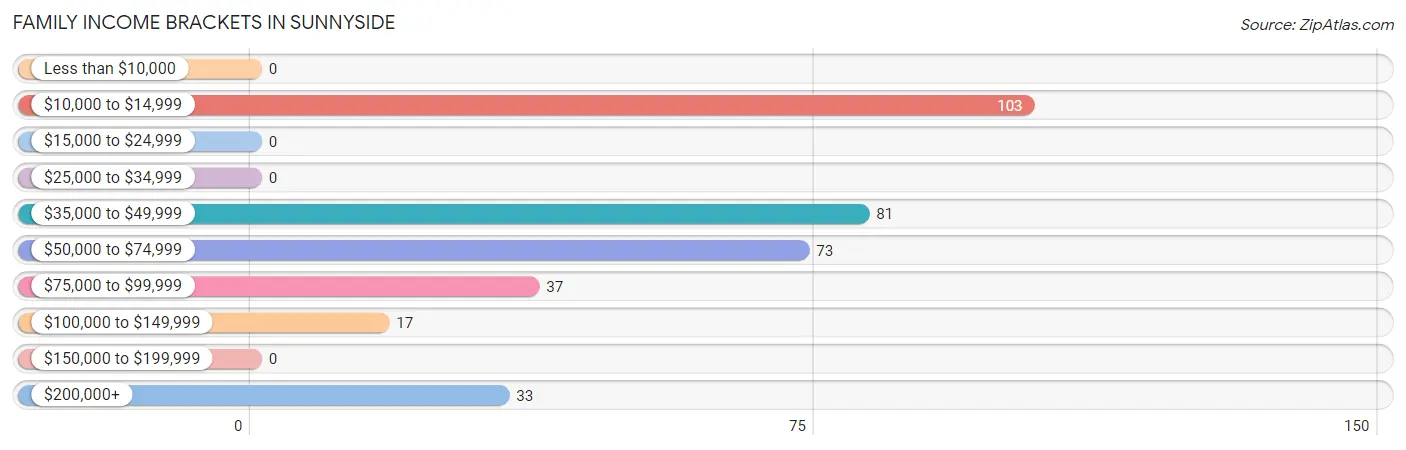
| Income Bracket | # Families | % Families |
| Less than $10,000 | 0 | 0.0% |
| $10,000 to $14,999 | 103 | 29.9% |
| $15,000 to $24,999 | 0 | 0.0% |
| $25,000 to $34,999 | 0 | 0.0% |
| $35,000 to $49,999 | 81 | 23.5% |
| $50,000 to $74,999 | 73 | 21.2% |
| $75,000 to $99,999 | 37 | 10.8% |
| $100,000 to $149,999 | 17 | 4.9% |
| $150,000 to $199,999 | 0 | 0.0% |
| $200,000+ | 33 | 9.6% |
Family Income by Famaliy Size in Sunnyside
2-person families (255 | 74.1%) account for the highest median family income in Sunnyside with $40,659 per family, while 2-person families (255 | 74.1%) have the highest median income of $20,330 per family member.
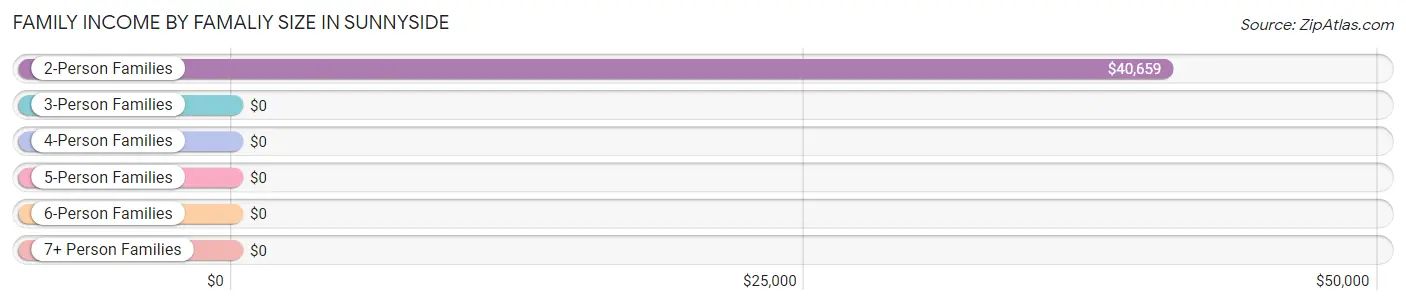
| Income Bracket | # Families | Median Income |
| 2-Person Families | 255 (74.1%) | $40,659 |
| 3-Person Families | 89 (25.9%) | $0 |
| 4-Person Families | 0 (0.0%) | $0 |
| 5-Person Families | 0 (0.0%) | $0 |
| 6-Person Families | 0 (0.0%) | $0 |
| 7+ Person Families | 0 (0.0%) | $0 |
| Total | 344 (100.0%) | $0 |
Family Income by Number of Earners in Sunnyside
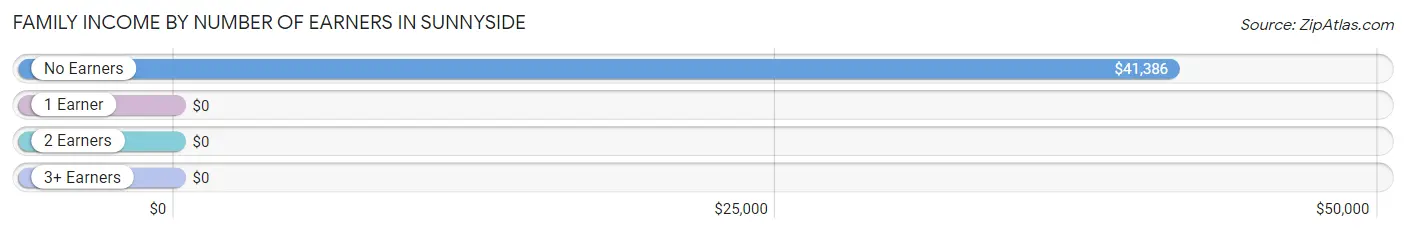
| Number of Earners | # Families | Median Income |
| No Earners | 81 (23.5%) | $41,386 |
| 1 Earner | 193 (56.1%) | $0 |
| 2 Earners | 70 (20.3%) | $0 |
| 3+ Earners | 0 (0.0%) | $0 |
| Total | 344 (100.0%) | $0 |
Household Income in Sunnyside
Household Income Brackets in Sunnyside
With 121 households falling in the category, the $10,000 to $14,999 income range is the most frequent in Sunnyside, accounting for 29.7% of all households.
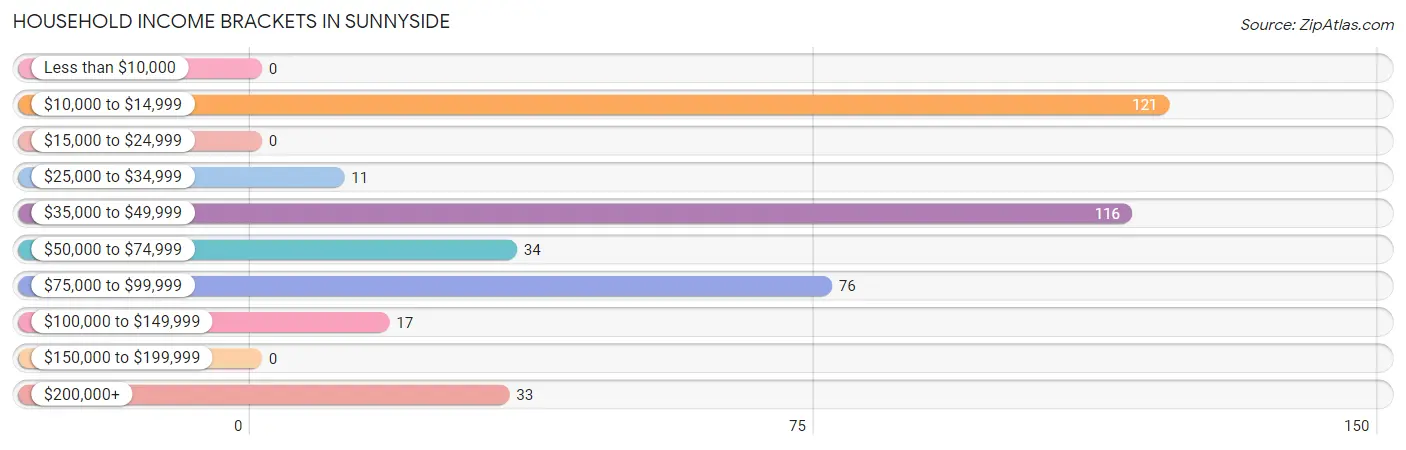
| Income Bracket | # Households | % Households |
| Less than $10,000 | 0 | 0.0% |
| $10,000 to $14,999 | 121 | 29.7% |
| $15,000 to $24,999 | 0 | 0.0% |
| $25,000 to $34,999 | 11 | 2.7% |
| $35,000 to $49,999 | 116 | 28.4% |
| $50,000 to $74,999 | 34 | 8.3% |
| $75,000 to $99,999 | 76 | 18.6% |
| $100,000 to $149,999 | 17 | 4.2% |
| $150,000 to $199,999 | 0 | 0.0% |
| $200,000+ | 33 | 8.1% |
Household Income by Householder Age in Sunnyside
The median household income in Sunnyside is $42,045, with the highest median household income of $41,909 found in the 65+ years age bracket for the primary householder. A total of 196 households (48.0%) fall into this category.
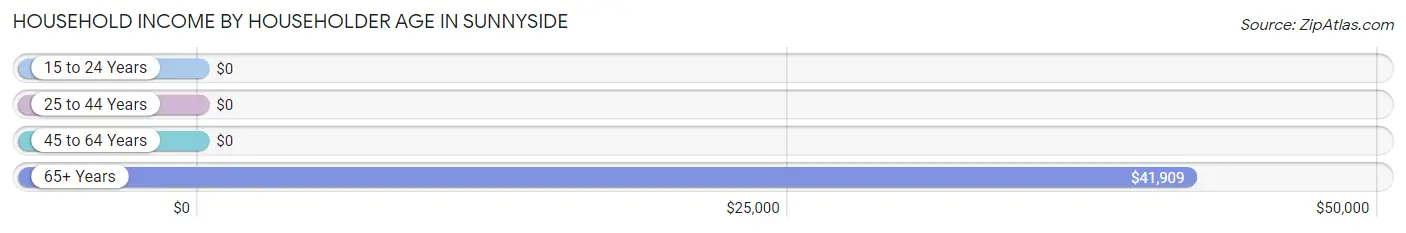
| Income Bracket | # Households | Median Income |
| 15 to 24 Years | 0 (0.0%) | $0 |
| 25 to 44 Years | 205 (50.2%) | $0 |
| 45 to 64 Years | 7 (1.7%) | $0 |
| 65+ Years | 196 (48.0%) | $41,909 |
| Total | 408 (100.0%) | $42,045 |
Poverty in Sunnyside
Income Below Poverty by Sex and Age in Sunnyside
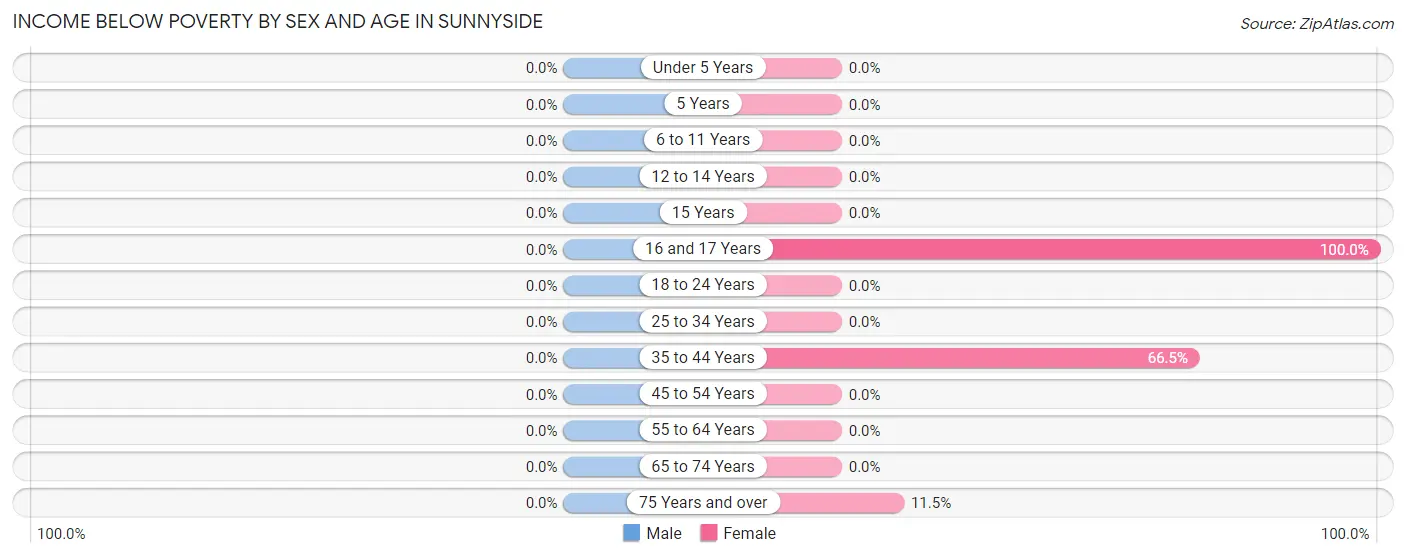
| Age Bracket | Male | Female |
| Under 5 Years | 0 (0.0%) | 0 (0.0%) |
| 5 Years | 0 (0.0%) | 0 (0.0%) |
| 6 to 11 Years | 0 (0.0%) | 0 (0.0%) |
| 12 to 14 Years | 0 (0.0%) | 0 (0.0%) |
| 15 Years | 0 (0.0%) | 0 (0.0%) |
| 16 and 17 Years | 0 (0.0%) | 58 (100.0%) |
| 18 to 24 Years | 0 (0.0%) | 0 (0.0%) |
| 25 to 34 Years | 0 (0.0%) | 0 (0.0%) |
| 35 to 44 Years | 0 (0.0%) | 103 (66.4%) |
| 45 to 54 Years | 0 (0.0%) | 0 (0.0%) |
| 55 to 64 Years | 0 (0.0%) | 0 (0.0%) |
| 65 to 74 Years | 0 (0.0%) | 0 (0.0%) |
| 75 Years and over | 0 (0.0%) | 18 (11.5%) |
| Total | 0 (0.0%) | 179 (25.3%) |
Income Above Poverty by Sex and Age in Sunnyside
According to the poverty statistics in Sunnyside, males aged under 5 years and females aged 6 to 11 years are the age groups that are most secure financially, with 100.0% of males and 100.0% of females in these age groups living above the poverty line.
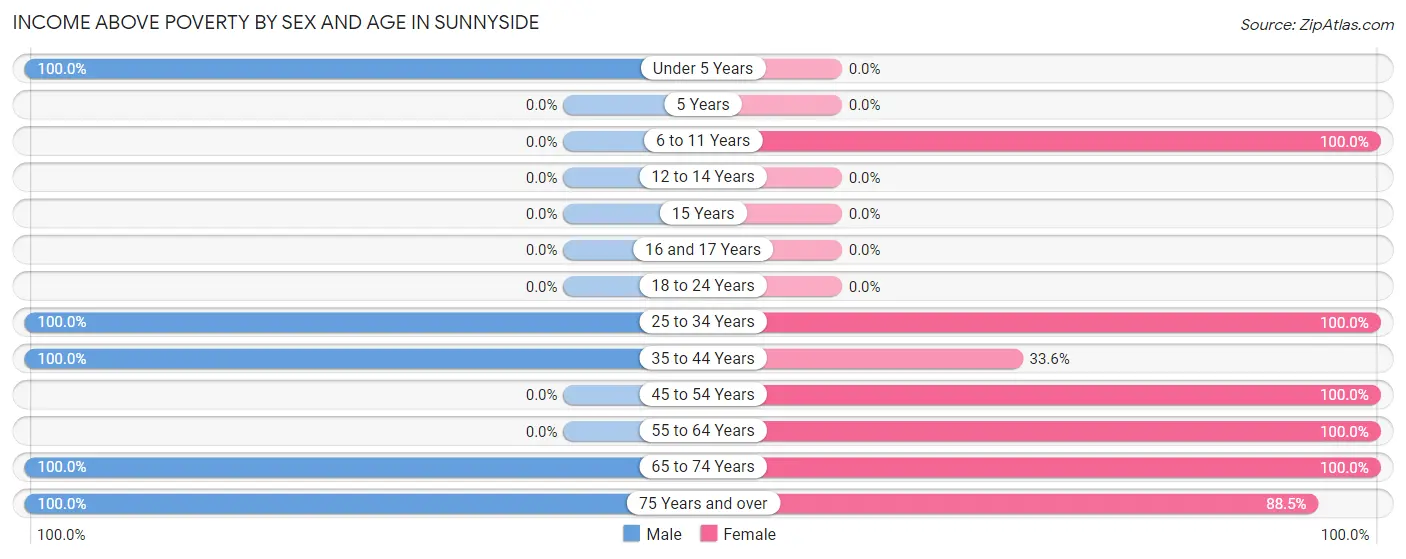
| Age Bracket | Male | Female |
| Under 5 Years | 42 (100.0%) | 0 (0.0%) |
| 5 Years | 0 (0.0%) | 0 (0.0%) |
| 6 to 11 Years | 0 (0.0%) | 86 (100.0%) |
| 12 to 14 Years | 0 (0.0%) | 0 (0.0%) |
| 15 Years | 0 (0.0%) | 0 (0.0%) |
| 16 and 17 Years | 0 (0.0%) | 0 (0.0%) |
| 18 to 24 Years | 0 (0.0%) | 0 (0.0%) |
| 25 to 34 Years | 30 (100.0%) | 87 (100.0%) |
| 35 to 44 Years | 72 (100.0%) | 52 (33.6%) |
| 45 to 54 Years | 0 (0.0%) | 57 (100.0%) |
| 55 to 64 Years | 0 (0.0%) | 31 (100.0%) |
| 65 to 74 Years | 55 (100.0%) | 78 (100.0%) |
| 75 Years and over | 55 (100.0%) | 138 (88.5%) |
| Total | 254 (100.0%) | 529 (74.7%) |
Income Below Poverty Among Married-Couple Families in Sunnyside
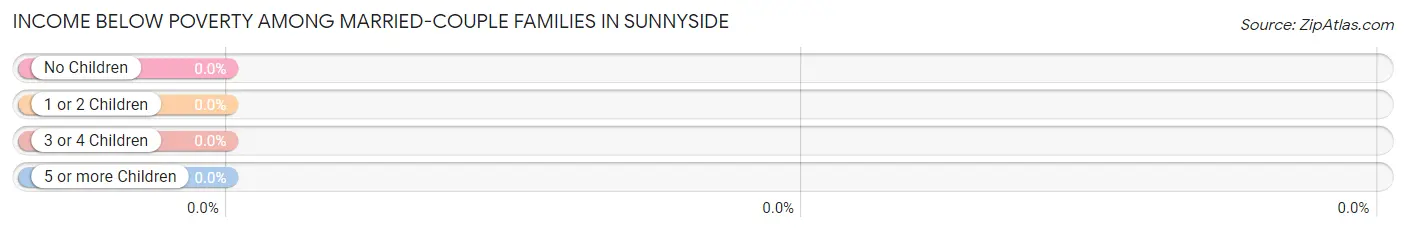
| Children | Above Poverty | Below Poverty |
| No Children | 129 (100.0%) | 0 (0.0%) |
| 1 or 2 Children | 33 (100.0%) | 0 (0.0%) |
| 3 or 4 Children | 0 (0.0%) | 0 (0.0%) |
| 5 or more Children | 0 (0.0%) | 0 (0.0%) |
| Total | 162 (100.0%) | 0 (0.0%) |
Income Below Poverty Among Single-Parent Households in Sunnyside
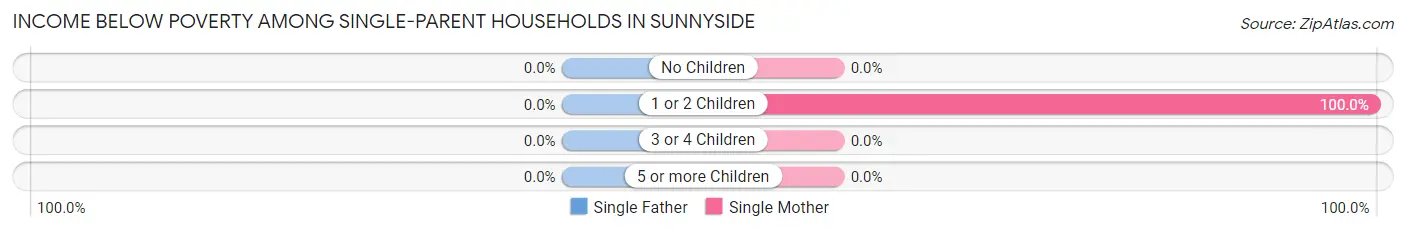
| Children | Single Father | Single Mother |
| No Children | 0 (0.0%) | 0 (0.0%) |
| 1 or 2 Children | 0 (0.0%) | 103 (100.0%) |
| 3 or 4 Children | 0 (0.0%) | 0 (0.0%) |
| 5 or more Children | 0 (0.0%) | 0 (0.0%) |
| Total | 0 (0.0%) | 103 (72.0%) |
Income Below Poverty Among Married-Couple vs Single-Parent Households in Sunnyside
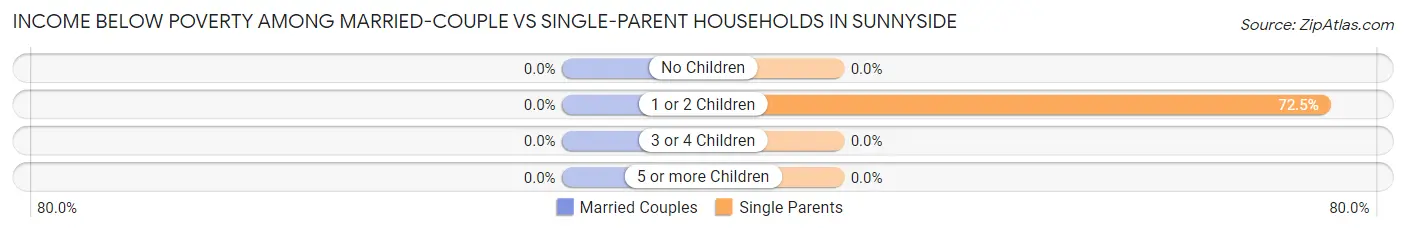
| Children | Married-Couple Families | Single-Parent Households |
| No Children | 0 (0.0%) | 0 (0.0%) |
| 1 or 2 Children | 0 (0.0%) | 103 (72.5%) |
| 3 or 4 Children | 0 (0.0%) | 0 (0.0%) |
| 5 or more Children | 0 (0.0%) | 0 (0.0%) |
| Total | 0 (0.0%) | 103 (56.6%) |
Race in Sunnyside
The most populous races in Sunnyside are White / Caucasian (925 | 96.2%), Black / African American (19 | 2.0%), and Two or more Races (18 | 1.9%).
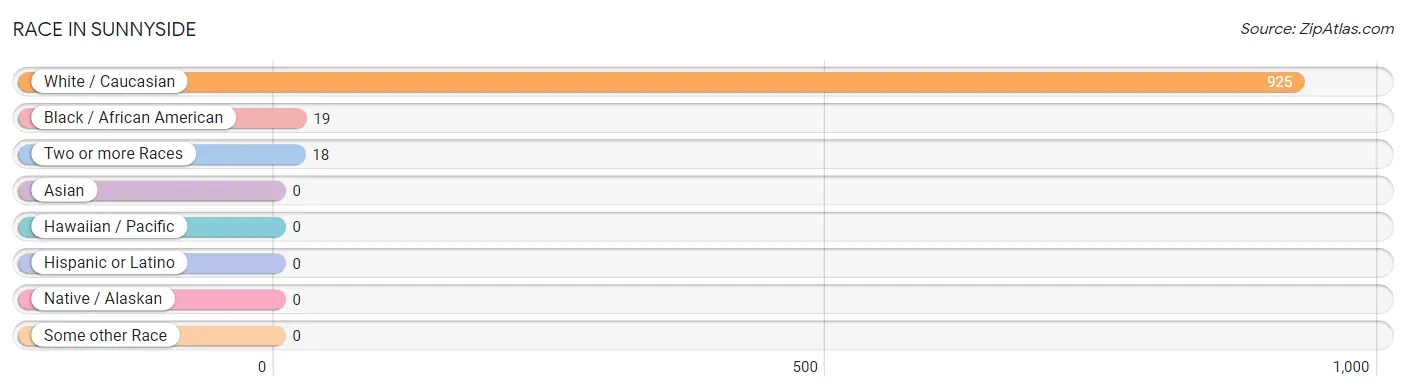
| Race | # Population | % Population |
| Asian | 0 | 0.0% |
| Black / African American | 19 | 2.0% |
| Hawaiian / Pacific | 0 | 0.0% |
| Hispanic or Latino | 0 | 0.0% |
| Native / Alaskan | 0 | 0.0% |
| White / Caucasian | 925 | 96.2% |
| Two or more Races | 18 | 1.9% |
| Some other Race | 0 | 0.0% |
| Total | 962 | 100.0% |
Ancestry in Sunnyside
The most populous ancestries reported in Sunnyside are American (182 | 18.9%), European (99 | 10.3%), English (67 | 7.0%), German (67 | 7.0%), and Irish (39 | 4.1%), together accounting for 47.2% of all Sunnyside residents.
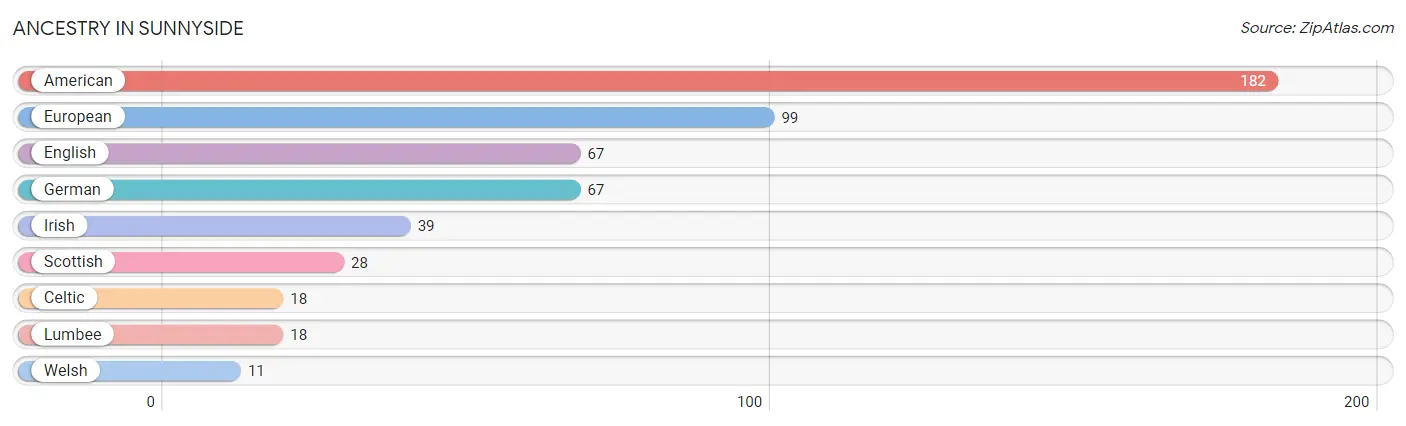
| Ancestry | # Population | % Population |
| American | 182 | 18.9% |
| Celtic | 18 | 1.9% |
| English | 67 | 7.0% |
| European | 99 | 10.3% |
| German | 67 | 7.0% |
| Irish | 39 | 4.1% |
| Lumbee | 18 | 1.9% |
| Scottish | 28 | 2.9% |
| Welsh | 11 | 1.1% | View All 9 Rows |
Immigrants in Sunnyside

| Immigration Origin | # Population | % Population | View All 0 Rows |
Sex and Age in Sunnyside
Sex and Age in Sunnyside
The most populous age groups in Sunnyside are 40 to 44 Years (72 | 28.3%) for men and 80 to 84 Years (139 | 19.6%) for women.
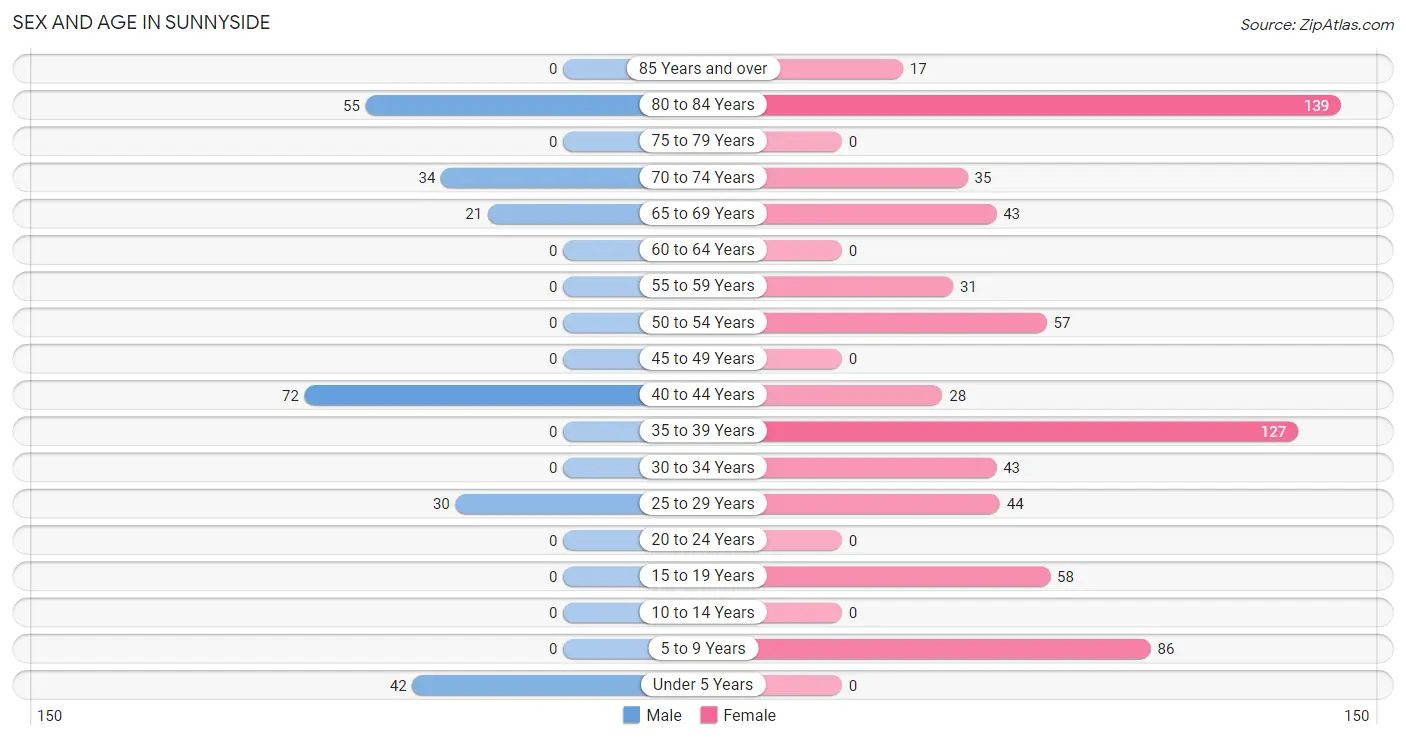
| Age Bracket | Male | Female |
| Under 5 Years | 42 (16.5%) | 0 (0.0%) |
| 5 to 9 Years | 0 (0.0%) | 86 (12.1%) |
| 10 to 14 Years | 0 (0.0%) | 0 (0.0%) |
| 15 to 19 Years | 0 (0.0%) | 58 (8.2%) |
| 20 to 24 Years | 0 (0.0%) | 0 (0.0%) |
| 25 to 29 Years | 30 (11.8%) | 44 (6.2%) |
| 30 to 34 Years | 0 (0.0%) | 43 (6.1%) |
| 35 to 39 Years | 0 (0.0%) | 127 (17.9%) |
| 40 to 44 Years | 72 (28.3%) | 28 (4.0%) |
| 45 to 49 Years | 0 (0.0%) | 0 (0.0%) |
| 50 to 54 Years | 0 (0.0%) | 57 (8.1%) |
| 55 to 59 Years | 0 (0.0%) | 31 (4.4%) |
| 60 to 64 Years | 0 (0.0%) | 0 (0.0%) |
| 65 to 69 Years | 21 (8.3%) | 43 (6.1%) |
| 70 to 74 Years | 34 (13.4%) | 35 (4.9%) |
| 75 to 79 Years | 0 (0.0%) | 0 (0.0%) |
| 80 to 84 Years | 55 (21.6%) | 139 (19.6%) |
| 85 Years and over | 0 (0.0%) | 17 (2.4%) |
| Total | 254 (100.0%) | 708 (100.0%) |
Families and Households in Sunnyside
Median Family Size in Sunnyside
The median family size in Sunnyside is 2.53 persons per family, with single male/father families (39 | 11.3%) accounting for the largest median family size of 3.21 persons per family. On the other hand, single female/mother families (143 | 41.6%) represent the smallest median family size with 2.27 persons per family.
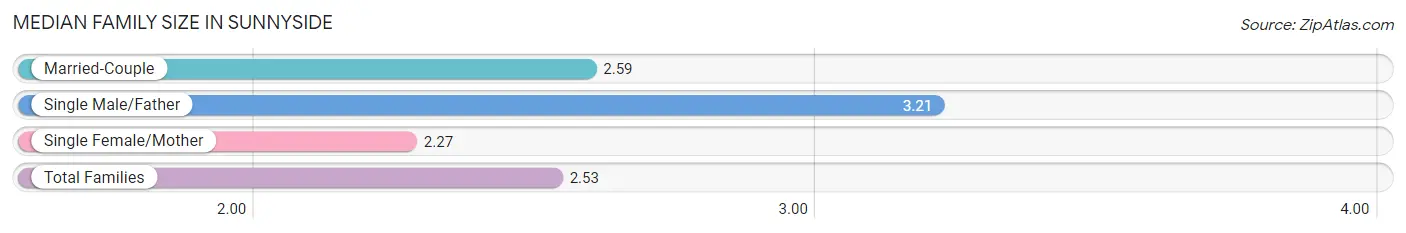
| Family Type | # Families | Family Size |
| Married-Couple | 162 (47.1%) | 2.59 |
| Single Male/Father | 39 (11.3%) | 3.21 |
| Single Female/Mother | 143 (41.6%) | 2.27 |
| Total Families | 344 (100.0%) | 2.53 |
Median Household Size in Sunnyside
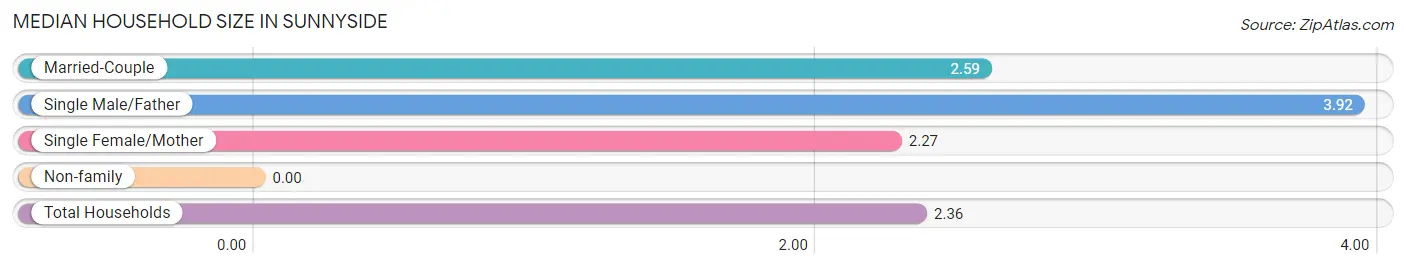
| Household Type | # Households | Household Size |
| Married-Couple | 162 (39.7%) | 2.59 |
| Single Male/Father | 39 (9.6%) | 3.92 |
| Single Female/Mother | 143 (35.0%) | 2.27 |
| Non-family | 64 (15.7%) | - |
| Total Households | 408 (100.0%) | 2.36 |
Household Size by Marriage Status in Sunnyside
Out of a total of 408 households in Sunnyside, 344 (84.3%) are family households, while 64 (15.7%) are nonfamily households. The most numerous type of family households are 2-person households, comprising 255, and the most common type of nonfamily households are 1-person households, comprising 64.
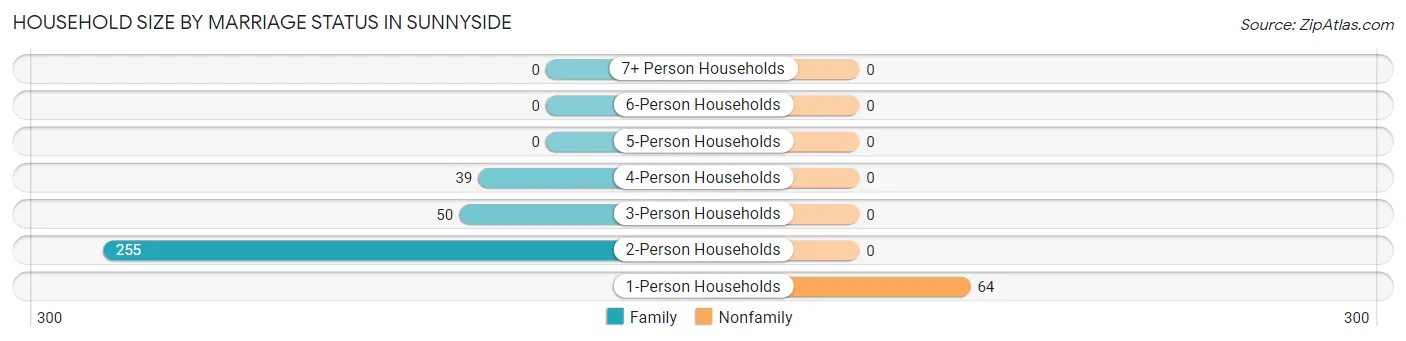
| Household Size | Family Households | Nonfamily Households |
| 1-Person Households | - | 64 (15.7%) |
| 2-Person Households | 255 (62.5%) | 0 (0.0%) |
| 3-Person Households | 50 (12.2%) | 0 (0.0%) |
| 4-Person Households | 39 (9.6%) | 0 (0.0%) |
| 5-Person Households | 0 (0.0%) | 0 (0.0%) |
| 6-Person Households | 0 (0.0%) | 0 (0.0%) |
| 7+ Person Households | 0 (0.0%) | 0 (0.0%) |
| Total | 344 (84.3%) | 64 (15.7%) |
Female Fertility in Sunnyside
Fertility by Age in Sunnyside
Average fertility rate in Sunnyside is 71.0 births per 1,000 women. Women in the age bracket of 35 to 50 years have the highest fertility rate with 124.0 births per 1,000 women. Women in the age bracket of 35 to 50 years acount for 100.0% of all women with births.
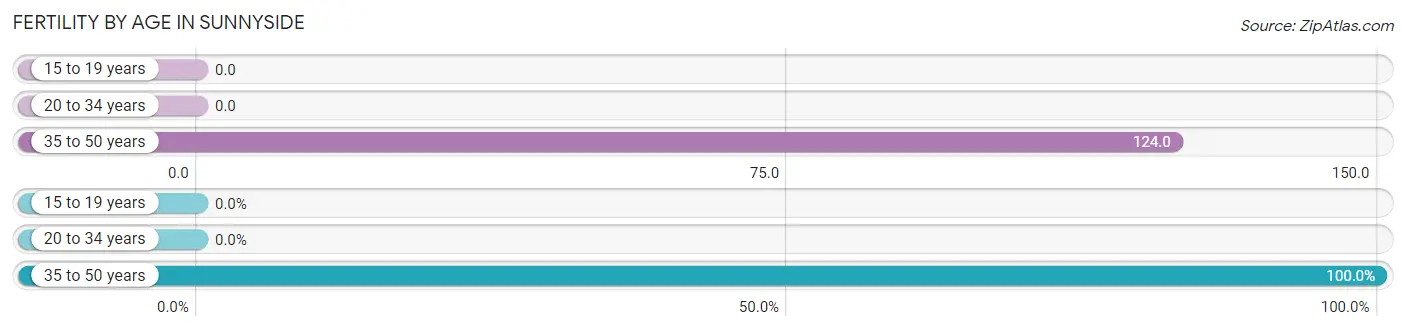
| Age Bracket | Women with Births | Births / 1,000 Women |
| 15 to 19 years | 0 (0.0%) | 0.0 |
| 20 to 34 years | 0 (0.0%) | 0.0 |
| 35 to 50 years | 24 (100.0%) | 124.0 |
| Total | 24 (100.0%) | 71.0 |
Fertility by Age by Marriage Status in Sunnyside
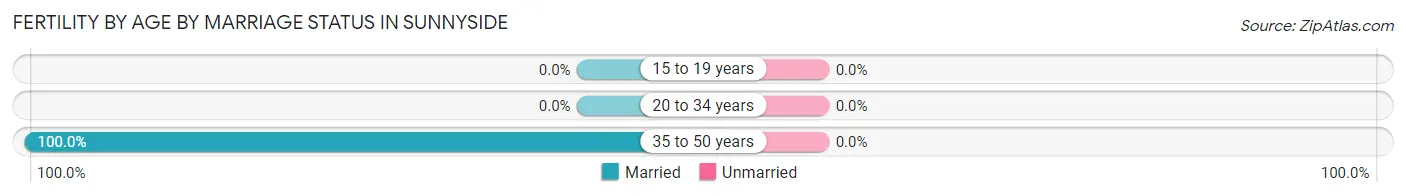
| Age Bracket | Married | Unmarried |
| 15 to 19 years | 0 (0.0%) | 0 (0.0%) |
| 20 to 34 years | 0 (0.0%) | 0 (0.0%) |
| 35 to 50 years | 24 (100.0%) | 0 (0.0%) |
| Total | 24 (100.0%) | 0 (0.0%) |
Fertility by Education in Sunnyside
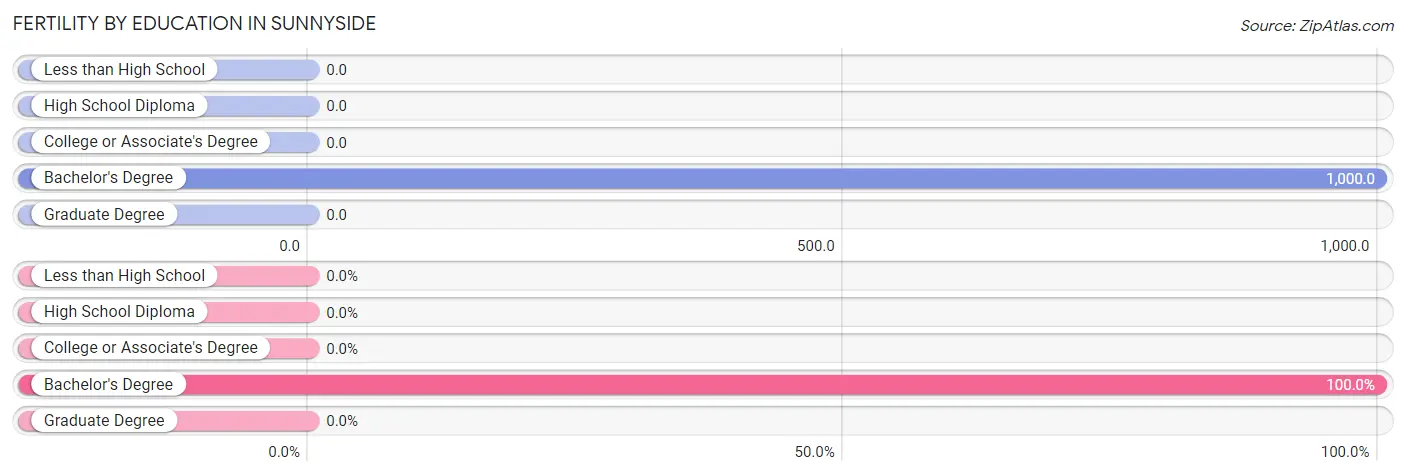
| Educational Attainment | Women with Births | Births / 1,000 Women |
| Less than High School | 0 (0.0%) | 0.0 |
| High School Diploma | 0 (0.0%) | 0.0 |
| College or Associate's Degree | 0 (0.0%) | 0.0 |
| Bachelor's Degree | 24 (100.0%) | 1,000.0 |
| Graduate Degree | 0 (0.0%) | 0.0 |
| Total | 24 (100.0%) | 71.0 |
Fertility by Education by Marriage Status in Sunnyside
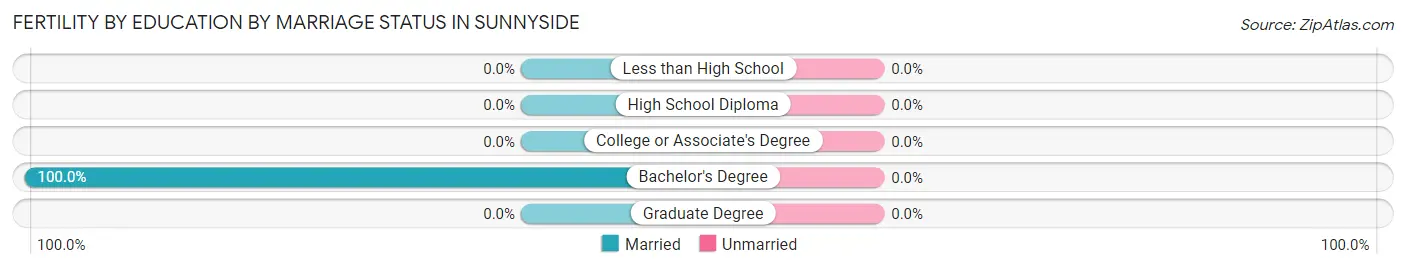
| Educational Attainment | Married | Unmarried |
| Less than High School | 0 (0.0%) | 0 (0.0%) |
| High School Diploma | 0 (0.0%) | 0 (0.0%) |
| College or Associate's Degree | 0 (0.0%) | 0 (0.0%) |
| Bachelor's Degree | 24 (100.0%) | 0 (0.0%) |
| Graduate Degree | 0 (0.0%) | 0 (0.0%) |
| Total | 24 (100.0%) | 0 (0.0%) |
Employment Characteristics in Sunnyside
Employment by Class of Employer in Sunnyside
Among the 373 employed individuals in Sunnyside, private company employees (334 | 89.5%), and local government employees (39 | 10.5%) make up the most common classes of employment.
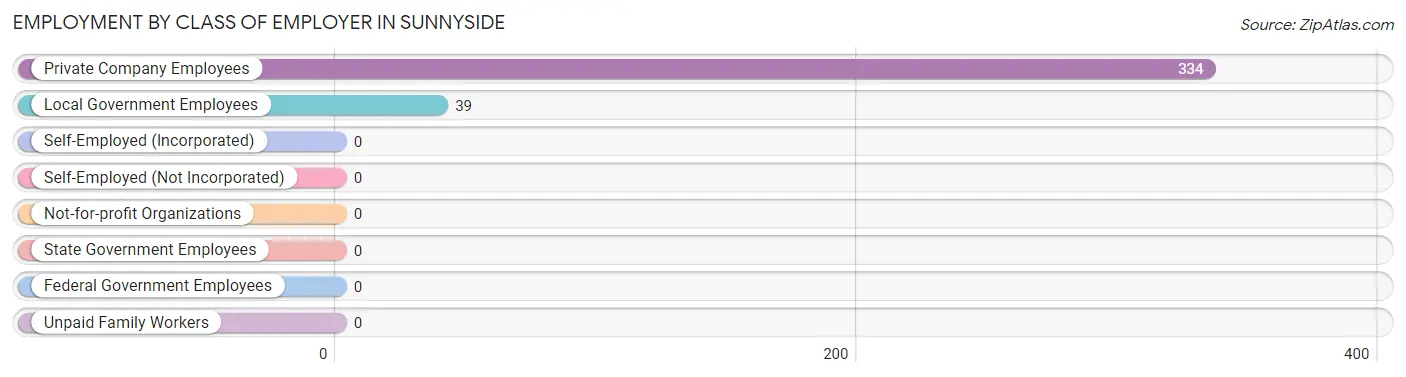
| Employer Class | # Employees | % Employees |
| Private Company Employees | 334 | 89.5% |
| Self-Employed (Incorporated) | 0 | 0.0% |
| Self-Employed (Not Incorporated) | 0 | 0.0% |
| Not-for-profit Organizations | 0 | 0.0% |
| Local Government Employees | 39 | 10.5% |
| State Government Employees | 0 | 0.0% |
| Federal Government Employees | 0 | 0.0% |
| Unpaid Family Workers | 0 | 0.0% |
| Total | 373 | 100.0% |
Employment Status by Age in Sunnyside
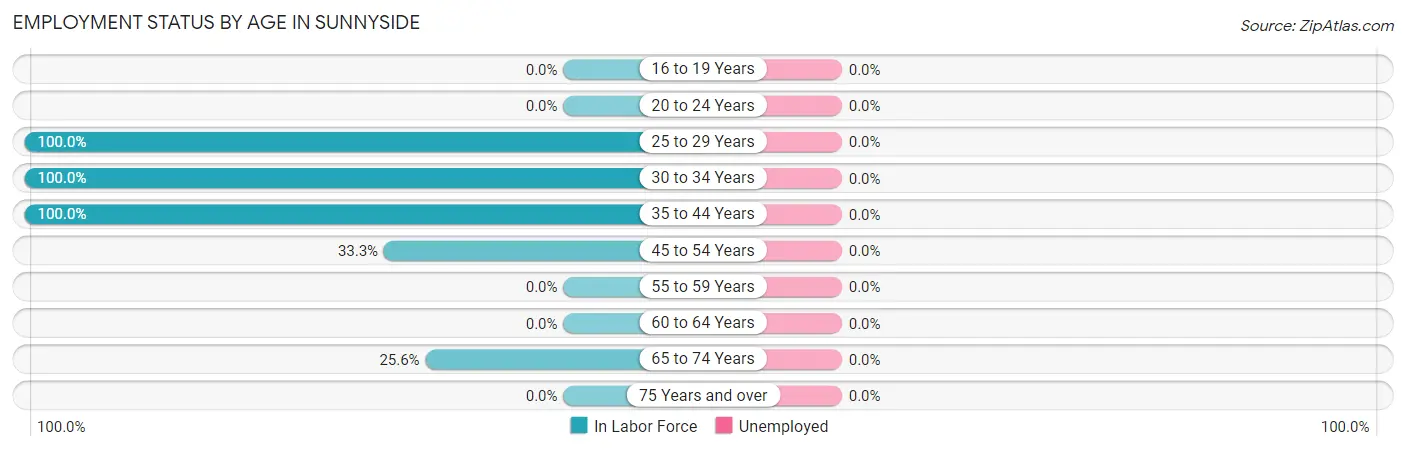
| Age Bracket | In Labor Force | Unemployed |
| 16 to 19 Years | 0 (0.0%) | 0 (0.0%) |
| 20 to 24 Years | 0 (0.0%) | 0 (0.0%) |
| 25 to 29 Years | 74 (100.0%) | 0 (0.0%) |
| 30 to 34 Years | 43 (100.0%) | 0 (0.0%) |
| 35 to 44 Years | 227 (100.0%) | 0 (0.0%) |
| 45 to 54 Years | 19 (33.3%) | 0 (0.0%) |
| 55 to 59 Years | 0 (0.0%) | 0 (0.0%) |
| 60 to 64 Years | 0 (0.0%) | 0 (0.0%) |
| 65 to 74 Years | 34 (25.6%) | 0 (0.0%) |
| 75 Years and over | 0 (0.0%) | 0 (0.0%) |
| Total | 397 (47.6%) | 0 (0.0%) |
Employment Status by Educational Attainment in Sunnyside
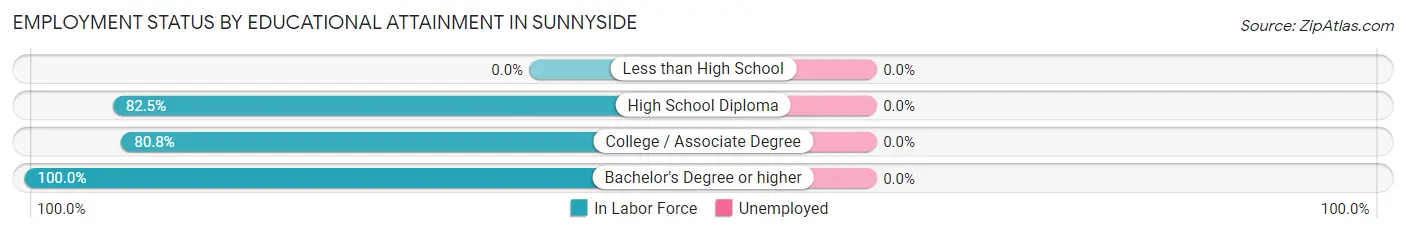
| Educational Attainment | In Labor Force | Unemployed |
| Less than High School | 0 (0.0%) | 0 (0.0%) |
| High School Diploma | 146 (82.5%) | 0 (0.0%) |
| College / Associate Degree | 160 (80.8%) | 0 (0.0%) |
| Bachelor's Degree or higher | 57 (100.0%) | 0 (0.0%) |
| Total | 363 (84.0%) | 0 (0.0%) |
Employment Occupations by Sex in Sunnyside
Management, Business, Science and Arts Occupations
The most common Management, Business, Science and Arts occupations in Sunnyside are Community & Social Service (43 | 10.8%), Legal Services & Support (43 | 10.8%), Management (33 | 8.3%), Business & Financial (30 | 7.6%), and Health Diagnosing & Treating (12 | 3.0%).
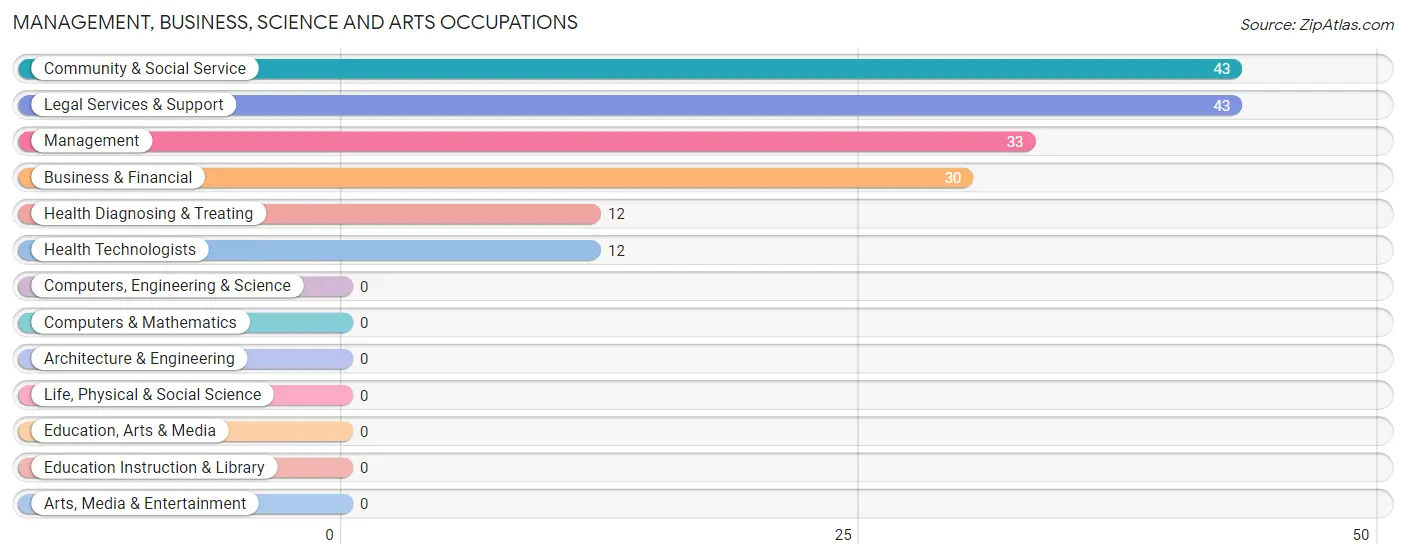
Management, Business, Science and Arts Occupations by Sex
Within the Management, Business, Science and Arts occupations in Sunnyside, the most male-oriented occupations are Management (100.0%), and Business & Financial (100.0%), while the most female-oriented occupations are Community & Social Service (100.0%), Legal Services & Support (100.0%), and Health Diagnosing & Treating (100.0%).
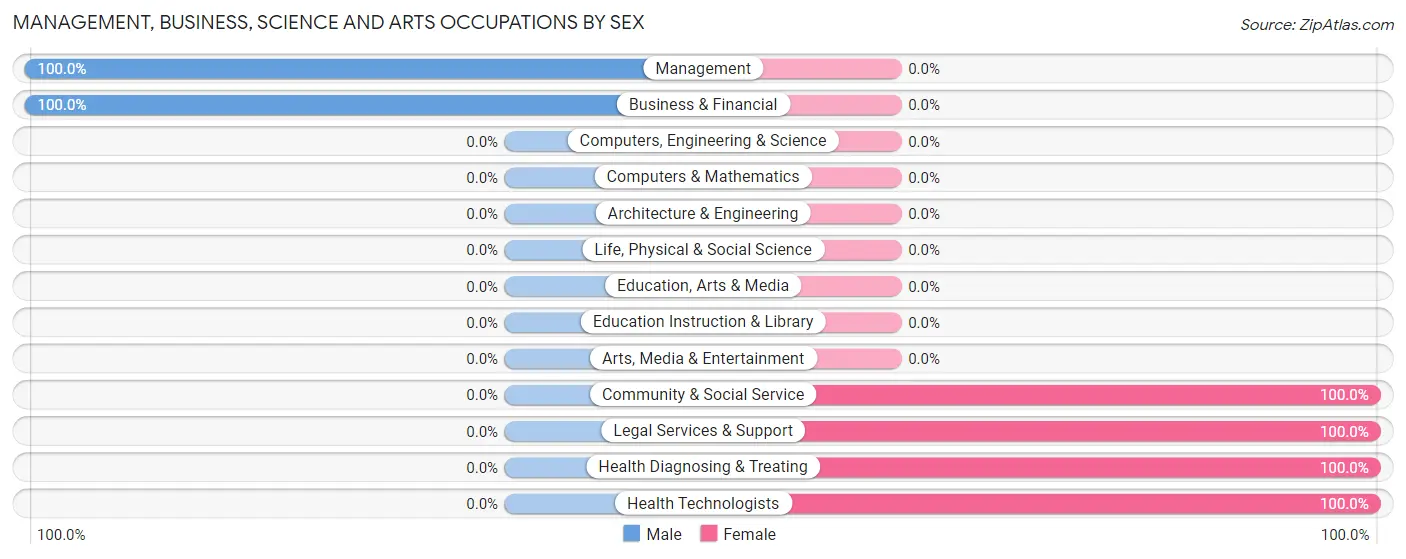
| Occupation | Male | Female |
| Management | 33 (100.0%) | 0 (0.0%) |
| Business & Financial | 30 (100.0%) | 0 (0.0%) |
| Computers, Engineering & Science | 0 (0.0%) | 0 (0.0%) |
| Computers & Mathematics | 0 (0.0%) | 0 (0.0%) |
| Architecture & Engineering | 0 (0.0%) | 0 (0.0%) |
| Life, Physical & Social Science | 0 (0.0%) | 0 (0.0%) |
| Community & Social Service | 0 (0.0%) | 43 (100.0%) |
| Education, Arts & Media | 0 (0.0%) | 0 (0.0%) |
| Legal Services & Support | 0 (0.0%) | 43 (100.0%) |
| Education Instruction & Library | 0 (0.0%) | 0 (0.0%) |
| Arts, Media & Entertainment | 0 (0.0%) | 0 (0.0%) |
| Health Diagnosing & Treating | 0 (0.0%) | 12 (100.0%) |
| Health Technologists | 0 (0.0%) | 12 (100.0%) |
| Total (Category) | 63 (53.4%) | 55 (46.6%) |
| Total (Overall) | 136 (34.3%) | 261 (65.7%) |
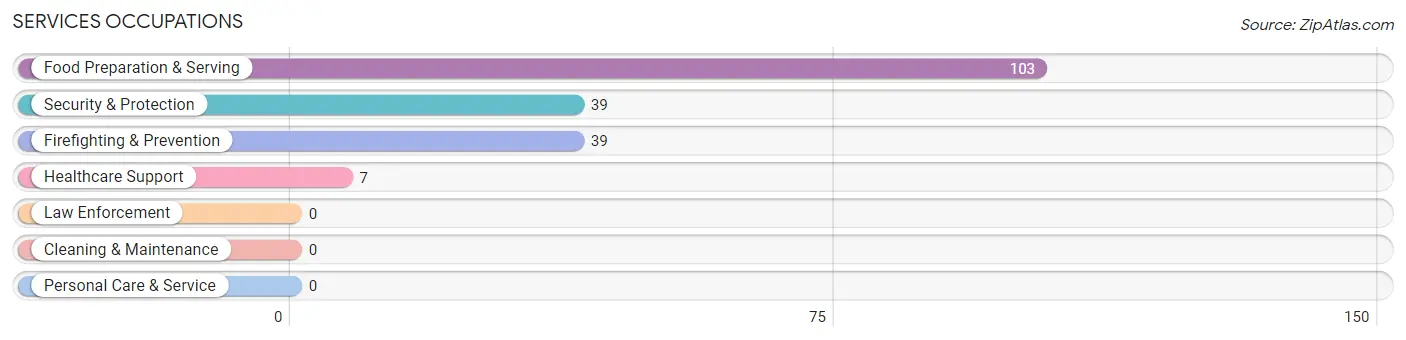
Services Occupations
The most common Services occupations in Sunnyside are Food Preparation & Serving (103 | 25.9%), Security & Protection (39 | 9.8%), Firefighting & Prevention (39 | 9.8%), and Healthcare Support (7 | 1.8%).
Services Occupations by Sex
Within the Services occupations in Sunnyside, the most male-oriented occupations are Security & Protection (100.0%), and Firefighting & Prevention (100.0%), while the most female-oriented occupations are Healthcare Support (100.0%), and Food Preparation & Serving (100.0%).
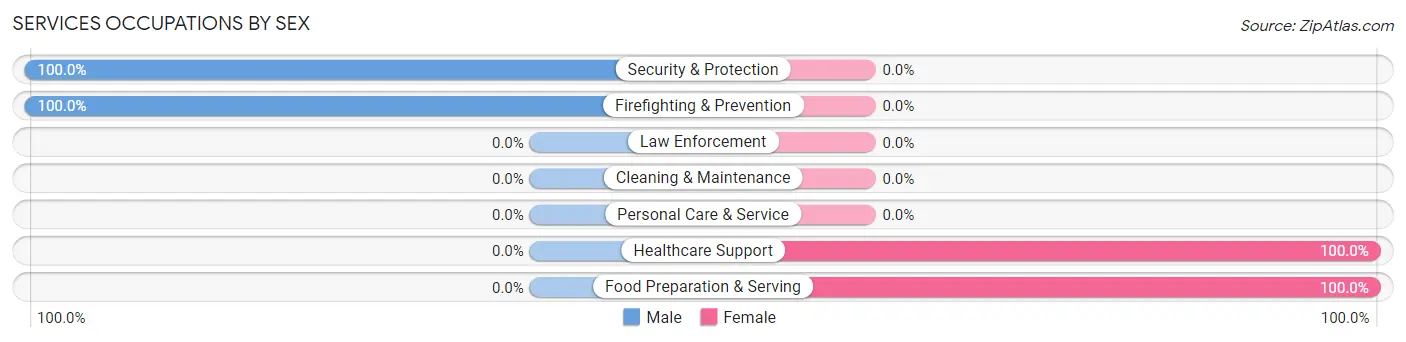
| Occupation | Male | Female |
| Healthcare Support | 0 (0.0%) | 7 (100.0%) |
| Security & Protection | 39 (100.0%) | 0 (0.0%) |
| Firefighting & Prevention | 39 (100.0%) | 0 (0.0%) |
| Law Enforcement | 0 (0.0%) | 0 (0.0%) |
| Food Preparation & Serving | 0 (0.0%) | 103 (100.0%) |
| Cleaning & Maintenance | 0 (0.0%) | 0 (0.0%) |
| Personal Care & Service | 0 (0.0%) | 0 (0.0%) |
| Total (Category) | 39 (26.2%) | 110 (73.8%) |
| Total (Overall) | 136 (34.3%) | 261 (65.7%) |
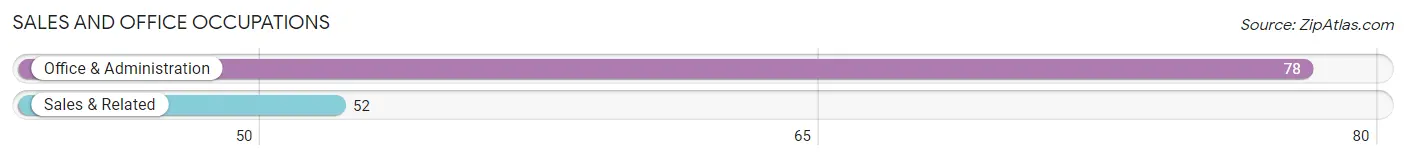
Sales and Office Occupations
The most common Sales and Office occupations in Sunnyside are Office & Administration (78 | 19.7%), and Sales & Related (52 | 13.1%).
Sales and Office Occupations by Sex
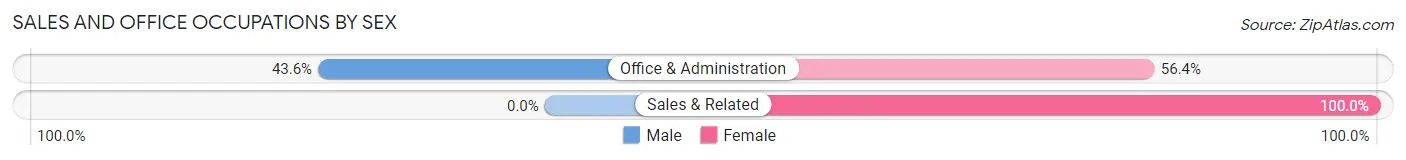
| Occupation | Male | Female |
| Sales & Related | 0 (0.0%) | 52 (100.0%) |
| Office & Administration | 34 (43.6%) | 44 (56.4%) |
| Total (Category) | 34 (26.2%) | 96 (73.9%) |
| Total (Overall) | 136 (34.3%) | 261 (65.7%) |
Natural Resources, Construction and Maintenance Occupations
Natural Resources, Construction and Maintenance Occupations by Sex
| Occupation | Male | Female |
| Farming, Fishing & Forestry | 0 (0.0%) | 0 (0.0%) |
| Construction & Extraction | 0 (0.0%) | 0 (0.0%) |
| Installation, Maintenance & Repair | 0 (0.0%) | 0 (0.0%) |
| Total (Category) | 0 (0.0%) | 0 (0.0%) |
| Total (Overall) | 136 (34.3%) | 261 (65.7%) |
Production, Transportation and Moving Occupations
Production, Transportation and Moving Occupations by Sex
| Occupation | Male | Female |
| Production | 0 (0.0%) | 0 (0.0%) |
| Transportation | 0 (0.0%) | 0 (0.0%) |
| Material Moving | 0 (0.0%) | 0 (0.0%) |
| Total (Category) | 0 (0.0%) | 0 (0.0%) |
| Total (Overall) | 136 (34.3%) | 261 (65.7%) |
Employment Industries by Sex in Sunnyside
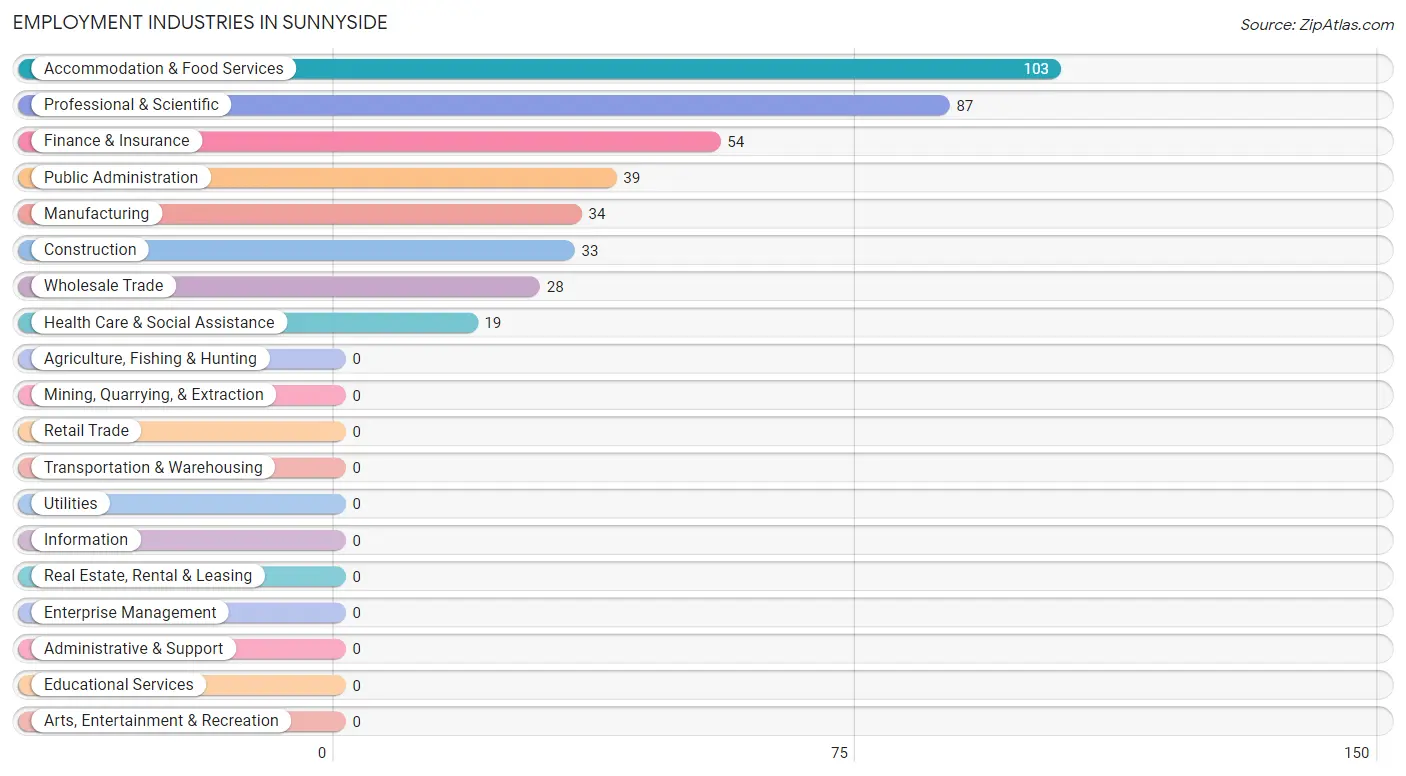
Employment Industries in Sunnyside
The major employment industries in Sunnyside include Accommodation & Food Services (103 | 25.9%), Professional & Scientific (87 | 21.9%), Finance & Insurance (54 | 13.6%), Public Administration (39 | 9.8%), and Manufacturing (34 | 8.6%).
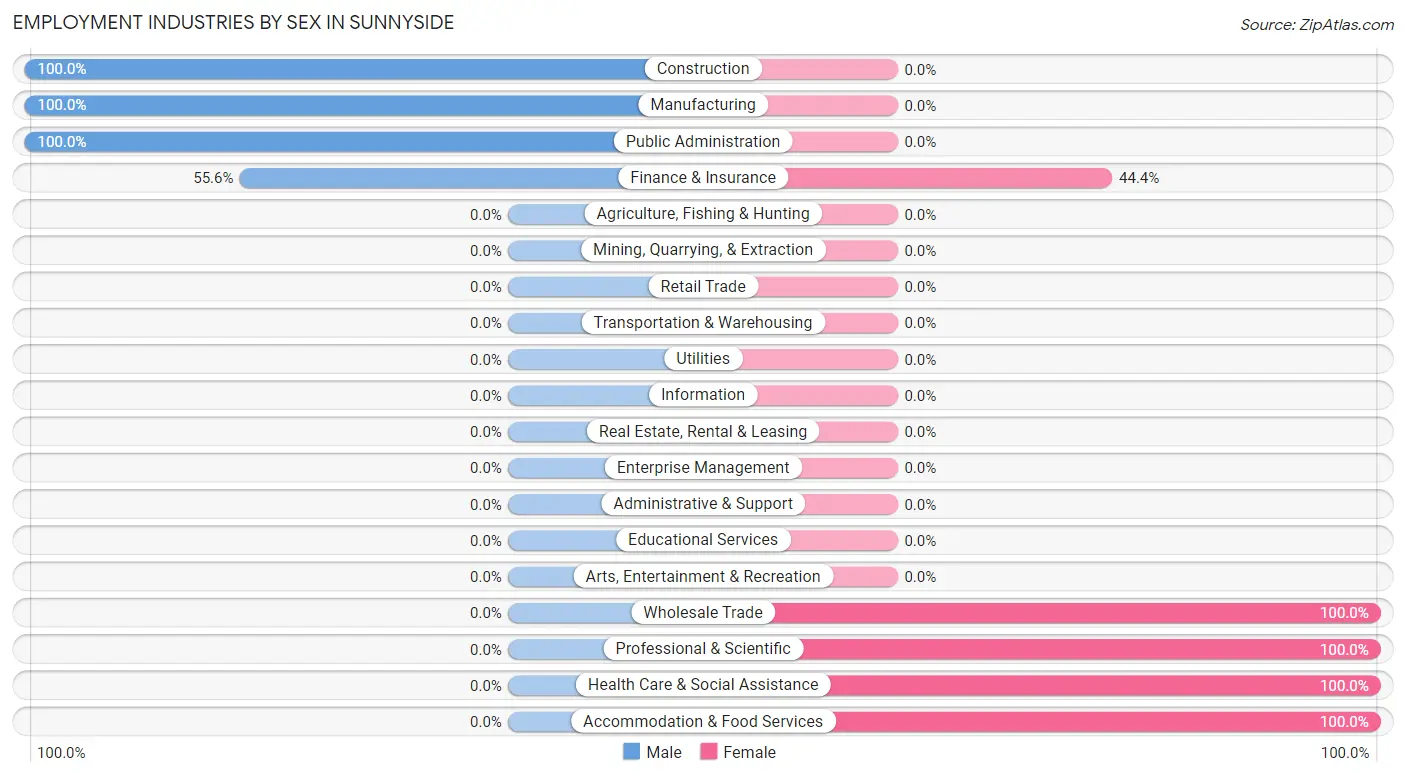
Employment Industries by Sex in Sunnyside
The Sunnyside industries that see more men than women are Construction (100.0%), Manufacturing (100.0%), and Public Administration (100.0%), whereas the industries that tend to have a higher number of women are Wholesale Trade (100.0%), Professional & Scientific (100.0%), and Health Care & Social Assistance (100.0%).
| Industry | Male | Female |
| Agriculture, Fishing & Hunting | 0 (0.0%) | 0 (0.0%) |
| Mining, Quarrying, & Extraction | 0 (0.0%) | 0 (0.0%) |
| Construction | 33 (100.0%) | 0 (0.0%) |
| Manufacturing | 34 (100.0%) | 0 (0.0%) |
| Wholesale Trade | 0 (0.0%) | 28 (100.0%) |
| Retail Trade | 0 (0.0%) | 0 (0.0%) |
| Transportation & Warehousing | 0 (0.0%) | 0 (0.0%) |
| Utilities | 0 (0.0%) | 0 (0.0%) |
| Information | 0 (0.0%) | 0 (0.0%) |
| Finance & Insurance | 30 (55.6%) | 24 (44.4%) |
| Real Estate, Rental & Leasing | 0 (0.0%) | 0 (0.0%) |
| Professional & Scientific | 0 (0.0%) | 87 (100.0%) |
| Enterprise Management | 0 (0.0%) | 0 (0.0%) |
| Administrative & Support | 0 (0.0%) | 0 (0.0%) |
| Educational Services | 0 (0.0%) | 0 (0.0%) |
| Health Care & Social Assistance | 0 (0.0%) | 19 (100.0%) |
| Arts, Entertainment & Recreation | 0 (0.0%) | 0 (0.0%) |
| Accommodation & Food Services | 0 (0.0%) | 103 (100.0%) |
| Public Administration | 39 (100.0%) | 0 (0.0%) |
| Total | 136 (34.3%) | 261 (65.7%) |
Education in Sunnyside
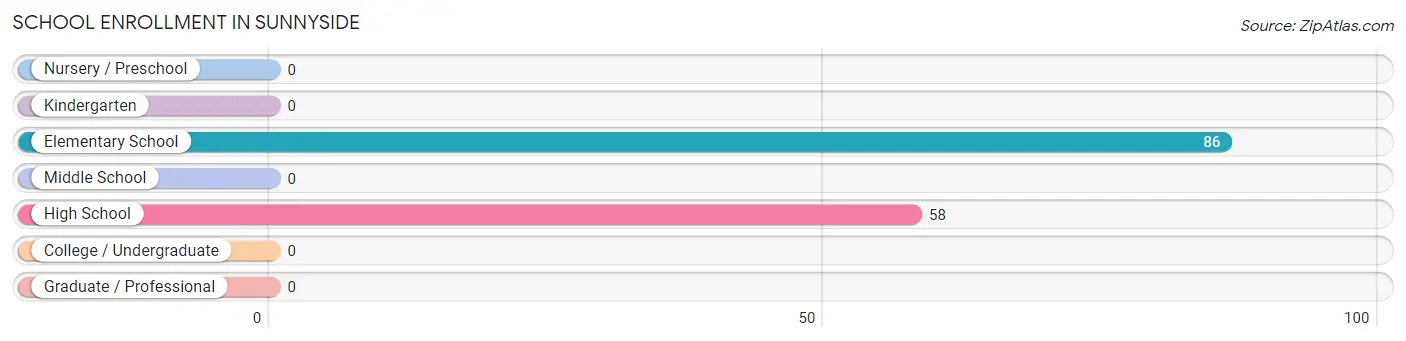
School Enrollment in Sunnyside
The most common levels of schooling among the 144 students in Sunnyside are elementary school (86 | 59.7%), and high school (58 | 40.3%).
| School Level | # Students | % Students |
| Nursery / Preschool | 0 | 0.0% |
| Kindergarten | 0 | 0.0% |
| Elementary School | 86 | 59.7% |
| Middle School | 0 | 0.0% |
| High School | 58 | 40.3% |
| College / Undergraduate | 0 | 0.0% |
| Graduate / Professional | 0 | 0.0% |
| Total | 144 | 100.0% |
School Enrollment by Age by Funding Source in Sunnyside
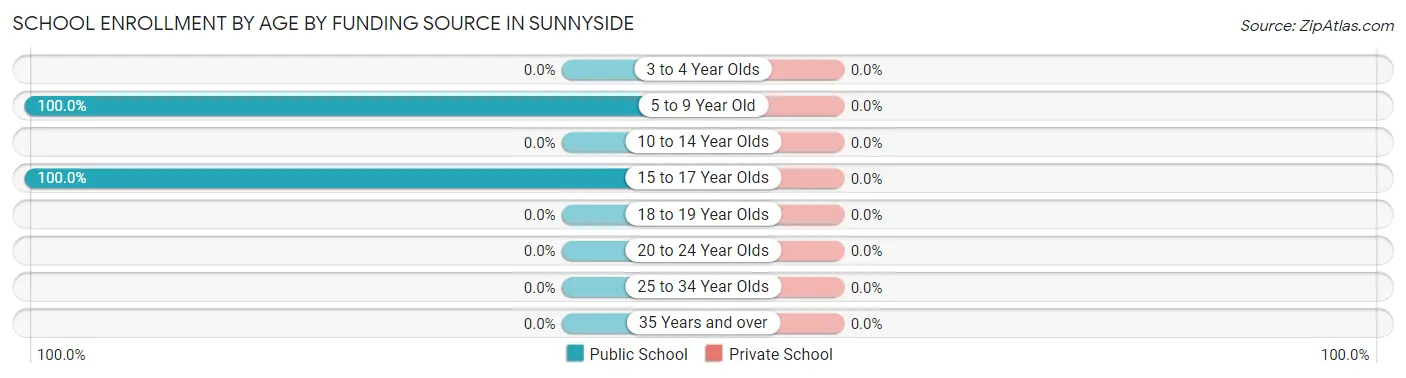
| Age Bracket | Public School | Private School |
| 3 to 4 Year Olds | 0 (0.0%) | 0 (0.0%) |
| 5 to 9 Year Old | 86 (100.0%) | 0 (0.0%) |
| 10 to 14 Year Olds | 0 (0.0%) | 0 (0.0%) |
| 15 to 17 Year Olds | 58 (100.0%) | 0 (0.0%) |
| 18 to 19 Year Olds | 0 (0.0%) | 0 (0.0%) |
| 20 to 24 Year Olds | 0 (0.0%) | 0 (0.0%) |
| 25 to 34 Year Olds | 0 (0.0%) | 0 (0.0%) |
| 35 Years and over | 0 (0.0%) | 0 (0.0%) |
| Total | 144 (100.0%) | 0 (0.0%) |
Educational Attainment by Field of Study in Sunnyside
Social sciences (33 | 57.9%), and business (24 | 42.1%) are the most common fields of study among 57 individuals in Sunnyside who have obtained a bachelor's degree or higher.
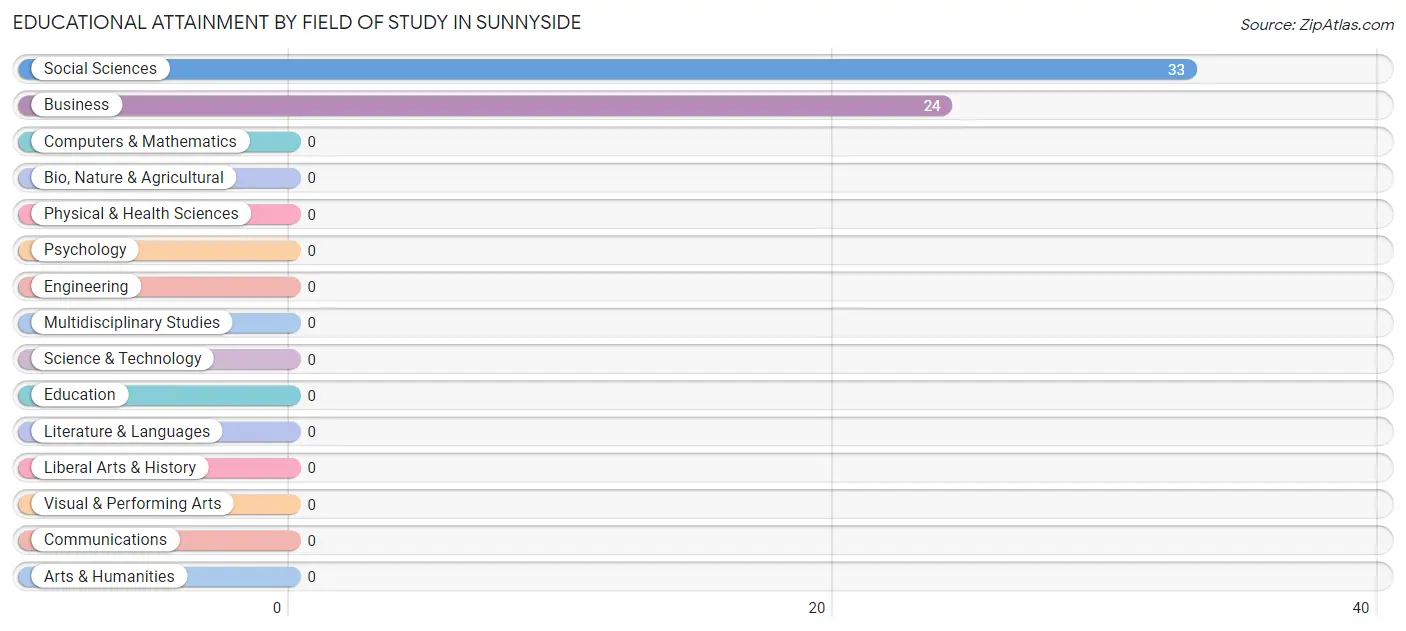
| Field of Study | # Graduates | % Graduates |
| Computers & Mathematics | 0 | 0.0% |
| Bio, Nature & Agricultural | 0 | 0.0% |
| Physical & Health Sciences | 0 | 0.0% |
| Psychology | 0 | 0.0% |
| Social Sciences | 33 | 57.9% |
| Engineering | 0 | 0.0% |
| Multidisciplinary Studies | 0 | 0.0% |
| Science & Technology | 0 | 0.0% |
| Business | 24 | 42.1% |
| Education | 0 | 0.0% |
| Literature & Languages | 0 | 0.0% |
| Liberal Arts & History | 0 | 0.0% |
| Visual & Performing Arts | 0 | 0.0% |
| Communications | 0 | 0.0% |
| Arts & Humanities | 0 | 0.0% |
| Total | 57 | 100.0% |
Transportation & Commute in Sunnyside
Vehicle Availability by Sex in Sunnyside
The most prevalent vehicle ownership categories in Sunnyside are males with 2 vehicles (97, accounting for 71.3%) and females with 2 vehicles (106, making up 40.9%).
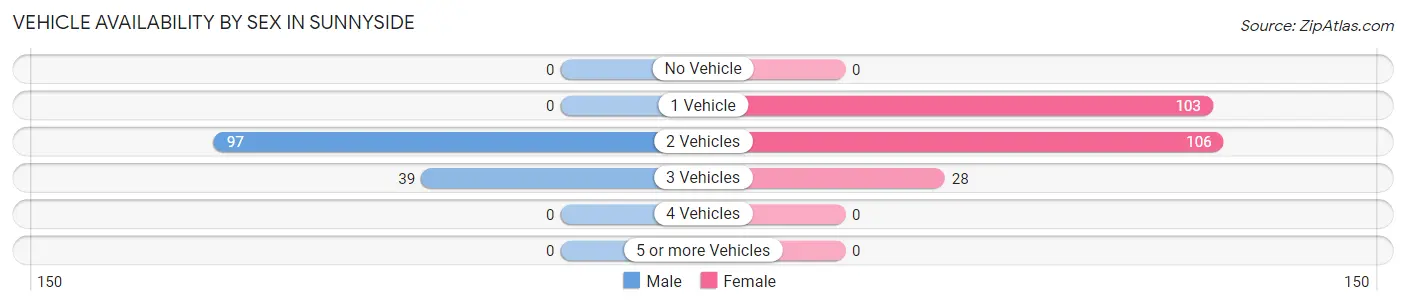
| Vehicles Available | Male | Female |
| No Vehicle | 0 (0.0%) | 0 (0.0%) |
| 1 Vehicle | 0 (0.0%) | 103 (43.5%) |
| 2 Vehicles | 97 (71.3%) | 106 (44.7%) |
| 3 Vehicles | 39 (28.7%) | 28 (11.8%) |
| 4 Vehicles | 0 (0.0%) | 0 (0.0%) |
| 5 or more Vehicles | 0 (0.0%) | 0 (0.0%) |
| Total | 136 (100.0%) | 237 (100.0%) |
Commute Time in Sunnyside
The most frequently occuring commute durations in Sunnyside are 10 to 14 minutes (223 commuters, 59.8%), 20 to 24 minutes (103 commuters, 27.6%), and 60 to 89 minutes (28 commuters, 7.5%).
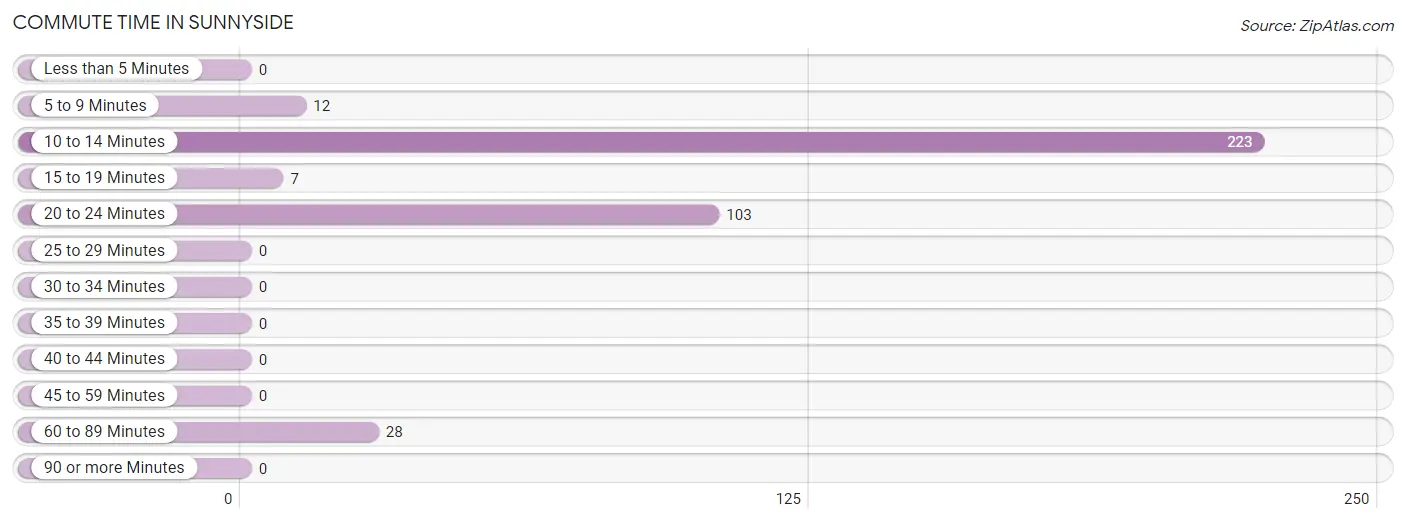
| Commute Time | # Commuters | % Commuters |
| Less than 5 Minutes | 0 | 0.0% |
| 5 to 9 Minutes | 12 | 3.2% |
| 10 to 14 Minutes | 223 | 59.8% |
| 15 to 19 Minutes | 7 | 1.9% |
| 20 to 24 Minutes | 103 | 27.6% |
| 25 to 29 Minutes | 0 | 0.0% |
| 30 to 34 Minutes | 0 | 0.0% |
| 35 to 39 Minutes | 0 | 0.0% |
| 40 to 44 Minutes | 0 | 0.0% |
| 45 to 59 Minutes | 0 | 0.0% |
| 60 to 89 Minutes | 28 | 7.5% |
| 90 or more Minutes | 0 | 0.0% |
Commute Time by Sex in Sunnyside
The most common commute times in Sunnyside are 10 to 14 minutes (136 commuters, 100.0%) for males and 20 to 24 minutes (103 commuters, 43.5%) for females.
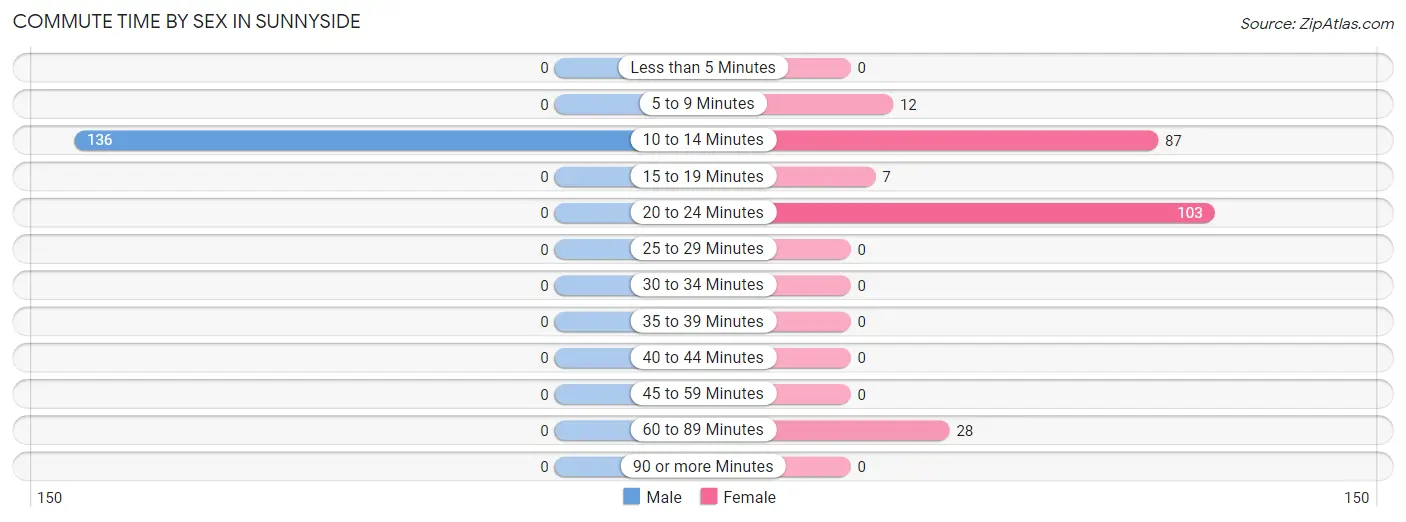
| Commute Time | Male | Female |
| Less than 5 Minutes | 0 (0.0%) | 0 (0.0%) |
| 5 to 9 Minutes | 0 (0.0%) | 12 (5.1%) |
| 10 to 14 Minutes | 136 (100.0%) | 87 (36.7%) |
| 15 to 19 Minutes | 0 (0.0%) | 7 (2.9%) |
| 20 to 24 Minutes | 0 (0.0%) | 103 (43.5%) |
| 25 to 29 Minutes | 0 (0.0%) | 0 (0.0%) |
| 30 to 34 Minutes | 0 (0.0%) | 0 (0.0%) |
| 35 to 39 Minutes | 0 (0.0%) | 0 (0.0%) |
| 40 to 44 Minutes | 0 (0.0%) | 0 (0.0%) |
| 45 to 59 Minutes | 0 (0.0%) | 0 (0.0%) |
| 60 to 89 Minutes | 0 (0.0%) | 28 (11.8%) |
| 90 or more Minutes | 0 (0.0%) | 0 (0.0%) |
Time of Departure to Work by Sex in Sunnyside
The most frequent times of departure to work in Sunnyside are 6:30 AM to 6:59 AM (39, 28.7%) for males and 7:00 AM to 7:29 AM (131, 55.3%) for females.
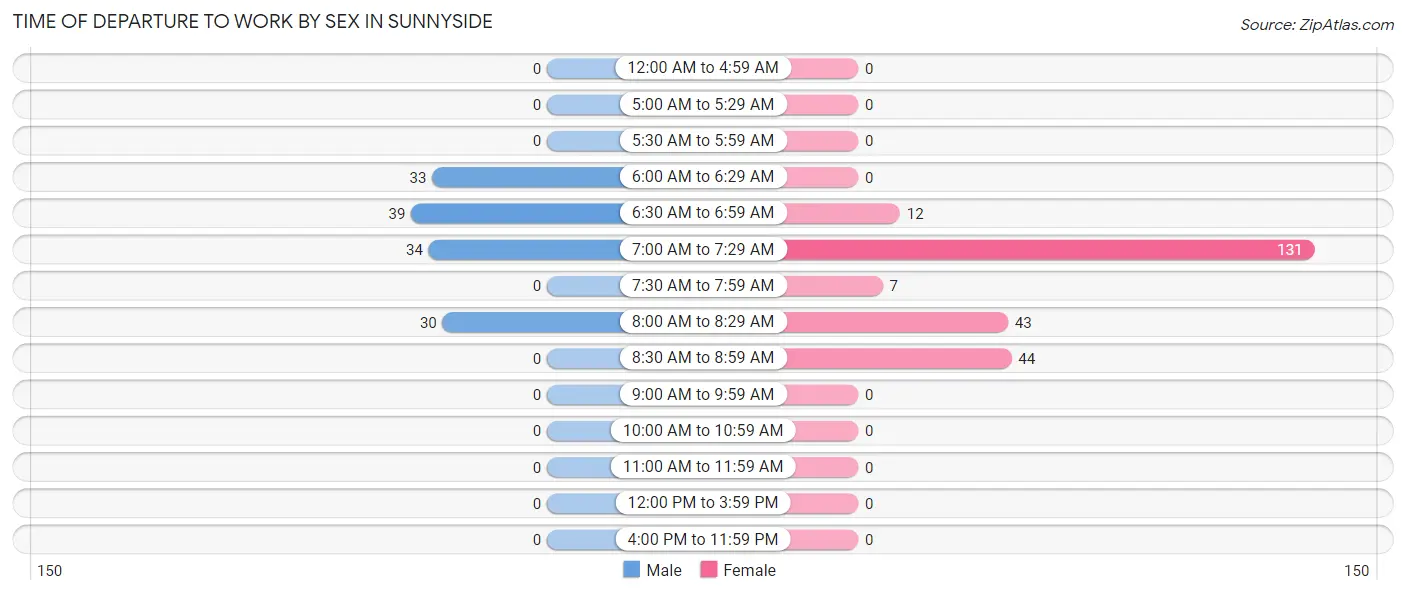
| Time of Departure | Male | Female |
| 12:00 AM to 4:59 AM | 0 (0.0%) | 0 (0.0%) |
| 5:00 AM to 5:29 AM | 0 (0.0%) | 0 (0.0%) |
| 5:30 AM to 5:59 AM | 0 (0.0%) | 0 (0.0%) |
| 6:00 AM to 6:29 AM | 33 (24.3%) | 0 (0.0%) |
| 6:30 AM to 6:59 AM | 39 (28.7%) | 12 (5.1%) |
| 7:00 AM to 7:29 AM | 34 (25.0%) | 131 (55.3%) |
| 7:30 AM to 7:59 AM | 0 (0.0%) | 7 (2.9%) |
| 8:00 AM to 8:29 AM | 30 (22.1%) | 43 (18.1%) |
| 8:30 AM to 8:59 AM | 0 (0.0%) | 44 (18.6%) |
| 9:00 AM to 9:59 AM | 0 (0.0%) | 0 (0.0%) |
| 10:00 AM to 10:59 AM | 0 (0.0%) | 0 (0.0%) |
| 11:00 AM to 11:59 AM | 0 (0.0%) | 0 (0.0%) |
| 12:00 PM to 3:59 PM | 0 (0.0%) | 0 (0.0%) |
| 4:00 PM to 11:59 PM | 0 (0.0%) | 0 (0.0%) |
| Total | 136 (100.0%) | 237 (100.0%) |
Housing Occupancy in Sunnyside
Occupancy by Ownership in Sunnyside
Of the total 408 dwellings in Sunnyside, owner-occupied units account for 408 (100.0%), while renter-occupied units make up 0 (0.0%).
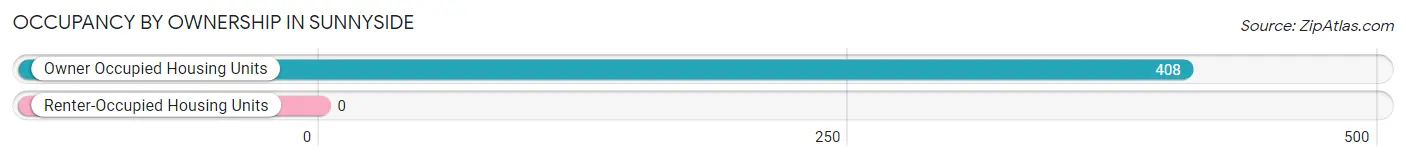
| Occupancy | # Housing Units | % Housing Units |
| Owner Occupied Housing Units | 408 | 100.0% |
| Renter-Occupied Housing Units | 0 | 0.0% |
| Total Occupied Housing Units | 408 | 100.0% |
Occupancy by Household Size in Sunnyside
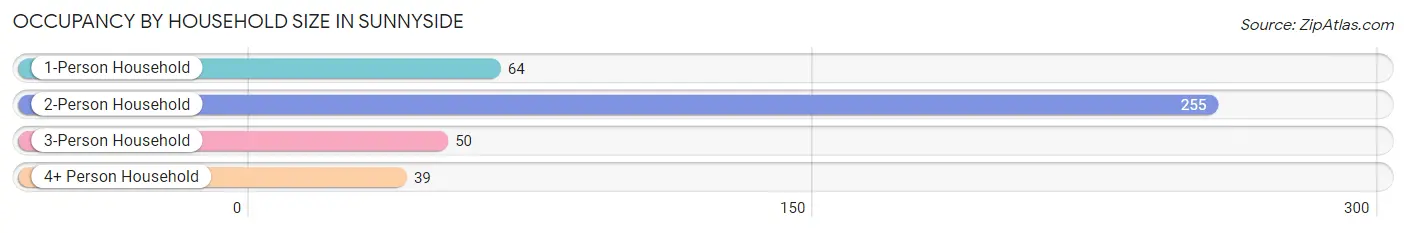
| Household Size | # Housing Units | % Housing Units |
| 1-Person Household | 64 | 15.7% |
| 2-Person Household | 255 | 62.5% |
| 3-Person Household | 50 | 12.2% |
| 4+ Person Household | 39 | 9.6% |
| Total Housing Units | 408 | 100.0% |
Occupancy by Ownership by Household Size in Sunnyside
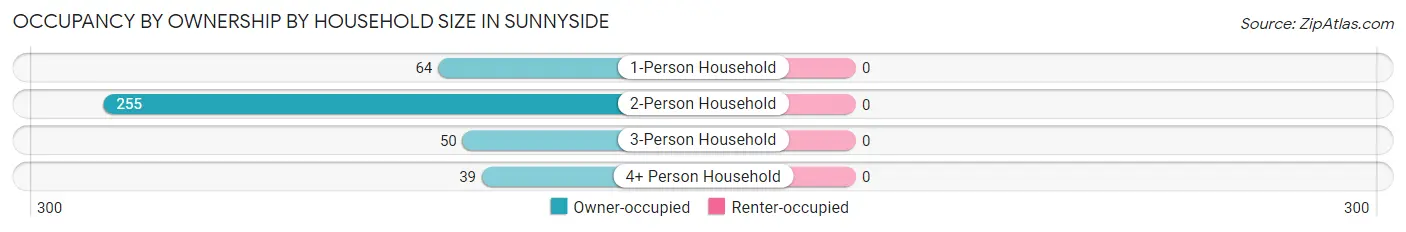
| Household Size | Owner-occupied | Renter-occupied |
| 1-Person Household | 64 (100.0%) | 0 (0.0%) |
| 2-Person Household | 255 (100.0%) | 0 (0.0%) |
| 3-Person Household | 50 (100.0%) | 0 (0.0%) |
| 4+ Person Household | 39 (100.0%) | 0 (0.0%) |
| Total Housing Units | 408 (100.0%) | 0 (0.0%) |
Occupancy by Educational Attainment in Sunnyside
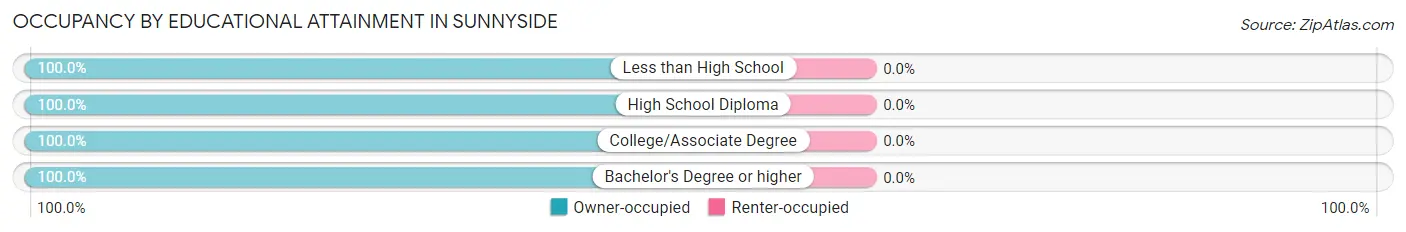
| Household Size | Owner-occupied | Renter-occupied |
| Less than High School | 33 (100.0%) | 0 (0.0%) |
| High School Diploma | 158 (100.0%) | 0 (0.0%) |
| College/Associate Degree | 184 (100.0%) | 0 (0.0%) |
| Bachelor's Degree or higher | 33 (100.0%) | 0 (0.0%) |
Occupancy by Age of Householder in Sunnyside
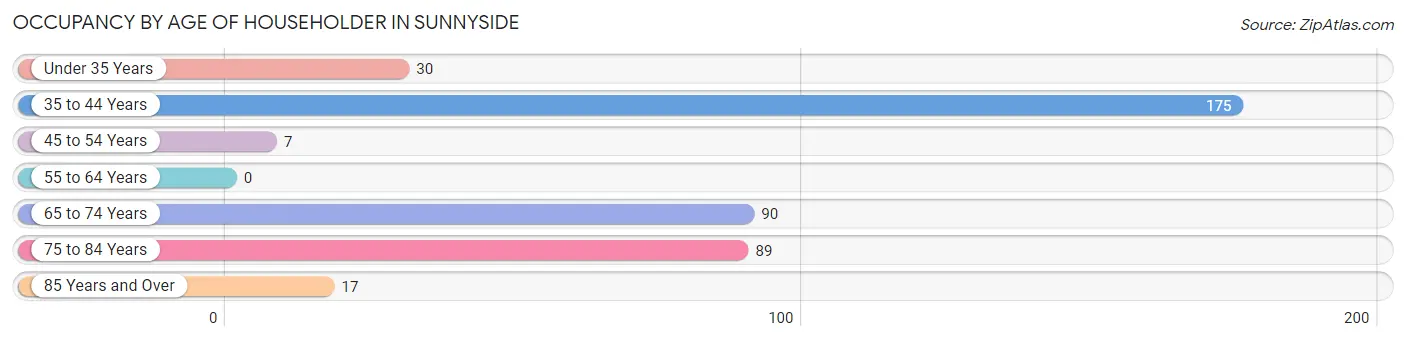
| Age Bracket | # Households | % Households |
| Under 35 Years | 30 | 7.3% |
| 35 to 44 Years | 175 | 42.9% |
| 45 to 54 Years | 7 | 1.7% |
| 55 to 64 Years | 0 | 0.0% |
| 65 to 74 Years | 90 | 22.1% |
| 75 to 84 Years | 89 | 21.8% |
| 85 Years and Over | 17 | 4.2% |
| Total | 408 | 100.0% |
Housing Finances in Sunnyside
Median Income by Occupancy in Sunnyside
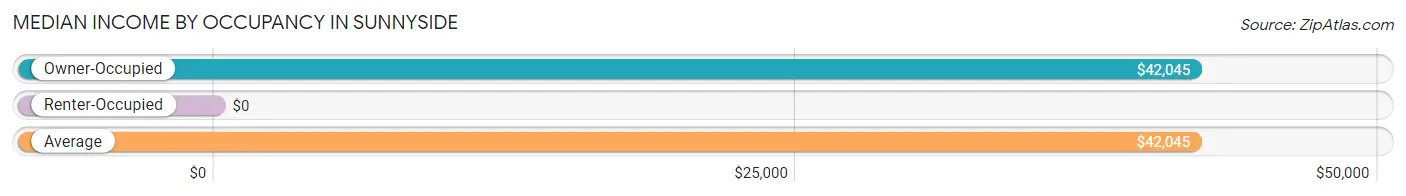
| Occupancy Type | # Households | Median Income |
| Owner-Occupied | 408 (100.0%) | $42,045 |
| Renter-Occupied | 0 (0.0%) | $0 |
| Average | 408 (100.0%) | $42,045 |
Occupancy by Householder Income Bracket in Sunnyside
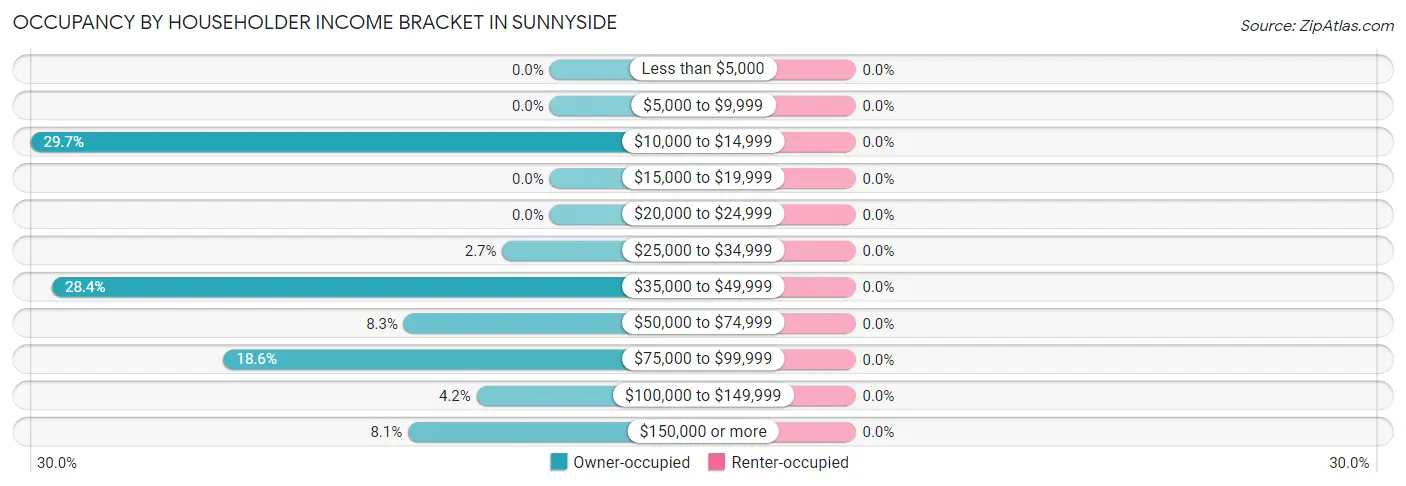
| Income Bracket | Owner-occupied | Renter-occupied |
| Less than $5,000 | 0 (0.0%) | 0 (0.0%) |
| $5,000 to $9,999 | 0 (0.0%) | 0 (0.0%) |
| $10,000 to $14,999 | 121 (29.7%) | 0 (0.0%) |
| $15,000 to $19,999 | 0 (0.0%) | 0 (0.0%) |
| $20,000 to $24,999 | 0 (0.0%) | 0 (0.0%) |
| $25,000 to $34,999 | 11 (2.7%) | 0 (0.0%) |
| $35,000 to $49,999 | 116 (28.4%) | 0 (0.0%) |
| $50,000 to $74,999 | 34 (8.3%) | 0 (0.0%) |
| $75,000 to $99,999 | 76 (18.6%) | 0 (0.0%) |
| $100,000 to $149,999 | 17 (4.2%) | 0 (0.0%) |
| $150,000 or more | 33 (8.1%) | 0 (0.0%) |
| Total | 408 (100.0%) | 0 (0.0%) |
Monthly Housing Cost Tiers in Sunnyside
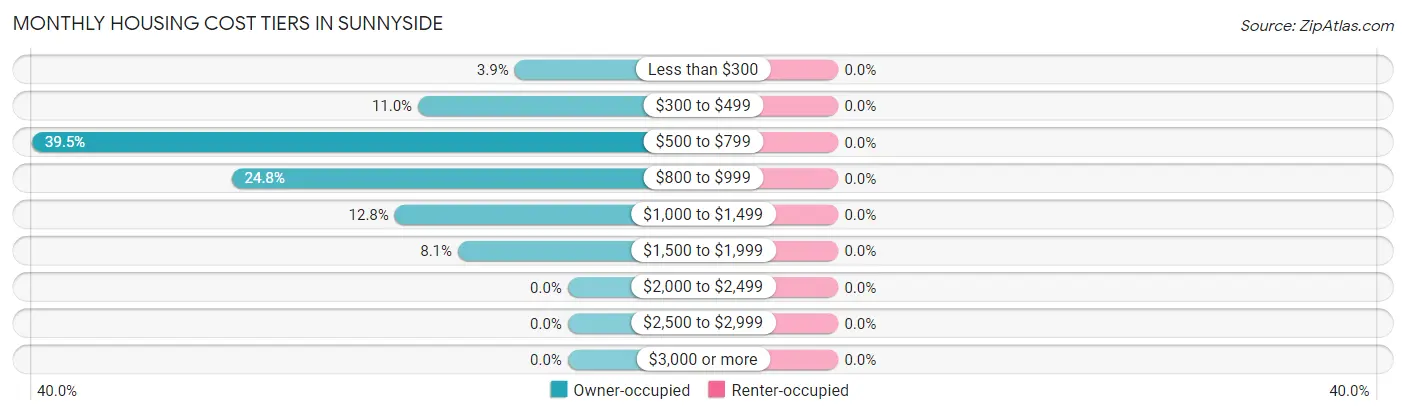
| Monthly Cost | Owner-occupied | Renter-occupied |
| Less than $300 | 16 (3.9%) | 0 (0.0%) |
| $300 to $499 | 45 (11.0%) | 0 (0.0%) |
| $500 to $799 | 161 (39.5%) | 0 (0.0%) |
| $800 to $999 | 101 (24.7%) | 0 (0.0%) |
| $1,000 to $1,499 | 52 (12.8%) | 0 (0.0%) |
| $1,500 to $1,999 | 33 (8.1%) | 0 (0.0%) |
| $2,000 to $2,499 | 0 (0.0%) | 0 (0.0%) |
| $2,500 to $2,999 | 0 (0.0%) | 0 (0.0%) |
| $3,000 or more | 0 (0.0%) | 0 (0.0%) |
| Total | 408 (100.0%) | 0 (0.0%) |
Physical Housing Characteristics in Sunnyside
Housing Structures in Sunnyside
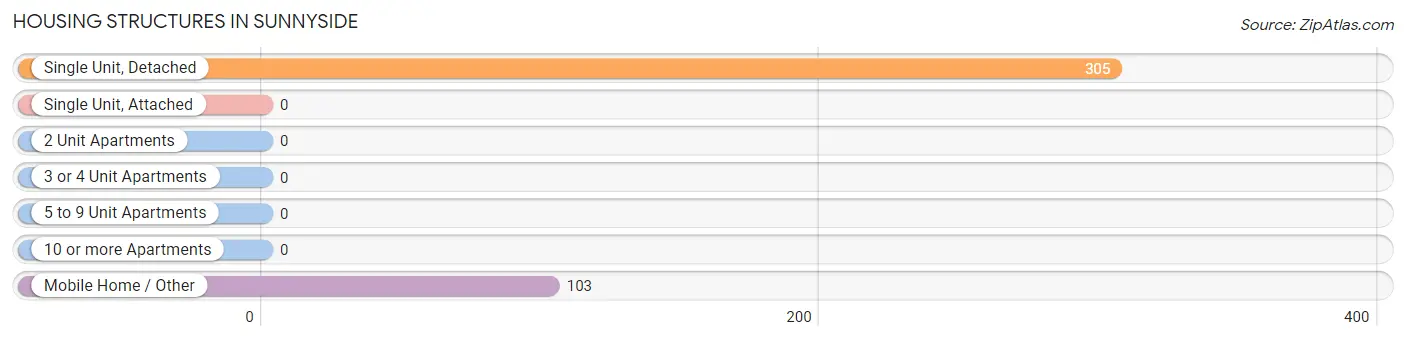
| Structure Type | # Housing Units | % Housing Units |
| Single Unit, Detached | 305 | 74.8% |
| Single Unit, Attached | 0 | 0.0% |
| 2 Unit Apartments | 0 | 0.0% |
| 3 or 4 Unit Apartments | 0 | 0.0% |
| 5 to 9 Unit Apartments | 0 | 0.0% |
| 10 or more Apartments | 0 | 0.0% |
| Mobile Home / Other | 103 | 25.3% |
| Total | 408 | 100.0% |
Housing Structures by Occupancy in Sunnyside
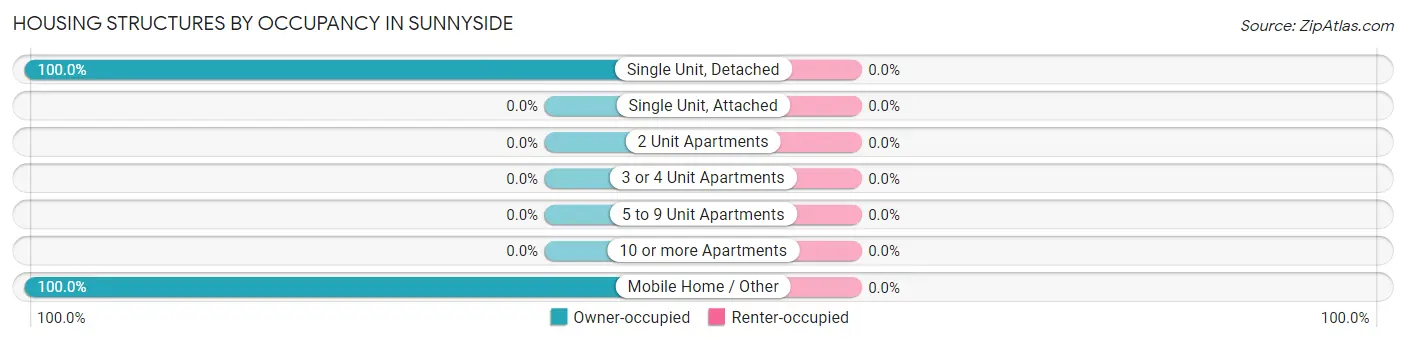
| Structure Type | Owner-occupied | Renter-occupied |
| Single Unit, Detached | 305 (100.0%) | 0 (0.0%) |
| Single Unit, Attached | 0 (0.0%) | 0 (0.0%) |
| 2 Unit Apartments | 0 (0.0%) | 0 (0.0%) |
| 3 or 4 Unit Apartments | 0 (0.0%) | 0 (0.0%) |
| 5 to 9 Unit Apartments | 0 (0.0%) | 0 (0.0%) |
| 10 or more Apartments | 0 (0.0%) | 0 (0.0%) |
| Mobile Home / Other | 103 (100.0%) | 0 (0.0%) |
| Total | 408 (100.0%) | 0 (0.0%) |
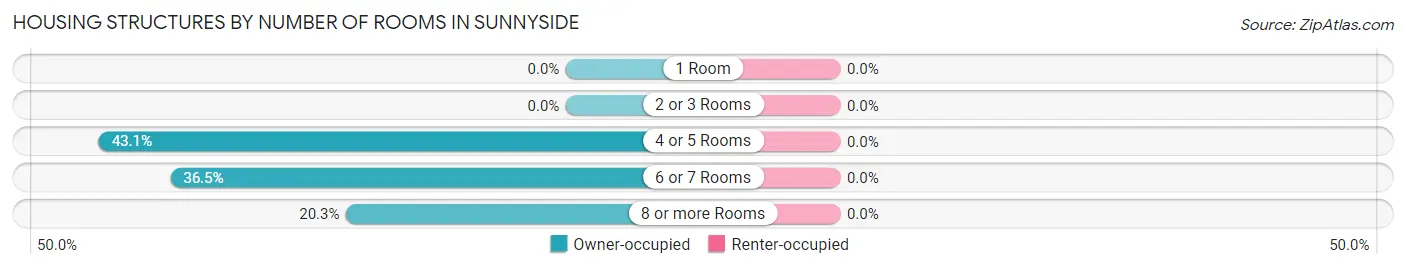
Housing Structures by Number of Rooms in Sunnyside
| Number of Rooms | Owner-occupied | Renter-occupied |
| 1 Room | 0 (0.0%) | 0 (0.0%) |
| 2 or 3 Rooms | 0 (0.0%) | 0 (0.0%) |
| 4 or 5 Rooms | 176 (43.1%) | 0 (0.0%) |
| 6 or 7 Rooms | 149 (36.5%) | 0 (0.0%) |
| 8 or more Rooms | 83 (20.3%) | 0 (0.0%) |
| Total | 408 (100.0%) | 0 (0.0%) |
Housing Structure by Heating Type in Sunnyside
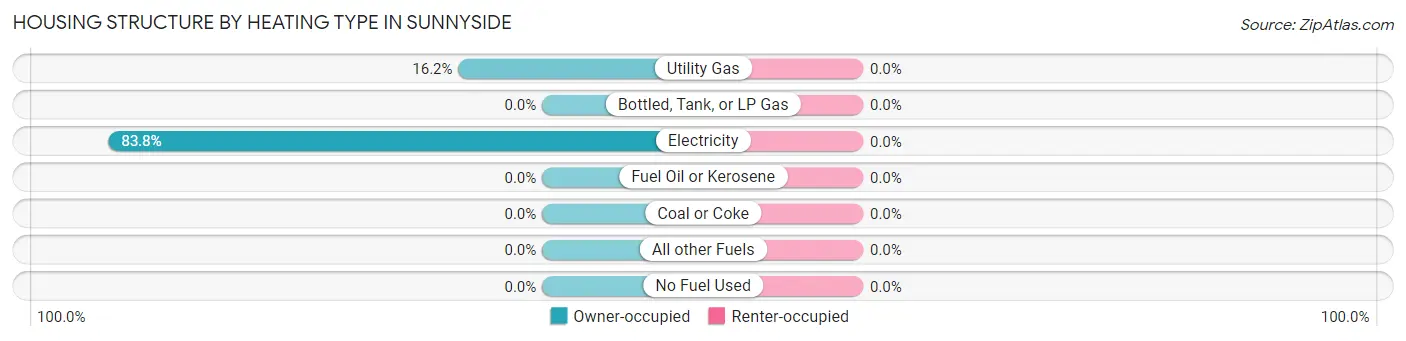
| Heating Type | Owner-occupied | Renter-occupied |
| Utility Gas | 66 (16.2%) | 0 (0.0%) |
| Bottled, Tank, or LP Gas | 0 (0.0%) | 0 (0.0%) |
| Electricity | 342 (83.8%) | 0 (0.0%) |
| Fuel Oil or Kerosene | 0 (0.0%) | 0 (0.0%) |
| Coal or Coke | 0 (0.0%) | 0 (0.0%) |
| All other Fuels | 0 (0.0%) | 0 (0.0%) |
| No Fuel Used | 0 (0.0%) | 0 (0.0%) |
| Total | 408 (100.0%) | 0 (0.0%) |
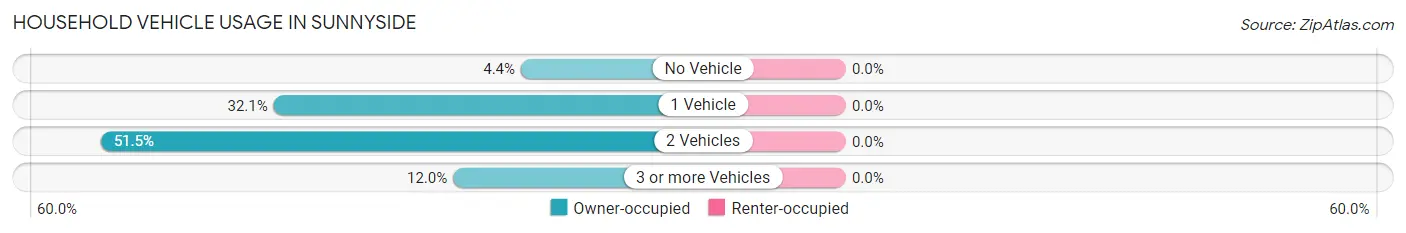
Household Vehicle Usage in Sunnyside
| Vehicles per Household | Owner-occupied | Renter-occupied |
| No Vehicle | 18 (4.4%) | 0 (0.0%) |
| 1 Vehicle | 131 (32.1%) | 0 (0.0%) |
| 2 Vehicles | 210 (51.5%) | 0 (0.0%) |
| 3 or more Vehicles | 49 (12.0%) | 0 (0.0%) |
| Total | 408 (100.0%) | 0 (0.0%) |
Real Estate & Mortgages in Sunnyside
Real Estate and Mortgage Overview in Sunnyside
| Characteristic | Without Mortgage | With Mortgage |
| Housing Units | 162 | 246 |
| Median Property Value | - | - |
| Median Household Income | $41,136 | $33 |
| Monthly Housing Costs | $720 | $0 |
| Real Estate Taxes | - | - |
Property Value by Mortgage Status in Sunnyside
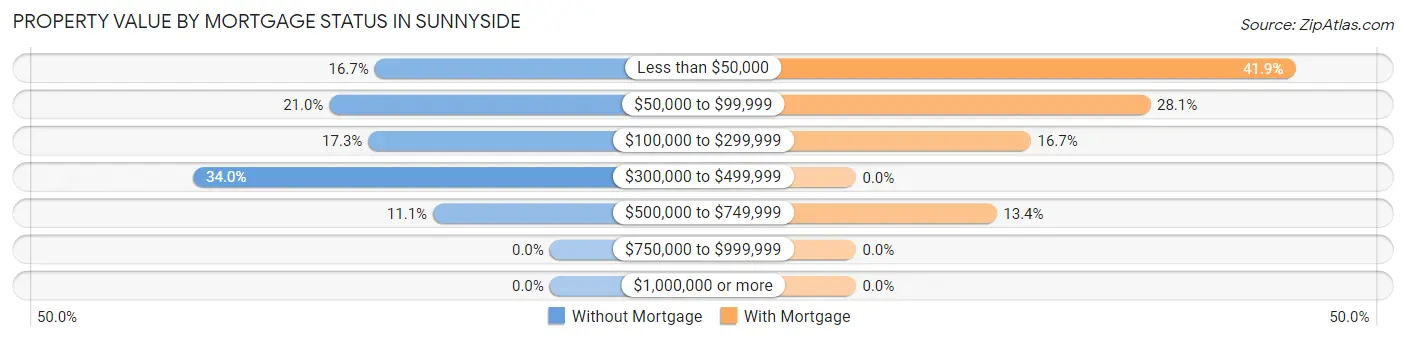
| Property Value | Without Mortgage | With Mortgage |
| Less than $50,000 | 27 (16.7%) | 103 (41.9%) |
| $50,000 to $99,999 | 34 (21.0%) | 69 (28.1%) |
| $100,000 to $299,999 | 28 (17.3%) | 41 (16.7%) |
| $300,000 to $499,999 | 55 (34.0%) | 0 (0.0%) |
| $500,000 to $749,999 | 18 (11.1%) | 33 (13.4%) |
| $750,000 to $999,999 | 0 (0.0%) | 0 (0.0%) |
| $1,000,000 or more | 0 (0.0%) | 0 (0.0%) |
| Total | 162 (100.0%) | 246 (100.0%) |
Household Income by Mortgage Status in Sunnyside
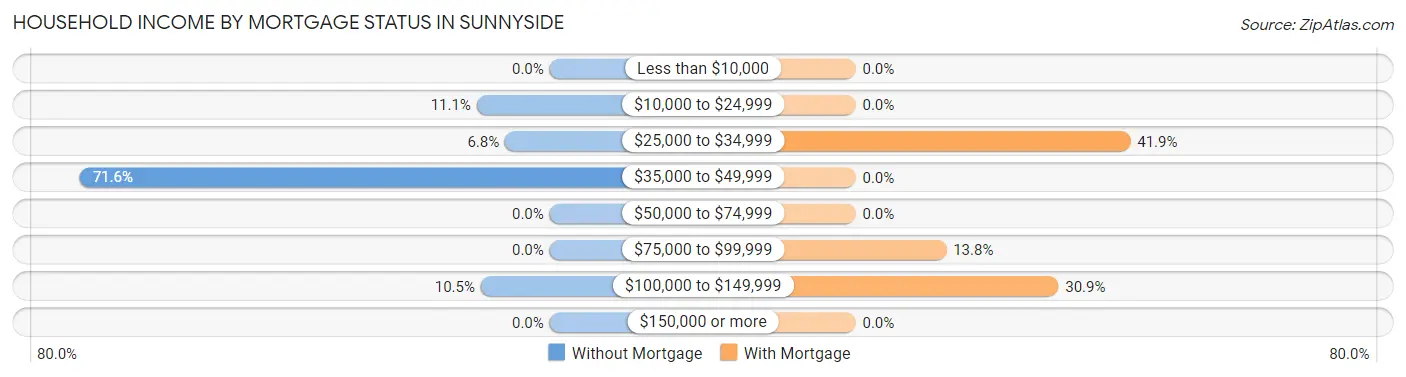
| Household Income | Without Mortgage | With Mortgage |
| Less than $10,000 | 0 (0.0%) | 0 (0.0%) |
| $10,000 to $24,999 | 18 (11.1%) | 0 (0.0%) |
| $25,000 to $34,999 | 11 (6.8%) | 103 (41.9%) |
| $35,000 to $49,999 | 116 (71.6%) | 0 (0.0%) |
| $50,000 to $74,999 | 0 (0.0%) | 0 (0.0%) |
| $75,000 to $99,999 | 0 (0.0%) | 34 (13.8%) |
| $100,000 to $149,999 | 17 (10.5%) | 76 (30.9%) |
| $150,000 or more | 0 (0.0%) | 0 (0.0%) |
| Total | 162 (100.0%) | 246 (100.0%) |
Property Value to Household Income Ratio in Sunnyside
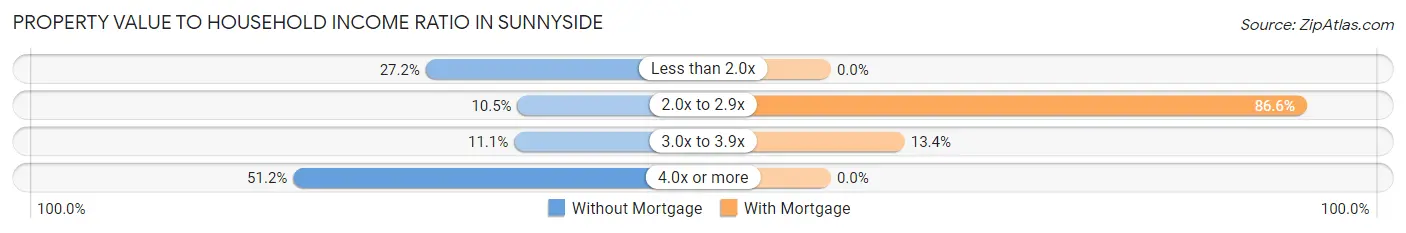
| Value-to-Income Ratio | Without Mortgage | With Mortgage |
| Less than 2.0x | 44 (27.2%) | 0 (0.0%) |
| 2.0x to 2.9x | 17 (10.5%) | 213 (86.6%) |
| 3.0x to 3.9x | 18 (11.1%) | 33 (13.4%) |
| 4.0x or more | 83 (51.2%) | 0 (0.0%) |
| Total | 162 (100.0%) | 246 (100.0%) |
Real Estate Taxes by Mortgage Status in Sunnyside
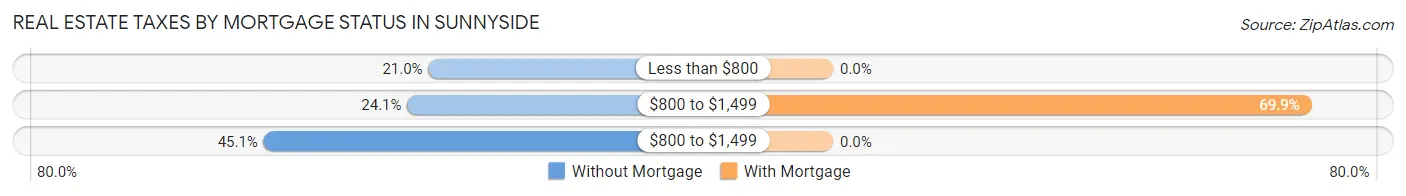
| Property Taxes | Without Mortgage | With Mortgage |
| Less than $800 | 34 (21.0%) | 0 (0.0%) |
| $800 to $1,499 | 39 (24.1%) | 172 (69.9%) |
| $800 to $1,499 | 73 (45.1%) | 0 (0.0%) |
| Total | 162 (100.0%) | 246 (100.0%) |
Health & Disability in Sunnyside
Health Insurance Coverage by Age in Sunnyside
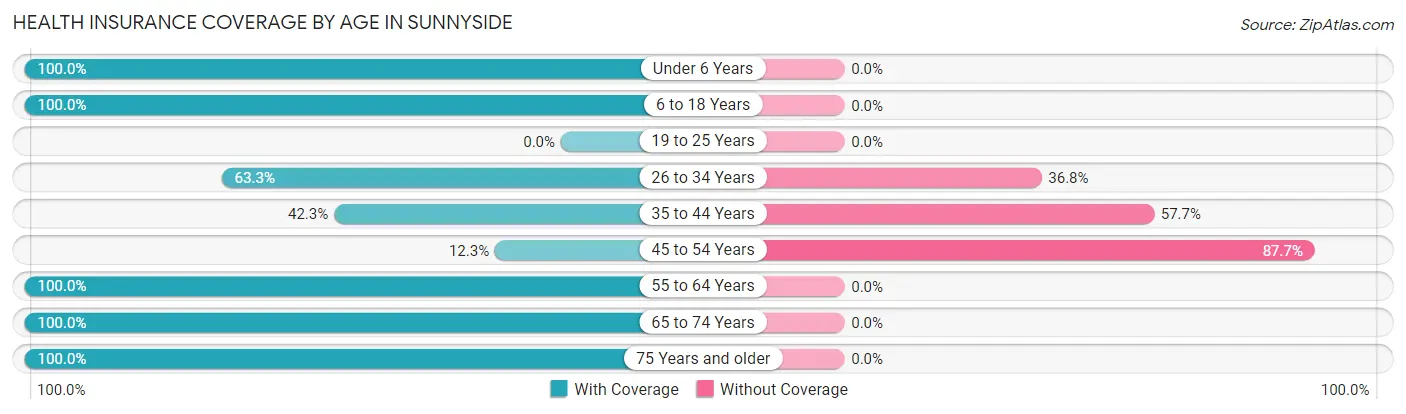
| Age Bracket | With Coverage | Without Coverage |
| Under 6 Years | 42 (100.0%) | 0 (0.0%) |
| 6 to 18 Years | 144 (100.0%) | 0 (0.0%) |
| 19 to 25 Years | 0 (0.0%) | 0 (0.0%) |
| 26 to 34 Years | 74 (63.2%) | 43 (36.7%) |
| 35 to 44 Years | 96 (42.3%) | 131 (57.7%) |
| 45 to 54 Years | 7 (12.3%) | 50 (87.7%) |
| 55 to 64 Years | 31 (100.0%) | 0 (0.0%) |
| 65 to 74 Years | 133 (100.0%) | 0 (0.0%) |
| 75 Years and older | 211 (100.0%) | 0 (0.0%) |
| Total | 738 (76.7%) | 224 (23.3%) |
Health Insurance Coverage by Citizenship Status in Sunnyside
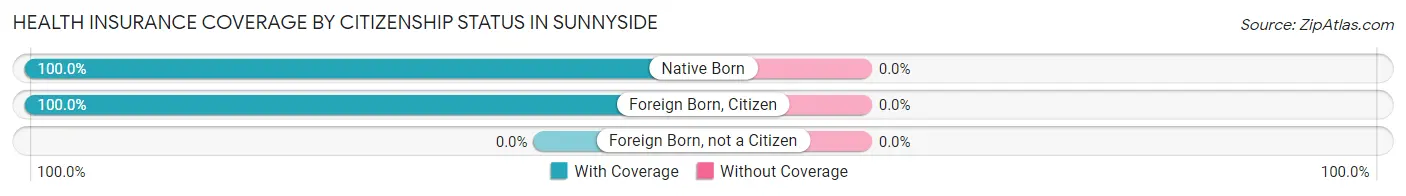
| Citizenship Status | With Coverage | Without Coverage |
| Native Born | 42 (100.0%) | 0 (0.0%) |
| Foreign Born, Citizen | 144 (100.0%) | 0 (0.0%) |
| Foreign Born, not a Citizen | 0 (0.0%) | 0 (0.0%) |
Health Insurance Coverage by Household Income in Sunnyside
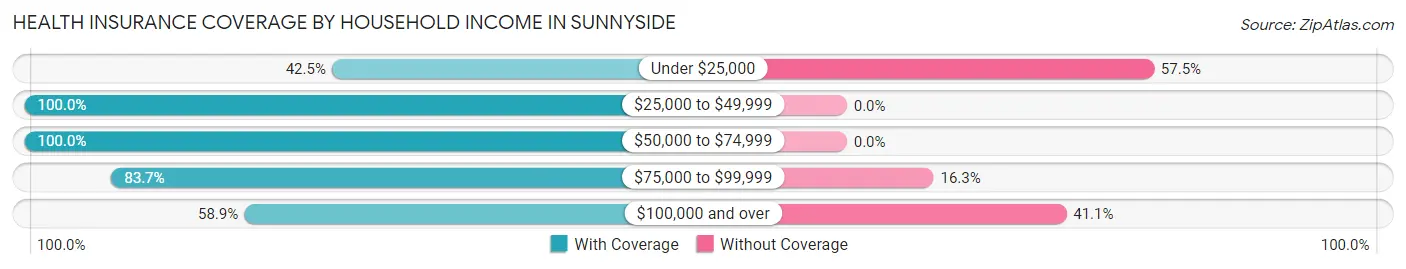
| Household Income | With Coverage | Without Coverage |
| Under $25,000 | 76 (42.5%) | 103 (57.5%) |
| $25,000 to $49,999 | 273 (100.0%) | 0 (0.0%) |
| $50,000 to $74,999 | 67 (100.0%) | 0 (0.0%) |
| $75,000 to $99,999 | 206 (83.7%) | 40 (16.3%) |
| $100,000 and over | 116 (58.9%) | 81 (41.1%) |
Public vs Private Health Insurance Coverage by Age in Sunnyside
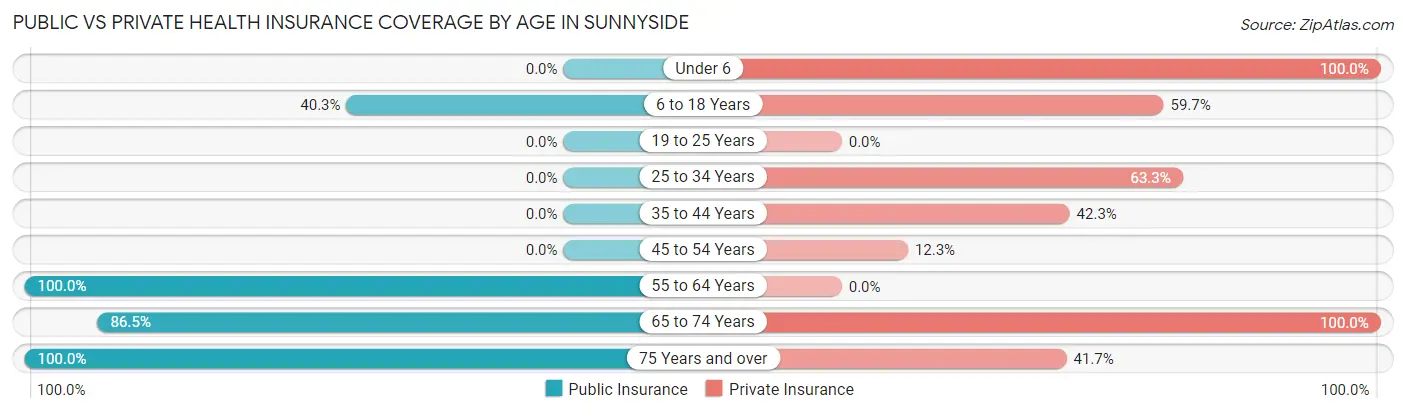
| Age Bracket | Public Insurance | Private Insurance |
| Under 6 | 0 (0.0%) | 42 (100.0%) |
| 6 to 18 Years | 58 (40.3%) | 86 (59.7%) |
| 19 to 25 Years | 0 (0.0%) | 0 (0.0%) |
| 25 to 34 Years | 0 (0.0%) | 74 (63.2%) |
| 35 to 44 Years | 0 (0.0%) | 96 (42.3%) |
| 45 to 54 Years | 0 (0.0%) | 7 (12.3%) |
| 55 to 64 Years | 31 (100.0%) | 0 (0.0%) |
| 65 to 74 Years | 115 (86.5%) | 133 (100.0%) |
| 75 Years and over | 211 (100.0%) | 88 (41.7%) |
| Total | 415 (43.1%) | 526 (54.7%) |
Disability Status by Sex by Age in Sunnyside
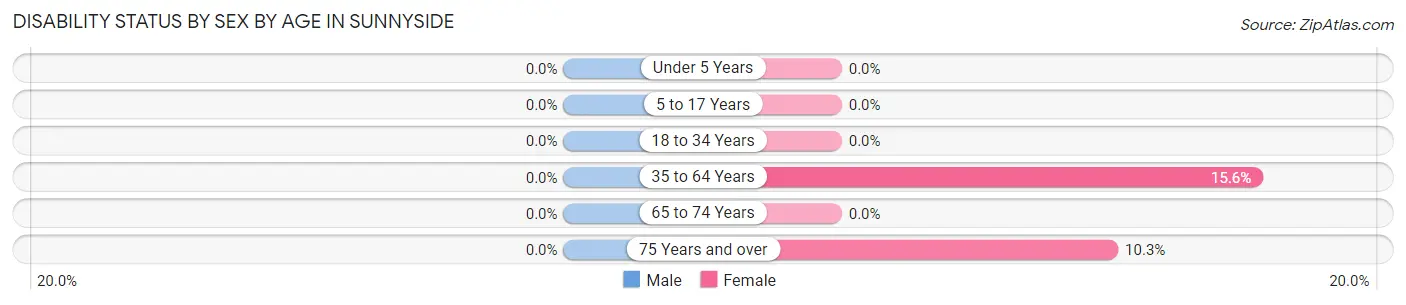
| Age Bracket | Male | Female |
| Under 5 Years | 0 (0.0%) | 0 (0.0%) |
| 5 to 17 Years | 0 (0.0%) | 0 (0.0%) |
| 18 to 34 Years | 0 (0.0%) | 0 (0.0%) |
| 35 to 64 Years | 0 (0.0%) | 38 (15.6%) |
| 65 to 74 Years | 0 (0.0%) | 0 (0.0%) |
| 75 Years and over | 0 (0.0%) | 16 (10.3%) |
Disability Class by Sex by Age in Sunnyside
Disability Class: Hearing Difficulty
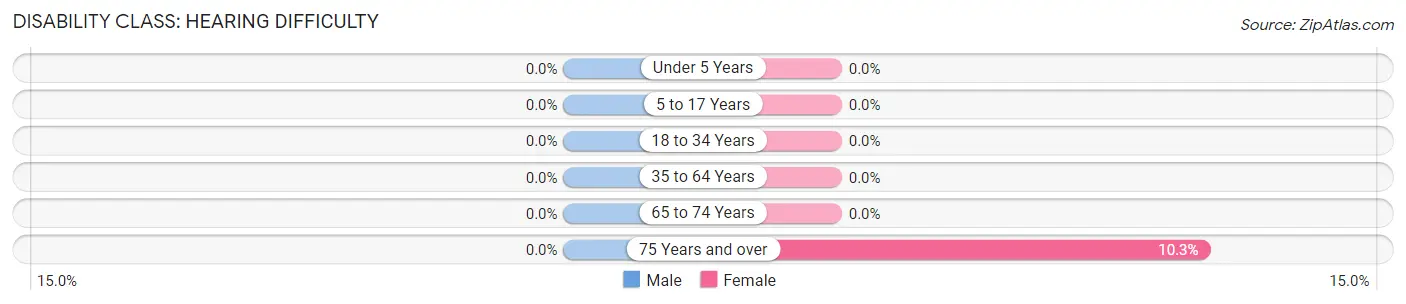
| Age Bracket | Male | Female |
| Under 5 Years | 0 (0.0%) | 0 (0.0%) |
| 5 to 17 Years | 0 (0.0%) | 0 (0.0%) |
| 18 to 34 Years | 0 (0.0%) | 0 (0.0%) |
| 35 to 64 Years | 0 (0.0%) | 0 (0.0%) |
| 65 to 74 Years | 0 (0.0%) | 0 (0.0%) |
| 75 Years and over | 0 (0.0%) | 16 (10.3%) |
Disability Class: Vision Difficulty
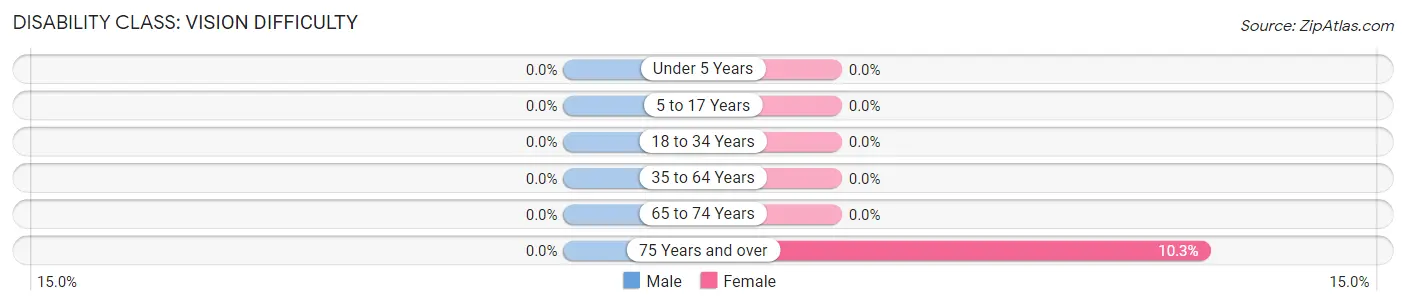
| Age Bracket | Male | Female |
| Under 5 Years | 0 (0.0%) | 0 (0.0%) |
| 5 to 17 Years | 0 (0.0%) | 0 (0.0%) |
| 18 to 34 Years | 0 (0.0%) | 0 (0.0%) |
| 35 to 64 Years | 0 (0.0%) | 0 (0.0%) |
| 65 to 74 Years | 0 (0.0%) | 0 (0.0%) |
| 75 Years and over | 0 (0.0%) | 16 (10.3%) |
Disability Class: Cognitive Difficulty
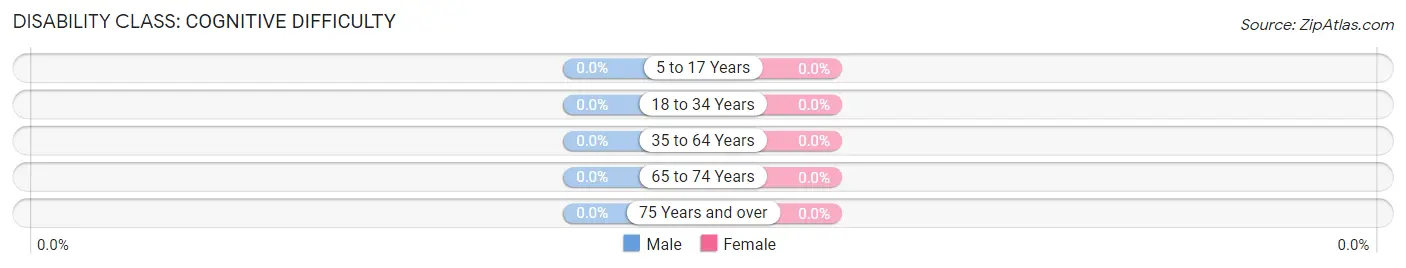
| Age Bracket | Male | Female |
| 5 to 17 Years | 0 (0.0%) | 0 (0.0%) |
| 18 to 34 Years | 0 (0.0%) | 0 (0.0%) |
| 35 to 64 Years | 0 (0.0%) | 0 (0.0%) |
| 65 to 74 Years | 0 (0.0%) | 0 (0.0%) |
| 75 Years and over | 0 (0.0%) | 0 (0.0%) |
Disability Class: Ambulatory Difficulty
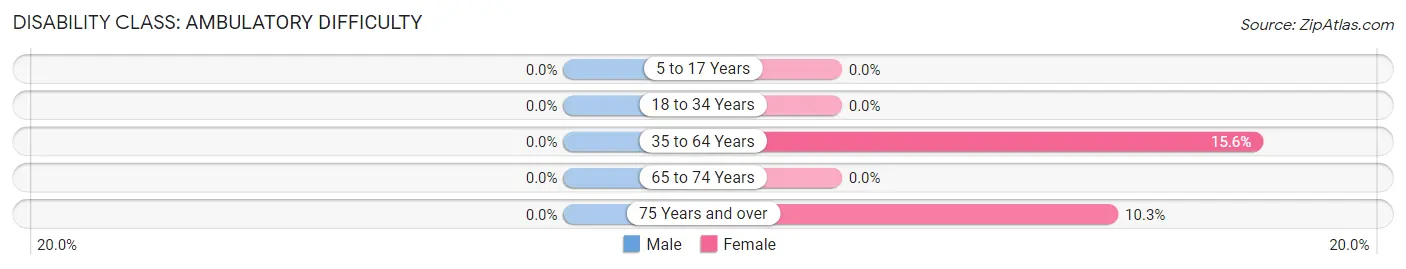
| Age Bracket | Male | Female |
| 5 to 17 Years | 0 (0.0%) | 0 (0.0%) |
| 18 to 34 Years | 0 (0.0%) | 0 (0.0%) |
| 35 to 64 Years | 0 (0.0%) | 38 (15.6%) |
| 65 to 74 Years | 0 (0.0%) | 0 (0.0%) |
| 75 Years and over | 0 (0.0%) | 16 (10.3%) |
Disability Class: Self-Care Difficulty
| Age Bracket | Male | Female |
| 5 to 17 Years | 0 (0.0%) | 0 (0.0%) |
| 18 to 34 Years | 0 (0.0%) | 0 (0.0%) |
| 35 to 64 Years | 0 (0.0%) | 0 (0.0%) |
| 65 to 74 Years | 0 (0.0%) | 0 (0.0%) |
| 75 Years and over | 0 (0.0%) | 0 (0.0%) |
Technology Access in Sunnyside
Computing Device Access in Sunnyside
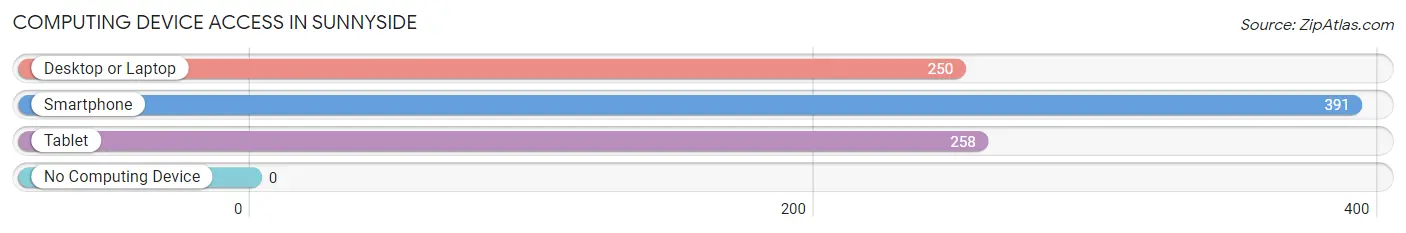
| Device Type | # Households | % Households |
| Desktop or Laptop | 250 | 61.3% |
| Smartphone | 391 | 95.8% |
| Tablet | 258 | 63.2% |
| No Computing Device | 0 | 0.0% |
| Total | 408 | 100.0% |
Internet Access in Sunnyside
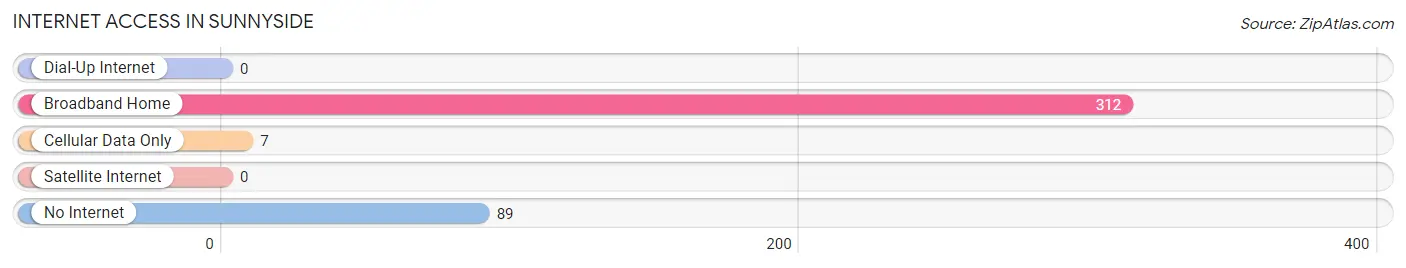
| Internet Type | # Households | % Households |
| Dial-Up Internet | 0 | 0.0% |
| Broadband Home | 312 | 76.5% |
| Cellular Data Only | 7 | 1.7% |
| Satellite Internet | 0 | 0.0% |
| No Internet | 89 | 21.8% |
| Total | 408 | 100.0% |
Sunnyside Summary
Sunnyside is a small town located in the state of Georgia, United States. It is situated in the southeastern part of the state, in the county of Chatham. The town has a population of around 1,000 people, and is located about 20 miles south of Savannah.
History
Sunnyside was founded in 1872 by a group of settlers from the nearby town of Savannah. The town was named after the sunny weather that the settlers experienced in the area. The town was originally a farming community, and the main crops grown were cotton, corn, and tobacco. The town also had a sawmill and a gristmill.
In the early 1900s, Sunnyside began to experience a period of growth. The town was incorporated in 1909, and the first mayor was elected in 1910. During this time, the town saw the construction of a number of new buildings, including a school, a post office, and a bank.
In the 1950s, Sunnyside experienced a period of decline. The town's population decreased, and many of the businesses closed. However, in the late 1970s, the town began to experience a period of revitalization. The town was able to attract new businesses, and the population began to increase.
Geography
Sunnyside is located in the southeastern part of the state of Georgia. It is situated in the county of Chatham, and is about 20 miles south of Savannah. The town is located on the banks of the Ogeechee River, and is surrounded by a number of small towns and villages.
The town has a total area of 1.2 square miles, and is located at an elevation of around 30 feet above sea level. The climate in Sunnyside is humid subtropical, with hot summers and mild winters.
Economy
Sunnyside's economy is largely based on agriculture. The town is home to a number of farms, and the main crops grown are cotton, corn, and tobacco. The town also has a number of small businesses, including restaurants, shops, and services.
Demographics
As of the 2010 census, Sunnyside had a population of 1,000 people. The racial makeup of the town was 79.2% White, 17.2% African American, 0.7% Native American, 0.3% Asian, and 2.6% from other races. The median household income was $31,250, and the median family income was $37,500.
Sunnyside is a small town with a rich history and a vibrant economy. The town is home to a diverse population, and is a great place to live and work.
Common Questions
What is Per Capita Income in Sunnyside?
Per Capita income in Sunnyside is $30,199.
What is the Median Household income in Sunnyside?
Median Household Income in Sunnyside is $42,045.
What is Inequality or Gini Index in Sunnyside?
Inequality or Gini Index in Sunnyside is 0.48.
What is the Total Population of Sunnyside?
Total Population of Sunnyside is 962.
What is the Total Male Population of Sunnyside?
Total Male Population of Sunnyside is 254.
What is the Total Female Population of Sunnyside?
Total Female Population of Sunnyside is 708.
What is the Ratio of Males per 100 Females in Sunnyside?
There are 35.88 Males per 100 Females in Sunnyside.
What is the Ratio of Females per 100 Males in Sunnyside?
There are 278.74 Females per 100 Males in Sunnyside.
What is the Median Population Age in Sunnyside?
Median Population Age in Sunnyside is 44.3 Years.
What is the Average Family Size in Sunnyside
Average Family Size in Sunnyside is 2.5 People.
What is the Average Household Size in Sunnyside
Average Household Size in Sunnyside is 2.4 People.
How Large is the Labor Force in Sunnyside?
There are 397 People in the Labor Forcein in Sunnyside.
What is the Percentage of People in the Labor Force in Sunnyside?
47.6% of People are in the Labor Force in Sunnyside.