Zip Codes with the Highest Percentage of Population Employed in Legal Services & Support in Griffin, GA
RELATED REPORTS & OPTIONS
Legal Services & Support
Griffin
Compare Zip Codes
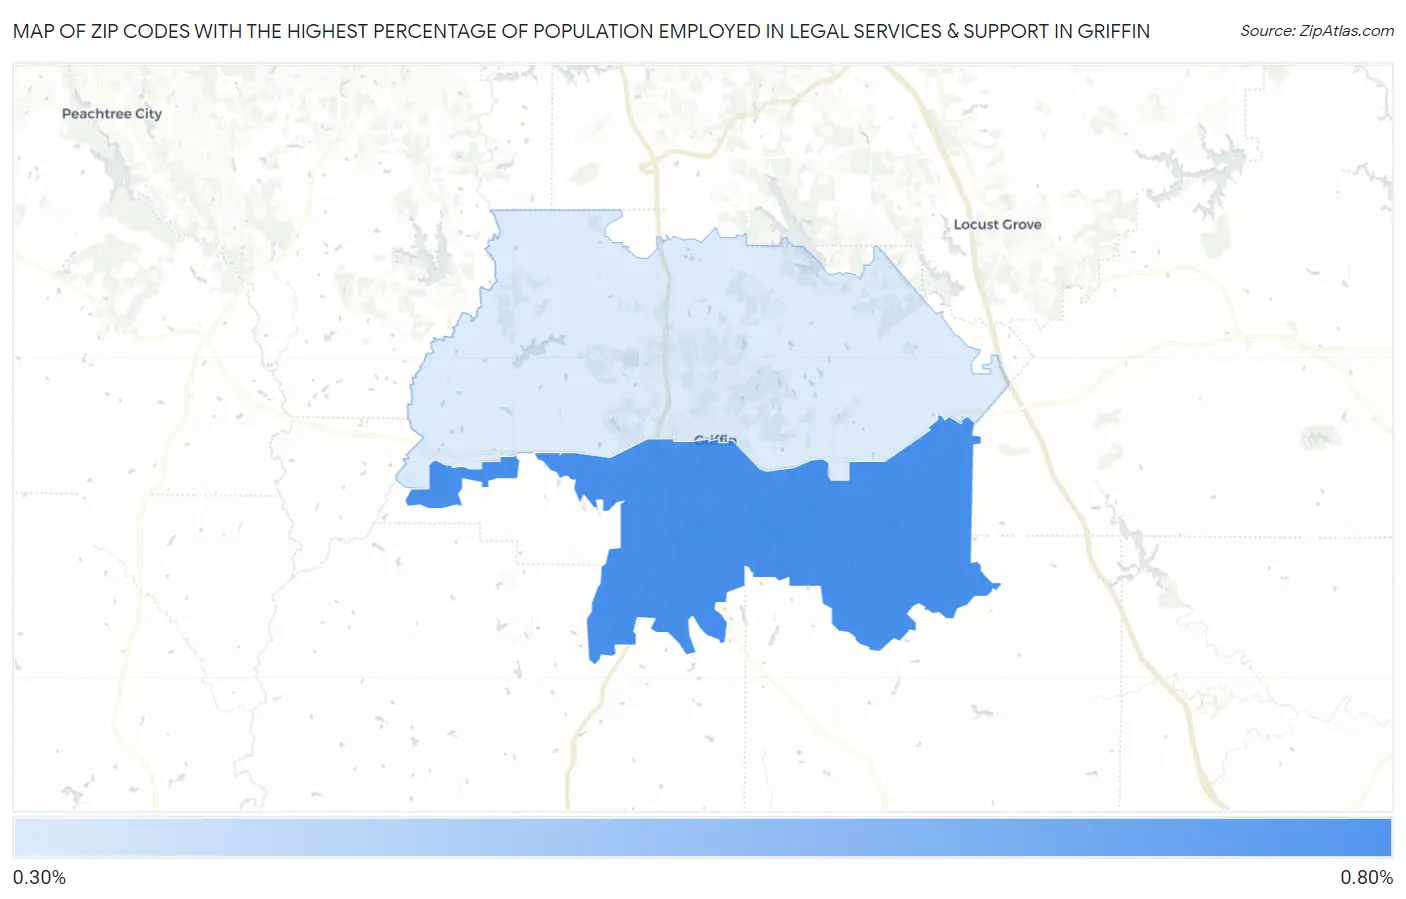
Map of Zip Codes with the Highest Percentage of Population Employed in Legal Services & Support in Griffin
0.34%
0.68%
Zip Codes with the Highest Percentage of Population Employed in Legal Services & Support in Griffin, GA
| Zip Code | % Employed | vs State | vs National | |
| 1. | 30224 | 0.68% | 1.1%(-0.426)#255 | 1.2%(-0.506)#10,635 |
| 2. | 30223 | 0.34% | 1.1%(-0.763)#366 | 1.2%(-0.843)#14,583 |
1
Common Questions
What are the Top Zip Codes with the Highest Percentage of Population Employed in Legal Services & Support in Griffin, GA?
Top Zip Codes with the Highest Percentage of Population Employed in Legal Services & Support in Griffin, GA are:
What zip code has the Highest Percentage of Population Employed in Legal Services & Support in Griffin, GA?
30224 has the Highest Percentage of Population Employed in Legal Services & Support in Griffin, GA with 0.68%.
What is the Percentage of Population Employed in Legal Services & Support in Griffin, GA?
Percentage of Population Employed in Legal Services & Support in Griffin is 0.60%.
What is the Percentage of Population Employed in Legal Services & Support in Georgia?
Percentage of Population Employed in Legal Services & Support in Georgia is 1.1%.
What is the Percentage of Population Employed in Legal Services & Support in the United States?
Percentage of Population Employed in Legal Services & Support in the United States is 1.2%.