Kennesaw, GA Map & Demographics
Kennesaw Map
Kennesaw Overview
$40,381
PER CAPITA INCOME
$99,947
AVG FAMILY INCOME
$81,467
AVG HOUSEHOLD INCOME
20.8%
WAGE / INCOME GAP [ % ]
79.2¢/ $1
WAGE / INCOME GAP [ $ ]
0.43
INEQUALITY / GINI INDEX
33,360
TOTAL POPULATION
15,959
MALE POPULATION
17,401
FEMALE POPULATION
91.71
MALES / 100 FEMALES
109.04
FEMALES / 100 MALES
35.6
MEDIAN AGE
3.0
AVG FAMILY SIZE
2.5
AVG HOUSEHOLD SIZE
19,031
LABOR FORCE [ PEOPLE ]
70.5%
PERCENT IN LABOR FORCE
5.4%
UNEMPLOYMENT RATE
Kennesaw Area Codes
Income in Kennesaw
Income Overview in Kennesaw
Per Capita Income in Kennesaw is $40,381, while median incomes of families and households are $99,947 and $81,467 respectively.
| Characteristic | Number | Measure |
| Per Capita Income | 33,360 | $40,381 |
| Median Family Income | 8,700 | $99,947 |
| Mean Family Income | 8,700 | $116,914 |
| Median Household Income | 13,046 | $81,467 |
| Mean Household Income | 13,046 | $102,153 |
| Income Deficit | 8,700 | $0 |
| Wage / Income Gap (%) | 33,360 | 20.83% |
| Wage / Income Gap ($) | 33,360 | 79.17¢ per $1 |
| Gini / Inequality Index | 33,360 | 0.43 |
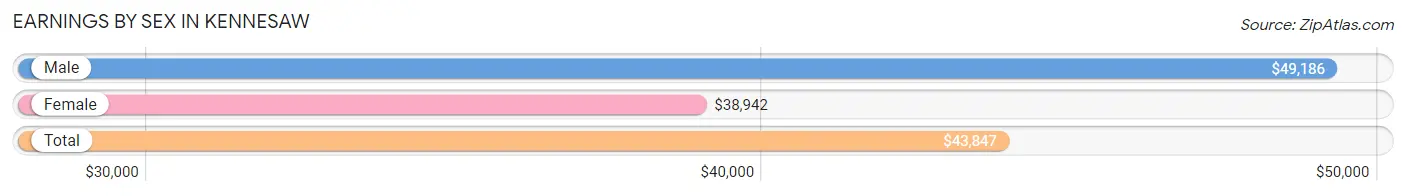
Earnings by Sex in Kennesaw
Average Earnings in Kennesaw are $43,847, $49,186 for men and $38,942 for women, a difference of 20.8%.
| Sex | Number | Average Earnings |
| Male | 9,498 (47.7%) | $49,186 |
| Female | 10,417 (52.3%) | $38,942 |
| Total | 19,915 (100.0%) | $43,847 |
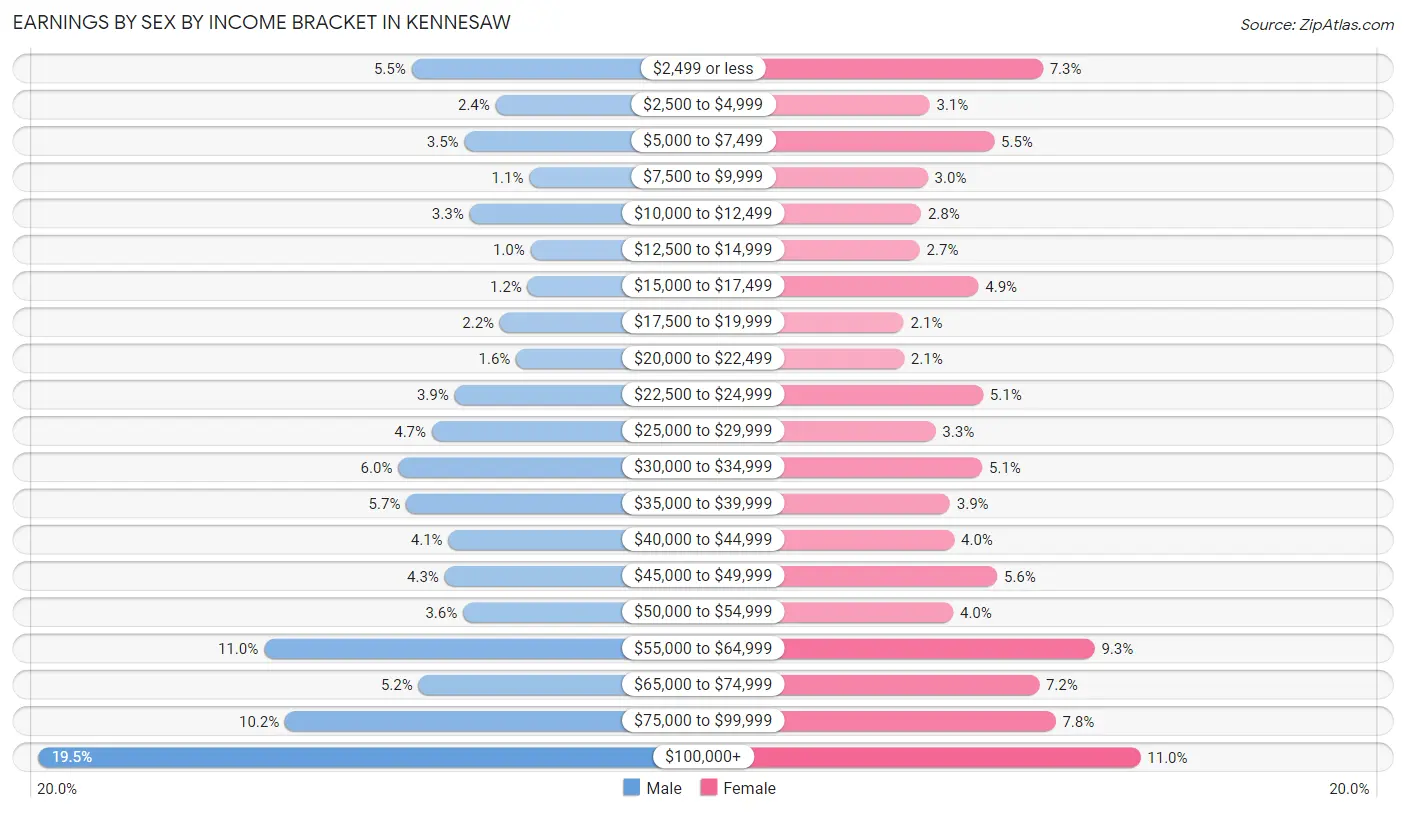
Earnings by Sex by Income Bracket in Kennesaw
The most common earnings brackets in Kennesaw are $100,000+ for men (1,849 | 19.5%) and $100,000+ for women (1,146 | 11.0%).
| Income | Male | Female |
| $2,499 or less | 522 (5.5%) | 765 (7.3%) |
| $2,500 to $4,999 | 223 (2.4%) | 323 (3.1%) |
| $5,000 to $7,499 | 334 (3.5%) | 575 (5.5%) |
| $7,500 to $9,999 | 104 (1.1%) | 316 (3.0%) |
| $10,000 to $12,499 | 316 (3.3%) | 290 (2.8%) |
| $12,500 to $14,999 | 99 (1.0%) | 284 (2.7%) |
| $15,000 to $17,499 | 109 (1.1%) | 514 (4.9%) |
| $17,500 to $19,999 | 208 (2.2%) | 222 (2.1%) |
| $20,000 to $22,499 | 150 (1.6%) | 223 (2.1%) |
| $22,500 to $24,999 | 369 (3.9%) | 531 (5.1%) |
| $25,000 to $29,999 | 450 (4.7%) | 346 (3.3%) |
| $30,000 to $34,999 | 570 (6.0%) | 528 (5.1%) |
| $35,000 to $39,999 | 541 (5.7%) | 402 (3.9%) |
| $40,000 to $44,999 | 391 (4.1%) | 419 (4.0%) |
| $45,000 to $49,999 | 405 (4.3%) | 586 (5.6%) |
| $50,000 to $54,999 | 339 (3.6%) | 415 (4.0%) |
| $55,000 to $64,999 | 1,048 (11.0%) | 967 (9.3%) |
| $65,000 to $74,999 | 498 (5.2%) | 750 (7.2%) |
| $75,000 to $99,999 | 973 (10.2%) | 815 (7.8%) |
| $100,000+ | 1,849 (19.5%) | 1,146 (11.0%) |
| Total | 9,498 (100.0%) | 10,417 (100.0%) |
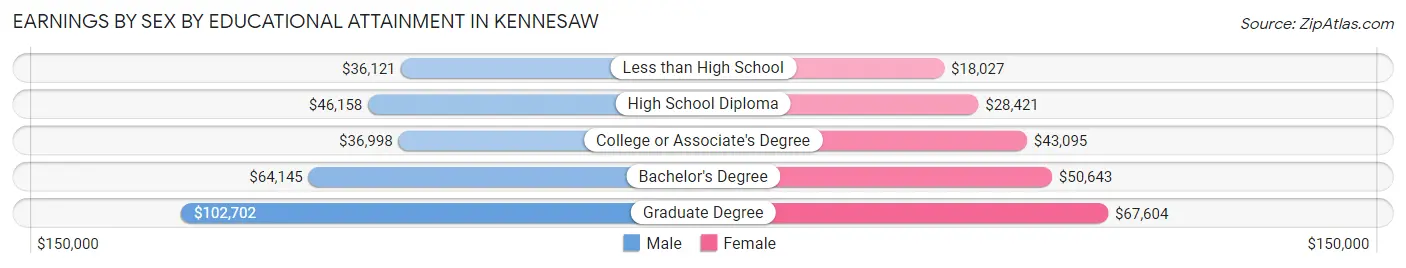
Earnings by Sex by Educational Attainment in Kennesaw
Average earnings in Kennesaw are $56,884 for men and $48,052 for women, a difference of 15.5%. Men with an educational attainment of graduate degree enjoy the highest average annual earnings of $102,702, while those with less than high school education earn the least with $36,121. Women with an educational attainment of graduate degree earn the most with the average annual earnings of $67,604, while those with less than high school education have the smallest earnings of $18,027.
| Educational Attainment | Male Income | Female Income |
| Less than High School | $36,121 | $18,027 |
| High School Diploma | $46,158 | $28,421 |
| College or Associate's Degree | $36,998 | $43,095 |
| Bachelor's Degree | $64,145 | $50,643 |
| Graduate Degree | $102,702 | $67,604 |
| Total | $56,884 | $48,052 |
Family Income in Kennesaw
Family Income Brackets in Kennesaw
According to the Kennesaw family income data, there are 2,236 families falling into the $100,000 to $149,999 income range, which is the most common income bracket and makes up 25.7% of all families. Conversely, the $10,000 to $14,999 income bracket is the least frequent group with only 70 families (0.8%) belonging to this category.
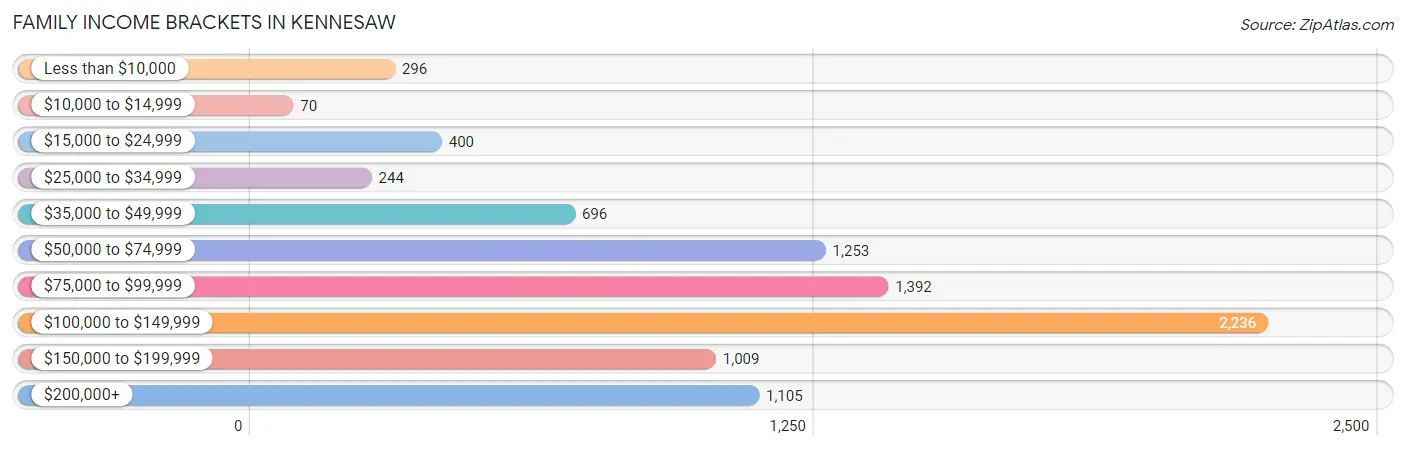
| Income Bracket | # Families | % Families |
| Less than $10,000 | 296 | 3.4% |
| $10,000 to $14,999 | 70 | 0.8% |
| $15,000 to $24,999 | 400 | 4.6% |
| $25,000 to $34,999 | 244 | 2.8% |
| $35,000 to $49,999 | 696 | 8.0% |
| $50,000 to $74,999 | 1,253 | 14.4% |
| $75,000 to $99,999 | 1,392 | 16.0% |
| $100,000 to $149,999 | 2,236 | 25.7% |
| $150,000 to $199,999 | 1,009 | 11.6% |
| $200,000+ | 1,105 | 12.7% |
Family Income by Famaliy Size in Kennesaw
6-person families (164 | 1.9%) account for the highest median family income in Kennesaw with $149,954 per family, while 2-person families (3,875 | 44.5%) have the highest median income of $42,197 per family member.
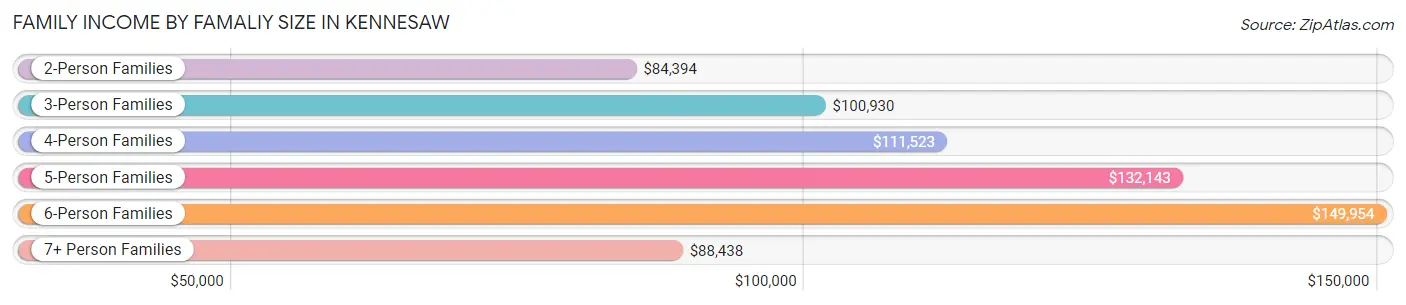
| Income Bracket | # Families | Median Income |
| 2-Person Families | 3,875 (44.5%) | $84,394 |
| 3-Person Families | 2,360 (27.1%) | $100,930 |
| 4-Person Families | 1,668 (19.2%) | $111,523 |
| 5-Person Families | 458 (5.3%) | $132,143 |
| 6-Person Families | 164 (1.9%) | $149,954 |
| 7+ Person Families | 175 (2.0%) | $88,438 |
| Total | 8,700 (100.0%) | $99,947 |
Family Income by Number of Earners in Kennesaw
The median family income in Kennesaw is $99,947, with families comprising 3+ earners (1,368) having the highest median family income of $136,935, while families with no earners (759) have the lowest median family income of $55,731, accounting for 15.7% and 8.7% of families, respectively.
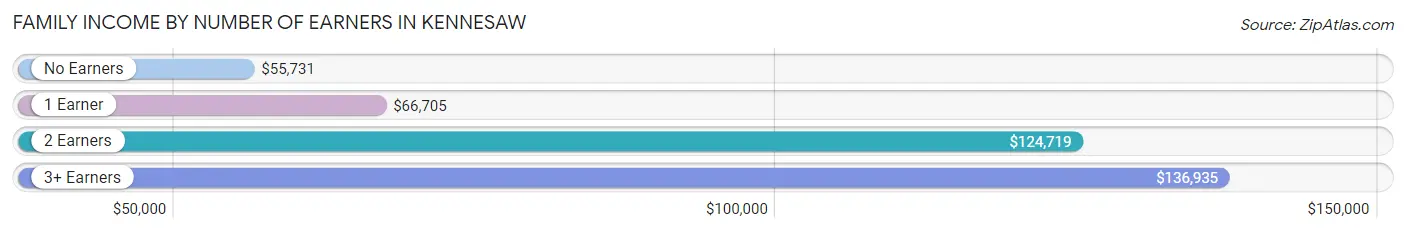
| Number of Earners | # Families | Median Income |
| No Earners | 759 (8.7%) | $55,731 |
| 1 Earner | 2,822 (32.4%) | $66,705 |
| 2 Earners | 3,751 (43.1%) | $124,719 |
| 3+ Earners | 1,368 (15.7%) | $136,935 |
| Total | 8,700 (100.0%) | $99,947 |
Household Income in Kennesaw
Household Income Brackets in Kennesaw
With 2,805 households falling in the category, the $100,000 to $149,999 income range is the most frequent in Kennesaw, accounting for 21.5% of all households. In contrast, only 261 households (2.0%) fall into the $10,000 to $14,999 income bracket, making it the least populous group.
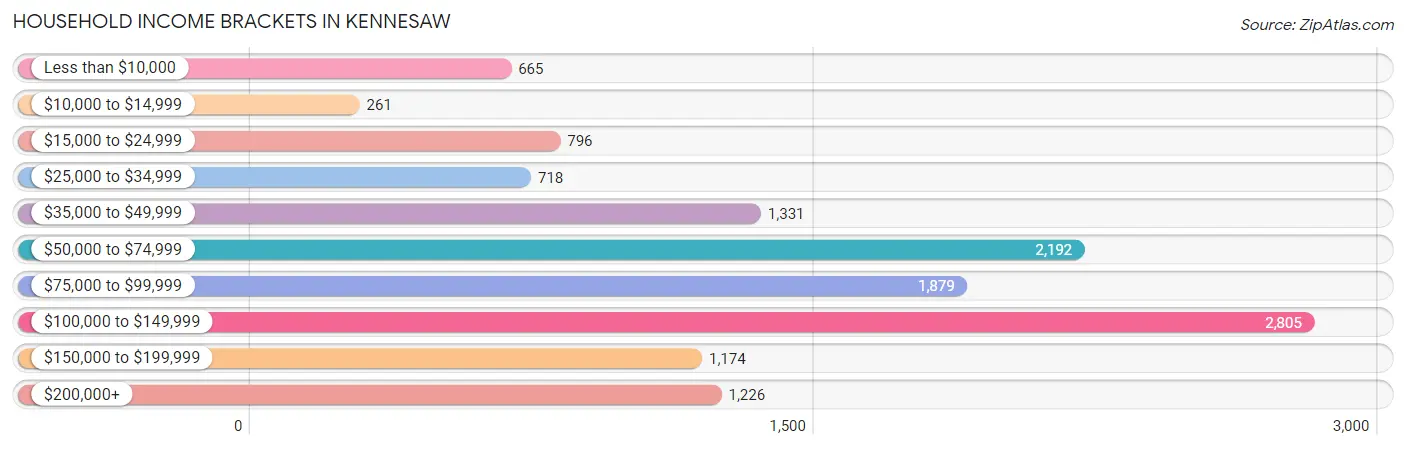
| Income Bracket | # Households | % Households |
| Less than $10,000 | 665 | 5.1% |
| $10,000 to $14,999 | 261 | 2.0% |
| $15,000 to $24,999 | 796 | 6.1% |
| $25,000 to $34,999 | 718 | 5.5% |
| $35,000 to $49,999 | 1,331 | 10.2% |
| $50,000 to $74,999 | 2,192 | 16.8% |
| $75,000 to $99,999 | 1,879 | 14.4% |
| $100,000 to $149,999 | 2,805 | 21.5% |
| $150,000 to $199,999 | 1,174 | 9.0% |
| $200,000+ | 1,226 | 9.4% |
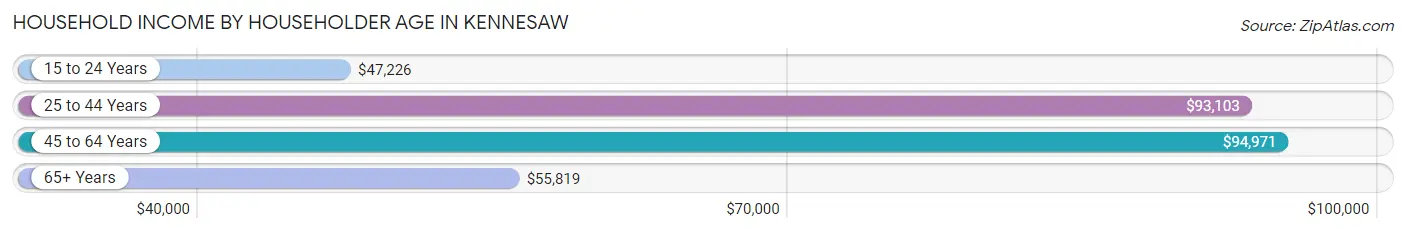
Household Income by Householder Age in Kennesaw
The median household income in Kennesaw is $81,467, with the highest median household income of $94,971 found in the 45 to 64 years age bracket for the primary householder. A total of 4,743 households (36.4%) fall into this category. Meanwhile, the 15 to 24 years age bracket for the primary householder has the lowest median household income of $47,226, with 923 households (7.1%) in this group.
| Income Bracket | # Households | Median Income |
| 15 to 24 Years | 923 (7.1%) | $47,226 |
| 25 to 44 Years | 4,678 (35.9%) | $93,103 |
| 45 to 64 Years | 4,743 (36.4%) | $94,971 |
| 65+ Years | 2,702 (20.7%) | $55,819 |
| Total | 13,046 (100.0%) | $81,467 |
Poverty in Kennesaw
Income Below Poverty by Sex and Age in Kennesaw
With 13.0% poverty level for males and 12.3% for females among the residents of Kennesaw, 15 year old males and 18 to 24 year old females are the most vulnerable to poverty, with 99 males (46.1%) and 564 females (27.1%) in their respective age groups living below the poverty level.
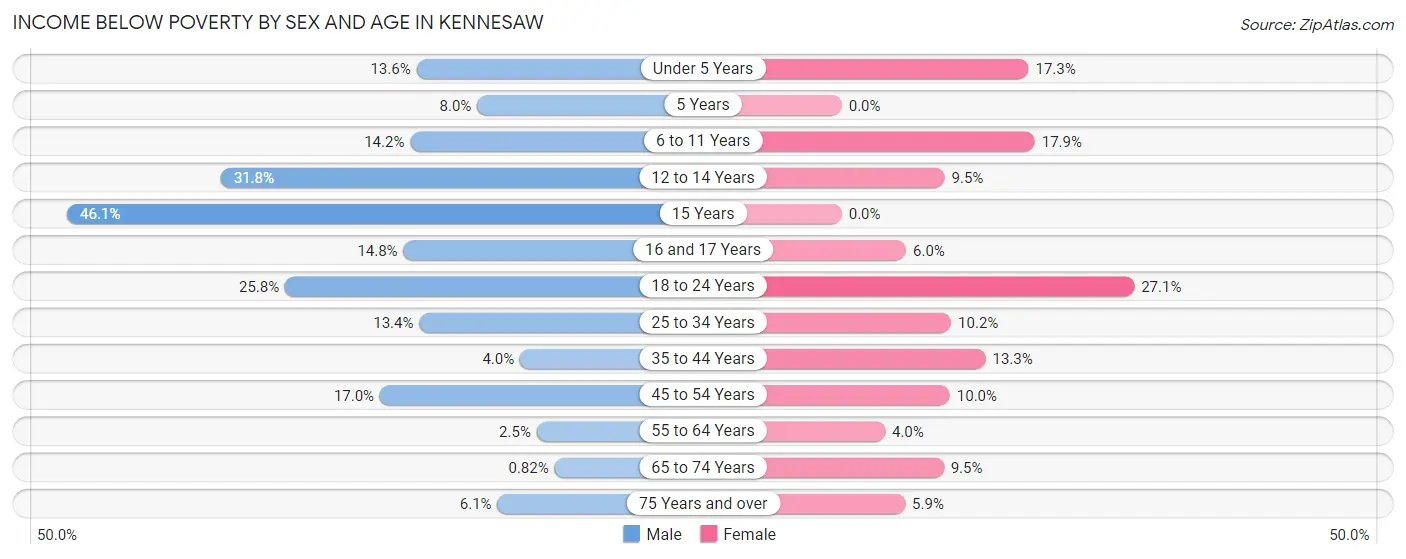
| Age Bracket | Male | Female |
| Under 5 Years | 113 (13.6%) | 223 (17.3%) |
| 5 Years | 12 (8.0%) | 0 (0.0%) |
| 6 to 11 Years | 209 (14.2%) | 154 (17.9%) |
| 12 to 14 Years | 261 (31.8%) | 39 (9.5%) |
| 15 Years | 99 (46.1%) | 0 (0.0%) |
| 16 and 17 Years | 95 (14.8%) | 21 (6.0%) |
| 18 to 24 Years | 436 (25.8%) | 564 (27.1%) |
| 25 to 34 Years | 293 (13.4%) | 279 (10.2%) |
| 35 to 44 Years | 89 (4.0%) | 335 (13.3%) |
| 45 to 54 Years | 357 (17.0%) | 217 (10.0%) |
| 55 to 64 Years | 46 (2.5%) | 75 (4.0%) |
| 65 to 74 Years | 8 (0.8%) | 140 (9.5%) |
| 75 Years and over | 42 (6.1%) | 67 (5.9%) |
| Total | 2,060 (13.0%) | 2,114 (12.3%) |
Income Above Poverty by Sex and Age in Kennesaw
According to the poverty statistics in Kennesaw, males aged 65 to 74 years and females aged 5 years are the age groups that are most secure financially, with 99.2% of males and 100.0% of females in these age groups living above the poverty line.
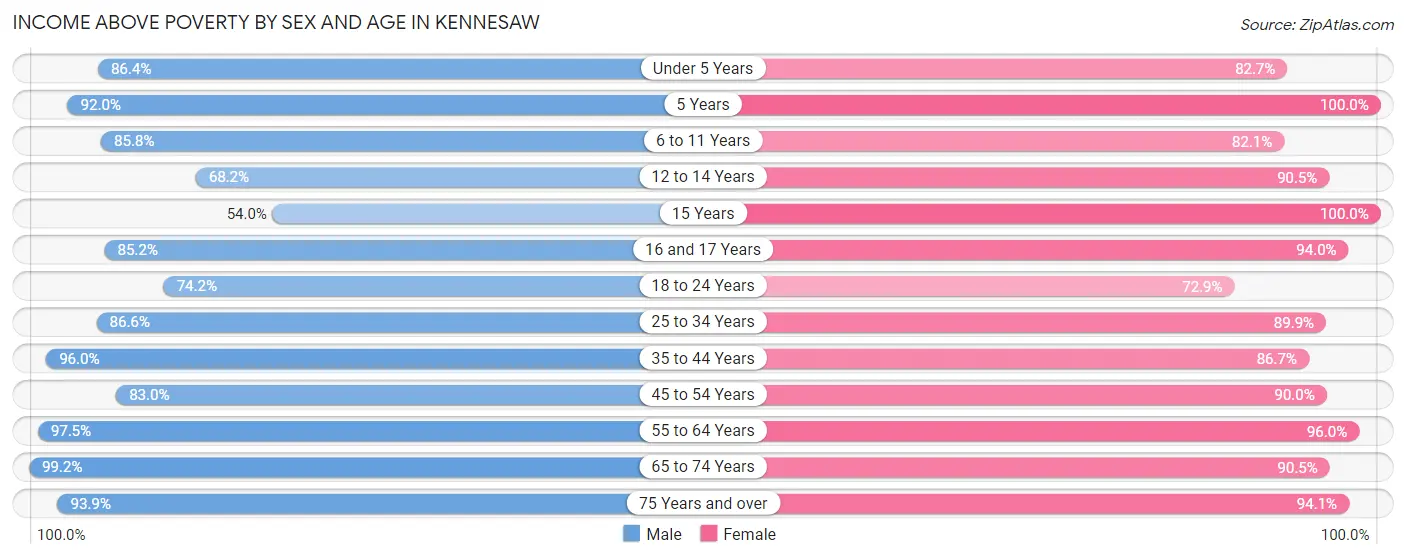
| Age Bracket | Male | Female |
| Under 5 Years | 716 (86.4%) | 1,064 (82.7%) |
| 5 Years | 138 (92.0%) | 148 (100.0%) |
| 6 to 11 Years | 1,262 (85.8%) | 706 (82.1%) |
| 12 to 14 Years | 560 (68.2%) | 370 (90.5%) |
| 15 Years | 116 (53.9%) | 167 (100.0%) |
| 16 and 17 Years | 545 (85.2%) | 331 (94.0%) |
| 18 to 24 Years | 1,252 (74.2%) | 1,514 (72.9%) |
| 25 to 34 Years | 1,898 (86.6%) | 2,470 (89.8%) |
| 35 to 44 Years | 2,124 (96.0%) | 2,177 (86.7%) |
| 45 to 54 Years | 1,741 (83.0%) | 1,947 (90.0%) |
| 55 to 64 Years | 1,819 (97.5%) | 1,796 (96.0%) |
| 65 to 74 Years | 967 (99.2%) | 1,340 (90.5%) |
| 75 Years and over | 644 (93.9%) | 1,072 (94.1%) |
| Total | 13,782 (87.0%) | 15,102 (87.7%) |
Income Below Poverty Among Married-Couple Families in Kennesaw
The poverty statistics for married-couple families in Kennesaw show that 4.3% or 287 of the total 6,615 families live below the poverty line. Families with 3 or 4 children have the highest poverty rate of 19.6%, comprising of 53 families. On the other hand, families with 5 or more children have the lowest poverty rate of 0.0%, which includes 0 families.
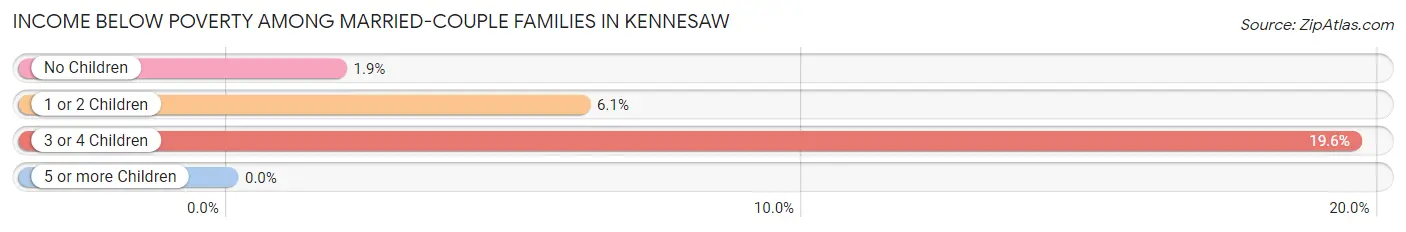
| Children | Above Poverty | Below Poverty |
| No Children | 3,487 (98.1%) | 67 (1.9%) |
| 1 or 2 Children | 2,558 (93.9%) | 167 (6.1%) |
| 3 or 4 Children | 218 (80.4%) | 53 (19.6%) |
| 5 or more Children | 65 (100.0%) | 0 (0.0%) |
| Total | 6,328 (95.7%) | 287 (4.3%) |
Income Below Poverty Among Single-Parent Households in Kennesaw
According to the poverty data in Kennesaw, 7.9% or 15 single-father households and 25.5% or 483 single-mother households are living below the poverty line. Among single-father households, those with 1 or 2 children have the highest poverty rate, with 15 households (18.1%) experiencing poverty. Likewise, among single-mother households, those with 5 or more children have the highest poverty rate, with 38 households (100.0%) falling below the poverty line.
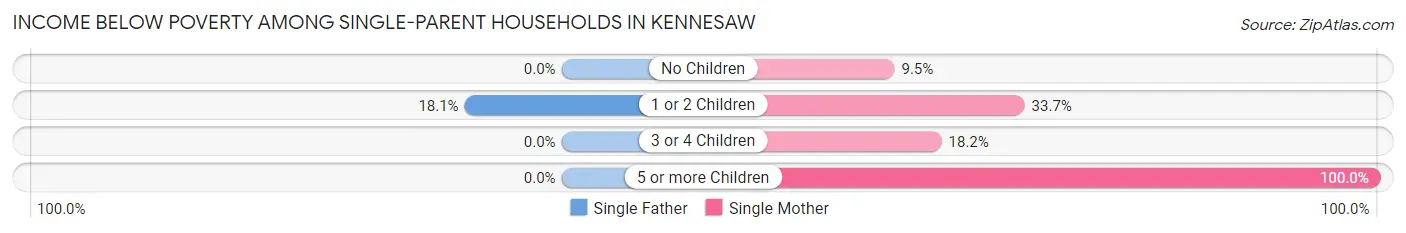
| Children | Single Father | Single Mother |
| No Children | 0 (0.0%) | 62 (9.5%) |
| 1 or 2 Children | 15 (18.1%) | 356 (33.7%) |
| 3 or 4 Children | 0 (0.0%) | 27 (18.2%) |
| 5 or more Children | 0 (0.0%) | 38 (100.0%) |
| Total | 15 (7.9%) | 483 (25.5%) |
Income Below Poverty Among Married-Couple vs Single-Parent Households in Kennesaw
The poverty data for Kennesaw shows that 287 of the married-couple family households (4.3%) and 498 of the single-parent households (23.9%) are living below the poverty level. Within the married-couple family households, those with 3 or 4 children have the highest poverty rate, with 53 households (19.6%) falling below the poverty line. Among the single-parent households, those with 5 or more children have the highest poverty rate, with 38 household (100.0%) living below poverty.
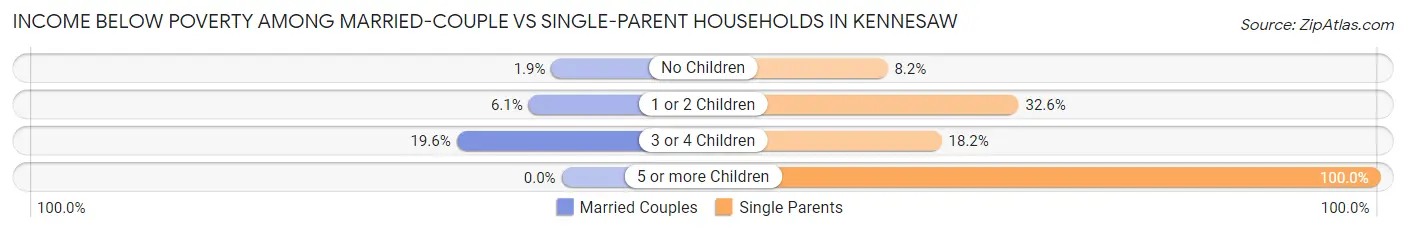
| Children | Married-Couple Families | Single-Parent Households |
| No Children | 67 (1.9%) | 62 (8.2%) |
| 1 or 2 Children | 167 (6.1%) | 371 (32.6%) |
| 3 or 4 Children | 53 (19.6%) | 27 (18.2%) |
| 5 or more Children | 0 (0.0%) | 38 (100.0%) |
| Total | 287 (4.3%) | 498 (23.9%) |
Race in Kennesaw
The most populous races in Kennesaw are White / Caucasian (19,594 | 58.7%), Black / African American (7,018 | 21.0%), and Hispanic or Latino (4,614 | 13.8%).
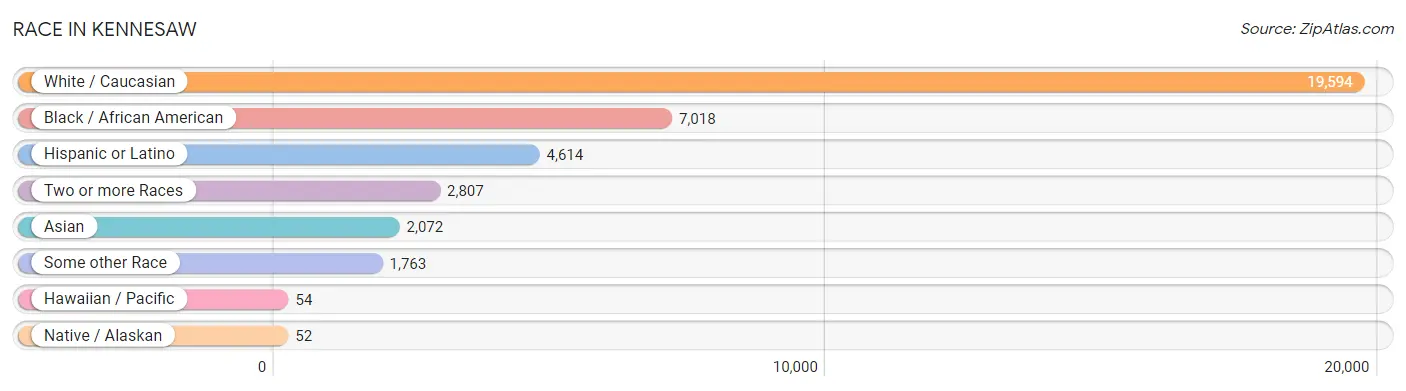
| Race | # Population | % Population |
| Asian | 2,072 | 6.2% |
| Black / African American | 7,018 | 21.0% |
| Hawaiian / Pacific | 54 | 0.2% |
| Hispanic or Latino | 4,614 | 13.8% |
| Native / Alaskan | 52 | 0.2% |
| White / Caucasian | 19,594 | 58.7% |
| Two or more Races | 2,807 | 8.4% |
| Some other Race | 1,763 | 5.3% |
| Total | 33,360 | 100.0% |
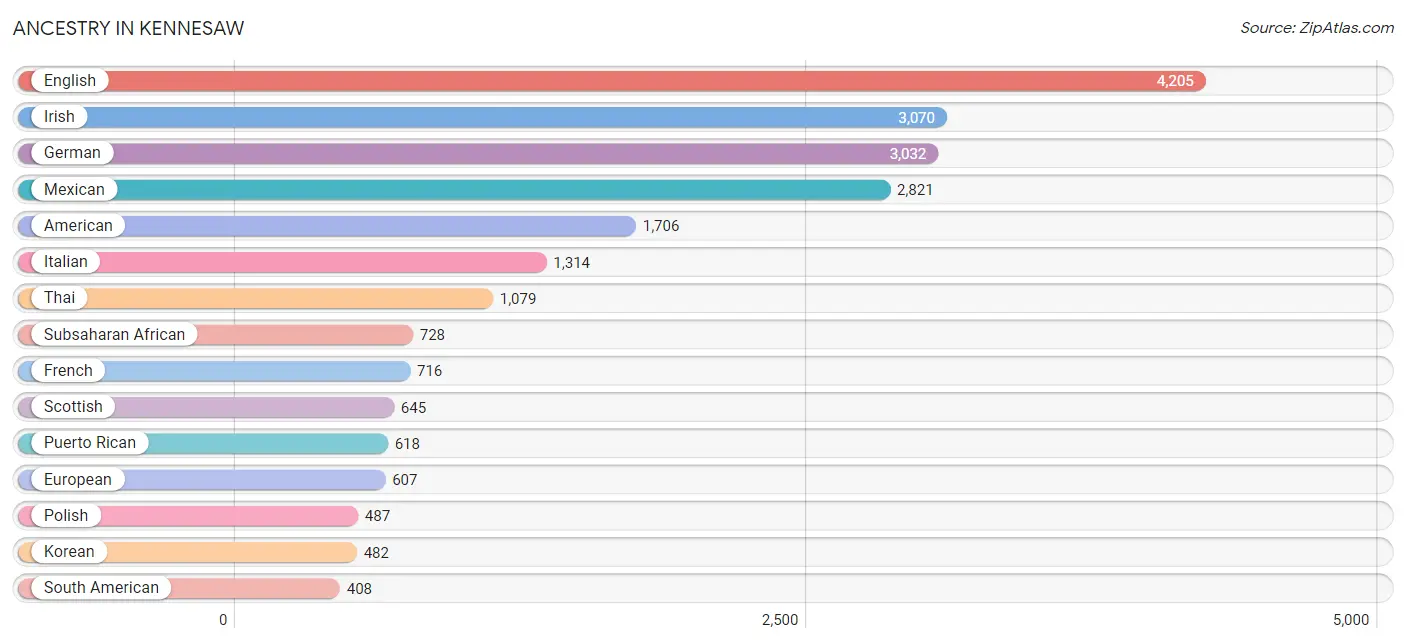
Ancestry in Kennesaw
The most populous ancestries reported in Kennesaw are English (4,205 | 12.6%), Irish (3,070 | 9.2%), German (3,032 | 9.1%), Mexican (2,821 | 8.5%), and American (1,706 | 5.1%), together accounting for 44.5% of all Kennesaw residents.
| Ancestry | # Population | % Population |
| African | 278 | 0.8% |
| Albanian | 18 | 0.1% |
| American | 1,706 | 5.1% |
| Arab | 83 | 0.3% |
| Argentinean | 63 | 0.2% |
| Austrian | 11 | 0.0% |
| Belgian | 32 | 0.1% |
| Belizean | 65 | 0.2% |
| Bermudan | 6 | 0.0% |
| Bhutanese | 60 | 0.2% |
| Brazilian | 307 | 0.9% |
| British | 221 | 0.7% |
| Burmese | 245 | 0.7% |
| Canadian | 27 | 0.1% |
| Central American | 268 | 0.8% |
| Central American Indian | 19 | 0.1% |
| Cherokee | 111 | 0.3% |
| Chilean | 18 | 0.1% |
| Colombian | 73 | 0.2% |
| Costa Rican | 17 | 0.1% |
| Croatian | 59 | 0.2% |
| Crow | 13 | 0.0% |
| Cuban | 74 | 0.2% |
| Czech | 19 | 0.1% |
| Danish | 188 | 0.6% |
| Dominican | 91 | 0.3% |
| Dutch | 119 | 0.4% |
| Eastern European | 47 | 0.1% |
| Ecuadorian | 12 | 0.0% |
| English | 4,205 | 12.6% |
| Ethiopian | 89 | 0.3% |
| European | 607 | 1.8% |
| Filipino | 18 | 0.1% |
| Finnish | 92 | 0.3% |
| French | 716 | 2.1% |
| French Canadian | 202 | 0.6% |
| German | 3,032 | 9.1% |
| Ghanaian | 70 | 0.2% |
| Greek | 103 | 0.3% |
| Guamanian / Chamorro | 20 | 0.1% |
| Guatemalan | 56 | 0.2% |
| Haitian | 123 | 0.4% |
| Honduran | 9 | 0.0% |
| Hungarian | 48 | 0.1% |
| Indian (Asian) | 57 | 0.2% |
| Indonesian | 65 | 0.2% |
| Iranian | 214 | 0.6% |
| Irish | 3,070 | 9.2% |
| Italian | 1,314 | 3.9% |
| Jamaican | 211 | 0.6% |
| Japanese | 32 | 0.1% |
| Korean | 482 | 1.4% |
| Lebanese | 23 | 0.1% |
| Lithuanian | 83 | 0.3% |
| Malaysian | 45 | 0.1% |
| Mexican | 2,821 | 8.5% |
| Mexican American Indian | 35 | 0.1% |
| Native Hawaiian | 76 | 0.2% |
| Nicaraguan | 106 | 0.3% |
| Nigerian | 169 | 0.5% |
| Northern European | 50 | 0.2% |
| Norwegian | 76 | 0.2% |
| Pakistani | 39 | 0.1% |
| Panamanian | 52 | 0.2% |
| Peruvian | 181 | 0.5% |
| Polish | 487 | 1.5% |
| Portuguese | 91 | 0.3% |
| Puerto Rican | 618 | 1.8% |
| Romanian | 18 | 0.1% |
| Russian | 129 | 0.4% |
| Salvadoran | 28 | 0.1% |
| Scandinavian | 94 | 0.3% |
| Scotch-Irish | 315 | 0.9% |
| Scottish | 645 | 1.9% |
| Serbian | 20 | 0.1% |
| Slavic | 22 | 0.1% |
| Slovak | 14 | 0.0% |
| Slovene | 13 | 0.0% |
| South American | 408 | 1.2% |
| Spaniard | 48 | 0.1% |
| Spanish | 25 | 0.1% |
| Sri Lankan | 307 | 0.9% |
| Subsaharan African | 728 | 2.2% |
| Sudanese | 19 | 0.1% |
| Swedish | 171 | 0.5% |
| Swiss | 66 | 0.2% |
| Syrian | 34 | 0.1% |
| Thai | 1,079 | 3.2% |
| Trinidadian and Tobagonian | 50 | 0.2% |
| Ukrainian | 55 | 0.2% |
| Venezuelan | 61 | 0.2% |
| Welsh | 185 | 0.5% |
| West Indian | 8 | 0.0% |
| Zimbabwean | 64 | 0.2% | View All 94 Rows |
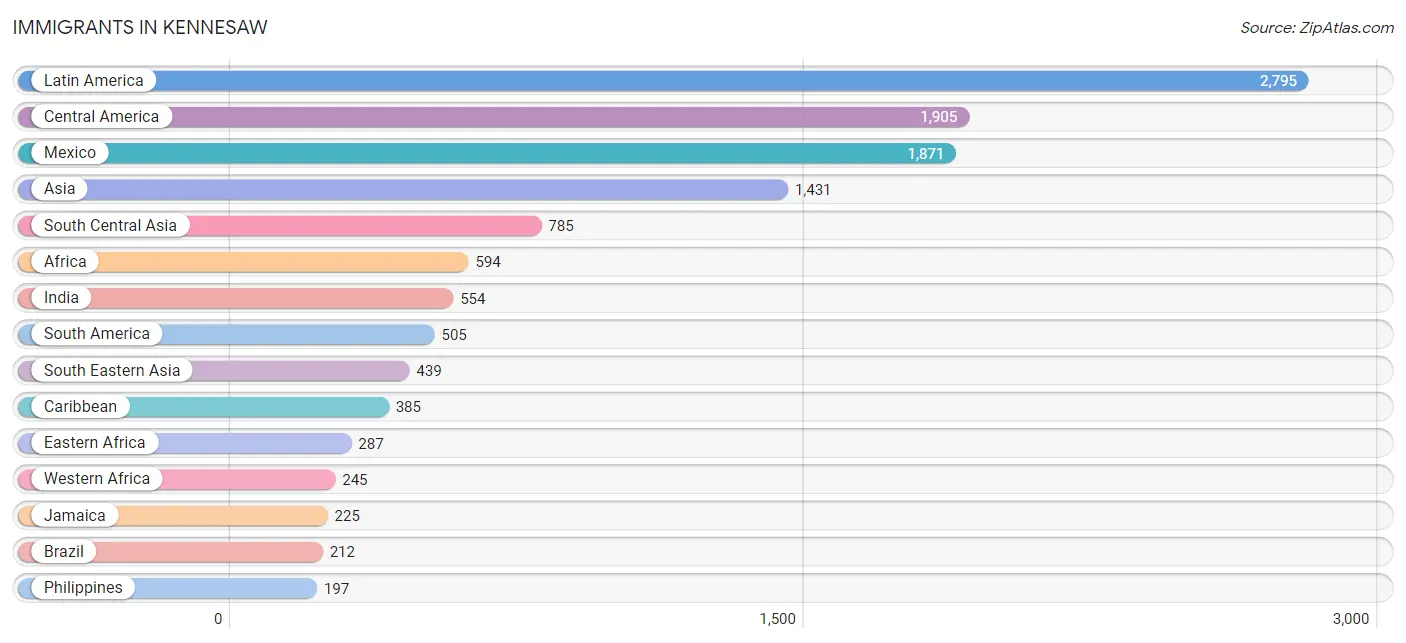
Immigrants in Kennesaw
The most numerous immigrant groups reported in Kennesaw came from Latin America (2,795 | 8.4%), Central America (1,905 | 5.7%), Mexico (1,871 | 5.6%), Asia (1,431 | 4.3%), and South Central Asia (785 | 2.4%), together accounting for 26.3% of all Kennesaw residents.
| Immigration Origin | # Population | % Population |
| Africa | 594 | 1.8% |
| Argentina | 51 | 0.2% |
| Armenia | 8 | 0.0% |
| Asia | 1,431 | 4.3% |
| Australia | 7 | 0.0% |
| Brazil | 212 | 0.6% |
| Cameroon | 29 | 0.1% |
| Canada | 150 | 0.4% |
| Caribbean | 385 | 1.1% |
| Central America | 1,905 | 5.7% |
| China | 148 | 0.4% |
| Colombia | 74 | 0.2% |
| Costa Rica | 17 | 0.1% |
| Cuba | 49 | 0.2% |
| Dominican Republic | 17 | 0.1% |
| Eastern Africa | 287 | 0.9% |
| Eastern Asia | 179 | 0.5% |
| Eastern Europe | 50 | 0.2% |
| Ecuador | 12 | 0.0% |
| England | 34 | 0.1% |
| Ethiopia | 56 | 0.2% |
| Europe | 189 | 0.6% |
| Germany | 12 | 0.0% |
| Ghana | 70 | 0.2% |
| Guatemala | 17 | 0.1% |
| Haiti | 94 | 0.3% |
| India | 554 | 1.7% |
| Iran | 164 | 0.5% |
| Italy | 18 | 0.1% |
| Jamaica | 225 | 0.7% |
| Japan | 21 | 0.1% |
| Kenya | 160 | 0.5% |
| Korea | 10 | 0.0% |
| Laos | 19 | 0.1% |
| Latin America | 2,795 | 8.4% |
| Mexico | 1,871 | 5.6% |
| Middle Africa | 29 | 0.1% |
| Netherlands | 8 | 0.0% |
| Nigeria | 113 | 0.3% |
| Northern Africa | 33 | 0.1% |
| Northern Europe | 100 | 0.3% |
| Oceania | 7 | 0.0% |
| Pakistan | 67 | 0.2% |
| Peru | 120 | 0.4% |
| Philippines | 197 | 0.6% |
| Romania | 11 | 0.0% |
| Saudi Arabia | 10 | 0.0% |
| South America | 505 | 1.5% |
| South Central Asia | 785 | 2.4% |
| South Eastern Asia | 439 | 1.3% |
| Southern Europe | 19 | 0.1% |
| Spain | 1 | 0.0% |
| Sudan | 9 | 0.0% |
| Taiwan | 17 | 0.1% |
| Thailand | 21 | 0.1% |
| Ukraine | 39 | 0.1% |
| Venezuela | 36 | 0.1% |
| Vietnam | 158 | 0.5% |
| Western Africa | 245 | 0.7% |
| Western Asia | 28 | 0.1% |
| Western Europe | 20 | 0.1% |
| Zimbabwe | 41 | 0.1% | View All 62 Rows |
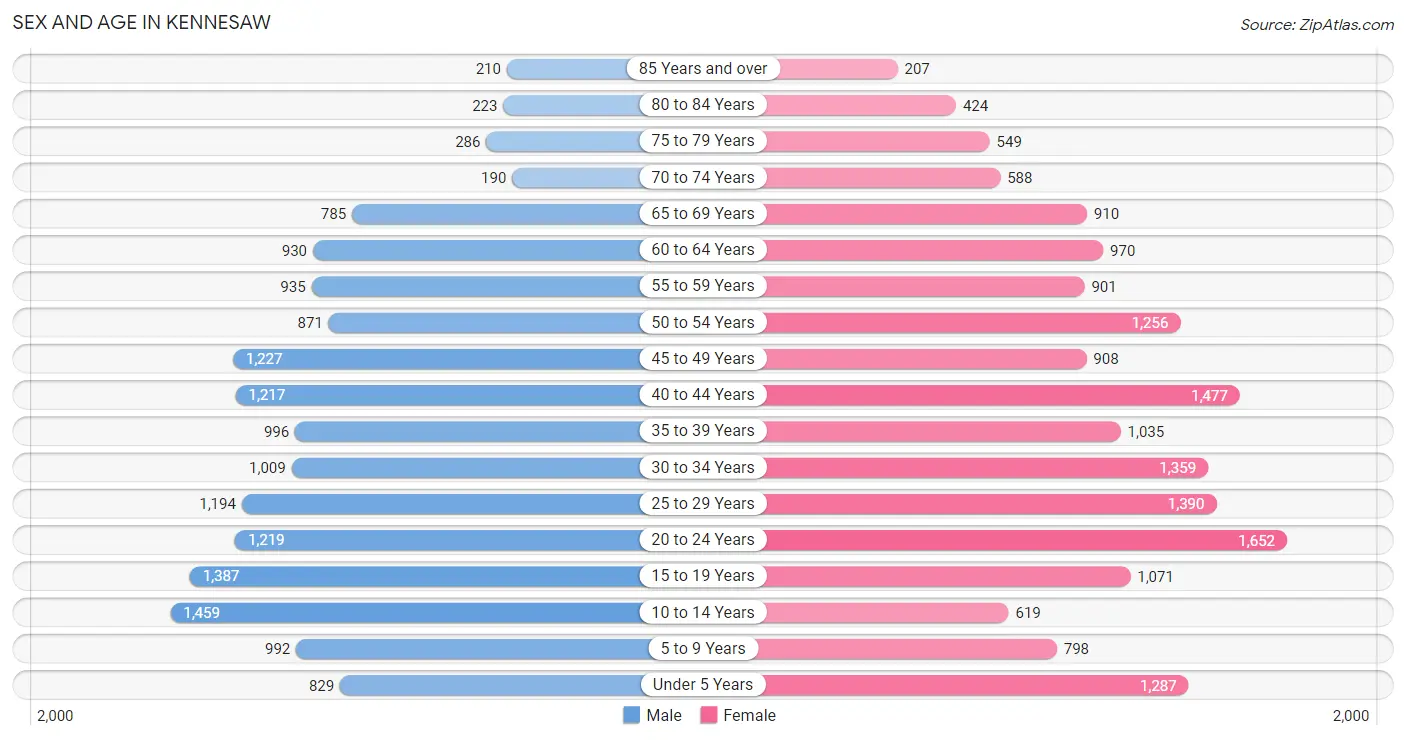
Sex and Age in Kennesaw
Sex and Age in Kennesaw
The most populous age groups in Kennesaw are 10 to 14 Years (1,459 | 9.1%) for men and 20 to 24 Years (1,652 | 9.5%) for women.
| Age Bracket | Male | Female |
| Under 5 Years | 829 (5.2%) | 1,287 (7.4%) |
| 5 to 9 Years | 992 (6.2%) | 798 (4.6%) |
| 10 to 14 Years | 1,459 (9.1%) | 619 (3.6%) |
| 15 to 19 Years | 1,387 (8.7%) | 1,071 (6.1%) |
| 20 to 24 Years | 1,219 (7.6%) | 1,652 (9.5%) |
| 25 to 29 Years | 1,194 (7.5%) | 1,390 (8.0%) |
| 30 to 34 Years | 1,009 (6.3%) | 1,359 (7.8%) |
| 35 to 39 Years | 996 (6.2%) | 1,035 (5.9%) |
| 40 to 44 Years | 1,217 (7.6%) | 1,477 (8.5%) |
| 45 to 49 Years | 1,227 (7.7%) | 908 (5.2%) |
| 50 to 54 Years | 871 (5.5%) | 1,256 (7.2%) |
| 55 to 59 Years | 935 (5.9%) | 901 (5.2%) |
| 60 to 64 Years | 930 (5.8%) | 970 (5.6%) |
| 65 to 69 Years | 785 (4.9%) | 910 (5.2%) |
| 70 to 74 Years | 190 (1.2%) | 588 (3.4%) |
| 75 to 79 Years | 286 (1.8%) | 549 (3.2%) |
| 80 to 84 Years | 223 (1.4%) | 424 (2.4%) |
| 85 Years and over | 210 (1.3%) | 207 (1.2%) |
| Total | 15,959 (100.0%) | 17,401 (100.0%) |
Families and Households in Kennesaw
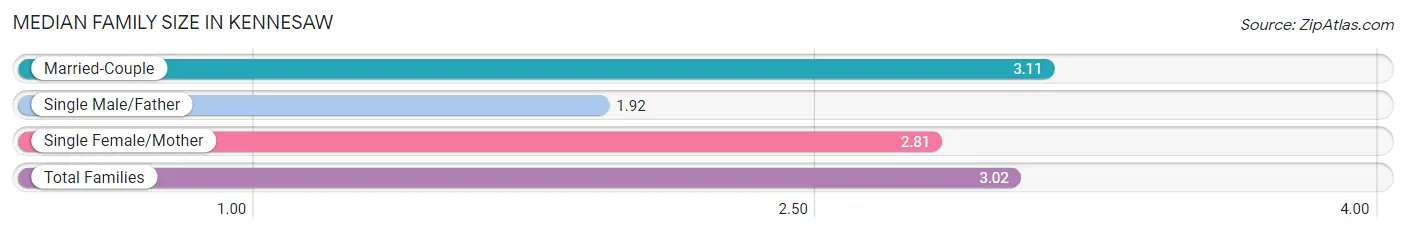
Median Family Size in Kennesaw
The median family size in Kennesaw is 3.02 persons per family, with married-couple families (6,615 | 76.0%) accounting for the largest median family size of 3.11 persons per family. On the other hand, single male/father families (189 | 2.2%) represent the smallest median family size with 1.92 persons per family.
| Family Type | # Families | Family Size |
| Married-Couple | 6,615 (76.0%) | 3.11 |
| Single Male/Father | 189 (2.2%) | 1.92 |
| Single Female/Mother | 1,896 (21.8%) | 2.81 |
| Total Families | 8,700 (100.0%) | 3.02 |
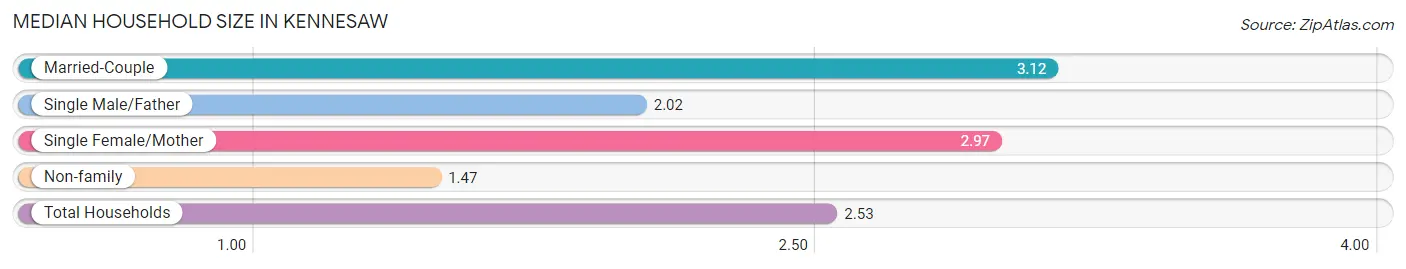
Median Household Size in Kennesaw
The median household size in Kennesaw is 2.53 persons per household, with married-couple households (6,615 | 50.7%) accounting for the largest median household size of 3.12 persons per household. non-family households (4,346 | 33.3%) represent the smallest median household size with 1.47 persons per household.
| Household Type | # Households | Household Size |
| Married-Couple | 6,615 (50.7%) | 3.12 |
| Single Male/Father | 189 (1.5%) | 2.02 |
| Single Female/Mother | 1,896 (14.5%) | 2.97 |
| Non-family | 4,346 (33.3%) | 1.47 |
| Total Households | 13,046 (100.0%) | 2.53 |
Household Size by Marriage Status in Kennesaw
Out of a total of 13,046 households in Kennesaw, 8,700 (66.7%) are family households, while 4,346 (33.3%) are nonfamily households. The most numerous type of family households are 2-person households, comprising 3,777, and the most common type of nonfamily households are 1-person households, comprising 3,189.
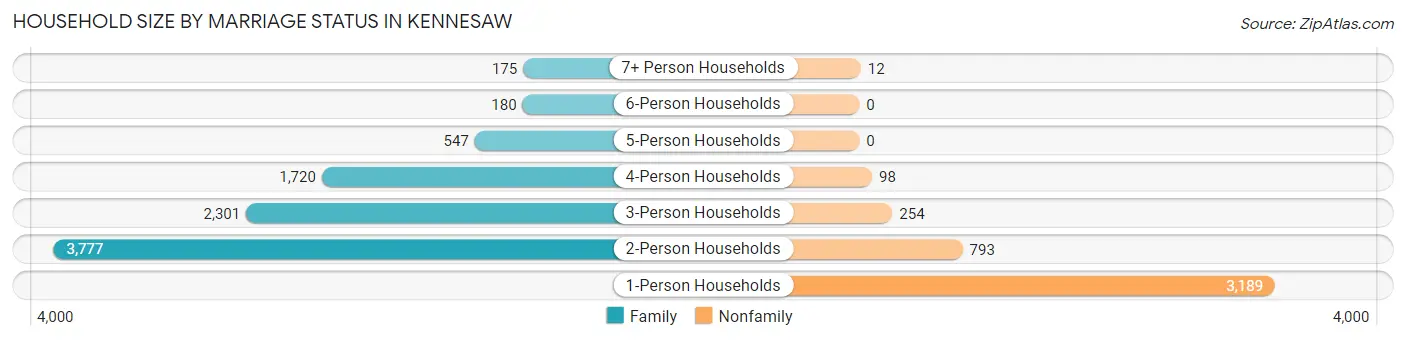
| Household Size | Family Households | Nonfamily Households |
| 1-Person Households | - | 3,189 (24.4%) |
| 2-Person Households | 3,777 (28.9%) | 793 (6.1%) |
| 3-Person Households | 2,301 (17.6%) | 254 (1.9%) |
| 4-Person Households | 1,720 (13.2%) | 98 (0.7%) |
| 5-Person Households | 547 (4.2%) | 0 (0.0%) |
| 6-Person Households | 180 (1.4%) | 0 (0.0%) |
| 7+ Person Households | 175 (1.3%) | 12 (0.1%) |
| Total | 8,700 (66.7%) | 4,346 (33.3%) |
Female Fertility in Kennesaw
Fertility by Age in Kennesaw
Average fertility rate in Kennesaw is 64.0 births per 1,000 women. Women in the age bracket of 20 to 34 years have the highest fertility rate with 96.0 births per 1,000 women. Women in the age bracket of 20 to 34 years acount for 73.4% of all women with births.
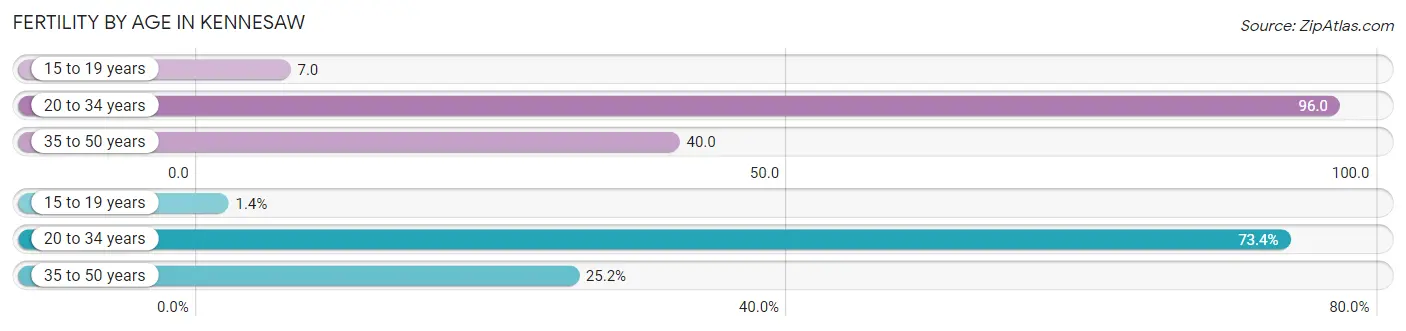
| Age Bracket | Women with Births | Births / 1,000 Women |
| 15 to 19 years | 8 (1.4%) | 7.0 |
| 20 to 34 years | 423 (73.4%) | 96.0 |
| 35 to 50 years | 145 (25.2%) | 40.0 |
| Total | 576 (100.0%) | 64.0 |
Fertility by Age by Marriage Status in Kennesaw
87.3% of women with births (576) in Kennesaw are married. The highest percentage of unmarried women with births falls into 15 to 19 years age bracket with 100.0% of them unmarried at the time of birth, while the lowest percentage of unmarried women with births belong to 20 to 34 years age bracket with 6.4% of them unmarried.
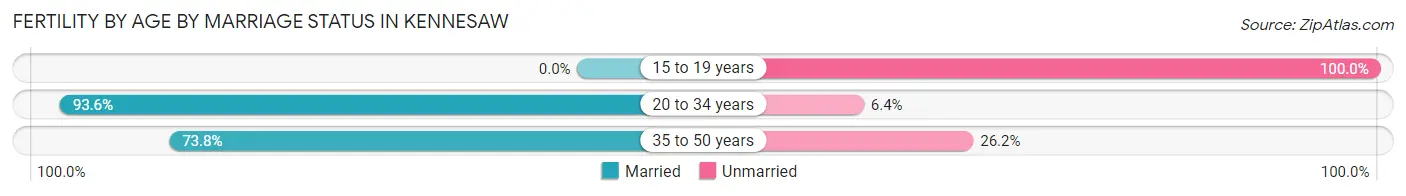
| Age Bracket | Married | Unmarried |
| 15 to 19 years | 0 (0.0%) | 8 (100.0%) |
| 20 to 34 years | 396 (93.6%) | 27 (6.4%) |
| 35 to 50 years | 107 (73.8%) | 38 (26.2%) |
| Total | 503 (87.3%) | 73 (12.7%) |
Fertility by Education in Kennesaw
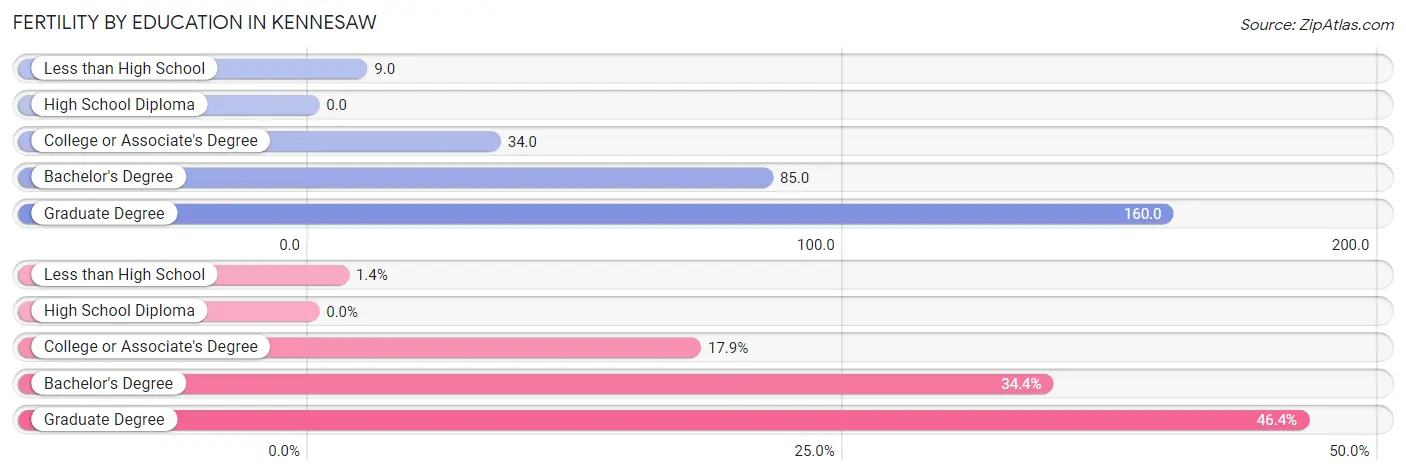
| Educational Attainment | Women with Births | Births / 1,000 Women |
| Less than High School | 8 (1.4%) | 9.0 |
| High School Diploma | 0 (0.0%) | 0.0 |
| College or Associate's Degree | 103 (17.9%) | 34.0 |
| Bachelor's Degree | 198 (34.4%) | 85.0 |
| Graduate Degree | 267 (46.4%) | 160.0 |
| Total | 576 (100.0%) | 64.0 |
Fertility by Education by Marriage Status in Kennesaw
12.7% of women with births in Kennesaw are unmarried. Women with the educational attainment of bachelor's degree are most likely to be married with 100.0% of them married at childbirth, while women with the educational attainment of less than high school are least likely to be married with 100.0% of them unmarried at childbirth.
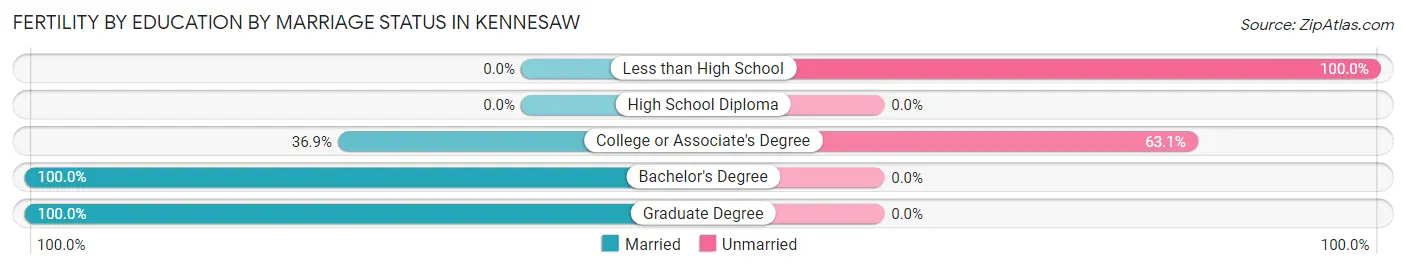
| Educational Attainment | Married | Unmarried |
| Less than High School | 0 (0.0%) | 8 (100.0%) |
| High School Diploma | 0 (0.0%) | 0 (0.0%) |
| College or Associate's Degree | 38 (36.9%) | 65 (63.1%) |
| Bachelor's Degree | 198 (100.0%) | 0 (0.0%) |
| Graduate Degree | 267 (100.0%) | 0 (0.0%) |
| Total | 503 (87.3%) | 73 (12.7%) |
Employment Characteristics in Kennesaw
Employment by Class of Employer in Kennesaw
Among the 17,806 employed individuals in Kennesaw, private company employees (12,720 | 71.4%), not-for-profit organizations (1,487 | 8.4%), and self-employed (not incorporated) (1,199 | 6.7%) make up the most common classes of employment.
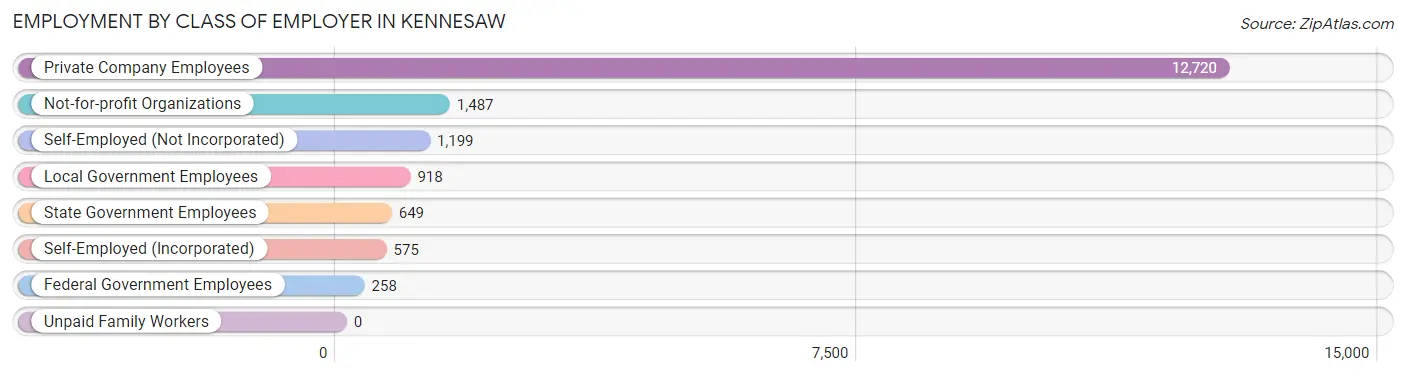
| Employer Class | # Employees | % Employees |
| Private Company Employees | 12,720 | 71.4% |
| Self-Employed (Incorporated) | 575 | 3.2% |
| Self-Employed (Not Incorporated) | 1,199 | 6.7% |
| Not-for-profit Organizations | 1,487 | 8.4% |
| Local Government Employees | 918 | 5.2% |
| State Government Employees | 649 | 3.6% |
| Federal Government Employees | 258 | 1.5% |
| Unpaid Family Workers | 0 | 0.0% |
| Total | 17,806 | 100.0% |
Employment Status by Age in Kennesaw
According to the labor force statistics for Kennesaw, out of the total population over 16 years of age (26,994), 70.5% or 19,031 individuals are in the labor force, with 5.4% or 1,028 of them unemployed. The age group with the highest labor force participation rate is 35 to 44 years, with 91.0% or 4,300 individuals in the labor force. Within the labor force, the 65 to 74 years age range has the highest percentage of unemployed individuals, with 17.4% or 137 of them being unemployed.
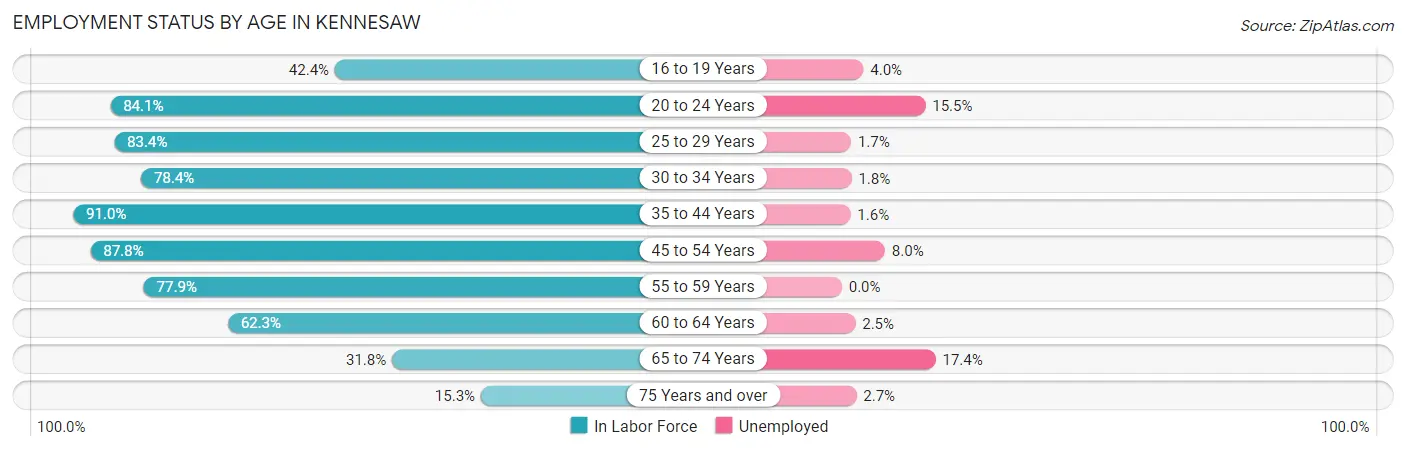
| Age Bracket | In Labor Force | Unemployed |
| 16 to 19 Years | 880 (42.4%) | 35 (4.0%) |
| 20 to 24 Years | 2,415 (84.1%) | 374 (15.5%) |
| 25 to 29 Years | 2,155 (83.4%) | 37 (1.7%) |
| 30 to 34 Years | 1,857 (78.4%) | 33 (1.8%) |
| 35 to 44 Years | 4,300 (91.0%) | 69 (1.6%) |
| 45 to 54 Years | 3,742 (87.8%) | 299 (8.0%) |
| 55 to 59 Years | 1,430 (77.9%) | 0 (0.0%) |
| 60 to 64 Years | 1,184 (62.3%) | 30 (2.5%) |
| 65 to 74 Years | 786 (31.8%) | 137 (17.4%) |
| 75 Years and over | 291 (15.3%) | 8 (2.7%) |
| Total | 19,031 (70.5%) | 1,028 (5.4%) |
Employment Status by Educational Attainment in Kennesaw
According to labor force statistics for Kennesaw, 83.0% of individuals (14,670) out of the total population between 25 and 64 years of age (17,675) are in the labor force, with 3.2% or 469 of them being unemployed. The group with the highest labor force participation rate are those with the educational attainment of bachelor's degree or higher, with 90.8% or 8,009 individuals in the labor force. Within the labor force, individuals with less than high school education have the highest percentage of unemployment, with 9.4% or 75 of them being unemployed.
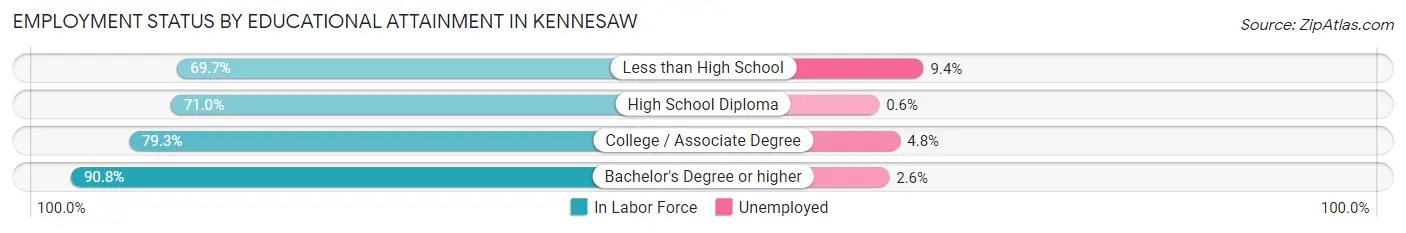
| Educational Attainment | In Labor Force | Unemployed |
| Less than High School | 802 (69.7%) | 108 (9.4%) |
| High School Diploma | 2,171 (71.0%) | 18 (0.6%) |
| College / Associate Degree | 3,684 (79.3%) | 223 (4.8%) |
| Bachelor's Degree or higher | 8,009 (90.8%) | 229 (2.6%) |
| Total | 14,670 (83.0%) | 566 (3.2%) |
Employment Occupations by Sex in Kennesaw
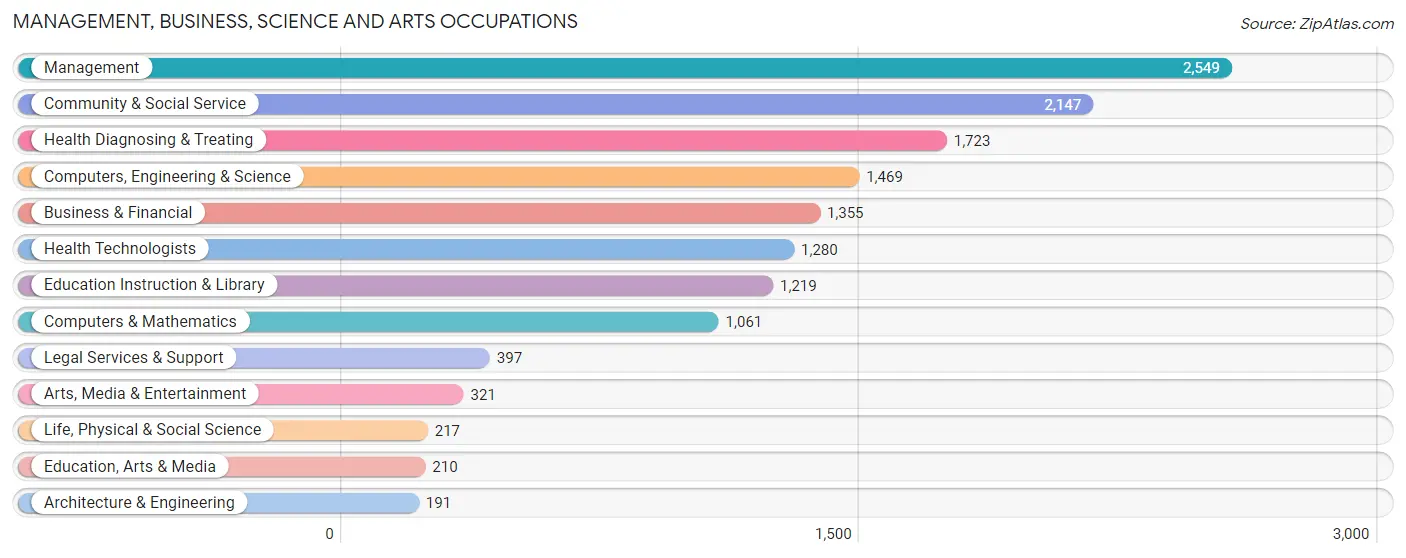
Management, Business, Science and Arts Occupations
The most common Management, Business, Science and Arts occupations in Kennesaw are Management (2,549 | 14.2%), Community & Social Service (2,147 | 12.0%), Health Diagnosing & Treating (1,723 | 9.6%), Computers, Engineering & Science (1,469 | 8.2%), and Business & Financial (1,355 | 7.5%).
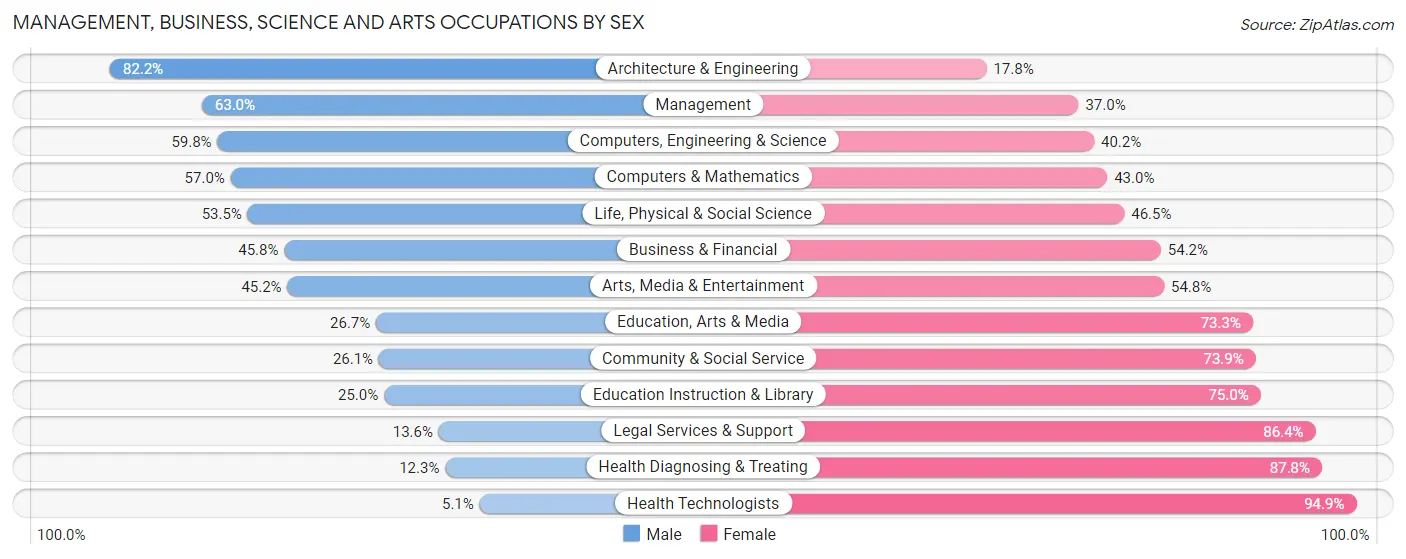
Management, Business, Science and Arts Occupations by Sex
Within the Management, Business, Science and Arts occupations in Kennesaw, the most male-oriented occupations are Architecture & Engineering (82.2%), Management (63.0%), and Computers, Engineering & Science (59.8%), while the most female-oriented occupations are Health Technologists (94.9%), Health Diagnosing & Treating (87.7%), and Legal Services & Support (86.4%).
| Occupation | Male | Female |
| Management | 1,606 (63.0%) | 943 (37.0%) |
| Business & Financial | 621 (45.8%) | 734 (54.2%) |
| Computers, Engineering & Science | 878 (59.8%) | 591 (40.2%) |
| Computers & Mathematics | 605 (57.0%) | 456 (43.0%) |
| Architecture & Engineering | 157 (82.2%) | 34 (17.8%) |
| Life, Physical & Social Science | 116 (53.5%) | 101 (46.5%) |
| Community & Social Service | 560 (26.1%) | 1,587 (73.9%) |
| Education, Arts & Media | 56 (26.7%) | 154 (73.3%) |
| Legal Services & Support | 54 (13.6%) | 343 (86.4%) |
| Education Instruction & Library | 305 (25.0%) | 914 (75.0%) |
| Arts, Media & Entertainment | 145 (45.2%) | 176 (54.8%) |
| Health Diagnosing & Treating | 211 (12.2%) | 1,512 (87.7%) |
| Health Technologists | 65 (5.1%) | 1,215 (94.9%) |
| Total (Category) | 3,876 (41.9%) | 5,367 (58.1%) |
| Total (Overall) | 8,507 (47.4%) | 9,452 (52.6%) |
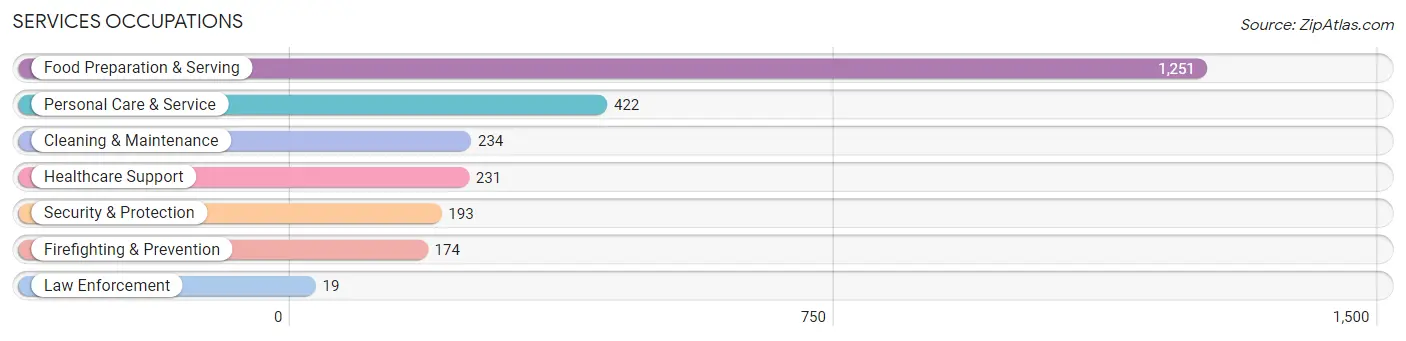
Services Occupations
The most common Services occupations in Kennesaw are Food Preparation & Serving (1,251 | 7.0%), Personal Care & Service (422 | 2.4%), Cleaning & Maintenance (234 | 1.3%), Healthcare Support (231 | 1.3%), and Security & Protection (193 | 1.1%).
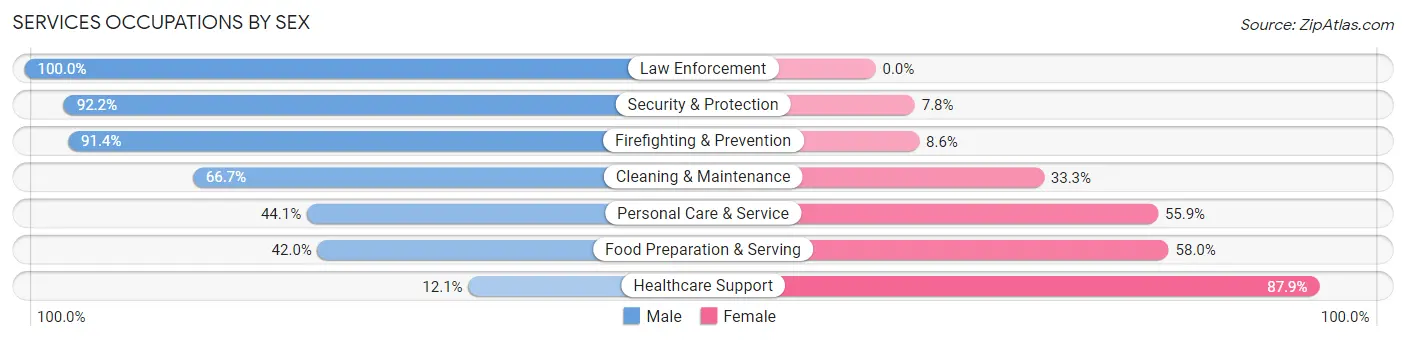
Services Occupations by Sex
Within the Services occupations in Kennesaw, the most male-oriented occupations are Law Enforcement (100.0%), Security & Protection (92.2%), and Firefighting & Prevention (91.4%), while the most female-oriented occupations are Healthcare Support (87.9%), Food Preparation & Serving (58.0%), and Personal Care & Service (55.9%).
| Occupation | Male | Female |
| Healthcare Support | 28 (12.1%) | 203 (87.9%) |
| Security & Protection | 178 (92.2%) | 15 (7.8%) |
| Firefighting & Prevention | 159 (91.4%) | 15 (8.6%) |
| Law Enforcement | 19 (100.0%) | 0 (0.0%) |
| Food Preparation & Serving | 525 (42.0%) | 726 (58.0%) |
| Cleaning & Maintenance | 156 (66.7%) | 78 (33.3%) |
| Personal Care & Service | 186 (44.1%) | 236 (55.9%) |
| Total (Category) | 1,073 (46.0%) | 1,258 (54.0%) |
| Total (Overall) | 8,507 (47.4%) | 9,452 (52.6%) |
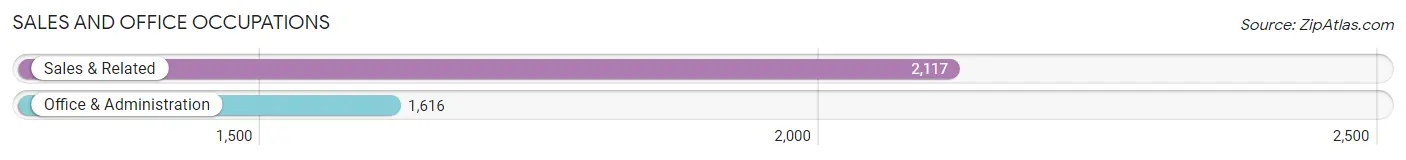
Sales and Office Occupations
The most common Sales and Office occupations in Kennesaw are Sales & Related (2,117 | 11.8%), and Office & Administration (1,616 | 9.0%).
Sales and Office Occupations by Sex
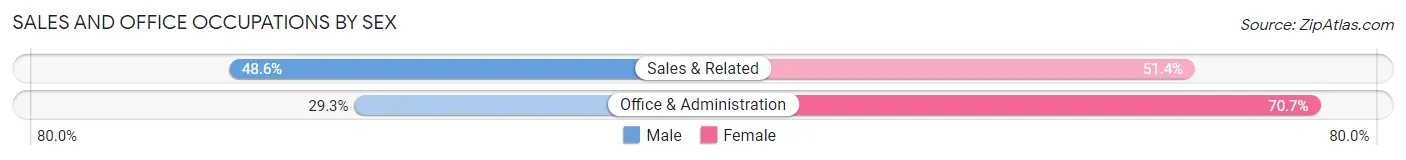
| Occupation | Male | Female |
| Sales & Related | 1,028 (48.6%) | 1,089 (51.4%) |
| Office & Administration | 473 (29.3%) | 1,143 (70.7%) |
| Total (Category) | 1,501 (40.2%) | 2,232 (59.8%) |
| Total (Overall) | 8,507 (47.4%) | 9,452 (52.6%) |
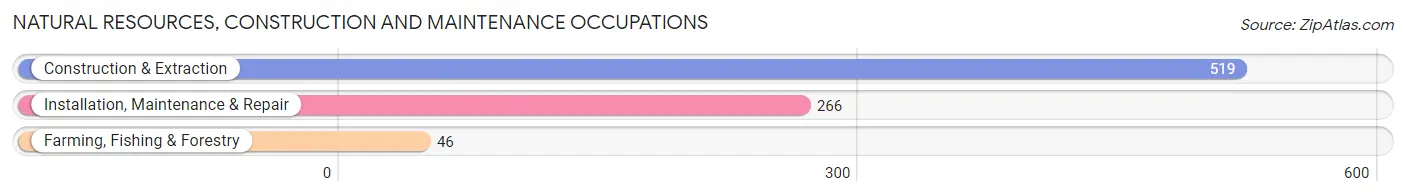
Natural Resources, Construction and Maintenance Occupations
The most common Natural Resources, Construction and Maintenance occupations in Kennesaw are Construction & Extraction (519 | 2.9%), Installation, Maintenance & Repair (266 | 1.5%), and Farming, Fishing & Forestry (46 | 0.3%).
Natural Resources, Construction and Maintenance Occupations by Sex
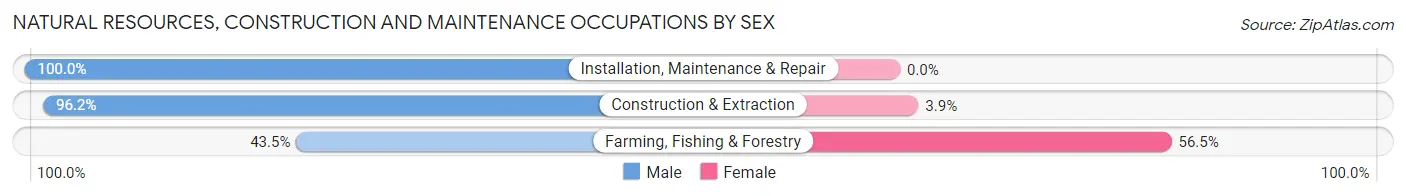
| Occupation | Male | Female |
| Farming, Fishing & Forestry | 20 (43.5%) | 26 (56.5%) |
| Construction & Extraction | 499 (96.2%) | 20 (3.8%) |
| Installation, Maintenance & Repair | 266 (100.0%) | 0 (0.0%) |
| Total (Category) | 785 (94.5%) | 46 (5.5%) |
| Total (Overall) | 8,507 (47.4%) | 9,452 (52.6%) |
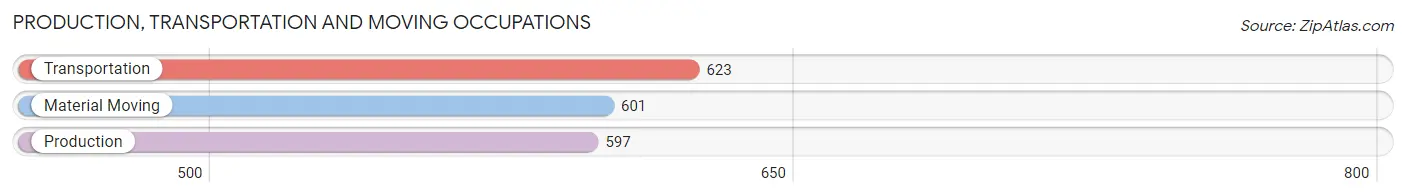
Production, Transportation and Moving Occupations
The most common Production, Transportation and Moving occupations in Kennesaw are Transportation (623 | 3.5%), Material Moving (601 | 3.4%), and Production (597 | 3.3%).
Production, Transportation and Moving Occupations by Sex
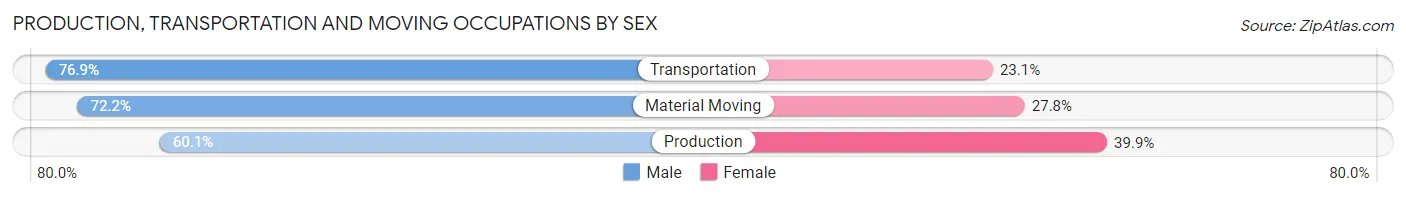
| Occupation | Male | Female |
| Production | 359 (60.1%) | 238 (39.9%) |
| Transportation | 479 (76.9%) | 144 (23.1%) |
| Material Moving | 434 (72.2%) | 167 (27.8%) |
| Total (Category) | 1,272 (69.9%) | 549 (30.1%) |
| Total (Overall) | 8,507 (47.4%) | 9,452 (52.6%) |
Employment Industries by Sex in Kennesaw
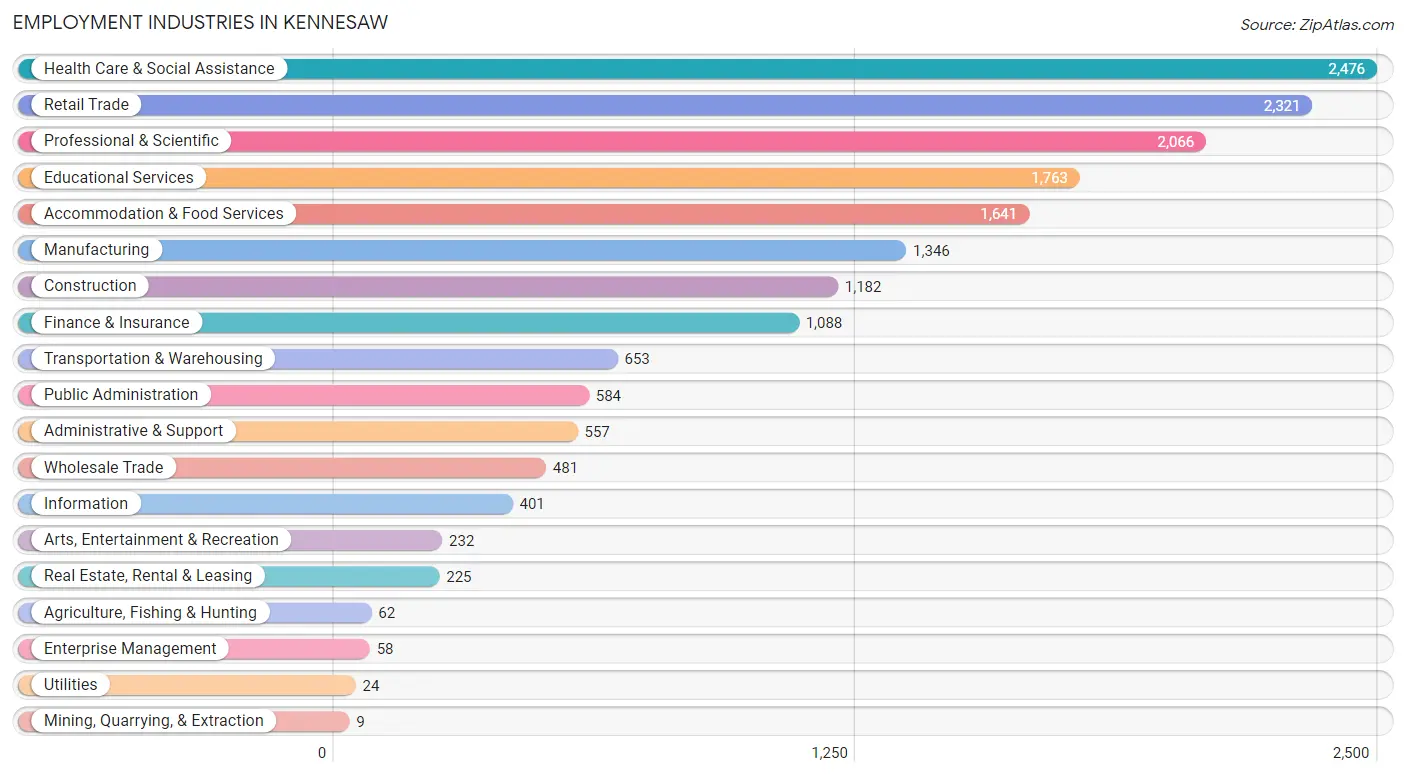
Employment Industries in Kennesaw
The major employment industries in Kennesaw include Health Care & Social Assistance (2,476 | 13.8%), Retail Trade (2,321 | 12.9%), Professional & Scientific (2,066 | 11.5%), Educational Services (1,763 | 9.8%), and Accommodation & Food Services (1,641 | 9.1%).
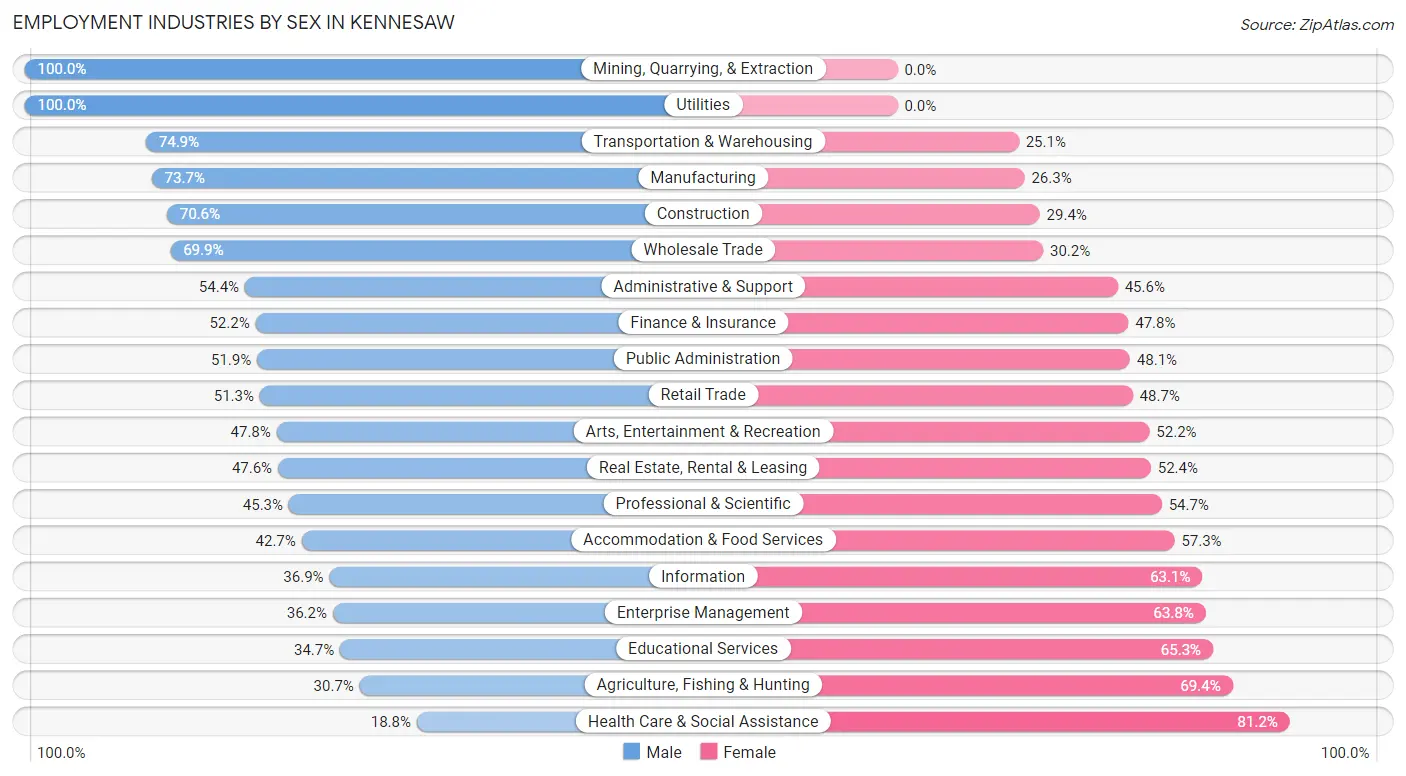
Employment Industries by Sex in Kennesaw
The Kennesaw industries that see more men than women are Mining, Quarrying, & Extraction (100.0%), Utilities (100.0%), and Transportation & Warehousing (74.9%), whereas the industries that tend to have a higher number of women are Health Care & Social Assistance (81.2%), Agriculture, Fishing & Hunting (69.4%), and Educational Services (65.3%).
| Industry | Male | Female |
| Agriculture, Fishing & Hunting | 19 (30.6%) | 43 (69.4%) |
| Mining, Quarrying, & Extraction | 9 (100.0%) | 0 (0.0%) |
| Construction | 834 (70.6%) | 348 (29.4%) |
| Manufacturing | 992 (73.7%) | 354 (26.3%) |
| Wholesale Trade | 336 (69.9%) | 145 (30.1%) |
| Retail Trade | 1,191 (51.3%) | 1,130 (48.7%) |
| Transportation & Warehousing | 489 (74.9%) | 164 (25.1%) |
| Utilities | 24 (100.0%) | 0 (0.0%) |
| Information | 148 (36.9%) | 253 (63.1%) |
| Finance & Insurance | 568 (52.2%) | 520 (47.8%) |
| Real Estate, Rental & Leasing | 107 (47.6%) | 118 (52.4%) |
| Professional & Scientific | 936 (45.3%) | 1,130 (54.7%) |
| Enterprise Management | 21 (36.2%) | 37 (63.8%) |
| Administrative & Support | 303 (54.4%) | 254 (45.6%) |
| Educational Services | 612 (34.7%) | 1,151 (65.3%) |
| Health Care & Social Assistance | 466 (18.8%) | 2,010 (81.2%) |
| Arts, Entertainment & Recreation | 111 (47.8%) | 121 (52.2%) |
| Accommodation & Food Services | 700 (42.7%) | 941 (57.3%) |
| Public Administration | 303 (51.9%) | 281 (48.1%) |
| Total | 8,507 (47.4%) | 9,452 (52.6%) |
Education in Kennesaw
School Enrollment in Kennesaw
The most common levels of schooling among the 9,137 students in Kennesaw are college / undergraduate (2,748 | 30.1%), high school (1,693 | 18.5%), and middle school (1,593 | 17.4%).
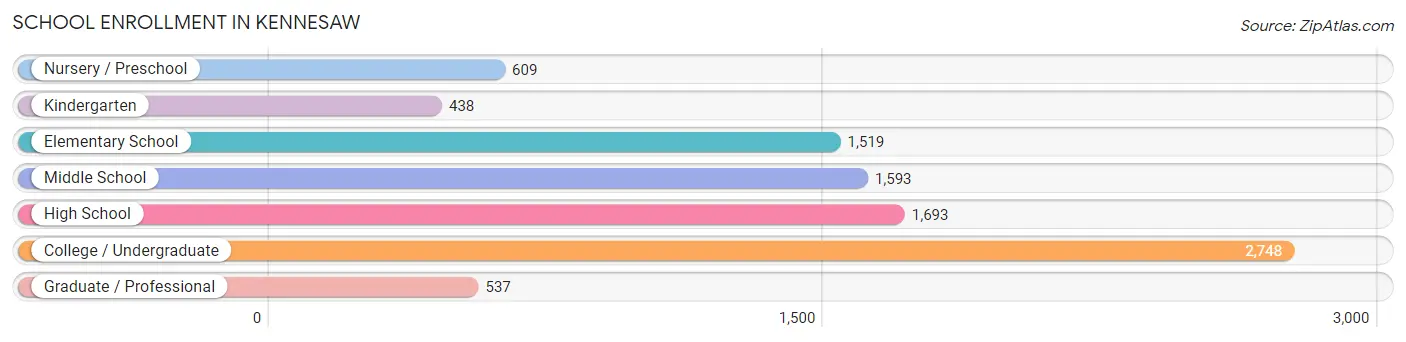
| School Level | # Students | % Students |
| Nursery / Preschool | 609 | 6.7% |
| Kindergarten | 438 | 4.8% |
| Elementary School | 1,519 | 16.6% |
| Middle School | 1,593 | 17.4% |
| High School | 1,693 | 18.5% |
| College / Undergraduate | 2,748 | 30.1% |
| Graduate / Professional | 537 | 5.9% |
| Total | 9,137 | 100.0% |
School Enrollment by Age by Funding Source in Kennesaw
Out of a total of 9,137 students who are enrolled in schools in Kennesaw, 1,544 (16.9%) attend a private institution, while the remaining 7,593 (83.1%) are enrolled in public schools. The age group of 3 to 4 year olds has the highest likelihood of being enrolled in private schools, with 221 (39.5% in the age bracket) enrolled. Conversely, the age group of 18 to 19 year olds has the lowest likelihood of being enrolled in a private school, with 864 (99.4% in the age bracket) attending a public institution.
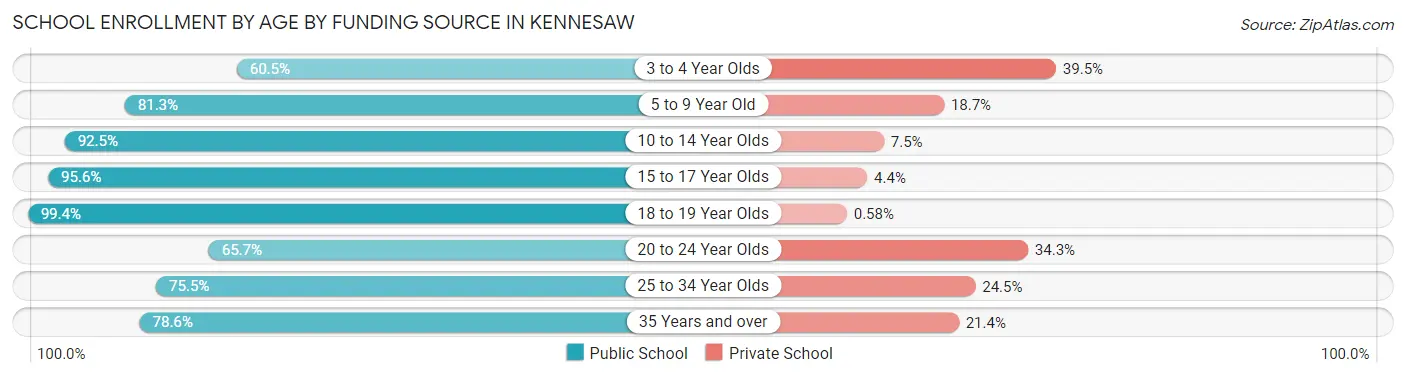
| Age Bracket | Public School | Private School |
| 3 to 4 Year Olds | 338 (60.5%) | 221 (39.5%) |
| 5 to 9 Year Old | 1,393 (81.3%) | 320 (18.7%) |
| 10 to 14 Year Olds | 1,918 (92.5%) | 155 (7.5%) |
| 15 to 17 Year Olds | 1,314 (95.6%) | 60 (4.4%) |
| 18 to 19 Year Olds | 864 (99.4%) | 5 (0.6%) |
| 20 to 24 Year Olds | 1,158 (65.7%) | 605 (34.3%) |
| 25 to 34 Year Olds | 308 (75.5%) | 100 (24.5%) |
| 35 Years and over | 297 (78.6%) | 81 (21.4%) |
| Total | 7,593 (83.1%) | 1,544 (16.9%) |
Educational Attainment by Field of Study in Kennesaw
Business (2,637 | 24.1%), science & technology (1,028 | 9.4%), education (1,003 | 9.2%), engineering (985 | 9.0%), and social sciences (847 | 7.7%) are the most common fields of study among 10,955 individuals in Kennesaw who have obtained a bachelor's degree or higher.
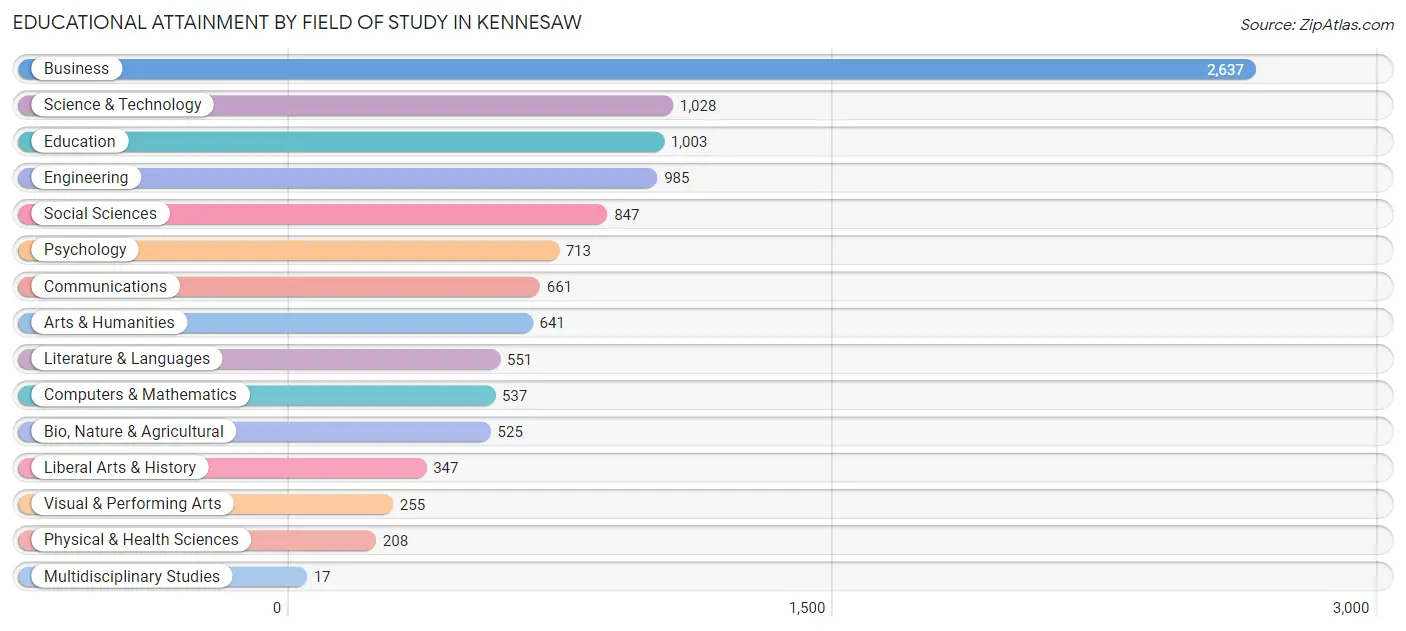
| Field of Study | # Graduates | % Graduates |
| Computers & Mathematics | 537 | 4.9% |
| Bio, Nature & Agricultural | 525 | 4.8% |
| Physical & Health Sciences | 208 | 1.9% |
| Psychology | 713 | 6.5% |
| Social Sciences | 847 | 7.7% |
| Engineering | 985 | 9.0% |
| Multidisciplinary Studies | 17 | 0.2% |
| Science & Technology | 1,028 | 9.4% |
| Business | 2,637 | 24.1% |
| Education | 1,003 | 9.2% |
| Literature & Languages | 551 | 5.0% |
| Liberal Arts & History | 347 | 3.2% |
| Visual & Performing Arts | 255 | 2.3% |
| Communications | 661 | 6.0% |
| Arts & Humanities | 641 | 5.9% |
| Total | 10,955 | 100.0% |
Transportation & Commute in Kennesaw
Vehicle Availability by Sex in Kennesaw
The most prevalent vehicle ownership categories in Kennesaw are males with 2 vehicles (4,103, accounting for 49.2%) and females with 2 vehicles (4,617, making up 43.7%).
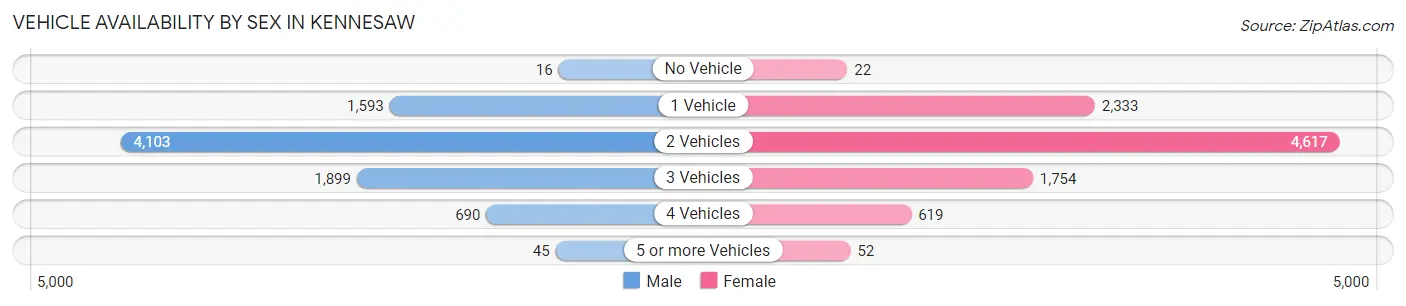
| Vehicles Available | Male | Female |
| No Vehicle | 16 (0.2%) | 22 (0.2%) |
| 1 Vehicle | 1,593 (19.1%) | 2,333 (24.8%) |
| 2 Vehicles | 4,103 (49.2%) | 4,617 (49.1%) |
| 3 Vehicles | 1,899 (22.8%) | 1,754 (18.7%) |
| 4 Vehicles | 690 (8.3%) | 619 (6.6%) |
| 5 or more Vehicles | 45 (0.5%) | 52 (0.5%) |
| Total | 8,346 (100.0%) | 9,397 (100.0%) |
Commute Time in Kennesaw
The most frequently occuring commute durations in Kennesaw are 15 to 19 minutes (2,589 commuters, 17.6%), 30 to 34 minutes (1,815 commuters, 12.4%), and 20 to 24 minutes (1,739 commuters, 11.8%).
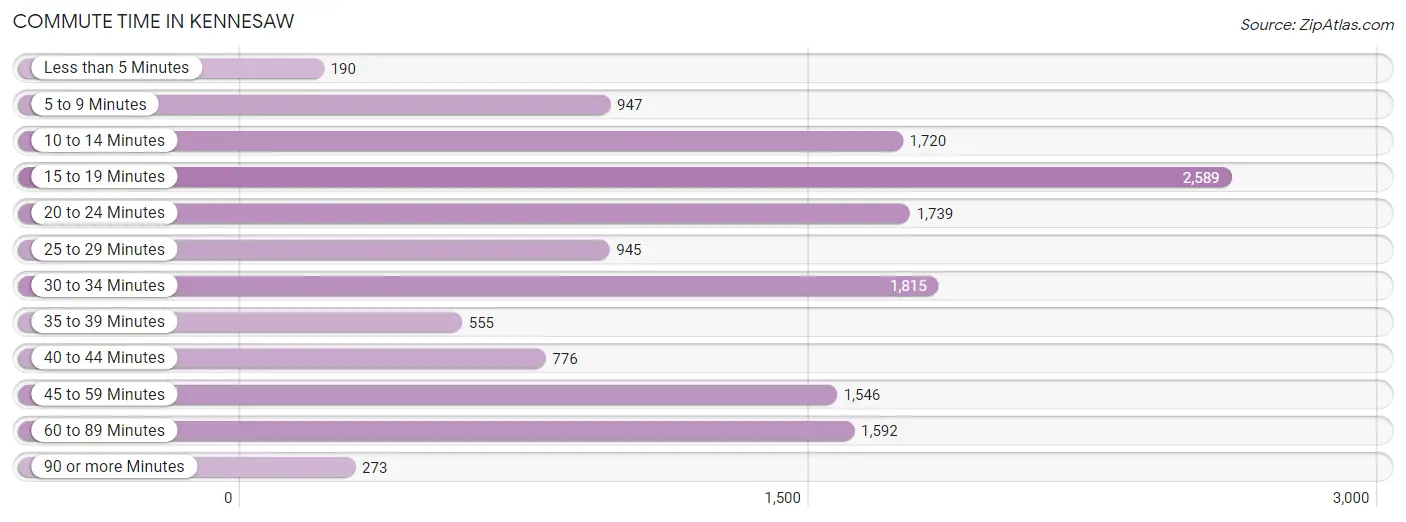
| Commute Time | # Commuters | % Commuters |
| Less than 5 Minutes | 190 | 1.3% |
| 5 to 9 Minutes | 947 | 6.5% |
| 10 to 14 Minutes | 1,720 | 11.7% |
| 15 to 19 Minutes | 2,589 | 17.6% |
| 20 to 24 Minutes | 1,739 | 11.8% |
| 25 to 29 Minutes | 945 | 6.4% |
| 30 to 34 Minutes | 1,815 | 12.4% |
| 35 to 39 Minutes | 555 | 3.8% |
| 40 to 44 Minutes | 776 | 5.3% |
| 45 to 59 Minutes | 1,546 | 10.5% |
| 60 to 89 Minutes | 1,592 | 10.8% |
| 90 or more Minutes | 273 | 1.9% |
Commute Time by Sex in Kennesaw
The most common commute times in Kennesaw are 15 to 19 minutes (1,494 commuters, 21.0%) for males and 15 to 19 minutes (1,095 commuters, 14.5%) for females.
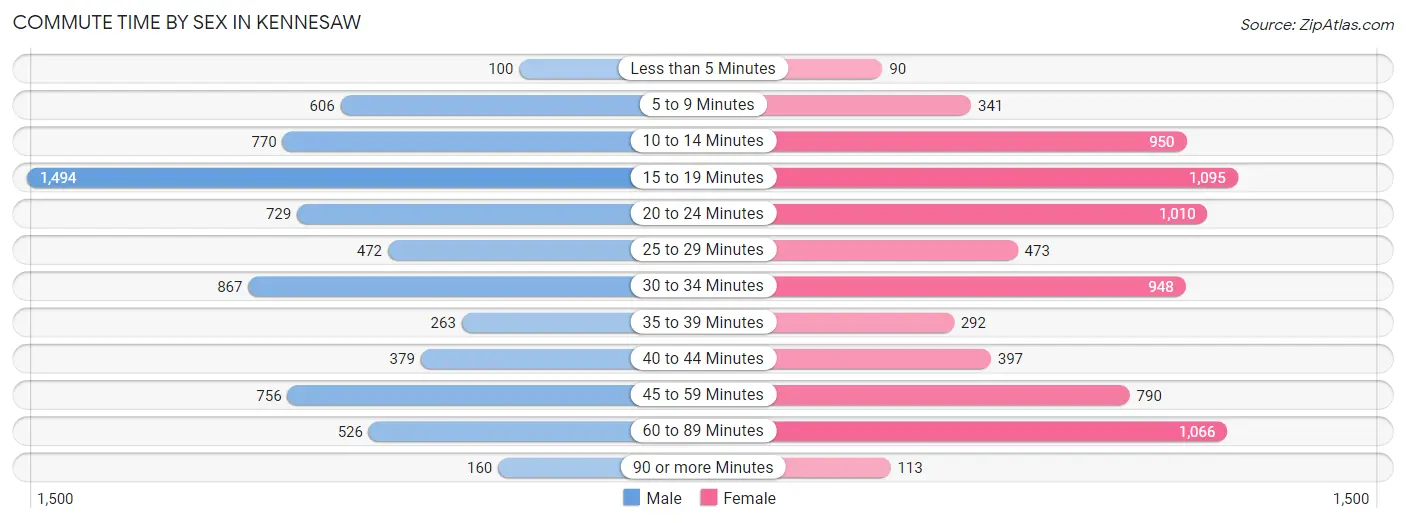
| Commute Time | Male | Female |
| Less than 5 Minutes | 100 (1.4%) | 90 (1.2%) |
| 5 to 9 Minutes | 606 (8.5%) | 341 (4.5%) |
| 10 to 14 Minutes | 770 (10.8%) | 950 (12.6%) |
| 15 to 19 Minutes | 1,494 (21.0%) | 1,095 (14.5%) |
| 20 to 24 Minutes | 729 (10.2%) | 1,010 (13.4%) |
| 25 to 29 Minutes | 472 (6.6%) | 473 (6.2%) |
| 30 to 34 Minutes | 867 (12.2%) | 948 (12.5%) |
| 35 to 39 Minutes | 263 (3.7%) | 292 (3.9%) |
| 40 to 44 Minutes | 379 (5.3%) | 397 (5.2%) |
| 45 to 59 Minutes | 756 (10.6%) | 790 (10.4%) |
| 60 to 89 Minutes | 526 (7.4%) | 1,066 (14.1%) |
| 90 or more Minutes | 160 (2.2%) | 113 (1.5%) |
Time of Departure to Work by Sex in Kennesaw
The most frequent times of departure to work in Kennesaw are 7:00 AM to 7:29 AM (1,063, 14.9%) for males and 7:00 AM to 7:29 AM (1,640, 21.7%) for females.
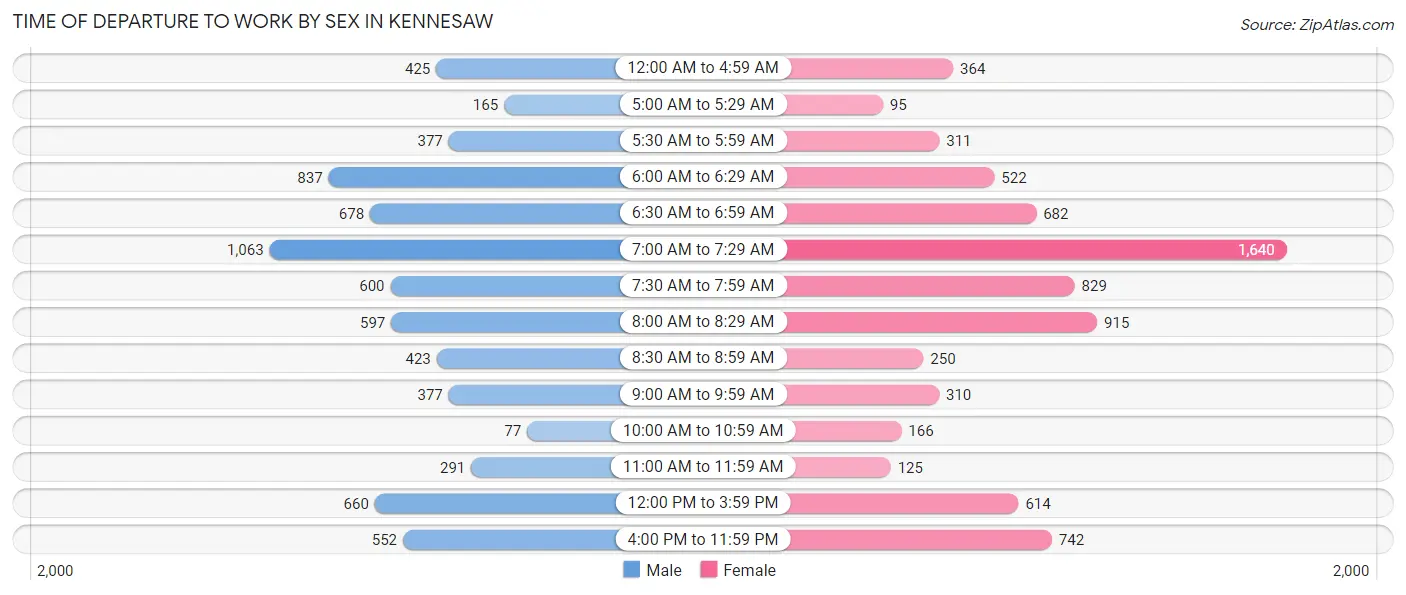
| Time of Departure | Male | Female |
| 12:00 AM to 4:59 AM | 425 (6.0%) | 364 (4.8%) |
| 5:00 AM to 5:29 AM | 165 (2.3%) | 95 (1.3%) |
| 5:30 AM to 5:59 AM | 377 (5.3%) | 311 (4.1%) |
| 6:00 AM to 6:29 AM | 837 (11.7%) | 522 (6.9%) |
| 6:30 AM to 6:59 AM | 678 (9.5%) | 682 (9.0%) |
| 7:00 AM to 7:29 AM | 1,063 (14.9%) | 1,640 (21.7%) |
| 7:30 AM to 7:59 AM | 600 (8.4%) | 829 (11.0%) |
| 8:00 AM to 8:29 AM | 597 (8.4%) | 915 (12.1%) |
| 8:30 AM to 8:59 AM | 423 (5.9%) | 250 (3.3%) |
| 9:00 AM to 9:59 AM | 377 (5.3%) | 310 (4.1%) |
| 10:00 AM to 10:59 AM | 77 (1.1%) | 166 (2.2%) |
| 11:00 AM to 11:59 AM | 291 (4.1%) | 125 (1.7%) |
| 12:00 PM to 3:59 PM | 660 (9.3%) | 614 (8.1%) |
| 4:00 PM to 11:59 PM | 552 (7.7%) | 742 (9.8%) |
| Total | 7,122 (100.0%) | 7,565 (100.0%) |
Housing Occupancy in Kennesaw
Occupancy by Ownership in Kennesaw
Of the total 13,046 dwellings in Kennesaw, owner-occupied units account for 8,543 (65.5%), while renter-occupied units make up 4,503 (34.5%).
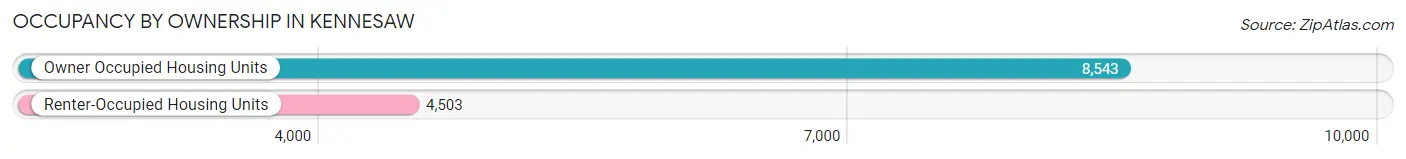
| Occupancy | # Housing Units | % Housing Units |
| Owner Occupied Housing Units | 8,543 | 65.5% |
| Renter-Occupied Housing Units | 4,503 | 34.5% |
| Total Occupied Housing Units | 13,046 | 100.0% |
Occupancy by Household Size in Kennesaw
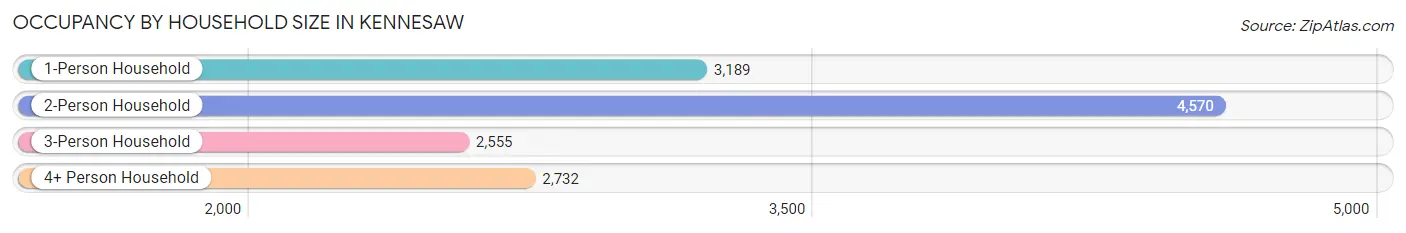
| Household Size | # Housing Units | % Housing Units |
| 1-Person Household | 3,189 | 24.4% |
| 2-Person Household | 4,570 | 35.0% |
| 3-Person Household | 2,555 | 19.6% |
| 4+ Person Household | 2,732 | 20.9% |
| Total Housing Units | 13,046 | 100.0% |
Occupancy by Ownership by Household Size in Kennesaw
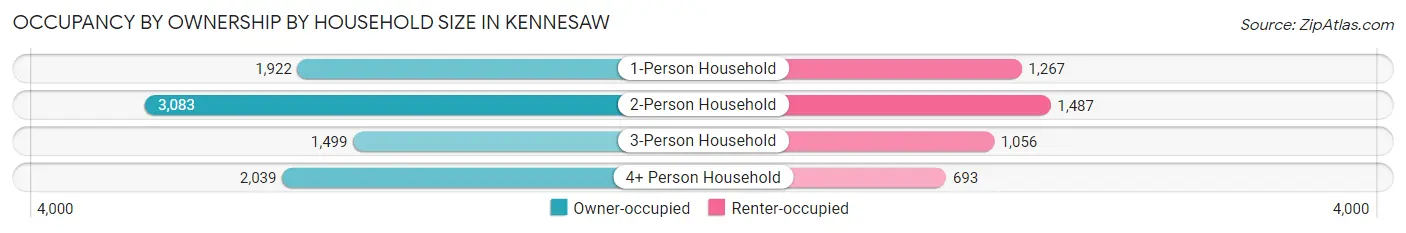
| Household Size | Owner-occupied | Renter-occupied |
| 1-Person Household | 1,922 (60.3%) | 1,267 (39.7%) |
| 2-Person Household | 3,083 (67.5%) | 1,487 (32.5%) |
| 3-Person Household | 1,499 (58.7%) | 1,056 (41.3%) |
| 4+ Person Household | 2,039 (74.6%) | 693 (25.4%) |
| Total Housing Units | 8,543 (65.5%) | 4,503 (34.5%) |
Occupancy by Educational Attainment in Kennesaw
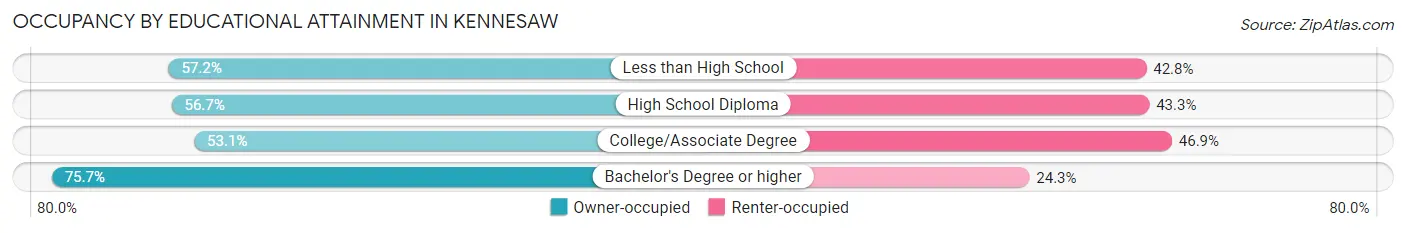
| Household Size | Owner-occupied | Renter-occupied |
| Less than High School | 427 (57.2%) | 320 (42.8%) |
| High School Diploma | 1,242 (56.7%) | 949 (43.3%) |
| College/Associate Degree | 1,827 (53.1%) | 1,614 (46.9%) |
| Bachelor's Degree or higher | 5,047 (75.7%) | 1,620 (24.3%) |
Occupancy by Age of Householder in Kennesaw
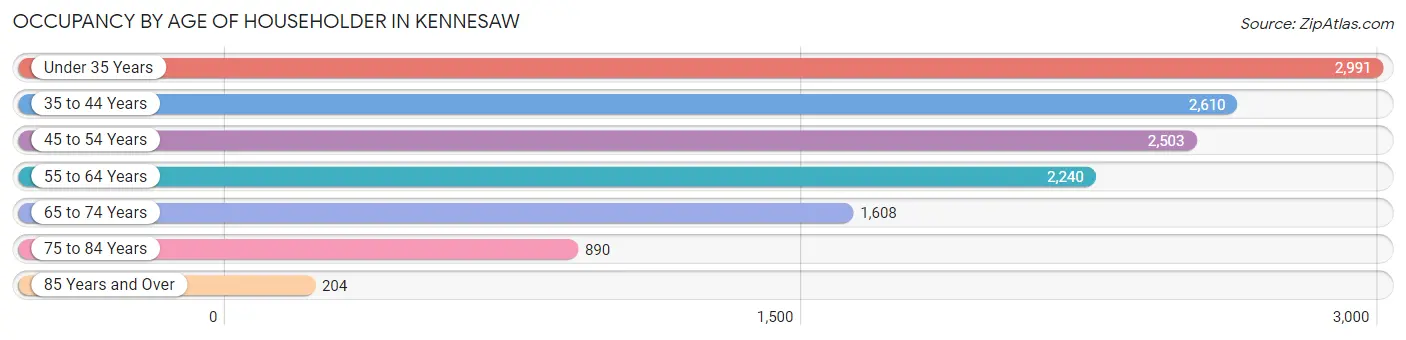
| Age Bracket | # Households | % Households |
| Under 35 Years | 2,991 | 22.9% |
| 35 to 44 Years | 2,610 | 20.0% |
| 45 to 54 Years | 2,503 | 19.2% |
| 55 to 64 Years | 2,240 | 17.2% |
| 65 to 74 Years | 1,608 | 12.3% |
| 75 to 84 Years | 890 | 6.8% |
| 85 Years and Over | 204 | 1.6% |
| Total | 13,046 | 100.0% |
Housing Finances in Kennesaw
Median Income by Occupancy in Kennesaw
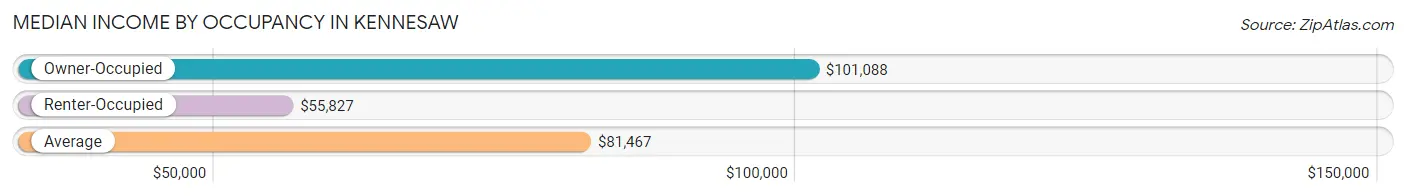
| Occupancy Type | # Households | Median Income |
| Owner-Occupied | 8,543 (65.5%) | $101,088 |
| Renter-Occupied | 4,503 (34.5%) | $55,827 |
| Average | 13,046 (100.0%) | $81,467 |
Occupancy by Householder Income Bracket in Kennesaw
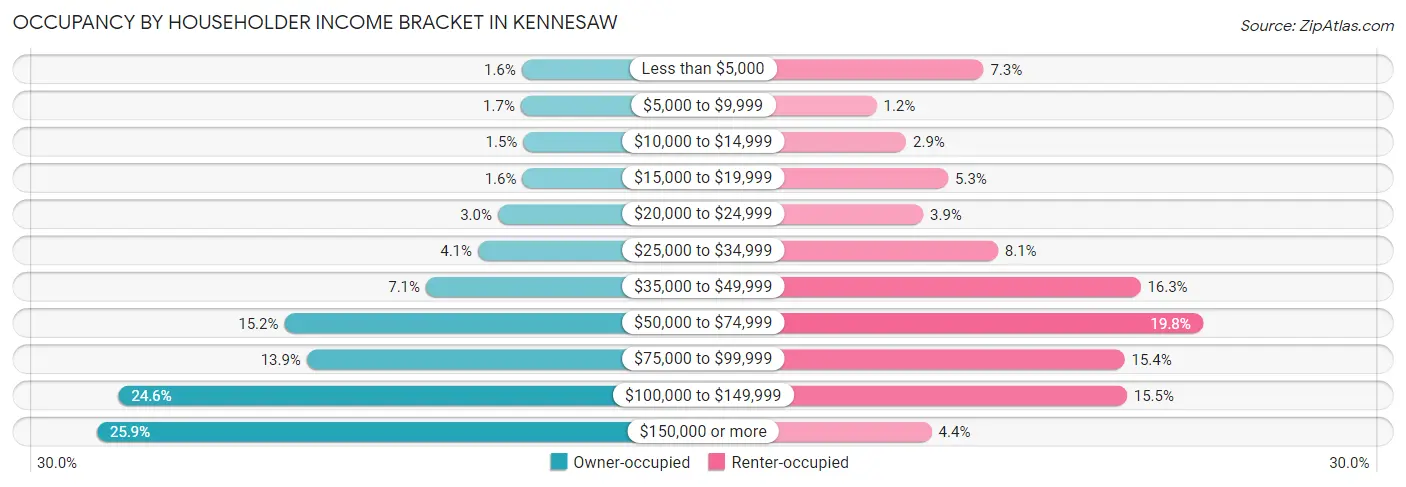
| Income Bracket | Owner-occupied | Renter-occupied |
| Less than $5,000 | 137 (1.6%) | 329 (7.3%) |
| $5,000 to $9,999 | 141 (1.7%) | 54 (1.2%) |
| $10,000 to $14,999 | 129 (1.5%) | 130 (2.9%) |
| $15,000 to $19,999 | 133 (1.6%) | 238 (5.3%) |
| $20,000 to $24,999 | 253 (3.0%) | 174 (3.9%) |
| $25,000 to $34,999 | 350 (4.1%) | 366 (8.1%) |
| $35,000 to $49,999 | 604 (7.1%) | 733 (16.3%) |
| $50,000 to $74,999 | 1,295 (15.2%) | 893 (19.8%) |
| $75,000 to $99,999 | 1,186 (13.9%) | 692 (15.4%) |
| $100,000 to $149,999 | 2,105 (24.6%) | 698 (15.5%) |
| $150,000 or more | 2,210 (25.9%) | 196 (4.3%) |
| Total | 8,543 (100.0%) | 4,503 (100.0%) |
Monthly Housing Cost Tiers in Kennesaw
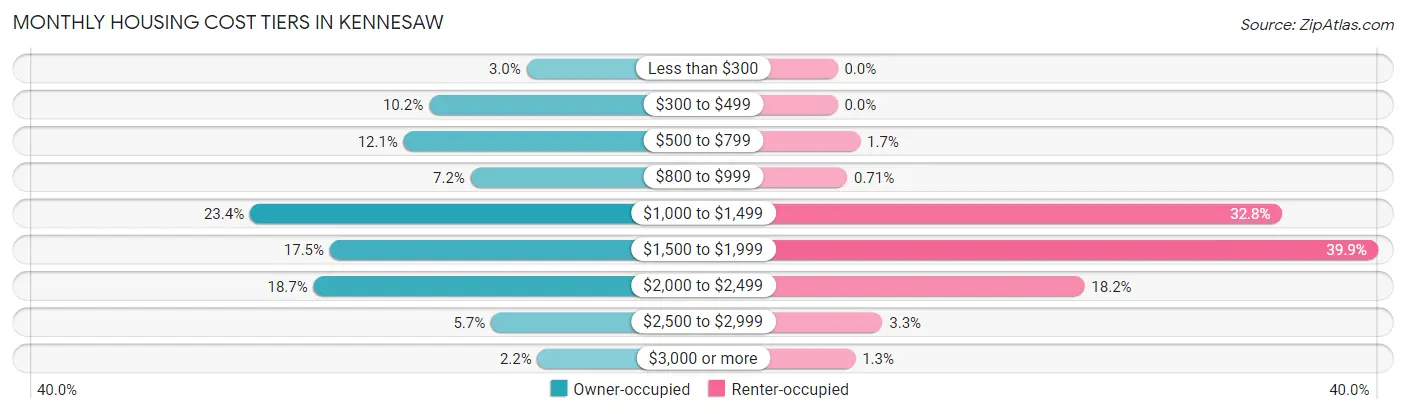
| Monthly Cost | Owner-occupied | Renter-occupied |
| Less than $300 | 259 (3.0%) | 0 (0.0%) |
| $300 to $499 | 873 (10.2%) | 0 (0.0%) |
| $500 to $799 | 1,032 (12.1%) | 75 (1.7%) |
| $800 to $999 | 611 (7.1%) | 32 (0.7%) |
| $1,000 to $1,499 | 1,999 (23.4%) | 1,475 (32.8%) |
| $1,500 to $1,999 | 1,497 (17.5%) | 1,795 (39.9%) |
| $2,000 to $2,499 | 1,599 (18.7%) | 819 (18.2%) |
| $2,500 to $2,999 | 483 (5.7%) | 149 (3.3%) |
| $3,000 or more | 190 (2.2%) | 59 (1.3%) |
| Total | 8,543 (100.0%) | 4,503 (100.0%) |
Physical Housing Characteristics in Kennesaw
Housing Structures in Kennesaw
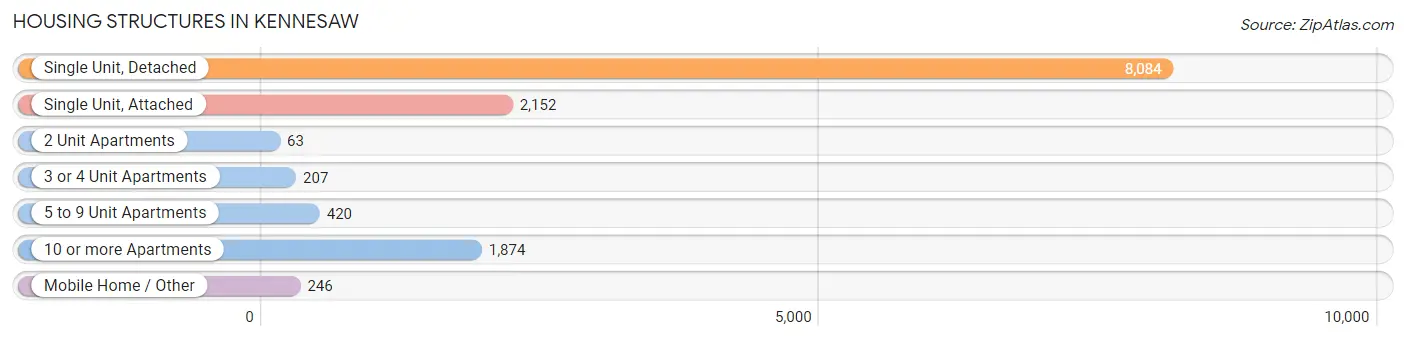
| Structure Type | # Housing Units | % Housing Units |
| Single Unit, Detached | 8,084 | 62.0% |
| Single Unit, Attached | 2,152 | 16.5% |
| 2 Unit Apartments | 63 | 0.5% |
| 3 or 4 Unit Apartments | 207 | 1.6% |
| 5 to 9 Unit Apartments | 420 | 3.2% |
| 10 or more Apartments | 1,874 | 14.4% |
| Mobile Home / Other | 246 | 1.9% |
| Total | 13,046 | 100.0% |
Housing Structures by Occupancy in Kennesaw
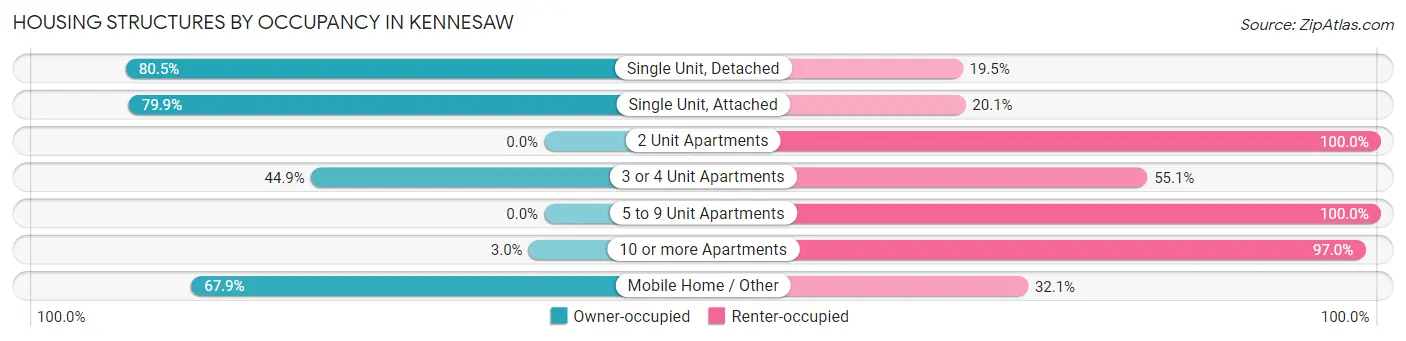
| Structure Type | Owner-occupied | Renter-occupied |
| Single Unit, Detached | 6,507 (80.5%) | 1,577 (19.5%) |
| Single Unit, Attached | 1,720 (79.9%) | 432 (20.1%) |
| 2 Unit Apartments | 0 (0.0%) | 63 (100.0%) |
| 3 or 4 Unit Apartments | 93 (44.9%) | 114 (55.1%) |
| 5 to 9 Unit Apartments | 0 (0.0%) | 420 (100.0%) |
| 10 or more Apartments | 56 (3.0%) | 1,818 (97.0%) |
| Mobile Home / Other | 167 (67.9%) | 79 (32.1%) |
| Total | 8,543 (65.5%) | 4,503 (34.5%) |
Housing Structures by Number of Rooms in Kennesaw
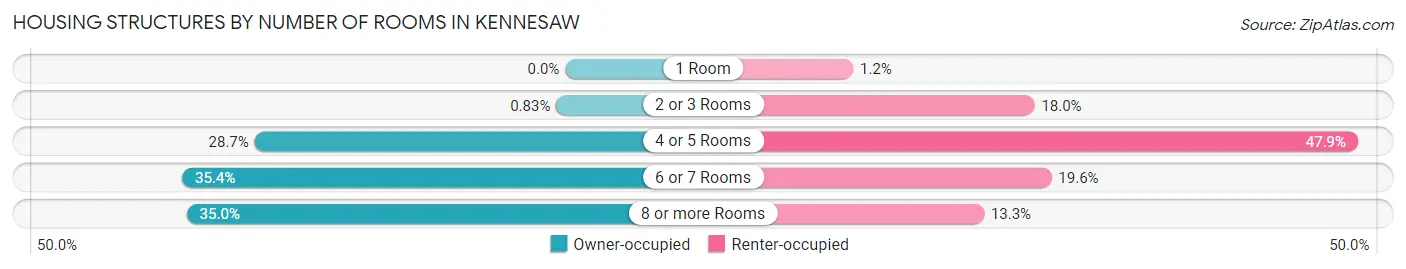
| Number of Rooms | Owner-occupied | Renter-occupied |
| 1 Room | 0 (0.0%) | 55 (1.2%) |
| 2 or 3 Rooms | 71 (0.8%) | 810 (18.0%) |
| 4 or 5 Rooms | 2,454 (28.7%) | 2,157 (47.9%) |
| 6 or 7 Rooms | 3,027 (35.4%) | 881 (19.6%) |
| 8 or more Rooms | 2,991 (35.0%) | 600 (13.3%) |
| Total | 8,543 (100.0%) | 4,503 (100.0%) |
Housing Structure by Heating Type in Kennesaw
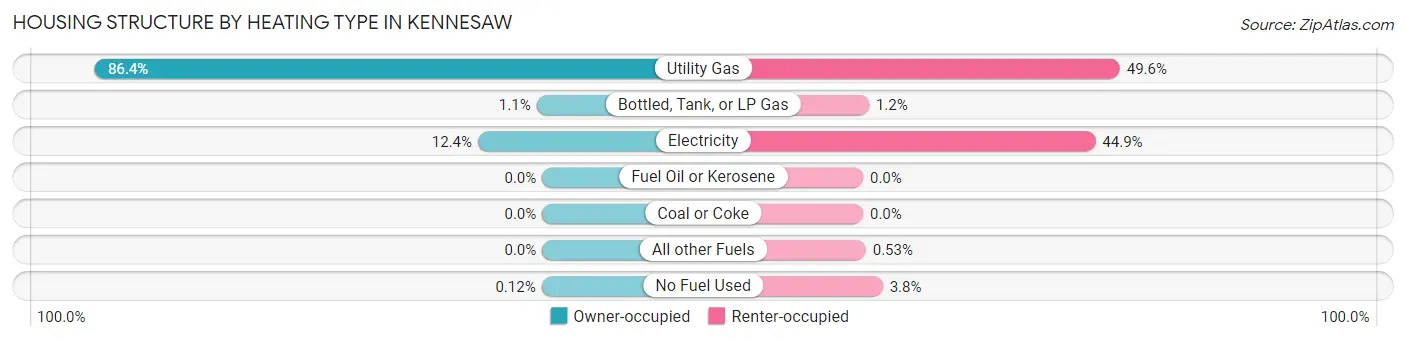
| Heating Type | Owner-occupied | Renter-occupied |
| Utility Gas | 7,381 (86.4%) | 2,234 (49.6%) |
| Bottled, Tank, or LP Gas | 92 (1.1%) | 52 (1.1%) |
| Electricity | 1,060 (12.4%) | 2,022 (44.9%) |
| Fuel Oil or Kerosene | 0 (0.0%) | 0 (0.0%) |
| Coal or Coke | 0 (0.0%) | 0 (0.0%) |
| All other Fuels | 0 (0.0%) | 24 (0.5%) |
| No Fuel Used | 10 (0.1%) | 171 (3.8%) |
| Total | 8,543 (100.0%) | 4,503 (100.0%) |
Household Vehicle Usage in Kennesaw
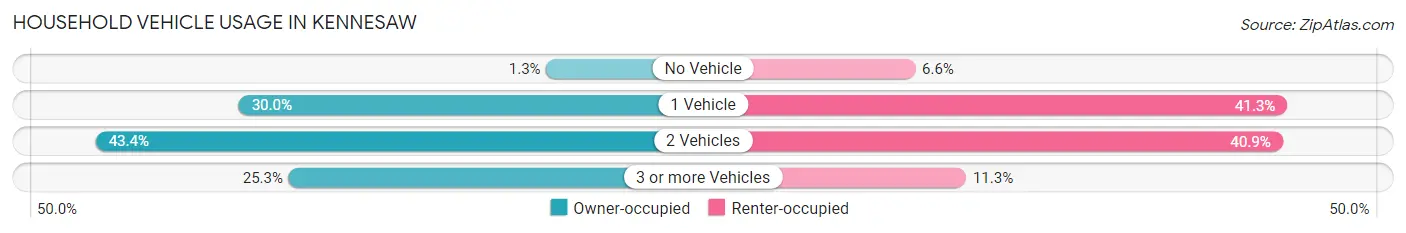
| Vehicles per Household | Owner-occupied | Renter-occupied |
| No Vehicle | 110 (1.3%) | 295 (6.6%) |
| 1 Vehicle | 2,564 (30.0%) | 1,859 (41.3%) |
| 2 Vehicles | 3,704 (43.4%) | 1,840 (40.9%) |
| 3 or more Vehicles | 2,165 (25.3%) | 509 (11.3%) |
| Total | 8,543 (100.0%) | 4,503 (100.0%) |
Real Estate & Mortgages in Kennesaw
Real Estate and Mortgage Overview in Kennesaw
| Characteristic | Without Mortgage | With Mortgage |
| Housing Units | 2,269 | 6,274 |
| Median Property Value | $259,100 | $263,600 |
| Median Household Income | $71,800 | $1,690 |
| Monthly Housing Costs | $510 | $190 |
| Real Estate Taxes | $1,760 | $102 |
Property Value by Mortgage Status in Kennesaw
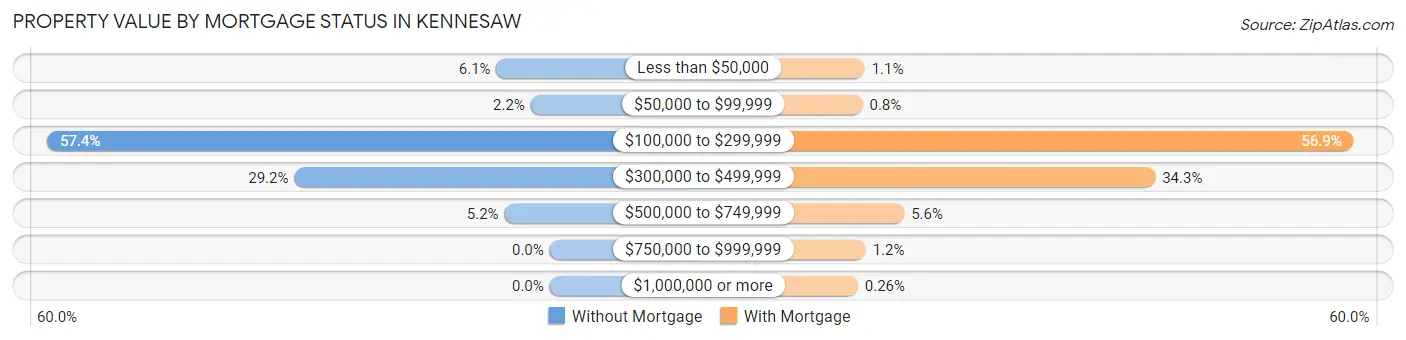
| Property Value | Without Mortgage | With Mortgage |
| Less than $50,000 | 138 (6.1%) | 66 (1.1%) |
| $50,000 to $99,999 | 49 (2.2%) | 50 (0.8%) |
| $100,000 to $299,999 | 1,303 (57.4%) | 3,571 (56.9%) |
| $300,000 to $499,999 | 662 (29.2%) | 2,149 (34.3%) |
| $500,000 to $749,999 | 117 (5.2%) | 349 (5.6%) |
| $750,000 to $999,999 | 0 (0.0%) | 73 (1.2%) |
| $1,000,000 or more | 0 (0.0%) | 16 (0.3%) |
| Total | 2,269 (100.0%) | 6,274 (100.0%) |
Household Income by Mortgage Status in Kennesaw
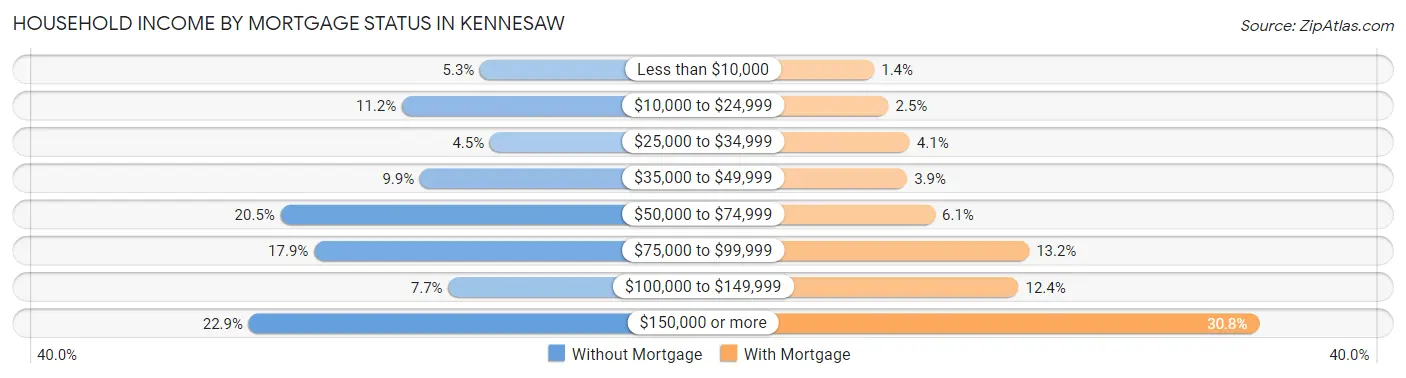
| Household Income | Without Mortgage | With Mortgage |
| Less than $10,000 | 120 (5.3%) | 90 (1.4%) |
| $10,000 to $24,999 | 255 (11.2%) | 158 (2.5%) |
| $25,000 to $34,999 | 103 (4.5%) | 260 (4.1%) |
| $35,000 to $49,999 | 224 (9.9%) | 247 (3.9%) |
| $50,000 to $74,999 | 465 (20.5%) | 380 (6.1%) |
| $75,000 to $99,999 | 407 (17.9%) | 830 (13.2%) |
| $100,000 to $149,999 | 175 (7.7%) | 779 (12.4%) |
| $150,000 or more | 520 (22.9%) | 1,930 (30.8%) |
| Total | 2,269 (100.0%) | 6,274 (100.0%) |
Property Value to Household Income Ratio in Kennesaw
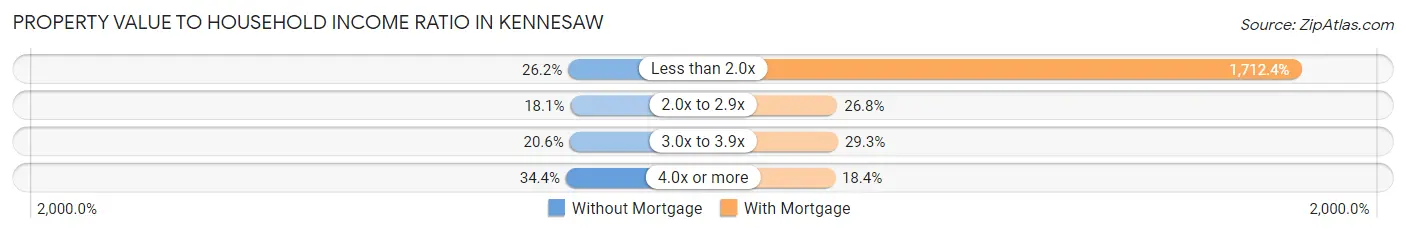
| Value-to-Income Ratio | Without Mortgage | With Mortgage |
| Less than 2.0x | 595 (26.2%) | 107,434 (1,712.4%) |
| 2.0x to 2.9x | 411 (18.1%) | 1,682 (26.8%) |
| 3.0x to 3.9x | 468 (20.6%) | 1,840 (29.3%) |
| 4.0x or more | 780 (34.4%) | 1,157 (18.4%) |
| Total | 2,269 (100.0%) | 6,274 (100.0%) |
Real Estate Taxes by Mortgage Status in Kennesaw
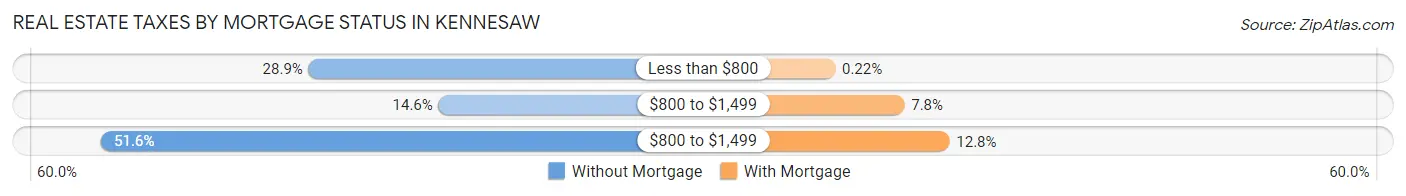
| Property Taxes | Without Mortgage | With Mortgage |
| Less than $800 | 655 (28.9%) | 14 (0.2%) |
| $800 to $1,499 | 332 (14.6%) | 490 (7.8%) |
| $800 to $1,499 | 1,171 (51.6%) | 800 (12.8%) |
| Total | 2,269 (100.0%) | 6,274 (100.0%) |
Health & Disability in Kennesaw
Health Insurance Coverage by Age in Kennesaw
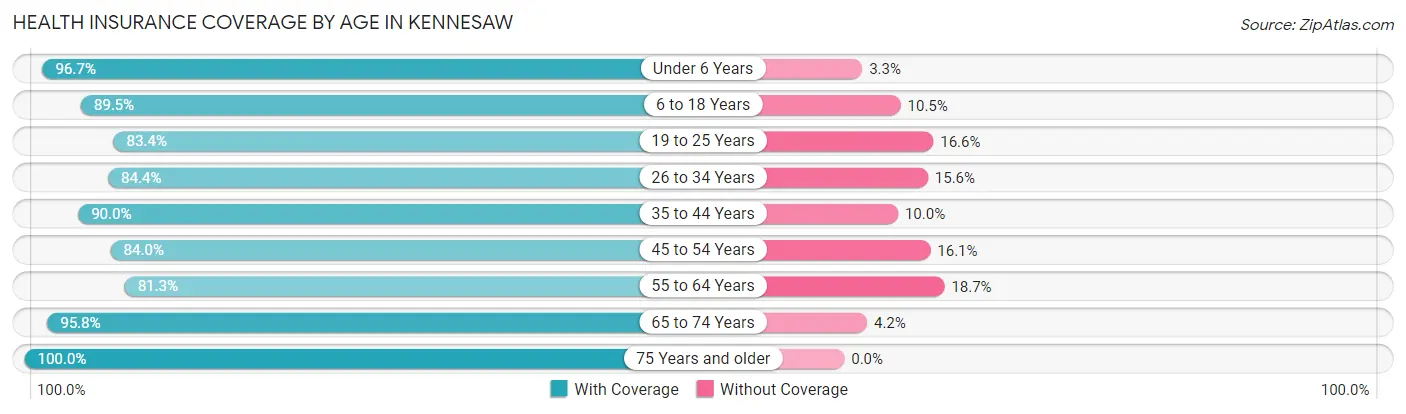
| Age Bracket | With Coverage | Without Coverage |
| Under 6 Years | 2,342 (96.7%) | 81 (3.3%) |
| 6 to 18 Years | 4,835 (89.5%) | 567 (10.5%) |
| 19 to 25 Years | 3,286 (83.4%) | 654 (16.6%) |
| 26 to 34 Years | 3,770 (84.4%) | 696 (15.6%) |
| 35 to 44 Years | 4,223 (90.0%) | 470 (10.0%) |
| 45 to 54 Years | 3,578 (84.0%) | 684 (16.1%) |
| 55 to 64 Years | 3,038 (81.3%) | 698 (18.7%) |
| 65 to 74 Years | 2,351 (95.8%) | 104 (4.2%) |
| 75 Years and older | 1,825 (100.0%) | 0 (0.0%) |
| Total | 29,248 (88.1%) | 3,954 (11.9%) |
Health Insurance Coverage by Citizenship Status in Kennesaw
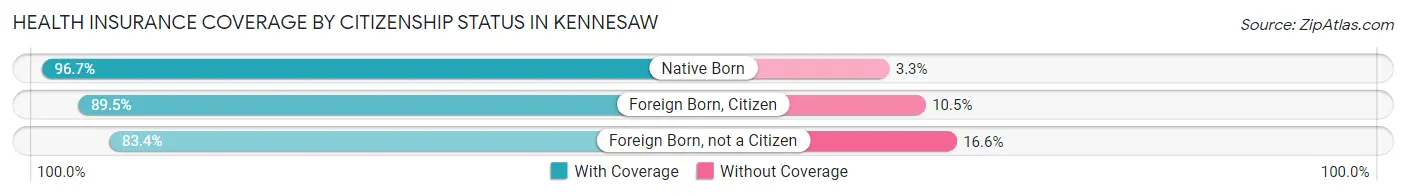
| Citizenship Status | With Coverage | Without Coverage |
| Native Born | 2,342 (96.7%) | 81 (3.3%) |
| Foreign Born, Citizen | 4,835 (89.5%) | 567 (10.5%) |
| Foreign Born, not a Citizen | 3,286 (83.4%) | 654 (16.6%) |
Health Insurance Coverage by Household Income in Kennesaw
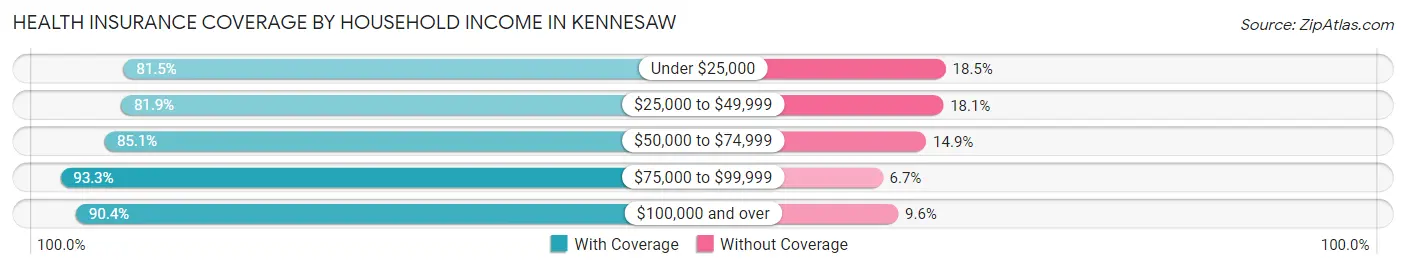
| Household Income | With Coverage | Without Coverage |
| Under $25,000 | 2,689 (81.5%) | 611 (18.5%) |
| $25,000 to $49,999 | 3,648 (81.9%) | 804 (18.1%) |
| $50,000 to $74,999 | 3,824 (85.1%) | 668 (14.9%) |
| $75,000 to $99,999 | 4,071 (93.3%) | 293 (6.7%) |
| $100,000 and over | 14,827 (90.4%) | 1,578 (9.6%) |
Public vs Private Health Insurance Coverage by Age in Kennesaw
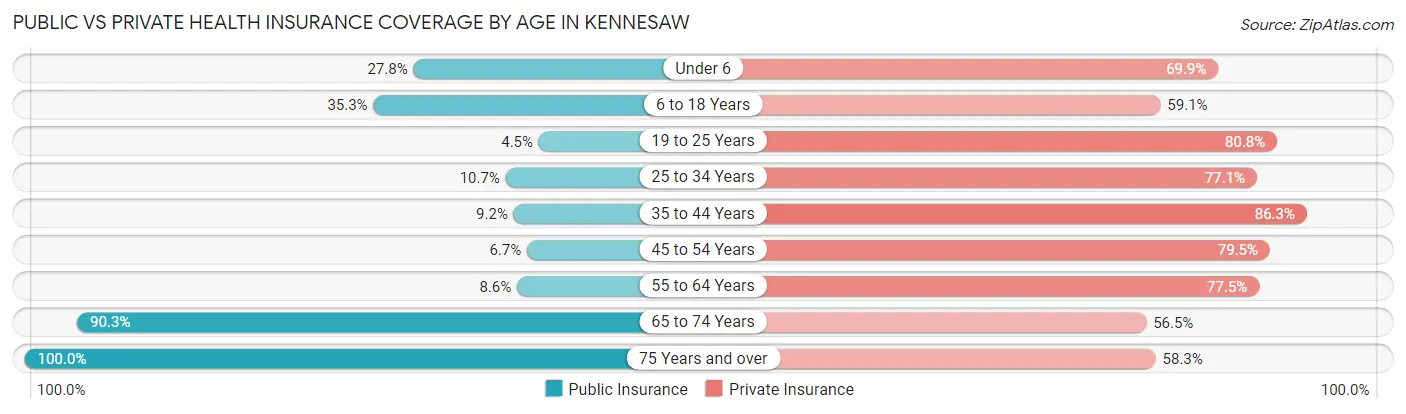
| Age Bracket | Public Insurance | Private Insurance |
| Under 6 | 674 (27.8%) | 1,693 (69.9%) |
| 6 to 18 Years | 1,904 (35.2%) | 3,195 (59.1%) |
| 19 to 25 Years | 179 (4.5%) | 3,183 (80.8%) |
| 25 to 34 Years | 478 (10.7%) | 3,441 (77.0%) |
| 35 to 44 Years | 432 (9.2%) | 4,050 (86.3%) |
| 45 to 54 Years | 287 (6.7%) | 3,386 (79.4%) |
| 55 to 64 Years | 321 (8.6%) | 2,894 (77.5%) |
| 65 to 74 Years | 2,216 (90.3%) | 1,387 (56.5%) |
| 75 Years and over | 1,825 (100.0%) | 1,063 (58.3%) |
| Total | 8,316 (25.1%) | 24,292 (73.2%) |
Disability Status by Sex by Age in Kennesaw
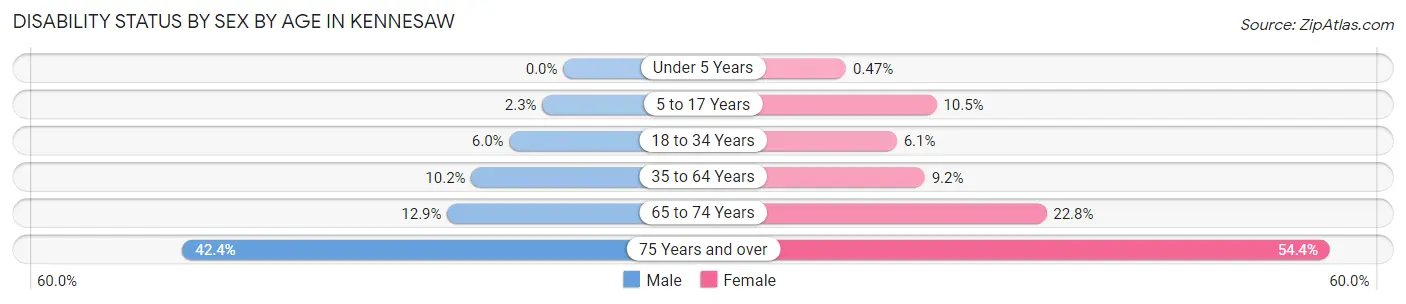
| Age Bracket | Male | Female |
| Under 5 Years | 0 (0.0%) | 6 (0.5%) |
| 5 to 17 Years | 77 (2.3%) | 204 (10.5%) |
| 18 to 34 Years | 237 (6.0%) | 302 (6.1%) |
| 35 to 64 Years | 629 (10.2%) | 605 (9.2%) |
| 65 to 74 Years | 126 (12.9%) | 337 (22.8%) |
| 75 Years and over | 291 (42.4%) | 619 (54.3%) |
Disability Class by Sex by Age in Kennesaw
Disability Class: Hearing Difficulty
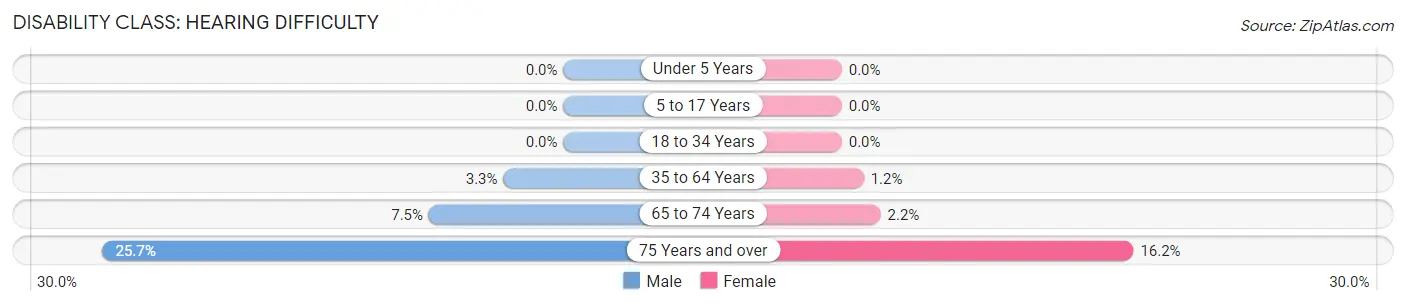
| Age Bracket | Male | Female |
| Under 5 Years | 0 (0.0%) | 0 (0.0%) |
| 5 to 17 Years | 0 (0.0%) | 0 (0.0%) |
| 18 to 34 Years | 0 (0.0%) | 0 (0.0%) |
| 35 to 64 Years | 205 (3.3%) | 80 (1.2%) |
| 65 to 74 Years | 73 (7.5%) | 32 (2.2%) |
| 75 Years and over | 176 (25.7%) | 185 (16.2%) |
Disability Class: Vision Difficulty
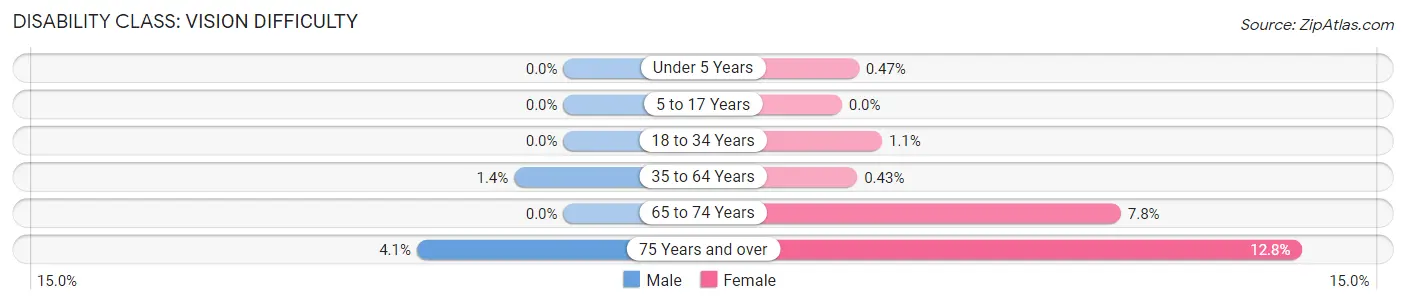
| Age Bracket | Male | Female |
| Under 5 Years | 0 (0.0%) | 6 (0.5%) |
| 5 to 17 Years | 0 (0.0%) | 0 (0.0%) |
| 18 to 34 Years | 0 (0.0%) | 55 (1.1%) |
| 35 to 64 Years | 84 (1.4%) | 28 (0.4%) |
| 65 to 74 Years | 0 (0.0%) | 115 (7.8%) |
| 75 Years and over | 28 (4.1%) | 146 (12.8%) |
Disability Class: Cognitive Difficulty
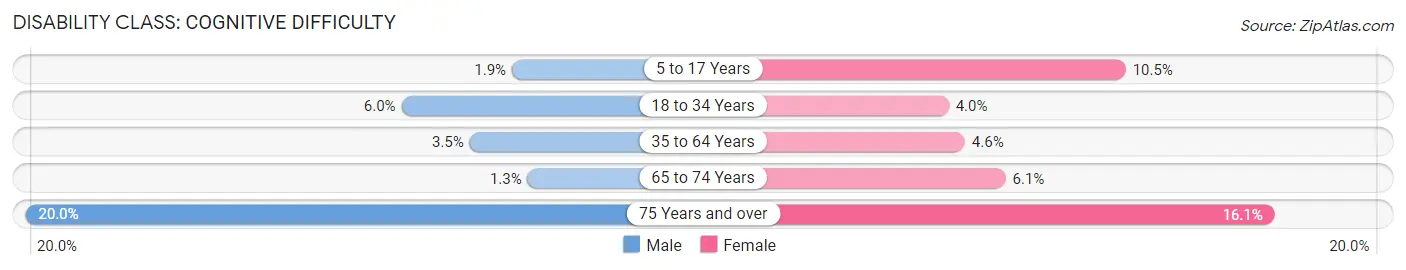
| Age Bracket | Male | Female |
| 5 to 17 Years | 63 (1.9%) | 204 (10.5%) |
| 18 to 34 Years | 237 (6.0%) | 196 (4.0%) |
| 35 to 64 Years | 214 (3.5%) | 299 (4.6%) |
| 65 to 74 Years | 13 (1.3%) | 90 (6.1%) |
| 75 Years and over | 137 (20.0%) | 183 (16.1%) |
Disability Class: Ambulatory Difficulty
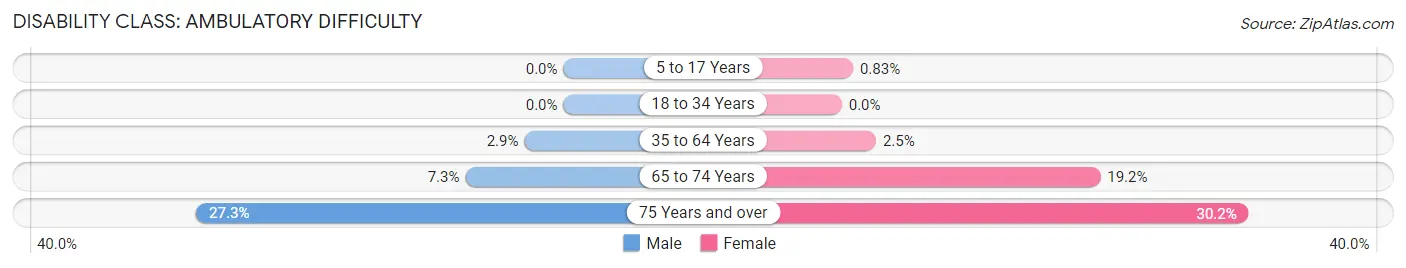
| Age Bracket | Male | Female |
| 5 to 17 Years | 0 (0.0%) | 16 (0.8%) |
| 18 to 34 Years | 0 (0.0%) | 0 (0.0%) |
| 35 to 64 Years | 178 (2.9%) | 166 (2.5%) |
| 65 to 74 Years | 71 (7.3%) | 284 (19.2%) |
| 75 Years and over | 187 (27.3%) | 344 (30.2%) |
Disability Class: Self-Care Difficulty
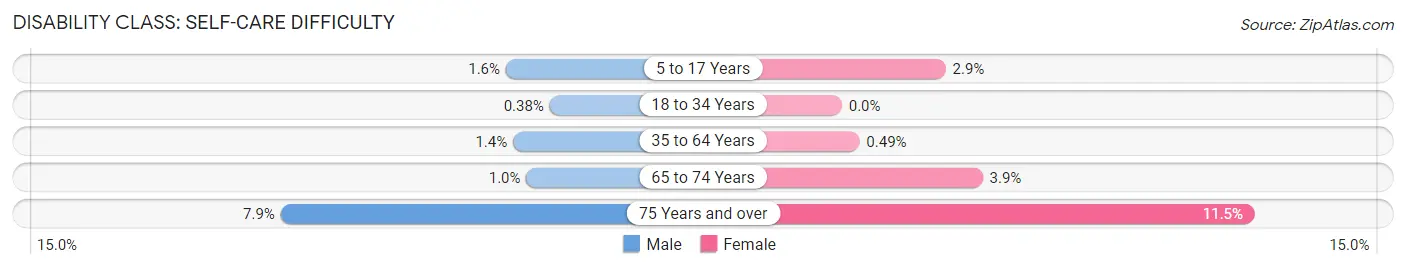
| Age Bracket | Male | Female |
| 5 to 17 Years | 53 (1.6%) | 56 (2.9%) |
| 18 to 34 Years | 15 (0.4%) | 0 (0.0%) |
| 35 to 64 Years | 86 (1.4%) | 32 (0.5%) |
| 65 to 74 Years | 10 (1.0%) | 58 (3.9%) |
| 75 Years and over | 54 (7.9%) | 131 (11.5%) |
Technology Access in Kennesaw
Computing Device Access in Kennesaw
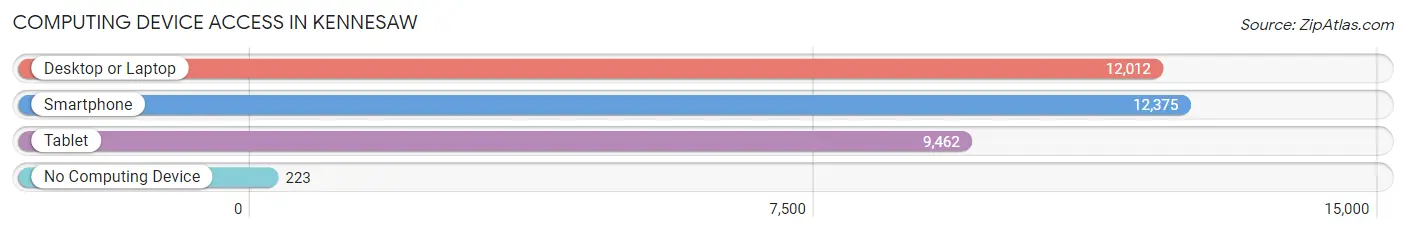
| Device Type | # Households | % Households |
| Desktop or Laptop | 12,012 | 92.1% |
| Smartphone | 12,375 | 94.9% |
| Tablet | 9,462 | 72.5% |
| No Computing Device | 223 | 1.7% |
| Total | 13,046 | 100.0% |
Internet Access in Kennesaw
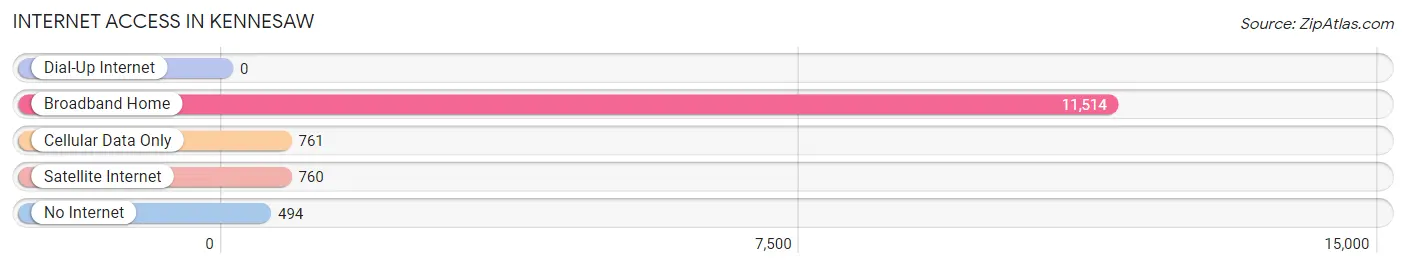
| Internet Type | # Households | % Households |
| Dial-Up Internet | 0 | 0.0% |
| Broadband Home | 11,514 | 88.3% |
| Cellular Data Only | 761 | 5.8% |
| Satellite Internet | 760 | 5.8% |
| No Internet | 494 | 3.8% |
| Total | 13,046 | 100.0% |
Kennesaw Summary
Kennesaw, Georgia is a city located in Cobb County, Georgia, United States. It is part of the Atlanta metropolitan area. As of the 2010 census, the city had a population of 29,783.
History
Kennesaw was founded in 1887 as Big Shanty, a stop on the Marietta and Northern Georgia Railroad. The city was renamed Kennesaw when it was incorporated in 1887. The name is derived from the Cherokee Indian word gah-nee-sah, which means cemetery or burial ground.
The city was the site of a major Civil War battle, the Battle of Kennesaw Mountain, which took place on June 27, 1864. The battle was a Confederate victory, but it was a costly one, with more than 3,000 casualties.
Geography
Kennesaw is located in northwestern Cobb County, about 25 miles northwest of downtown Atlanta. It is bordered to the north by the city of Acworth, to the east by Marietta, to the south by Smyrna, and to the west by Powder Springs.
The city has a total area of 14.4 square miles, of which 14.3 square miles is land and 0.1 square miles is water.
Economy
Kennesaw is home to several large employers, including Kennesaw State University, WellStar Kennestone Hospital, and the Cobb County School District. The city is also home to several corporate headquarters, including the headquarters of the Home Depot, the world's largest home improvement retailer.
The city's economy is also bolstered by its proximity to Atlanta, which is home to several major corporations, including Delta Air Lines, Coca-Cola, and UPS.
Demographics
As of the 2010 census, there were 29,783 people, 11,945 households, and 7,845 families residing in the city. The population density was 2,077.2 people per square mile. The racial makeup of the city was 68.2% White, 18.3% African American, 0.3% Native American, 5.3% Asian, 0.1% Pacific Islander, 4.2% from other races, and 3.6% from two or more races. Hispanic or Latino of any race were 9.7% of the population.
The median income for a household in the city was $54,902, and the median income for a family was $63,837. The per capita income for the city was $25,845. About 8.2% of families and 11.2% of the population were below the poverty line, including 15.2% of those under age 18 and 8.2% of those age 65 or over.
Common Questions
What is Per Capita Income in Kennesaw?
Per Capita income in Kennesaw is $40,381.
What is the Median Family Income in Kennesaw?
Median Family Income in Kennesaw is $99,947.
What is the Median Household income in Kennesaw?
Median Household Income in Kennesaw is $81,467.
What is Income or Wage Gap in Kennesaw?
Income or Wage Gap in Kennesaw is 20.8%.
Women in Kennesaw earn 79.2 cents for every dollar earned by a man.
What is Inequality or Gini Index in Kennesaw?
Inequality or Gini Index in Kennesaw is 0.43.
What is the Total Population of Kennesaw?
Total Population of Kennesaw is 33,360.
What is the Total Male Population of Kennesaw?
Total Male Population of Kennesaw is 15,959.
What is the Total Female Population of Kennesaw?
Total Female Population of Kennesaw is 17,401.
What is the Ratio of Males per 100 Females in Kennesaw?
There are 91.71 Males per 100 Females in Kennesaw.
What is the Ratio of Females per 100 Males in Kennesaw?
There are 109.04 Females per 100 Males in Kennesaw.
What is the Median Population Age in Kennesaw?
Median Population Age in Kennesaw is 35.6 Years.
What is the Average Family Size in Kennesaw
Average Family Size in Kennesaw is 3.0 People.
What is the Average Household Size in Kennesaw
Average Household Size in Kennesaw is 2.5 People.
How Large is the Labor Force in Kennesaw?
There are 19,031 People in the Labor Forcein in Kennesaw.
What is the Percentage of People in the Labor Force in Kennesaw?
70.5% of People are in the Labor Force in Kennesaw.
What is the Unemployment Rate in Kennesaw?
Unemployment Rate in Kennesaw is 5.4%.