Blackshear, GA Map & Demographics
Blackshear Map
Blackshear Overview
$27,714
PER CAPITA INCOME
$58,163
AVG FAMILY INCOME
$34,963
AVG HOUSEHOLD INCOME
3.2%
WAGE / INCOME GAP [ % ]
96.8¢/ $1
WAGE / INCOME GAP [ $ ]
0.42
INEQUALITY / GINI INDEX
3,521
TOTAL POPULATION
1,613
MALE POPULATION
1,908
FEMALE POPULATION
84.54
MALES / 100 FEMALES
118.29
FEMALES / 100 MALES
47.5
MEDIAN AGE
2.6
AVG FAMILY SIZE
2.1
AVG HOUSEHOLD SIZE
1,521
LABOR FORCE [ PEOPLE ]
50.3%
PERCENT IN LABOR FORCE
3.4%
UNEMPLOYMENT RATE
Blackshear Zip Codes
Blackshear Area Codes
Income in Blackshear
Income Overview in Blackshear
Per Capita Income in Blackshear is $27,714, while median incomes of families and households are $58,163 and $34,963 respectively.
| Characteristic | Number | Measure |
| Per Capita Income | 3,521 | $27,714 |
| Median Family Income | 862 | $58,163 |
| Mean Family Income | 862 | $70,250 |
| Median Household Income | 1,622 | $34,963 |
| Mean Household Income | 1,622 | $58,390 |
| Income Deficit | 862 | $0 |
| Wage / Income Gap (%) | 3,521 | 3.22% |
| Wage / Income Gap ($) | 3,521 | 96.78¢ per $1 |
| Gini / Inequality Index | 3,521 | 0.42 |
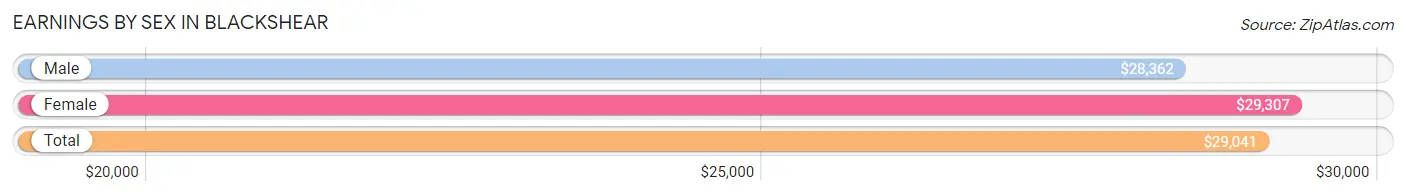
Earnings by Sex in Blackshear
Average Earnings in Blackshear are $29,041, $28,362 for men and $29,307 for women, a difference of 3.2%.
| Sex | Number | Average Earnings |
| Male | 684 (43.7%) | $28,362 |
| Female | 881 (56.3%) | $29,307 |
| Total | 1,565 (100.0%) | $29,041 |
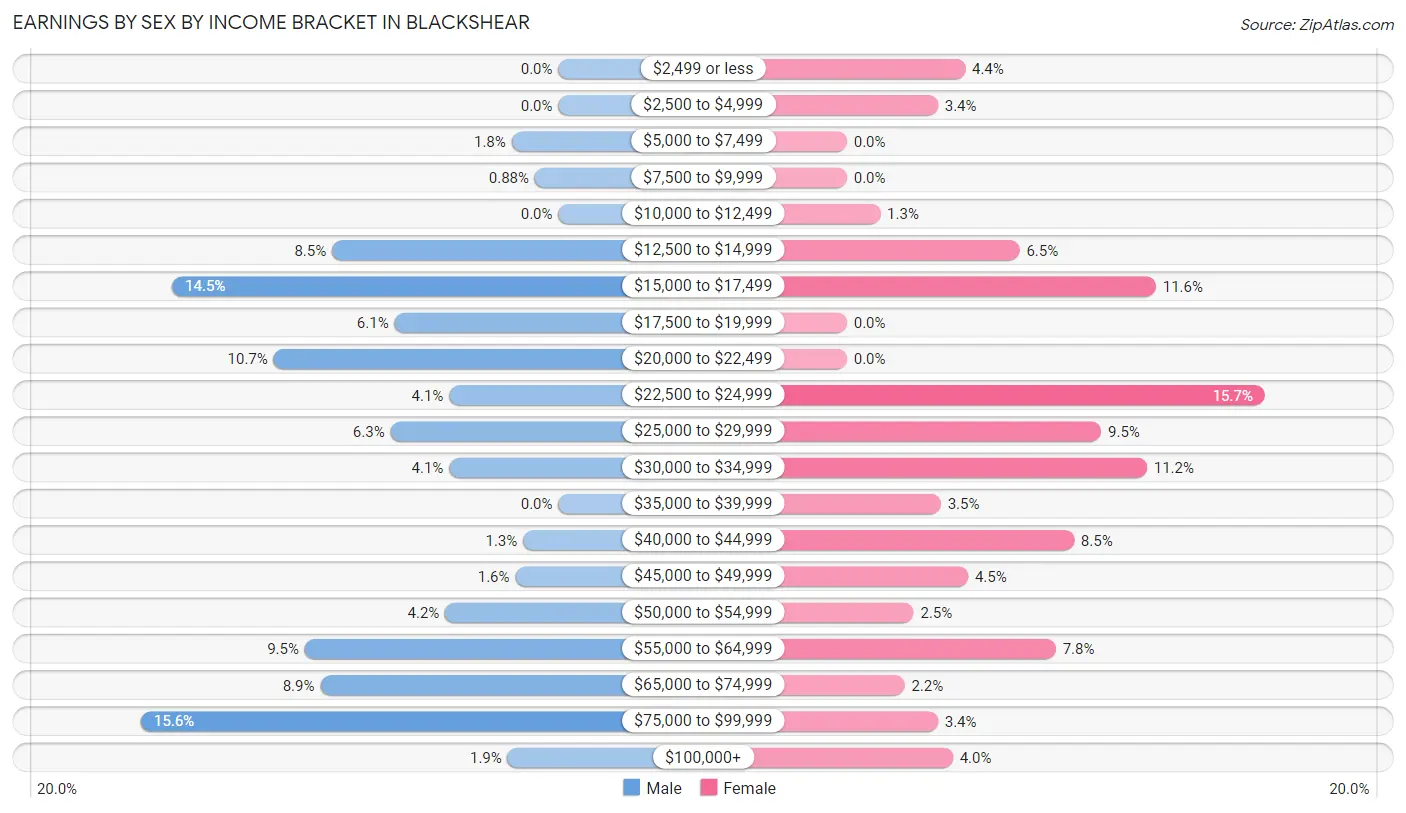
Earnings by Sex by Income Bracket in Blackshear
The most common earnings brackets in Blackshear are $75,000 to $99,999 for men (107 | 15.6%) and $22,500 to $24,999 for women (138 | 15.7%).
| Income | Male | Female |
| $2,499 or less | 0 (0.0%) | 39 (4.4%) |
| $2,500 to $4,999 | 0 (0.0%) | 30 (3.4%) |
| $5,000 to $7,499 | 12 (1.8%) | 0 (0.0%) |
| $7,500 to $9,999 | 6 (0.9%) | 0 (0.0%) |
| $10,000 to $12,499 | 0 (0.0%) | 11 (1.3%) |
| $12,500 to $14,999 | 58 (8.5%) | 57 (6.5%) |
| $15,000 to $17,499 | 99 (14.5%) | 102 (11.6%) |
| $17,500 to $19,999 | 42 (6.1%) | 0 (0.0%) |
| $20,000 to $22,499 | 73 (10.7%) | 0 (0.0%) |
| $22,500 to $24,999 | 28 (4.1%) | 138 (15.7%) |
| $25,000 to $29,999 | 43 (6.3%) | 84 (9.5%) |
| $30,000 to $34,999 | 28 (4.1%) | 99 (11.2%) |
| $35,000 to $39,999 | 0 (0.0%) | 31 (3.5%) |
| $40,000 to $44,999 | 9 (1.3%) | 75 (8.5%) |
| $45,000 to $49,999 | 11 (1.6%) | 40 (4.5%) |
| $50,000 to $54,999 | 29 (4.2%) | 22 (2.5%) |
| $55,000 to $64,999 | 65 (9.5%) | 69 (7.8%) |
| $65,000 to $74,999 | 61 (8.9%) | 19 (2.2%) |
| $75,000 to $99,999 | 107 (15.6%) | 30 (3.4%) |
| $100,000+ | 13 (1.9%) | 35 (4.0%) |
| Total | 684 (100.0%) | 881 (100.0%) |
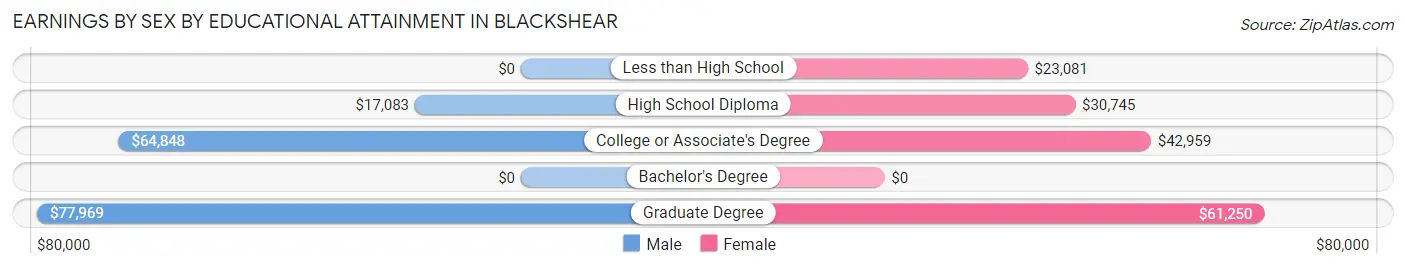
Earnings by Sex by Educational Attainment in Blackshear
Average earnings in Blackshear are $45,114 for men and $29,882 for women, a difference of 33.8%. Men with an educational attainment of graduate degree enjoy the highest average annual earnings of $77,969, while those with high school diploma education earn the least with $17,083. Women with an educational attainment of graduate degree earn the most with the average annual earnings of $61,250, while those with less than high school education have the smallest earnings of $23,081.
| Educational Attainment | Male Income | Female Income |
| Less than High School | - | - |
| High School Diploma | $17,083 | $30,745 |
| College or Associate's Degree | $64,848 | $42,959 |
| Bachelor's Degree | - | - |
| Graduate Degree | $77,969 | $61,250 |
| Total | $45,114 | $29,882 |
Family Income in Blackshear
Family Income Brackets in Blackshear
According to the Blackshear family income data, there are 252 families falling into the $25,000 to $34,999 income range, which is the most common income bracket and makes up 29.2% of all families.
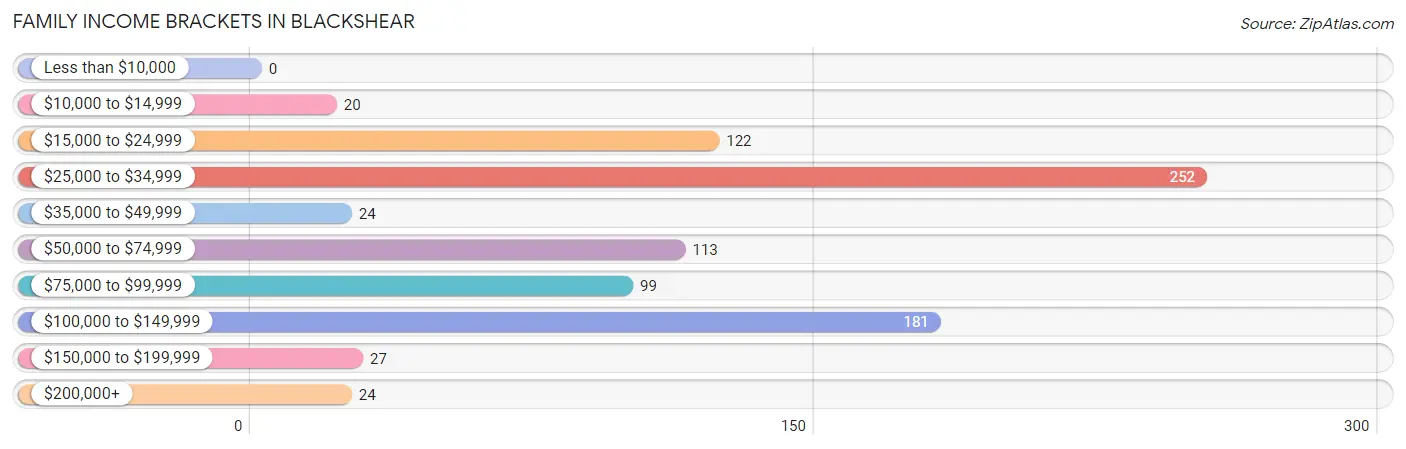
| Income Bracket | # Families | % Families |
| Less than $10,000 | 0 | 0.0% |
| $10,000 to $14,999 | 20 | 2.3% |
| $15,000 to $24,999 | 122 | 14.2% |
| $25,000 to $34,999 | 252 | 29.2% |
| $35,000 to $49,999 | 24 | 2.8% |
| $50,000 to $74,999 | 113 | 13.1% |
| $75,000 to $99,999 | 99 | 11.5% |
| $100,000 to $149,999 | 181 | 21.0% |
| $150,000 to $199,999 | 27 | 3.1% |
| $200,000+ | 24 | 2.8% |
Family Income by Famaliy Size in Blackshear
4-person families (121 | 14.0%) account for the highest median family income in Blackshear with $135,625 per family, while 4-person families (121 | 14.0%) have the highest median income of $33,906 per family member.
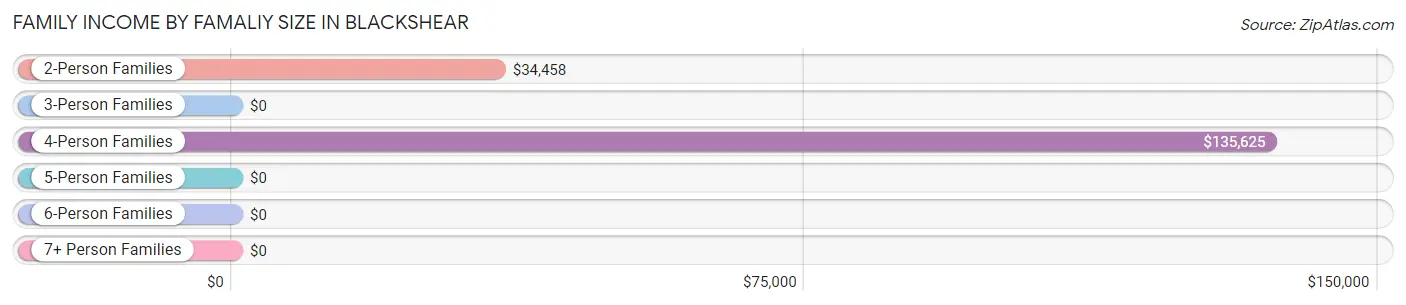
| Income Bracket | # Families | Median Income |
| 2-Person Families | 584 (67.7%) | $34,458 |
| 3-Person Families | 133 (15.4%) | $0 |
| 4-Person Families | 121 (14.0%) | $135,625 |
| 5-Person Families | 15 (1.7%) | $0 |
| 6-Person Families | 9 (1.0%) | $0 |
| 7+ Person Families | 0 (0.0%) | $0 |
| Total | 862 (100.0%) | $58,163 |
Family Income by Number of Earners in Blackshear
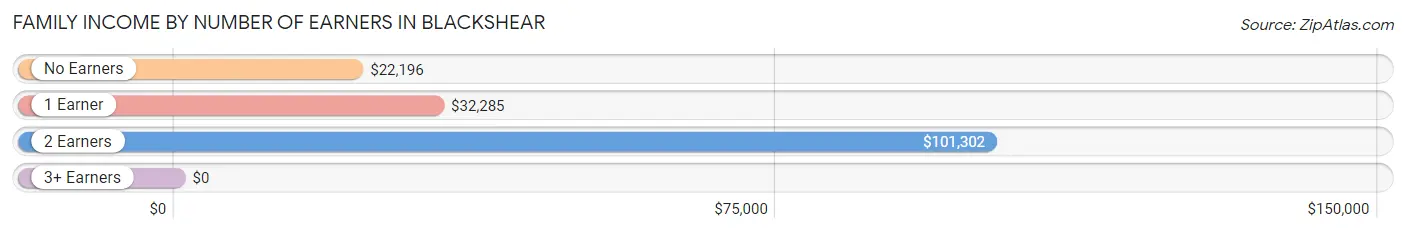
| Number of Earners | # Families | Median Income |
| No Earners | 245 (28.4%) | $22,196 |
| 1 Earner | 251 (29.1%) | $32,285 |
| 2 Earners | 325 (37.7%) | $101,302 |
| 3+ Earners | 41 (4.8%) | $0 |
| Total | 862 (100.0%) | $58,163 |
Household Income in Blackshear
Household Income Brackets in Blackshear
With 375 households falling in the category, the $25,000 to $34,999 income range is the most frequent in Blackshear, accounting for 23.1% of all households. In contrast, only 23 households (1.4%) fall into the less than $10,000 income bracket, making it the least populous group.
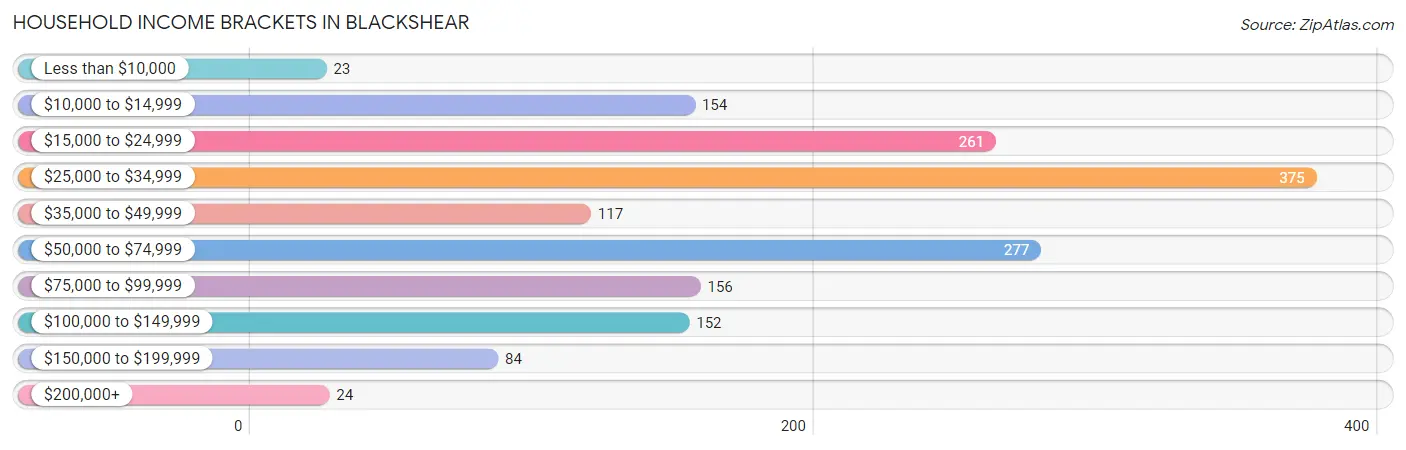
| Income Bracket | # Households | % Households |
| Less than $10,000 | 23 | 1.4% |
| $10,000 to $14,999 | 154 | 9.5% |
| $15,000 to $24,999 | 261 | 16.1% |
| $25,000 to $34,999 | 375 | 23.1% |
| $35,000 to $49,999 | 117 | 7.2% |
| $50,000 to $74,999 | 277 | 17.1% |
| $75,000 to $99,999 | 156 | 9.6% |
| $100,000 to $149,999 | 152 | 9.4% |
| $150,000 to $199,999 | 84 | 5.2% |
| $200,000+ | 24 | 1.5% |
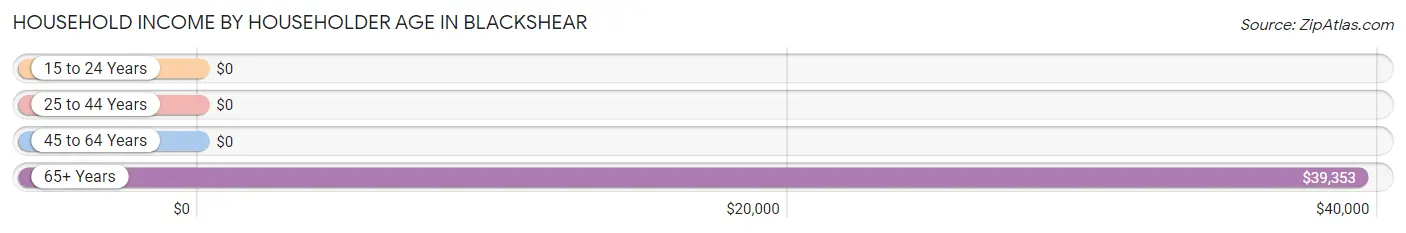
Household Income by Householder Age in Blackshear
The median household income in Blackshear is $34,963, with the highest median household income of $39,353 found in the 65+ years age bracket for the primary householder. A total of 582 households (35.9%) fall into this category. Meanwhile, the 15 to 24 years age bracket for the primary householder has the lowest median household income of $0, with 11 households (0.7%) in this group.
| Income Bracket | # Households | Median Income |
| 15 to 24 Years | 11 (0.7%) | $0 |
| 25 to 44 Years | 419 (25.8%) | $0 |
| 45 to 64 Years | 610 (37.6%) | $0 |
| 65+ Years | 582 (35.9%) | $39,353 |
| Total | 1,622 (100.0%) | $34,963 |
Poverty in Blackshear
Income Below Poverty by Sex and Age in Blackshear
With 14.6% poverty level for males and 19.7% for females among the residents of Blackshear, 16 and 17 year old males and 12 to 14 year old females are the most vulnerable to poverty, with 21 males (52.5%) and 59 females (100.0%) in their respective age groups living below the poverty level.
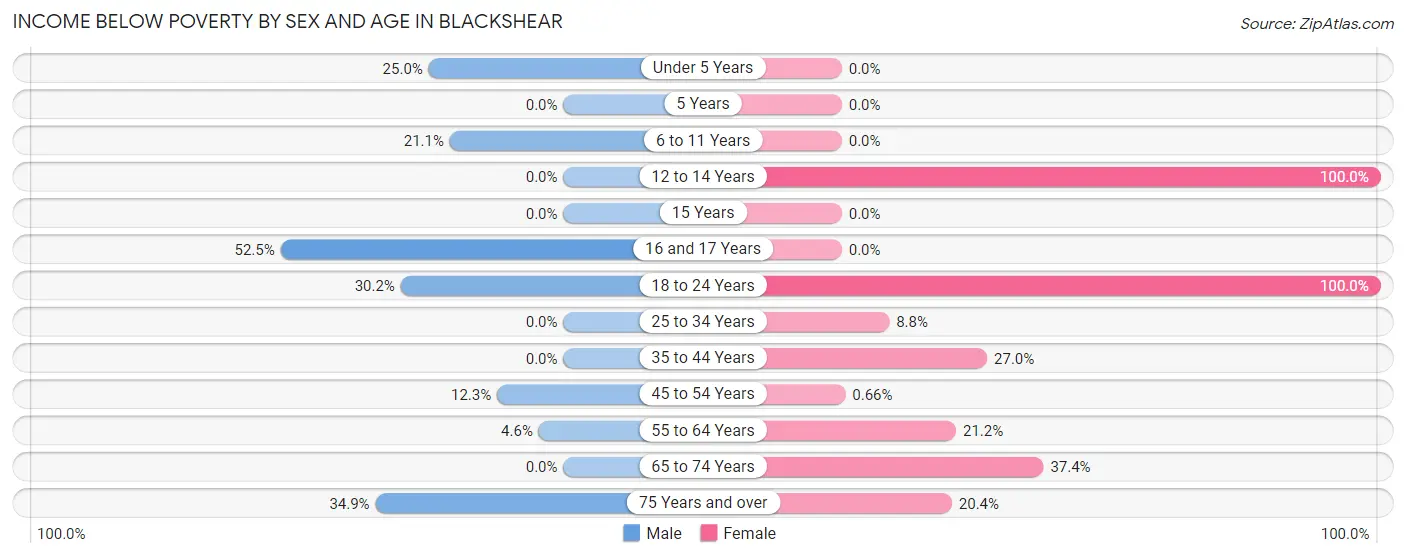
| Age Bracket | Male | Female |
| Under 5 Years | 23 (25.0%) | 0 (0.0%) |
| 5 Years | 0 (0.0%) | 0 (0.0%) |
| 6 to 11 Years | 35 (21.1%) | 0 (0.0%) |
| 12 to 14 Years | 0 (0.0%) | 59 (100.0%) |
| 15 Years | 0 (0.0%) | 0 (0.0%) |
| 16 and 17 Years | 21 (52.5%) | 0 (0.0%) |
| 18 to 24 Years | 48 (30.2%) | 23 (100.0%) |
| 25 to 34 Years | 0 (0.0%) | 25 (8.8%) |
| 35 to 44 Years | 0 (0.0%) | 41 (27.0%) |
| 45 to 54 Years | 40 (12.3%) | 2 (0.7%) |
| 55 to 64 Years | 9 (4.6%) | 77 (21.2%) |
| 65 to 74 Years | 0 (0.0%) | 70 (37.4%) |
| 75 Years and over | 45 (34.9%) | 67 (20.4%) |
| Total | 221 (14.6%) | 364 (19.7%) |
Income Above Poverty by Sex and Age in Blackshear
According to the poverty statistics in Blackshear, males aged 12 to 14 years and females aged under 5 years are the age groups that are most secure financially, with 100.0% of males and 100.0% of females in these age groups living above the poverty line.
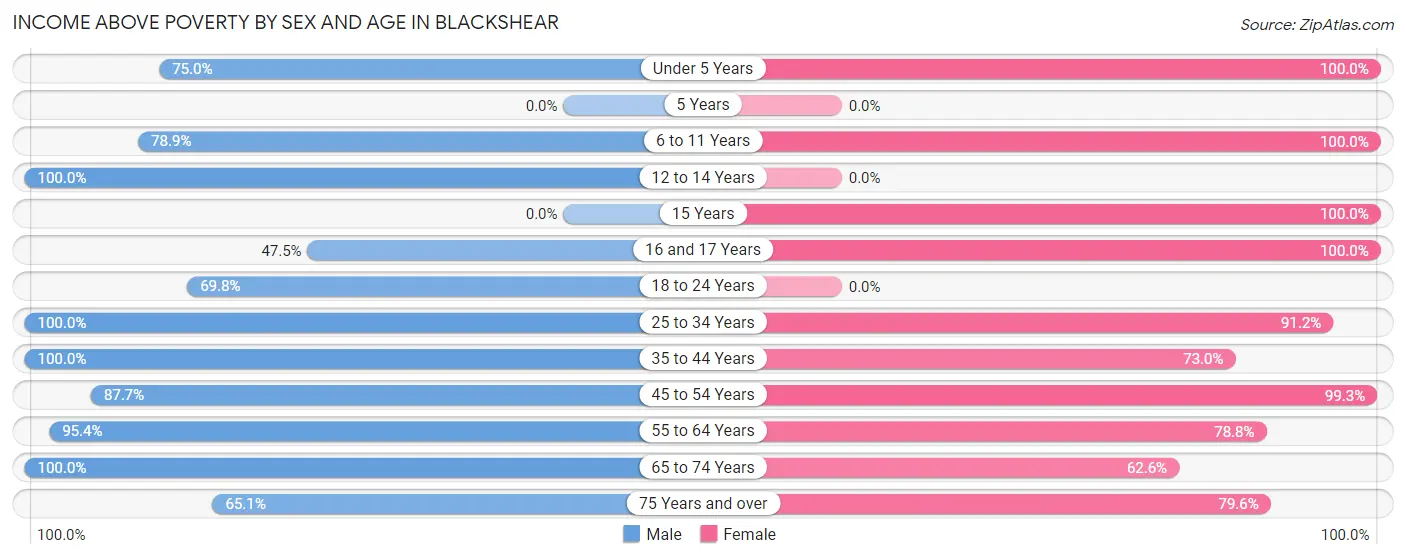
| Age Bracket | Male | Female |
| Under 5 Years | 69 (75.0%) | 83 (100.0%) |
| 5 Years | 0 (0.0%) | 0 (0.0%) |
| 6 to 11 Years | 131 (78.9%) | 28 (100.0%) |
| 12 to 14 Years | 46 (100.0%) | 0 (0.0%) |
| 15 Years | 0 (0.0%) | 8 (100.0%) |
| 16 and 17 Years | 19 (47.5%) | 26 (100.0%) |
| 18 to 24 Years | 111 (69.8%) | 0 (0.0%) |
| 25 to 34 Years | 83 (100.0%) | 259 (91.2%) |
| 35 to 44 Years | 170 (100.0%) | 111 (73.0%) |
| 45 to 54 Years | 285 (87.7%) | 301 (99.3%) |
| 55 to 64 Years | 188 (95.4%) | 286 (78.8%) |
| 65 to 74 Years | 104 (100.0%) | 117 (62.6%) |
| 75 Years and over | 84 (65.1%) | 261 (79.6%) |
| Total | 1,290 (85.4%) | 1,480 (80.3%) |
Income Below Poverty Among Married-Couple Families in Blackshear
The poverty statistics for married-couple families in Blackshear show that 3.3% or 20 of the total 603 families live below the poverty line. Families with 1 or 2 children have the highest poverty rate of 7.6%, comprising of 11 families. On the other hand, families with 3 or 4 children have the lowest poverty rate of 0.0%, which includes 0 families.
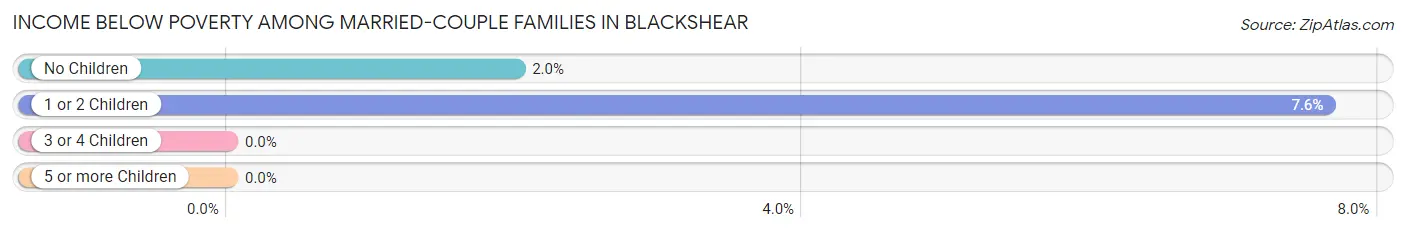
| Children | Above Poverty | Below Poverty |
| No Children | 441 (98.0%) | 9 (2.0%) |
| 1 or 2 Children | 133 (92.4%) | 11 (7.6%) |
| 3 or 4 Children | 9 (100.0%) | 0 (0.0%) |
| 5 or more Children | 0 (0.0%) | 0 (0.0%) |
| Total | 583 (96.7%) | 20 (3.3%) |
Income Below Poverty Among Single-Parent Households in Blackshear
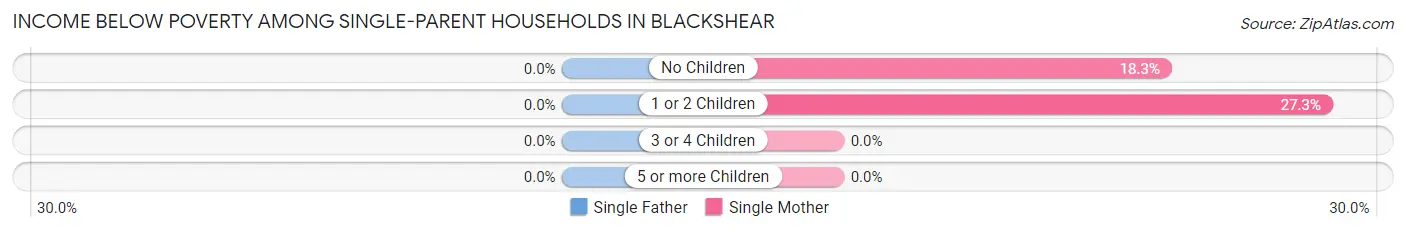
| Children | Single Father | Single Mother |
| No Children | 0 (0.0%) | 11 (18.3%) |
| 1 or 2 Children | 0 (0.0%) | 41 (27.3%) |
| 3 or 4 Children | 0 (0.0%) | 0 (0.0%) |
| 5 or more Children | 0 (0.0%) | 0 (0.0%) |
| Total | 0 (0.0%) | 52 (24.8%) |
Income Below Poverty Among Married-Couple vs Single-Parent Households in Blackshear
The poverty data for Blackshear shows that 20 of the married-couple family households (3.3%) and 52 of the single-parent households (20.1%) are living below the poverty level. Within the married-couple family households, those with 1 or 2 children have the highest poverty rate, with 11 households (7.6%) falling below the poverty line. Among the single-parent households, those with 1 or 2 children have the highest poverty rate, with 41 household (27.3%) living below poverty.
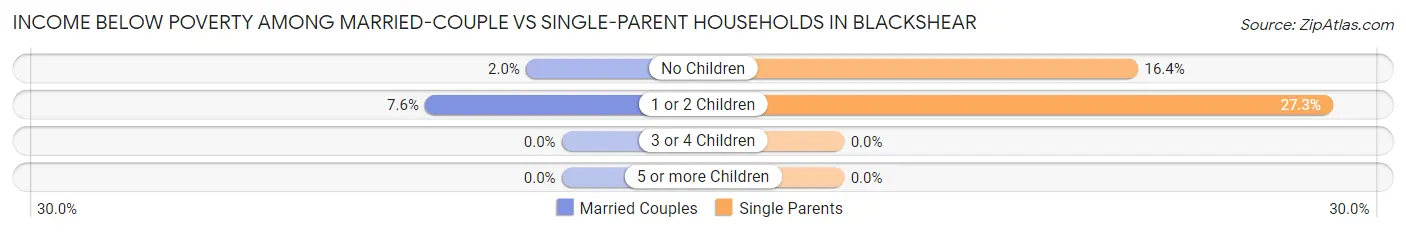
| Children | Married-Couple Families | Single-Parent Households |
| No Children | 9 (2.0%) | 11 (16.4%) |
| 1 or 2 Children | 11 (7.6%) | 41 (27.3%) |
| 3 or 4 Children | 0 (0.0%) | 0 (0.0%) |
| 5 or more Children | 0 (0.0%) | 0 (0.0%) |
| Total | 20 (3.3%) | 52 (20.1%) |
Race in Blackshear
The most populous races in Blackshear are White / Caucasian (2,722 | 77.3%), Black / African American (694 | 19.7%), and Two or more Races (94 | 2.7%).
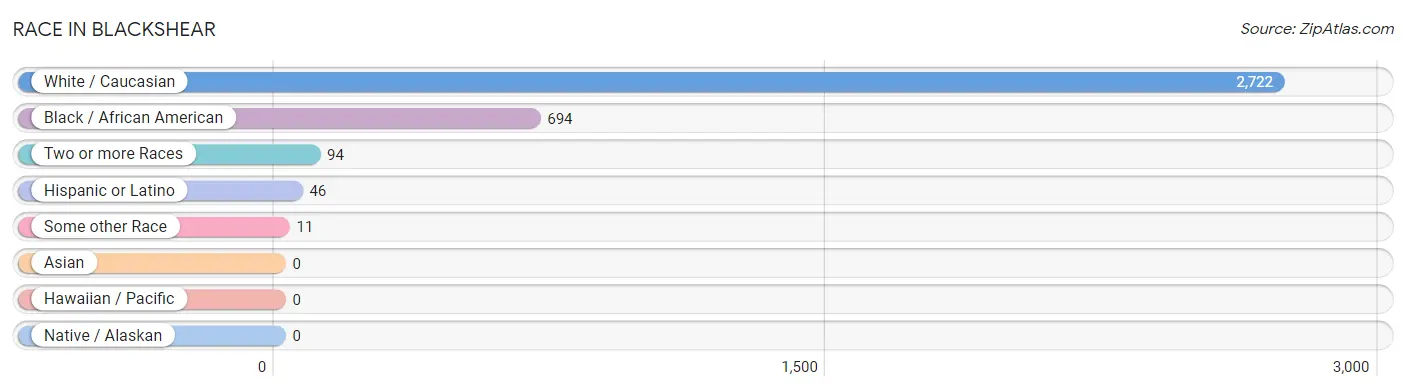
| Race | # Population | % Population |
| Asian | 0 | 0.0% |
| Black / African American | 694 | 19.7% |
| Hawaiian / Pacific | 0 | 0.0% |
| Hispanic or Latino | 46 | 1.3% |
| Native / Alaskan | 0 | 0.0% |
| White / Caucasian | 2,722 | 77.3% |
| Two or more Races | 94 | 2.7% |
| Some other Race | 11 | 0.3% |
| Total | 3,521 | 100.0% |
Ancestry in Blackshear
The most populous ancestries reported in Blackshear are English (333 | 9.5%), American (205 | 5.8%), Irish (145 | 4.1%), German (91 | 2.6%), and Scottish (68 | 1.9%), together accounting for 23.9% of all Blackshear residents.
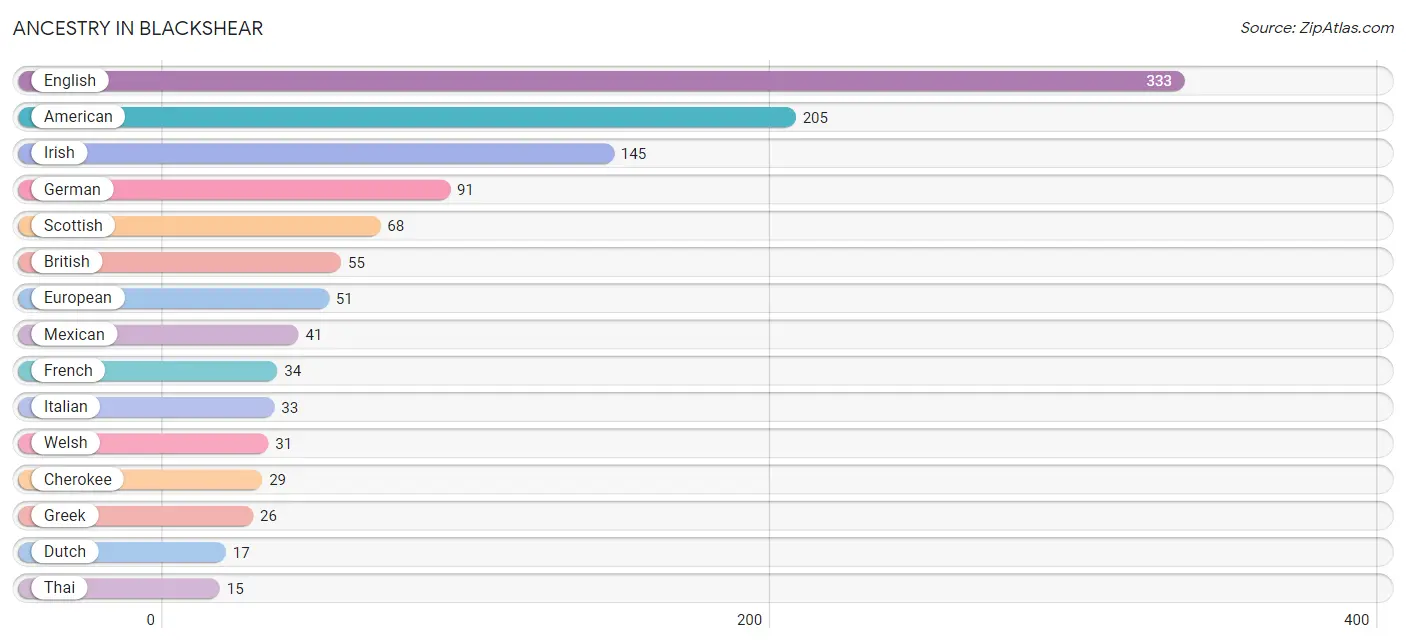
| Ancestry | # Population | % Population |
| African | 5 | 0.1% |
| American | 205 | 5.8% |
| British | 55 | 1.6% |
| Cherokee | 29 | 0.8% |
| Dutch | 17 | 0.5% |
| English | 333 | 9.5% |
| European | 51 | 1.5% |
| French | 34 | 1.0% |
| German | 91 | 2.6% |
| Greek | 26 | 0.7% |
| Irish | 145 | 4.1% |
| Italian | 33 | 0.9% |
| Mexican | 41 | 1.2% |
| Polish | 14 | 0.4% |
| Puerto Rican | 5 | 0.1% |
| Romanian | 6 | 0.2% |
| Scotch-Irish | 5 | 0.1% |
| Scottish | 68 | 1.9% |
| Slovak | 7 | 0.2% |
| Subsaharan African | 5 | 0.1% |
| Thai | 15 | 0.4% |
| Welsh | 31 | 0.9% | View All 22 Rows |
Immigrants in Blackshear
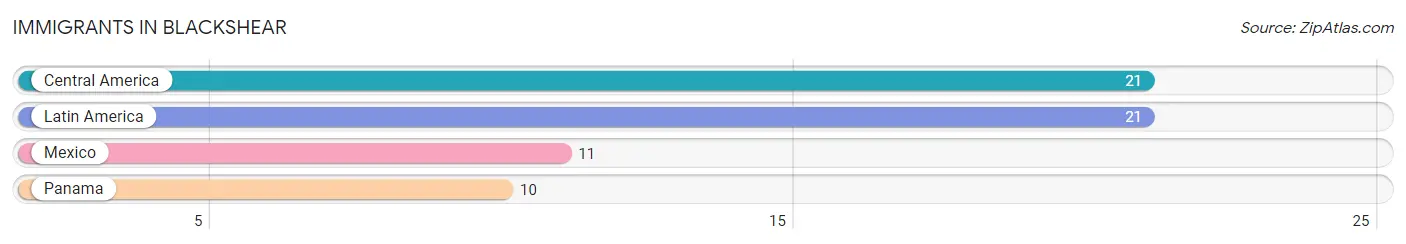
The most numerous immigrant groups reported in Blackshear came from Central America (21 | 0.6%), Latin America (21 | 0.6%), Mexico (11 | 0.3%), and Panama (10 | 0.3%), together accounting for 1.8% of all Blackshear residents.
| Immigration Origin | # Population | % Population |
| Central America | 21 | 0.6% |
| Latin America | 21 | 0.6% |
| Mexico | 11 | 0.3% |
| Panama | 10 | 0.3% | View All 4 Rows |
Sex and Age in Blackshear
Sex and Age in Blackshear
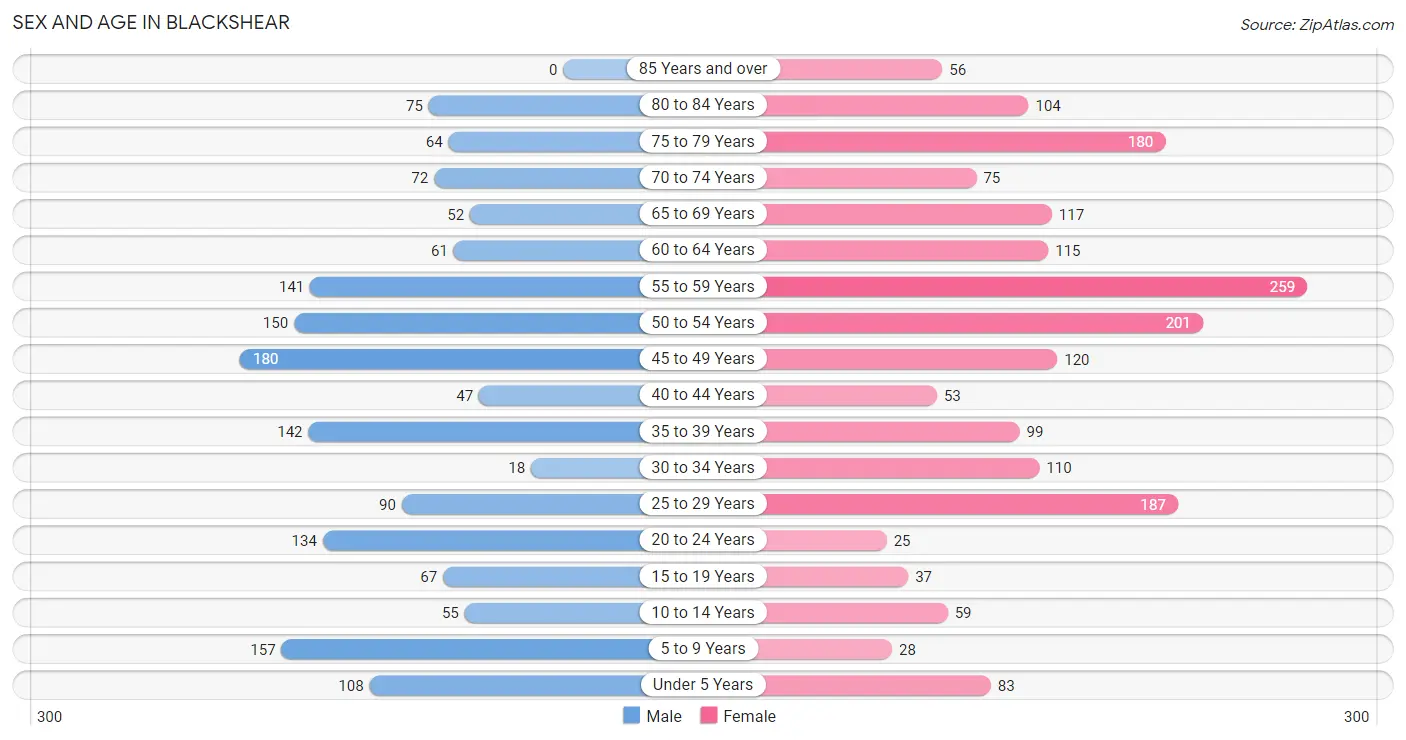
The most populous age groups in Blackshear are 45 to 49 Years (180 | 11.2%) for men and 55 to 59 Years (259 | 13.6%) for women.
| Age Bracket | Male | Female |
| Under 5 Years | 108 (6.7%) | 83 (4.3%) |
| 5 to 9 Years | 157 (9.7%) | 28 (1.5%) |
| 10 to 14 Years | 55 (3.4%) | 59 (3.1%) |
| 15 to 19 Years | 67 (4.2%) | 37 (1.9%) |
| 20 to 24 Years | 134 (8.3%) | 25 (1.3%) |
| 25 to 29 Years | 90 (5.6%) | 187 (9.8%) |
| 30 to 34 Years | 18 (1.1%) | 110 (5.8%) |
| 35 to 39 Years | 142 (8.8%) | 99 (5.2%) |
| 40 to 44 Years | 47 (2.9%) | 53 (2.8%) |
| 45 to 49 Years | 180 (11.2%) | 120 (6.3%) |
| 50 to 54 Years | 150 (9.3%) | 201 (10.5%) |
| 55 to 59 Years | 141 (8.7%) | 259 (13.6%) |
| 60 to 64 Years | 61 (3.8%) | 115 (6.0%) |
| 65 to 69 Years | 52 (3.2%) | 117 (6.1%) |
| 70 to 74 Years | 72 (4.5%) | 75 (3.9%) |
| 75 to 79 Years | 64 (4.0%) | 180 (9.4%) |
| 80 to 84 Years | 75 (4.6%) | 104 (5.4%) |
| 85 Years and over | 0 (0.0%) | 56 (2.9%) |
| Total | 1,613 (100.0%) | 1,908 (100.0%) |
Families and Households in Blackshear
Median Family Size in Blackshear
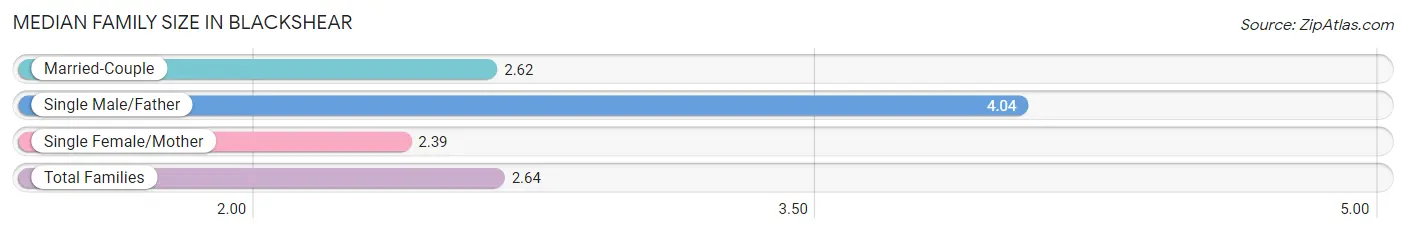
The median family size in Blackshear is 2.64 persons per family, with single male/father families (49 | 5.7%) accounting for the largest median family size of 4.04 persons per family. On the other hand, single female/mother families (210 | 24.4%) represent the smallest median family size with 2.39 persons per family.
| Family Type | # Families | Family Size |
| Married-Couple | 603 (70.0%) | 2.62 |
| Single Male/Father | 49 (5.7%) | 4.04 |
| Single Female/Mother | 210 (24.4%) | 2.39 |
| Total Families | 862 (100.0%) | 2.64 |
Median Household Size in Blackshear
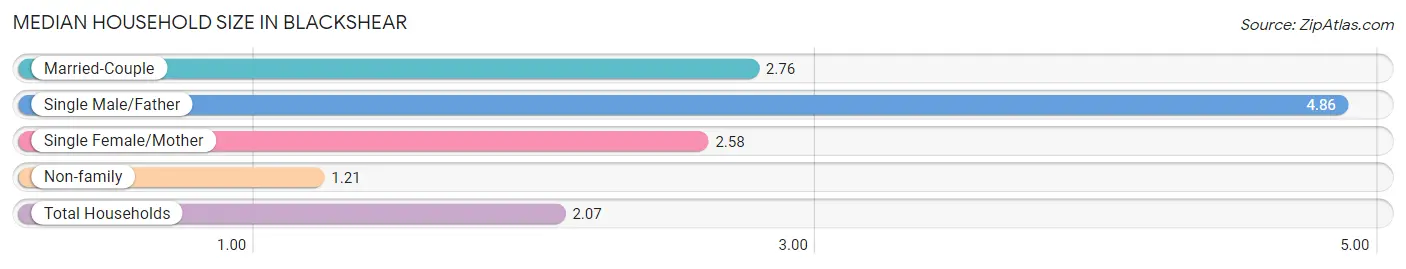
The median household size in Blackshear is 2.07 persons per household, with single male/father households (49 | 3.0%) accounting for the largest median household size of 4.86 persons per household. non-family households (760 | 46.9%) represent the smallest median household size with 1.21 persons per household.
| Household Type | # Households | Household Size |
| Married-Couple | 603 (37.2%) | 2.76 |
| Single Male/Father | 49 (3.0%) | 4.86 |
| Single Female/Mother | 210 (13.0%) | 2.58 |
| Non-family | 760 (46.9%) | 1.21 |
| Total Households | 1,622 (100.0%) | 2.07 |
Household Size by Marriage Status in Blackshear
Out of a total of 1,622 households in Blackshear, 862 (53.1%) are family households, while 760 (46.9%) are nonfamily households. The most numerous type of family households are 2-person households, comprising 584, and the most common type of nonfamily households are 1-person households, comprising 639.
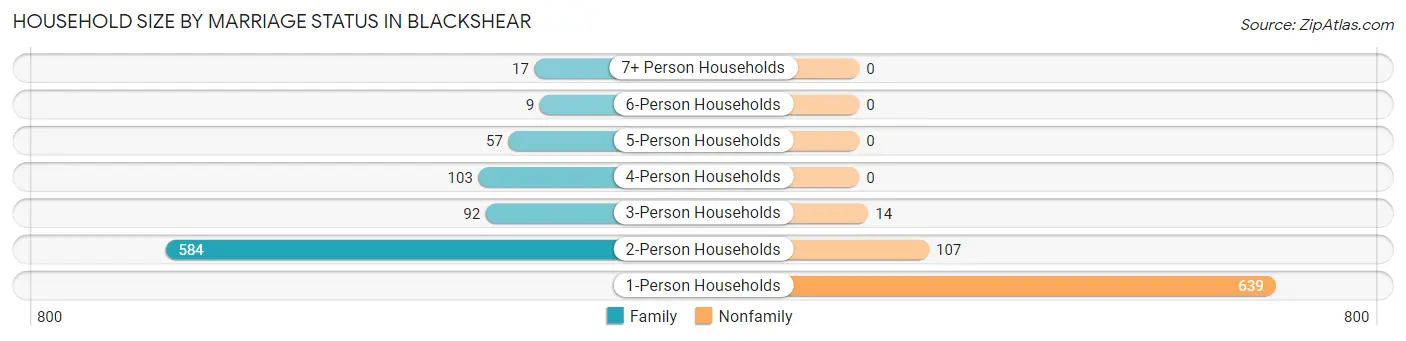
| Household Size | Family Households | Nonfamily Households |
| 1-Person Households | - | 639 (39.4%) |
| 2-Person Households | 584 (36.0%) | 107 (6.6%) |
| 3-Person Households | 92 (5.7%) | 14 (0.9%) |
| 4-Person Households | 103 (6.4%) | 0 (0.0%) |
| 5-Person Households | 57 (3.5%) | 0 (0.0%) |
| 6-Person Households | 9 (0.5%) | 0 (0.0%) |
| 7+ Person Households | 17 (1.1%) | 0 (0.0%) |
| Total | 862 (53.1%) | 760 (46.9%) |
Female Fertility in Blackshear
Fertility by Age in Blackshear
Average fertility rate in Blackshear is 57.0 births per 1,000 women. Women in the age bracket of 20 to 34 years have the highest fertility rate with 112.0 births per 1,000 women. Women in the age bracket of 20 to 34 years acount for 100.0% of all women with births.
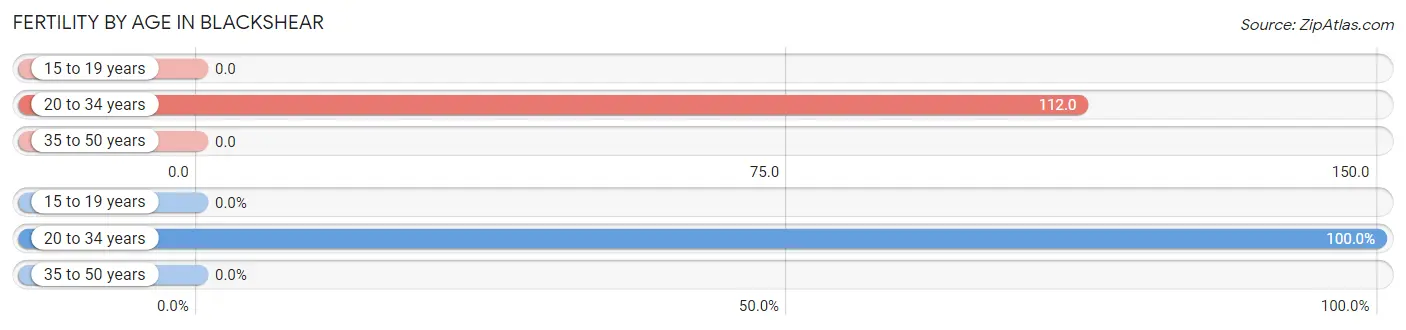
| Age Bracket | Women with Births | Births / 1,000 Women |
| 15 to 19 years | 0 (0.0%) | 0.0 |
| 20 to 34 years | 36 (100.0%) | 112.0 |
| 35 to 50 years | 0 (0.0%) | 0.0 |
| Total | 36 (100.0%) | 57.0 |
Fertility by Age by Marriage Status in Blackshear
86.1% of women with births (36) in Blackshear are married. The highest percentage of unmarried women with births falls into 20 to 34 years age bracket with 13.9% of them unmarried at the time of birth, while the lowest percentage of unmarried women with births belong to 20 to 34 years age bracket with 13.9% of them unmarried.
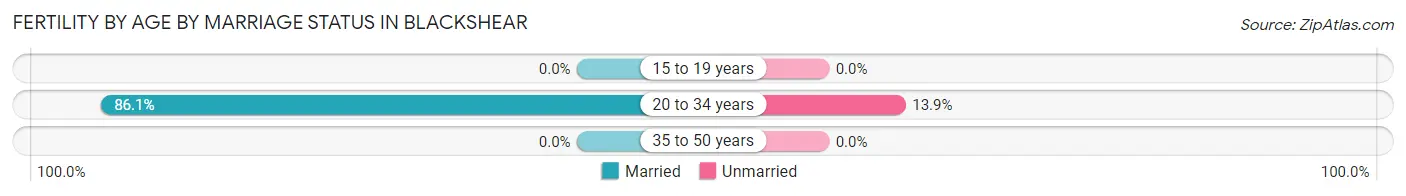
| Age Bracket | Married | Unmarried |
| 15 to 19 years | 0 (0.0%) | 0 (0.0%) |
| 20 to 34 years | 31 (86.1%) | 5 (13.9%) |
| 35 to 50 years | 0 (0.0%) | 0 (0.0%) |
| Total | 31 (86.1%) | 5 (13.9%) |
Fertility by Education in Blackshear
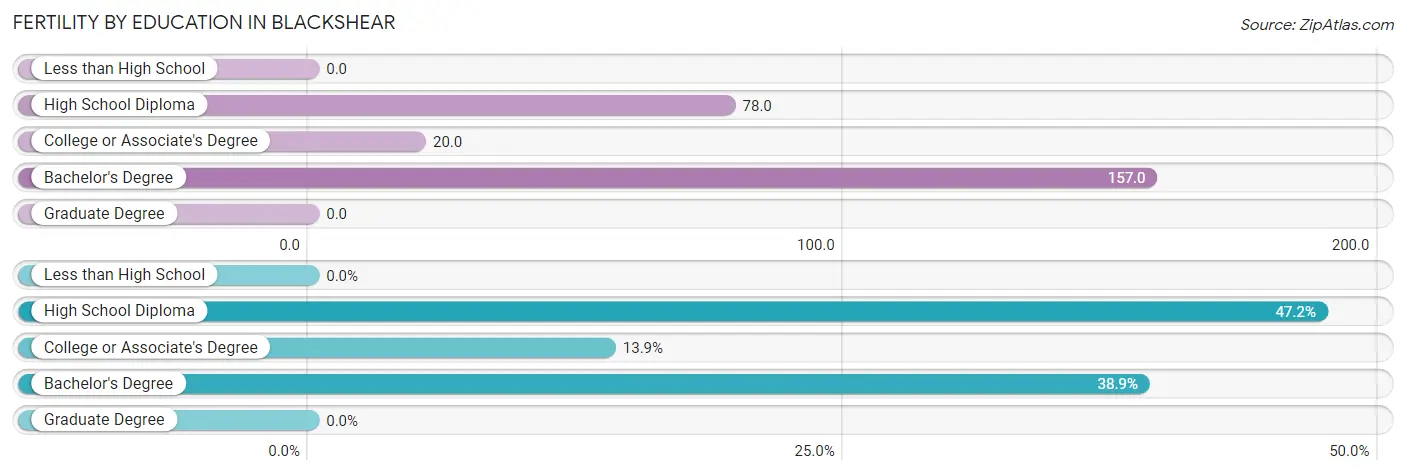
| Educational Attainment | Women with Births | Births / 1,000 Women |
| Less than High School | 0 (0.0%) | 0.0 |
| High School Diploma | 17 (47.2%) | 78.0 |
| College or Associate's Degree | 5 (13.9%) | 20.0 |
| Bachelor's Degree | 14 (38.9%) | 157.0 |
| Graduate Degree | 0 (0.0%) | 0.0 |
| Total | 36 (100.0%) | 57.0 |
Fertility by Education by Marriage Status in Blackshear
13.9% of women with births in Blackshear are unmarried. Women with the educational attainment of high school diploma are most likely to be married with 100.0% of them married at childbirth, while women with the educational attainment of college or associate's degree are least likely to be married with 100.0% of them unmarried at childbirth.
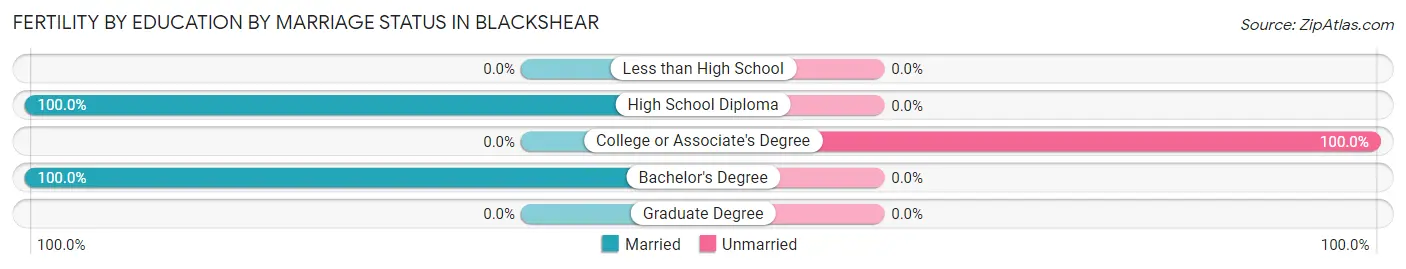
| Educational Attainment | Married | Unmarried |
| Less than High School | 0 (0.0%) | 0 (0.0%) |
| High School Diploma | 17 (100.0%) | 0 (0.0%) |
| College or Associate's Degree | 0 (0.0%) | 5 (100.0%) |
| Bachelor's Degree | 14 (100.0%) | 0 (0.0%) |
| Graduate Degree | 0 (0.0%) | 0 (0.0%) |
| Total | 31 (86.1%) | 5 (13.9%) |
Employment Characteristics in Blackshear
Employment by Class of Employer in Blackshear
Among the 1,469 employed individuals in Blackshear, private company employees (985 | 67.0%), local government employees (188 | 12.8%), and state government employees (174 | 11.8%) make up the most common classes of employment.
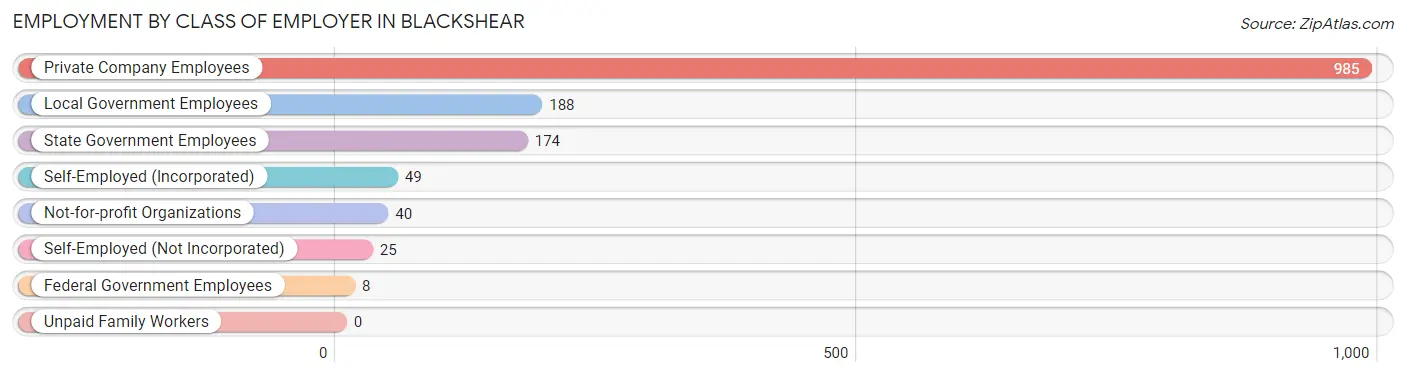
| Employer Class | # Employees | % Employees |
| Private Company Employees | 985 | 67.0% |
| Self-Employed (Incorporated) | 49 | 3.3% |
| Self-Employed (Not Incorporated) | 25 | 1.7% |
| Not-for-profit Organizations | 40 | 2.7% |
| Local Government Employees | 188 | 12.8% |
| State Government Employees | 174 | 11.8% |
| Federal Government Employees | 8 | 0.5% |
| Unpaid Family Workers | 0 | 0.0% |
| Total | 1,469 | 100.0% |
Employment Status by Age in Blackshear
According to the labor force statistics for Blackshear, out of the total population over 16 years of age (3,023), 50.3% or 1,521 individuals are in the labor force, with 3.4% or 52 of them unemployed. The age group with the highest labor force participation rate is 30 to 34 years, with 85.2% or 109 individuals in the labor force. Within the labor force, the 16 to 19 years age range has the highest percentage of unemployed individuals, with 21.4% or 12 of them being unemployed.
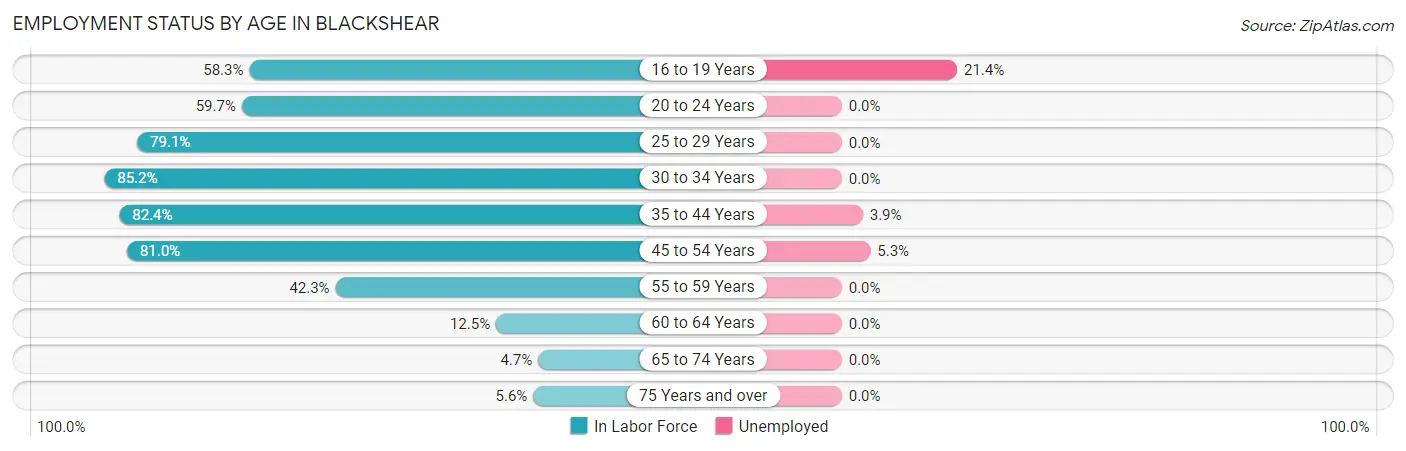
| Age Bracket | In Labor Force | Unemployed |
| 16 to 19 Years | 56 (58.3%) | 12 (21.4%) |
| 20 to 24 Years | 95 (59.7%) | 0 (0.0%) |
| 25 to 29 Years | 219 (79.1%) | 0 (0.0%) |
| 30 to 34 Years | 109 (85.2%) | 0 (0.0%) |
| 35 to 44 Years | 281 (82.4%) | 11 (3.9%) |
| 45 to 54 Years | 527 (81.0%) | 28 (5.3%) |
| 55 to 59 Years | 169 (42.3%) | 0 (0.0%) |
| 60 to 64 Years | 22 (12.5%) | 0 (0.0%) |
| 65 to 74 Years | 15 (4.7%) | 0 (0.0%) |
| 75 Years and over | 27 (5.6%) | 0 (0.0%) |
| Total | 1,521 (50.3%) | 52 (3.4%) |
Employment Status by Educational Attainment in Blackshear
According to labor force statistics for Blackshear, 67.3% of individuals (1,328) out of the total population between 25 and 64 years of age (1,973) are in the labor force, with 2.9% or 39 of them being unemployed. The group with the highest labor force participation rate are those with the educational attainment of bachelor's degree or higher, with 85.3% or 226 individuals in the labor force. Within the labor force, individuals with college / associate degree education have the highest percentage of unemployment, with 9.1% or 39 of them being unemployed.
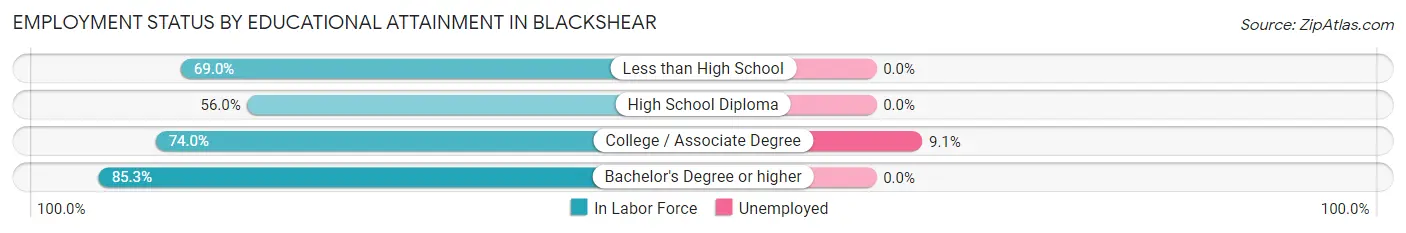
| Educational Attainment | In Labor Force | Unemployed |
| Less than High School | 216 (69.0%) | 0 (0.0%) |
| High School Diploma | 458 (56.0%) | 0 (0.0%) |
| College / Associate Degree | 427 (74.0%) | 53 (9.1%) |
| Bachelor's Degree or higher | 226 (85.3%) | 0 (0.0%) |
| Total | 1,328 (67.3%) | 57 (2.9%) |
Employment Occupations by Sex in Blackshear
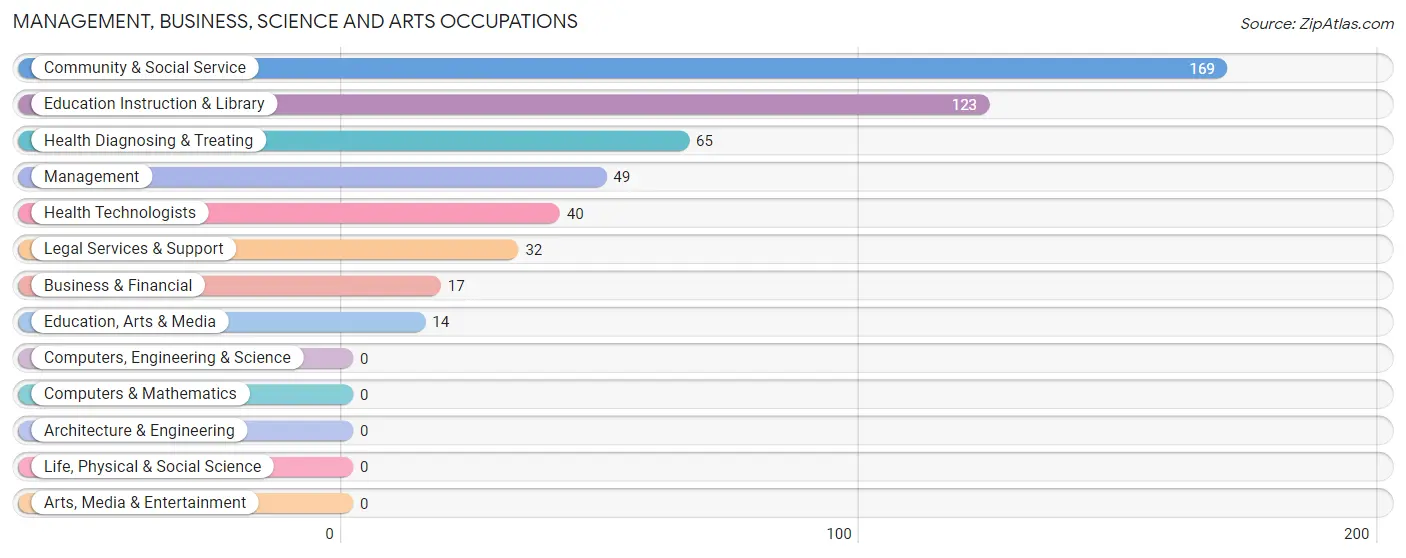
Management, Business, Science and Arts Occupations
The most common Management, Business, Science and Arts occupations in Blackshear are Community & Social Service (169 | 11.5%), Education Instruction & Library (123 | 8.4%), Health Diagnosing & Treating (65 | 4.4%), Management (49 | 3.3%), and Health Technologists (40 | 2.7%).
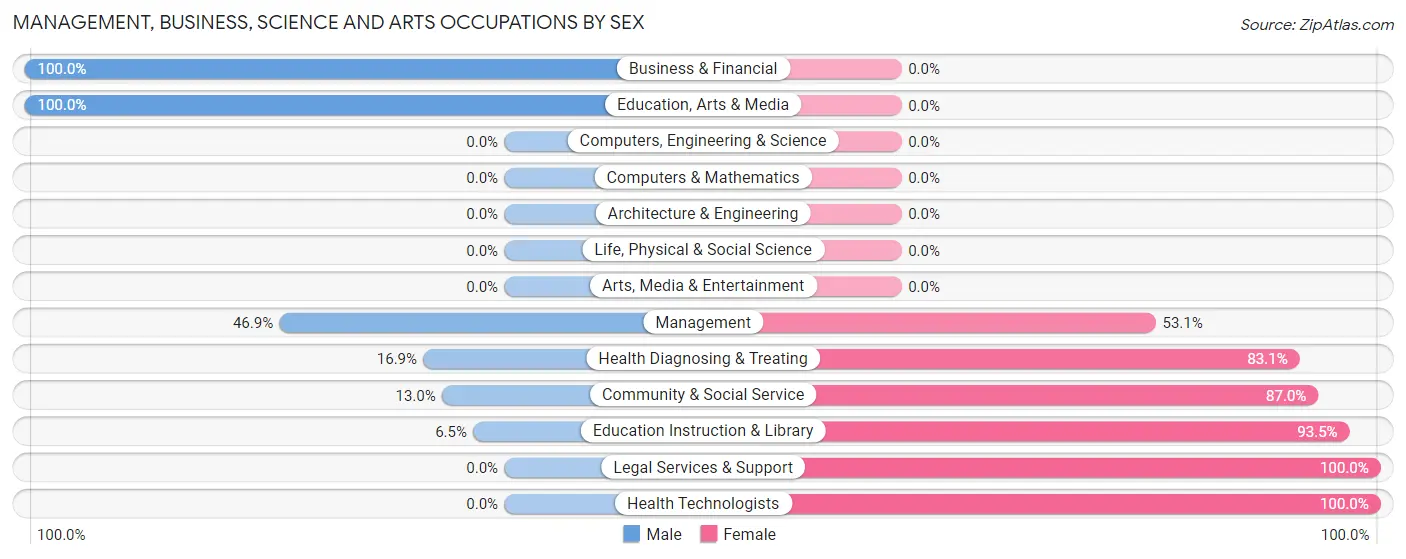
Management, Business, Science and Arts Occupations by Sex
Within the Management, Business, Science and Arts occupations in Blackshear, the most male-oriented occupations are Business & Financial (100.0%), Education, Arts & Media (100.0%), and Management (46.9%), while the most female-oriented occupations are Legal Services & Support (100.0%), Health Technologists (100.0%), and Education Instruction & Library (93.5%).
| Occupation | Male | Female |
| Management | 23 (46.9%) | 26 (53.1%) |
| Business & Financial | 17 (100.0%) | 0 (0.0%) |
| Computers, Engineering & Science | 0 (0.0%) | 0 (0.0%) |
| Computers & Mathematics | 0 (0.0%) | 0 (0.0%) |
| Architecture & Engineering | 0 (0.0%) | 0 (0.0%) |
| Life, Physical & Social Science | 0 (0.0%) | 0 (0.0%) |
| Community & Social Service | 22 (13.0%) | 147 (87.0%) |
| Education, Arts & Media | 14 (100.0%) | 0 (0.0%) |
| Legal Services & Support | 0 (0.0%) | 32 (100.0%) |
| Education Instruction & Library | 8 (6.5%) | 115 (93.5%) |
| Arts, Media & Entertainment | 0 (0.0%) | 0 (0.0%) |
| Health Diagnosing & Treating | 11 (16.9%) | 54 (83.1%) |
| Health Technologists | 0 (0.0%) | 40 (100.0%) |
| Total (Category) | 73 (24.3%) | 227 (75.7%) |
| Total (Overall) | 657 (44.7%) | 812 (55.3%) |
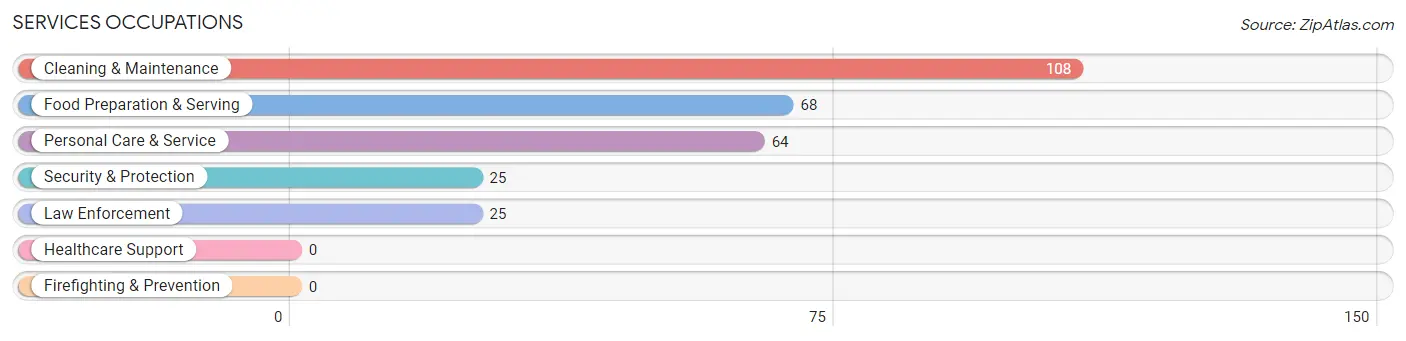
Services Occupations
The most common Services occupations in Blackshear are Cleaning & Maintenance (108 | 7.3%), Food Preparation & Serving (68 | 4.6%), Personal Care & Service (64 | 4.4%), Security & Protection (25 | 1.7%), and Law Enforcement (25 | 1.7%).
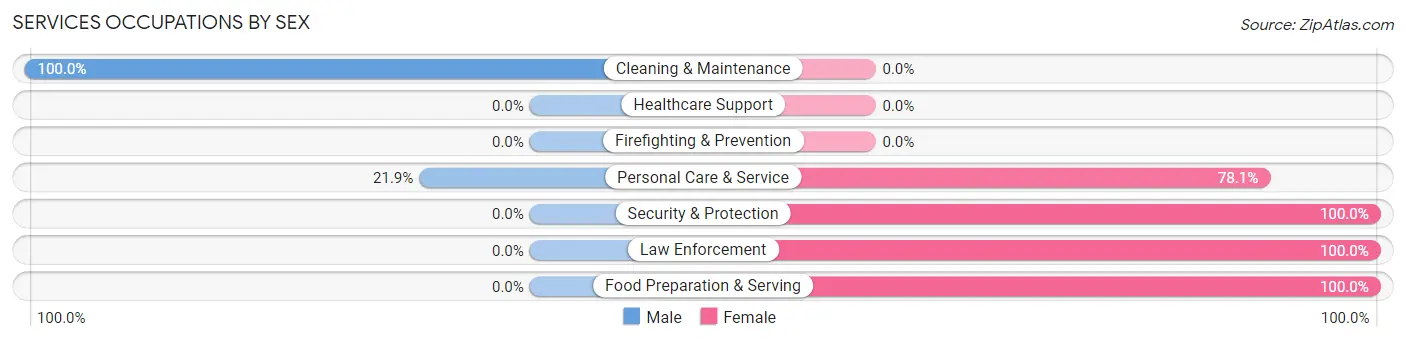
Services Occupations by Sex
Within the Services occupations in Blackshear, the most male-oriented occupations are Cleaning & Maintenance (100.0%), and Personal Care & Service (21.9%), while the most female-oriented occupations are Security & Protection (100.0%), Law Enforcement (100.0%), and Food Preparation & Serving (100.0%).
| Occupation | Male | Female |
| Healthcare Support | 0 (0.0%) | 0 (0.0%) |
| Security & Protection | 0 (0.0%) | 25 (100.0%) |
| Firefighting & Prevention | 0 (0.0%) | 0 (0.0%) |
| Law Enforcement | 0 (0.0%) | 25 (100.0%) |
| Food Preparation & Serving | 0 (0.0%) | 68 (100.0%) |
| Cleaning & Maintenance | 108 (100.0%) | 0 (0.0%) |
| Personal Care & Service | 14 (21.9%) | 50 (78.1%) |
| Total (Category) | 122 (46.0%) | 143 (54.0%) |
| Total (Overall) | 657 (44.7%) | 812 (55.3%) |
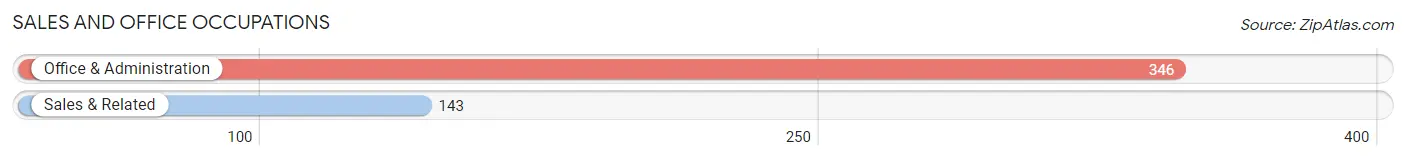
Sales and Office Occupations
The most common Sales and Office occupations in Blackshear are Office & Administration (346 | 23.5%), and Sales & Related (143 | 9.7%).
Sales and Office Occupations by Sex
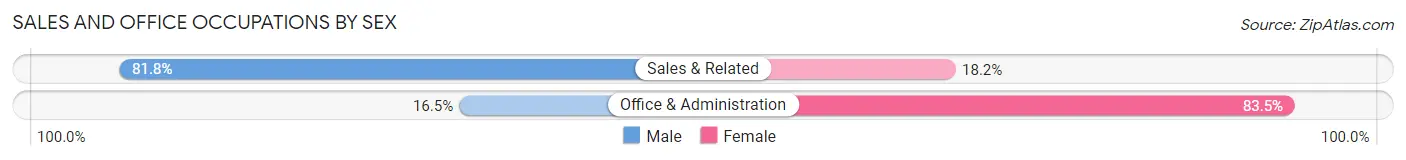
| Occupation | Male | Female |
| Sales & Related | 117 (81.8%) | 26 (18.2%) |
| Office & Administration | 57 (16.5%) | 289 (83.5%) |
| Total (Category) | 174 (35.6%) | 315 (64.4%) |
| Total (Overall) | 657 (44.7%) | 812 (55.3%) |
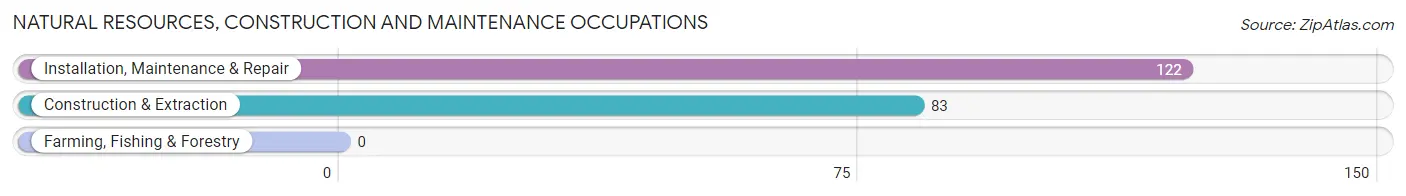
Natural Resources, Construction and Maintenance Occupations
The most common Natural Resources, Construction and Maintenance occupations in Blackshear are Installation, Maintenance & Repair (122 | 8.3%), and Construction & Extraction (83 | 5.7%).
Natural Resources, Construction and Maintenance Occupations by Sex
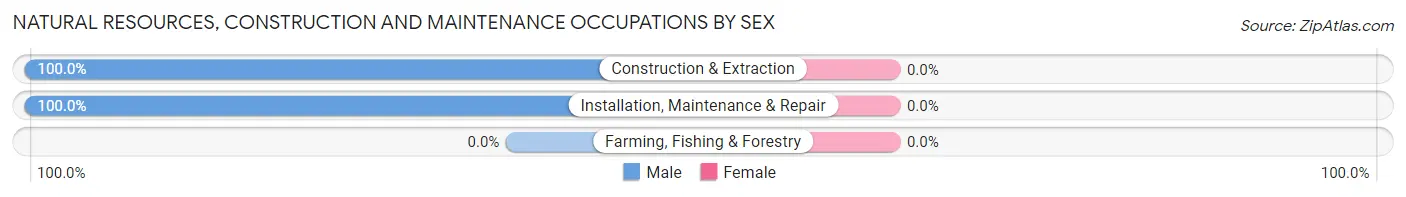
| Occupation | Male | Female |
| Farming, Fishing & Forestry | 0 (0.0%) | 0 (0.0%) |
| Construction & Extraction | 83 (100.0%) | 0 (0.0%) |
| Installation, Maintenance & Repair | 122 (100.0%) | 0 (0.0%) |
| Total (Category) | 205 (100.0%) | 0 (0.0%) |
| Total (Overall) | 657 (44.7%) | 812 (55.3%) |
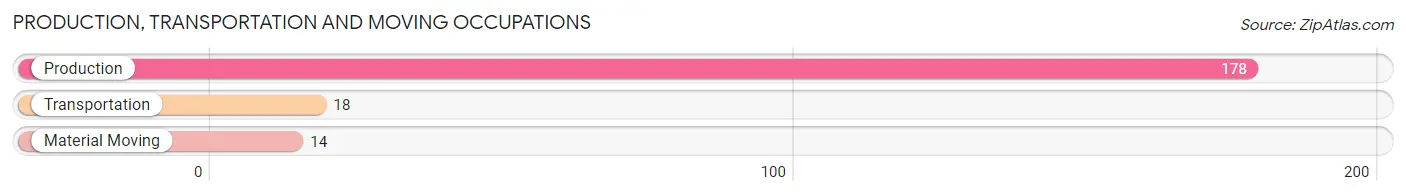
Production, Transportation and Moving Occupations
The most common Production, Transportation and Moving occupations in Blackshear are Production (178 | 12.1%), Transportation (18 | 1.2%), and Material Moving (14 | 0.9%).
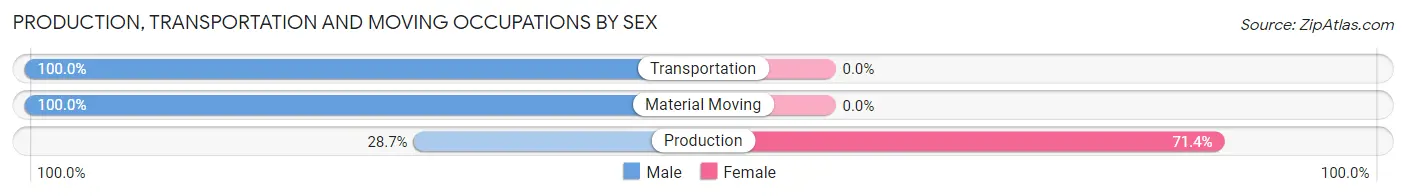
Production, Transportation and Moving Occupations by Sex
| Occupation | Male | Female |
| Production | 51 (28.6%) | 127 (71.4%) |
| Transportation | 18 (100.0%) | 0 (0.0%) |
| Material Moving | 14 (100.0%) | 0 (0.0%) |
| Total (Category) | 83 (39.5%) | 127 (60.5%) |
| Total (Overall) | 657 (44.7%) | 812 (55.3%) |
Employment Industries by Sex in Blackshear
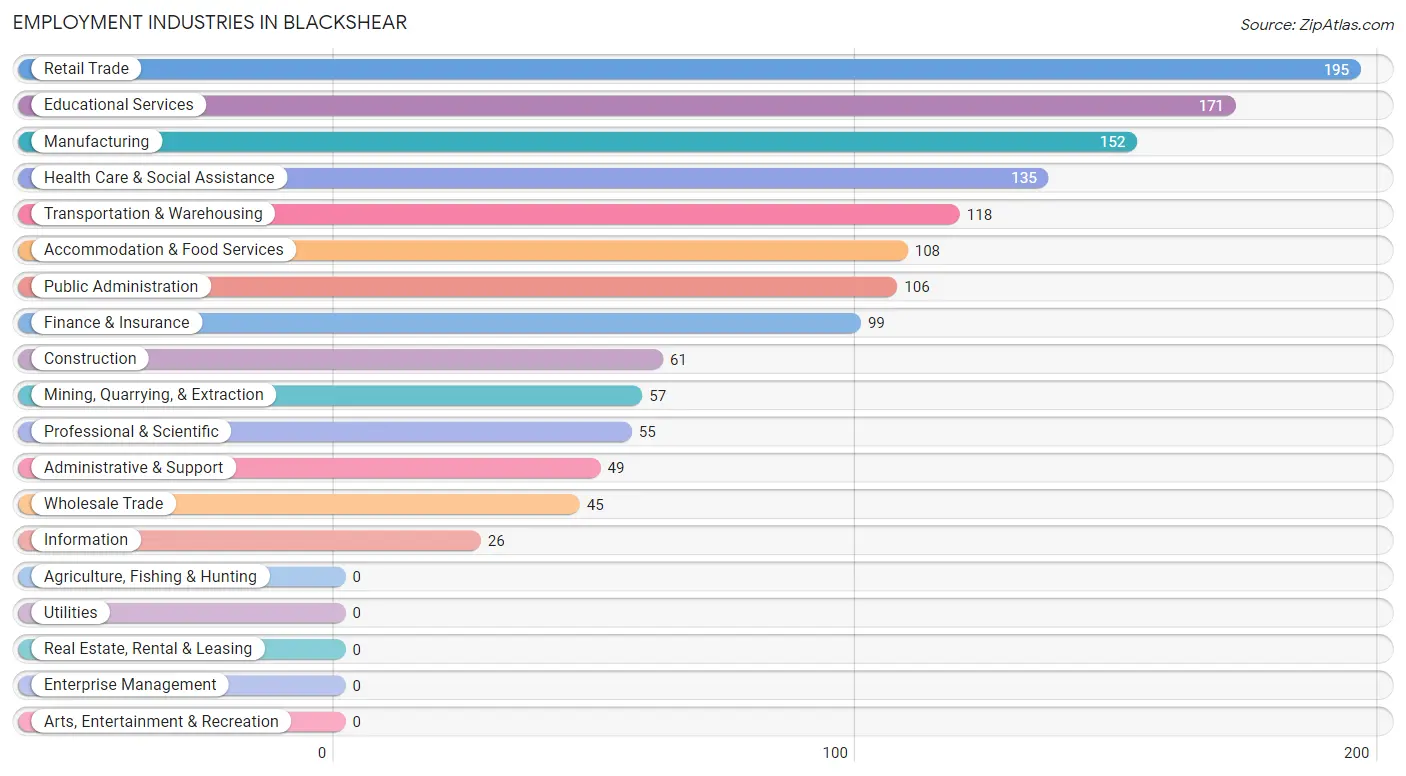
Employment Industries in Blackshear
The major employment industries in Blackshear include Retail Trade (195 | 13.3%), Educational Services (171 | 11.6%), Manufacturing (152 | 10.3%), Health Care & Social Assistance (135 | 9.2%), and Transportation & Warehousing (118 | 8.0%).
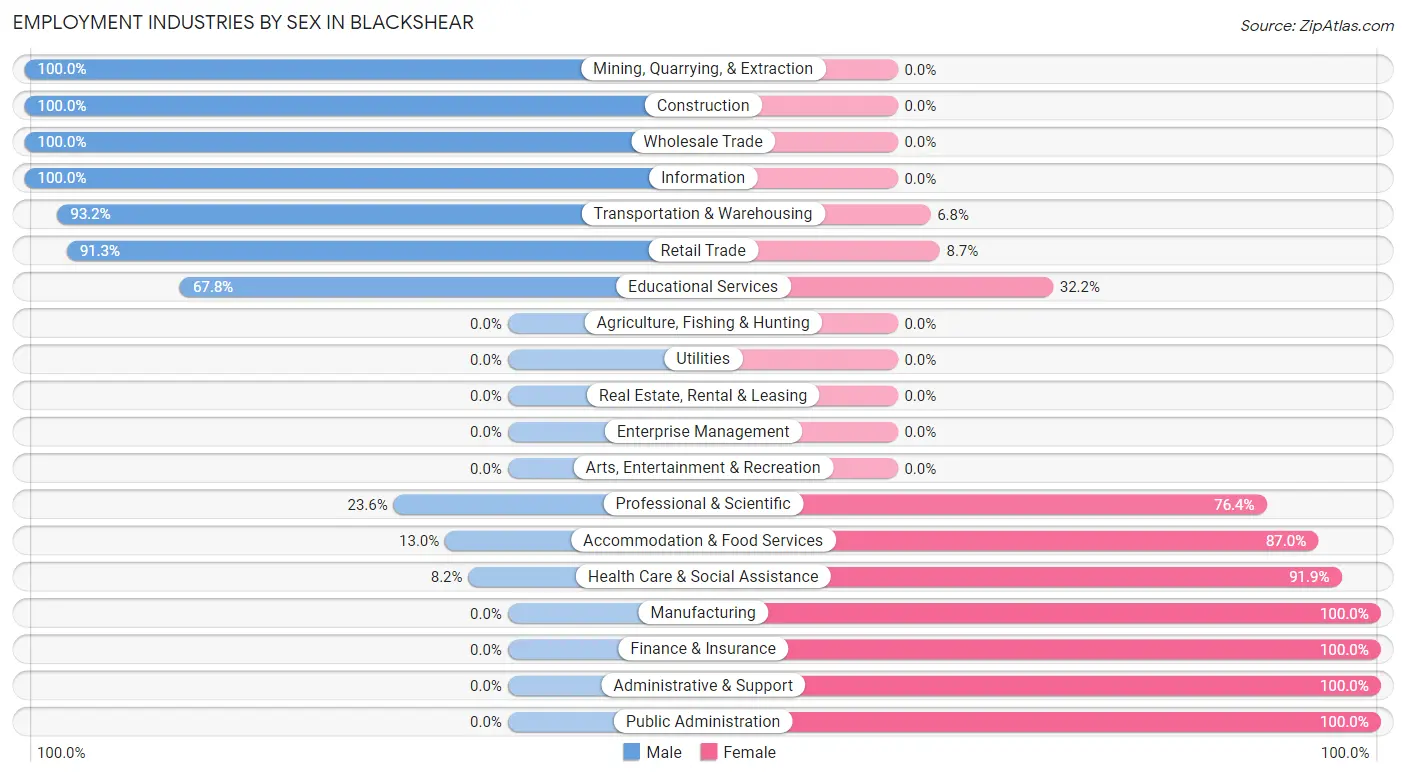
Employment Industries by Sex in Blackshear
The Blackshear industries that see more men than women are Mining, Quarrying, & Extraction (100.0%), Construction (100.0%), and Wholesale Trade (100.0%), whereas the industries that tend to have a higher number of women are Manufacturing (100.0%), Finance & Insurance (100.0%), and Administrative & Support (100.0%).
| Industry | Male | Female |
| Agriculture, Fishing & Hunting | 0 (0.0%) | 0 (0.0%) |
| Mining, Quarrying, & Extraction | 57 (100.0%) | 0 (0.0%) |
| Construction | 61 (100.0%) | 0 (0.0%) |
| Manufacturing | 0 (0.0%) | 152 (100.0%) |
| Wholesale Trade | 45 (100.0%) | 0 (0.0%) |
| Retail Trade | 178 (91.3%) | 17 (8.7%) |
| Transportation & Warehousing | 110 (93.2%) | 8 (6.8%) |
| Utilities | 0 (0.0%) | 0 (0.0%) |
| Information | 26 (100.0%) | 0 (0.0%) |
| Finance & Insurance | 0 (0.0%) | 99 (100.0%) |
| Real Estate, Rental & Leasing | 0 (0.0%) | 0 (0.0%) |
| Professional & Scientific | 13 (23.6%) | 42 (76.4%) |
| Enterprise Management | 0 (0.0%) | 0 (0.0%) |
| Administrative & Support | 0 (0.0%) | 49 (100.0%) |
| Educational Services | 116 (67.8%) | 55 (32.2%) |
| Health Care & Social Assistance | 11 (8.2%) | 124 (91.8%) |
| Arts, Entertainment & Recreation | 0 (0.0%) | 0 (0.0%) |
| Accommodation & Food Services | 14 (13.0%) | 94 (87.0%) |
| Public Administration | 0 (0.0%) | 106 (100.0%) |
| Total | 657 (44.7%) | 812 (55.3%) |
Education in Blackshear
School Enrollment in Blackshear
The most common levels of schooling among the 545 students in Blackshear are elementary school (185 | 33.9%), middle school (100 | 18.3%), and high school (88 | 16.2%).
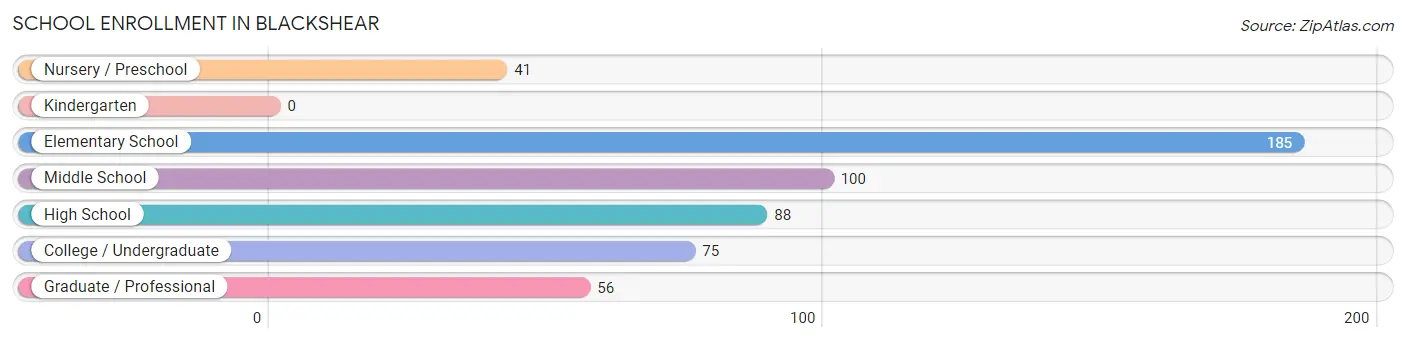
| School Level | # Students | % Students |
| Nursery / Preschool | 41 | 7.5% |
| Kindergarten | 0 | 0.0% |
| Elementary School | 185 | 33.9% |
| Middle School | 100 | 18.3% |
| High School | 88 | 16.2% |
| College / Undergraduate | 75 | 13.8% |
| Graduate / Professional | 56 | 10.3% |
| Total | 545 | 100.0% |
School Enrollment by Age by Funding Source in Blackshear
Out of a total of 545 students who are enrolled in schools in Blackshear, 41 (7.5%) attend a private institution, while the remaining 504 (92.5%) are enrolled in public schools. The age group of 3 to 4 year olds has the highest likelihood of being enrolled in private schools, with 41 (100.0% in the age bracket) enrolled. Conversely, the age group of 5 to 9 year old has the lowest likelihood of being enrolled in a private school, with 185 (100.0% in the age bracket) attending a public institution.
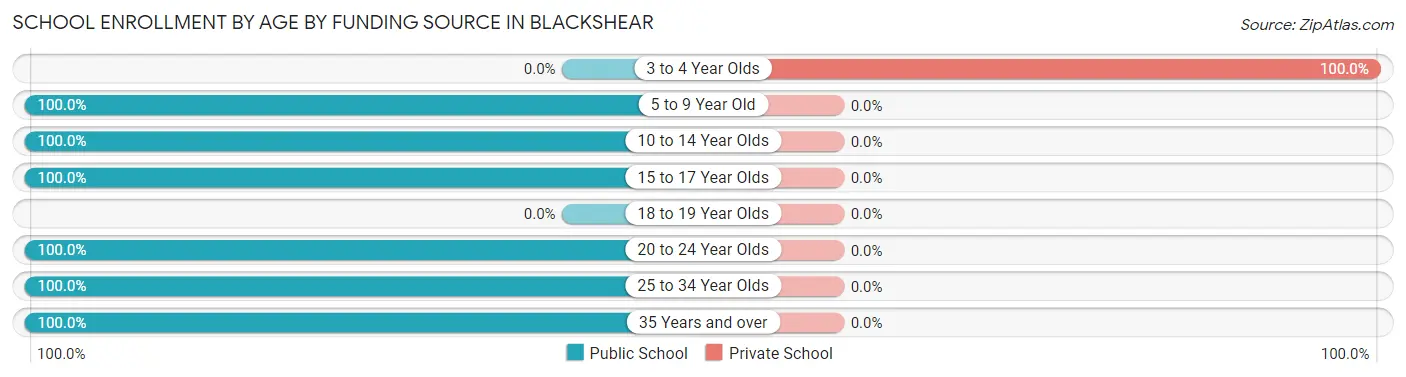
| Age Bracket | Public School | Private School |
| 3 to 4 Year Olds | 0 (0.0%) | 41 (100.0%) |
| 5 to 9 Year Old | 185 (100.0%) | 0 (0.0%) |
| 10 to 14 Year Olds | 114 (100.0%) | 0 (0.0%) |
| 15 to 17 Year Olds | 74 (100.0%) | 0 (0.0%) |
| 18 to 19 Year Olds | 0 (0.0%) | 0 (0.0%) |
| 20 to 24 Year Olds | 26 (100.0%) | 0 (0.0%) |
| 25 to 34 Year Olds | 42 (100.0%) | 0 (0.0%) |
| 35 Years and over | 63 (100.0%) | 0 (0.0%) |
| Total | 504 (92.5%) | 41 (7.5%) |
Educational Attainment by Field of Study in Blackshear
Education (241 | 47.2%), business (80 | 15.7%), arts & humanities (57 | 11.2%), communications (40 | 7.8%), and science & technology (28 | 5.5%) are the most common fields of study among 511 individuals in Blackshear who have obtained a bachelor's degree or higher.
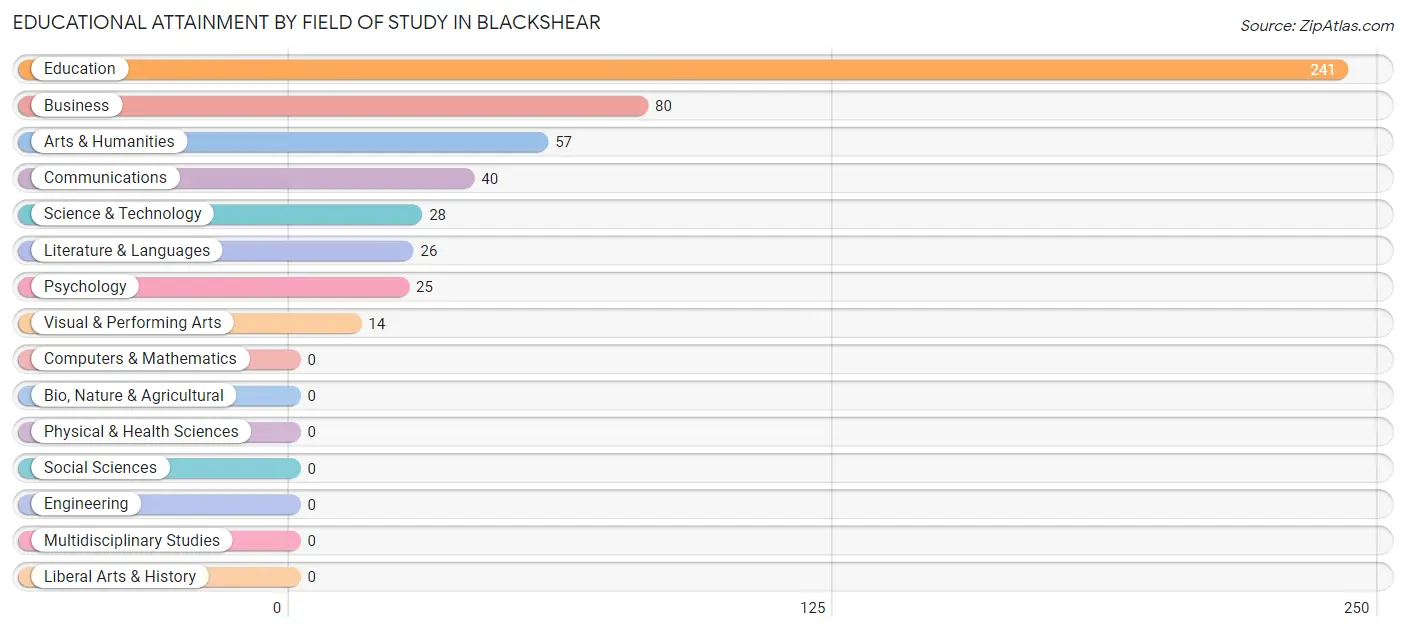
| Field of Study | # Graduates | % Graduates |
| Computers & Mathematics | 0 | 0.0% |
| Bio, Nature & Agricultural | 0 | 0.0% |
| Physical & Health Sciences | 0 | 0.0% |
| Psychology | 25 | 4.9% |
| Social Sciences | 0 | 0.0% |
| Engineering | 0 | 0.0% |
| Multidisciplinary Studies | 0 | 0.0% |
| Science & Technology | 28 | 5.5% |
| Business | 80 | 15.7% |
| Education | 241 | 47.2% |
| Literature & Languages | 26 | 5.1% |
| Liberal Arts & History | 0 | 0.0% |
| Visual & Performing Arts | 14 | 2.7% |
| Communications | 40 | 7.8% |
| Arts & Humanities | 57 | 11.2% |
| Total | 511 | 100.0% |
Transportation & Commute in Blackshear
Vehicle Availability by Sex in Blackshear
The most prevalent vehicle ownership categories in Blackshear are males with 2 vehicles (268, accounting for 40.8%) and females with 2 vehicles (179, making up 33.0%).
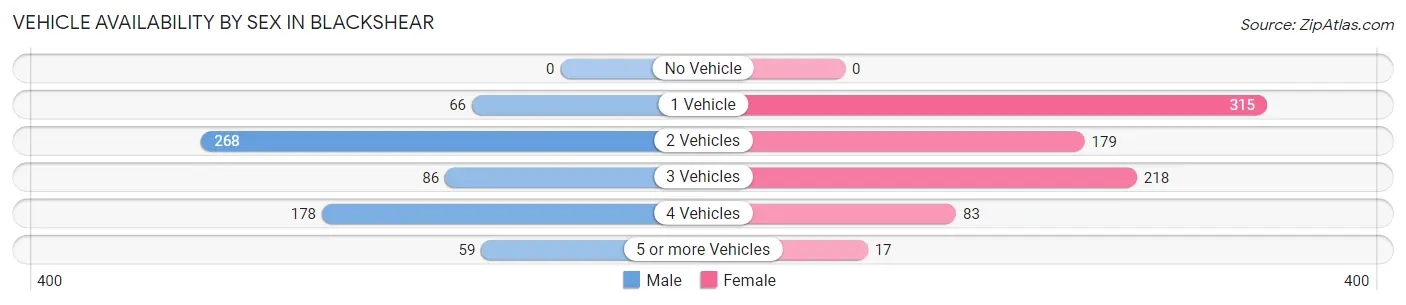
| Vehicles Available | Male | Female |
| No Vehicle | 0 (0.0%) | 0 (0.0%) |
| 1 Vehicle | 66 (10.1%) | 315 (38.8%) |
| 2 Vehicles | 268 (40.8%) | 179 (22.0%) |
| 3 Vehicles | 86 (13.1%) | 218 (26.9%) |
| 4 Vehicles | 178 (27.1%) | 83 (10.2%) |
| 5 or more Vehicles | 59 (9.0%) | 17 (2.1%) |
| Total | 657 (100.0%) | 812 (100.0%) |
Commute Time in Blackshear
The most frequently occuring commute durations in Blackshear are 20 to 24 minutes (455 commuters, 31.2%), 30 to 34 minutes (296 commuters, 20.3%), and 15 to 19 minutes (250 commuters, 17.1%).
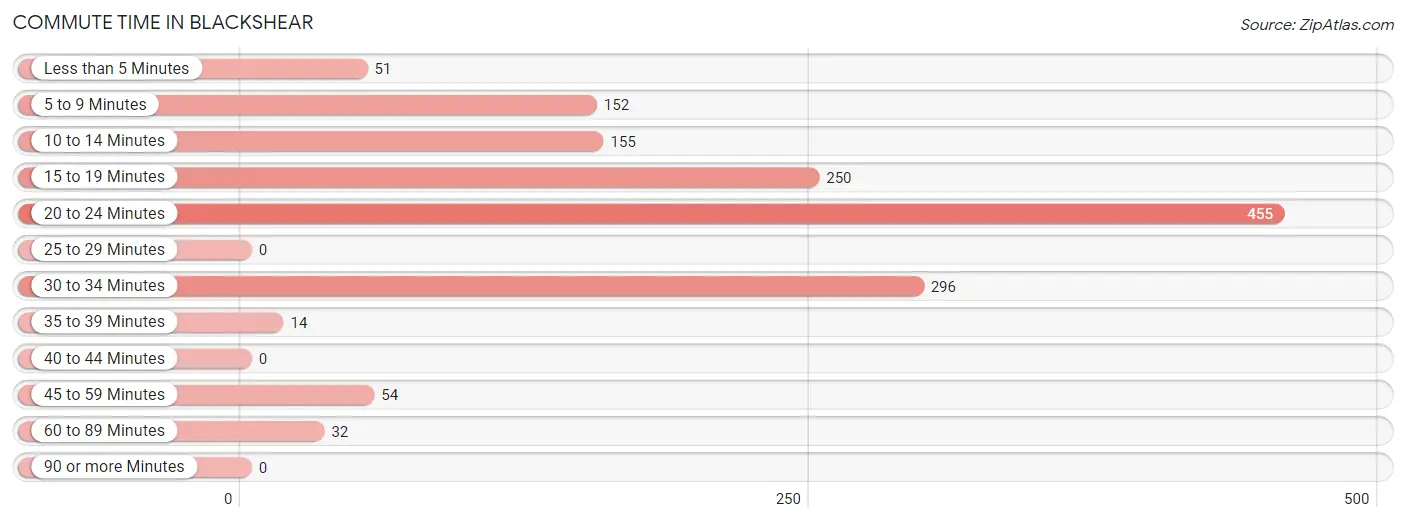
| Commute Time | # Commuters | % Commuters |
| Less than 5 Minutes | 51 | 3.5% |
| 5 to 9 Minutes | 152 | 10.4% |
| 10 to 14 Minutes | 155 | 10.6% |
| 15 to 19 Minutes | 250 | 17.1% |
| 20 to 24 Minutes | 455 | 31.2% |
| 25 to 29 Minutes | 0 | 0.0% |
| 30 to 34 Minutes | 296 | 20.3% |
| 35 to 39 Minutes | 14 | 1.0% |
| 40 to 44 Minutes | 0 | 0.0% |
| 45 to 59 Minutes | 54 | 3.7% |
| 60 to 89 Minutes | 32 | 2.2% |
| 90 or more Minutes | 0 | 0.0% |
Commute Time by Sex in Blackshear
The most common commute times in Blackshear are 20 to 24 minutes (235 commuters, 35.8%) for males and 20 to 24 minutes (220 commuters, 27.4%) for females.
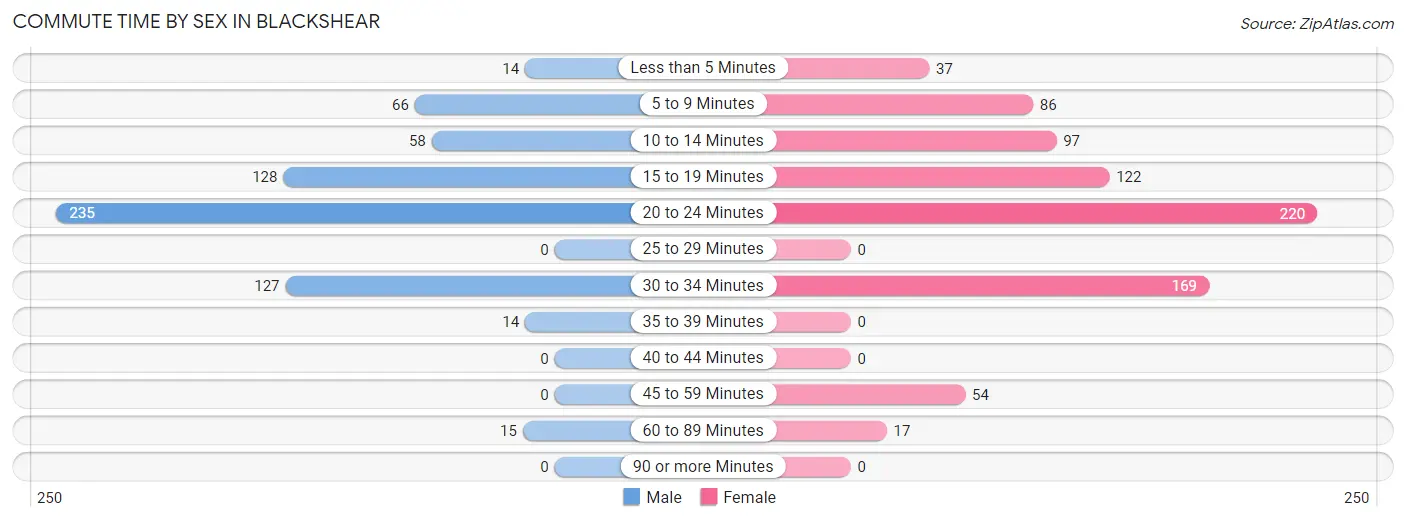
| Commute Time | Male | Female |
| Less than 5 Minutes | 14 (2.1%) | 37 (4.6%) |
| 5 to 9 Minutes | 66 (10.1%) | 86 (10.7%) |
| 10 to 14 Minutes | 58 (8.8%) | 97 (12.1%) |
| 15 to 19 Minutes | 128 (19.5%) | 122 (15.2%) |
| 20 to 24 Minutes | 235 (35.8%) | 220 (27.4%) |
| 25 to 29 Minutes | 0 (0.0%) | 0 (0.0%) |
| 30 to 34 Minutes | 127 (19.3%) | 169 (21.1%) |
| 35 to 39 Minutes | 14 (2.1%) | 0 (0.0%) |
| 40 to 44 Minutes | 0 (0.0%) | 0 (0.0%) |
| 45 to 59 Minutes | 0 (0.0%) | 54 (6.7%) |
| 60 to 89 Minutes | 15 (2.3%) | 17 (2.1%) |
| 90 or more Minutes | 0 (0.0%) | 0 (0.0%) |
Time of Departure to Work by Sex in Blackshear
The most frequent times of departure to work in Blackshear are 7:00 AM to 7:29 AM (155, 23.6%) for males and 6:30 AM to 6:59 AM (336, 41.9%) for females.
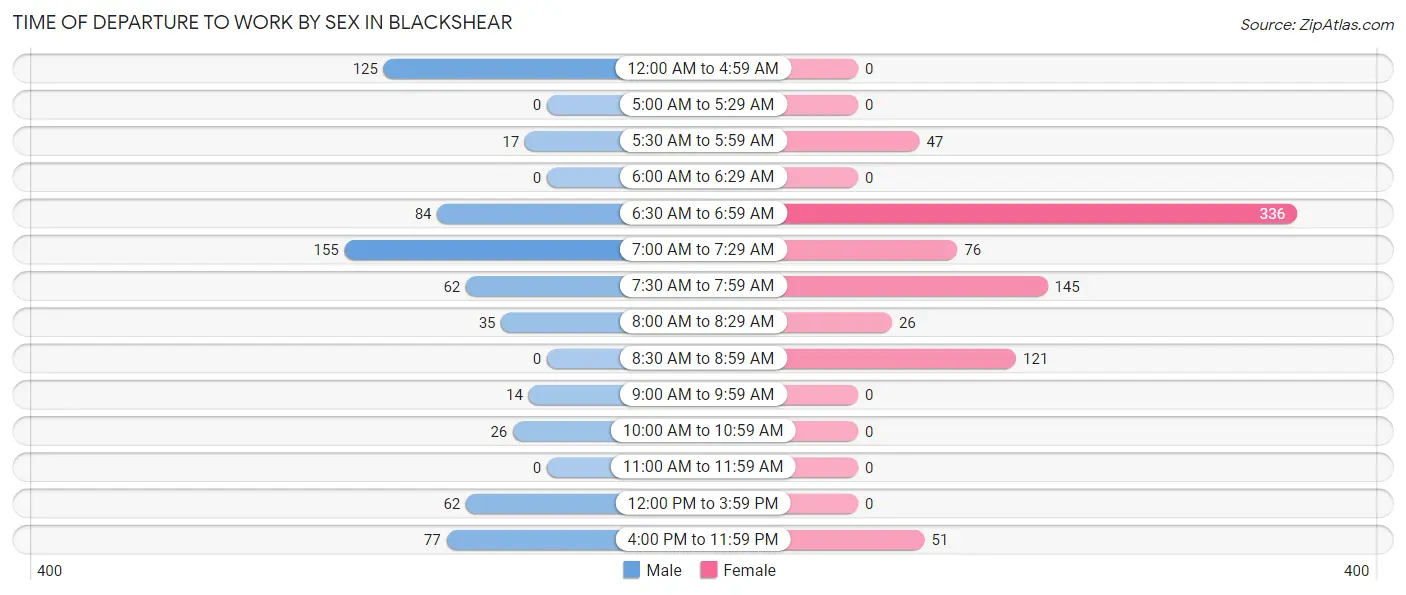
| Time of Departure | Male | Female |
| 12:00 AM to 4:59 AM | 125 (19.0%) | 0 (0.0%) |
| 5:00 AM to 5:29 AM | 0 (0.0%) | 0 (0.0%) |
| 5:30 AM to 5:59 AM | 17 (2.6%) | 47 (5.9%) |
| 6:00 AM to 6:29 AM | 0 (0.0%) | 0 (0.0%) |
| 6:30 AM to 6:59 AM | 84 (12.8%) | 336 (41.9%) |
| 7:00 AM to 7:29 AM | 155 (23.6%) | 76 (9.5%) |
| 7:30 AM to 7:59 AM | 62 (9.4%) | 145 (18.1%) |
| 8:00 AM to 8:29 AM | 35 (5.3%) | 26 (3.2%) |
| 8:30 AM to 8:59 AM | 0 (0.0%) | 121 (15.1%) |
| 9:00 AM to 9:59 AM | 14 (2.1%) | 0 (0.0%) |
| 10:00 AM to 10:59 AM | 26 (4.0%) | 0 (0.0%) |
| 11:00 AM to 11:59 AM | 0 (0.0%) | 0 (0.0%) |
| 12:00 PM to 3:59 PM | 62 (9.4%) | 0 (0.0%) |
| 4:00 PM to 11:59 PM | 77 (11.7%) | 51 (6.4%) |
| Total | 657 (100.0%) | 802 (100.0%) |
Housing Occupancy in Blackshear
Occupancy by Ownership in Blackshear
Of the total 1,622 dwellings in Blackshear, owner-occupied units account for 1,173 (72.3%), while renter-occupied units make up 449 (27.7%).
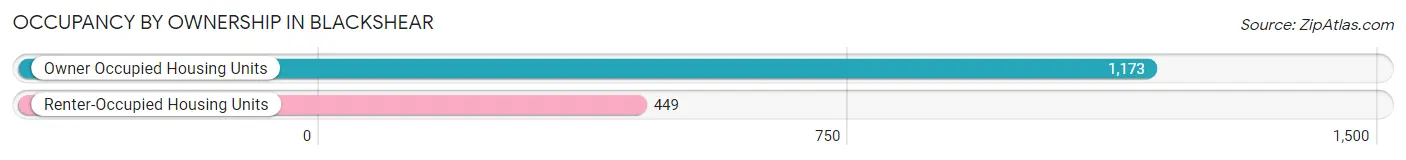
| Occupancy | # Housing Units | % Housing Units |
| Owner Occupied Housing Units | 1,173 | 72.3% |
| Renter-Occupied Housing Units | 449 | 27.7% |
| Total Occupied Housing Units | 1,622 | 100.0% |
Occupancy by Household Size in Blackshear
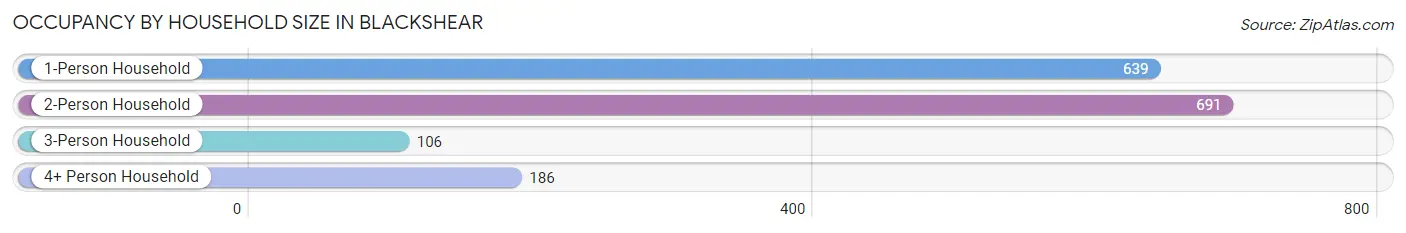
| Household Size | # Housing Units | % Housing Units |
| 1-Person Household | 639 | 39.4% |
| 2-Person Household | 691 | 42.6% |
| 3-Person Household | 106 | 6.5% |
| 4+ Person Household | 186 | 11.5% |
| Total Housing Units | 1,622 | 100.0% |
Occupancy by Ownership by Household Size in Blackshear
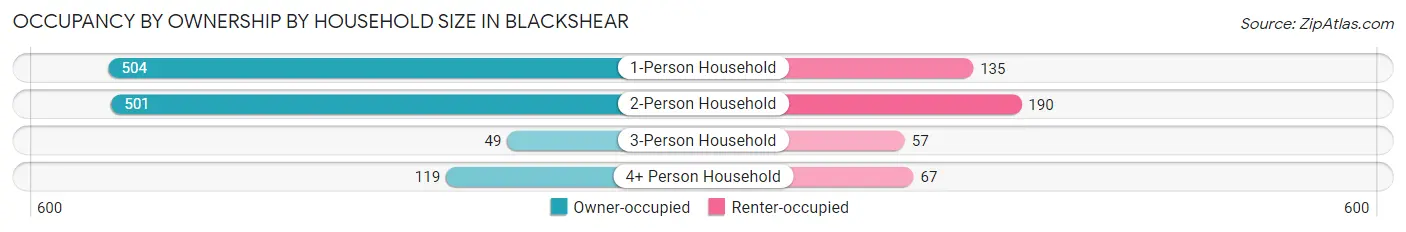
| Household Size | Owner-occupied | Renter-occupied |
| 1-Person Household | 504 (78.9%) | 135 (21.1%) |
| 2-Person Household | 501 (72.5%) | 190 (27.5%) |
| 3-Person Household | 49 (46.2%) | 57 (53.8%) |
| 4+ Person Household | 119 (64.0%) | 67 (36.0%) |
| Total Housing Units | 1,173 (72.3%) | 449 (27.7%) |
Occupancy by Educational Attainment in Blackshear
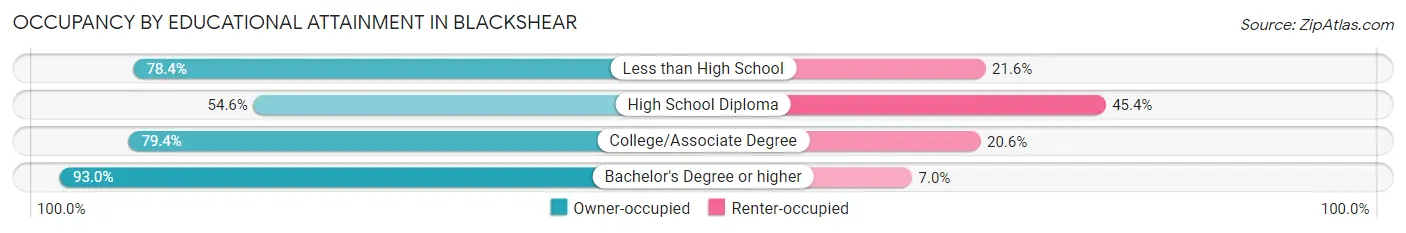
| Household Size | Owner-occupied | Renter-occupied |
| Less than High School | 254 (78.4%) | 70 (21.6%) |
| High School Diploma | 339 (54.6%) | 282 (45.4%) |
| College/Associate Degree | 289 (79.4%) | 75 (20.6%) |
| Bachelor's Degree or higher | 291 (93.0%) | 22 (7.0%) |
Occupancy by Age of Householder in Blackshear
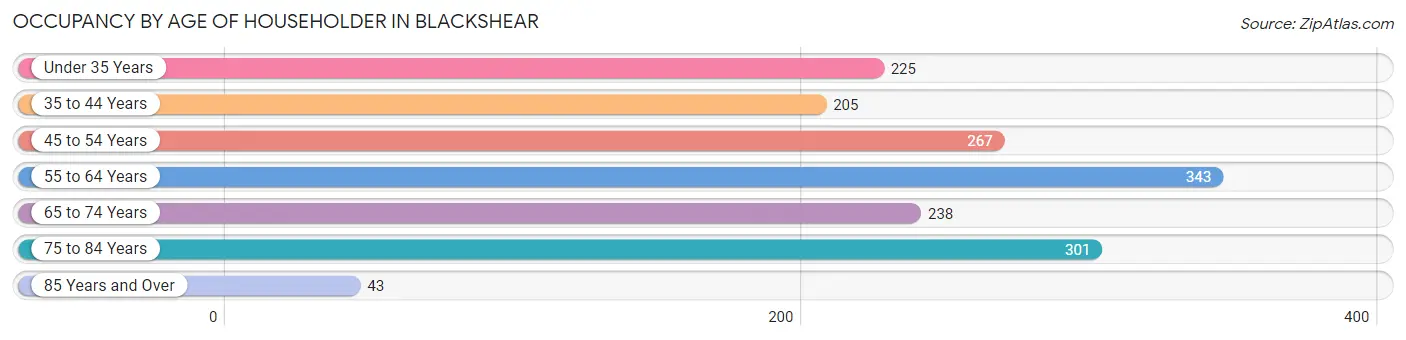
| Age Bracket | # Households | % Households |
| Under 35 Years | 225 | 13.9% |
| 35 to 44 Years | 205 | 12.6% |
| 45 to 54 Years | 267 | 16.5% |
| 55 to 64 Years | 343 | 21.1% |
| 65 to 74 Years | 238 | 14.7% |
| 75 to 84 Years | 301 | 18.6% |
| 85 Years and Over | 43 | 2.6% |
| Total | 1,622 | 100.0% |
Housing Finances in Blackshear
Median Income by Occupancy in Blackshear
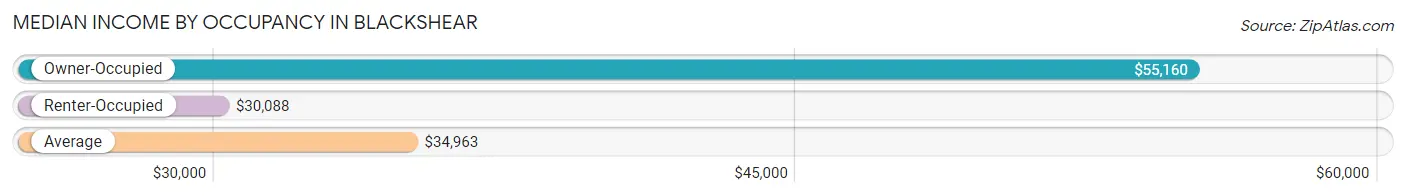
| Occupancy Type | # Households | Median Income |
| Owner-Occupied | 1,173 (72.3%) | $55,160 |
| Renter-Occupied | 449 (27.7%) | $30,088 |
| Average | 1,622 (100.0%) | $34,963 |
Occupancy by Householder Income Bracket in Blackshear
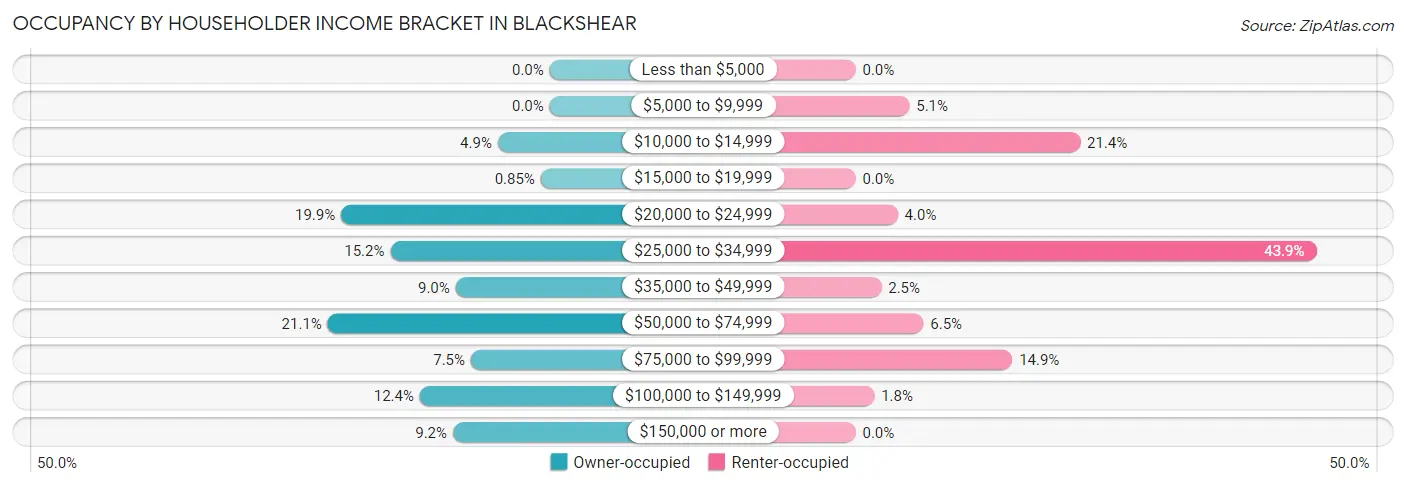
| Income Bracket | Owner-occupied | Renter-occupied |
| Less than $5,000 | 0 (0.0%) | 0 (0.0%) |
| $5,000 to $9,999 | 0 (0.0%) | 23 (5.1%) |
| $10,000 to $14,999 | 58 (4.9%) | 96 (21.4%) |
| $15,000 to $19,999 | 10 (0.9%) | 0 (0.0%) |
| $20,000 to $24,999 | 233 (19.9%) | 18 (4.0%) |
| $25,000 to $34,999 | 178 (15.2%) | 197 (43.9%) |
| $35,000 to $49,999 | 105 (8.9%) | 11 (2.5%) |
| $50,000 to $74,999 | 248 (21.1%) | 29 (6.5%) |
| $75,000 to $99,999 | 88 (7.5%) | 67 (14.9%) |
| $100,000 to $149,999 | 145 (12.4%) | 8 (1.8%) |
| $150,000 or more | 108 (9.2%) | 0 (0.0%) |
| Total | 1,173 (100.0%) | 449 (100.0%) |
Monthly Housing Cost Tiers in Blackshear
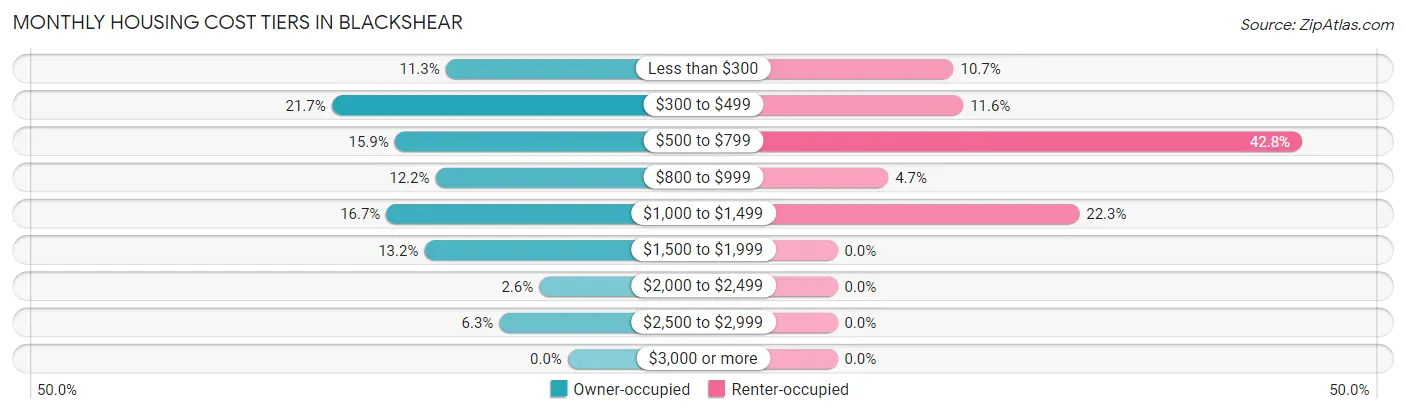
| Monthly Cost | Owner-occupied | Renter-occupied |
| Less than $300 | 132 (11.3%) | 48 (10.7%) |
| $300 to $499 | 255 (21.7%) | 52 (11.6%) |
| $500 to $799 | 187 (15.9%) | 192 (42.8%) |
| $800 to $999 | 143 (12.2%) | 21 (4.7%) |
| $1,000 to $1,499 | 196 (16.7%) | 100 (22.3%) |
| $1,500 to $1,999 | 155 (13.2%) | 0 (0.0%) |
| $2,000 to $2,499 | 31 (2.6%) | 0 (0.0%) |
| $2,500 to $2,999 | 74 (6.3%) | 0 (0.0%) |
| $3,000 or more | 0 (0.0%) | 0 (0.0%) |
| Total | 1,173 (100.0%) | 449 (100.0%) |
Physical Housing Characteristics in Blackshear
Housing Structures in Blackshear
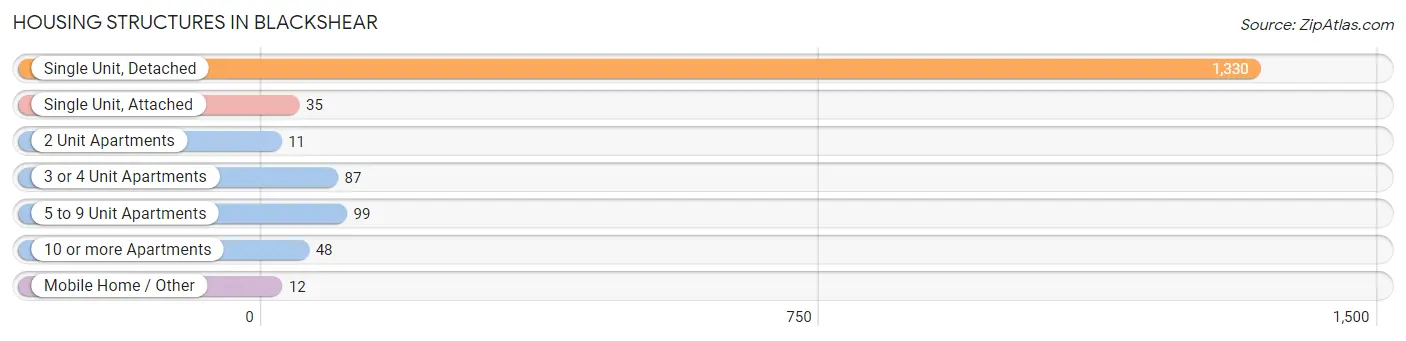
| Structure Type | # Housing Units | % Housing Units |
| Single Unit, Detached | 1,330 | 82.0% |
| Single Unit, Attached | 35 | 2.2% |
| 2 Unit Apartments | 11 | 0.7% |
| 3 or 4 Unit Apartments | 87 | 5.4% |
| 5 to 9 Unit Apartments | 99 | 6.1% |
| 10 or more Apartments | 48 | 3.0% |
| Mobile Home / Other | 12 | 0.7% |
| Total | 1,622 | 100.0% |
Housing Structures by Occupancy in Blackshear
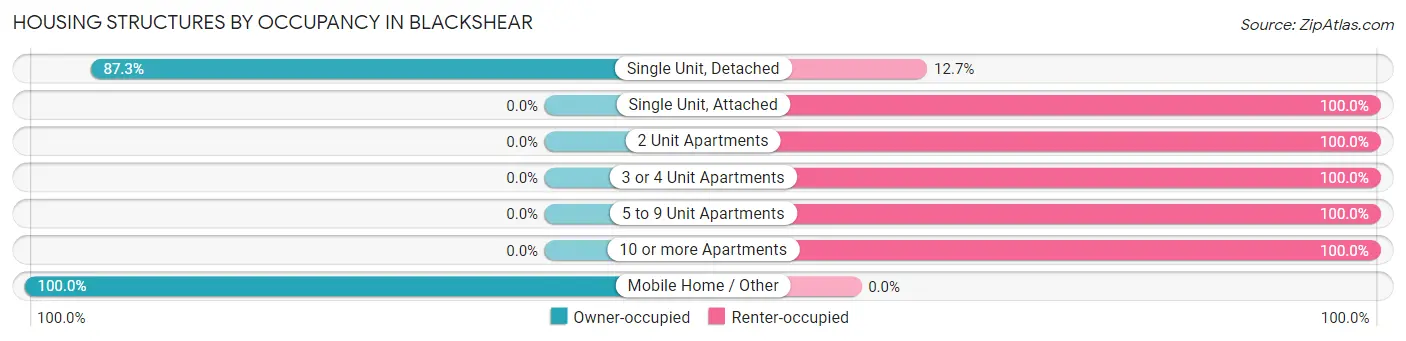
| Structure Type | Owner-occupied | Renter-occupied |
| Single Unit, Detached | 1,161 (87.3%) | 169 (12.7%) |
| Single Unit, Attached | 0 (0.0%) | 35 (100.0%) |
| 2 Unit Apartments | 0 (0.0%) | 11 (100.0%) |
| 3 or 4 Unit Apartments | 0 (0.0%) | 87 (100.0%) |
| 5 to 9 Unit Apartments | 0 (0.0%) | 99 (100.0%) |
| 10 or more Apartments | 0 (0.0%) | 48 (100.0%) |
| Mobile Home / Other | 12 (100.0%) | 0 (0.0%) |
| Total | 1,173 (72.3%) | 449 (27.7%) |
Housing Structures by Number of Rooms in Blackshear
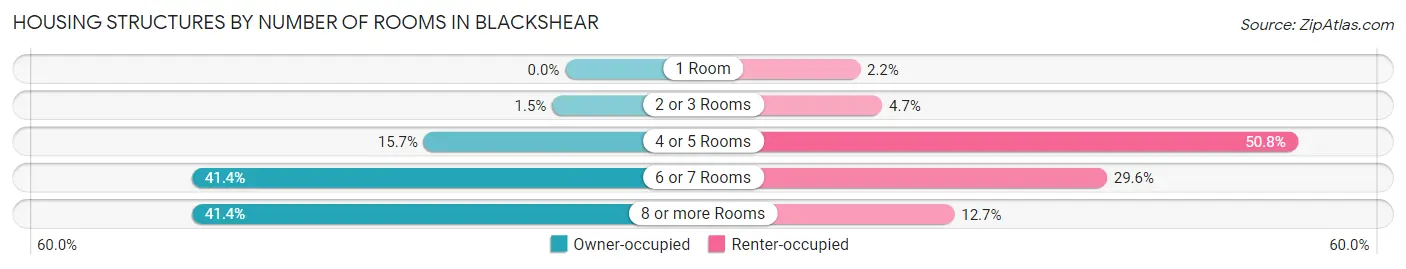
| Number of Rooms | Owner-occupied | Renter-occupied |
| 1 Room | 0 (0.0%) | 10 (2.2%) |
| 2 or 3 Rooms | 17 (1.5%) | 21 (4.7%) |
| 4 or 5 Rooms | 184 (15.7%) | 228 (50.8%) |
| 6 or 7 Rooms | 486 (41.4%) | 133 (29.6%) |
| 8 or more Rooms | 486 (41.4%) | 57 (12.7%) |
| Total | 1,173 (100.0%) | 449 (100.0%) |
Housing Structure by Heating Type in Blackshear
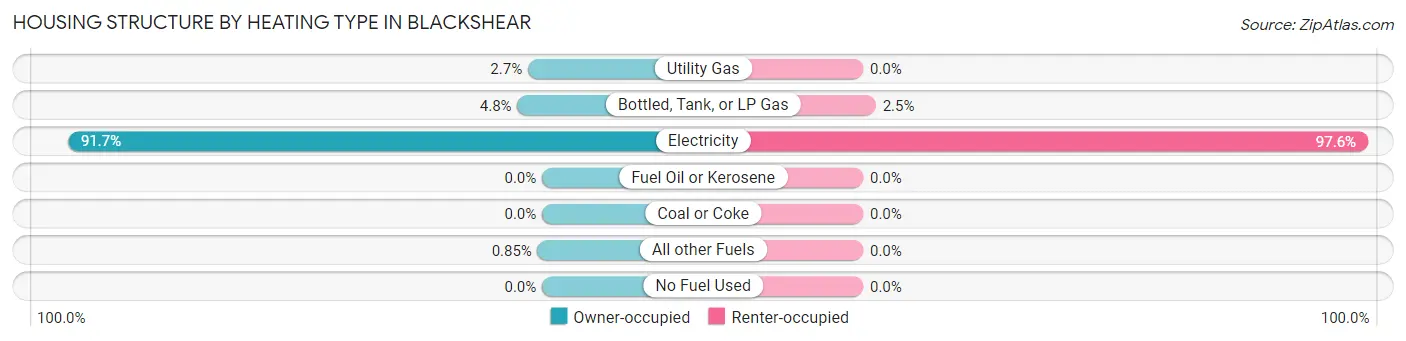
| Heating Type | Owner-occupied | Renter-occupied |
| Utility Gas | 32 (2.7%) | 0 (0.0%) |
| Bottled, Tank, or LP Gas | 56 (4.8%) | 11 (2.5%) |
| Electricity | 1,075 (91.6%) | 438 (97.6%) |
| Fuel Oil or Kerosene | 0 (0.0%) | 0 (0.0%) |
| Coal or Coke | 0 (0.0%) | 0 (0.0%) |
| All other Fuels | 10 (0.9%) | 0 (0.0%) |
| No Fuel Used | 0 (0.0%) | 0 (0.0%) |
| Total | 1,173 (100.0%) | 449 (100.0%) |
Household Vehicle Usage in Blackshear
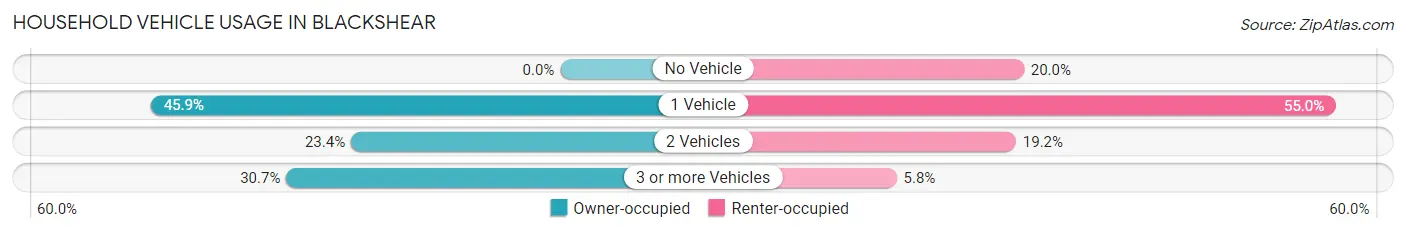
| Vehicles per Household | Owner-occupied | Renter-occupied |
| No Vehicle | 0 (0.0%) | 90 (20.0%) |
| 1 Vehicle | 538 (45.9%) | 247 (55.0%) |
| 2 Vehicles | 275 (23.4%) | 86 (19.2%) |
| 3 or more Vehicles | 360 (30.7%) | 26 (5.8%) |
| Total | 1,173 (100.0%) | 449 (100.0%) |
Real Estate & Mortgages in Blackshear
Real Estate and Mortgage Overview in Blackshear
| Characteristic | Without Mortgage | With Mortgage |
| Housing Units | 633 | 540 |
| Median Property Value | $99,200 | $151,100 |
| Median Household Income | $34,344 | $93 |
| Monthly Housing Costs | $349 | $0 |
| Real Estate Taxes | $1,614 | $8 |
Property Value by Mortgage Status in Blackshear
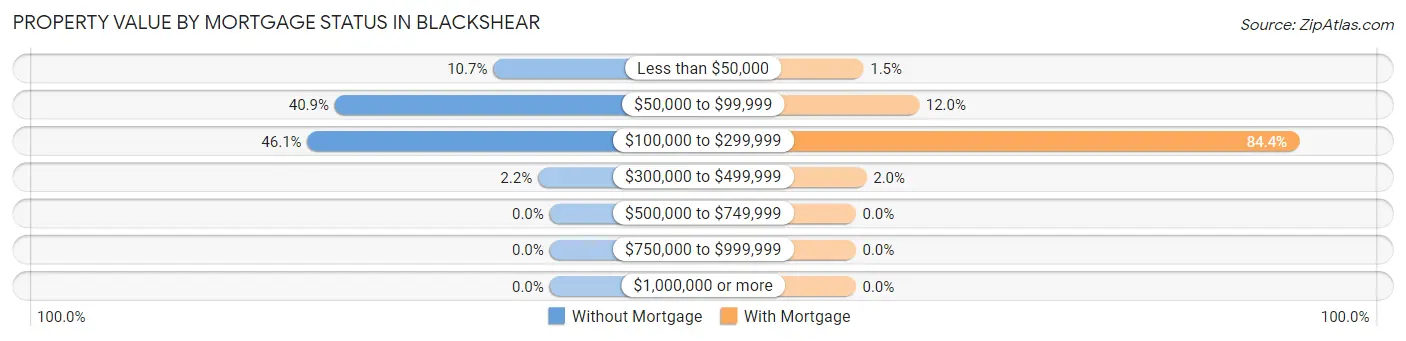
| Property Value | Without Mortgage | With Mortgage |
| Less than $50,000 | 68 (10.7%) | 8 (1.5%) |
| $50,000 to $99,999 | 259 (40.9%) | 65 (12.0%) |
| $100,000 to $299,999 | 292 (46.1%) | 456 (84.4%) |
| $300,000 to $499,999 | 14 (2.2%) | 11 (2.0%) |
| $500,000 to $749,999 | 0 (0.0%) | 0 (0.0%) |
| $750,000 to $999,999 | 0 (0.0%) | 0 (0.0%) |
| $1,000,000 or more | 0 (0.0%) | 0 (0.0%) |
| Total | 633 (100.0%) | 540 (100.0%) |
Household Income by Mortgage Status in Blackshear
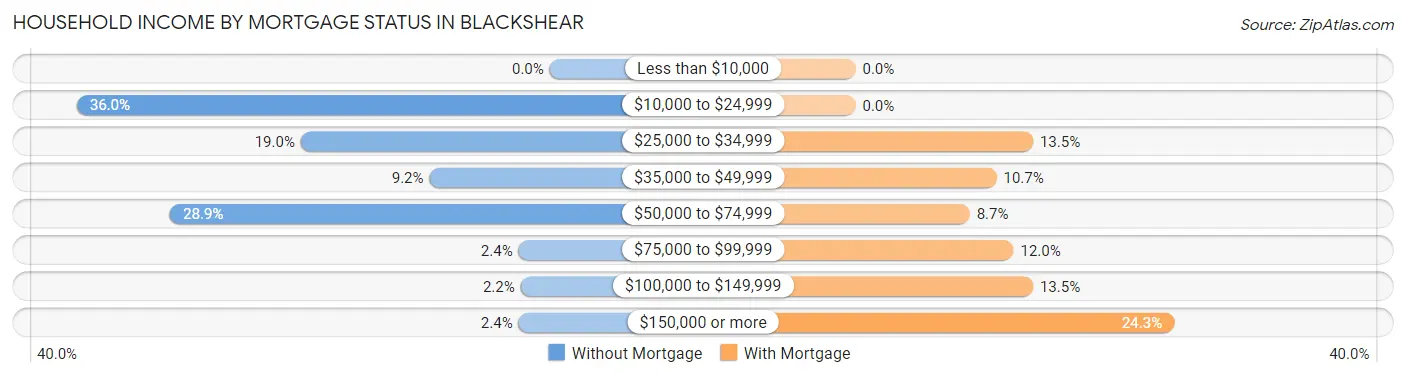
| Household Income | Without Mortgage | With Mortgage |
| Less than $10,000 | 0 (0.0%) | 0 (0.0%) |
| $10,000 to $24,999 | 228 (36.0%) | 0 (0.0%) |
| $25,000 to $34,999 | 120 (19.0%) | 73 (13.5%) |
| $35,000 to $49,999 | 58 (9.2%) | 58 (10.7%) |
| $50,000 to $74,999 | 183 (28.9%) | 47 (8.7%) |
| $75,000 to $99,999 | 15 (2.4%) | 65 (12.0%) |
| $100,000 to $149,999 | 14 (2.2%) | 73 (13.5%) |
| $150,000 or more | 15 (2.4%) | 131 (24.3%) |
| Total | 633 (100.0%) | 540 (100.0%) |
Property Value to Household Income Ratio in Blackshear
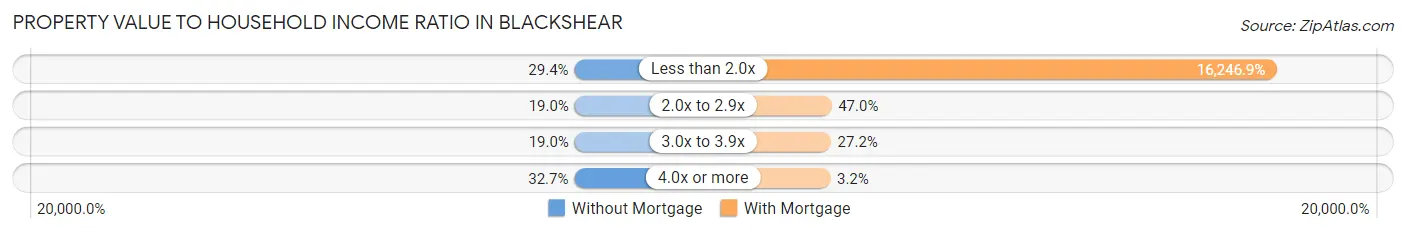
| Value-to-Income Ratio | Without Mortgage | With Mortgage |
| Less than 2.0x | 186 (29.4%) | 87,733 (16,246.9%) |
| 2.0x to 2.9x | 120 (19.0%) | 254 (47.0%) |
| 3.0x to 3.9x | 120 (19.0%) | 147 (27.2%) |
| 4.0x or more | 207 (32.7%) | 17 (3.2%) |
| Total | 633 (100.0%) | 540 (100.0%) |
Real Estate Taxes by Mortgage Status in Blackshear
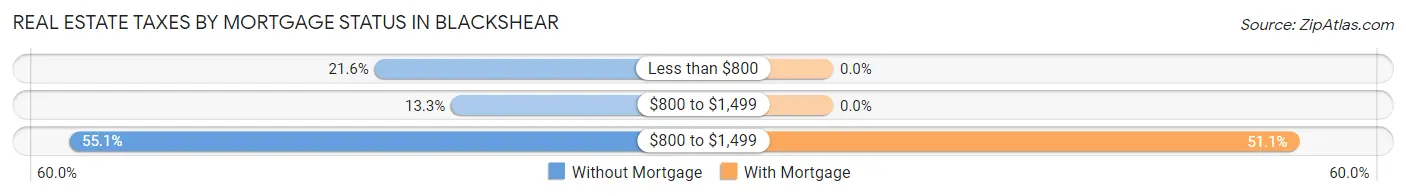
| Property Taxes | Without Mortgage | With Mortgage |
| Less than $800 | 137 (21.6%) | 0 (0.0%) |
| $800 to $1,499 | 84 (13.3%) | 0 (0.0%) |
| $800 to $1,499 | 349 (55.1%) | 276 (51.1%) |
| Total | 633 (100.0%) | 540 (100.0%) |
Health & Disability in Blackshear
Health Insurance Coverage by Age in Blackshear
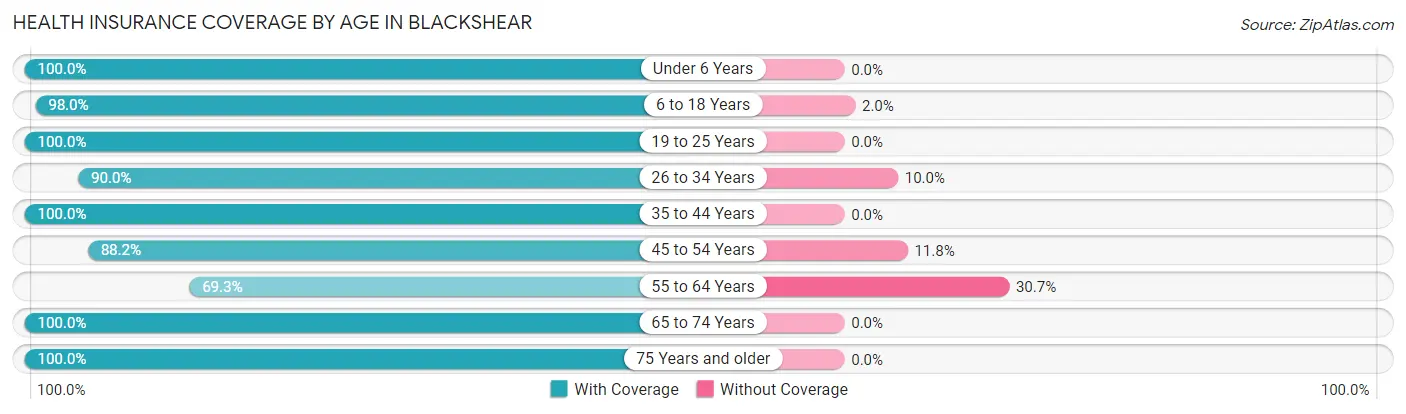
| Age Bracket | With Coverage | Without Coverage |
| Under 6 Years | 191 (100.0%) | 0 (0.0%) |
| 6 to 18 Years | 392 (98.0%) | 8 (2.0%) |
| 19 to 25 Years | 171 (100.0%) | 0 (0.0%) |
| 26 to 34 Years | 316 (90.0%) | 35 (10.0%) |
| 35 to 44 Years | 322 (100.0%) | 0 (0.0%) |
| 45 to 54 Years | 554 (88.2%) | 74 (11.8%) |
| 55 to 64 Years | 388 (69.3%) | 172 (30.7%) |
| 65 to 74 Years | 291 (100.0%) | 0 (0.0%) |
| 75 Years and older | 457 (100.0%) | 0 (0.0%) |
| Total | 3,082 (91.4%) | 289 (8.6%) |
Health Insurance Coverage by Citizenship Status in Blackshear
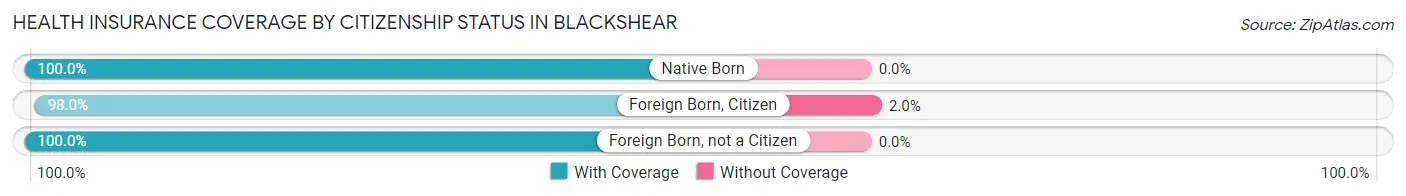
| Citizenship Status | With Coverage | Without Coverage |
| Native Born | 191 (100.0%) | 0 (0.0%) |
| Foreign Born, Citizen | 392 (98.0%) | 8 (2.0%) |
| Foreign Born, not a Citizen | 171 (100.0%) | 0 (0.0%) |
Health Insurance Coverage by Household Income in Blackshear
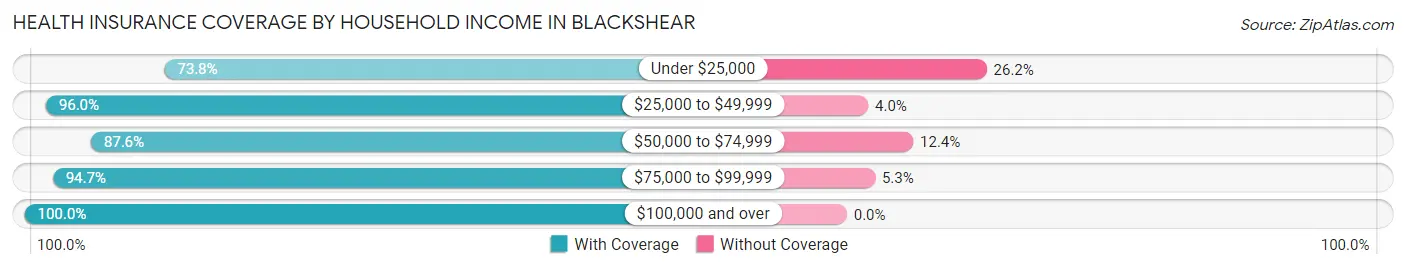
| Household Income | With Coverage | Without Coverage |
| Under $25,000 | 479 (73.8%) | 170 (26.2%) |
| $25,000 to $49,999 | 794 (96.0%) | 33 (4.0%) |
| $50,000 to $74,999 | 402 (87.6%) | 57 (12.4%) |
| $75,000 to $99,999 | 521 (94.7%) | 29 (5.3%) |
| $100,000 and over | 875 (100.0%) | 0 (0.0%) |
Public vs Private Health Insurance Coverage by Age in Blackshear
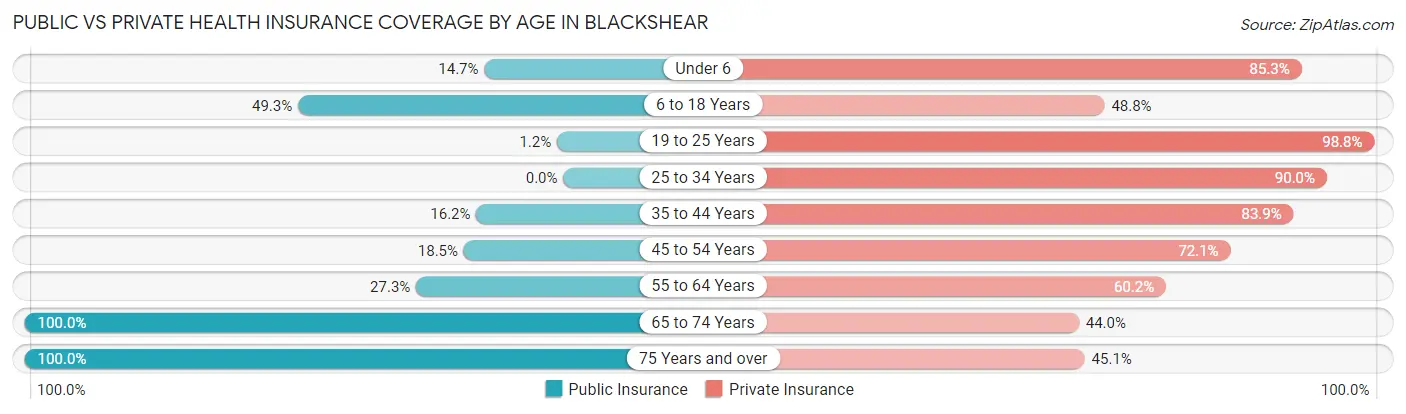
| Age Bracket | Public Insurance | Private Insurance |
| Under 6 | 28 (14.7%) | 163 (85.3%) |
| 6 to 18 Years | 197 (49.2%) | 195 (48.7%) |
| 19 to 25 Years | 2 (1.2%) | 169 (98.8%) |
| 25 to 34 Years | 0 (0.0%) | 316 (90.0%) |
| 35 to 44 Years | 52 (16.2%) | 270 (83.9%) |
| 45 to 54 Years | 116 (18.5%) | 453 (72.1%) |
| 55 to 64 Years | 153 (27.3%) | 337 (60.2%) |
| 65 to 74 Years | 291 (100.0%) | 128 (44.0%) |
| 75 Years and over | 457 (100.0%) | 206 (45.1%) |
| Total | 1,296 (38.5%) | 2,237 (66.4%) |
Disability Status by Sex by Age in Blackshear
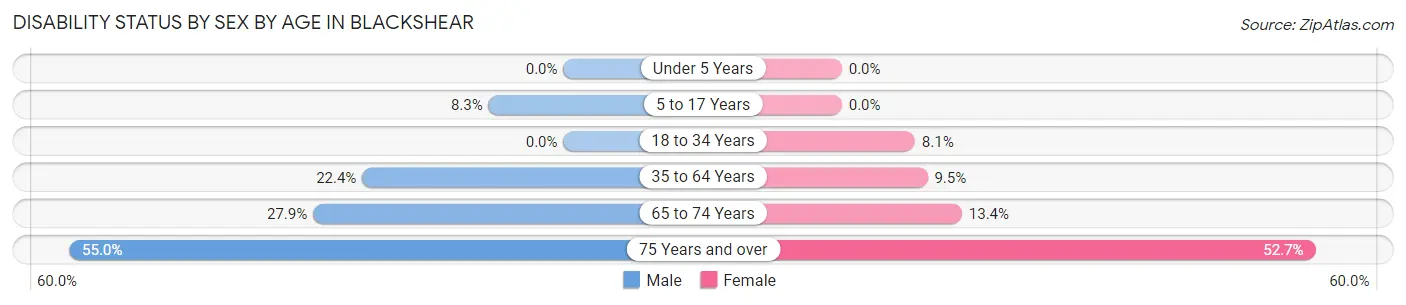
| Age Bracket | Male | Female |
| Under 5 Years | 0 (0.0%) | 0 (0.0%) |
| 5 to 17 Years | 21 (8.3%) | 0 (0.0%) |
| 18 to 34 Years | 0 (0.0%) | 25 (8.1%) |
| 35 to 64 Years | 155 (22.4%) | 78 (9.5%) |
| 65 to 74 Years | 29 (27.9%) | 25 (13.4%) |
| 75 Years and over | 71 (55.0%) | 173 (52.7%) |
Disability Class by Sex by Age in Blackshear
Disability Class: Hearing Difficulty
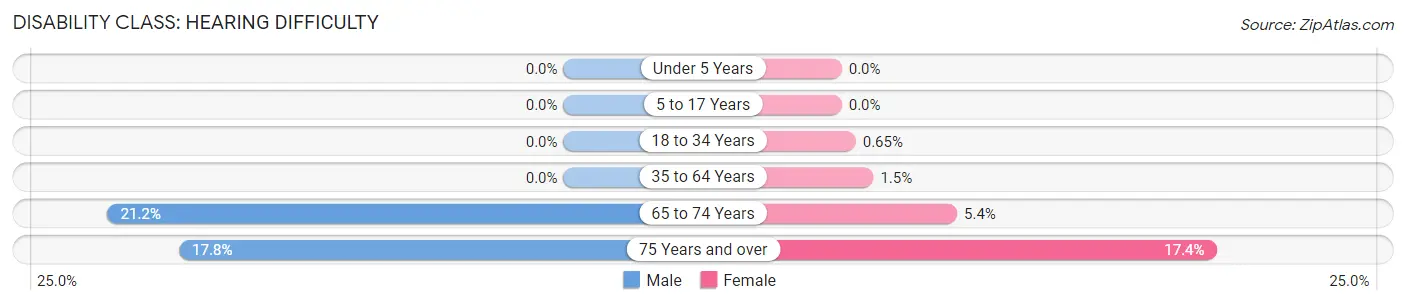
| Age Bracket | Male | Female |
| Under 5 Years | 0 (0.0%) | 0 (0.0%) |
| 5 to 17 Years | 0 (0.0%) | 0 (0.0%) |
| 18 to 34 Years | 0 (0.0%) | 2 (0.6%) |
| 35 to 64 Years | 0 (0.0%) | 12 (1.5%) |
| 65 to 74 Years | 22 (21.1%) | 10 (5.3%) |
| 75 Years and over | 23 (17.8%) | 57 (17.4%) |
Disability Class: Vision Difficulty
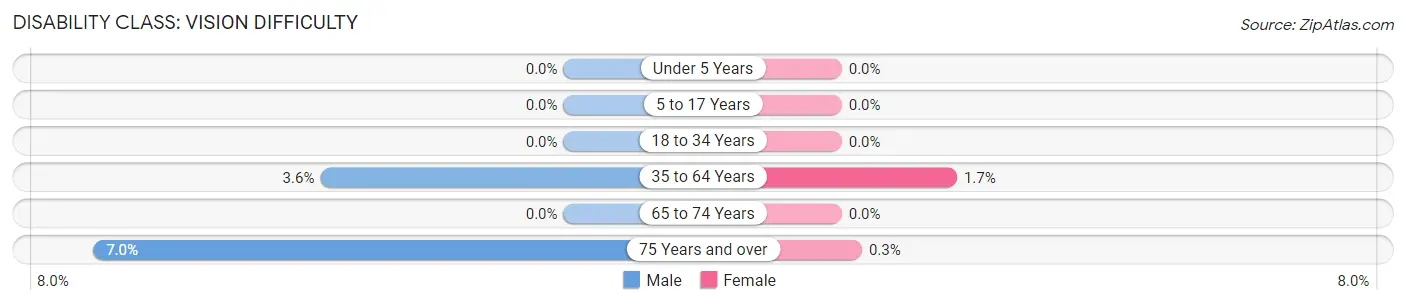
| Age Bracket | Male | Female |
| Under 5 Years | 0 (0.0%) | 0 (0.0%) |
| 5 to 17 Years | 0 (0.0%) | 0 (0.0%) |
| 18 to 34 Years | 0 (0.0%) | 0 (0.0%) |
| 35 to 64 Years | 25 (3.6%) | 14 (1.7%) |
| 65 to 74 Years | 0 (0.0%) | 0 (0.0%) |
| 75 Years and over | 9 (7.0%) | 1 (0.3%) |
Disability Class: Cognitive Difficulty
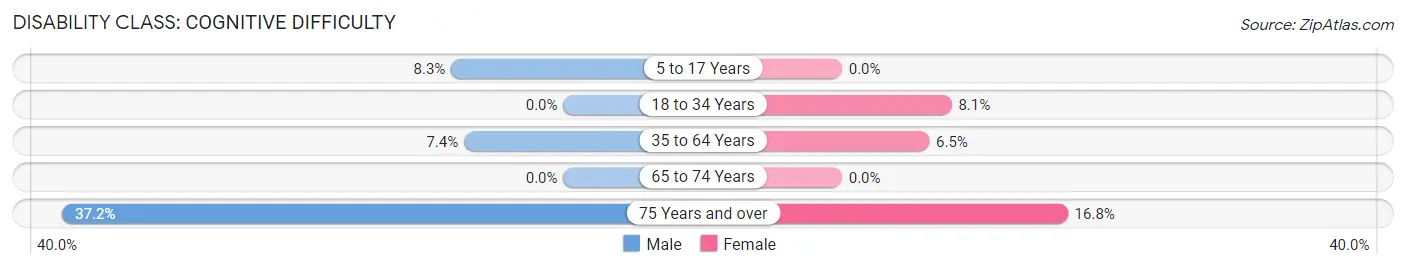
| Age Bracket | Male | Female |
| 5 to 17 Years | 21 (8.3%) | 0 (0.0%) |
| 18 to 34 Years | 0 (0.0%) | 25 (8.1%) |
| 35 to 64 Years | 51 (7.4%) | 53 (6.5%) |
| 65 to 74 Years | 0 (0.0%) | 0 (0.0%) |
| 75 Years and over | 48 (37.2%) | 55 (16.8%) |
Disability Class: Ambulatory Difficulty
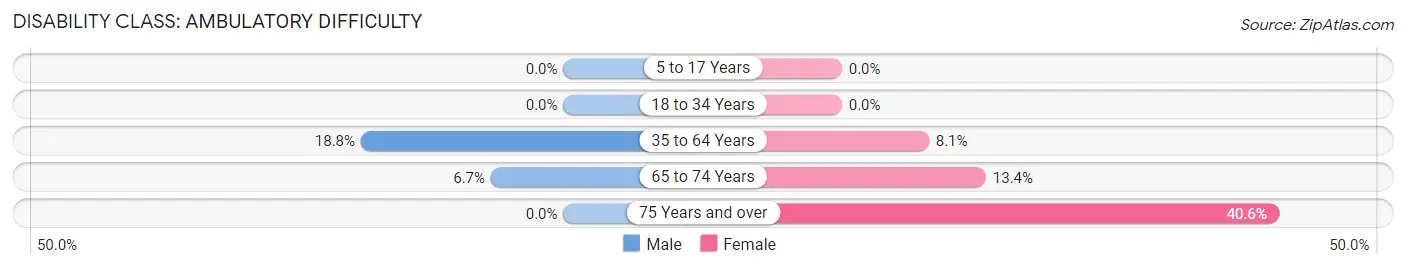
| Age Bracket | Male | Female |
| 5 to 17 Years | 0 (0.0%) | 0 (0.0%) |
| 18 to 34 Years | 0 (0.0%) | 0 (0.0%) |
| 35 to 64 Years | 130 (18.8%) | 66 (8.1%) |
| 65 to 74 Years | 7 (6.7%) | 25 (13.4%) |
| 75 Years and over | 0 (0.0%) | 133 (40.6%) |
Disability Class: Self-Care Difficulty
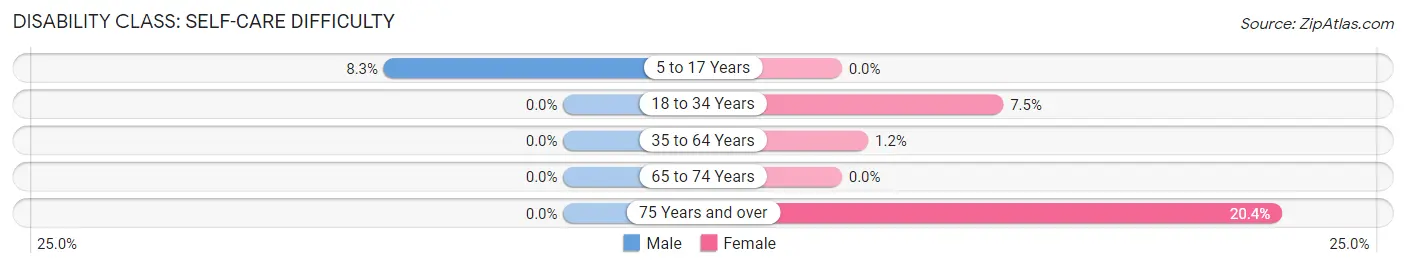
| Age Bracket | Male | Female |
| 5 to 17 Years | 21 (8.3%) | 0 (0.0%) |
| 18 to 34 Years | 0 (0.0%) | 23 (7.5%) |
| 35 to 64 Years | 0 (0.0%) | 10 (1.2%) |
| 65 to 74 Years | 0 (0.0%) | 0 (0.0%) |
| 75 Years and over | 0 (0.0%) | 67 (20.4%) |
Technology Access in Blackshear
Computing Device Access in Blackshear
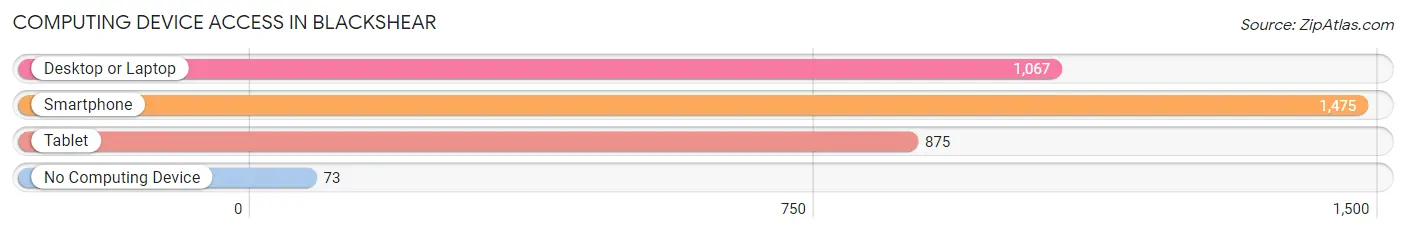
| Device Type | # Households | % Households |
| Desktop or Laptop | 1,067 | 65.8% |
| Smartphone | 1,475 | 90.9% |
| Tablet | 875 | 53.9% |
| No Computing Device | 73 | 4.5% |
| Total | 1,622 | 100.0% |
Internet Access in Blackshear
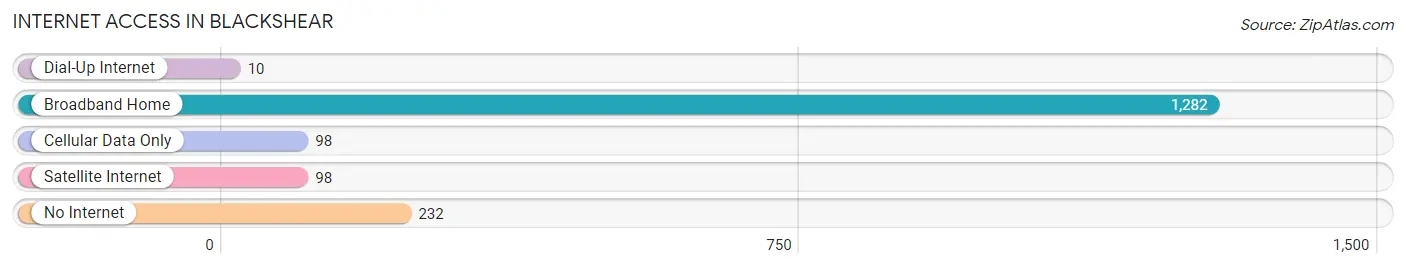
| Internet Type | # Households | % Households |
| Dial-Up Internet | 10 | 0.6% |
| Broadband Home | 1,282 | 79.0% |
| Cellular Data Only | 98 | 6.0% |
| Satellite Internet | 98 | 6.0% |
| No Internet | 232 | 14.3% |
| Total | 1,622 | 100.0% |
Blackshear Summary
Blackshear, Georgia is a small city located in Pierce County, Georgia. It is situated on the banks of the Satilla River, about 30 miles south of the Georgia-Florida border. The city has a population of approximately 3,000 people and is the county seat of Pierce County.
History
Blackshear was founded in 1854 by a group of settlers from South Carolina. The town was named after General David Blackshear, a Revolutionary War hero who fought in the Battle of Kettle Creek. The town was incorporated in 1872 and has remained a small, rural community ever since.
The town was an important stop on the Atlantic Coast Line Railroad, which ran through the area in the late 19th century. The railroad brought economic growth to the area, and the town became a center for cotton production and timber harvesting.
In the early 20th century, the town was home to a number of prominent African-American businesses, including a hotel, a barber shop, and a restaurant. The town was also home to a number of churches, including the First African Baptist Church, which was founded in 1867.
Geography
Blackshear is located in the southeastern corner of Georgia, about 30 miles south of the Georgia-Florida border. The city is situated on the banks of the Satilla River, which flows through the area. The city is surrounded by a number of small towns and rural communities, including Waycross, Patterson, and Hoboken.
The city has a total area of 4.2 square miles, all of which is land. The city has a humid subtropical climate, with hot, humid summers and mild winters.
Economy
The economy of Blackshear is largely based on agriculture and timber production. The city is home to a number of farms, which produce a variety of crops, including cotton, corn, soybeans, and peanuts. The city is also home to a number of timber companies, which harvest timber from the surrounding forests.
The city is also home to a number of small businesses, including restaurants, retail stores, and service providers. The city is also home to a number of manufacturing companies, which produce a variety of products, including furniture, clothing, and paper products.
Demographics
As of the 2010 census, the population of Blackshear was 3,000. The racial makeup of the city was 79.3% White, 17.2% African American, 0.3% Native American, 0.7% Asian, 0.1% Pacific Islander, and 2.4% from other races. Hispanic or Latino of any race were 2.7% of the population.
The median household income in Blackshear was $30,938, and the median family income was $37,813. The per capita income in the city was $15,945. About 17.2% of the population was below the poverty line.
Blackshear is a small, rural city with a rich history and a diverse economy. The city is home to a number of farms, timber companies, and small businesses, and is a popular destination for tourists and outdoor enthusiasts. The city is also home to a number of churches, schools, and other community organizations, which provide a variety of services to the residents of the city.
Common Questions
What is Per Capita Income in Blackshear?
Per Capita income in Blackshear is $27,714.
What is the Median Family Income in Blackshear?
Median Family Income in Blackshear is $58,163.
What is the Median Household income in Blackshear?
Median Household Income in Blackshear is $34,963.
What is Income or Wage Gap in Blackshear?
Income or Wage Gap in Blackshear is 3.2%.
Women in Blackshear earn 96.8 cents for every dollar earned by a man.
What is Inequality or Gini Index in Blackshear?
Inequality or Gini Index in Blackshear is 0.42.
What is the Total Population of Blackshear?
Total Population of Blackshear is 3,521.
What is the Total Male Population of Blackshear?
Total Male Population of Blackshear is 1,613.
What is the Total Female Population of Blackshear?
Total Female Population of Blackshear is 1,908.
What is the Ratio of Males per 100 Females in Blackshear?
There are 84.54 Males per 100 Females in Blackshear.
What is the Ratio of Females per 100 Males in Blackshear?
There are 118.29 Females per 100 Males in Blackshear.
What is the Median Population Age in Blackshear?
Median Population Age in Blackshear is 47.5 Years.
What is the Average Family Size in Blackshear
Average Family Size in Blackshear is 2.6 People.
What is the Average Household Size in Blackshear
Average Household Size in Blackshear is 2.1 People.
How Large is the Labor Force in Blackshear?
There are 1,521 People in the Labor Forcein in Blackshear.
What is the Percentage of People in the Labor Force in Blackshear?
50.3% of People are in the Labor Force in Blackshear.
What is the Unemployment Rate in Blackshear?
Unemployment Rate in Blackshear is 3.4%.