Springfield, GA Map & Demographics
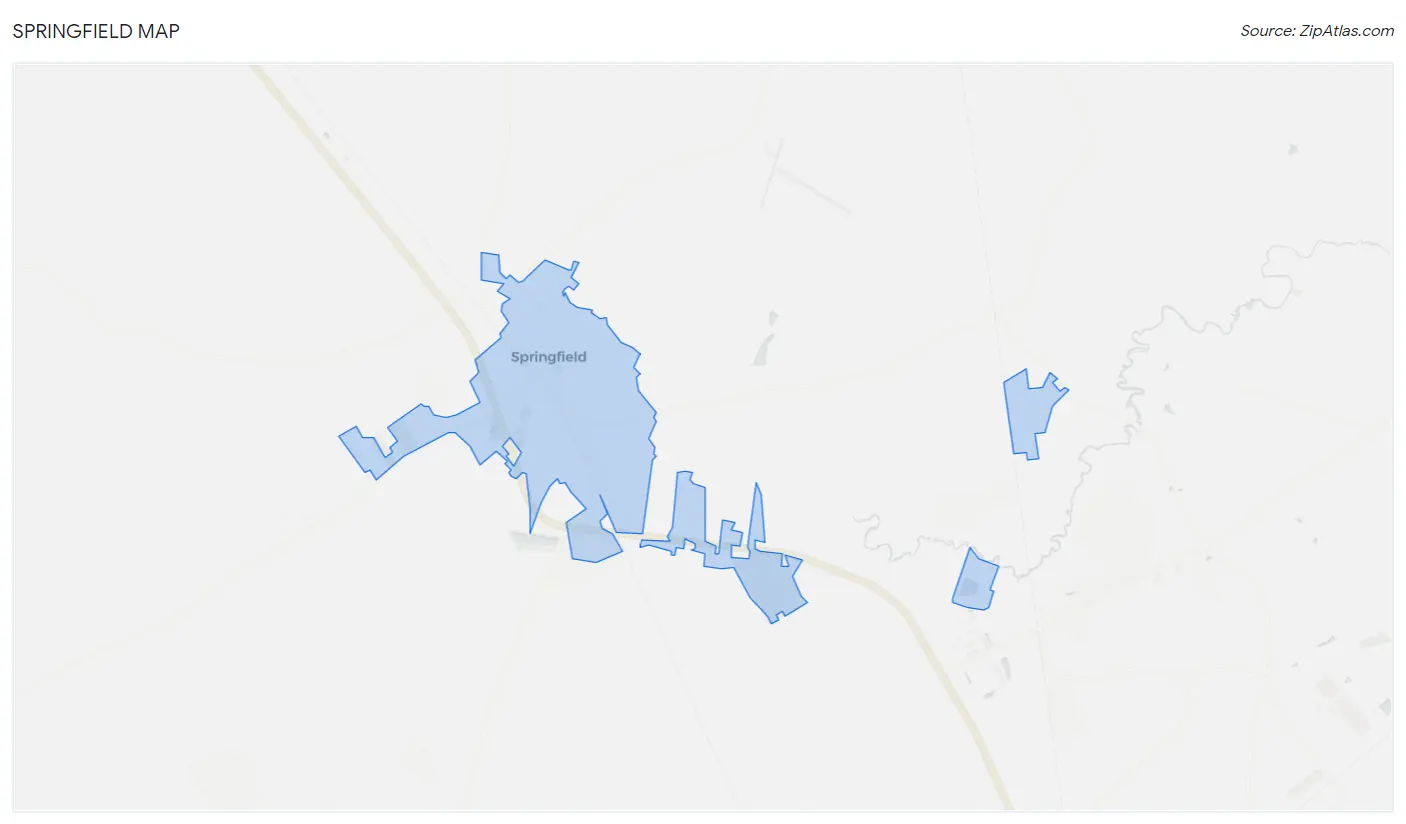
Springfield Map
Springfield Overview
$60,066
PER CAPITA INCOME
$74,250
AVG FAMILY INCOME
$46,936
AVG HOUSEHOLD INCOME
24.4%
WAGE / INCOME GAP [ % ]
75.6¢/ $1
WAGE / INCOME GAP [ $ ]
0.66
INEQUALITY / GINI INDEX
2,753
TOTAL POPULATION
1,406
MALE POPULATION
1,347
FEMALE POPULATION
104.38
MALES / 100 FEMALES
95.80
FEMALES / 100 MALES
32.8
MEDIAN AGE
2.9
AVG FAMILY SIZE
2.2
AVG HOUSEHOLD SIZE
1,440
LABOR FORCE [ PEOPLE ]
64.0%
PERCENT IN LABOR FORCE
1.0%
UNEMPLOYMENT RATE
Springfield Zip Codes
Springfield Area Codes
Income in Springfield
Income Overview in Springfield
Per Capita Income in Springfield is $60,066, while median incomes of families and households are $74,250 and $46,936 respectively.
| Characteristic | Number | Measure |
| Per Capita Income | 2,753 | $60,066 |
| Median Family Income | 672 | $74,250 |
| Mean Family Income | 672 | $178,392 |
| Median Household Income | 1,127 | $46,936 |
| Mean Household Income | 1,127 | $119,398 |
| Income Deficit | 672 | $0 |
| Wage / Income Gap (%) | 2,753 | 24.36% |
| Wage / Income Gap ($) | 2,753 | 75.64¢ per $1 |
| Gini / Inequality Index | 2,753 | 0.66 |
Earnings by Sex in Springfield
Average Earnings in Springfield are $36,608, $44,397 for men and $33,581 for women, a difference of 24.4%.
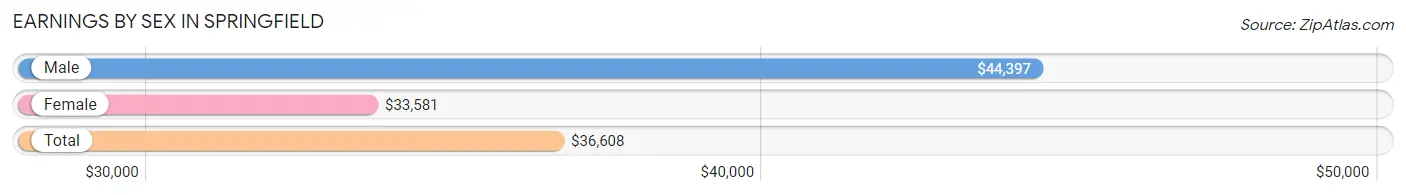
| Sex | Number | Average Earnings |
| Male | 768 (50.5%) | $44,397 |
| Female | 753 (49.5%) | $33,581 |
| Total | 1,521 (100.0%) | $36,608 |
Earnings by Sex by Income Bracket in Springfield
The most common earnings brackets in Springfield are $100,000+ for men (116 | 15.1%) and $30,000 to $34,999 for women (145 | 19.3%).
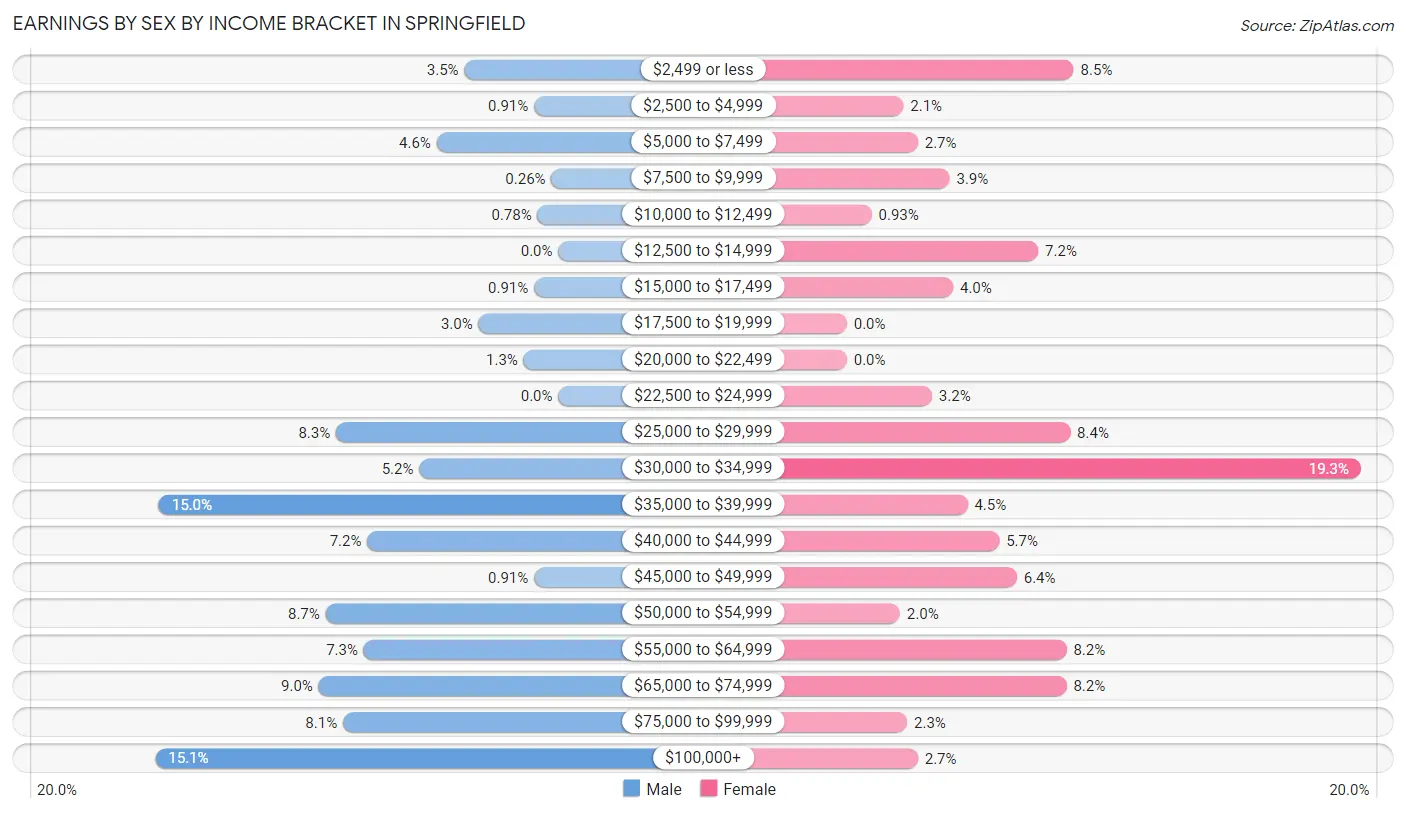
| Income | Male | Female |
| $2,499 or less | 27 (3.5%) | 64 (8.5%) |
| $2,500 to $4,999 | 7 (0.9%) | 16 (2.1%) |
| $5,000 to $7,499 | 35 (4.6%) | 20 (2.7%) |
| $7,500 to $9,999 | 2 (0.3%) | 29 (3.8%) |
| $10,000 to $12,499 | 6 (0.8%) | 7 (0.9%) |
| $12,500 to $14,999 | 0 (0.0%) | 54 (7.2%) |
| $15,000 to $17,499 | 7 (0.9%) | 30 (4.0%) |
| $17,500 to $19,999 | 23 (3.0%) | 0 (0.0%) |
| $20,000 to $22,499 | 10 (1.3%) | 0 (0.0%) |
| $22,500 to $24,999 | 0 (0.0%) | 24 (3.2%) |
| $25,000 to $29,999 | 64 (8.3%) | 63 (8.4%) |
| $30,000 to $34,999 | 40 (5.2%) | 145 (19.3%) |
| $35,000 to $39,999 | 115 (15.0%) | 34 (4.5%) |
| $40,000 to $44,999 | 55 (7.2%) | 43 (5.7%) |
| $45,000 to $49,999 | 7 (0.9%) | 48 (6.4%) |
| $50,000 to $54,999 | 67 (8.7%) | 15 (2.0%) |
| $55,000 to $64,999 | 56 (7.3%) | 62 (8.2%) |
| $65,000 to $74,999 | 69 (9.0%) | 62 (8.2%) |
| $75,000 to $99,999 | 62 (8.1%) | 17 (2.3%) |
| $100,000+ | 116 (15.1%) | 20 (2.7%) |
| Total | 768 (100.0%) | 753 (100.0%) |
Earnings by Sex by Educational Attainment in Springfield
Average earnings in Springfield are $50,844 for men and $35,880 for women, a difference of 29.4%. Men with an educational attainment of college or associate's degree enjoy the highest average annual earnings of $68,667, while those with high school diploma education earn the least with $40,337. Women with an educational attainment of bachelor's degree earn the most with the average annual earnings of $57,813, while those with college or associate's degree education have the smallest earnings of $32,938.
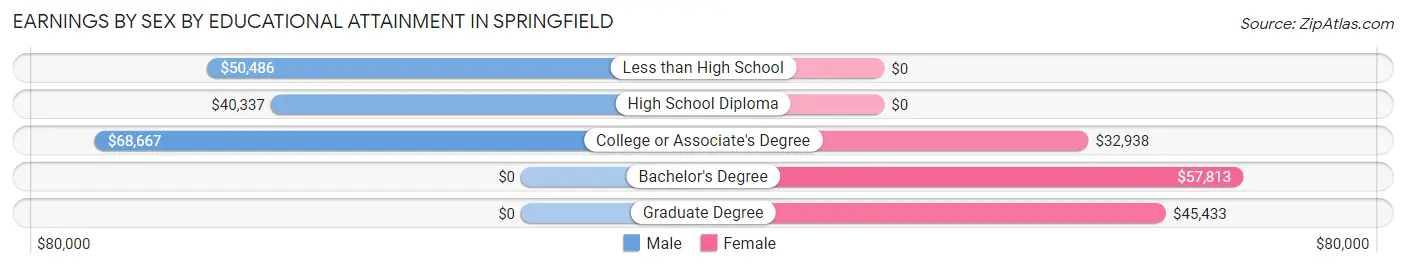
| Educational Attainment | Male Income | Female Income |
| Less than High School | $50,486 | $0 |
| High School Diploma | $40,337 | $0 |
| College or Associate's Degree | $68,667 | $32,938 |
| Bachelor's Degree | - | - |
| Graduate Degree | - | - |
| Total | $50,844 | $35,880 |
Family Income in Springfield
Family Income Brackets in Springfield
According to the Springfield family income data, there are 179 families falling into the $100,000 to $149,999 income range, which is the most common income bracket and makes up 26.6% of all families.
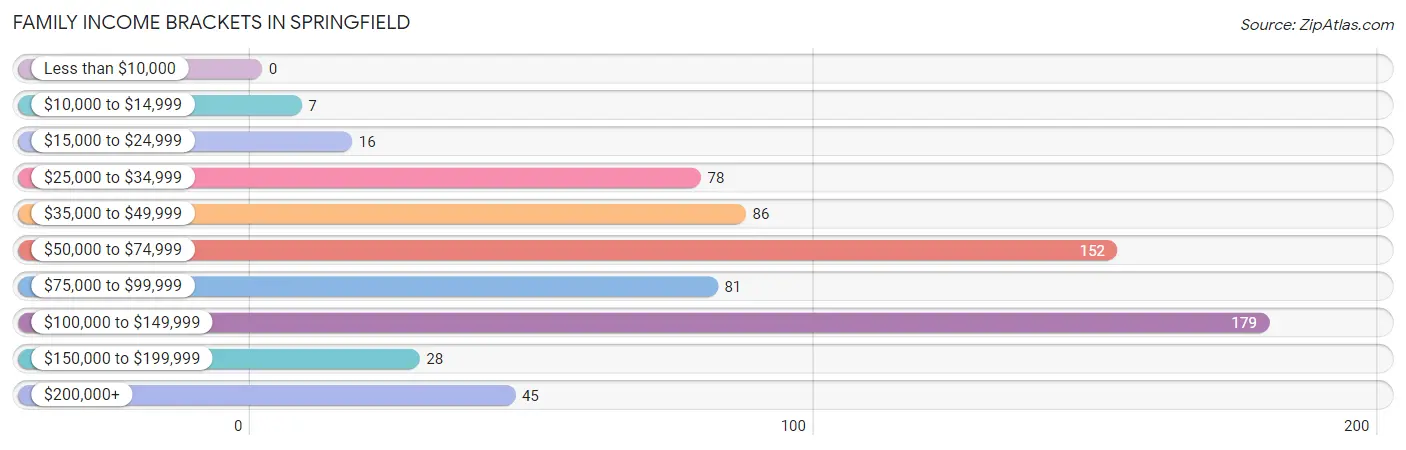
| Income Bracket | # Families | % Families |
| Less than $10,000 | 0 | 0.0% |
| $10,000 to $14,999 | 7 | 1.0% |
| $15,000 to $24,999 | 16 | 2.4% |
| $25,000 to $34,999 | 78 | 11.6% |
| $35,000 to $49,999 | 86 | 12.8% |
| $50,000 to $74,999 | 152 | 22.6% |
| $75,000 to $99,999 | 81 | 12.1% |
| $100,000 to $149,999 | 179 | 26.6% |
| $150,000 to $199,999 | 28 | 4.2% |
| $200,000+ | 45 | 6.7% |
Family Income by Famaliy Size in Springfield
3-person families (162 | 24.1%) account for the highest median family income in Springfield with $100,658 per family, while 3-person families (162 | 24.1%) have the highest median income of $33,553 per family member.
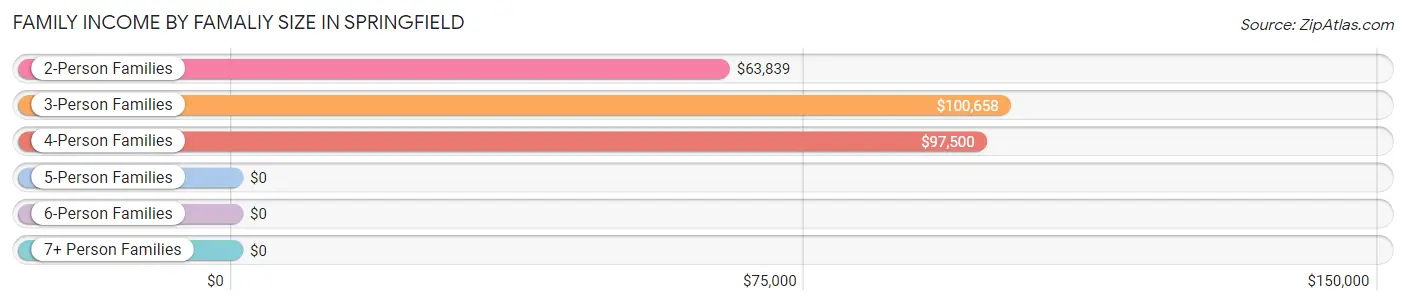
| Income Bracket | # Families | Median Income |
| 2-Person Families | 396 (58.9%) | $63,839 |
| 3-Person Families | 162 (24.1%) | $100,658 |
| 4-Person Families | 80 (11.9%) | $97,500 |
| 5-Person Families | 28 (4.2%) | $0 |
| 6-Person Families | 6 (0.9%) | $0 |
| 7+ Person Families | 0 (0.0%) | $0 |
| Total | 672 (100.0%) | $74,250 |
Family Income by Number of Earners in Springfield
The median family income in Springfield is $74,250, with families comprising 3+ earners (31) having the highest median family income of $133,315, while families with 1 earner (314) have the lowest median family income of $59,286, accounting for 4.6% and 46.7% of families, respectively.
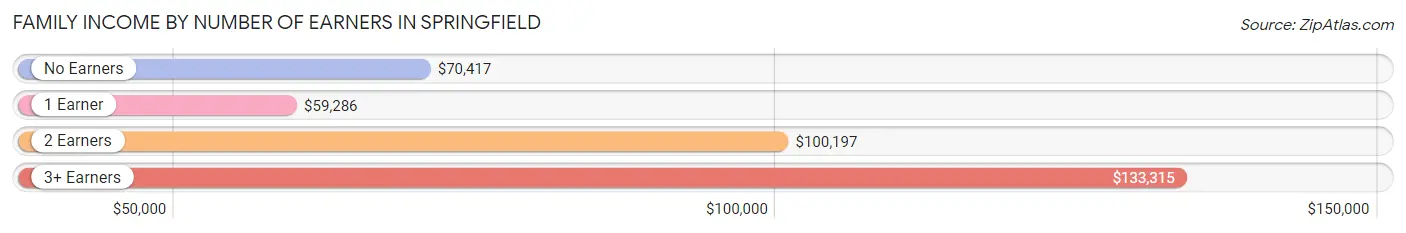
| Number of Earners | # Families | Median Income |
| No Earners | 38 (5.7%) | $70,417 |
| 1 Earner | 314 (46.7%) | $59,286 |
| 2 Earners | 289 (43.0%) | $100,197 |
| 3+ Earners | 31 (4.6%) | $133,315 |
| Total | 672 (100.0%) | $74,250 |
Household Income in Springfield
Household Income Brackets in Springfield
With 215 households falling in the category, the $25,000 to $34,999 income range is the most frequent in Springfield, accounting for 19.1% of all households. In contrast, only 28 households (2.5%) fall into the $150,000 to $199,999 income bracket, making it the least populous group.
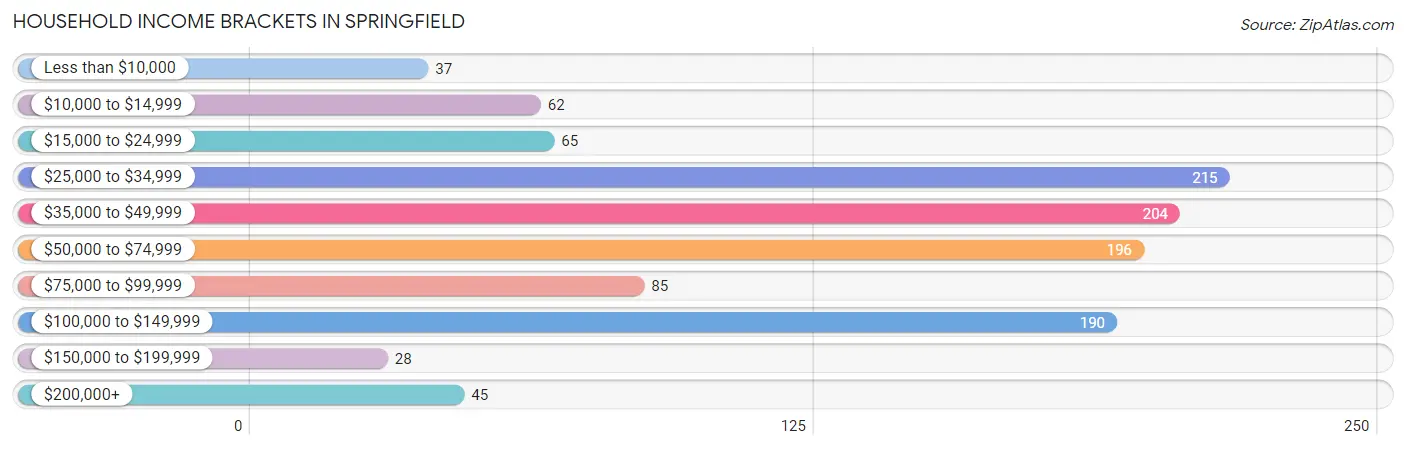
| Income Bracket | # Households | % Households |
| Less than $10,000 | 37 | 3.3% |
| $10,000 to $14,999 | 62 | 5.5% |
| $15,000 to $24,999 | 65 | 5.8% |
| $25,000 to $34,999 | 215 | 19.1% |
| $35,000 to $49,999 | 204 | 18.1% |
| $50,000 to $74,999 | 196 | 17.4% |
| $75,000 to $99,999 | 85 | 7.5% |
| $100,000 to $149,999 | 190 | 16.9% |
| $150,000 to $199,999 | 28 | 2.5% |
| $200,000+ | 45 | 4.0% |
Household Income by Householder Age in Springfield
The median household income in Springfield is $46,936, with the highest median household income of $63,155 found in the 45 to 64 years age bracket for the primary householder. A total of 369 households (32.7%) fall into this category. Meanwhile, the 15 to 24 years age bracket for the primary householder has the lowest median household income of $33,359, with 140 households (12.4%) in this group.
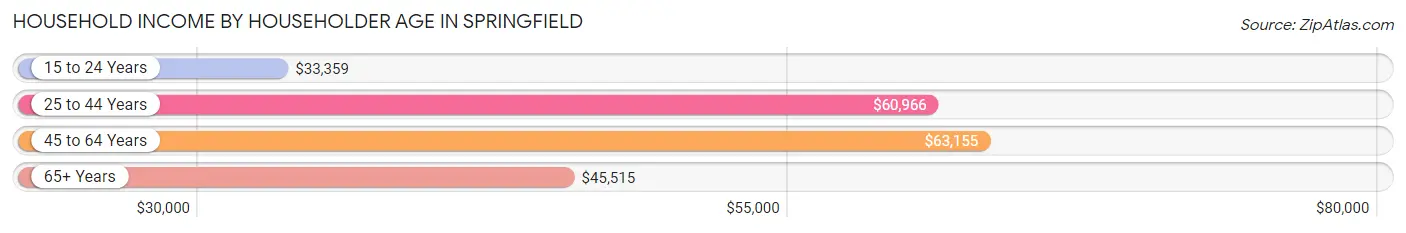
| Income Bracket | # Households | Median Income |
| 15 to 24 Years | 140 (12.4%) | $33,359 |
| 25 to 44 Years | 441 (39.1%) | $60,966 |
| 45 to 64 Years | 369 (32.7%) | $63,155 |
| 65+ Years | 177 (15.7%) | $45,515 |
| Total | 1,127 (100.0%) | $46,936 |
Poverty in Springfield
Income Below Poverty by Sex and Age in Springfield
With 3.5% poverty level for males and 9.1% for females among the residents of Springfield, 65 to 74 year old males and 55 to 64 year old females are the most vulnerable to poverty, with 18 males (31.0%) and 49 females (40.5%) in their respective age groups living below the poverty level.
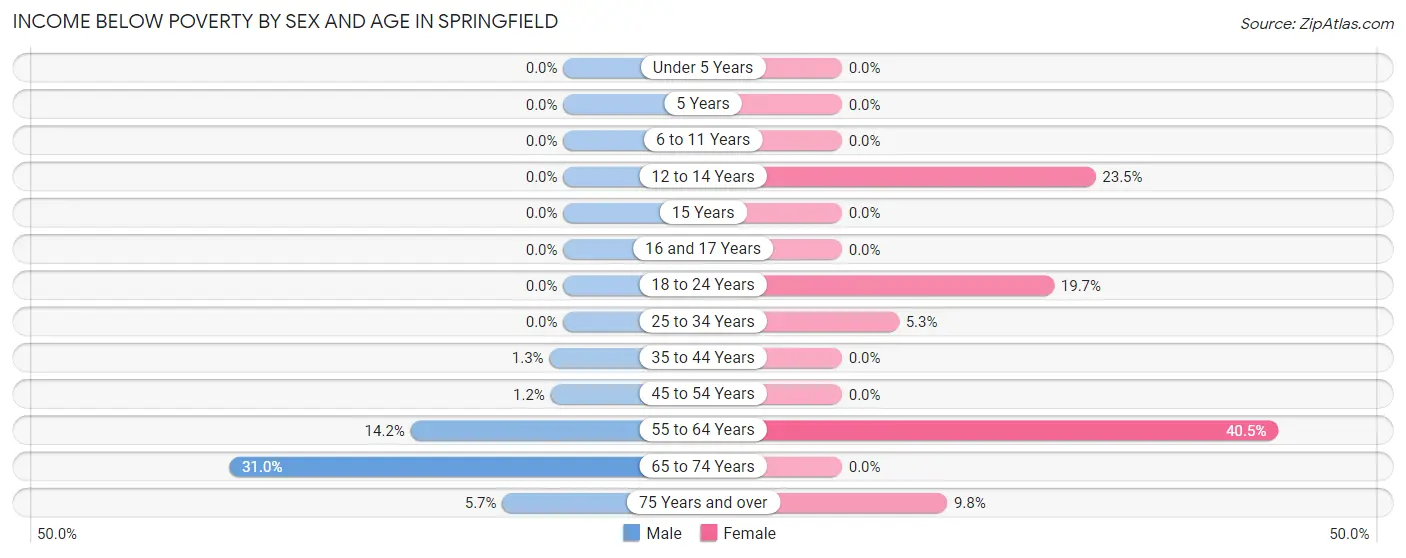
| Age Bracket | Male | Female |
| Under 5 Years | 0 (0.0%) | 0 (0.0%) |
| 5 Years | 0 (0.0%) | 0 (0.0%) |
| 6 to 11 Years | 0 (0.0%) | 0 (0.0%) |
| 12 to 14 Years | 0 (0.0%) | 8 (23.5%) |
| 15 Years | 0 (0.0%) | 0 (0.0%) |
| 16 and 17 Years | 0 (0.0%) | 0 (0.0%) |
| 18 to 24 Years | 0 (0.0%) | 37 (19.7%) |
| 25 to 34 Years | 0 (0.0%) | 14 (5.3%) |
| 35 to 44 Years | 2 (1.3%) | 0 (0.0%) |
| 45 to 54 Years | 2 (1.2%) | 0 (0.0%) |
| 55 to 64 Years | 17 (14.2%) | 49 (40.5%) |
| 65 to 74 Years | 18 (31.0%) | 0 (0.0%) |
| 75 Years and over | 3 (5.7%) | 4 (9.8%) |
| Total | 42 (3.5%) | 112 (9.1%) |
Income Above Poverty by Sex and Age in Springfield
According to the poverty statistics in Springfield, males aged under 5 years and females aged under 5 years are the age groups that are most secure financially, with 100.0% of males and 100.0% of females in these age groups living above the poverty line.
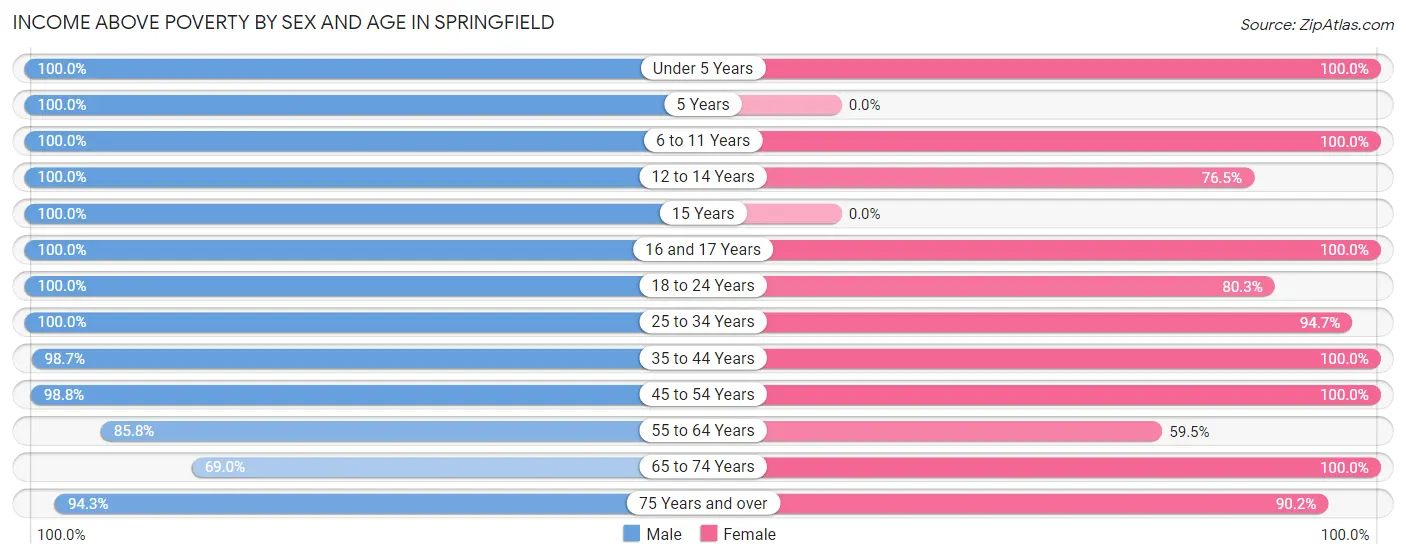
| Age Bracket | Male | Female |
| Under 5 Years | 87 (100.0%) | 92 (100.0%) |
| 5 Years | 8 (100.0%) | 0 (0.0%) |
| 6 to 11 Years | 122 (100.0%) | 58 (100.0%) |
| 12 to 14 Years | 60 (100.0%) | 26 (76.5%) |
| 15 Years | 16 (100.0%) | 0 (0.0%) |
| 16 and 17 Years | 20 (100.0%) | 33 (100.0%) |
| 18 to 24 Years | 112 (100.0%) | 151 (80.3%) |
| 25 to 34 Years | 210 (100.0%) | 251 (94.7%) |
| 35 to 44 Years | 153 (98.7%) | 116 (100.0%) |
| 45 to 54 Years | 167 (98.8%) | 202 (100.0%) |
| 55 to 64 Years | 103 (85.8%) | 72 (59.5%) |
| 65 to 74 Years | 40 (69.0%) | 82 (100.0%) |
| 75 Years and over | 50 (94.3%) | 37 (90.2%) |
| Total | 1,148 (96.5%) | 1,120 (90.9%) |
Income Below Poverty Among Married-Couple Families in Springfield
The poverty statistics for married-couple families in Springfield show that 4.2% or 16 of the total 378 families live below the poverty line. Families with no children have the highest poverty rate of 8.2%, comprising of 16 families. On the other hand, families with 1 or 2 children have the lowest poverty rate of 0.0%, which includes 0 families.
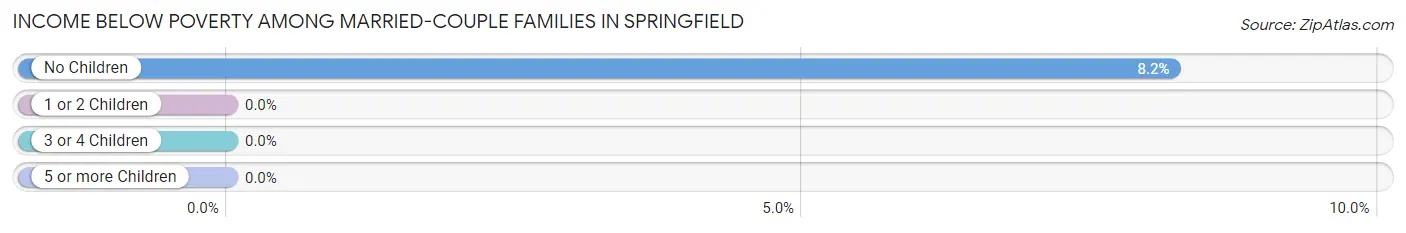
| Children | Above Poverty | Below Poverty |
| No Children | 179 (91.8%) | 16 (8.2%) |
| 1 or 2 Children | 171 (100.0%) | 0 (0.0%) |
| 3 or 4 Children | 12 (100.0%) | 0 (0.0%) |
| 5 or more Children | 0 (0.0%) | 0 (0.0%) |
| Total | 362 (95.8%) | 16 (4.2%) |
Income Below Poverty Among Single-Parent Households in Springfield
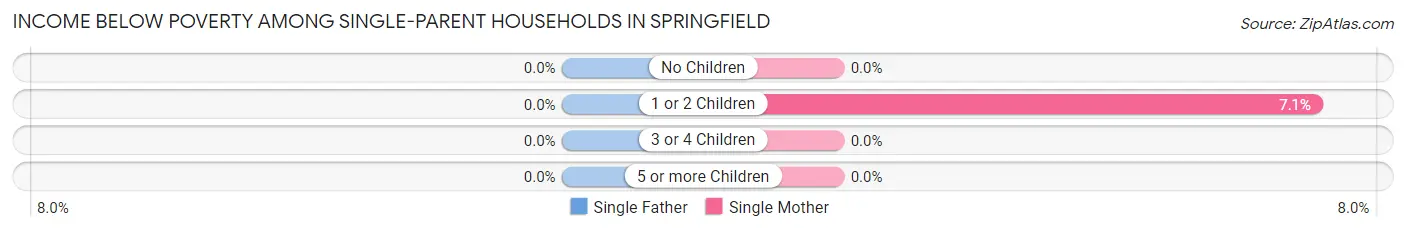
| Children | Single Father | Single Mother |
| No Children | 0 (0.0%) | 0 (0.0%) |
| 1 or 2 Children | 0 (0.0%) | 7 (7.1%) |
| 3 or 4 Children | 0 (0.0%) | 0 (0.0%) |
| 5 or more Children | 0 (0.0%) | 0 (0.0%) |
| Total | 0 (0.0%) | 7 (3.5%) |
Income Below Poverty Among Married-Couple vs Single-Parent Households in Springfield
The poverty data for Springfield shows that 16 of the married-couple family households (4.2%) and 7 of the single-parent households (2.4%) are living below the poverty level. Within the married-couple family households, those with no children have the highest poverty rate, with 16 households (8.2%) falling below the poverty line. Among the single-parent households, those with 1 or 2 children have the highest poverty rate, with 7 household (5.1%) living below poverty.
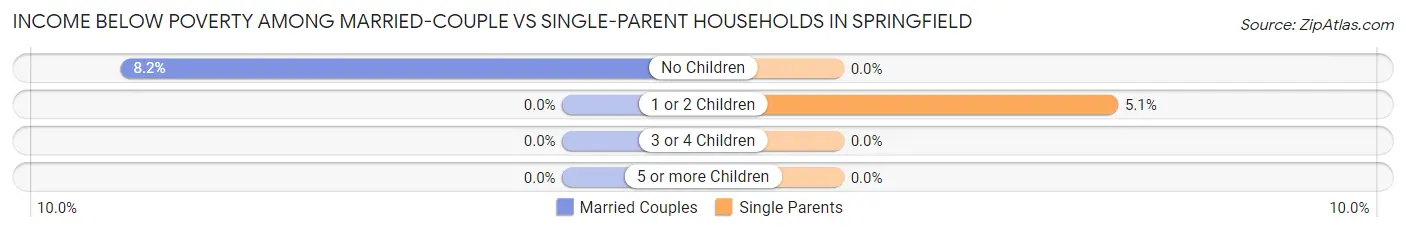
| Children | Married-Couple Families | Single-Parent Households |
| No Children | 16 (8.2%) | 0 (0.0%) |
| 1 or 2 Children | 0 (0.0%) | 7 (5.1%) |
| 3 or 4 Children | 0 (0.0%) | 0 (0.0%) |
| 5 or more Children | 0 (0.0%) | 0 (0.0%) |
| Total | 16 (4.2%) | 7 (2.4%) |
Race in Springfield
The most populous races in Springfield are White / Caucasian (1,989 | 72.3%), Black / African American (626 | 22.7%), and Two or more Races (138 | 5.0%).
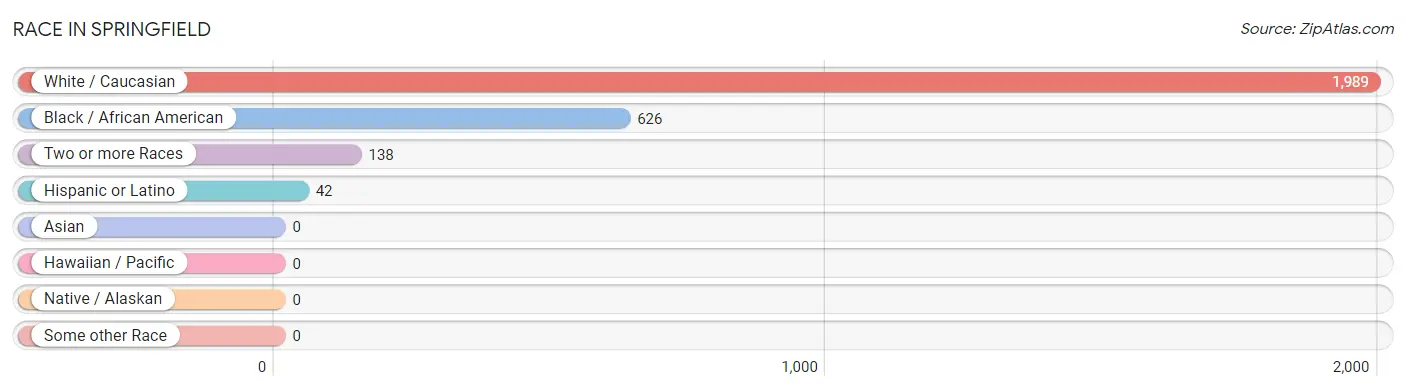
| Race | # Population | % Population |
| Asian | 0 | 0.0% |
| Black / African American | 626 | 22.7% |
| Hawaiian / Pacific | 0 | 0.0% |
| Hispanic or Latino | 42 | 1.5% |
| Native / Alaskan | 0 | 0.0% |
| White / Caucasian | 1,989 | 72.3% |
| Two or more Races | 138 | 5.0% |
| Some other Race | 0 | 0.0% |
| Total | 2,753 | 100.0% |
Ancestry in Springfield
The most populous ancestries reported in Springfield are American (562 | 20.4%), Irish (185 | 6.7%), German (128 | 4.6%), English (84 | 3.0%), and Scotch-Irish (48 | 1.7%), together accounting for 36.6% of all Springfield residents.
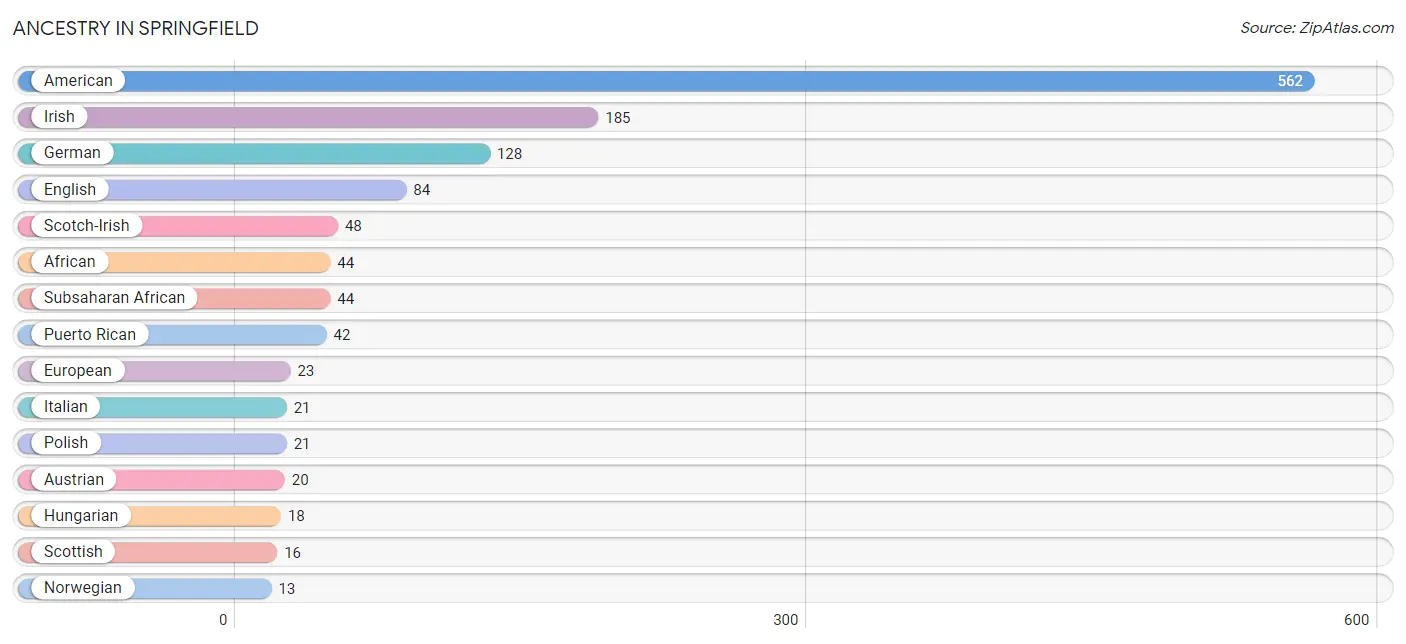
| Ancestry | # Population | % Population |
| African | 44 | 1.6% |
| American | 562 | 20.4% |
| Austrian | 20 | 0.7% |
| Belgian | 8 | 0.3% |
| Canadian | 6 | 0.2% |
| Cherokee | 3 | 0.1% |
| Czech | 3 | 0.1% |
| Czechoslovakian | 4 | 0.2% |
| English | 84 | 3.0% |
| European | 23 | 0.8% |
| Finnish | 10 | 0.4% |
| French | 11 | 0.4% |
| German | 128 | 4.6% |
| Hungarian | 18 | 0.6% |
| Irish | 185 | 6.7% |
| Italian | 21 | 0.8% |
| Korean | 4 | 0.2% |
| Northern European | 6 | 0.2% |
| Norwegian | 13 | 0.5% |
| Polish | 21 | 0.8% |
| Portuguese | 7 | 0.3% |
| Puerto Rican | 42 | 1.5% |
| Russian | 6 | 0.2% |
| Scotch-Irish | 48 | 1.7% |
| Scottish | 16 | 0.6% |
| Subsaharan African | 44 | 1.6% |
| Swedish | 8 | 0.3% |
| Welsh | 6 | 0.2% | View All 28 Rows |
Immigrants in Springfield
The most numerous immigrant groups reported in Springfield came from Caribbean (6 | 0.2%), Jamaica (6 | 0.2%), and Latin America (6 | 0.2%), together accounting for 0.7% of all Springfield residents.
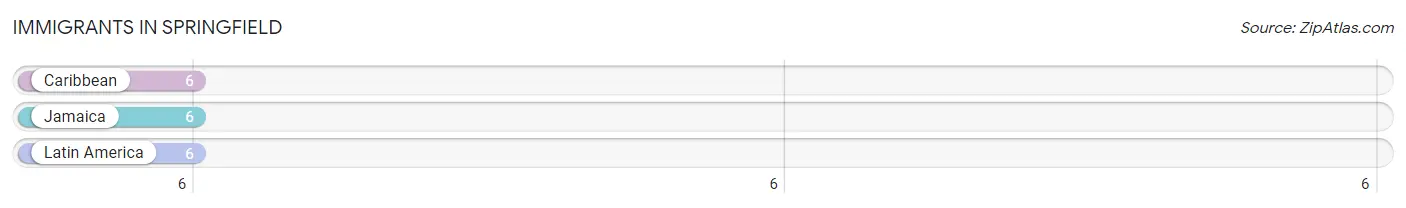
| Immigration Origin | # Population | % Population |
| Caribbean | 6 | 0.2% |
| Jamaica | 6 | 0.2% |
| Latin America | 6 | 0.2% | View All 3 Rows |
Sex and Age in Springfield
Sex and Age in Springfield
The most populous age groups in Springfield are 25 to 29 Years (197 | 14.0%) for men and 20 to 24 Years (143 | 10.6%) for women.
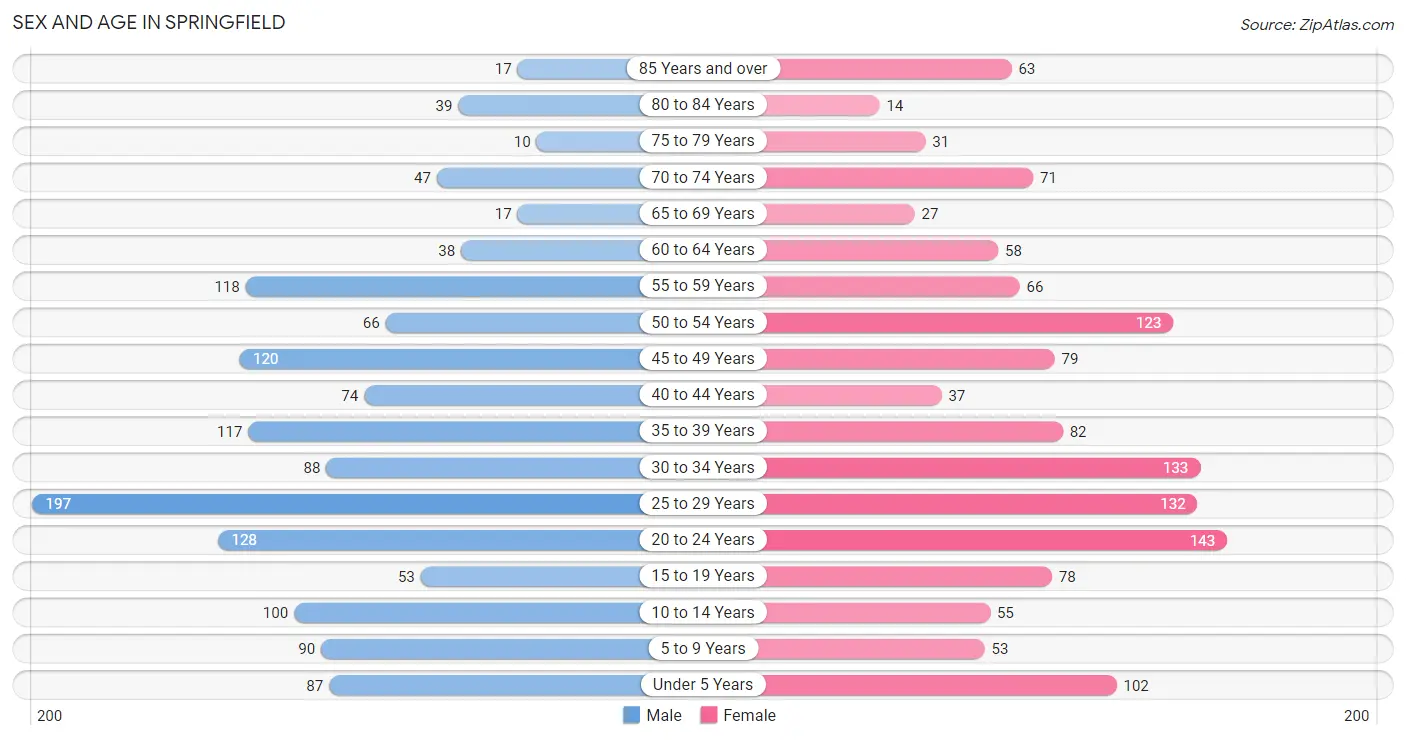
| Age Bracket | Male | Female |
| Under 5 Years | 87 (6.2%) | 102 (7.6%) |
| 5 to 9 Years | 90 (6.4%) | 53 (3.9%) |
| 10 to 14 Years | 100 (7.1%) | 55 (4.1%) |
| 15 to 19 Years | 53 (3.8%) | 78 (5.8%) |
| 20 to 24 Years | 128 (9.1%) | 143 (10.6%) |
| 25 to 29 Years | 197 (14.0%) | 132 (9.8%) |
| 30 to 34 Years | 88 (6.3%) | 133 (9.9%) |
| 35 to 39 Years | 117 (8.3%) | 82 (6.1%) |
| 40 to 44 Years | 74 (5.3%) | 37 (2.8%) |
| 45 to 49 Years | 120 (8.5%) | 79 (5.9%) |
| 50 to 54 Years | 66 (4.7%) | 123 (9.1%) |
| 55 to 59 Years | 118 (8.4%) | 66 (4.9%) |
| 60 to 64 Years | 38 (2.7%) | 58 (4.3%) |
| 65 to 69 Years | 17 (1.2%) | 27 (2.0%) |
| 70 to 74 Years | 47 (3.3%) | 71 (5.3%) |
| 75 to 79 Years | 10 (0.7%) | 31 (2.3%) |
| 80 to 84 Years | 39 (2.8%) | 14 (1.0%) |
| 85 Years and over | 17 (1.2%) | 63 (4.7%) |
| Total | 1,406 (100.0%) | 1,347 (100.0%) |
Families and Households in Springfield
Median Family Size in Springfield
The median family size in Springfield is 2.85 persons per family, with married-couple families (378 | 56.2%) accounting for the largest median family size of 2.96 persons per family. On the other hand, single male/father families (95 | 14.1%) represent the smallest median family size with 2.37 persons per family.
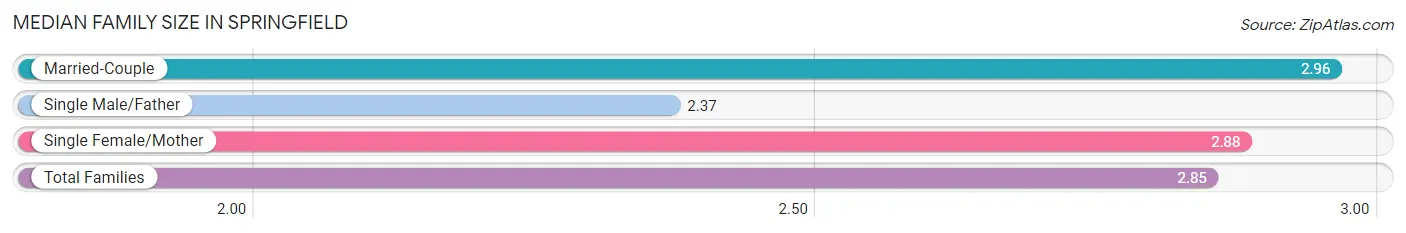
| Family Type | # Families | Family Size |
| Married-Couple | 378 (56.2%) | 2.96 |
| Single Male/Father | 95 (14.1%) | 2.37 |
| Single Female/Mother | 199 (29.6%) | 2.88 |
| Total Families | 672 (100.0%) | 2.85 |
Median Household Size in Springfield
The median household size in Springfield is 2.16 persons per household, with single female/mother households (199 | 17.7%) accounting for the largest median household size of 3.04 persons per household. non-family households (455 | 40.4%) represent the smallest median household size with 1.05 persons per household.
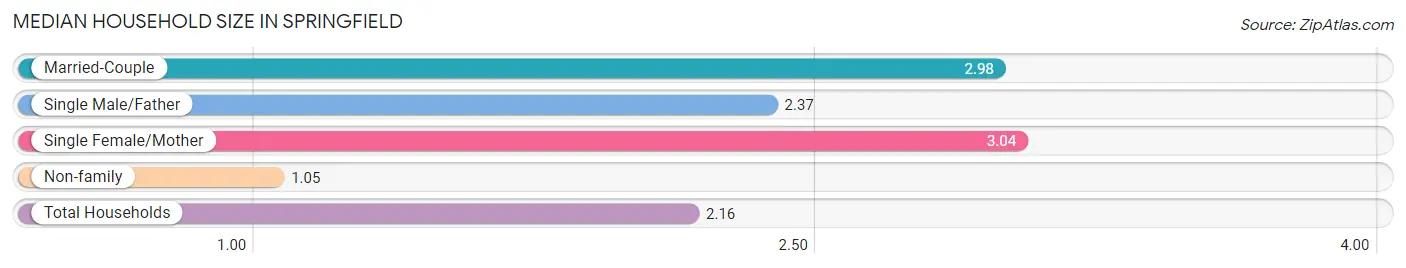
| Household Type | # Households | Household Size |
| Married-Couple | 378 (33.5%) | 2.98 |
| Single Male/Father | 95 (8.4%) | 2.37 |
| Single Female/Mother | 199 (17.7%) | 3.04 |
| Non-family | 455 (40.4%) | 1.05 |
| Total Households | 1,127 (100.0%) | 2.16 |
Household Size by Marriage Status in Springfield
Out of a total of 1,127 households in Springfield, 672 (59.6%) are family households, while 455 (40.4%) are nonfamily households. The most numerous type of family households are 2-person households, comprising 389, and the most common type of nonfamily households are 1-person households, comprising 439.
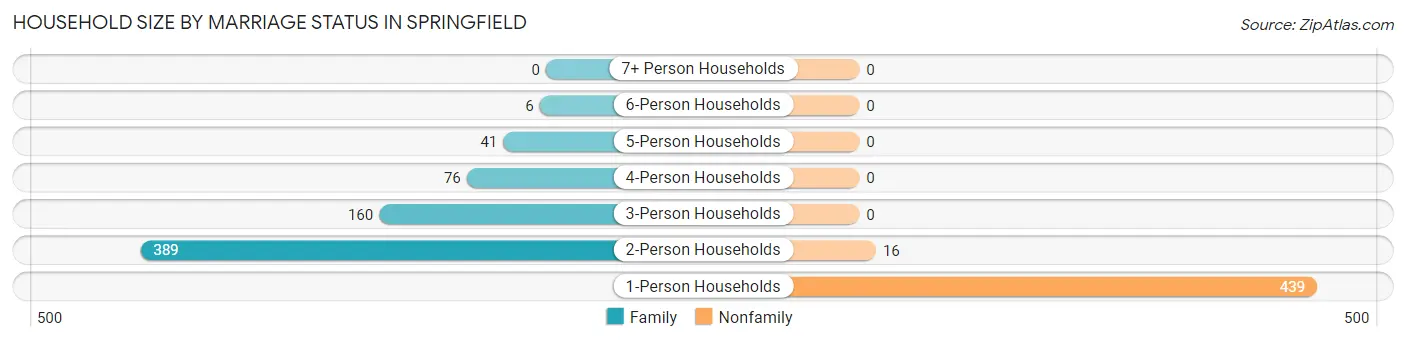
| Household Size | Family Households | Nonfamily Households |
| 1-Person Households | - | 439 (39.0%) |
| 2-Person Households | 389 (34.5%) | 16 (1.4%) |
| 3-Person Households | 160 (14.2%) | 0 (0.0%) |
| 4-Person Households | 76 (6.7%) | 0 (0.0%) |
| 5-Person Households | 41 (3.6%) | 0 (0.0%) |
| 6-Person Households | 6 (0.5%) | 0 (0.0%) |
| 7+ Person Households | 0 (0.0%) | 0 (0.0%) |
| Total | 672 (59.6%) | 455 (40.4%) |
Female Fertility in Springfield
Fertility by Age in Springfield
Average fertility rate in Springfield is 38.0 births per 1,000 women. Women in the age bracket of 20 to 34 years have the highest fertility rate with 64.0 births per 1,000 women. Women in the age bracket of 20 to 34 years acount for 100.0% of all women with births.
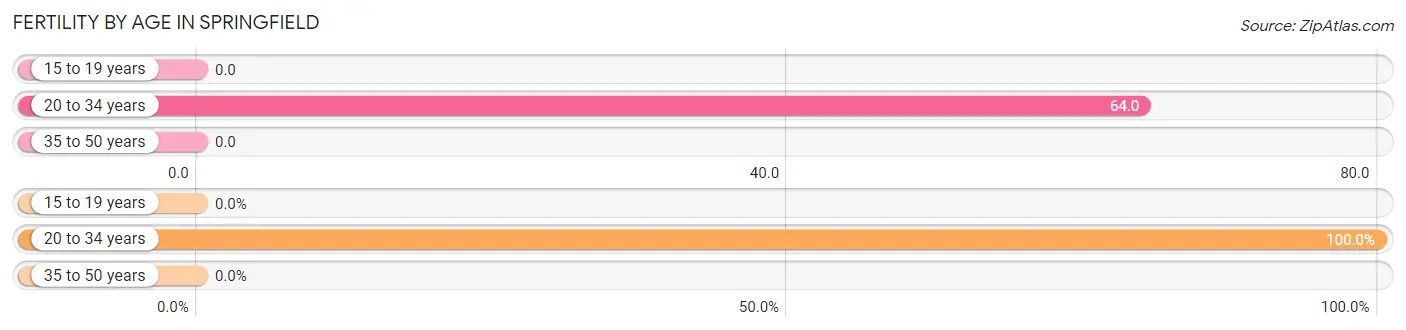
| Age Bracket | Women with Births | Births / 1,000 Women |
| 15 to 19 years | 0 (0.0%) | 0.0 |
| 20 to 34 years | 26 (100.0%) | 64.0 |
| 35 to 50 years | 0 (0.0%) | 0.0 |
| Total | 26 (100.0%) | 38.0 |
Fertility by Age by Marriage Status in Springfield
57.7% of women with births (26) in Springfield are married. The highest percentage of unmarried women with births falls into 20 to 34 years age bracket with 42.3% of them unmarried at the time of birth, while the lowest percentage of unmarried women with births belong to 20 to 34 years age bracket with 42.3% of them unmarried.
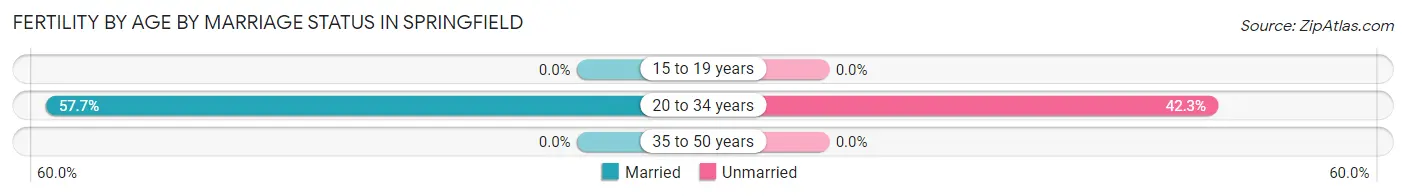
| Age Bracket | Married | Unmarried |
| 15 to 19 years | 0 (0.0%) | 0 (0.0%) |
| 20 to 34 years | 15 (57.7%) | 11 (42.3%) |
| 35 to 50 years | 0 (0.0%) | 0 (0.0%) |
| Total | 15 (57.7%) | 11 (42.3%) |
Fertility by Education in Springfield
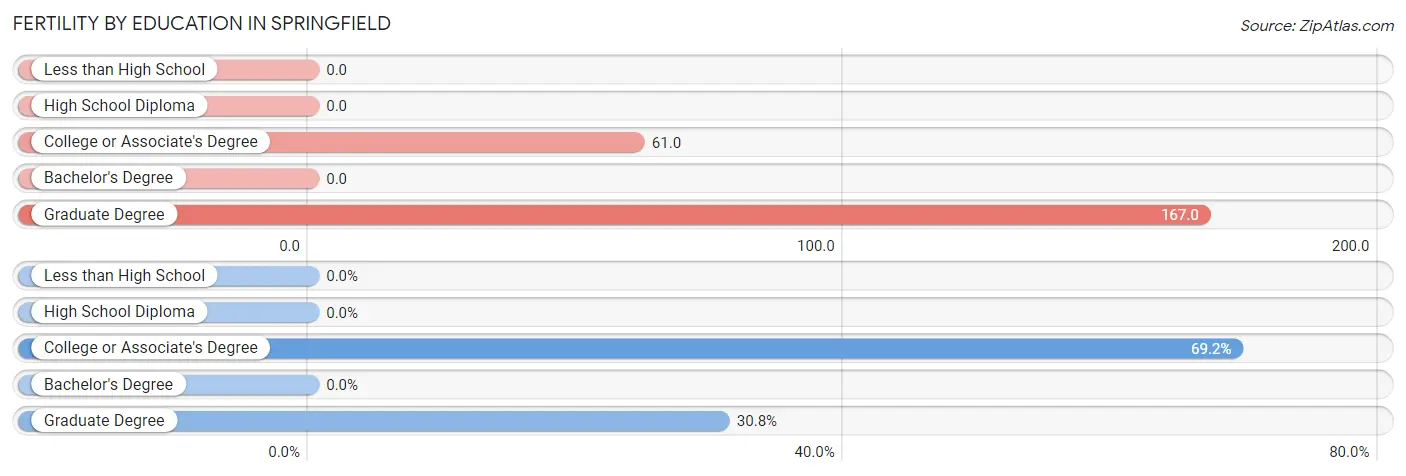
| Educational Attainment | Women with Births | Births / 1,000 Women |
| Less than High School | 0 (0.0%) | 0.0 |
| High School Diploma | 0 (0.0%) | 0.0 |
| College or Associate's Degree | 18 (69.2%) | 61.0 |
| Bachelor's Degree | 0 (0.0%) | 0.0 |
| Graduate Degree | 8 (30.8%) | 167.0 |
| Total | 26 (100.0%) | 38.0 |
Fertility by Education by Marriage Status in Springfield
42.3% of women with births in Springfield are unmarried. Women with the educational attainment of graduate degree are most likely to be married with 100.0% of them married at childbirth, while women with the educational attainment of college or associate's degree are least likely to be married with 61.1% of them unmarried at childbirth.
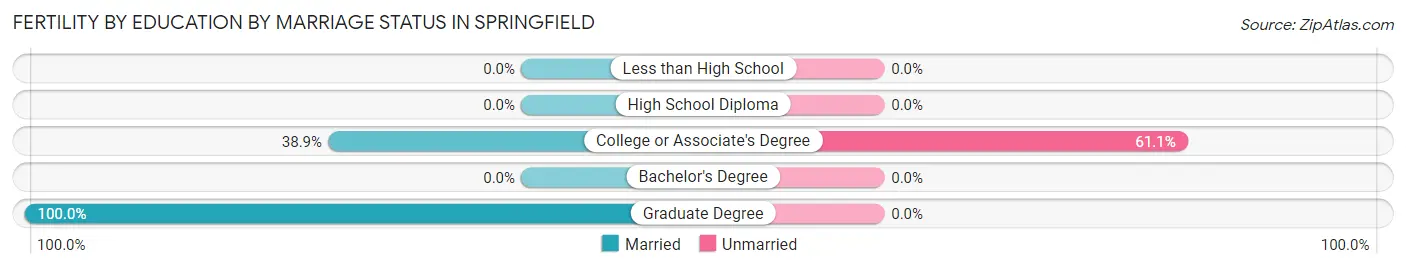
| Educational Attainment | Married | Unmarried |
| Less than High School | 0 (0.0%) | 0 (0.0%) |
| High School Diploma | 0 (0.0%) | 0 (0.0%) |
| College or Associate's Degree | 7 (38.9%) | 11 (61.1%) |
| Bachelor's Degree | 0 (0.0%) | 0 (0.0%) |
| Graduate Degree | 8 (100.0%) | 0 (0.0%) |
| Total | 15 (57.7%) | 11 (42.3%) |
Employment Characteristics in Springfield
Employment by Class of Employer in Springfield
Among the 1,407 employed individuals in Springfield, private company employees (1,001 | 71.1%), state government employees (122 | 8.7%), and local government employees (84 | 6.0%) make up the most common classes of employment.
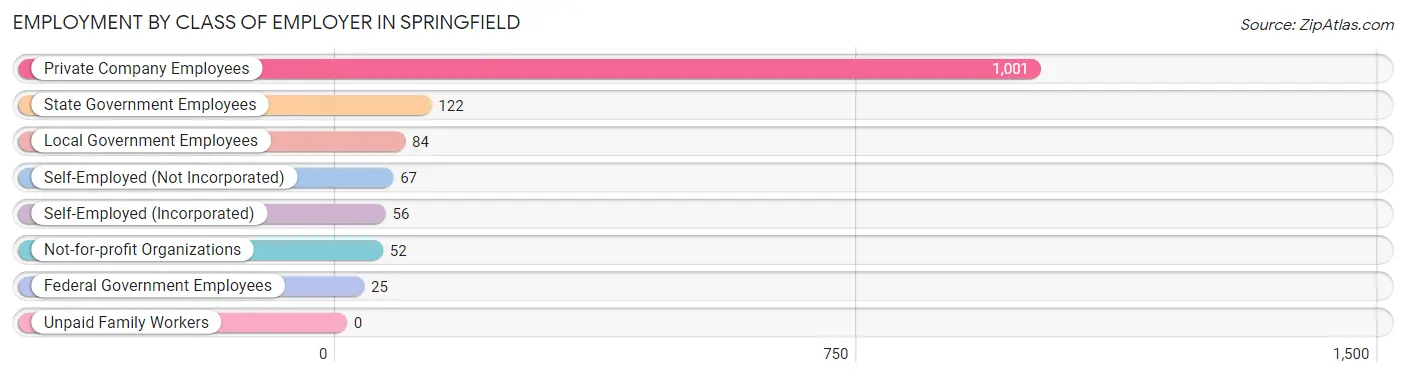
| Employer Class | # Employees | % Employees |
| Private Company Employees | 1,001 | 71.1% |
| Self-Employed (Incorporated) | 56 | 4.0% |
| Self-Employed (Not Incorporated) | 67 | 4.8% |
| Not-for-profit Organizations | 52 | 3.7% |
| Local Government Employees | 84 | 6.0% |
| State Government Employees | 122 | 8.7% |
| Federal Government Employees | 25 | 1.8% |
| Unpaid Family Workers | 0 | 0.0% |
| Total | 1,407 | 100.0% |
Employment Status by Age in Springfield
According to the labor force statistics for Springfield, out of the total population over 16 years of age (2,250), 64.0% or 1,440 individuals are in the labor force, with 1.0% or 14 of them unemployed. The age group with the highest labor force participation rate is 35 to 44 years, with 86.8% or 269 individuals in the labor force. Within the labor force, the 55 to 59 years age range has the highest percentage of unemployed individuals, with 5.8% or 6 of them being unemployed.
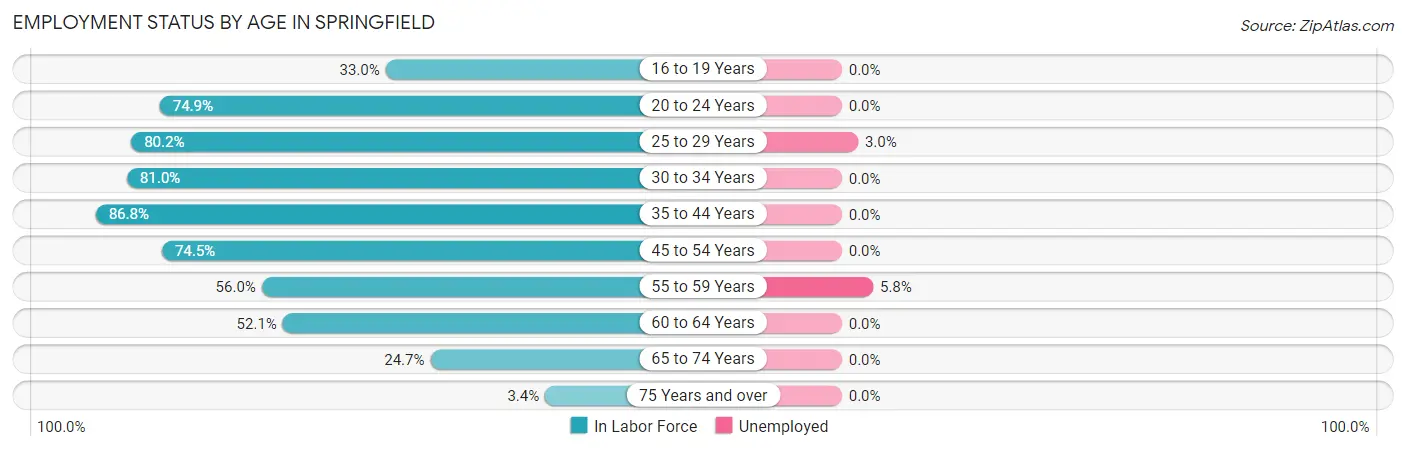
| Age Bracket | In Labor Force | Unemployed |
| 16 to 19 Years | 38 (33.0%) | 0 (0.0%) |
| 20 to 24 Years | 203 (74.9%) | 0 (0.0%) |
| 25 to 29 Years | 264 (80.2%) | 8 (3.0%) |
| 30 to 34 Years | 179 (81.0%) | 0 (0.0%) |
| 35 to 44 Years | 269 (86.8%) | 0 (0.0%) |
| 45 to 54 Years | 289 (74.5%) | 0 (0.0%) |
| 55 to 59 Years | 103 (56.0%) | 6 (5.8%) |
| 60 to 64 Years | 50 (52.1%) | 0 (0.0%) |
| 65 to 74 Years | 40 (24.7%) | 0 (0.0%) |
| 75 Years and over | 6 (3.4%) | 0 (0.0%) |
| Total | 1,440 (64.0%) | 14 (1.0%) |
Employment Status by Educational Attainment in Springfield
According to labor force statistics for Springfield, 75.5% of individuals (1,154) out of the total population between 25 and 64 years of age (1,528) are in the labor force, with 1.2% or 14 of them being unemployed. The group with the highest labor force participation rate are those with the educational attainment of bachelor's degree or higher, with 84.2% or 266 individuals in the labor force. Within the labor force, individuals with bachelor's degree or higher education have the highest percentage of unemployment, with 3.0% or 8 of them being unemployed.
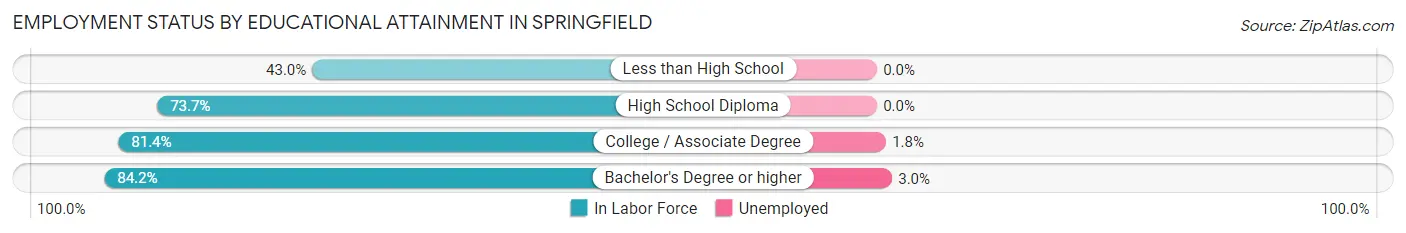
| Educational Attainment | In Labor Force | Unemployed |
| Less than High School | 52 (43.0%) | 0 (0.0%) |
| High School Diploma | 498 (73.7%) | 0 (0.0%) |
| College / Associate Degree | 338 (81.4%) | 7 (1.8%) |
| Bachelor's Degree or higher | 266 (84.2%) | 9 (3.0%) |
| Total | 1,154 (75.5%) | 18 (1.2%) |
Employment Occupations by Sex in Springfield
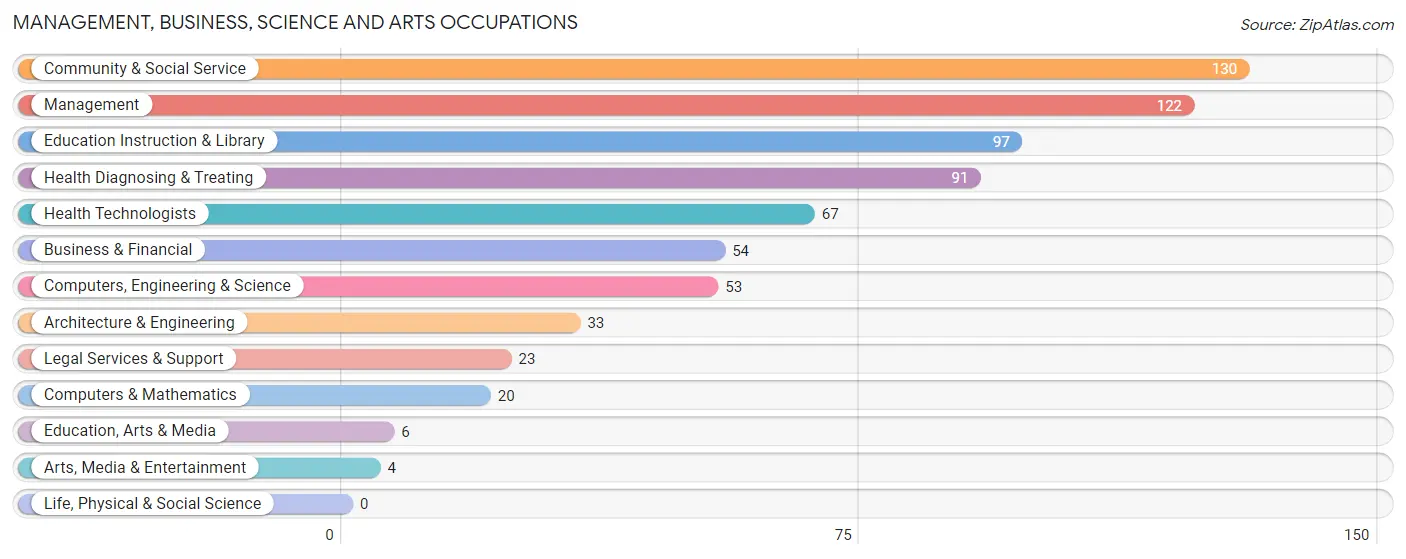
Management, Business, Science and Arts Occupations
The most common Management, Business, Science and Arts occupations in Springfield are Community & Social Service (130 | 9.1%), Management (122 | 8.6%), Education Instruction & Library (97 | 6.8%), Health Diagnosing & Treating (91 | 6.4%), and Health Technologists (67 | 4.7%).
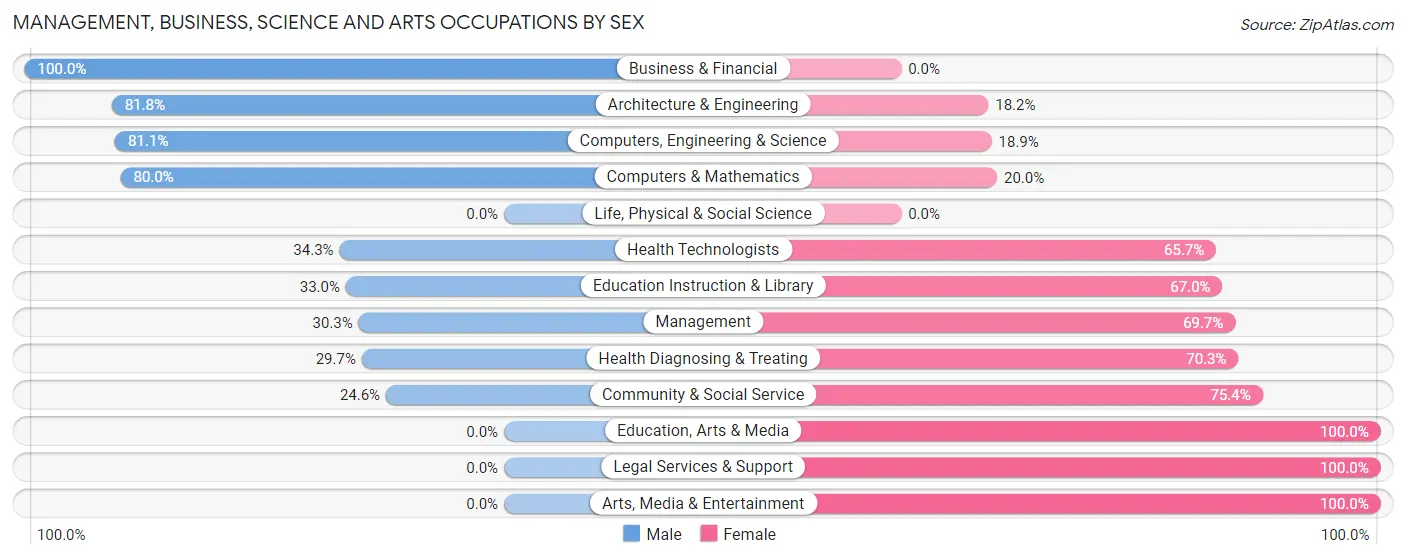
Management, Business, Science and Arts Occupations by Sex
Within the Management, Business, Science and Arts occupations in Springfield, the most male-oriented occupations are Business & Financial (100.0%), Architecture & Engineering (81.8%), and Computers, Engineering & Science (81.1%), while the most female-oriented occupations are Education, Arts & Media (100.0%), Legal Services & Support (100.0%), and Arts, Media & Entertainment (100.0%).
| Occupation | Male | Female |
| Management | 37 (30.3%) | 85 (69.7%) |
| Business & Financial | 54 (100.0%) | 0 (0.0%) |
| Computers, Engineering & Science | 43 (81.1%) | 10 (18.9%) |
| Computers & Mathematics | 16 (80.0%) | 4 (20.0%) |
| Architecture & Engineering | 27 (81.8%) | 6 (18.2%) |
| Life, Physical & Social Science | 0 (0.0%) | 0 (0.0%) |
| Community & Social Service | 32 (24.6%) | 98 (75.4%) |
| Education, Arts & Media | 0 (0.0%) | 6 (100.0%) |
| Legal Services & Support | 0 (0.0%) | 23 (100.0%) |
| Education Instruction & Library | 32 (33.0%) | 65 (67.0%) |
| Arts, Media & Entertainment | 0 (0.0%) | 4 (100.0%) |
| Health Diagnosing & Treating | 27 (29.7%) | 64 (70.3%) |
| Health Technologists | 23 (34.3%) | 44 (65.7%) |
| Total (Category) | 193 (42.9%) | 257 (57.1%) |
| Total (Overall) | 707 (49.5%) | 720 (50.5%) |
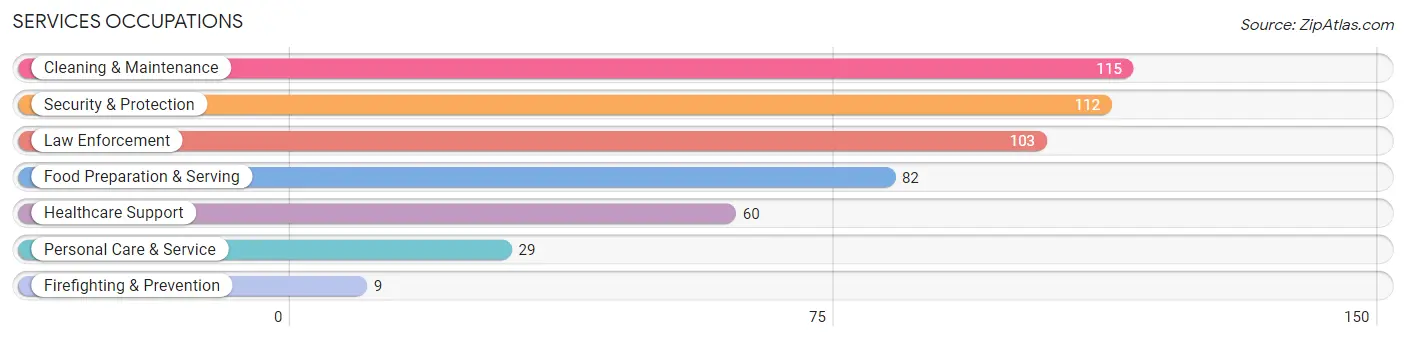
Services Occupations
The most common Services occupations in Springfield are Cleaning & Maintenance (115 | 8.1%), Security & Protection (112 | 7.9%), Law Enforcement (103 | 7.2%), Food Preparation & Serving (82 | 5.8%), and Healthcare Support (60 | 4.2%).
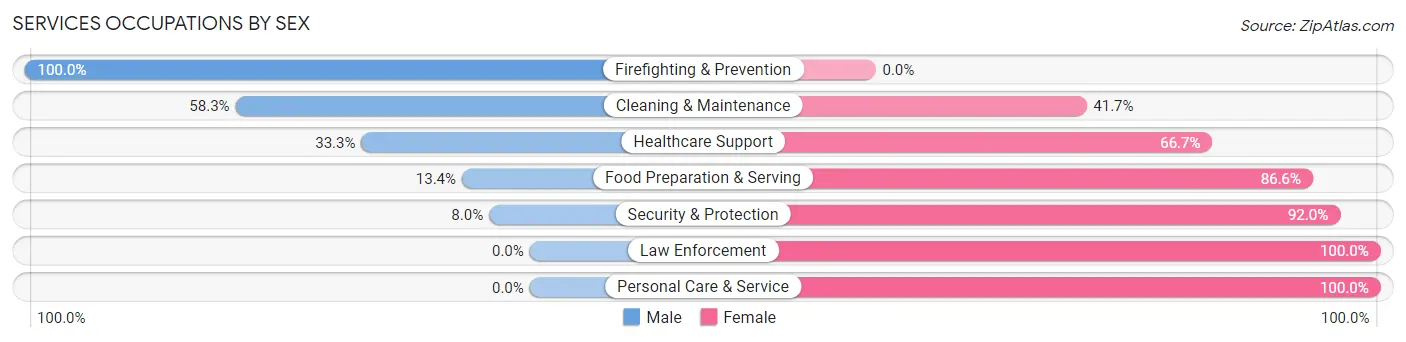
Services Occupations by Sex
Within the Services occupations in Springfield, the most male-oriented occupations are Firefighting & Prevention (100.0%), Cleaning & Maintenance (58.3%), and Healthcare Support (33.3%), while the most female-oriented occupations are Law Enforcement (100.0%), Personal Care & Service (100.0%), and Security & Protection (92.0%).
| Occupation | Male | Female |
| Healthcare Support | 20 (33.3%) | 40 (66.7%) |
| Security & Protection | 9 (8.0%) | 103 (92.0%) |
| Firefighting & Prevention | 9 (100.0%) | 0 (0.0%) |
| Law Enforcement | 0 (0.0%) | 103 (100.0%) |
| Food Preparation & Serving | 11 (13.4%) | 71 (86.6%) |
| Cleaning & Maintenance | 67 (58.3%) | 48 (41.7%) |
| Personal Care & Service | 0 (0.0%) | 29 (100.0%) |
| Total (Category) | 107 (26.9%) | 291 (73.1%) |
| Total (Overall) | 707 (49.5%) | 720 (50.5%) |
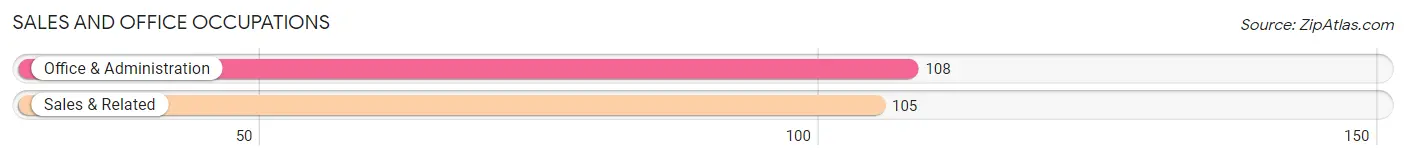
Sales and Office Occupations
The most common Sales and Office occupations in Springfield are Office & Administration (108 | 7.6%), and Sales & Related (105 | 7.4%).
Sales and Office Occupations by Sex
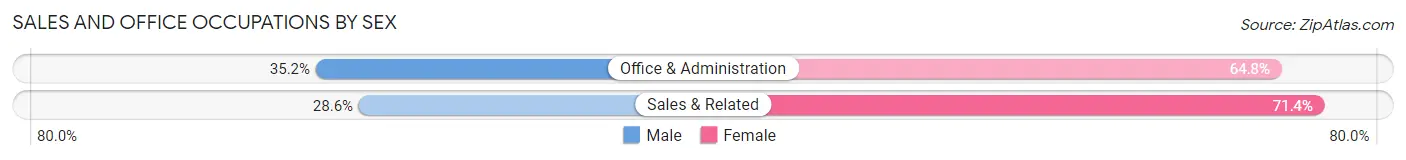
| Occupation | Male | Female |
| Sales & Related | 30 (28.6%) | 75 (71.4%) |
| Office & Administration | 38 (35.2%) | 70 (64.8%) |
| Total (Category) | 68 (31.9%) | 145 (68.1%) |
| Total (Overall) | 707 (49.5%) | 720 (50.5%) |
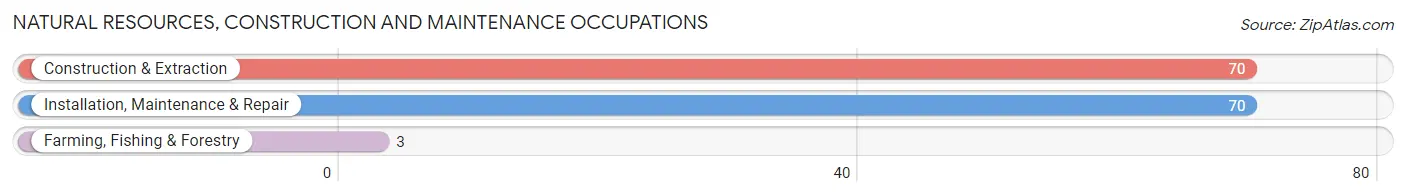
Natural Resources, Construction and Maintenance Occupations
The most common Natural Resources, Construction and Maintenance occupations in Springfield are Construction & Extraction (70 | 4.9%), Installation, Maintenance & Repair (70 | 4.9%), and Farming, Fishing & Forestry (3 | 0.2%).
Natural Resources, Construction and Maintenance Occupations by Sex
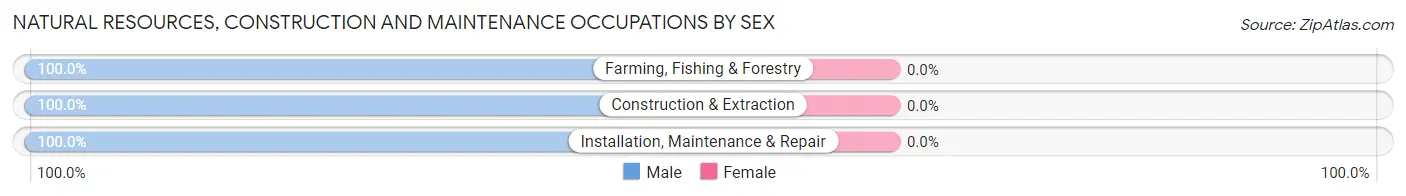
| Occupation | Male | Female |
| Farming, Fishing & Forestry | 3 (100.0%) | 0 (0.0%) |
| Construction & Extraction | 70 (100.0%) | 0 (0.0%) |
| Installation, Maintenance & Repair | 70 (100.0%) | 0 (0.0%) |
| Total (Category) | 143 (100.0%) | 0 (0.0%) |
| Total (Overall) | 707 (49.5%) | 720 (50.5%) |
Production, Transportation and Moving Occupations
The most common Production, Transportation and Moving occupations in Springfield are Transportation (133 | 9.3%), Material Moving (79 | 5.5%), and Production (11 | 0.8%).
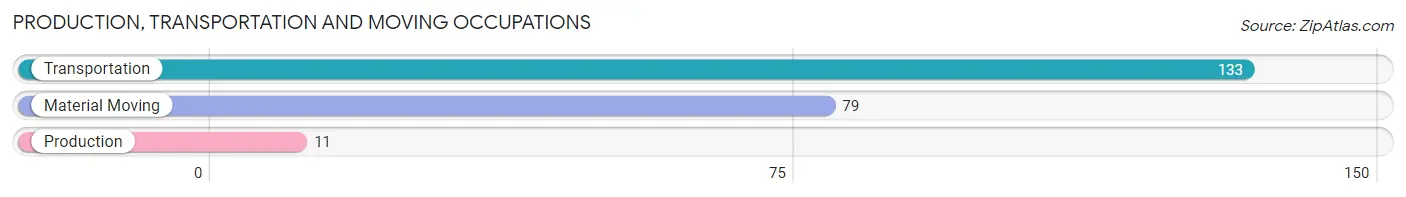
Production, Transportation and Moving Occupations by Sex
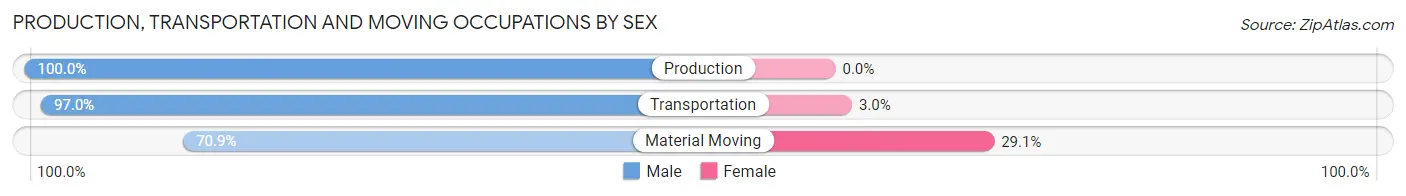
| Occupation | Male | Female |
| Production | 11 (100.0%) | 0 (0.0%) |
| Transportation | 129 (97.0%) | 4 (3.0%) |
| Material Moving | 56 (70.9%) | 23 (29.1%) |
| Total (Category) | 196 (87.9%) | 27 (12.1%) |
| Total (Overall) | 707 (49.5%) | 720 (50.5%) |
Employment Industries by Sex in Springfield
Employment Industries in Springfield
The major employment industries in Springfield include Transportation & Warehousing (195 | 13.7%), Health Care & Social Assistance (160 | 11.2%), Construction (152 | 10.6%), Public Administration (138 | 9.7%), and Manufacturing (126 | 8.8%).
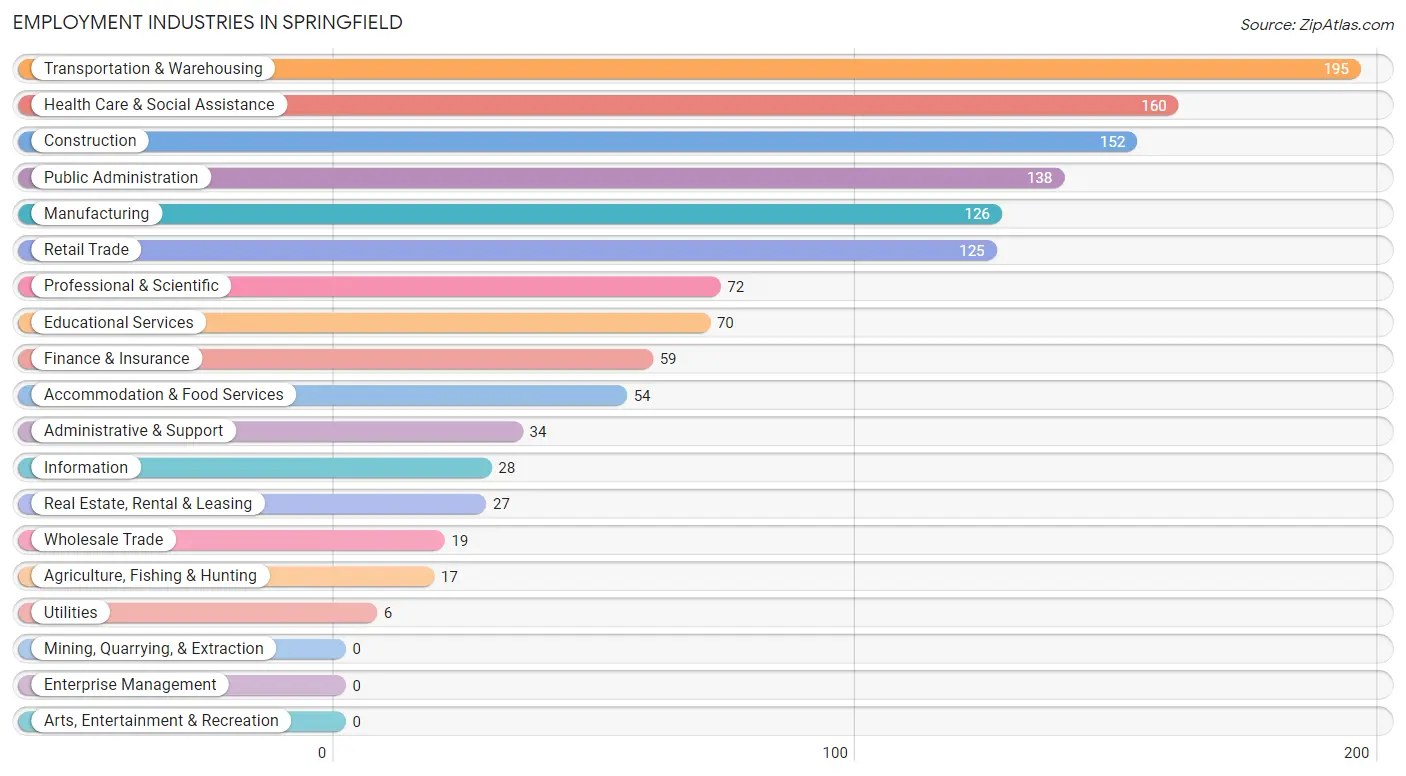
Employment Industries by Sex in Springfield
The Springfield industries that see more men than women are Agriculture, Fishing & Hunting (100.0%), Construction (100.0%), and Wholesale Trade (100.0%), whereas the industries that tend to have a higher number of women are Information (100.0%), Public Administration (93.5%), and Real Estate, Rental & Leasing (88.9%).
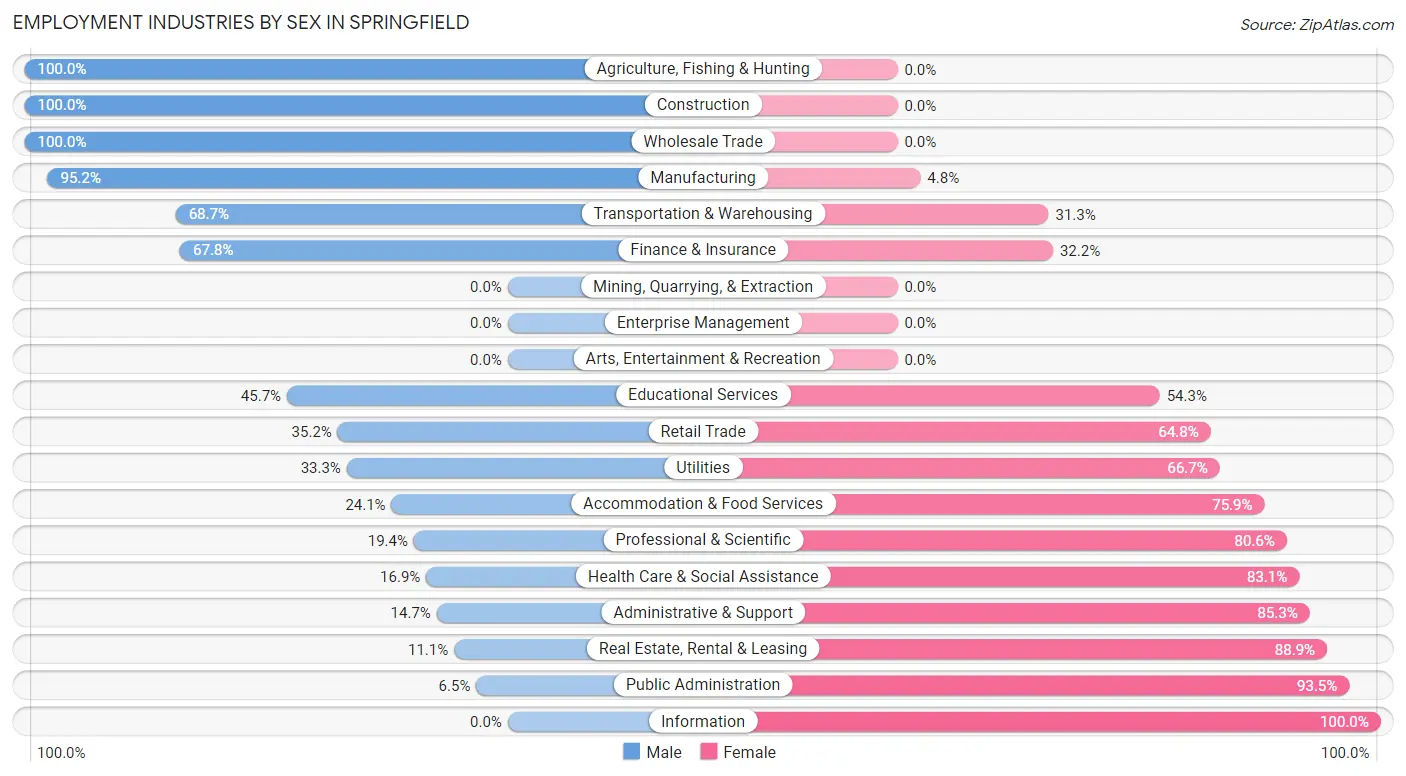
| Industry | Male | Female |
| Agriculture, Fishing & Hunting | 17 (100.0%) | 0 (0.0%) |
| Mining, Quarrying, & Extraction | 0 (0.0%) | 0 (0.0%) |
| Construction | 152 (100.0%) | 0 (0.0%) |
| Manufacturing | 120 (95.2%) | 6 (4.8%) |
| Wholesale Trade | 19 (100.0%) | 0 (0.0%) |
| Retail Trade | 44 (35.2%) | 81 (64.8%) |
| Transportation & Warehousing | 134 (68.7%) | 61 (31.3%) |
| Utilities | 2 (33.3%) | 4 (66.7%) |
| Information | 0 (0.0%) | 28 (100.0%) |
| Finance & Insurance | 40 (67.8%) | 19 (32.2%) |
| Real Estate, Rental & Leasing | 3 (11.1%) | 24 (88.9%) |
| Professional & Scientific | 14 (19.4%) | 58 (80.6%) |
| Enterprise Management | 0 (0.0%) | 0 (0.0%) |
| Administrative & Support | 5 (14.7%) | 29 (85.3%) |
| Educational Services | 32 (45.7%) | 38 (54.3%) |
| Health Care & Social Assistance | 27 (16.9%) | 133 (83.1%) |
| Arts, Entertainment & Recreation | 0 (0.0%) | 0 (0.0%) |
| Accommodation & Food Services | 13 (24.1%) | 41 (75.9%) |
| Public Administration | 9 (6.5%) | 129 (93.5%) |
| Total | 707 (49.5%) | 720 (50.5%) |
Education in Springfield
School Enrollment in Springfield
The most common levels of schooling among the 519 students in Springfield are middle school (125 | 24.1%), elementary school (118 | 22.7%), and high school (105 | 20.2%).
| School Level | # Students | % Students |
| Nursery / Preschool | 44 | 8.5% |
| Kindergarten | 21 | 4.1% |
| Elementary School | 118 | 22.7% |
| Middle School | 125 | 24.1% |
| High School | 105 | 20.2% |
| College / Undergraduate | 80 | 15.4% |
| Graduate / Professional | 26 | 5.0% |
| Total | 519 | 100.0% |
School Enrollment by Age by Funding Source in Springfield
Out of a total of 519 students who are enrolled in schools in Springfield, 49 (9.4%) attend a private institution, while the remaining 470 (90.6%) are enrolled in public schools. The age group of 3 to 4 year olds has the highest likelihood of being enrolled in private schools, with 14 (38.9% in the age bracket) enrolled. Conversely, the age group of 5 to 9 year old has the lowest likelihood of being enrolled in a private school, with 143 (100.0% in the age bracket) attending a public institution.
| Age Bracket | Public School | Private School |
| 3 to 4 Year Olds | 22 (61.1%) | 14 (38.9%) |
| 5 to 9 Year Old | 143 (100.0%) | 0 (0.0%) |
| 10 to 14 Year Olds | 120 (77.4%) | 35 (22.6%) |
| 15 to 17 Year Olds | 69 (100.0%) | 0 (0.0%) |
| 18 to 19 Year Olds | 28 (100.0%) | 0 (0.0%) |
| 20 to 24 Year Olds | 38 (100.0%) | 0 (0.0%) |
| 25 to 34 Year Olds | 44 (100.0%) | 0 (0.0%) |
| 35 Years and over | 6 (100.0%) | 0 (0.0%) |
| Total | 470 (90.6%) | 49 (9.4%) |
Educational Attainment by Field of Study in Springfield
Business (105 | 26.2%), arts & humanities (65 | 16.2%), science & technology (58 | 14.5%), education (46 | 11.5%), and visual & performing arts (38 | 9.5%) are the most common fields of study among 401 individuals in Springfield who have obtained a bachelor's degree or higher.
| Field of Study | # Graduates | % Graduates |
| Computers & Mathematics | 4 | 1.0% |
| Bio, Nature & Agricultural | 0 | 0.0% |
| Physical & Health Sciences | 0 | 0.0% |
| Psychology | 36 | 9.0% |
| Social Sciences | 11 | 2.7% |
| Engineering | 6 | 1.5% |
| Multidisciplinary Studies | 0 | 0.0% |
| Science & Technology | 58 | 14.5% |
| Business | 105 | 26.2% |
| Education | 46 | 11.5% |
| Literature & Languages | 0 | 0.0% |
| Liberal Arts & History | 0 | 0.0% |
| Visual & Performing Arts | 38 | 9.5% |
| Communications | 32 | 8.0% |
| Arts & Humanities | 65 | 16.2% |
| Total | 401 | 100.0% |
Transportation & Commute in Springfield
Vehicle Availability by Sex in Springfield
The most prevalent vehicle ownership categories in Springfield are males with 2 vehicles (299, accounting for 43.8%) and females with 2 vehicles (327, making up 41.5%).
| Vehicles Available | Male | Female |
| No Vehicle | 0 (0.0%) | 6 (0.8%) |
| 1 Vehicle | 176 (25.8%) | 253 (35.1%) |
| 2 Vehicles | 299 (43.8%) | 327 (45.4%) |
| 3 Vehicles | 118 (17.3%) | 119 (16.5%) |
| 4 Vehicles | 81 (11.9%) | 15 (2.1%) |
| 5 or more Vehicles | 9 (1.3%) | 0 (0.0%) |
| Total | 683 (100.0%) | 720 (100.0%) |
Commute Time in Springfield
The most frequently occuring commute durations in Springfield are 30 to 34 minutes (454 commuters, 32.9%), 15 to 19 minutes (208 commuters, 15.1%), and 45 to 59 minutes (141 commuters, 10.2%).
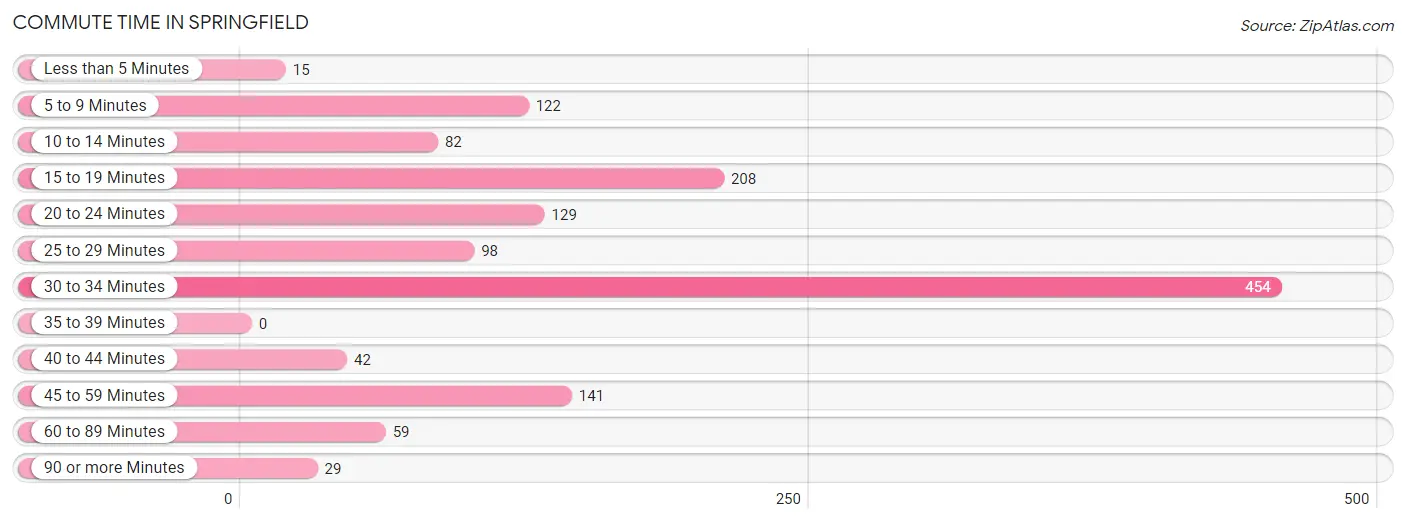
| Commute Time | # Commuters | % Commuters |
| Less than 5 Minutes | 15 | 1.1% |
| 5 to 9 Minutes | 122 | 8.8% |
| 10 to 14 Minutes | 82 | 5.9% |
| 15 to 19 Minutes | 208 | 15.1% |
| 20 to 24 Minutes | 129 | 9.3% |
| 25 to 29 Minutes | 98 | 7.1% |
| 30 to 34 Minutes | 454 | 32.9% |
| 35 to 39 Minutes | 0 | 0.0% |
| 40 to 44 Minutes | 42 | 3.0% |
| 45 to 59 Minutes | 141 | 10.2% |
| 60 to 89 Minutes | 59 | 4.3% |
| 90 or more Minutes | 29 | 2.1% |
Commute Time by Sex in Springfield
The most common commute times in Springfield are 30 to 34 minutes (267 commuters, 39.1%) for males and 30 to 34 minutes (187 commuters, 26.9%) for females.
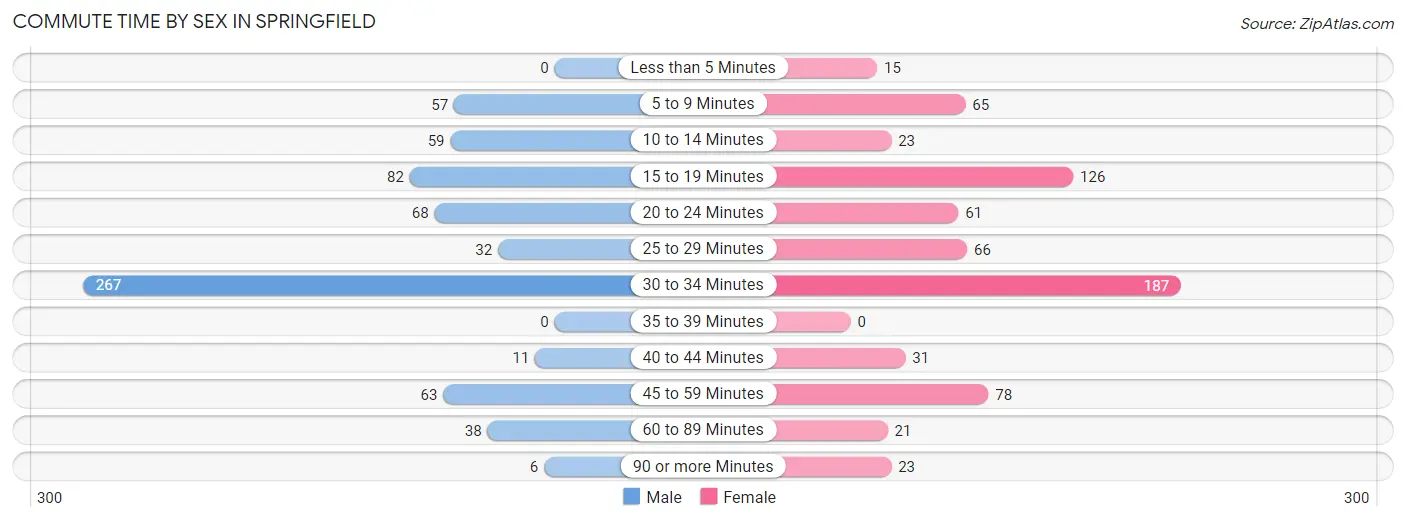
| Commute Time | Male | Female |
| Less than 5 Minutes | 0 (0.0%) | 15 (2.2%) |
| 5 to 9 Minutes | 57 (8.4%) | 65 (9.3%) |
| 10 to 14 Minutes | 59 (8.6%) | 23 (3.3%) |
| 15 to 19 Minutes | 82 (12.0%) | 126 (18.1%) |
| 20 to 24 Minutes | 68 (10.0%) | 61 (8.8%) |
| 25 to 29 Minutes | 32 (4.7%) | 66 (9.5%) |
| 30 to 34 Minutes | 267 (39.1%) | 187 (26.9%) |
| 35 to 39 Minutes | 0 (0.0%) | 0 (0.0%) |
| 40 to 44 Minutes | 11 (1.6%) | 31 (4.4%) |
| 45 to 59 Minutes | 63 (9.2%) | 78 (11.2%) |
| 60 to 89 Minutes | 38 (5.6%) | 21 (3.0%) |
| 90 or more Minutes | 6 (0.9%) | 23 (3.3%) |
Time of Departure to Work by Sex in Springfield
The most frequent times of departure to work in Springfield are 12:00 AM to 4:59 AM (122, 17.9%) for males and 5:00 AM to 5:29 AM (104, 14.9%) for females.
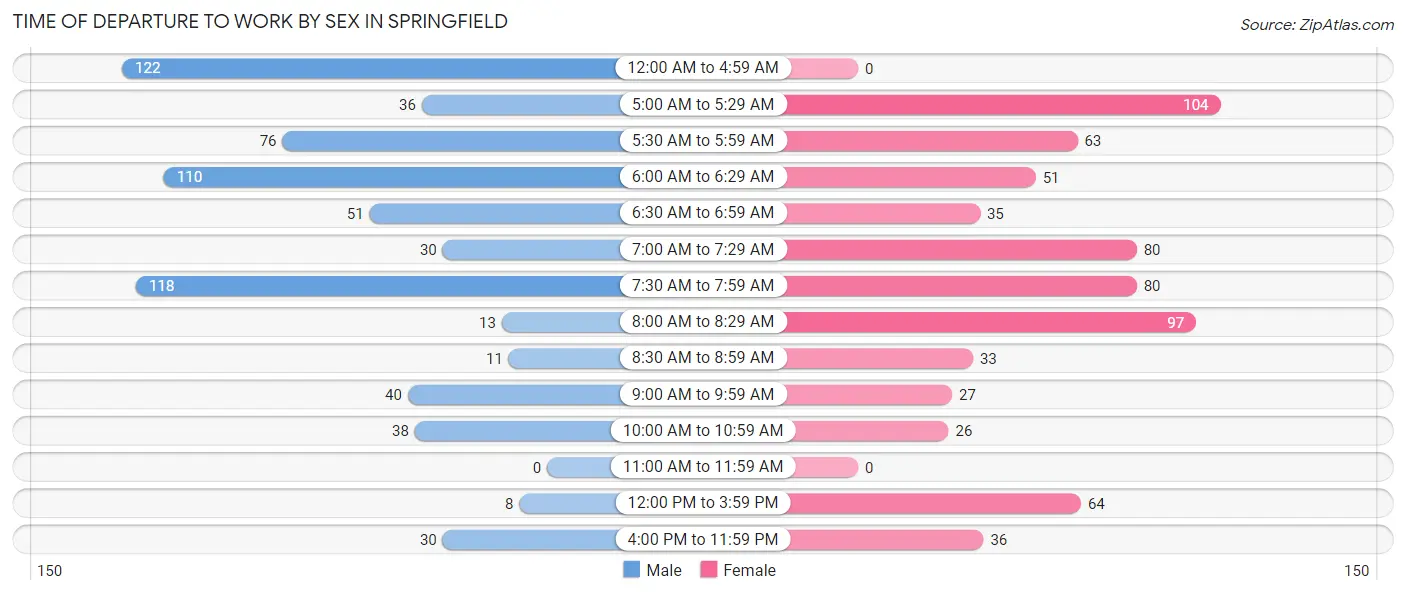
| Time of Departure | Male | Female |
| 12:00 AM to 4:59 AM | 122 (17.9%) | 0 (0.0%) |
| 5:00 AM to 5:29 AM | 36 (5.3%) | 104 (14.9%) |
| 5:30 AM to 5:59 AM | 76 (11.1%) | 63 (9.0%) |
| 6:00 AM to 6:29 AM | 110 (16.1%) | 51 (7.3%) |
| 6:30 AM to 6:59 AM | 51 (7.5%) | 35 (5.0%) |
| 7:00 AM to 7:29 AM | 30 (4.4%) | 80 (11.5%) |
| 7:30 AM to 7:59 AM | 118 (17.3%) | 80 (11.5%) |
| 8:00 AM to 8:29 AM | 13 (1.9%) | 97 (13.9%) |
| 8:30 AM to 8:59 AM | 11 (1.6%) | 33 (4.7%) |
| 9:00 AM to 9:59 AM | 40 (5.9%) | 27 (3.9%) |
| 10:00 AM to 10:59 AM | 38 (5.6%) | 26 (3.7%) |
| 11:00 AM to 11:59 AM | 0 (0.0%) | 0 (0.0%) |
| 12:00 PM to 3:59 PM | 8 (1.2%) | 64 (9.2%) |
| 4:00 PM to 11:59 PM | 30 (4.4%) | 36 (5.2%) |
| Total | 683 (100.0%) | 696 (100.0%) |
Housing Occupancy in Springfield
Occupancy by Ownership in Springfield
Of the total 1,127 dwellings in Springfield, owner-occupied units account for 772 (68.5%), while renter-occupied units make up 355 (31.5%).
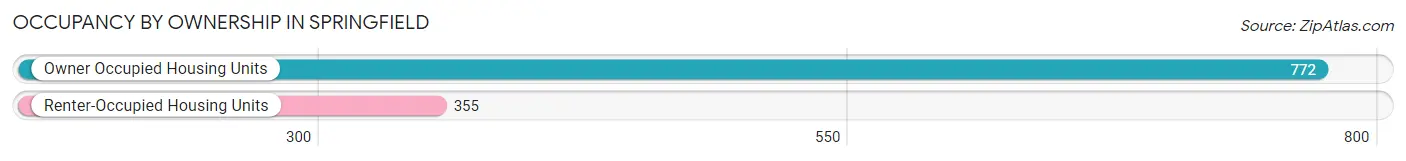
| Occupancy | # Housing Units | % Housing Units |
| Owner Occupied Housing Units | 772 | 68.5% |
| Renter-Occupied Housing Units | 355 | 31.5% |
| Total Occupied Housing Units | 1,127 | 100.0% |
Occupancy by Household Size in Springfield
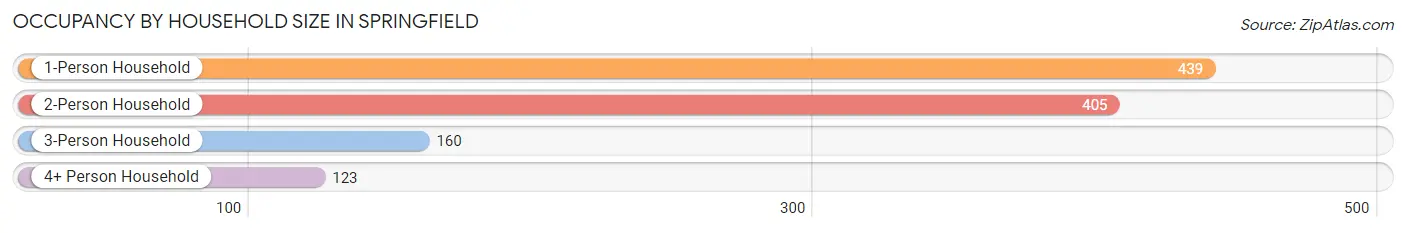
| Household Size | # Housing Units | % Housing Units |
| 1-Person Household | 439 | 39.0% |
| 2-Person Household | 405 | 35.9% |
| 3-Person Household | 160 | 14.2% |
| 4+ Person Household | 123 | 10.9% |
| Total Housing Units | 1,127 | 100.0% |
Occupancy by Ownership by Household Size in Springfield
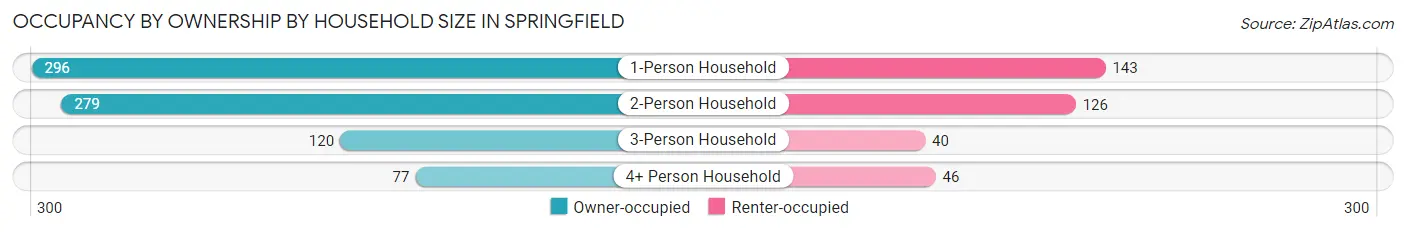
| Household Size | Owner-occupied | Renter-occupied |
| 1-Person Household | 296 (67.4%) | 143 (32.6%) |
| 2-Person Household | 279 (68.9%) | 126 (31.1%) |
| 3-Person Household | 120 (75.0%) | 40 (25.0%) |
| 4+ Person Household | 77 (62.6%) | 46 (37.4%) |
| Total Housing Units | 772 (68.5%) | 355 (31.5%) |
Occupancy by Educational Attainment in Springfield
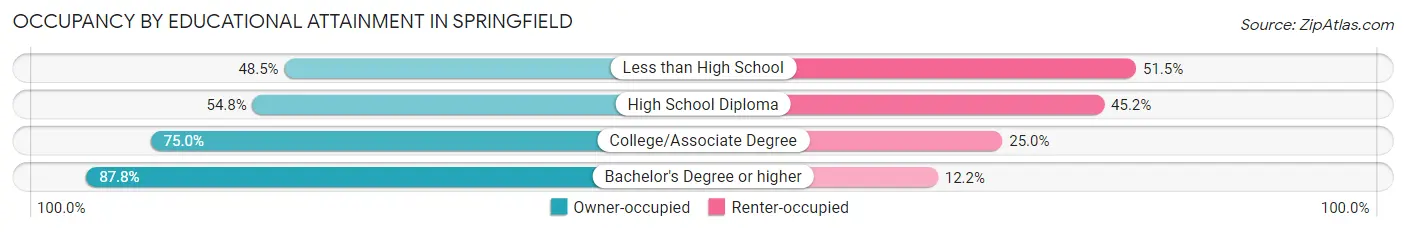
| Household Size | Owner-occupied | Renter-occupied |
| Less than High School | 32 (48.5%) | 34 (51.5%) |
| High School Diploma | 245 (54.8%) | 202 (45.2%) |
| College/Associate Degree | 258 (75.0%) | 86 (25.0%) |
| Bachelor's Degree or higher | 237 (87.8%) | 33 (12.2%) |
Occupancy by Age of Householder in Springfield
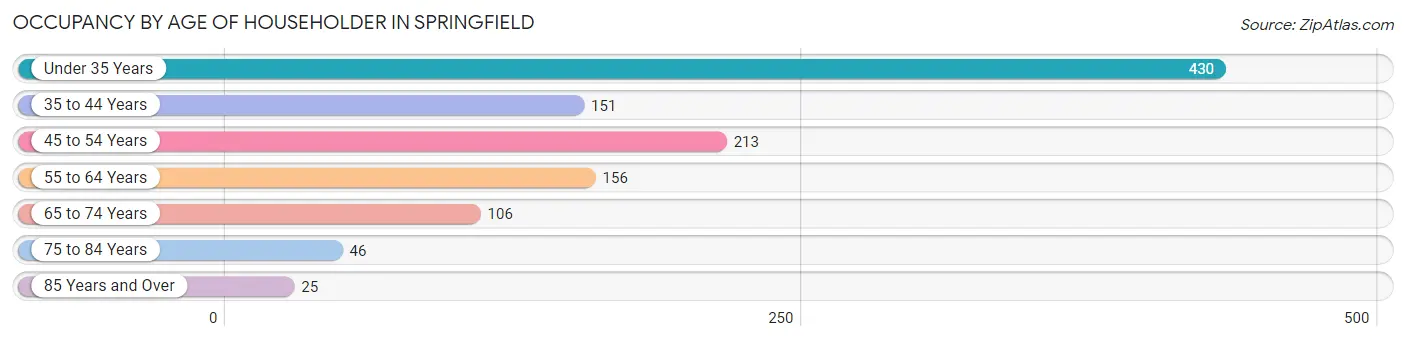
| Age Bracket | # Households | % Households |
| Under 35 Years | 430 | 38.2% |
| 35 to 44 Years | 151 | 13.4% |
| 45 to 54 Years | 213 | 18.9% |
| 55 to 64 Years | 156 | 13.8% |
| 65 to 74 Years | 106 | 9.4% |
| 75 to 84 Years | 46 | 4.1% |
| 85 Years and Over | 25 | 2.2% |
| Total | 1,127 | 100.0% |
Housing Finances in Springfield
Median Income by Occupancy in Springfield
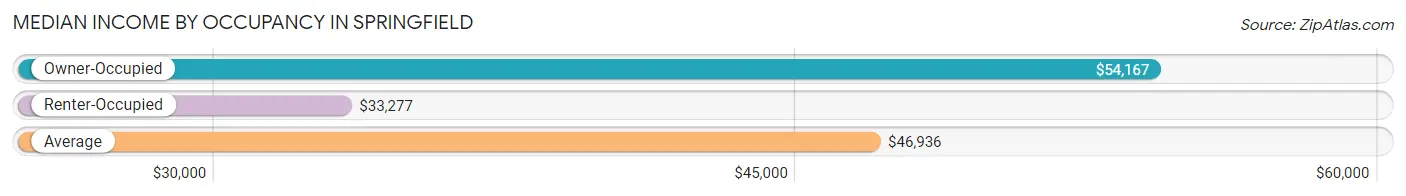
| Occupancy Type | # Households | Median Income |
| Owner-Occupied | 772 (68.5%) | $54,167 |
| Renter-Occupied | 355 (31.5%) | $33,277 |
| Average | 1,127 (100.0%) | $46,936 |
Occupancy by Householder Income Bracket in Springfield
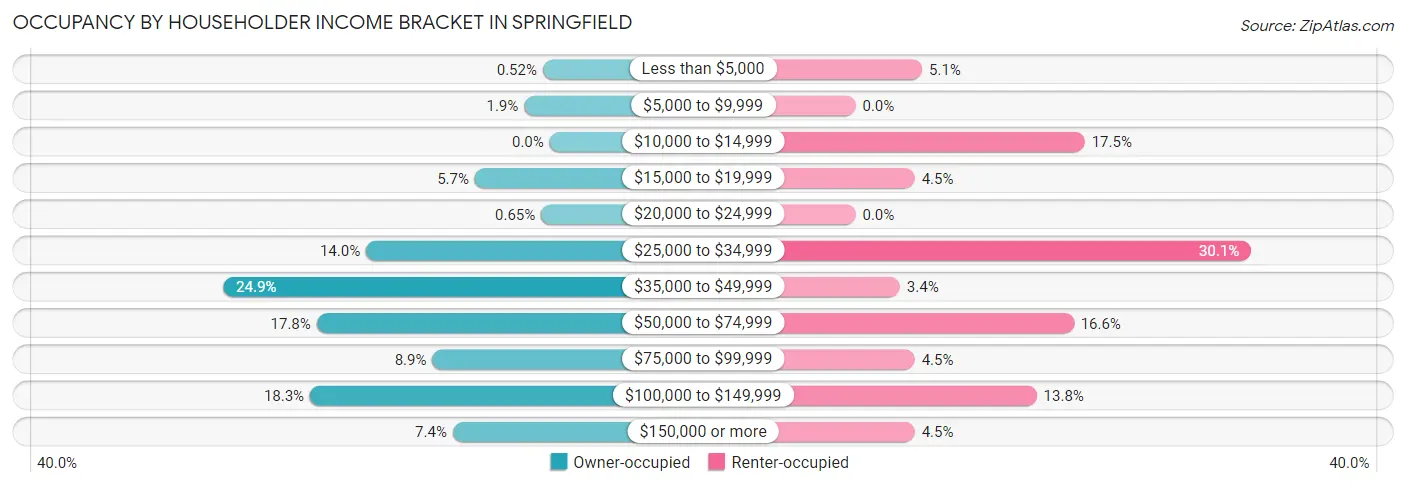
| Income Bracket | Owner-occupied | Renter-occupied |
| Less than $5,000 | 4 (0.5%) | 18 (5.1%) |
| $5,000 to $9,999 | 15 (1.9%) | 0 (0.0%) |
| $10,000 to $14,999 | 0 (0.0%) | 62 (17.5%) |
| $15,000 to $19,999 | 44 (5.7%) | 16 (4.5%) |
| $20,000 to $24,999 | 5 (0.6%) | 0 (0.0%) |
| $25,000 to $34,999 | 108 (14.0%) | 107 (30.1%) |
| $35,000 to $49,999 | 192 (24.9%) | 12 (3.4%) |
| $50,000 to $74,999 | 137 (17.7%) | 59 (16.6%) |
| $75,000 to $99,999 | 69 (8.9%) | 16 (4.5%) |
| $100,000 to $149,999 | 141 (18.3%) | 49 (13.8%) |
| $150,000 or more | 57 (7.4%) | 16 (4.5%) |
| Total | 772 (100.0%) | 355 (100.0%) |
Monthly Housing Cost Tiers in Springfield
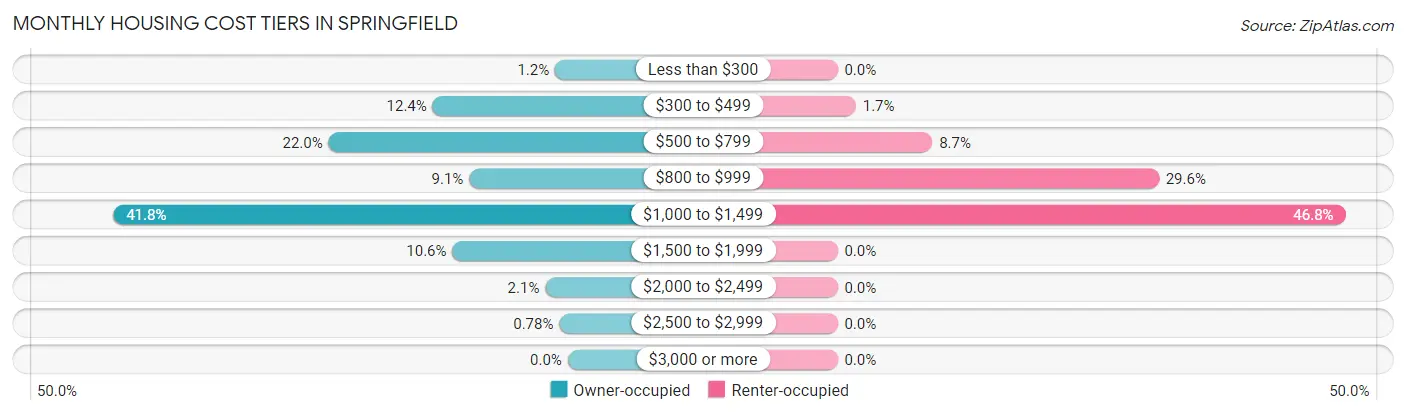
| Monthly Cost | Owner-occupied | Renter-occupied |
| Less than $300 | 9 (1.2%) | 0 (0.0%) |
| $300 to $499 | 96 (12.4%) | 6 (1.7%) |
| $500 to $799 | 170 (22.0%) | 31 (8.7%) |
| $800 to $999 | 70 (9.1%) | 105 (29.6%) |
| $1,000 to $1,499 | 323 (41.8%) | 166 (46.8%) |
| $1,500 to $1,999 | 82 (10.6%) | 0 (0.0%) |
| $2,000 to $2,499 | 16 (2.1%) | 0 (0.0%) |
| $2,500 to $2,999 | 6 (0.8%) | 0 (0.0%) |
| $3,000 or more | 0 (0.0%) | 0 (0.0%) |
| Total | 772 (100.0%) | 355 (100.0%) |
Physical Housing Characteristics in Springfield
Housing Structures in Springfield
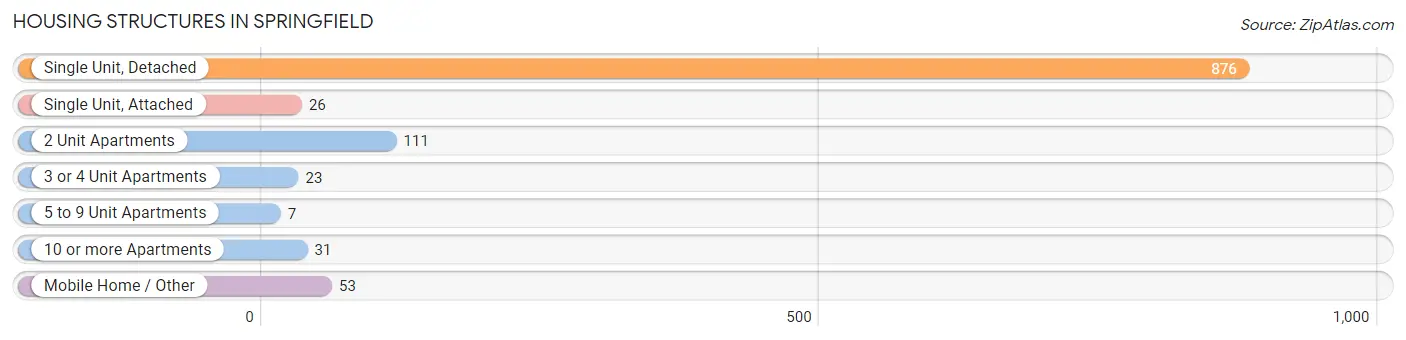
| Structure Type | # Housing Units | % Housing Units |
| Single Unit, Detached | 876 | 77.7% |
| Single Unit, Attached | 26 | 2.3% |
| 2 Unit Apartments | 111 | 9.9% |
| 3 or 4 Unit Apartments | 23 | 2.0% |
| 5 to 9 Unit Apartments | 7 | 0.6% |
| 10 or more Apartments | 31 | 2.8% |
| Mobile Home / Other | 53 | 4.7% |
| Total | 1,127 | 100.0% |
Housing Structures by Occupancy in Springfield
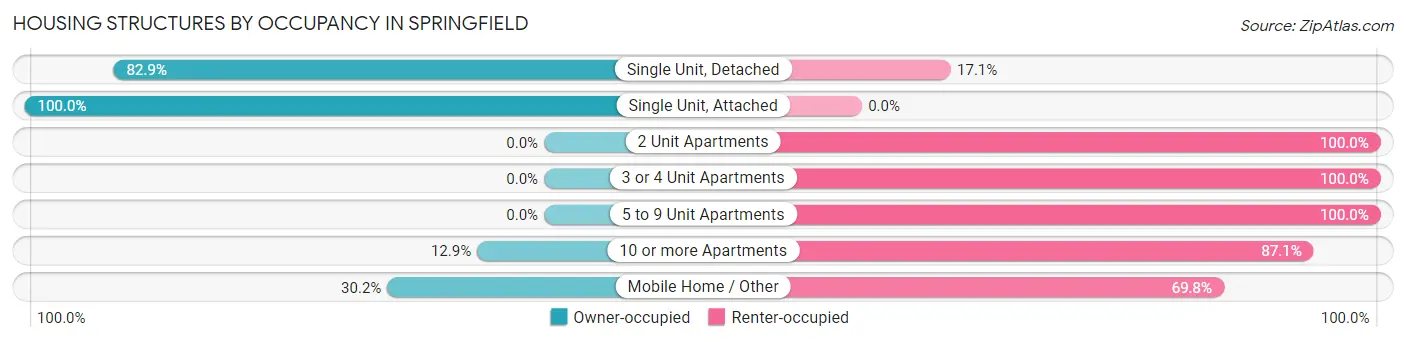
| Structure Type | Owner-occupied | Renter-occupied |
| Single Unit, Detached | 726 (82.9%) | 150 (17.1%) |
| Single Unit, Attached | 26 (100.0%) | 0 (0.0%) |
| 2 Unit Apartments | 0 (0.0%) | 111 (100.0%) |
| 3 or 4 Unit Apartments | 0 (0.0%) | 23 (100.0%) |
| 5 to 9 Unit Apartments | 0 (0.0%) | 7 (100.0%) |
| 10 or more Apartments | 4 (12.9%) | 27 (87.1%) |
| Mobile Home / Other | 16 (30.2%) | 37 (69.8%) |
| Total | 772 (68.5%) | 355 (31.5%) |
Housing Structures by Number of Rooms in Springfield
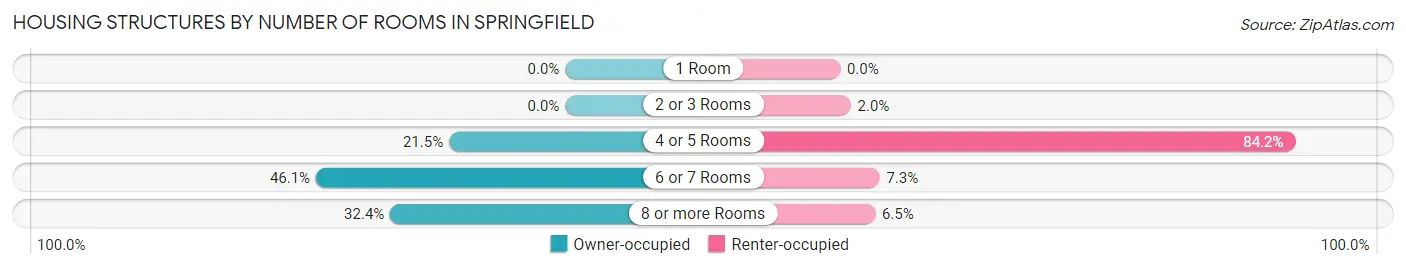
| Number of Rooms | Owner-occupied | Renter-occupied |
| 1 Room | 0 (0.0%) | 0 (0.0%) |
| 2 or 3 Rooms | 0 (0.0%) | 7 (2.0%) |
| 4 or 5 Rooms | 166 (21.5%) | 299 (84.2%) |
| 6 or 7 Rooms | 356 (46.1%) | 26 (7.3%) |
| 8 or more Rooms | 250 (32.4%) | 23 (6.5%) |
| Total | 772 (100.0%) | 355 (100.0%) |
Housing Structure by Heating Type in Springfield
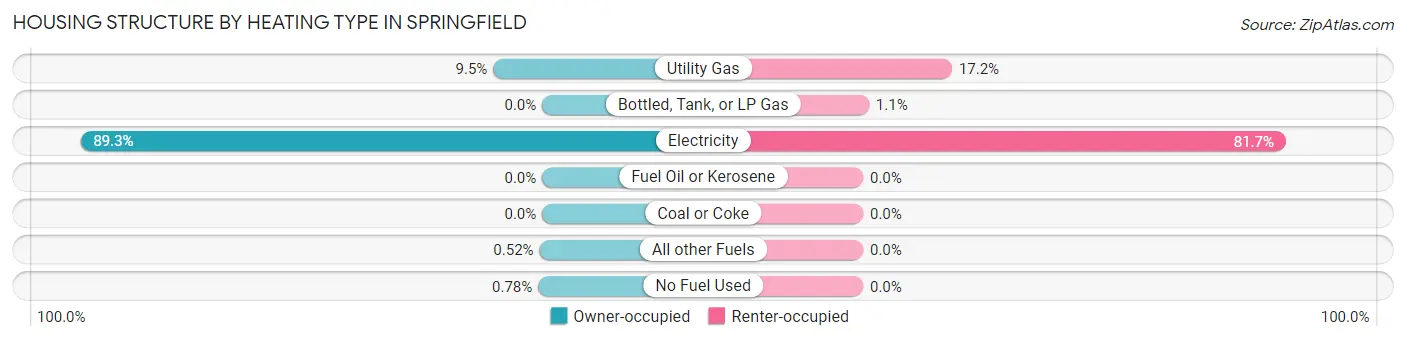
| Heating Type | Owner-occupied | Renter-occupied |
| Utility Gas | 73 (9.5%) | 61 (17.2%) |
| Bottled, Tank, or LP Gas | 0 (0.0%) | 4 (1.1%) |
| Electricity | 689 (89.2%) | 290 (81.7%) |
| Fuel Oil or Kerosene | 0 (0.0%) | 0 (0.0%) |
| Coal or Coke | 0 (0.0%) | 0 (0.0%) |
| All other Fuels | 4 (0.5%) | 0 (0.0%) |
| No Fuel Used | 6 (0.8%) | 0 (0.0%) |
| Total | 772 (100.0%) | 355 (100.0%) |
Household Vehicle Usage in Springfield
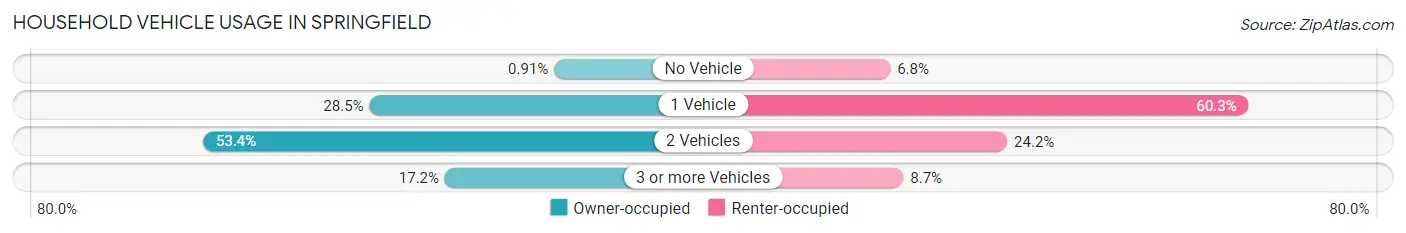
| Vehicles per Household | Owner-occupied | Renter-occupied |
| No Vehicle | 7 (0.9%) | 24 (6.8%) |
| 1 Vehicle | 220 (28.5%) | 214 (60.3%) |
| 2 Vehicles | 412 (53.4%) | 86 (24.2%) |
| 3 or more Vehicles | 133 (17.2%) | 31 (8.7%) |
| Total | 772 (100.0%) | 355 (100.0%) |
Real Estate & Mortgages in Springfield
Real Estate and Mortgage Overview in Springfield
| Characteristic | Without Mortgage | With Mortgage |
| Housing Units | 245 | 527 |
| Median Property Value | $165,800 | $152,400 |
| Median Household Income | $44,271 | $56 |
| Monthly Housing Costs | $557 | $0 |
| Real Estate Taxes | $1,659 | $0 |
Property Value by Mortgage Status in Springfield
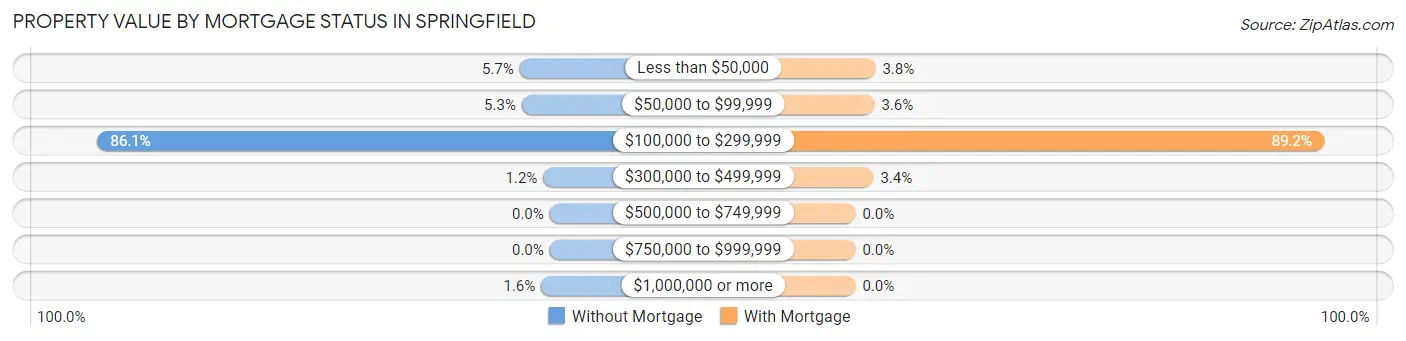
| Property Value | Without Mortgage | With Mortgage |
| Less than $50,000 | 14 (5.7%) | 20 (3.8%) |
| $50,000 to $99,999 | 13 (5.3%) | 19 (3.6%) |
| $100,000 to $299,999 | 211 (86.1%) | 470 (89.2%) |
| $300,000 to $499,999 | 3 (1.2%) | 18 (3.4%) |
| $500,000 to $749,999 | 0 (0.0%) | 0 (0.0%) |
| $750,000 to $999,999 | 0 (0.0%) | 0 (0.0%) |
| $1,000,000 or more | 4 (1.6%) | 0 (0.0%) |
| Total | 245 (100.0%) | 527 (100.0%) |
Household Income by Mortgage Status in Springfield
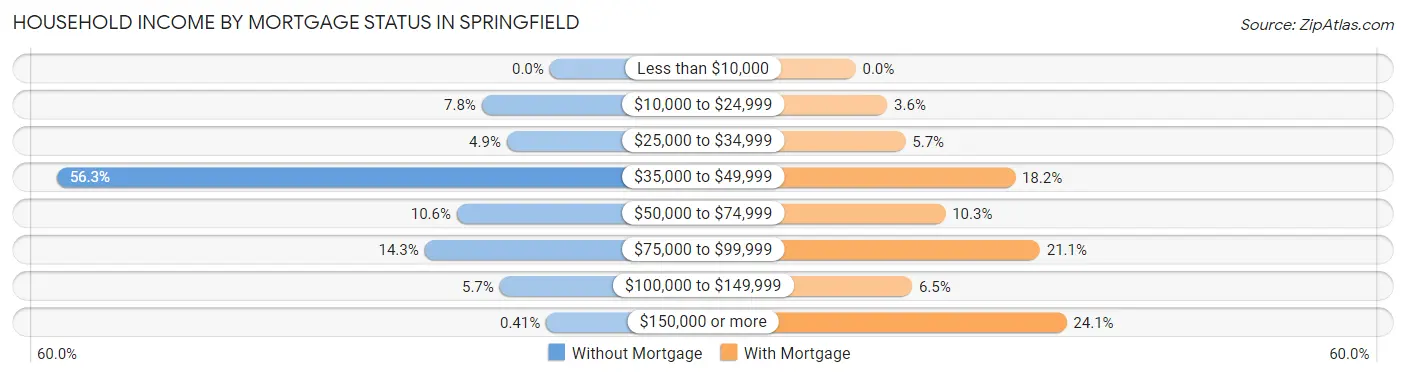
| Household Income | Without Mortgage | With Mortgage |
| Less than $10,000 | 0 (0.0%) | 0 (0.0%) |
| $10,000 to $24,999 | 19 (7.8%) | 19 (3.6%) |
| $25,000 to $34,999 | 12 (4.9%) | 30 (5.7%) |
| $35,000 to $49,999 | 138 (56.3%) | 96 (18.2%) |
| $50,000 to $74,999 | 26 (10.6%) | 54 (10.2%) |
| $75,000 to $99,999 | 35 (14.3%) | 111 (21.1%) |
| $100,000 to $149,999 | 14 (5.7%) | 34 (6.5%) |
| $150,000 or more | 1 (0.4%) | 127 (24.1%) |
| Total | 245 (100.0%) | 527 (100.0%) |
Property Value to Household Income Ratio in Springfield
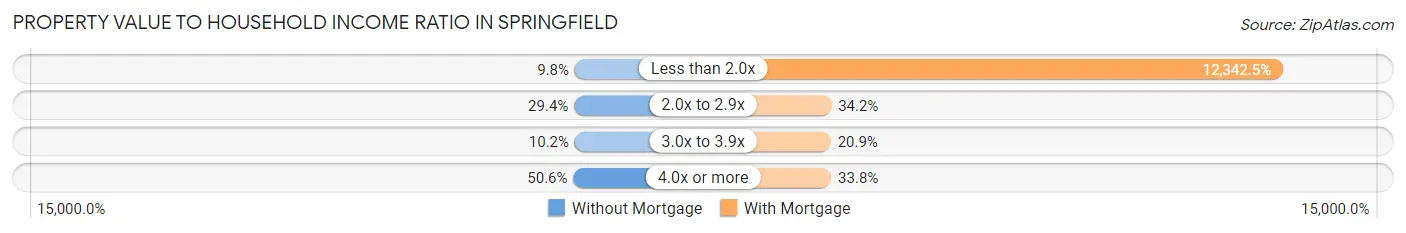
| Value-to-Income Ratio | Without Mortgage | With Mortgage |
| Less than 2.0x | 24 (9.8%) | 65,045 (12,342.5%) |
| 2.0x to 2.9x | 72 (29.4%) | 180 (34.2%) |
| 3.0x to 3.9x | 25 (10.2%) | 110 (20.9%) |
| 4.0x or more | 124 (50.6%) | 178 (33.8%) |
| Total | 245 (100.0%) | 527 (100.0%) |
Real Estate Taxes by Mortgage Status in Springfield
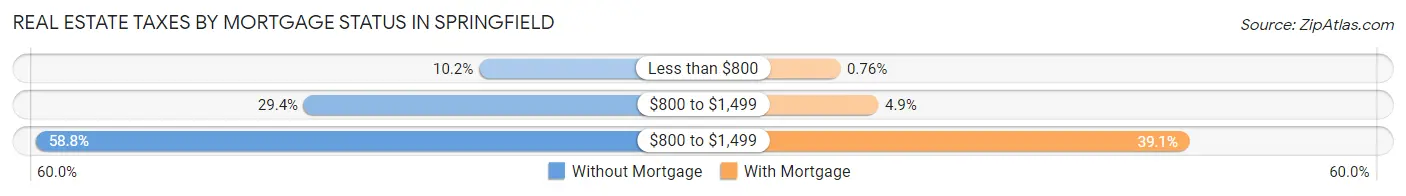
| Property Taxes | Without Mortgage | With Mortgage |
| Less than $800 | 25 (10.2%) | 4 (0.8%) |
| $800 to $1,499 | 72 (29.4%) | 26 (4.9%) |
| $800 to $1,499 | 144 (58.8%) | 206 (39.1%) |
| Total | 245 (100.0%) | 527 (100.0%) |
Health & Disability in Springfield
Health Insurance Coverage by Age in Springfield
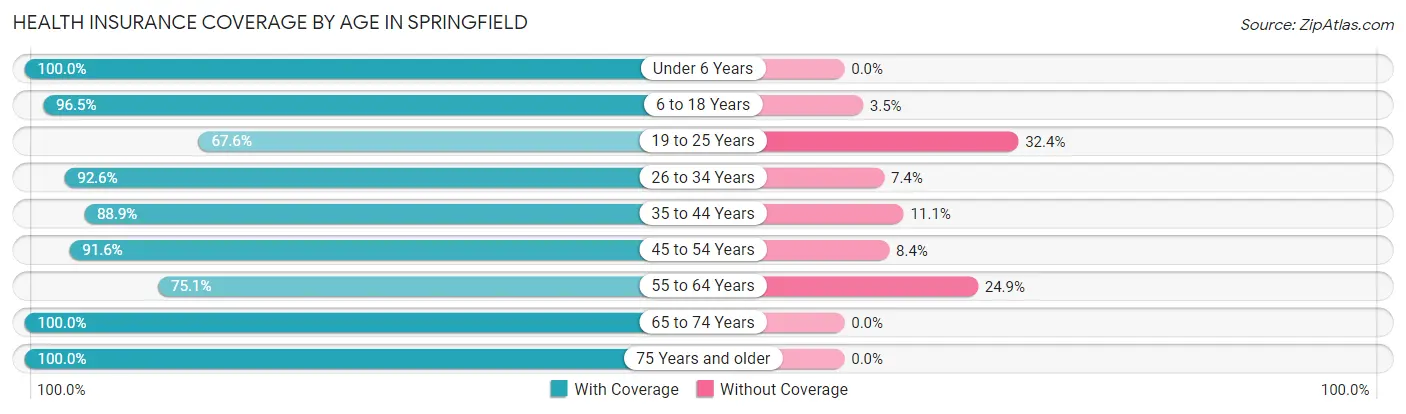
| Age Bracket | With Coverage | Without Coverage |
| Under 6 Years | 197 (100.0%) | 0 (0.0%) |
| 6 to 18 Years | 363 (96.5%) | 13 (3.5%) |
| 19 to 25 Years | 202 (67.6%) | 97 (32.4%) |
| 26 to 34 Years | 425 (92.6%) | 34 (7.4%) |
| 35 to 44 Years | 241 (88.9%) | 30 (11.1%) |
| 45 to 54 Years | 340 (91.6%) | 31 (8.4%) |
| 55 to 64 Years | 181 (75.1%) | 60 (24.9%) |
| 65 to 74 Years | 140 (100.0%) | 0 (0.0%) |
| 75 Years and older | 94 (100.0%) | 0 (0.0%) |
| Total | 2,183 (89.2%) | 265 (10.8%) |
Health Insurance Coverage by Citizenship Status in Springfield
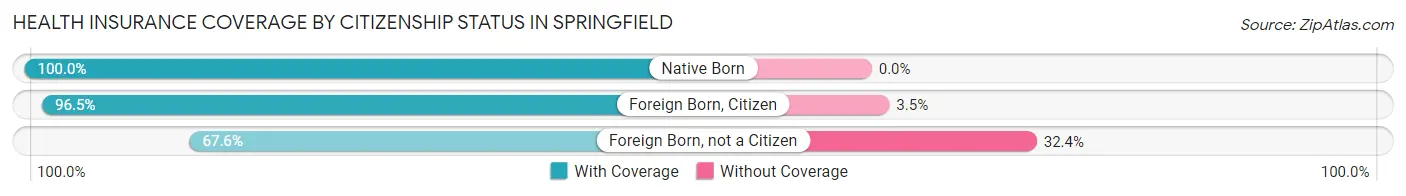
| Citizenship Status | With Coverage | Without Coverage |
| Native Born | 197 (100.0%) | 0 (0.0%) |
| Foreign Born, Citizen | 363 (96.5%) | 13 (3.5%) |
| Foreign Born, not a Citizen | 202 (67.6%) | 97 (32.4%) |
Health Insurance Coverage by Household Income in Springfield
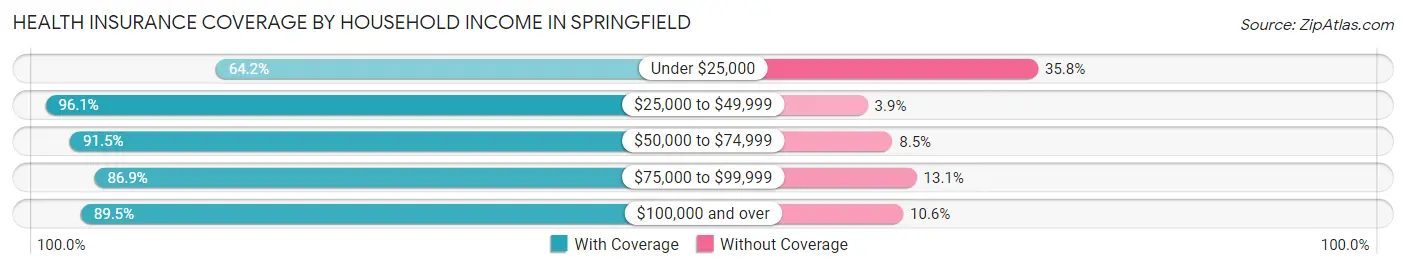
| Household Income | With Coverage | Without Coverage |
| Under $25,000 | 120 (64.2%) | 67 (35.8%) |
| $25,000 to $49,999 | 615 (96.1%) | 25 (3.9%) |
| $50,000 to $74,999 | 439 (91.5%) | 41 (8.5%) |
| $75,000 to $99,999 | 239 (86.9%) | 36 (13.1%) |
| $100,000 and over | 763 (89.4%) | 90 (10.5%) |
Public vs Private Health Insurance Coverage by Age in Springfield
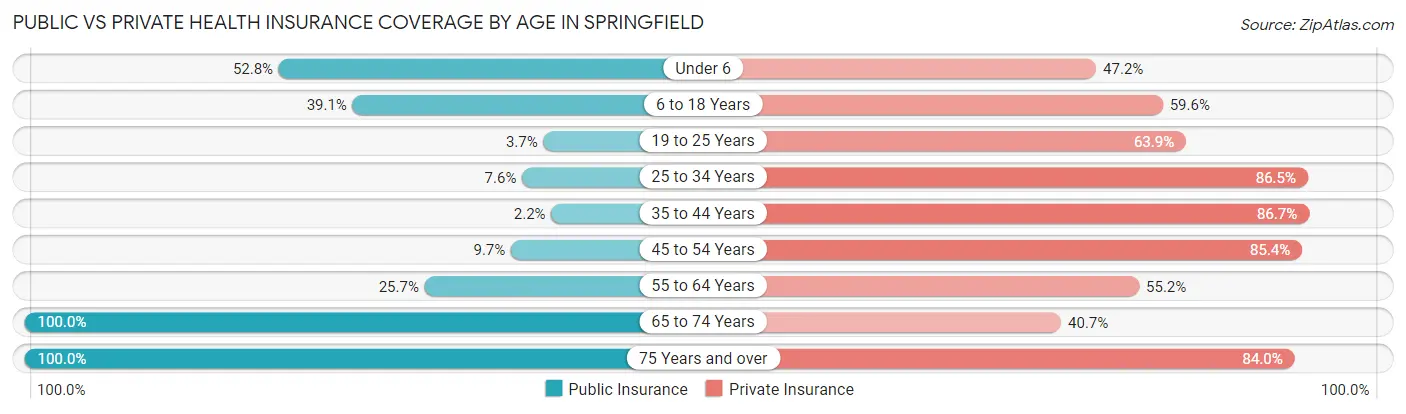
| Age Bracket | Public Insurance | Private Insurance |
| Under 6 | 104 (52.8%) | 93 (47.2%) |
| 6 to 18 Years | 147 (39.1%) | 224 (59.6%) |
| 19 to 25 Years | 11 (3.7%) | 191 (63.9%) |
| 25 to 34 Years | 35 (7.6%) | 397 (86.5%) |
| 35 to 44 Years | 6 (2.2%) | 235 (86.7%) |
| 45 to 54 Years | 36 (9.7%) | 317 (85.4%) |
| 55 to 64 Years | 62 (25.7%) | 133 (55.2%) |
| 65 to 74 Years | 140 (100.0%) | 57 (40.7%) |
| 75 Years and over | 94 (100.0%) | 79 (84.0%) |
| Total | 635 (25.9%) | 1,726 (70.5%) |
Disability Status by Sex by Age in Springfield
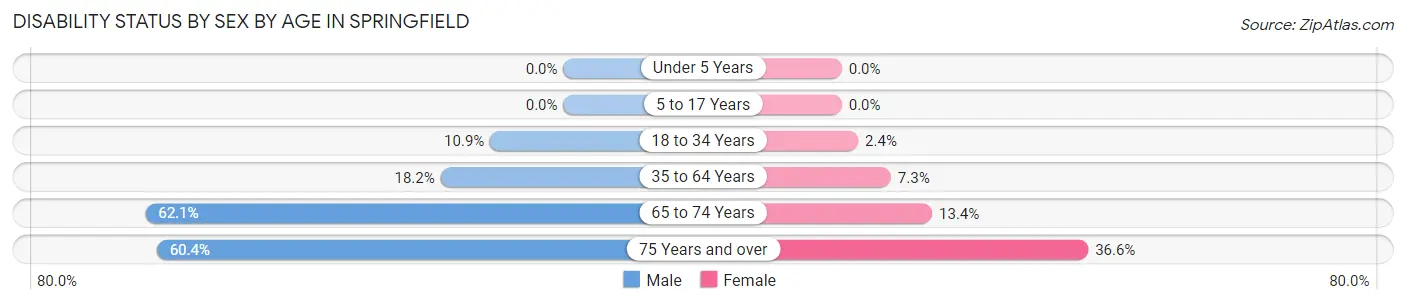
| Age Bracket | Male | Female |
| Under 5 Years | 0 (0.0%) | 0 (0.0%) |
| 5 to 17 Years | 0 (0.0%) | 0 (0.0%) |
| 18 to 34 Years | 35 (10.9%) | 11 (2.4%) |
| 35 to 64 Years | 81 (18.2%) | 32 (7.3%) |
| 65 to 74 Years | 36 (62.1%) | 11 (13.4%) |
| 75 Years and over | 32 (60.4%) | 15 (36.6%) |
Disability Class by Sex by Age in Springfield
Disability Class: Hearing Difficulty
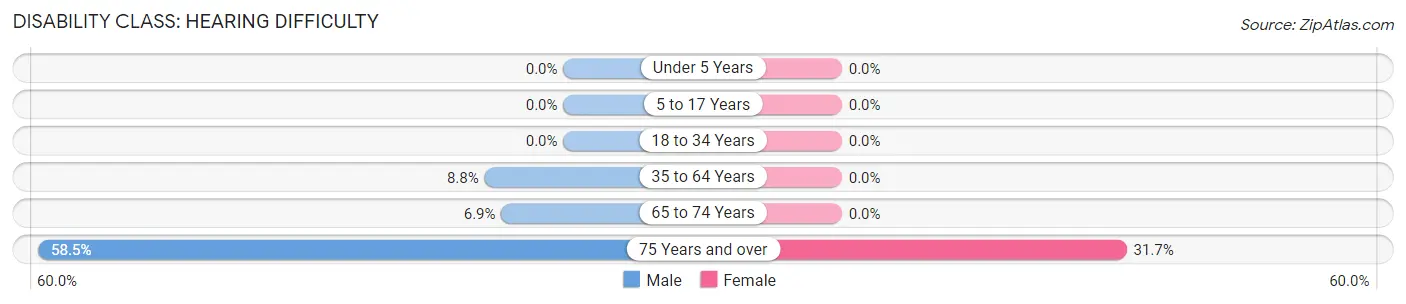
| Age Bracket | Male | Female |
| Under 5 Years | 0 (0.0%) | 0 (0.0%) |
| 5 to 17 Years | 0 (0.0%) | 0 (0.0%) |
| 18 to 34 Years | 0 (0.0%) | 0 (0.0%) |
| 35 to 64 Years | 39 (8.8%) | 0 (0.0%) |
| 65 to 74 Years | 4 (6.9%) | 0 (0.0%) |
| 75 Years and over | 31 (58.5%) | 13 (31.7%) |
Disability Class: Vision Difficulty
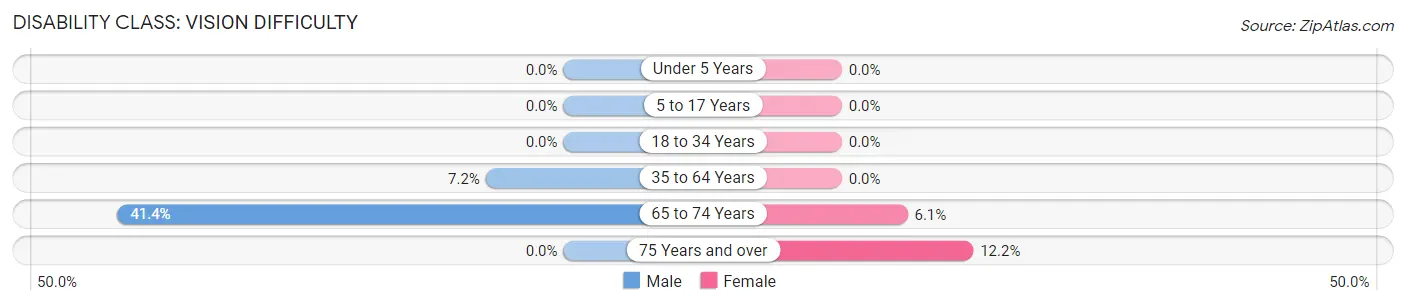
| Age Bracket | Male | Female |
| Under 5 Years | 0 (0.0%) | 0 (0.0%) |
| 5 to 17 Years | 0 (0.0%) | 0 (0.0%) |
| 18 to 34 Years | 0 (0.0%) | 0 (0.0%) |
| 35 to 64 Years | 32 (7.2%) | 0 (0.0%) |
| 65 to 74 Years | 24 (41.4%) | 5 (6.1%) |
| 75 Years and over | 0 (0.0%) | 5 (12.2%) |
Disability Class: Cognitive Difficulty
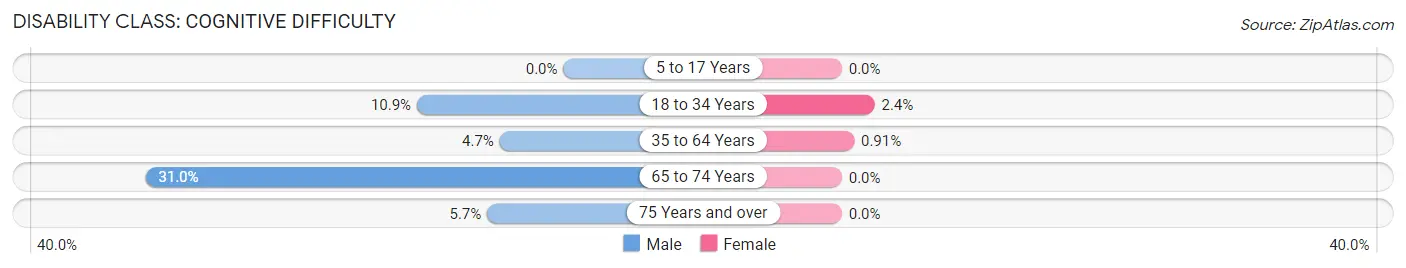
| Age Bracket | Male | Female |
| 5 to 17 Years | 0 (0.0%) | 0 (0.0%) |
| 18 to 34 Years | 35 (10.9%) | 11 (2.4%) |
| 35 to 64 Years | 21 (4.7%) | 4 (0.9%) |
| 65 to 74 Years | 18 (31.0%) | 0 (0.0%) |
| 75 Years and over | 3 (5.7%) | 0 (0.0%) |
Disability Class: Ambulatory Difficulty
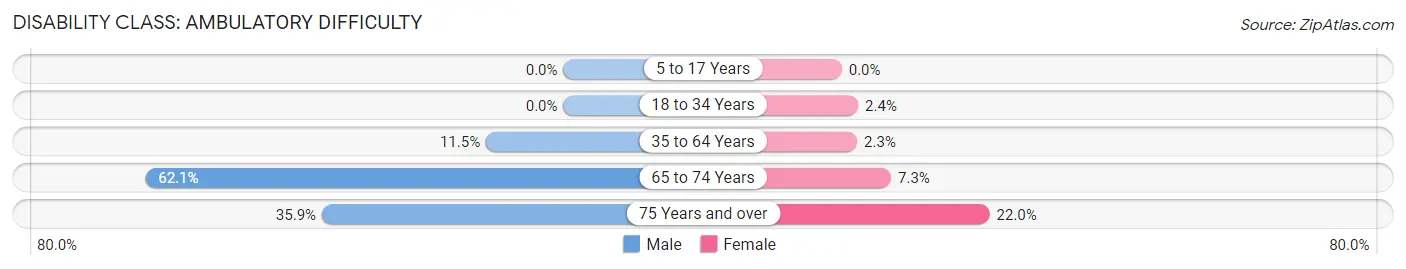
| Age Bracket | Male | Female |
| 5 to 17 Years | 0 (0.0%) | 0 (0.0%) |
| 18 to 34 Years | 0 (0.0%) | 11 (2.4%) |
| 35 to 64 Years | 51 (11.5%) | 10 (2.3%) |
| 65 to 74 Years | 36 (62.1%) | 6 (7.3%) |
| 75 Years and over | 19 (35.8%) | 9 (22.0%) |
Disability Class: Self-Care Difficulty
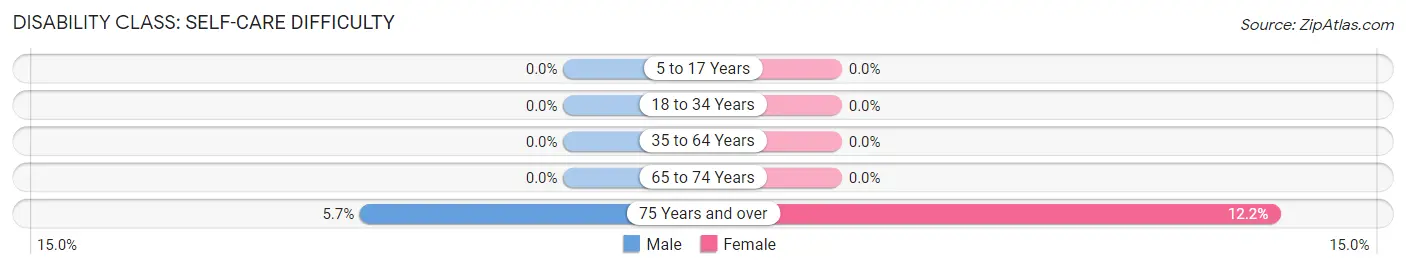
| Age Bracket | Male | Female |
| 5 to 17 Years | 0 (0.0%) | 0 (0.0%) |
| 18 to 34 Years | 0 (0.0%) | 0 (0.0%) |
| 35 to 64 Years | 0 (0.0%) | 0 (0.0%) |
| 65 to 74 Years | 0 (0.0%) | 0 (0.0%) |
| 75 Years and over | 3 (5.7%) | 5 (12.2%) |
Technology Access in Springfield
Computing Device Access in Springfield
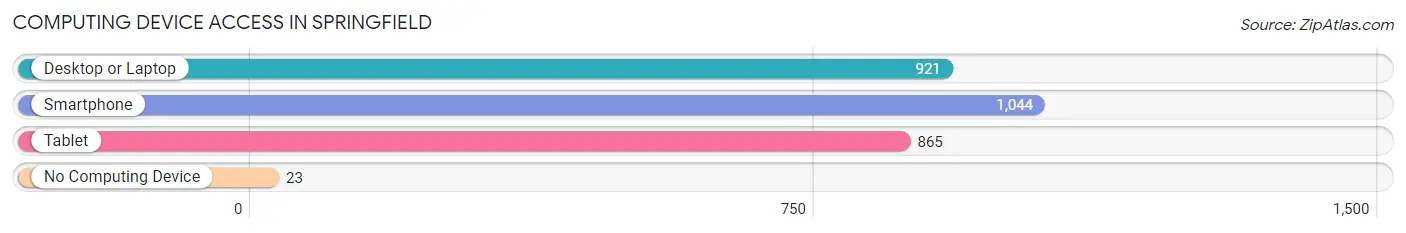
| Device Type | # Households | % Households |
| Desktop or Laptop | 921 | 81.7% |
| Smartphone | 1,044 | 92.6% |
| Tablet | 865 | 76.7% |
| No Computing Device | 23 | 2.0% |
| Total | 1,127 | 100.0% |
Internet Access in Springfield
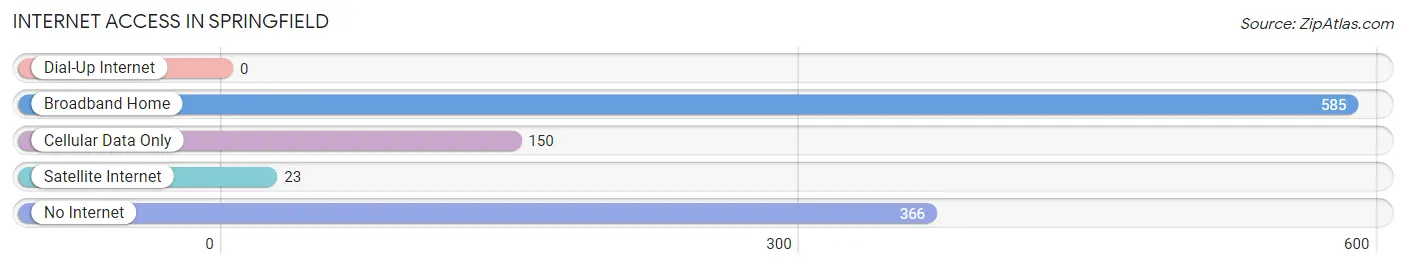
| Internet Type | # Households | % Households |
| Dial-Up Internet | 0 | 0.0% |
| Broadband Home | 585 | 51.9% |
| Cellular Data Only | 150 | 13.3% |
| Satellite Internet | 23 | 2.0% |
| No Internet | 366 | 32.5% |
| Total | 1,127 | 100.0% |
Springfield Summary
Springfield, Georgia is a small town located in Effingham County, Georgia. It is situated about 25 miles northwest of Savannah and is part of the Savannah Metropolitan Statistical Area. The town has a population of approximately 1,500 people and is known for its rural charm and friendly atmosphere.
History
The area that is now Springfield was first settled in the late 1700s by a group of settlers from South Carolina. The town was originally known as “Springfield Plantation” and was named after the plantation’s owner, William Springfield. The town was officially incorporated in 1883 and was named after the plantation.
In the late 1800s, Springfield was a thriving agricultural community. The town was home to several cotton plantations and was known for its production of cotton, corn, and other crops. The town also had a thriving lumber industry and was home to several sawmills.
In the early 1900s, Springfield began to experience a decline in its agricultural industry. The town’s population began to decline as well, and by the 1950s, the town had a population of only about 500 people.
Geography
Springfield is located in the southeastern part of Effingham County, Georgia. The town is situated about 25 miles northwest of Savannah and is part of the Savannah Metropolitan Statistical Area. The town is located on the Ogeechee River and is surrounded by rural farmland.
The town has a total area of 2.2 square miles, all of which is land. The town has a humid subtropical climate, with hot, humid summers and mild winters.
Economy
The economy of Springfield is largely based on agriculture. The town is home to several farms that produce cotton, corn, and other crops. The town also has a thriving lumber industry and is home to several sawmills.
In addition to agriculture, Springfield is home to several small businesses, including restaurants, retail stores, and service providers. The town is also home to a few manufacturing companies, including a furniture manufacturer and a plastics manufacturer.
Demographics
As of the 2010 census, Springfield had a population of 1,500 people. The racial makeup of the town was 94.7% White, 2.7% African American, 0.7% Native American, 0.3% Asian, and 1.7% from other races.
The median household income in Springfield was $37,500, and the median family income was $45,000. The per capita income in the town was $18,000. About 11.7% of the population was below the poverty line.
Conclusion
Springfield, Georgia is a small town located in Effingham County, Georgia. It is situated about 25 miles northwest of Savannah and is part of the Savannah Metropolitan Statistical Area. The town has a population of approximately 1,500 people and is known for its rural charm and friendly atmosphere. The economy of Springfield is largely based on agriculture, with a few small businesses and manufacturing companies. The town has a humid subtropical climate, with hot, humid summers and mild winters. The racial makeup of the town is 94.7% White, 2.7% African American, 0.7% Native American, 0.3% Asian, and 1.7% from other races. The median household income in Springfield was $37,500, and the median family income was $45,000.
Common Questions
What is Per Capita Income in Springfield?
Per Capita income in Springfield is $60,066.
What is the Median Family Income in Springfield?
Median Family Income in Springfield is $74,250.
What is the Median Household income in Springfield?
Median Household Income in Springfield is $46,936.
What is Income or Wage Gap in Springfield?
Income or Wage Gap in Springfield is 24.4%.
Women in Springfield earn 75.6 cents for every dollar earned by a man.
What is Inequality or Gini Index in Springfield?
Inequality or Gini Index in Springfield is 0.66.
What is the Total Population of Springfield?
Total Population of Springfield is 2,753.
What is the Total Male Population of Springfield?
Total Male Population of Springfield is 1,406.
What is the Total Female Population of Springfield?
Total Female Population of Springfield is 1,347.
What is the Ratio of Males per 100 Females in Springfield?
There are 104.38 Males per 100 Females in Springfield.
What is the Ratio of Females per 100 Males in Springfield?
There are 95.80 Females per 100 Males in Springfield.
What is the Median Population Age in Springfield?
Median Population Age in Springfield is 32.8 Years.
What is the Average Family Size in Springfield
Average Family Size in Springfield is 2.9 People.
What is the Average Household Size in Springfield
Average Household Size in Springfield is 2.2 People.
How Large is the Labor Force in Springfield?
There are 1,440 People in the Labor Forcein in Springfield.
What is the Percentage of People in the Labor Force in Springfield?
64.0% of People are in the Labor Force in Springfield.
What is the Unemployment Rate in Springfield?
Unemployment Rate in Springfield is 1.0%.