Zip Codes with the Highest Percentage of Population Employed in Legal Services & Support in Rome, GA
RELATED REPORTS & OPTIONS
Legal Services & Support
Rome
Compare Zip Codes
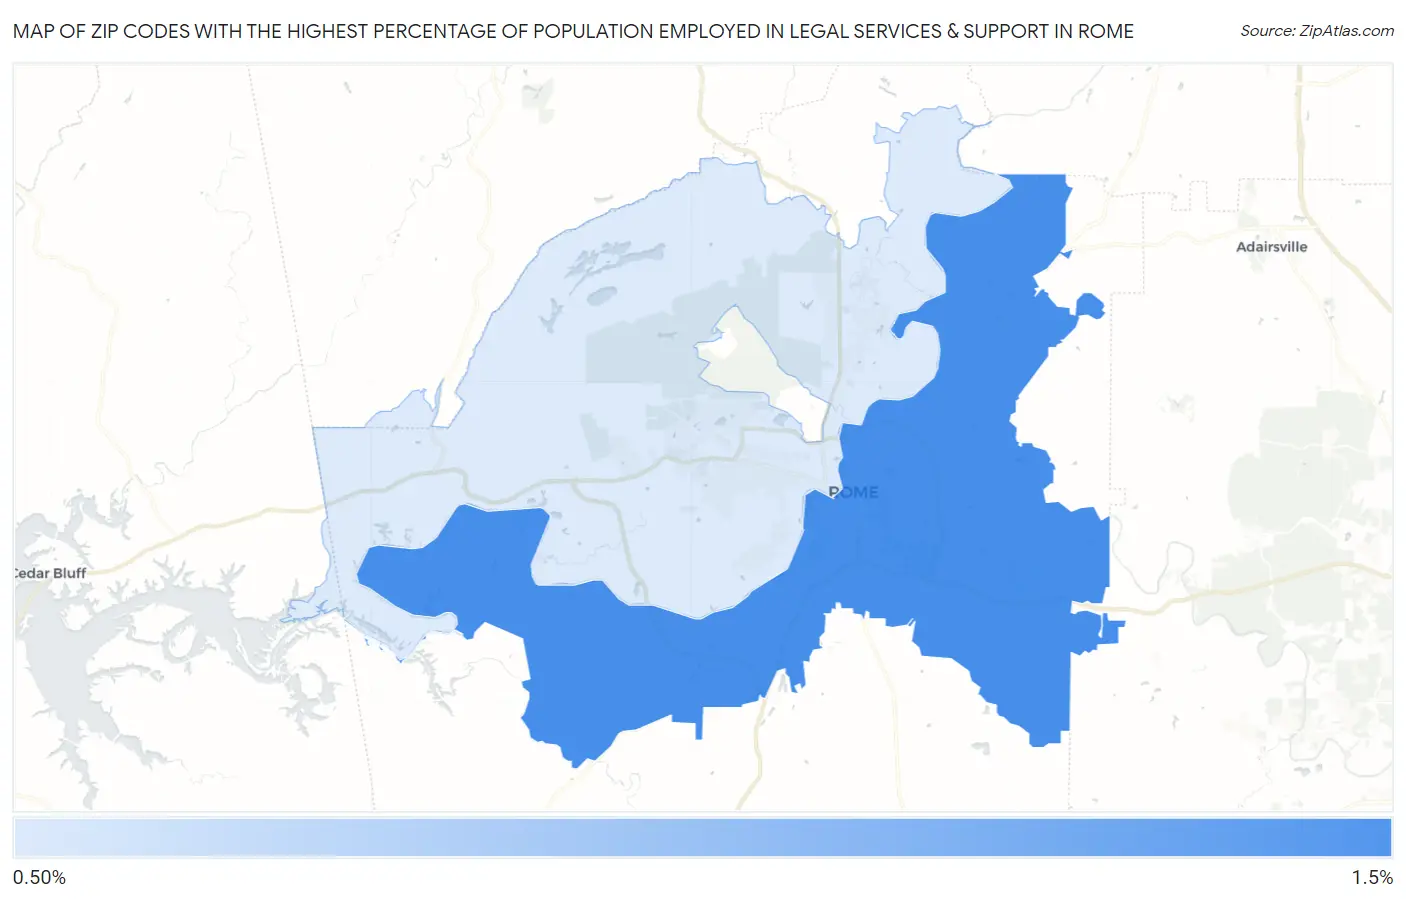
Map of Zip Codes with the Highest Percentage of Population Employed in Legal Services & Support in Rome
0.67%
1.1%
Zip Codes with the Highest Percentage of Population Employed in Legal Services & Support in Rome, GA
| Zip Code | % Employed | vs State | vs National | |
| 1. | 30161 | 1.1% | 1.1%(-0.018)#169 | 1.2%(-0.098)#7,270 |
| 2. | 30165 | 0.67% | 1.1%(-0.431)#257 | 1.2%(-0.511)#10,696 |
1
Common Questions
What are the Top Zip Codes with the Highest Percentage of Population Employed in Legal Services & Support in Rome, GA?
Top Zip Codes with the Highest Percentage of Population Employed in Legal Services & Support in Rome, GA are:
What zip code has the Highest Percentage of Population Employed in Legal Services & Support in Rome, GA?
30161 has the Highest Percentage of Population Employed in Legal Services & Support in Rome, GA with 1.1%.
What is the Percentage of Population Employed in Legal Services & Support in Rome, GA?
Percentage of Population Employed in Legal Services & Support in Rome is 1.1%.
What is the Percentage of Population Employed in Legal Services & Support in Georgia?
Percentage of Population Employed in Legal Services & Support in Georgia is 1.1%.
What is the Percentage of Population Employed in Legal Services & Support in the United States?
Percentage of Population Employed in Legal Services & Support in the United States is 1.2%.