Sparta, GA Map & Demographics
Sparta Map
Sparta Overview
$14,830
PER CAPITA INCOME
$35,117
AVG FAMILY INCOME
$22,102
AVG HOUSEHOLD INCOME
14.8%
WAGE / INCOME GAP [ % ]
85.2¢/ $1
WAGE / INCOME GAP [ $ ]
0.53
INEQUALITY / GINI INDEX
1,944
TOTAL POPULATION
755
MALE POPULATION
1,189
FEMALE POPULATION
63.50
MALES / 100 FEMALES
157.48
FEMALES / 100 MALES
26.9
MEDIAN AGE
4.9
AVG FAMILY SIZE
3.5
AVG HOUSEHOLD SIZE
679
LABOR FORCE [ PEOPLE ]
54.1%
PERCENT IN LABOR FORCE
11.6%
UNEMPLOYMENT RATE
Sparta Zip Codes
Sparta Area Codes
Income in Sparta
Income Overview in Sparta
Per Capita Income in Sparta is $14,830, while median incomes of families and households are $35,117 and $22,102 respectively.
| Characteristic | Number | Measure |
| Per Capita Income | 1,944 | $14,830 |
| Median Family Income | 327 | $35,117 |
| Mean Family Income | 327 | $53,988 |
| Median Household Income | 534 | $22,102 |
| Mean Household Income | 534 | $42,453 |
| Income Deficit | 327 | $0 |
| Wage / Income Gap (%) | 1,944 | 14.80% |
| Wage / Income Gap ($) | 1,944 | 85.20¢ per $1 |
| Gini / Inequality Index | 1,944 | 0.53 |
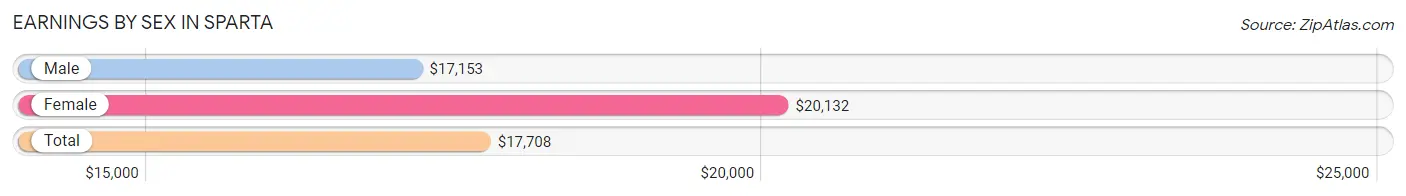
Earnings by Sex in Sparta
Average Earnings in Sparta are $17,708, $17,153 for men and $20,132 for women, a difference of 14.8%.
| Sex | Number | Average Earnings |
| Male | 358 (51.0%) | $17,153 |
| Female | 344 (49.0%) | $20,132 |
| Total | 702 (100.0%) | $17,708 |
Earnings by Sex by Income Bracket in Sparta
The most common earnings brackets in Sparta are $15,000 to $17,499 for men (72 | 20.1%) and $15,000 to $17,499 for women (86 | 25.0%).
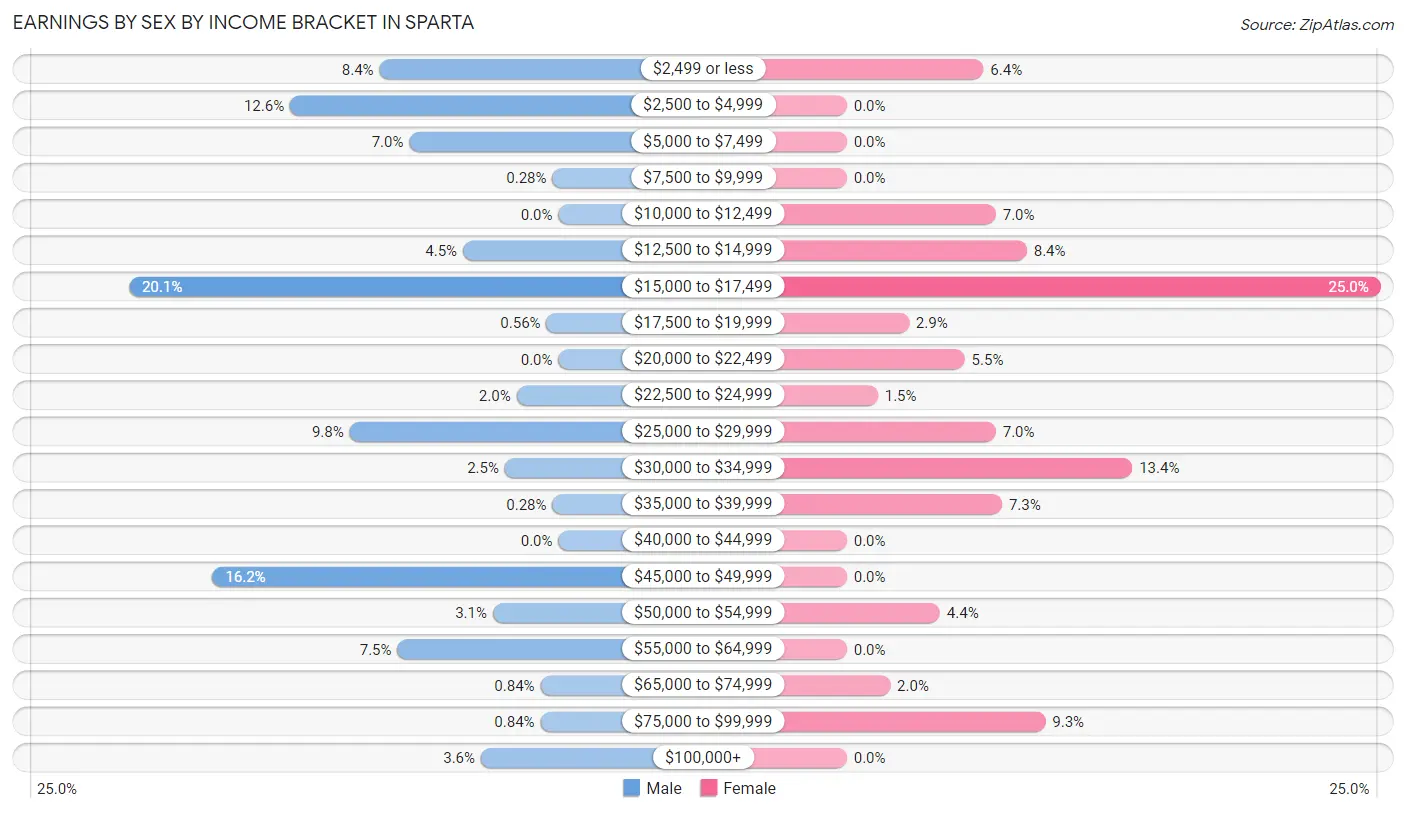
| Income | Male | Female |
| $2,499 or less | 30 (8.4%) | 22 (6.4%) |
| $2,500 to $4,999 | 45 (12.6%) | 0 (0.0%) |
| $5,000 to $7,499 | 25 (7.0%) | 0 (0.0%) |
| $7,500 to $9,999 | 1 (0.3%) | 0 (0.0%) |
| $10,000 to $12,499 | 0 (0.0%) | 24 (7.0%) |
| $12,500 to $14,999 | 16 (4.5%) | 29 (8.4%) |
| $15,000 to $17,499 | 72 (20.1%) | 86 (25.0%) |
| $17,500 to $19,999 | 2 (0.6%) | 10 (2.9%) |
| $20,000 to $22,499 | 0 (0.0%) | 19 (5.5%) |
| $22,500 to $24,999 | 7 (2.0%) | 5 (1.5%) |
| $25,000 to $29,999 | 35 (9.8%) | 24 (7.0%) |
| $30,000 to $34,999 | 9 (2.5%) | 46 (13.4%) |
| $35,000 to $39,999 | 1 (0.3%) | 25 (7.3%) |
| $40,000 to $44,999 | 0 (0.0%) | 0 (0.0%) |
| $45,000 to $49,999 | 58 (16.2%) | 0 (0.0%) |
| $50,000 to $54,999 | 11 (3.1%) | 15 (4.4%) |
| $55,000 to $64,999 | 27 (7.5%) | 0 (0.0%) |
| $65,000 to $74,999 | 3 (0.8%) | 7 (2.0%) |
| $75,000 to $99,999 | 3 (0.8%) | 32 (9.3%) |
| $100,000+ | 13 (3.6%) | 0 (0.0%) |
| Total | 358 (100.0%) | 344 (100.0%) |
Earnings by Sex by Educational Attainment in Sparta
Average earnings in Sparta are $45,583 for men and $20,132 for women, a difference of 55.8%. Men with an educational attainment of high school diploma enjoy the highest average annual earnings of $47,961, while those with bachelor's degree education earn the least with $47,917. Women with an educational attainment of high school diploma earn the most with the average annual earnings of $26,518, while those with college or associate's degree education have the smallest earnings of $17,083.
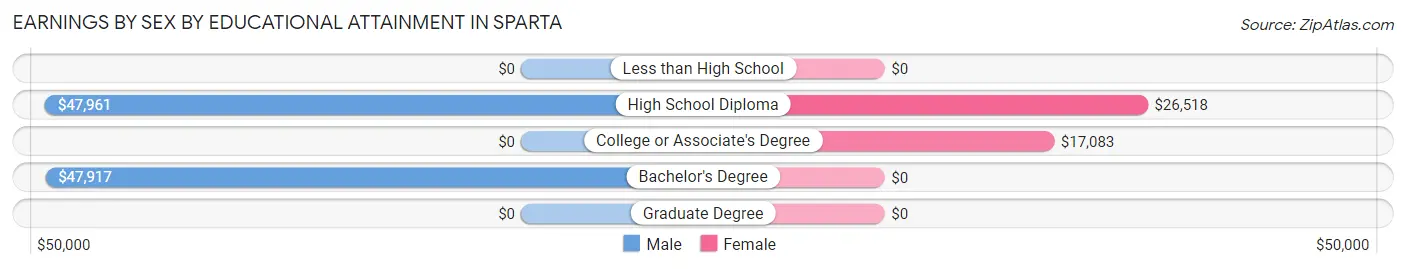
| Educational Attainment | Male Income | Female Income |
| Less than High School | - | - |
| High School Diploma | $47,961 | $26,518 |
| College or Associate's Degree | - | - |
| Bachelor's Degree | $47,917 | $0 |
| Graduate Degree | - | - |
| Total | $45,583 | $20,132 |
Family Income in Sparta
Family Income Brackets in Sparta
According to the Sparta family income data, there are 65 families falling into the $15,000 to $24,999 income range, which is the most common income bracket and makes up 19.9% of all families.
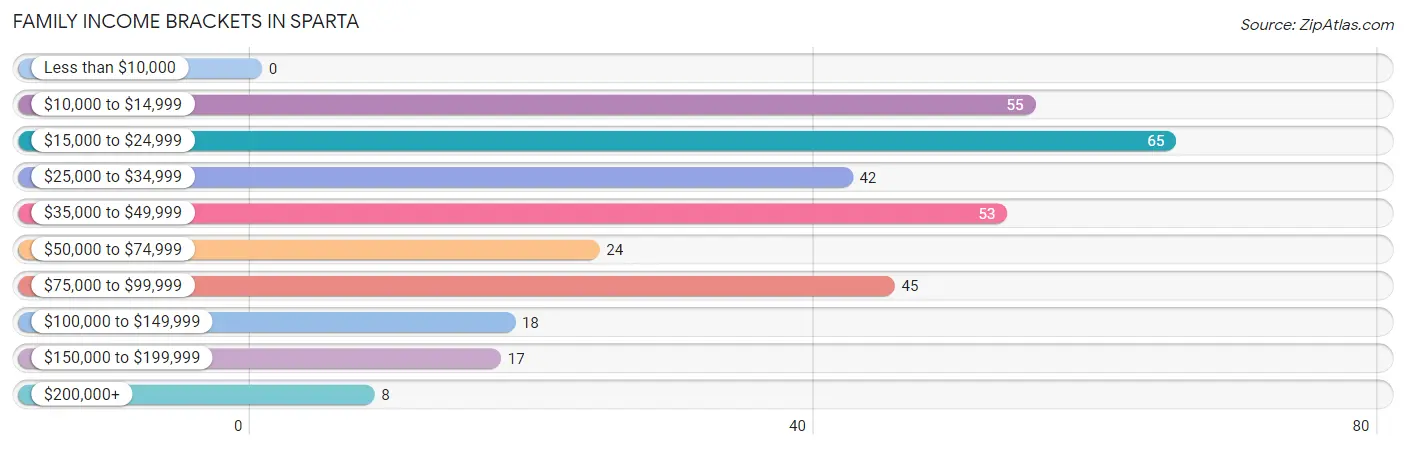
| Income Bracket | # Families | % Families |
| Less than $10,000 | 0 | 0.0% |
| $10,000 to $14,999 | 55 | 16.8% |
| $15,000 to $24,999 | 65 | 19.9% |
| $25,000 to $34,999 | 42 | 12.8% |
| $35,000 to $49,999 | 53 | 16.2% |
| $50,000 to $74,999 | 24 | 7.3% |
| $75,000 to $99,999 | 45 | 13.8% |
| $100,000 to $149,999 | 18 | 5.5% |
| $150,000 to $199,999 | 17 | 5.2% |
| $200,000+ | 8 | 2.4% |
Family Income by Famaliy Size in Sparta
2-person families (116 | 35.5%) account for the highest median family income in Sparta with $35,543 per family, while 2-person families (116 | 35.5%) have the highest median income of $17,772 per family member.
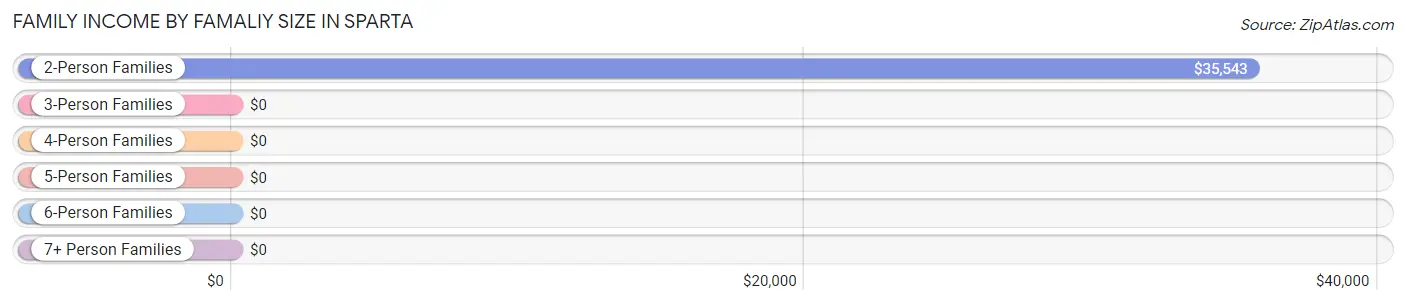
| Income Bracket | # Families | Median Income |
| 2-Person Families | 116 (35.5%) | $35,543 |
| 3-Person Families | 52 (15.9%) | $0 |
| 4-Person Families | 67 (20.5%) | $0 |
| 5-Person Families | 48 (14.7%) | $0 |
| 6-Person Families | 44 (13.5%) | $0 |
| 7+ Person Families | 0 (0.0%) | $0 |
| Total | 327 (100.0%) | $35,117 |
Family Income by Number of Earners in Sparta
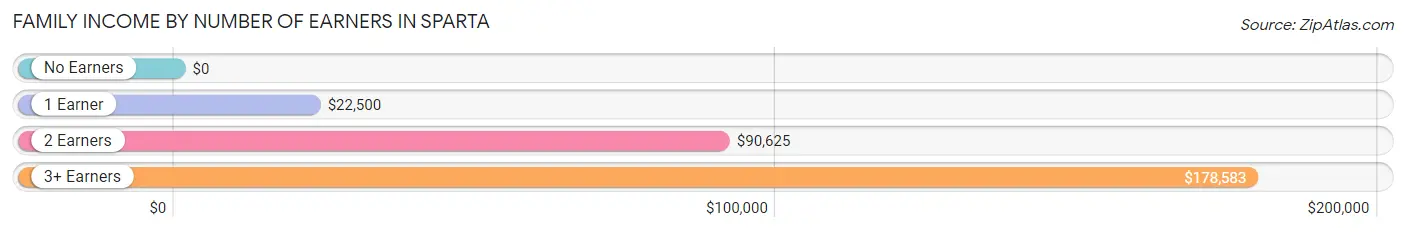
| Number of Earners | # Families | Median Income |
| No Earners | 52 (15.9%) | $0 |
| 1 Earner | 180 (55.0%) | $22,500 |
| 2 Earners | 74 (22.6%) | $90,625 |
| 3+ Earners | 21 (6.4%) | $178,583 |
| Total | 327 (100.0%) | $35,117 |
Household Income in Sparta
Household Income Brackets in Sparta
With 132 households falling in the category, the $10,000 to $14,999 income range is the most frequent in Sparta, accounting for 24.7% of all households. In contrast, only 8 households (1.5%) fall into the $200,000+ income bracket, making it the least populous group.
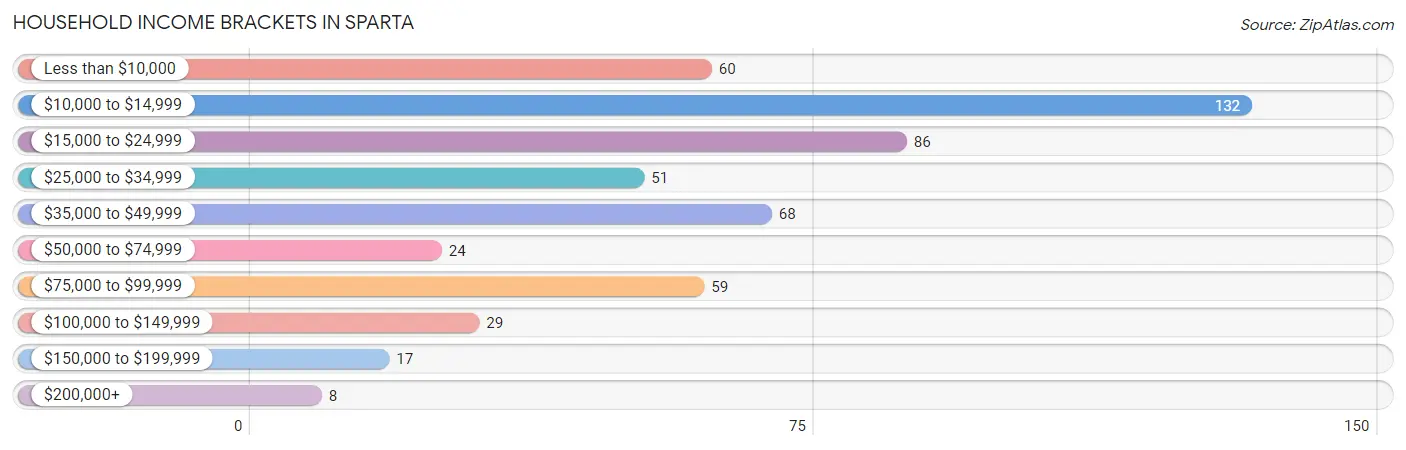
| Income Bracket | # Households | % Households |
| Less than $10,000 | 60 | 11.2% |
| $10,000 to $14,999 | 132 | 24.7% |
| $15,000 to $24,999 | 86 | 16.1% |
| $25,000 to $34,999 | 51 | 9.6% |
| $35,000 to $49,999 | 68 | 12.7% |
| $50,000 to $74,999 | 24 | 4.5% |
| $75,000 to $99,999 | 59 | 11.0% |
| $100,000 to $149,999 | 29 | 5.4% |
| $150,000 to $199,999 | 17 | 3.2% |
| $200,000+ | 8 | 1.5% |
Household Income by Householder Age in Sparta
The median household income in Sparta is $22,102, with the highest median household income of $26,146 found in the 65+ years age bracket for the primary householder. A total of 187 households (35.0%) fall into this category.
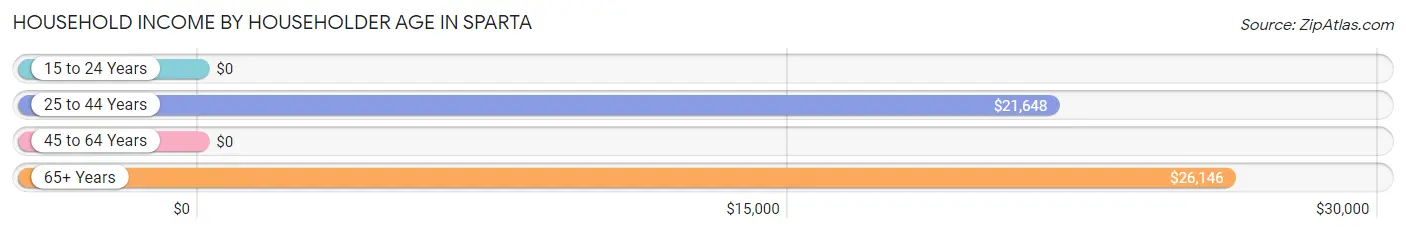
| Income Bracket | # Households | Median Income |
| 15 to 24 Years | 0 (0.0%) | $0 |
| 25 to 44 Years | 196 (36.7%) | $21,648 |
| 45 to 64 Years | 151 (28.3%) | $0 |
| 65+ Years | 187 (35.0%) | $26,146 |
| Total | 534 (100.0%) | $22,102 |
Poverty in Sparta
Income Below Poverty by Sex and Age in Sparta
With 30.2% poverty level for males and 63.6% for females among the residents of Sparta, 6 to 11 year old males and under 5 year old females are the most vulnerable to poverty, with 78 males (60.9%) and 119 females (100.0%) in their respective age groups living below the poverty level.
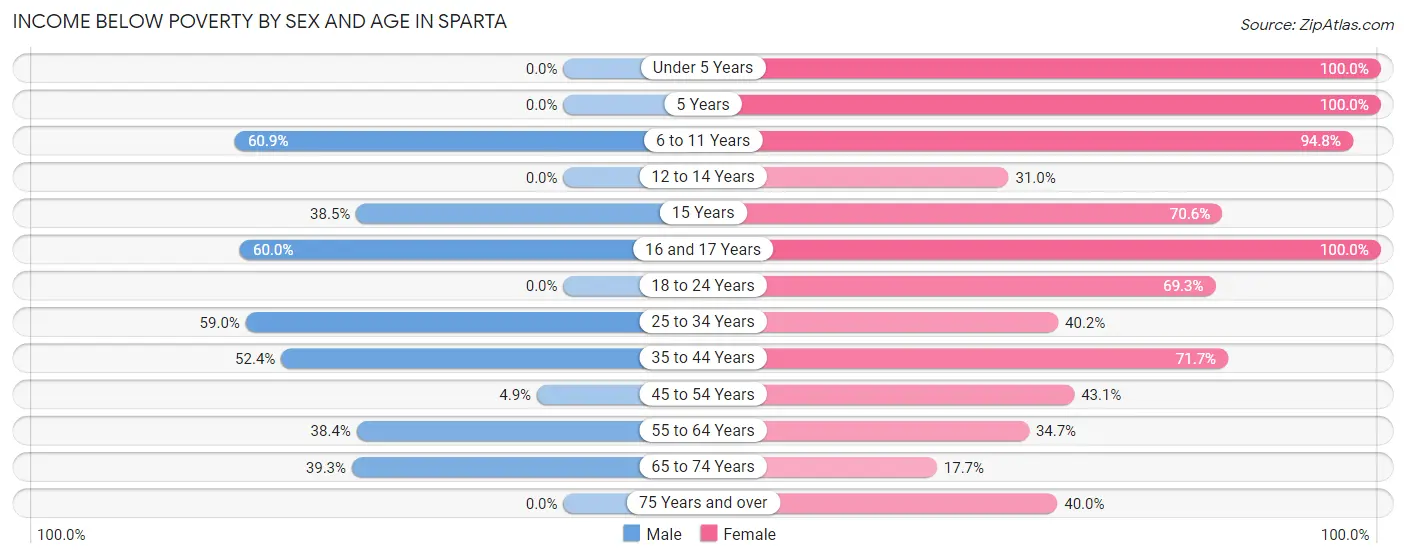
| Age Bracket | Male | Female |
| Under 5 Years | 0 (0.0%) | 119 (100.0%) |
| 5 Years | 0 (0.0%) | 60 (100.0%) |
| 6 to 11 Years | 78 (60.9%) | 183 (94.8%) |
| 12 to 14 Years | 0 (0.0%) | 26 (30.9%) |
| 15 Years | 5 (38.5%) | 48 (70.6%) |
| 16 and 17 Years | 6 (60.0%) | 16 (100.0%) |
| 18 to 24 Years | 0 (0.0%) | 61 (69.3%) |
| 25 to 34 Years | 23 (59.0%) | 53 (40.2%) |
| 35 to 44 Years | 11 (52.4%) | 86 (71.7%) |
| 45 to 54 Years | 5 (4.9%) | 22 (43.1%) |
| 55 to 64 Years | 33 (38.4%) | 33 (34.7%) |
| 65 to 74 Years | 53 (39.3%) | 18 (17.6%) |
| 75 Years and over | 0 (0.0%) | 12 (40.0%) |
| Total | 214 (30.2%) | 737 (63.6%) |
Income Above Poverty by Sex and Age in Sparta
According to the poverty statistics in Sparta, males aged under 5 years and females aged 65 to 74 years are the age groups that are most secure financially, with 100.0% of males and 82.4% of females in these age groups living above the poverty line.
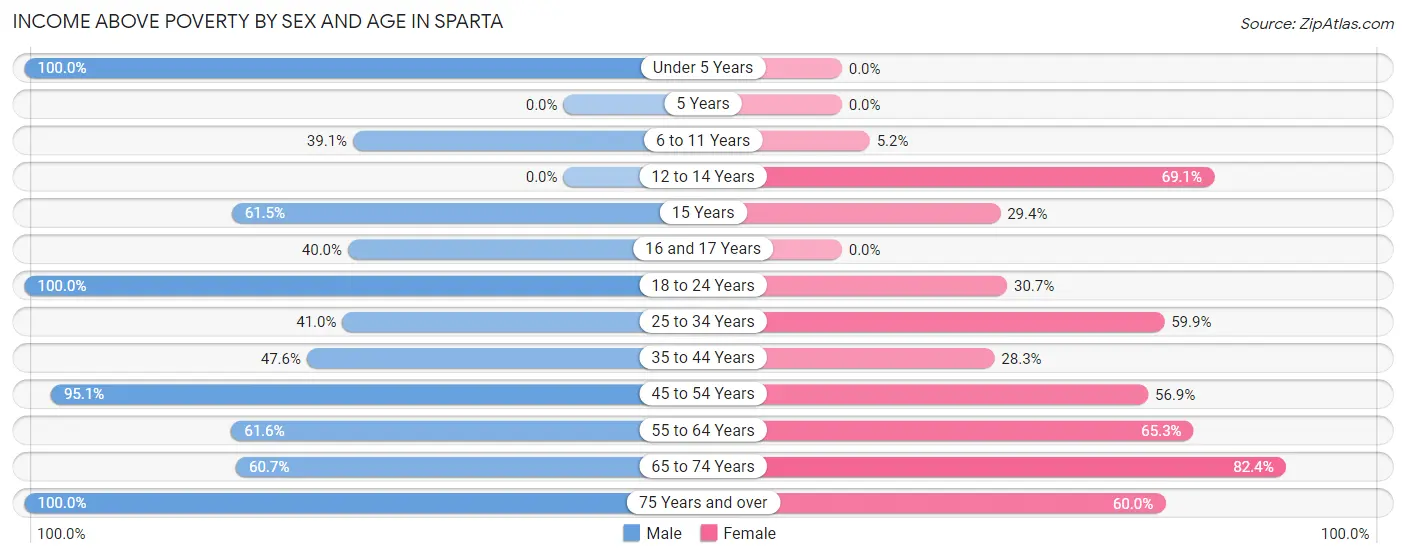
| Age Bracket | Male | Female |
| Under 5 Years | 16 (100.0%) | 0 (0.0%) |
| 5 Years | 0 (0.0%) | 0 (0.0%) |
| 6 to 11 Years | 50 (39.1%) | 10 (5.2%) |
| 12 to 14 Years | 0 (0.0%) | 58 (69.1%) |
| 15 Years | 8 (61.5%) | 20 (29.4%) |
| 16 and 17 Years | 4 (40.0%) | 0 (0.0%) |
| 18 to 24 Years | 141 (100.0%) | 27 (30.7%) |
| 25 to 34 Years | 16 (41.0%) | 79 (59.9%) |
| 35 to 44 Years | 10 (47.6%) | 34 (28.3%) |
| 45 to 54 Years | 97 (95.1%) | 29 (56.9%) |
| 55 to 64 Years | 53 (61.6%) | 62 (65.3%) |
| 65 to 74 Years | 82 (60.7%) | 84 (82.4%) |
| 75 Years and over | 17 (100.0%) | 18 (60.0%) |
| Total | 494 (69.8%) | 421 (36.4%) |
Income Below Poverty Among Married-Couple Families in Sparta
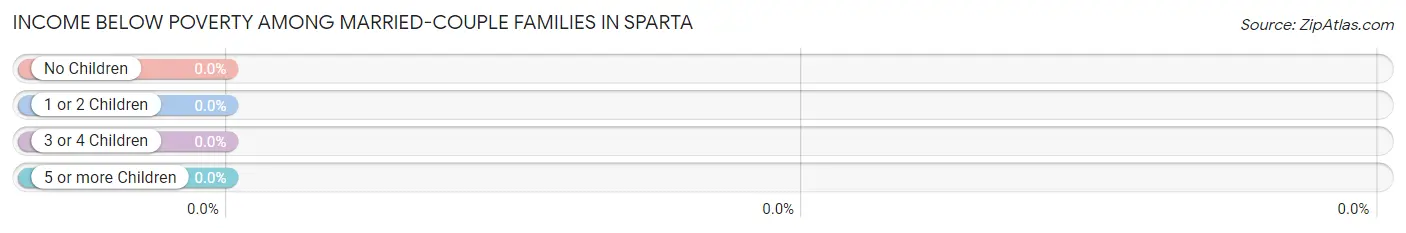
| Children | Above Poverty | Below Poverty |
| No Children | 61 (100.0%) | 0 (0.0%) |
| 1 or 2 Children | 36 (100.0%) | 0 (0.0%) |
| 3 or 4 Children | 0 (0.0%) | 0 (0.0%) |
| 5 or more Children | 0 (0.0%) | 0 (0.0%) |
| Total | 97 (100.0%) | 0 (0.0%) |
Income Below Poverty Among Single-Parent Households in Sparta
According to the poverty data in Sparta, 47.6% or 10 single-father households and 66.5% or 139 single-mother households are living below the poverty line. Among single-father households, those with no children have the highest poverty rate, with 10 households (47.6%) experiencing poverty. Likewise, among single-mother households, those with 3 or 4 children have the highest poverty rate, with 107 households (100.0%) falling below the poverty line.
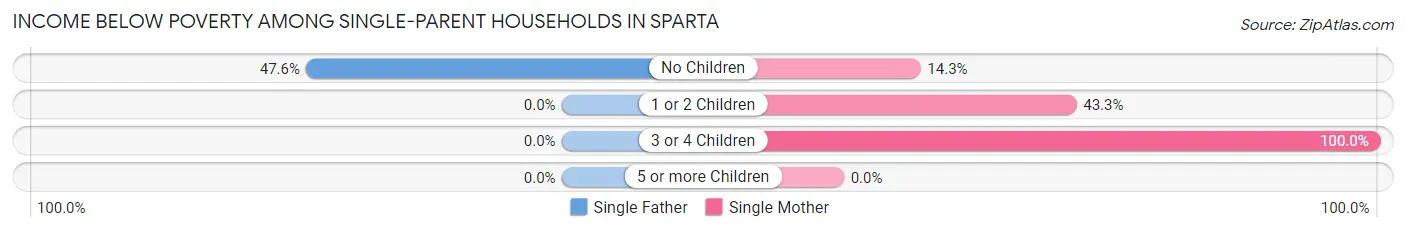
| Children | Single Father | Single Mother |
| No Children | 10 (47.6%) | 6 (14.3%) |
| 1 or 2 Children | 0 (0.0%) | 26 (43.3%) |
| 3 or 4 Children | 0 (0.0%) | 107 (100.0%) |
| 5 or more Children | 0 (0.0%) | 0 (0.0%) |
| Total | 10 (47.6%) | 139 (66.5%) |
Income Below Poverty Among Married-Couple vs Single-Parent Households in Sparta
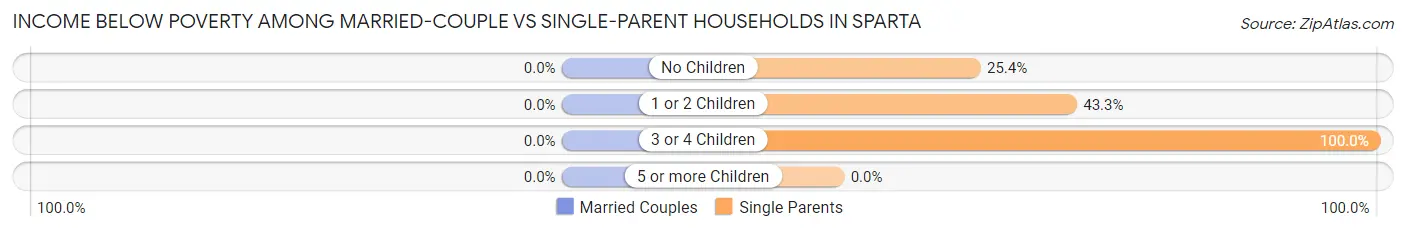
| Children | Married-Couple Families | Single-Parent Households |
| No Children | 0 (0.0%) | 16 (25.4%) |
| 1 or 2 Children | 0 (0.0%) | 26 (43.3%) |
| 3 or 4 Children | 0 (0.0%) | 107 (100.0%) |
| 5 or more Children | 0 (0.0%) | 0 (0.0%) |
| Total | 0 (0.0%) | 149 (64.8%) |
Race in Sparta
The most populous races in Sparta are Black / African American (1,715 | 88.2%), White / Caucasian (129 | 6.6%), and Asian (64 | 3.3%).
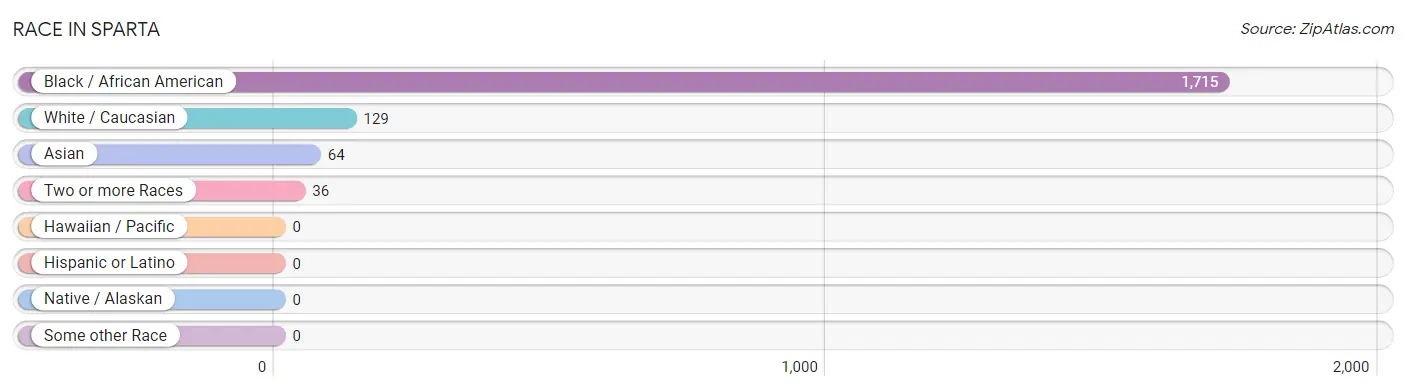
| Race | # Population | % Population |
| Asian | 64 | 3.3% |
| Black / African American | 1,715 | 88.2% |
| Hawaiian / Pacific | 0 | 0.0% |
| Hispanic or Latino | 0 | 0.0% |
| Native / Alaskan | 0 | 0.0% |
| White / Caucasian | 129 | 6.6% |
| Two or more Races | 36 | 1.8% |
| Some other Race | 0 | 0.0% |
| Total | 1,944 | 100.0% |
Ancestry in Sparta
The most populous ancestries reported in Sparta are American (94 | 4.8%), Thai (64 | 3.3%), Irish (10 | 0.5%), English (6 | 0.3%), and French (4 | 0.2%), together accounting for 9.2% of all Sparta residents.
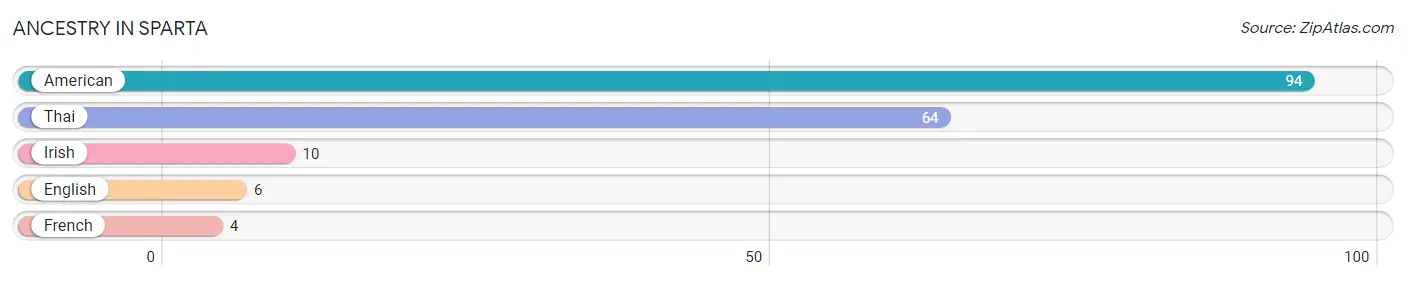
| Ancestry | # Population | % Population |
| American | 94 | 4.8% |
| English | 6 | 0.3% |
| French | 4 | 0.2% |
| Irish | 10 | 0.5% |
| Thai | 64 | 3.3% | View All 5 Rows |
Immigrants in Sparta
The most numerous immigrant groups reported in Sparta came from Asia (39 | 2.0%), India (39 | 2.0%), and South Central Asia (39 | 2.0%), together accounting for 6.0% of all Sparta residents.
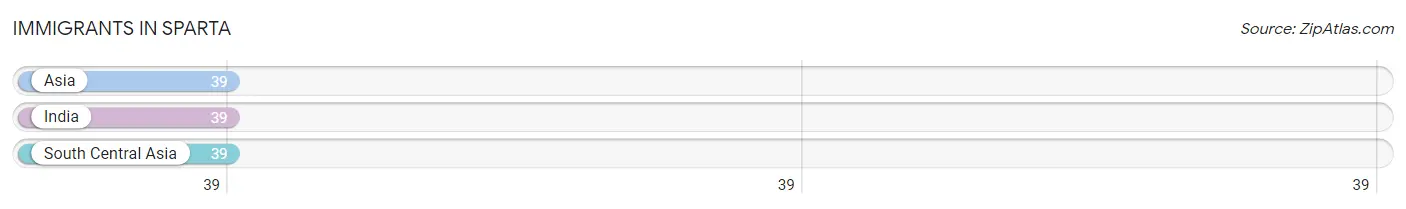
| Immigration Origin | # Population | % Population |
| Asia | 39 | 2.0% |
| India | 39 | 2.0% |
| South Central Asia | 39 | 2.0% | View All 3 Rows |
Sex and Age in Sparta
Sex and Age in Sparta
The most populous age groups in Sparta are 20 to 24 Years (142 | 18.8%) for men and 5 to 9 Years (227 | 19.1%) for women.
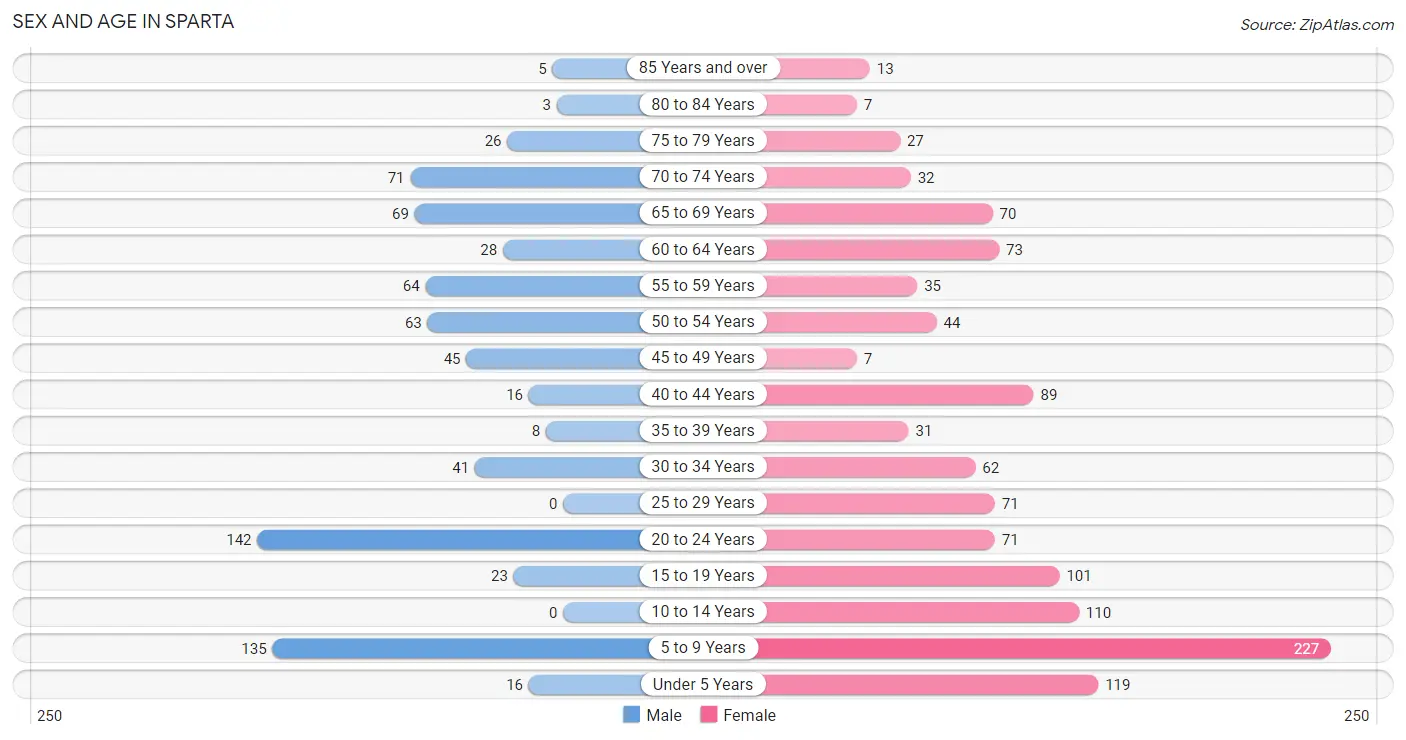
| Age Bracket | Male | Female |
| Under 5 Years | 16 (2.1%) | 119 (10.0%) |
| 5 to 9 Years | 135 (17.9%) | 227 (19.1%) |
| 10 to 14 Years | 0 (0.0%) | 110 (9.2%) |
| 15 to 19 Years | 23 (3.0%) | 101 (8.5%) |
| 20 to 24 Years | 142 (18.8%) | 71 (6.0%) |
| 25 to 29 Years | 0 (0.0%) | 71 (6.0%) |
| 30 to 34 Years | 41 (5.4%) | 62 (5.2%) |
| 35 to 39 Years | 8 (1.1%) | 31 (2.6%) |
| 40 to 44 Years | 16 (2.1%) | 89 (7.5%) |
| 45 to 49 Years | 45 (6.0%) | 7 (0.6%) |
| 50 to 54 Years | 63 (8.3%) | 44 (3.7%) |
| 55 to 59 Years | 64 (8.5%) | 35 (2.9%) |
| 60 to 64 Years | 28 (3.7%) | 73 (6.1%) |
| 65 to 69 Years | 69 (9.1%) | 70 (5.9%) |
| 70 to 74 Years | 71 (9.4%) | 32 (2.7%) |
| 75 to 79 Years | 26 (3.4%) | 27 (2.3%) |
| 80 to 84 Years | 3 (0.4%) | 7 (0.6%) |
| 85 Years and over | 5 (0.7%) | 13 (1.1%) |
| Total | 755 (100.0%) | 1,189 (100.0%) |
Families and Households in Sparta
Median Family Size in Sparta
The median family size in Sparta is 4.90 persons per family, with single female/mother families (209 | 63.9%) accounting for the largest median family size of 5.17 persons per family. On the other hand, single male/father families (21 | 6.4%) represent the smallest median family size with 2.05 persons per family.
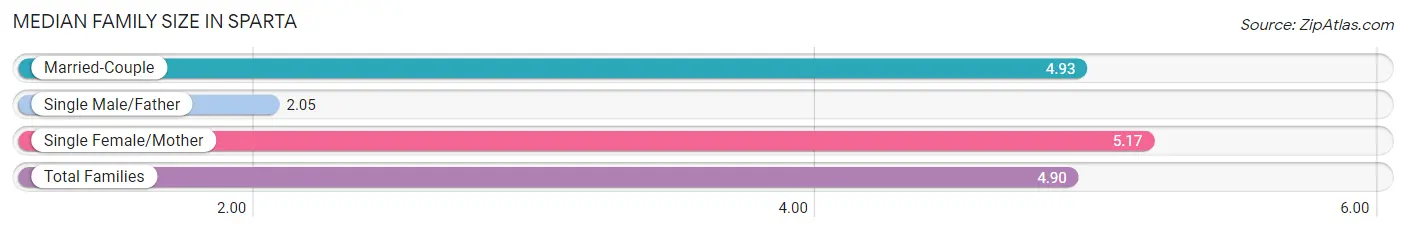
| Family Type | # Families | Family Size |
| Married-Couple | 97 (29.7%) | 4.93 |
| Single Male/Father | 21 (6.4%) | 2.05 |
| Single Female/Mother | 209 (63.9%) | 5.17 |
| Total Families | 327 (100.0%) | 4.90 |
Median Household Size in Sparta
The median household size in Sparta is 3.51 persons per household, with single female/mother households (209 | 39.1%) accounting for the largest median household size of 5.17 persons per household. non-family households (207 | 38.8%) represent the smallest median household size with 1.31 persons per household.
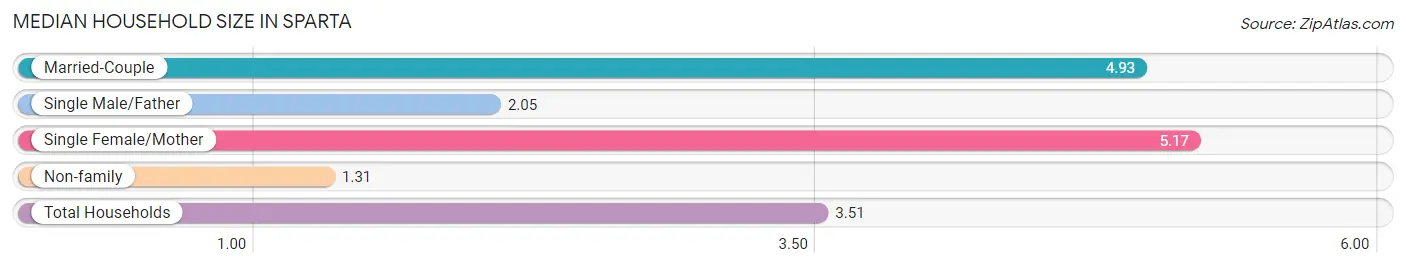
| Household Type | # Households | Household Size |
| Married-Couple | 97 (18.2%) | 4.93 |
| Single Male/Father | 21 (3.9%) | 2.05 |
| Single Female/Mother | 209 (39.1%) | 5.17 |
| Non-family | 207 (38.8%) | 1.31 |
| Total Households | 534 (100.0%) | 3.51 |
Household Size by Marriage Status in Sparta
Out of a total of 534 households in Sparta, 327 (61.2%) are family households, while 207 (38.8%) are nonfamily households. The most numerous type of family households are 2-person households, comprising 116, and the most common type of nonfamily households are 1-person households, comprising 153.
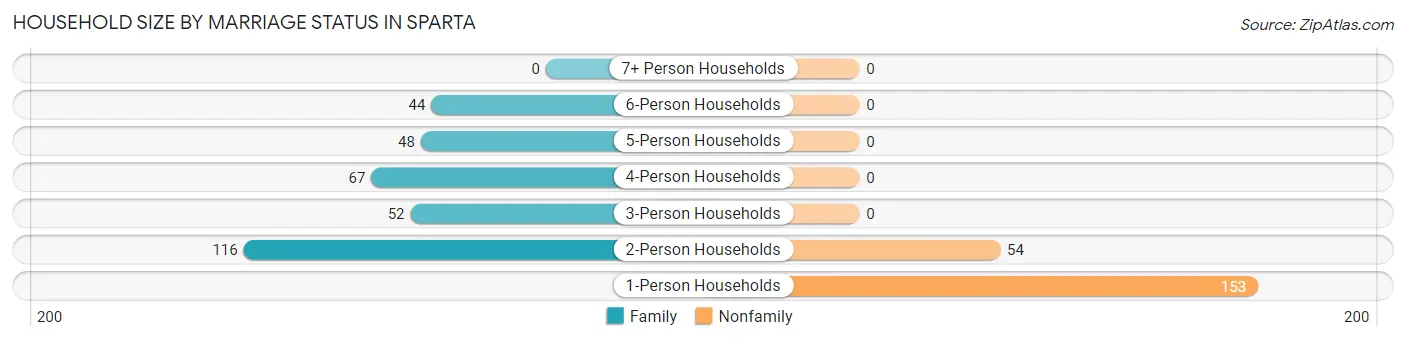
| Household Size | Family Households | Nonfamily Households |
| 1-Person Households | - | 153 (28.6%) |
| 2-Person Households | 116 (21.7%) | 54 (10.1%) |
| 3-Person Households | 52 (9.7%) | 0 (0.0%) |
| 4-Person Households | 67 (12.6%) | 0 (0.0%) |
| 5-Person Households | 48 (9.0%) | 0 (0.0%) |
| 6-Person Households | 44 (8.2%) | 0 (0.0%) |
| 7+ Person Households | 0 (0.0%) | 0 (0.0%) |
| Total | 327 (61.2%) | 207 (38.8%) |
Female Fertility in Sparta
Fertility by Age in Sparta
| Age Bracket | Women with Births | Births / 1,000 Women |
| 15 to 19 years | 0 (0.0%) | 0.0 |
| 20 to 34 years | 0 (0.0%) | 0.0 |
| 35 to 50 years | 0 (0.0%) | 0.0 |
| Total | 0 (0.0%) | 0.0 |
Fertility by Age by Marriage Status in Sparta
| Age Bracket | Married | Unmarried |
| 15 to 19 years | 0 (0.0%) | 0 (0.0%) |
| 20 to 34 years | 0 (0.0%) | 0 (0.0%) |
| 35 to 50 years | 0 (0.0%) | 0 (0.0%) |
| Total | 0 (0.0%) | 0 (0.0%) |
Fertility by Education in Sparta
| Educational Attainment | Women with Births | Births / 1,000 Women |
| Less than High School | 0 (0.0%) | 0.0 |
| High School Diploma | 0 (0.0%) | 0.0 |
| College or Associate's Degree | 0 (0.0%) | 0.0 |
| Bachelor's Degree | 0 (0.0%) | 0.0 |
| Graduate Degree | 0 (0.0%) | 0.0 |
| Total | 0 (0.0%) | 0.0 |
Fertility by Education by Marriage Status in Sparta
| Educational Attainment | Married | Unmarried |
| Less than High School | 0 (0.0%) | 0 (0.0%) |
| High School Diploma | 0 (0.0%) | 0 (0.0%) |
| College or Associate's Degree | 0 (0.0%) | 0 (0.0%) |
| Bachelor's Degree | 0 (0.0%) | 0 (0.0%) |
| Graduate Degree | 0 (0.0%) | 0 (0.0%) |
| Total | 0 (0.0%) | 0 (0.0%) |
Employment Characteristics in Sparta
Employment by Class of Employer in Sparta
Among the 598 employed individuals in Sparta, private company employees (328 | 54.8%), state government employees (124 | 20.7%), and local government employees (72 | 12.0%) make up the most common classes of employment.
| Employer Class | # Employees | % Employees |
| Private Company Employees | 328 | 54.8% |
| Self-Employed (Incorporated) | 10 | 1.7% |
| Self-Employed (Not Incorporated) | 22 | 3.7% |
| Not-for-profit Organizations | 42 | 7.0% |
| Local Government Employees | 72 | 12.0% |
| State Government Employees | 124 | 20.7% |
| Federal Government Employees | 0 | 0.0% |
| Unpaid Family Workers | 0 | 0.0% |
| Total | 598 | 100.0% |
Employment Status by Age in Sparta
According to the labor force statistics for Sparta, out of the total population over 16 years of age (1,256), 54.1% or 679 individuals are in the labor force, with 11.6% or 79 of them unemployed. The age group with the highest labor force participation rate is 35 to 44 years, with 88.9% or 128 individuals in the labor force. Within the labor force, the 16 to 19 years age range has the highest percentage of unemployed individuals, with 100.0% or 4 of them being unemployed.
| Age Bracket | In Labor Force | Unemployed |
| 16 to 19 Years | 4 (9.3%) | 4 (100.0%) |
| 20 to 24 Years | 116 (54.5%) | 44 (37.9%) |
| 25 to 29 Years | 57 (80.3%) | 8 (14.0%) |
| 30 to 34 Years | 77 (74.8%) | 0 (0.0%) |
| 35 to 44 Years | 128 (88.9%) | 8 (6.3%) |
| 45 to 54 Years | 132 (83.0%) | 10 (7.6%) |
| 55 to 59 Years | 67 (67.7%) | 0 (0.0%) |
| 60 to 64 Years | 32 (31.7%) | 0 (0.0%) |
| 65 to 74 Years | 63 (26.0%) | 5 (7.9%) |
| 75 Years and over | 4 (4.9%) | 0 (0.0%) |
| Total | 679 (54.1%) | 79 (11.6%) |
Employment Status by Educational Attainment in Sparta
According to labor force statistics for Sparta, 72.8% of individuals (493) out of the total population between 25 and 64 years of age (677) are in the labor force, with 5.3% or 26 of them being unemployed. The group with the highest labor force participation rate are those with the educational attainment of college / associate degree, with 93.0% or 252 individuals in the labor force. Within the labor force, individuals with high school diploma education have the highest percentage of unemployment, with 10.1% or 18 of them being unemployed.
| Educational Attainment | In Labor Force | Unemployed |
| Less than High School | 9 (12.0%) | 0 (0.0%) |
| High School Diploma | 179 (65.6%) | 28 (10.1%) |
| College / Associate Degree | 252 (93.0%) | 9 (3.2%) |
| Bachelor's Degree or higher | 53 (91.4%) | 0 (0.0%) |
| Total | 493 (72.8%) | 36 (5.3%) |
Employment Occupations by Sex in Sparta
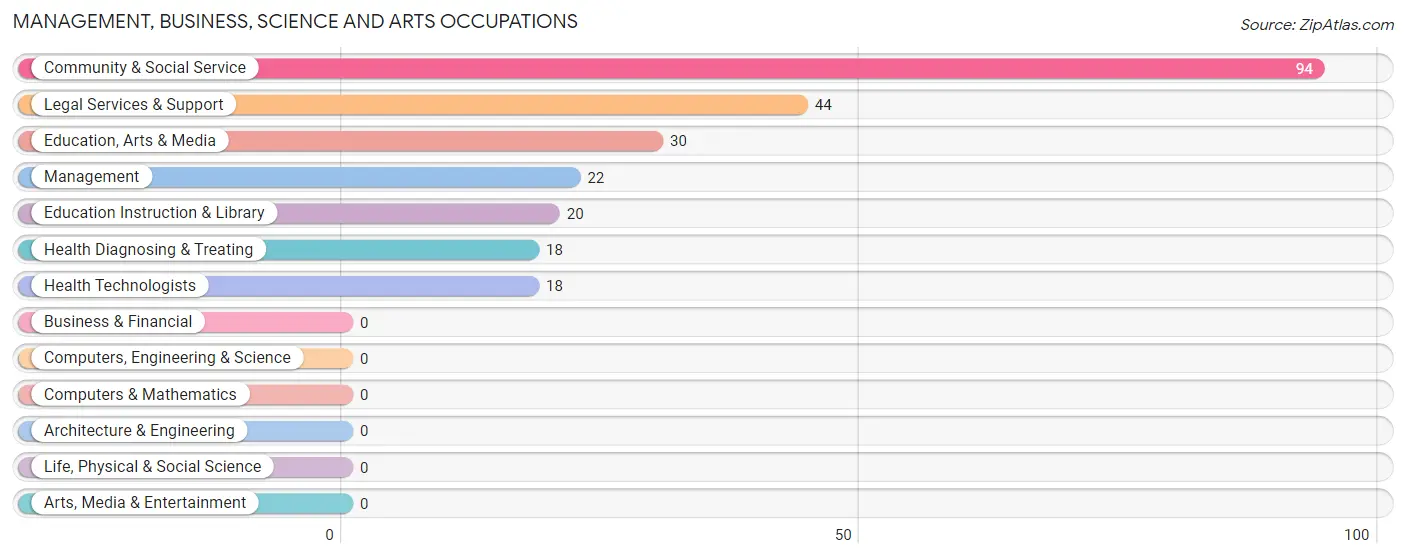
Management, Business, Science and Arts Occupations
The most common Management, Business, Science and Arts occupations in Sparta are Community & Social Service (94 | 15.6%), Legal Services & Support (44 | 7.3%), Education, Arts & Media (30 | 5.0%), Management (22 | 3.7%), and Education Instruction & Library (20 | 3.3%).
Management, Business, Science and Arts Occupations by Sex
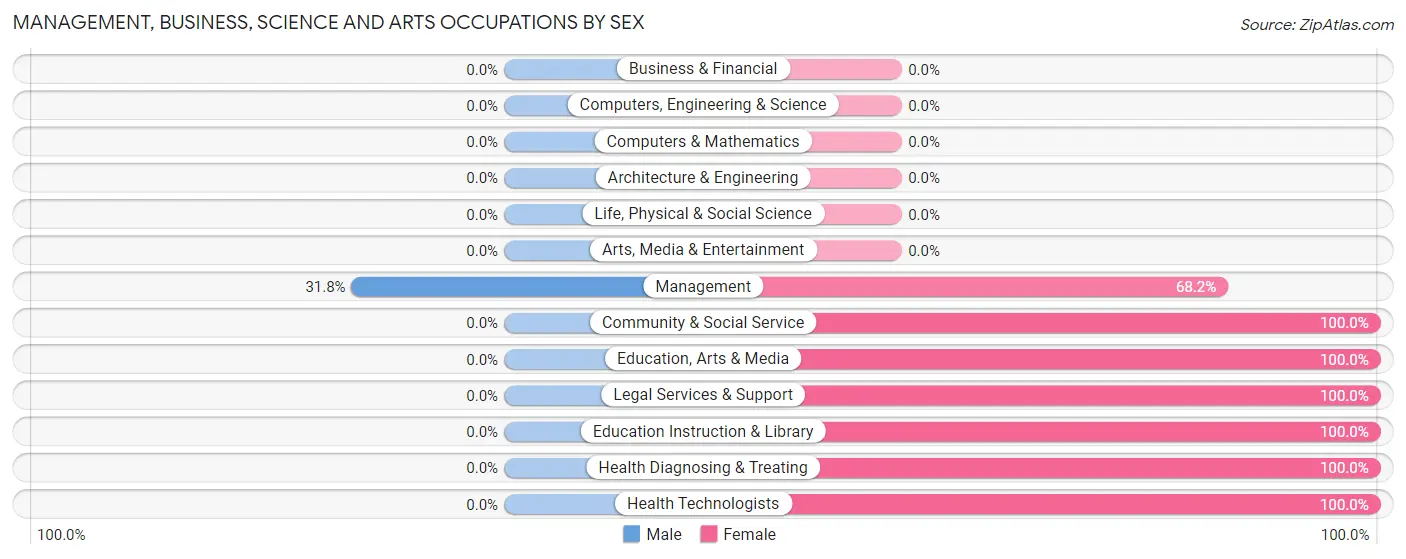
| Occupation | Male | Female |
| Management | 7 (31.8%) | 15 (68.2%) |
| Business & Financial | 0 (0.0%) | 0 (0.0%) |
| Computers, Engineering & Science | 0 (0.0%) | 0 (0.0%) |
| Computers & Mathematics | 0 (0.0%) | 0 (0.0%) |
| Architecture & Engineering | 0 (0.0%) | 0 (0.0%) |
| Life, Physical & Social Science | 0 (0.0%) | 0 (0.0%) |
| Community & Social Service | 0 (0.0%) | 94 (100.0%) |
| Education, Arts & Media | 0 (0.0%) | 30 (100.0%) |
| Legal Services & Support | 0 (0.0%) | 44 (100.0%) |
| Education Instruction & Library | 0 (0.0%) | 20 (100.0%) |
| Arts, Media & Entertainment | 0 (0.0%) | 0 (0.0%) |
| Health Diagnosing & Treating | 0 (0.0%) | 18 (100.0%) |
| Health Technologists | 0 (0.0%) | 18 (100.0%) |
| Total (Category) | 7 (5.2%) | 127 (94.8%) |
| Total (Overall) | 268 (44.6%) | 333 (55.4%) |
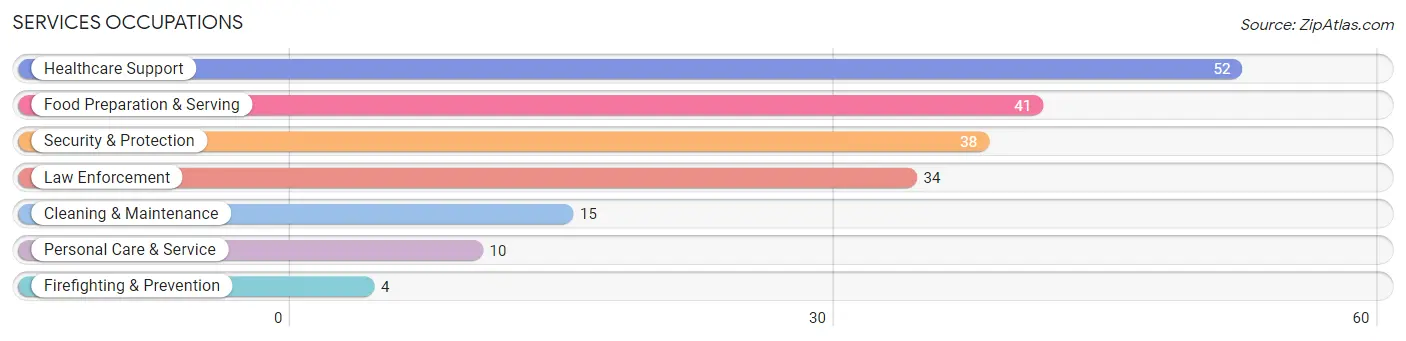
Services Occupations
The most common Services occupations in Sparta are Healthcare Support (52 | 8.6%), Food Preparation & Serving (41 | 6.8%), Security & Protection (38 | 6.3%), Law Enforcement (34 | 5.7%), and Cleaning & Maintenance (15 | 2.5%).
Services Occupations by Sex
Within the Services occupations in Sparta, the most male-oriented occupations are Firefighting & Prevention (100.0%), Cleaning & Maintenance (100.0%), and Security & Protection (52.6%), while the most female-oriented occupations are Healthcare Support (100.0%), Personal Care & Service (100.0%), and Food Preparation & Serving (73.2%).
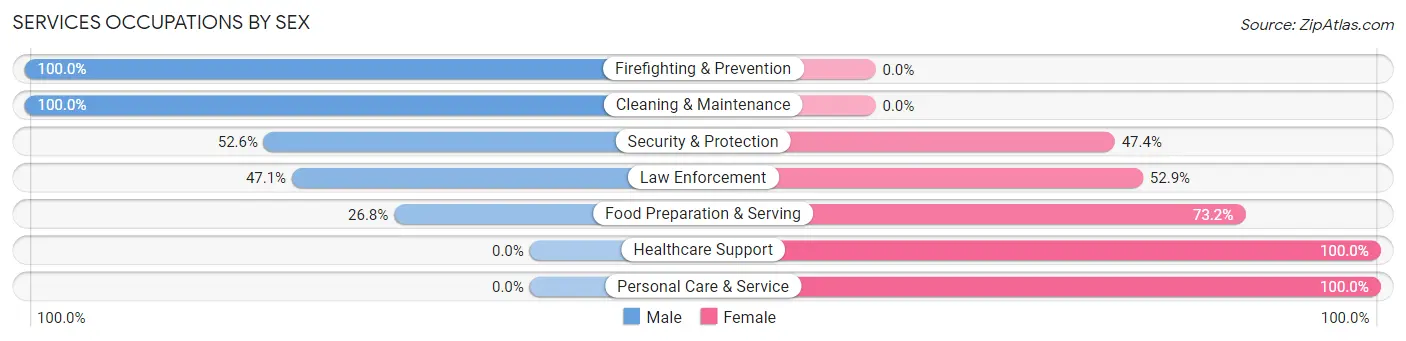
| Occupation | Male | Female |
| Healthcare Support | 0 (0.0%) | 52 (100.0%) |
| Security & Protection | 20 (52.6%) | 18 (47.4%) |
| Firefighting & Prevention | 4 (100.0%) | 0 (0.0%) |
| Law Enforcement | 16 (47.1%) | 18 (52.9%) |
| Food Preparation & Serving | 11 (26.8%) | 30 (73.2%) |
| Cleaning & Maintenance | 15 (100.0%) | 0 (0.0%) |
| Personal Care & Service | 0 (0.0%) | 10 (100.0%) |
| Total (Category) | 46 (29.5%) | 110 (70.5%) |
| Total (Overall) | 268 (44.6%) | 333 (55.4%) |
Sales and Office Occupations
The most common Sales and Office occupations in Sparta are Sales & Related (74 | 12.3%), and Office & Administration (32 | 5.3%).
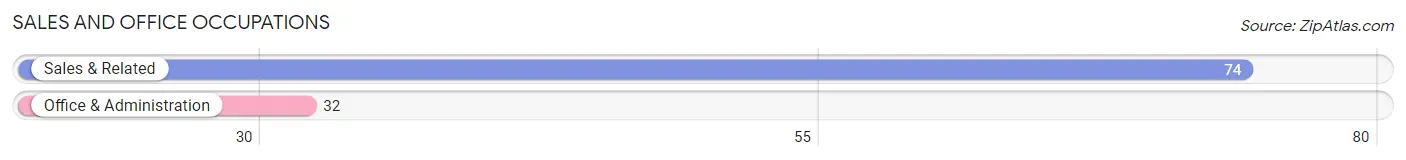
Sales and Office Occupations by Sex

| Occupation | Male | Female |
| Sales & Related | 0 (0.0%) | 74 (100.0%) |
| Office & Administration | 15 (46.9%) | 17 (53.1%) |
| Total (Category) | 15 (14.1%) | 91 (85.9%) |
| Total (Overall) | 268 (44.6%) | 333 (55.4%) |
Natural Resources, Construction and Maintenance Occupations
The most common Natural Resources, Construction and Maintenance occupations in Sparta are Construction & Extraction (20 | 3.3%), and Installation, Maintenance & Repair (14 | 2.3%).
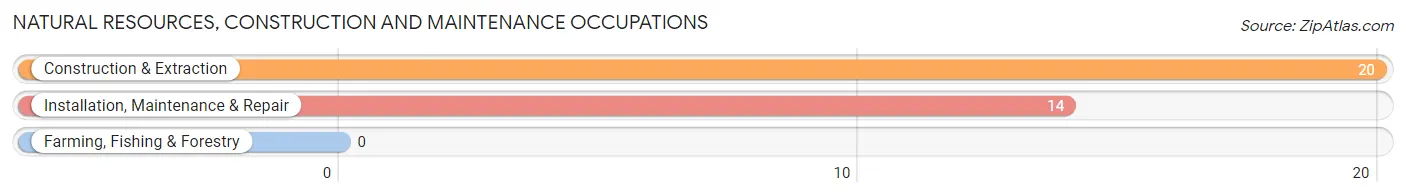
Natural Resources, Construction and Maintenance Occupations by Sex
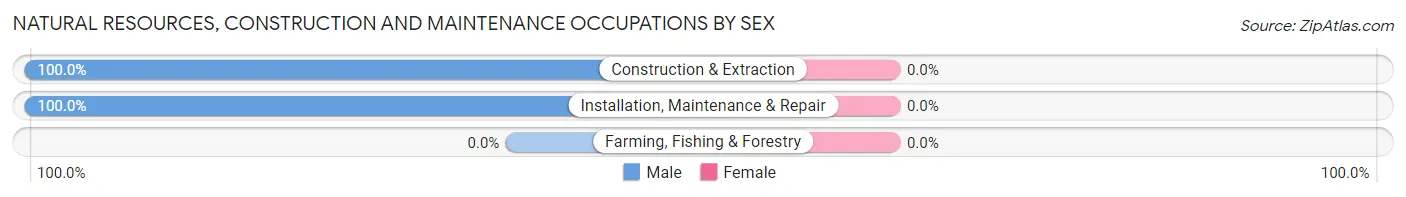
| Occupation | Male | Female |
| Farming, Fishing & Forestry | 0 (0.0%) | 0 (0.0%) |
| Construction & Extraction | 20 (100.0%) | 0 (0.0%) |
| Installation, Maintenance & Repair | 14 (100.0%) | 0 (0.0%) |
| Total (Category) | 34 (100.0%) | 0 (0.0%) |
| Total (Overall) | 268 (44.6%) | 333 (55.4%) |
Production, Transportation and Moving Occupations
The most common Production, Transportation and Moving occupations in Sparta are Material Moving (102 | 17.0%), Production (39 | 6.5%), and Transportation (30 | 5.0%).
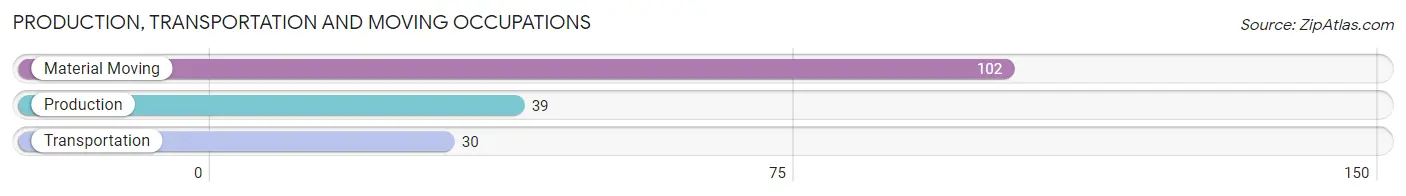
Production, Transportation and Moving Occupations by Sex
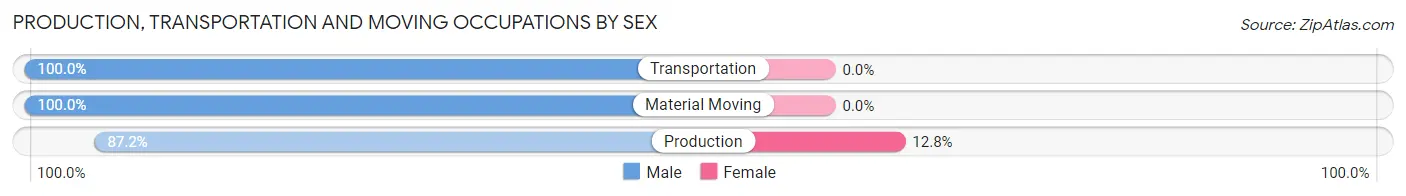
| Occupation | Male | Female |
| Production | 34 (87.2%) | 5 (12.8%) |
| Transportation | 30 (100.0%) | 0 (0.0%) |
| Material Moving | 102 (100.0%) | 0 (0.0%) |
| Total (Category) | 166 (97.1%) | 5 (2.9%) |
| Total (Overall) | 268 (44.6%) | 333 (55.4%) |
Employment Industries by Sex in Sparta
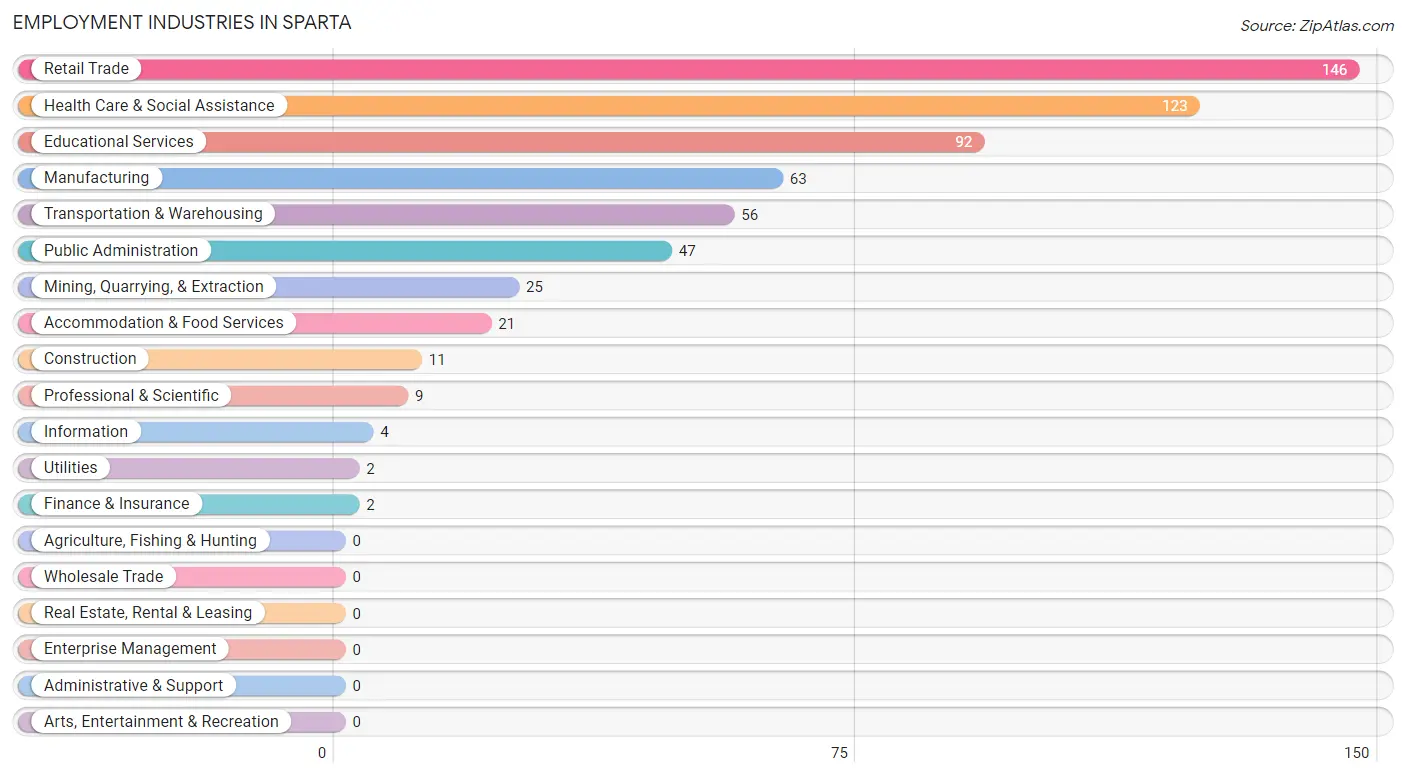
Employment Industries in Sparta
The major employment industries in Sparta include Retail Trade (146 | 24.3%), Health Care & Social Assistance (123 | 20.5%), Educational Services (92 | 15.3%), Manufacturing (63 | 10.5%), and Transportation & Warehousing (56 | 9.3%).
Employment Industries by Sex in Sparta
The Sparta industries that see more men than women are Mining, Quarrying, & Extraction (100.0%), Construction (100.0%), and Utilities (100.0%), whereas the industries that tend to have a higher number of women are Information (100.0%), Health Care & Social Assistance (97.6%), and Accommodation & Food Services (80.9%).
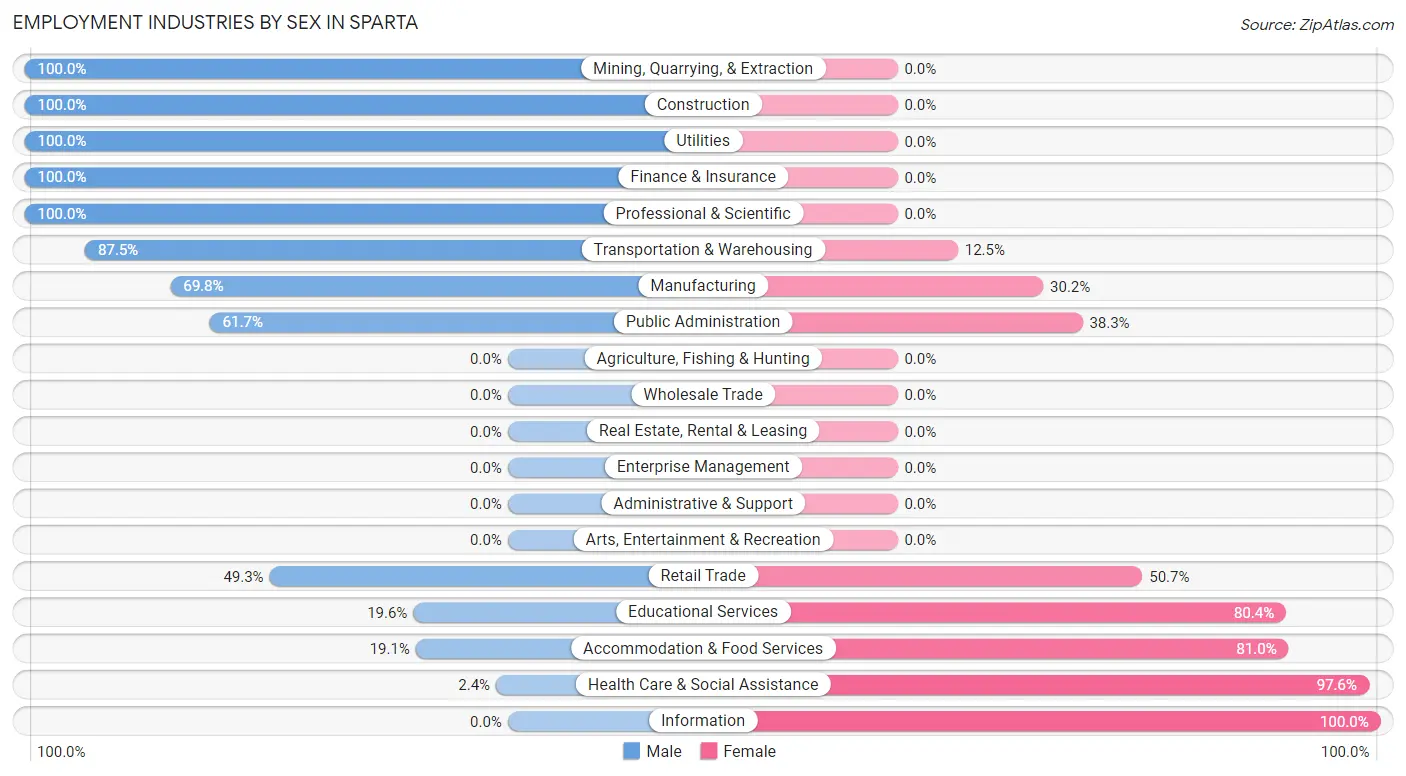
| Industry | Male | Female |
| Agriculture, Fishing & Hunting | 0 (0.0%) | 0 (0.0%) |
| Mining, Quarrying, & Extraction | 25 (100.0%) | 0 (0.0%) |
| Construction | 11 (100.0%) | 0 (0.0%) |
| Manufacturing | 44 (69.8%) | 19 (30.2%) |
| Wholesale Trade | 0 (0.0%) | 0 (0.0%) |
| Retail Trade | 72 (49.3%) | 74 (50.7%) |
| Transportation & Warehousing | 49 (87.5%) | 7 (12.5%) |
| Utilities | 2 (100.0%) | 0 (0.0%) |
| Information | 0 (0.0%) | 4 (100.0%) |
| Finance & Insurance | 2 (100.0%) | 0 (0.0%) |
| Real Estate, Rental & Leasing | 0 (0.0%) | 0 (0.0%) |
| Professional & Scientific | 9 (100.0%) | 0 (0.0%) |
| Enterprise Management | 0 (0.0%) | 0 (0.0%) |
| Administrative & Support | 0 (0.0%) | 0 (0.0%) |
| Educational Services | 18 (19.6%) | 74 (80.4%) |
| Health Care & Social Assistance | 3 (2.4%) | 120 (97.6%) |
| Arts, Entertainment & Recreation | 0 (0.0%) | 0 (0.0%) |
| Accommodation & Food Services | 4 (19.1%) | 17 (80.9%) |
| Public Administration | 29 (61.7%) | 18 (38.3%) |
| Total | 268 (44.6%) | 333 (55.4%) |
Education in Sparta
School Enrollment in Sparta
The most common levels of schooling among the 709 students in Sparta are elementary school (261 | 36.8%), high school (154 | 21.7%), and kindergarten (110 | 15.5%).
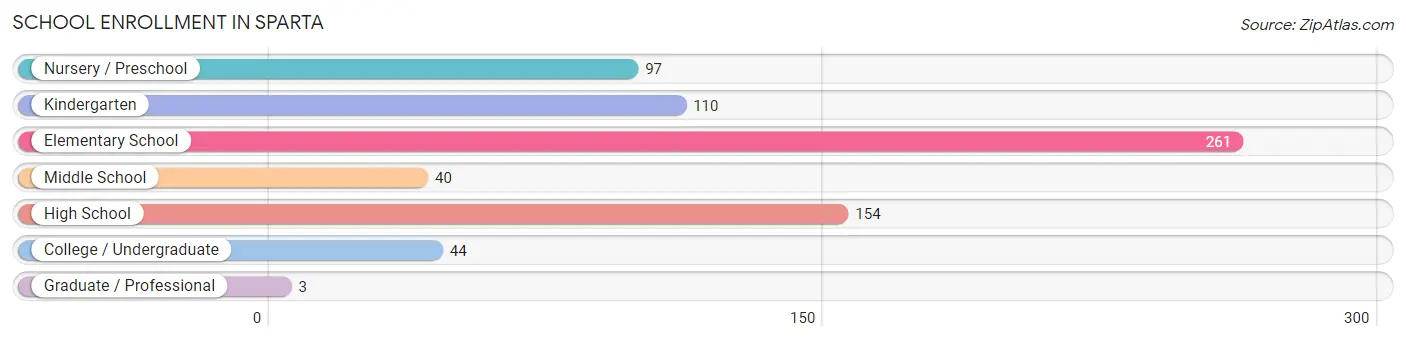
| School Level | # Students | % Students |
| Nursery / Preschool | 97 | 13.7% |
| Kindergarten | 110 | 15.5% |
| Elementary School | 261 | 36.8% |
| Middle School | 40 | 5.6% |
| High School | 154 | 21.7% |
| College / Undergraduate | 44 | 6.2% |
| Graduate / Professional | 3 | 0.4% |
| Total | 709 | 100.0% |
School Enrollment by Age by Funding Source in Sparta
Out of a total of 709 students who are enrolled in schools in Sparta, 8 (1.1%) attend a private institution, while the remaining 701 (98.9%) are enrolled in public schools. The age group of 20 to 24 year olds has the highest likelihood of being enrolled in private schools, with 8 (24.2% in the age bracket) enrolled. Conversely, the age group of 3 to 4 year olds has the lowest likelihood of being enrolled in a private school, with 97 (100.0% in the age bracket) attending a public institution.
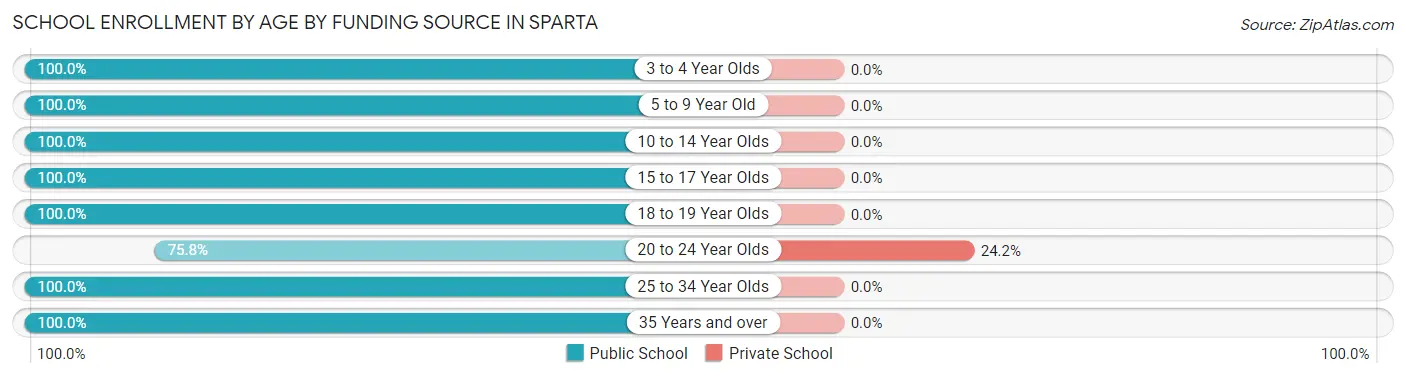
| Age Bracket | Public School | Private School |
| 3 to 4 Year Olds | 97 (100.0%) | 0 (0.0%) |
| 5 to 9 Year Old | 345 (100.0%) | 0 (0.0%) |
| 10 to 14 Year Olds | 92 (100.0%) | 0 (0.0%) |
| 15 to 17 Year Olds | 107 (100.0%) | 0 (0.0%) |
| 18 to 19 Year Olds | 6 (100.0%) | 0 (0.0%) |
| 20 to 24 Year Olds | 25 (75.8%) | 8 (24.2%) |
| 25 to 34 Year Olds | 14 (100.0%) | 0 (0.0%) |
| 35 Years and over | 15 (100.0%) | 0 (0.0%) |
| Total | 701 (98.9%) | 8 (1.1%) |
Educational Attainment by Field of Study in Sparta
Education (36 | 31.9%), business (26 | 23.0%), engineering (18 | 15.9%), bio, nature & agricultural (14 | 12.4%), and arts & humanities (5 | 4.4%) are the most common fields of study among 113 individuals in Sparta who have obtained a bachelor's degree or higher.
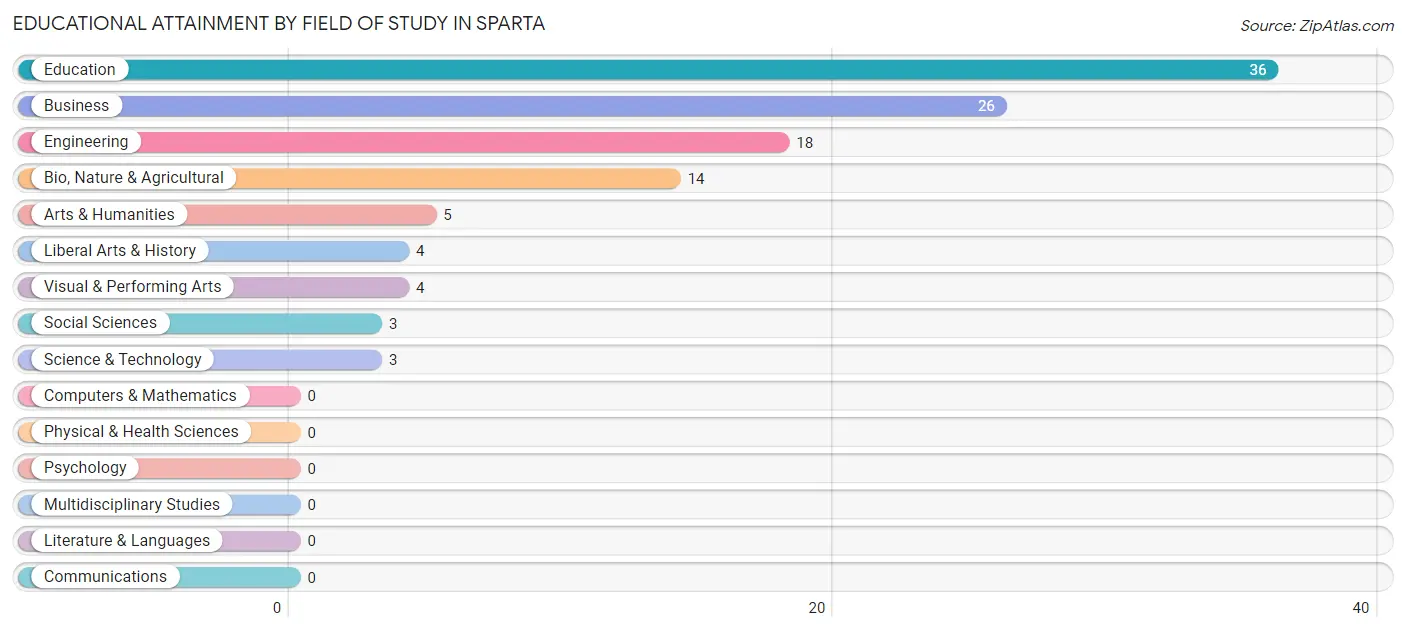
| Field of Study | # Graduates | % Graduates |
| Computers & Mathematics | 0 | 0.0% |
| Bio, Nature & Agricultural | 14 | 12.4% |
| Physical & Health Sciences | 0 | 0.0% |
| Psychology | 0 | 0.0% |
| Social Sciences | 3 | 2.6% |
| Engineering | 18 | 15.9% |
| Multidisciplinary Studies | 0 | 0.0% |
| Science & Technology | 3 | 2.6% |
| Business | 26 | 23.0% |
| Education | 36 | 31.9% |
| Literature & Languages | 0 | 0.0% |
| Liberal Arts & History | 4 | 3.5% |
| Visual & Performing Arts | 4 | 3.5% |
| Communications | 0 | 0.0% |
| Arts & Humanities | 5 | 4.4% |
| Total | 113 | 100.0% |
Transportation & Commute in Sparta
Vehicle Availability by Sex in Sparta
The most prevalent vehicle ownership categories in Sparta are males with 5 or more vehicles (95, accounting for 35.4%) and females with 5 or more vehicles (22, making up 28.8%).
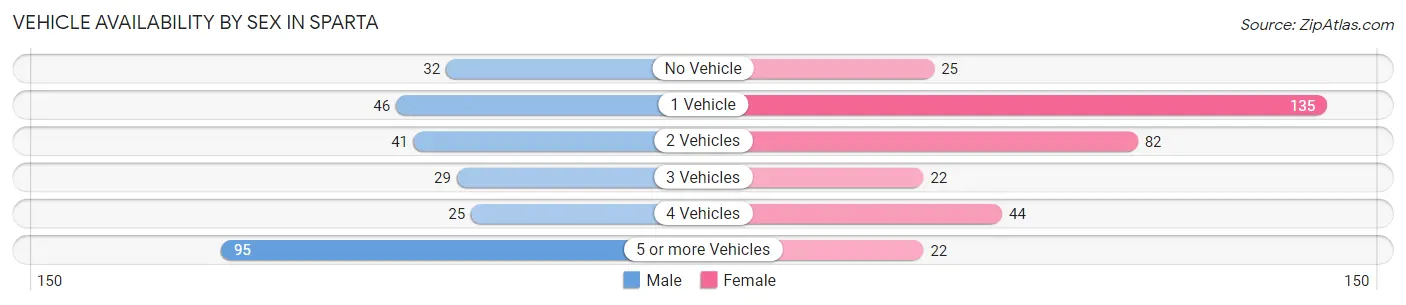
| Vehicles Available | Male | Female |
| No Vehicle | 32 (11.9%) | 25 (7.6%) |
| 1 Vehicle | 46 (17.2%) | 135 (40.9%) |
| 2 Vehicles | 41 (15.3%) | 82 (24.8%) |
| 3 Vehicles | 29 (10.8%) | 22 (6.7%) |
| 4 Vehicles | 25 (9.3%) | 44 (13.3%) |
| 5 or more Vehicles | 95 (35.4%) | 22 (6.7%) |
| Total | 268 (100.0%) | 330 (100.0%) |
Commute Time in Sparta
The most frequently occuring commute durations in Sparta are 5 to 9 minutes (111 commuters, 18.9%), 30 to 34 minutes (93 commuters, 15.8%), and 40 to 44 minutes (88 commuters, 15.0%).
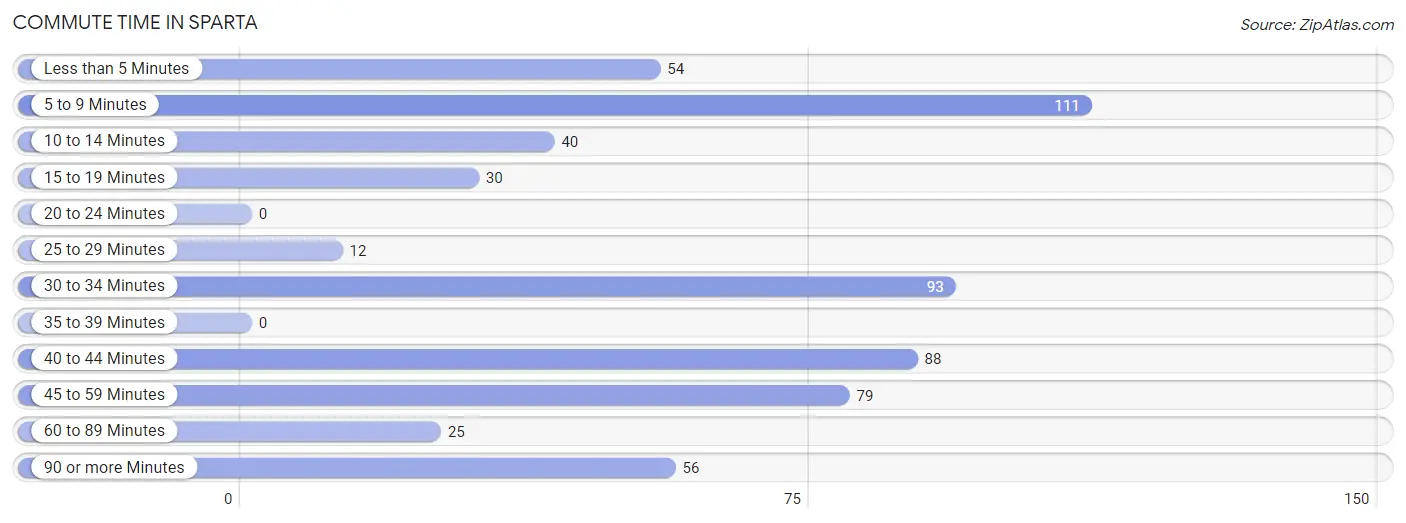
| Commute Time | # Commuters | % Commuters |
| Less than 5 Minutes | 54 | 9.2% |
| 5 to 9 Minutes | 111 | 18.9% |
| 10 to 14 Minutes | 40 | 6.8% |
| 15 to 19 Minutes | 30 | 5.1% |
| 20 to 24 Minutes | 0 | 0.0% |
| 25 to 29 Minutes | 12 | 2.0% |
| 30 to 34 Minutes | 93 | 15.8% |
| 35 to 39 Minutes | 0 | 0.0% |
| 40 to 44 Minutes | 88 | 15.0% |
| 45 to 59 Minutes | 79 | 13.4% |
| 60 to 89 Minutes | 25 | 4.3% |
| 90 or more Minutes | 56 | 9.5% |
Commute Time by Sex in Sparta
The most common commute times in Sparta are 40 to 44 minutes (88 commuters, 32.8%) for males and 30 to 34 minutes (77 commuters, 24.1%) for females.
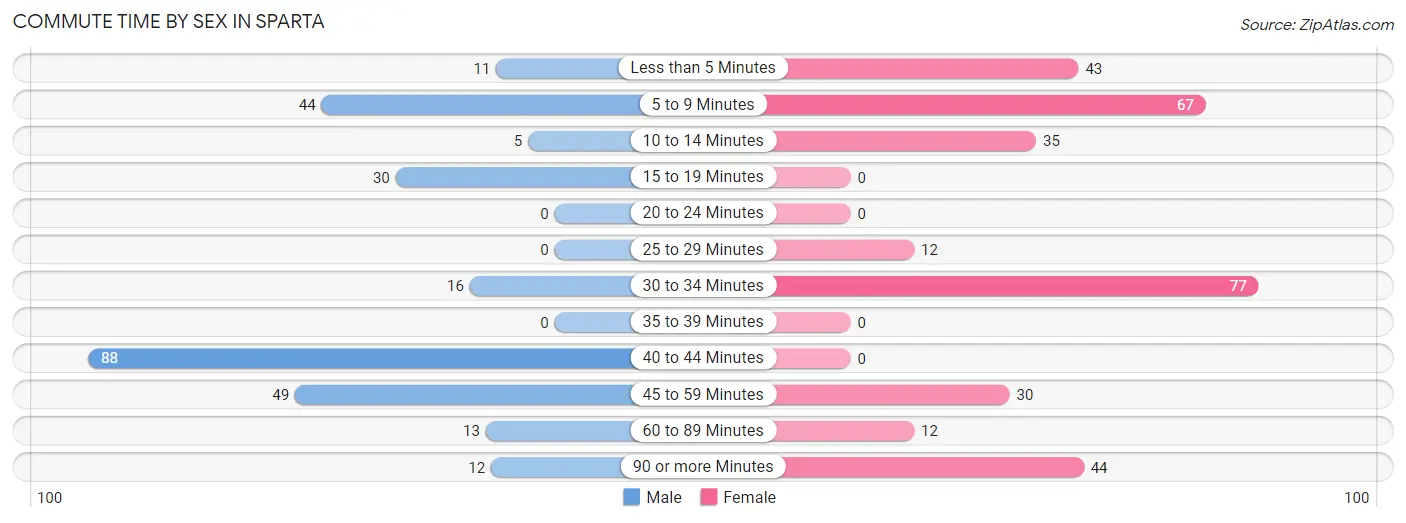
| Commute Time | Male | Female |
| Less than 5 Minutes | 11 (4.1%) | 43 (13.4%) |
| 5 to 9 Minutes | 44 (16.4%) | 67 (20.9%) |
| 10 to 14 Minutes | 5 (1.9%) | 35 (10.9%) |
| 15 to 19 Minutes | 30 (11.2%) | 0 (0.0%) |
| 20 to 24 Minutes | 0 (0.0%) | 0 (0.0%) |
| 25 to 29 Minutes | 0 (0.0%) | 12 (3.7%) |
| 30 to 34 Minutes | 16 (6.0%) | 77 (24.1%) |
| 35 to 39 Minutes | 0 (0.0%) | 0 (0.0%) |
| 40 to 44 Minutes | 88 (32.8%) | 0 (0.0%) |
| 45 to 59 Minutes | 49 (18.3%) | 30 (9.4%) |
| 60 to 89 Minutes | 13 (4.9%) | 12 (3.7%) |
| 90 or more Minutes | 12 (4.5%) | 44 (13.8%) |
Time of Departure to Work by Sex in Sparta
The most frequent times of departure to work in Sparta are 12:00 PM to 3:59 PM (84, 31.3%) for males and 6:00 AM to 6:29 AM (53, 16.6%) for females.
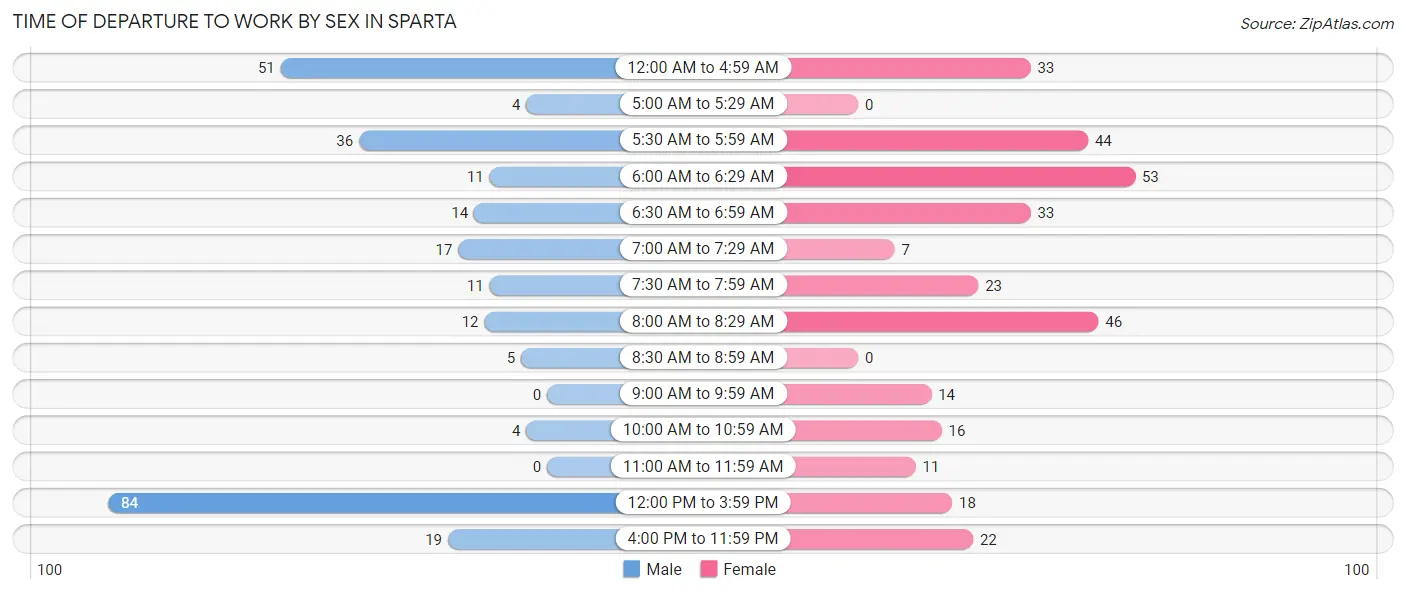
| Time of Departure | Male | Female |
| 12:00 AM to 4:59 AM | 51 (19.0%) | 33 (10.3%) |
| 5:00 AM to 5:29 AM | 4 (1.5%) | 0 (0.0%) |
| 5:30 AM to 5:59 AM | 36 (13.4%) | 44 (13.8%) |
| 6:00 AM to 6:29 AM | 11 (4.1%) | 53 (16.6%) |
| 6:30 AM to 6:59 AM | 14 (5.2%) | 33 (10.3%) |
| 7:00 AM to 7:29 AM | 17 (6.3%) | 7 (2.2%) |
| 7:30 AM to 7:59 AM | 11 (4.1%) | 23 (7.2%) |
| 8:00 AM to 8:29 AM | 12 (4.5%) | 46 (14.4%) |
| 8:30 AM to 8:59 AM | 5 (1.9%) | 0 (0.0%) |
| 9:00 AM to 9:59 AM | 0 (0.0%) | 14 (4.4%) |
| 10:00 AM to 10:59 AM | 4 (1.5%) | 16 (5.0%) |
| 11:00 AM to 11:59 AM | 0 (0.0%) | 11 (3.4%) |
| 12:00 PM to 3:59 PM | 84 (31.3%) | 18 (5.6%) |
| 4:00 PM to 11:59 PM | 19 (7.1%) | 22 (6.9%) |
| Total | 268 (100.0%) | 320 (100.0%) |
Housing Occupancy in Sparta
Occupancy by Ownership in Sparta
Of the total 534 dwellings in Sparta, owner-occupied units account for 223 (41.8%), while renter-occupied units make up 311 (58.2%).
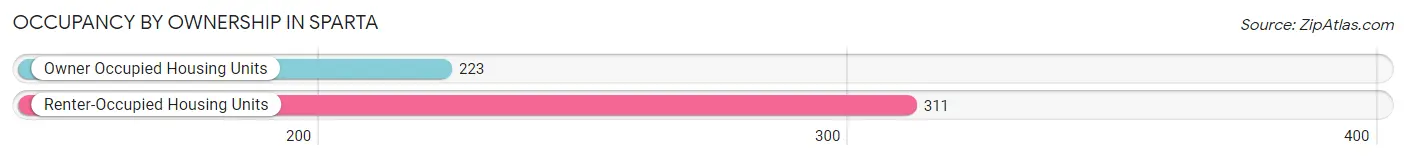
| Occupancy | # Housing Units | % Housing Units |
| Owner Occupied Housing Units | 223 | 41.8% |
| Renter-Occupied Housing Units | 311 | 58.2% |
| Total Occupied Housing Units | 534 | 100.0% |
Occupancy by Household Size in Sparta
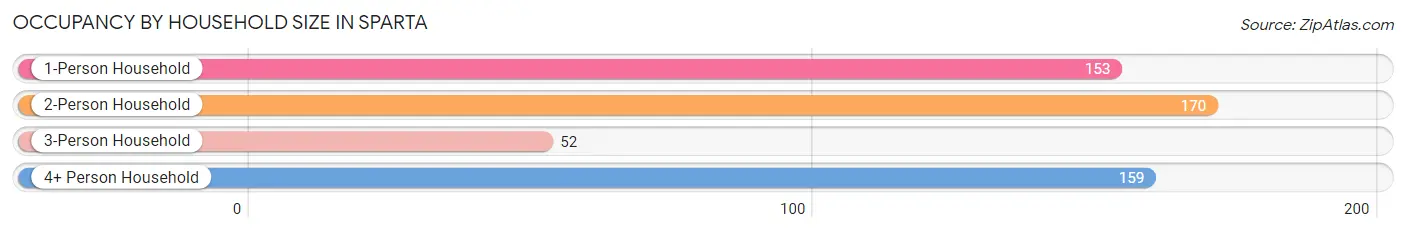
| Household Size | # Housing Units | % Housing Units |
| 1-Person Household | 153 | 28.6% |
| 2-Person Household | 170 | 31.8% |
| 3-Person Household | 52 | 9.7% |
| 4+ Person Household | 159 | 29.8% |
| Total Housing Units | 534 | 100.0% |
Occupancy by Ownership by Household Size in Sparta
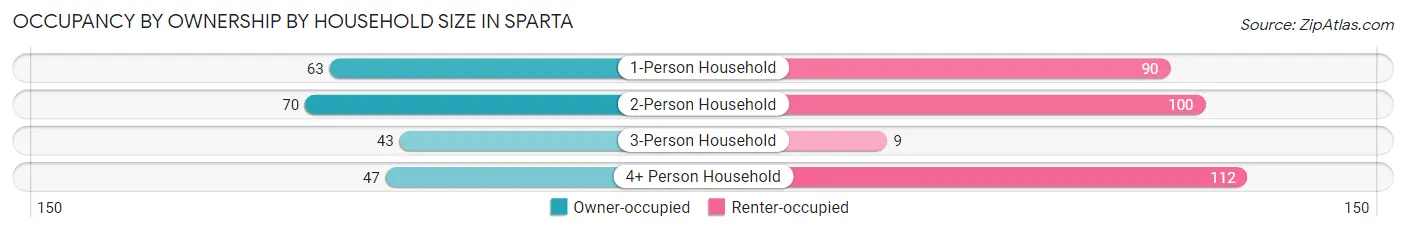
| Household Size | Owner-occupied | Renter-occupied |
| 1-Person Household | 63 (41.2%) | 90 (58.8%) |
| 2-Person Household | 70 (41.2%) | 100 (58.8%) |
| 3-Person Household | 43 (82.7%) | 9 (17.3%) |
| 4+ Person Household | 47 (29.6%) | 112 (70.4%) |
| Total Housing Units | 223 (41.8%) | 311 (58.2%) |
Occupancy by Educational Attainment in Sparta
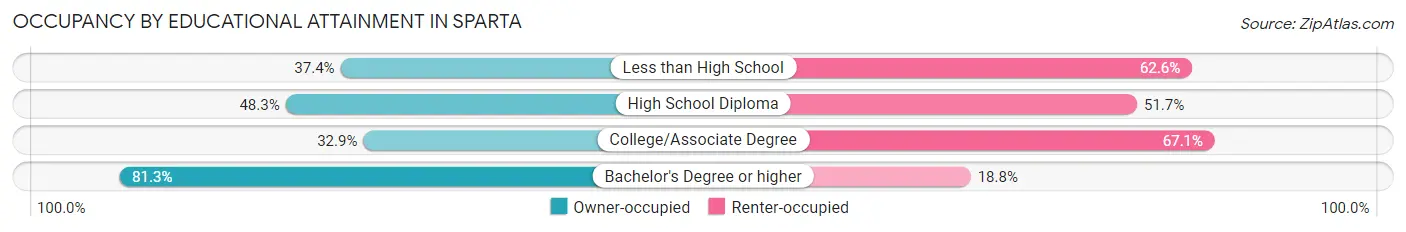
| Household Size | Owner-occupied | Renter-occupied |
| Less than High School | 43 (37.4%) | 72 (62.6%) |
| High School Diploma | 84 (48.3%) | 90 (51.7%) |
| College/Associate Degree | 70 (32.9%) | 143 (67.1%) |
| Bachelor's Degree or higher | 26 (81.2%) | 6 (18.8%) |
Occupancy by Age of Householder in Sparta
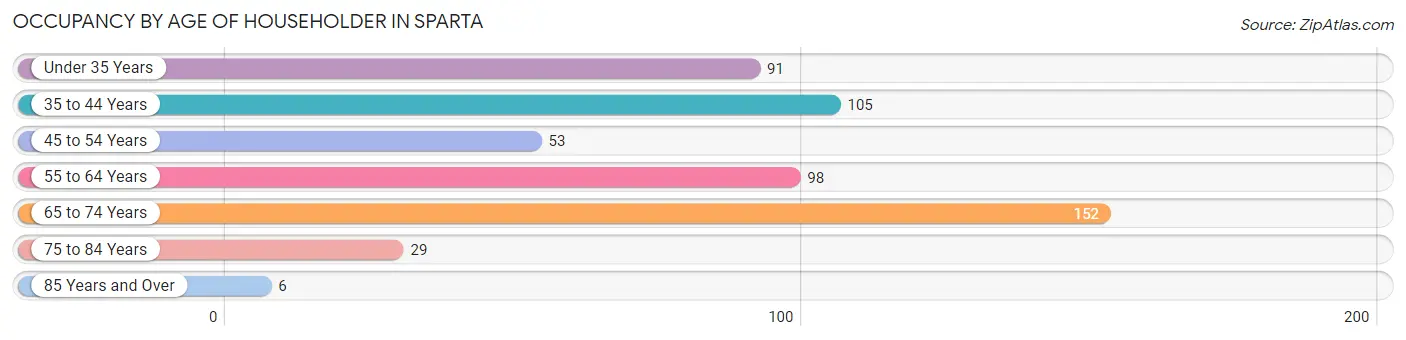
| Age Bracket | # Households | % Households |
| Under 35 Years | 91 | 17.0% |
| 35 to 44 Years | 105 | 19.7% |
| 45 to 54 Years | 53 | 9.9% |
| 55 to 64 Years | 98 | 18.3% |
| 65 to 74 Years | 152 | 28.5% |
| 75 to 84 Years | 29 | 5.4% |
| 85 Years and Over | 6 | 1.1% |
| Total | 534 | 100.0% |
Housing Finances in Sparta
Median Income by Occupancy in Sparta
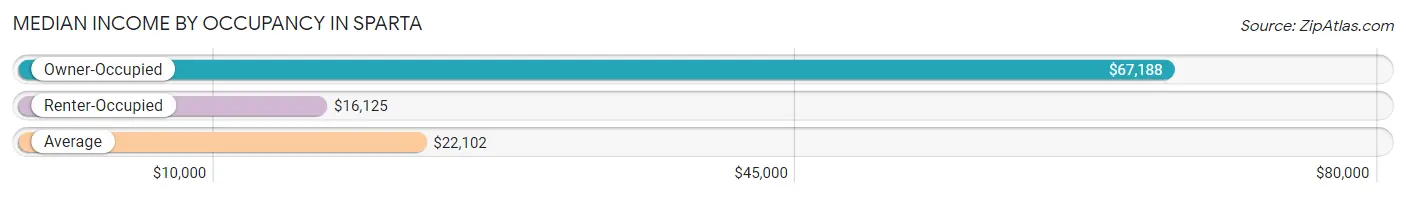
| Occupancy Type | # Households | Median Income |
| Owner-Occupied | 223 (41.8%) | $67,188 |
| Renter-Occupied | 311 (58.2%) | $16,125 |
| Average | 534 (100.0%) | $22,102 |
Occupancy by Householder Income Bracket in Sparta
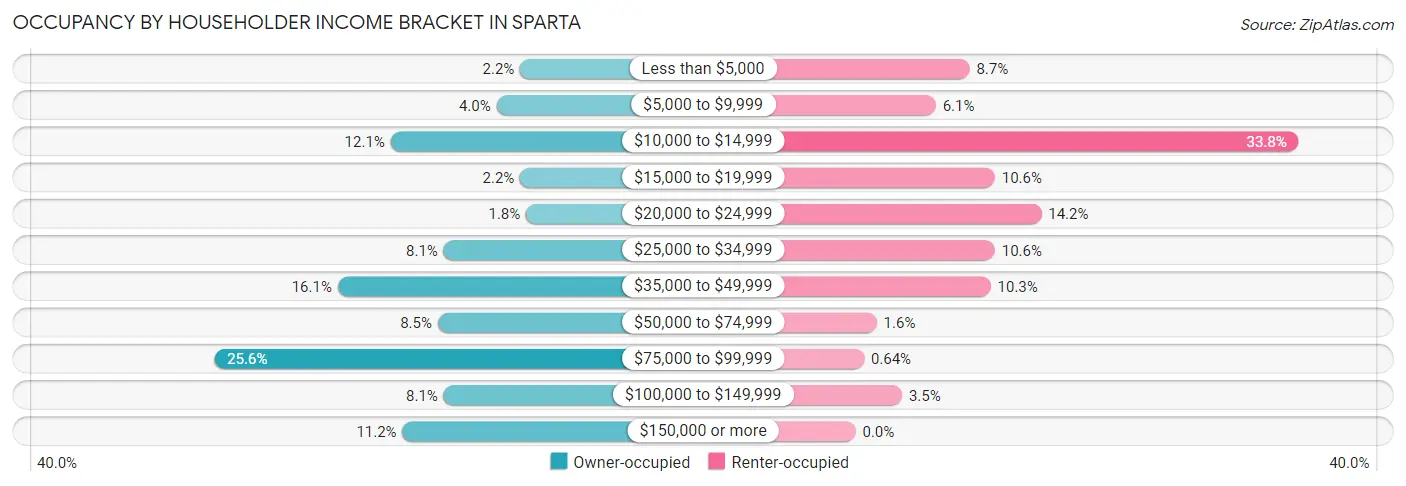
| Income Bracket | Owner-occupied | Renter-occupied |
| Less than $5,000 | 5 (2.2%) | 27 (8.7%) |
| $5,000 to $9,999 | 9 (4.0%) | 19 (6.1%) |
| $10,000 to $14,999 | 27 (12.1%) | 105 (33.8%) |
| $15,000 to $19,999 | 5 (2.2%) | 33 (10.6%) |
| $20,000 to $24,999 | 4 (1.8%) | 44 (14.1%) |
| $25,000 to $34,999 | 18 (8.1%) | 33 (10.6%) |
| $35,000 to $49,999 | 36 (16.1%) | 32 (10.3%) |
| $50,000 to $74,999 | 19 (8.5%) | 5 (1.6%) |
| $75,000 to $99,999 | 57 (25.6%) | 2 (0.6%) |
| $100,000 to $149,999 | 18 (8.1%) | 11 (3.5%) |
| $150,000 or more | 25 (11.2%) | 0 (0.0%) |
| Total | 223 (100.0%) | 311 (100.0%) |
Monthly Housing Cost Tiers in Sparta
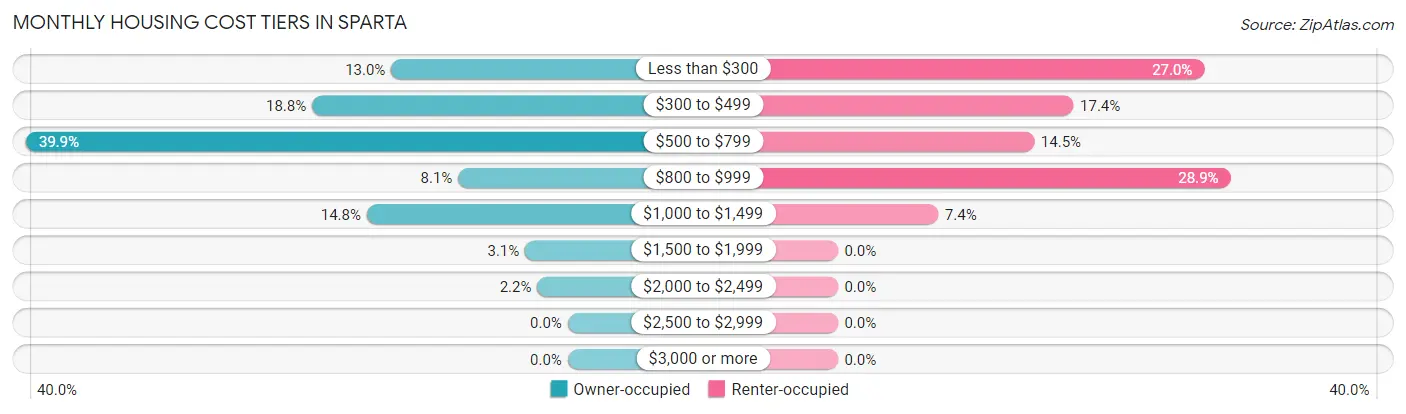
| Monthly Cost | Owner-occupied | Renter-occupied |
| Less than $300 | 29 (13.0%) | 84 (27.0%) |
| $300 to $499 | 42 (18.8%) | 54 (17.4%) |
| $500 to $799 | 89 (39.9%) | 45 (14.5%) |
| $800 to $999 | 18 (8.1%) | 90 (28.9%) |
| $1,000 to $1,499 | 33 (14.8%) | 23 (7.4%) |
| $1,500 to $1,999 | 7 (3.1%) | 0 (0.0%) |
| $2,000 to $2,499 | 5 (2.2%) | 0 (0.0%) |
| $2,500 to $2,999 | 0 (0.0%) | 0 (0.0%) |
| $3,000 or more | 0 (0.0%) | 0 (0.0%) |
| Total | 223 (100.0%) | 311 (100.0%) |
Physical Housing Characteristics in Sparta
Housing Structures in Sparta
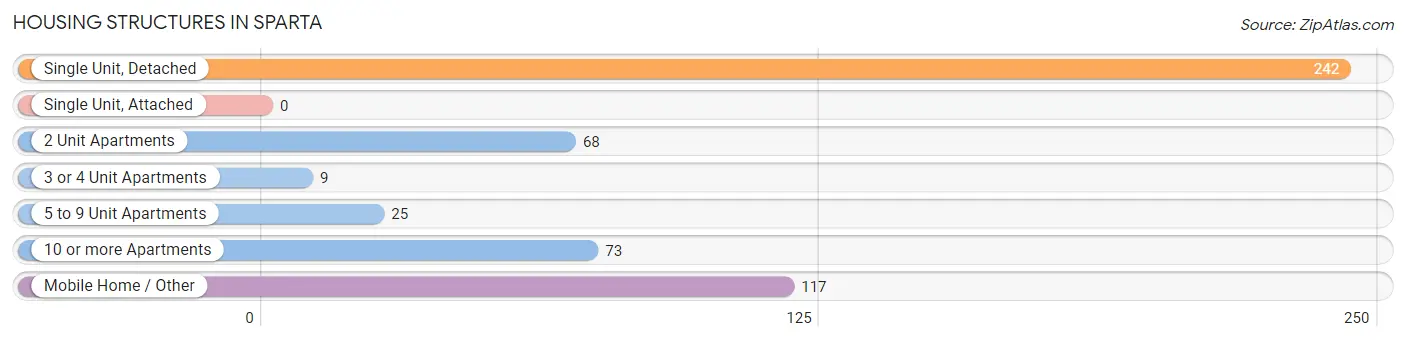
| Structure Type | # Housing Units | % Housing Units |
| Single Unit, Detached | 242 | 45.3% |
| Single Unit, Attached | 0 | 0.0% |
| 2 Unit Apartments | 68 | 12.7% |
| 3 or 4 Unit Apartments | 9 | 1.7% |
| 5 to 9 Unit Apartments | 25 | 4.7% |
| 10 or more Apartments | 73 | 13.7% |
| Mobile Home / Other | 117 | 21.9% |
| Total | 534 | 100.0% |
Housing Structures by Occupancy in Sparta
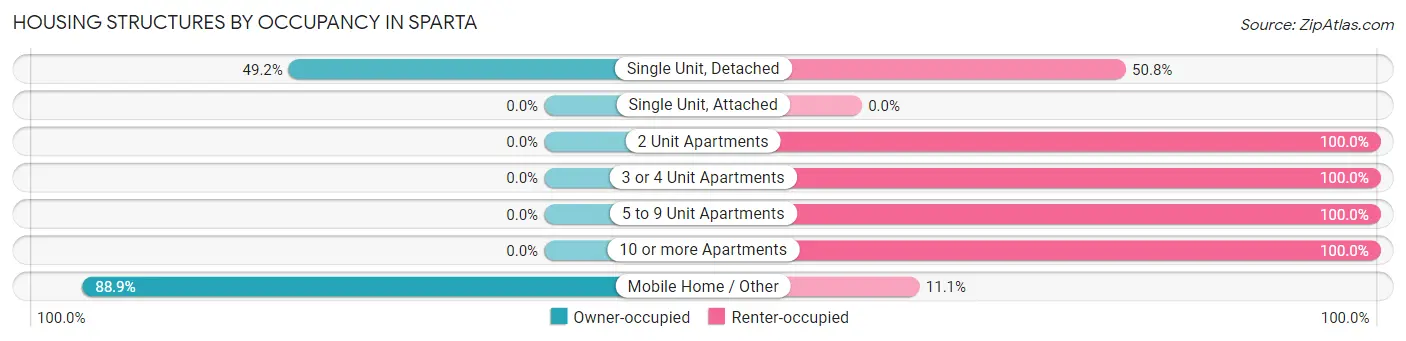
| Structure Type | Owner-occupied | Renter-occupied |
| Single Unit, Detached | 119 (49.2%) | 123 (50.8%) |
| Single Unit, Attached | 0 (0.0%) | 0 (0.0%) |
| 2 Unit Apartments | 0 (0.0%) | 68 (100.0%) |
| 3 or 4 Unit Apartments | 0 (0.0%) | 9 (100.0%) |
| 5 to 9 Unit Apartments | 0 (0.0%) | 25 (100.0%) |
| 10 or more Apartments | 0 (0.0%) | 73 (100.0%) |
| Mobile Home / Other | 104 (88.9%) | 13 (11.1%) |
| Total | 223 (41.8%) | 311 (58.2%) |
Housing Structures by Number of Rooms in Sparta
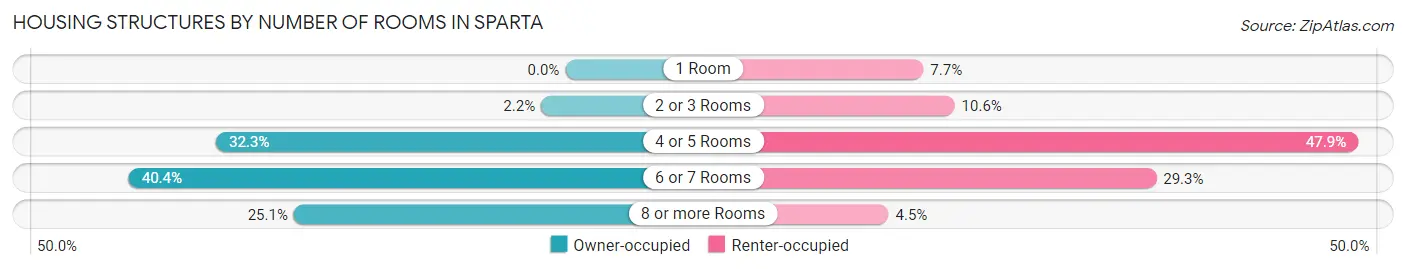
| Number of Rooms | Owner-occupied | Renter-occupied |
| 1 Room | 0 (0.0%) | 24 (7.7%) |
| 2 or 3 Rooms | 5 (2.2%) | 33 (10.6%) |
| 4 or 5 Rooms | 72 (32.3%) | 149 (47.9%) |
| 6 or 7 Rooms | 90 (40.4%) | 91 (29.3%) |
| 8 or more Rooms | 56 (25.1%) | 14 (4.5%) |
| Total | 223 (100.0%) | 311 (100.0%) |
Housing Structure by Heating Type in Sparta
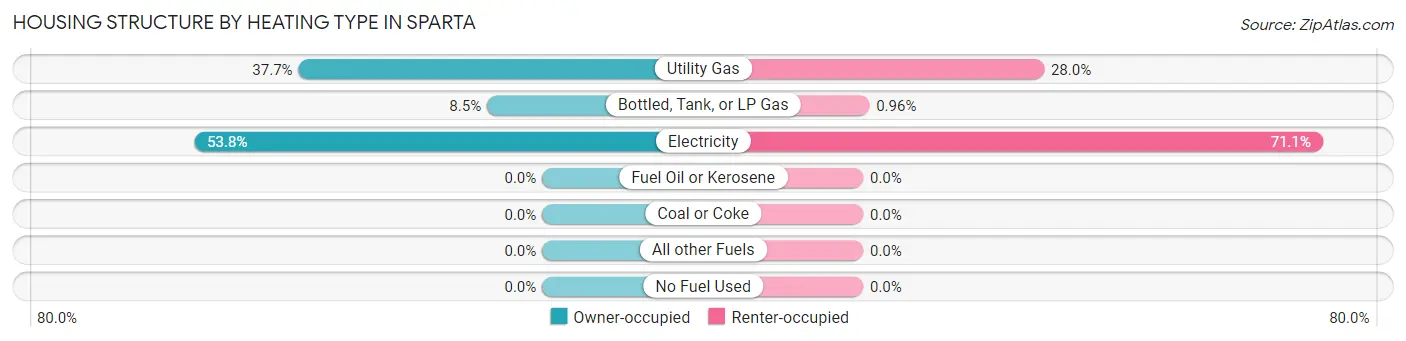
| Heating Type | Owner-occupied | Renter-occupied |
| Utility Gas | 84 (37.7%) | 87 (28.0%) |
| Bottled, Tank, or LP Gas | 19 (8.5%) | 3 (1.0%) |
| Electricity | 120 (53.8%) | 221 (71.1%) |
| Fuel Oil or Kerosene | 0 (0.0%) | 0 (0.0%) |
| Coal or Coke | 0 (0.0%) | 0 (0.0%) |
| All other Fuels | 0 (0.0%) | 0 (0.0%) |
| No Fuel Used | 0 (0.0%) | 0 (0.0%) |
| Total | 223 (100.0%) | 311 (100.0%) |
Household Vehicle Usage in Sparta
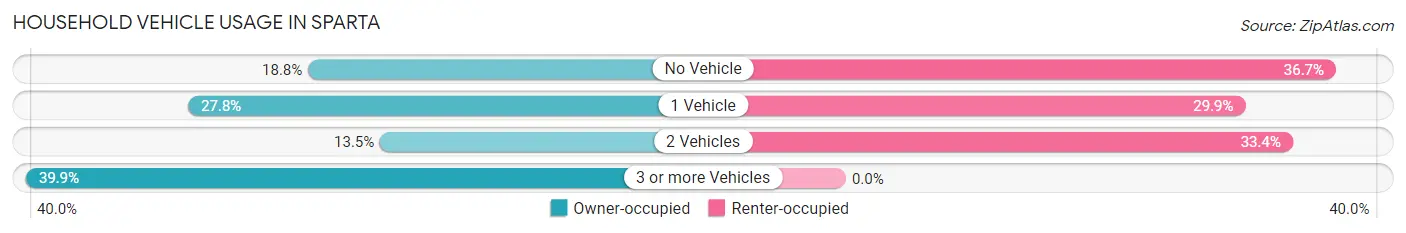
| Vehicles per Household | Owner-occupied | Renter-occupied |
| No Vehicle | 42 (18.8%) | 114 (36.7%) |
| 1 Vehicle | 62 (27.8%) | 93 (29.9%) |
| 2 Vehicles | 30 (13.5%) | 104 (33.4%) |
| 3 or more Vehicles | 89 (39.9%) | 0 (0.0%) |
| Total | 223 (100.0%) | 311 (100.0%) |
Real Estate & Mortgages in Sparta
Real Estate and Mortgage Overview in Sparta
| Characteristic | Without Mortgage | With Mortgage |
| Housing Units | 135 | 88 |
| Median Property Value | $50,500 | $57,900 |
| Median Household Income | $69,432 | $15 |
| Monthly Housing Costs | $490 | $0 |
| Real Estate Taxes | $986 | $0 |
Property Value by Mortgage Status in Sparta
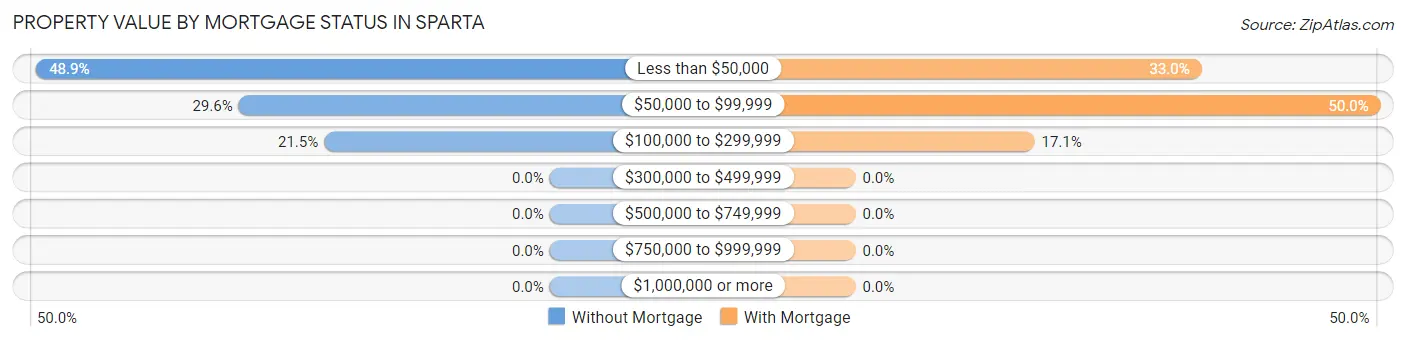
| Property Value | Without Mortgage | With Mortgage |
| Less than $50,000 | 66 (48.9%) | 29 (33.0%) |
| $50,000 to $99,999 | 40 (29.6%) | 44 (50.0%) |
| $100,000 to $299,999 | 29 (21.5%) | 15 (17.1%) |
| $300,000 to $499,999 | 0 (0.0%) | 0 (0.0%) |
| $500,000 to $749,999 | 0 (0.0%) | 0 (0.0%) |
| $750,000 to $999,999 | 0 (0.0%) | 0 (0.0%) |
| $1,000,000 or more | 0 (0.0%) | 0 (0.0%) |
| Total | 135 (100.0%) | 88 (100.0%) |
Household Income by Mortgage Status in Sparta
| Household Income | Without Mortgage | With Mortgage |
| Less than $10,000 | 14 (10.4%) | 0 (0.0%) |
| $10,000 to $24,999 | 25 (18.5%) | 0 (0.0%) |
| $25,000 to $34,999 | 9 (6.7%) | 11 (12.5%) |
| $35,000 to $49,999 | 7 (5.2%) | 9 (10.2%) |
| $50,000 to $74,999 | 15 (11.1%) | 29 (33.0%) |
| $75,000 to $99,999 | 41 (30.4%) | 4 (4.5%) |
| $100,000 to $149,999 | 14 (10.4%) | 16 (18.2%) |
| $150,000 or more | 10 (7.4%) | 4 (4.5%) |
| Total | 135 (100.0%) | 88 (100.0%) |
Property Value to Household Income Ratio in Sparta
| Value-to-Income Ratio | Without Mortgage | With Mortgage |
| Less than 2.0x | 96 (71.1%) | 0 (0.0%) |
| 2.0x to 2.9x | 13 (9.6%) | 77 (87.5%) |
| 3.0x to 3.9x | 5 (3.7%) | 0 (0.0%) |
| 4.0x or more | 16 (11.8%) | 4 (4.5%) |
| Total | 135 (100.0%) | 88 (100.0%) |
Real Estate Taxes by Mortgage Status in Sparta
| Property Taxes | Without Mortgage | With Mortgage |
| Less than $800 | 48 (35.6%) | 0 (0.0%) |
| $800 to $1,499 | 58 (43.0%) | 46 (52.3%) |
| $800 to $1,499 | 29 (21.5%) | 34 (38.6%) |
| Total | 135 (100.0%) | 88 (100.0%) |
Health & Disability in Sparta
Health Insurance Coverage by Age in Sparta
| Age Bracket | With Coverage | Without Coverage |
| Under 6 Years | 195 (100.0%) | 0 (0.0%) |
| 6 to 18 Years | 525 (98.0%) | 11 (2.1%) |
| 19 to 25 Years | 168 (75.7%) | 54 (24.3%) |
| 26 to 34 Years | 113 (70.2%) | 48 (29.8%) |
| 35 to 44 Years | 133 (94.3%) | 8 (5.7%) |
| 45 to 54 Years | 103 (67.3%) | 50 (32.7%) |
| 55 to 64 Years | 152 (84.0%) | 29 (16.0%) |
| 65 to 74 Years | 237 (100.0%) | 0 (0.0%) |
| 75 Years and older | 47 (100.0%) | 0 (0.0%) |
| Total | 1,673 (89.3%) | 200 (10.7%) |
Health Insurance Coverage by Citizenship Status in Sparta
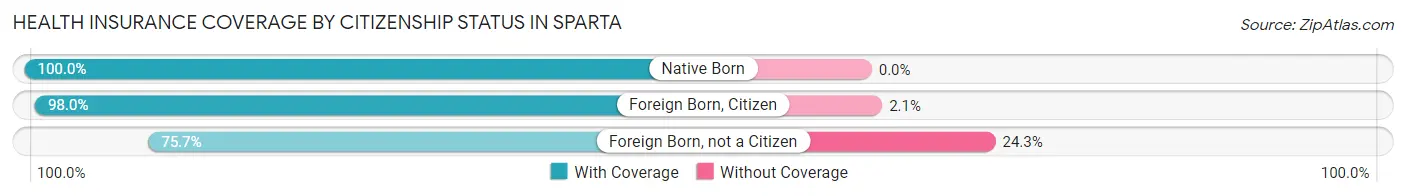
| Citizenship Status | With Coverage | Without Coverage |
| Native Born | 195 (100.0%) | 0 (0.0%) |
| Foreign Born, Citizen | 525 (98.0%) | 11 (2.1%) |
| Foreign Born, not a Citizen | 168 (75.7%) | 54 (24.3%) |
Health Insurance Coverage by Household Income in Sparta
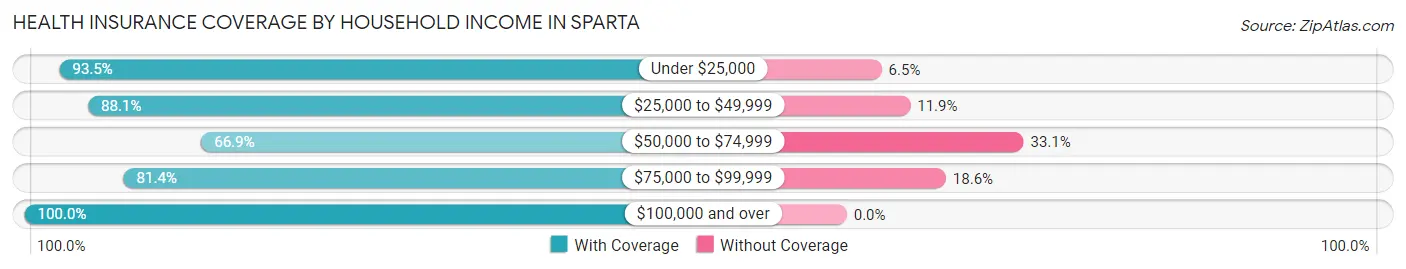
| Household Income | With Coverage | Without Coverage |
| Under $25,000 | 716 (93.5%) | 50 (6.5%) |
| $25,000 to $49,999 | 415 (88.1%) | 56 (11.9%) |
| $50,000 to $74,999 | 101 (66.9%) | 50 (33.1%) |
| $75,000 to $99,999 | 193 (81.4%) | 44 (18.6%) |
| $100,000 and over | 248 (100.0%) | 0 (0.0%) |
Public vs Private Health Insurance Coverage by Age in Sparta
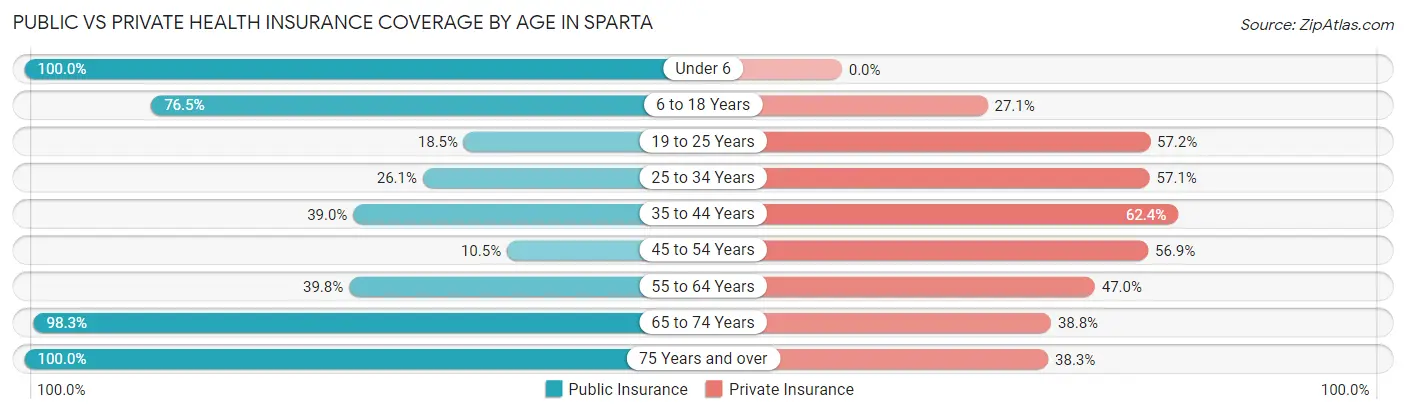
| Age Bracket | Public Insurance | Private Insurance |
| Under 6 | 195 (100.0%) | 0 (0.0%) |
| 6 to 18 Years | 410 (76.5%) | 145 (27.1%) |
| 19 to 25 Years | 41 (18.5%) | 127 (57.2%) |
| 25 to 34 Years | 42 (26.1%) | 92 (57.1%) |
| 35 to 44 Years | 55 (39.0%) | 88 (62.4%) |
| 45 to 54 Years | 16 (10.5%) | 87 (56.9%) |
| 55 to 64 Years | 72 (39.8%) | 85 (47.0%) |
| 65 to 74 Years | 233 (98.3%) | 92 (38.8%) |
| 75 Years and over | 47 (100.0%) | 18 (38.3%) |
| Total | 1,111 (59.3%) | 734 (39.2%) |
Disability Status by Sex by Age in Sparta
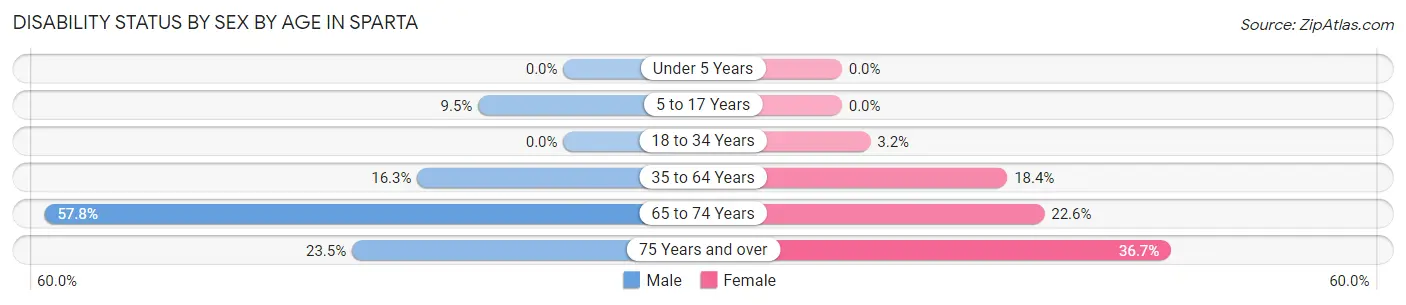
| Age Bracket | Male | Female |
| Under 5 Years | 0 (0.0%) | 0 (0.0%) |
| 5 to 17 Years | 15 (9.5%) | 0 (0.0%) |
| 18 to 34 Years | 0 (0.0%) | 7 (3.2%) |
| 35 to 64 Years | 34 (16.3%) | 49 (18.4%) |
| 65 to 74 Years | 78 (57.8%) | 23 (22.6%) |
| 75 Years and over | 4 (23.5%) | 11 (36.7%) |
Disability Class by Sex by Age in Sparta
Disability Class: Hearing Difficulty
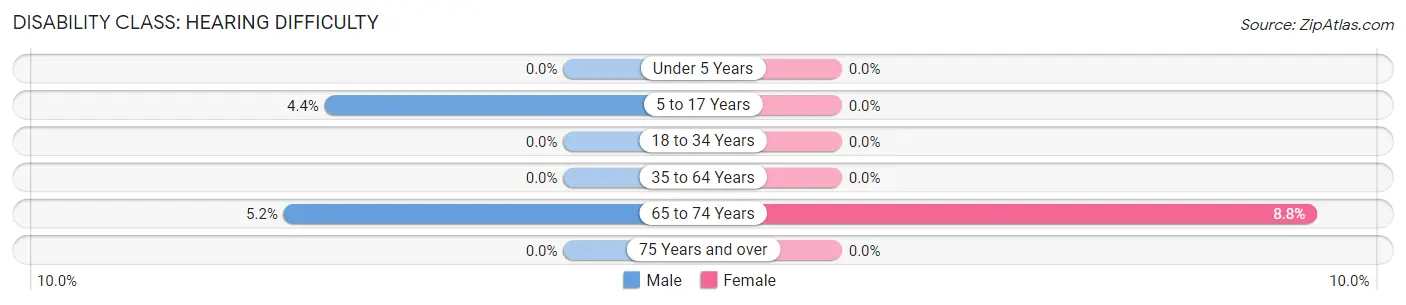
| Age Bracket | Male | Female |
| Under 5 Years | 0 (0.0%) | 0 (0.0%) |
| 5 to 17 Years | 7 (4.4%) | 0 (0.0%) |
| 18 to 34 Years | 0 (0.0%) | 0 (0.0%) |
| 35 to 64 Years | 0 (0.0%) | 0 (0.0%) |
| 65 to 74 Years | 7 (5.2%) | 9 (8.8%) |
| 75 Years and over | 0 (0.0%) | 0 (0.0%) |
Disability Class: Vision Difficulty
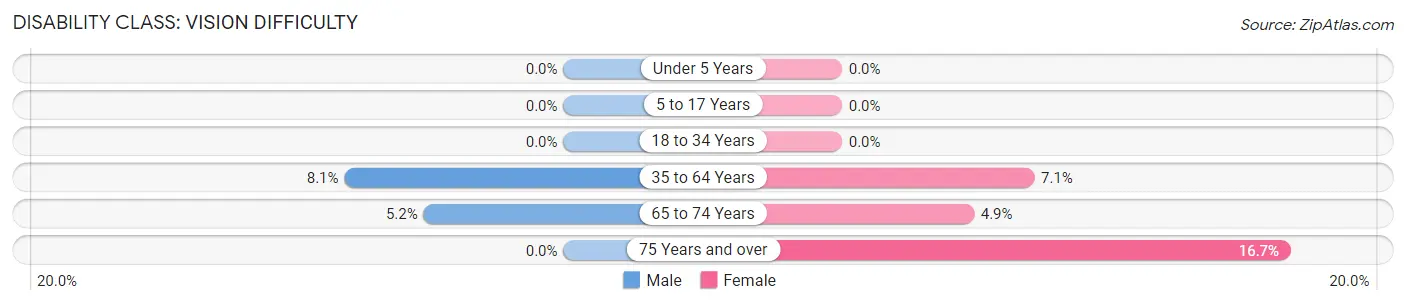
| Age Bracket | Male | Female |
| Under 5 Years | 0 (0.0%) | 0 (0.0%) |
| 5 to 17 Years | 0 (0.0%) | 0 (0.0%) |
| 18 to 34 Years | 0 (0.0%) | 0 (0.0%) |
| 35 to 64 Years | 17 (8.1%) | 19 (7.1%) |
| 65 to 74 Years | 7 (5.2%) | 5 (4.9%) |
| 75 Years and over | 0 (0.0%) | 5 (16.7%) |
Disability Class: Cognitive Difficulty
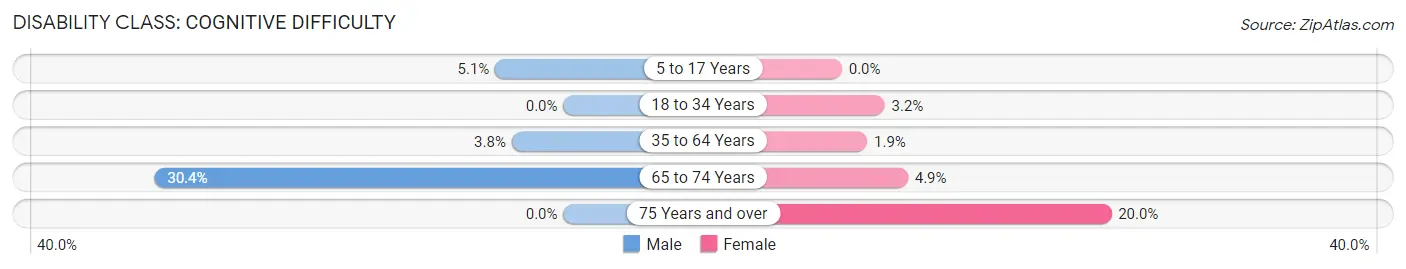
| Age Bracket | Male | Female |
| 5 to 17 Years | 8 (5.1%) | 0 (0.0%) |
| 18 to 34 Years | 0 (0.0%) | 7 (3.2%) |
| 35 to 64 Years | 8 (3.8%) | 5 (1.9%) |
| 65 to 74 Years | 41 (30.4%) | 5 (4.9%) |
| 75 Years and over | 0 (0.0%) | 6 (20.0%) |
Disability Class: Ambulatory Difficulty
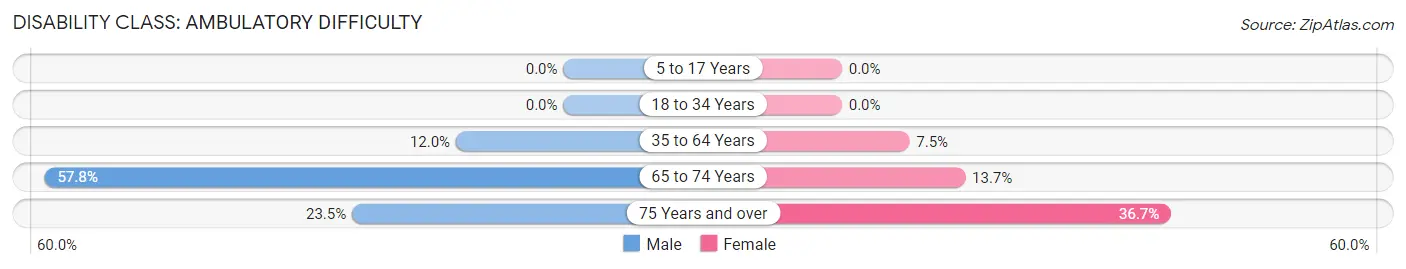
| Age Bracket | Male | Female |
| 5 to 17 Years | 0 (0.0%) | 0 (0.0%) |
| 18 to 34 Years | 0 (0.0%) | 0 (0.0%) |
| 35 to 64 Years | 25 (12.0%) | 20 (7.5%) |
| 65 to 74 Years | 78 (57.8%) | 14 (13.7%) |
| 75 Years and over | 4 (23.5%) | 11 (36.7%) |
Disability Class: Self-Care Difficulty
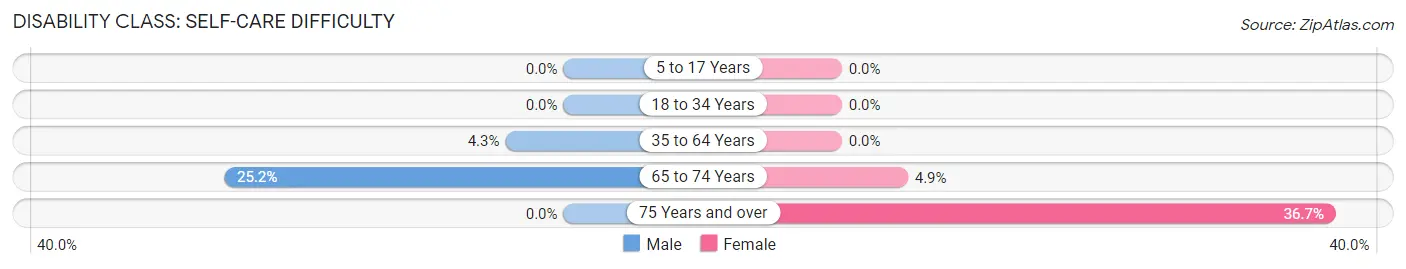
| Age Bracket | Male | Female |
| 5 to 17 Years | 0 (0.0%) | 0 (0.0%) |
| 18 to 34 Years | 0 (0.0%) | 0 (0.0%) |
| 35 to 64 Years | 9 (4.3%) | 0 (0.0%) |
| 65 to 74 Years | 34 (25.2%) | 5 (4.9%) |
| 75 Years and over | 0 (0.0%) | 11 (36.7%) |
Technology Access in Sparta
Computing Device Access in Sparta
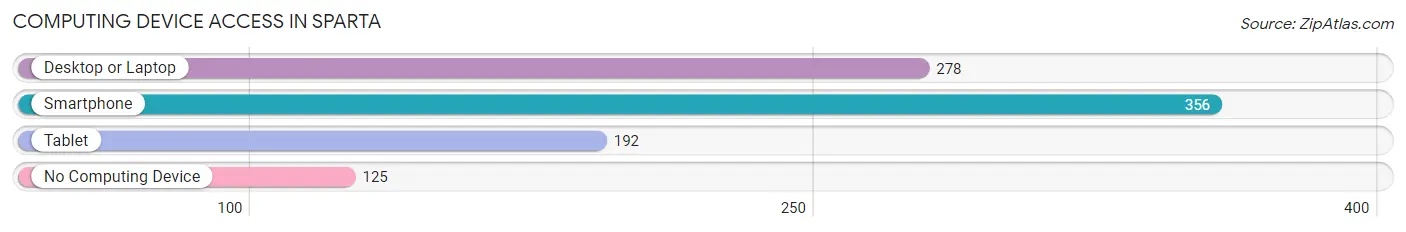
| Device Type | # Households | % Households |
| Desktop or Laptop | 278 | 52.1% |
| Smartphone | 356 | 66.7% |
| Tablet | 192 | 36.0% |
| No Computing Device | 125 | 23.4% |
| Total | 534 | 100.0% |
Internet Access in Sparta
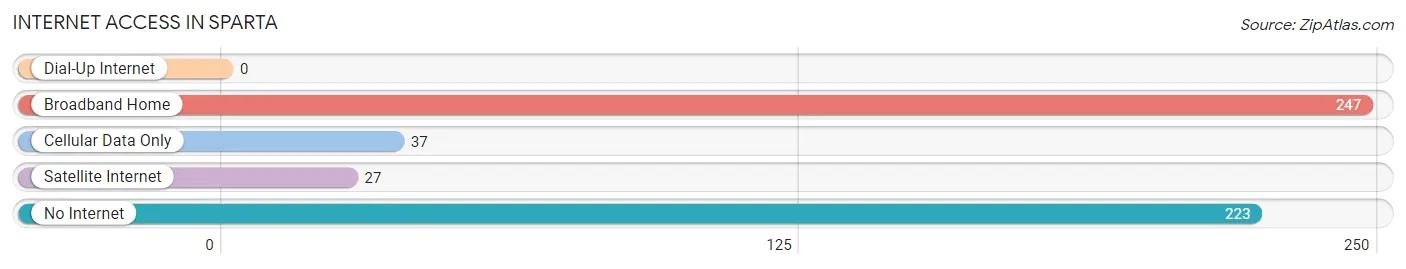
| Internet Type | # Households | % Households |
| Dial-Up Internet | 0 | 0.0% |
| Broadband Home | 247 | 46.3% |
| Cellular Data Only | 37 | 6.9% |
| Satellite Internet | 27 | 5.1% |
| No Internet | 223 | 41.8% |
| Total | 534 | 100.0% |
Sparta Summary
Sparta, Georgia is a small town located in Hancock County, Georgia. It is situated in the foothills of the Appalachian Mountains and is approximately 70 miles east of Atlanta. The town has a population of approximately 1,500 people and is the county seat of Hancock County.
History
Sparta was founded in 1806 by a group of settlers from North Carolina. The town was named after the ancient Greek city-state of Sparta, and the settlers hoped to create a similar society in the new town. The town was incorporated in 1809 and quickly became a center of commerce and industry. The town was home to several cotton mills, a sawmill, and a gristmill. The town also had a thriving agricultural industry, with cotton, corn, and tobacco being the main crops.
In the late 19th century, Sparta was a major stop on the Central of Georgia Railroad. This allowed the town to become a major shipping center for the surrounding area. The town also had a thriving lumber industry, with several sawmills located in the area.
In the early 20th century, Sparta was a major center of the textile industry. Several large mills were located in the town, and the town was home to several large cotton warehouses. The town also had a thriving furniture industry, with several furniture factories located in the area.
Geography
Sparta is located in the foothills of the Appalachian Mountains in Hancock County, Georgia. The town is situated on the banks of the Oconee River, and is approximately 70 miles east of Atlanta. The town is surrounded by rolling hills and forests, and is home to several small lakes and streams.
Economy
Sparta’s economy is largely based on agriculture and tourism. The town is home to several small farms, and the surrounding area is home to several large farms. The town is also home to several small businesses, including restaurants, shops, and other services.
The town is also home to several tourist attractions, including the Oconee River National Wildlife Refuge, the Oconee National Forest, and the Oconee River Greenway. The town is also home to several historic sites, including the Hancock County Courthouse and the Sparta Historic District.
Demographics
As of the 2010 census, Sparta had a population of 1,500 people. The town is approximately 75% white, 20% African American, and 5% Hispanic. The median household income in the town is $30,000, and the median home value is $90,000. The town has a poverty rate of approximately 20%.
Common Questions
What is Per Capita Income in Sparta?
Per Capita income in Sparta is $14,830.
What is the Median Family Income in Sparta?
Median Family Income in Sparta is $35,117.
What is the Median Household income in Sparta?
Median Household Income in Sparta is $22,102.
What is Income or Wage Gap in Sparta?
Income or Wage Gap in Sparta is 14.8%.
Women in Sparta earn 85.2 cents for every dollar earned by a man.
What is Inequality or Gini Index in Sparta?
Inequality or Gini Index in Sparta is 0.53.
What is the Total Population of Sparta?
Total Population of Sparta is 1,944.
What is the Total Male Population of Sparta?
Total Male Population of Sparta is 755.
What is the Total Female Population of Sparta?
Total Female Population of Sparta is 1,189.
What is the Ratio of Males per 100 Females in Sparta?
There are 63.50 Males per 100 Females in Sparta.
What is the Ratio of Females per 100 Males in Sparta?
There are 157.48 Females per 100 Males in Sparta.
What is the Median Population Age in Sparta?
Median Population Age in Sparta is 26.9 Years.
What is the Average Family Size in Sparta
Average Family Size in Sparta is 4.9 People.
What is the Average Household Size in Sparta
Average Household Size in Sparta is 3.5 People.
How Large is the Labor Force in Sparta?
There are 679 People in the Labor Forcein in Sparta.
What is the Percentage of People in the Labor Force in Sparta?
54.1% of People are in the Labor Force in Sparta.
What is the Unemployment Rate in Sparta?
Unemployment Rate in Sparta is 11.6%.