Dunwoody, GA Map & Demographics
Dunwoody Map
Dunwoody Overview
$66,443
PER CAPITA INCOME
$161,111
AVG FAMILY INCOME
$106,710
AVG HOUSEHOLD INCOME
37.6%
WAGE / INCOME GAP [ % ]
62.4¢/ $1
WAGE / INCOME GAP [ $ ]
$9,225
FAMILY INCOME DEFICIT
0.48
INEQUALITY / GINI INDEX
51,458
TOTAL POPULATION
25,284
MALE POPULATION
26,174
FEMALE POPULATION
96.60
MALES / 100 FEMALES
103.52
FEMALES / 100 MALES
36.9
MEDIAN AGE
3.2
AVG FAMILY SIZE
2.4
AVG HOUSEHOLD SIZE
27,770
LABOR FORCE [ PEOPLE ]
69.4%
PERCENT IN LABOR FORCE
1.8%
UNEMPLOYMENT RATE
Income in Dunwoody
Income Overview in Dunwoody
Per Capita Income in Dunwoody is $66,443, while median incomes of families and households are $161,111 and $106,710 respectively.
| Characteristic | Number | Measure |
| Per Capita Income | 51,458 | $66,443 |
| Median Family Income | 12,426 | $161,111 |
| Mean Family Income | 12,426 | $208,888 |
| Median Household Income | 21,496 | $106,710 |
| Mean Household Income | 21,496 | $156,441 |
| Income Deficit | 12,426 | $9,225 |
| Wage / Income Gap (%) | 51,458 | 37.61% |
| Wage / Income Gap ($) | 51,458 | 62.39¢ per $1 |
| Gini / Inequality Index | 51,458 | 0.48 |
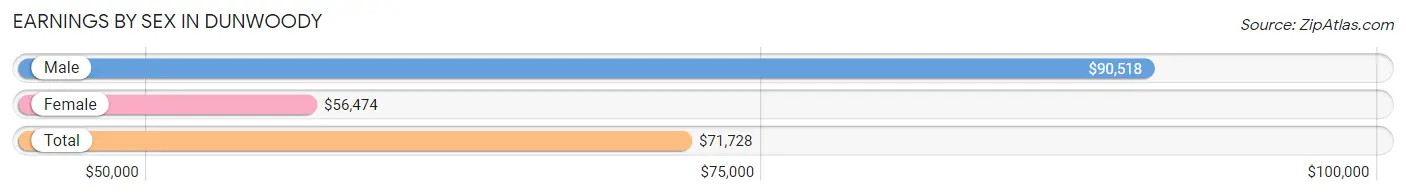
Earnings by Sex in Dunwoody
Average Earnings in Dunwoody are $71,728, $90,518 for men and $56,474 for women, a difference of 37.6%.
| Sex | Number | Average Earnings |
| Male | 15,837 (54.7%) | $90,518 |
| Female | 13,110 (45.3%) | $56,474 |
| Total | 28,947 (100.0%) | $71,728 |
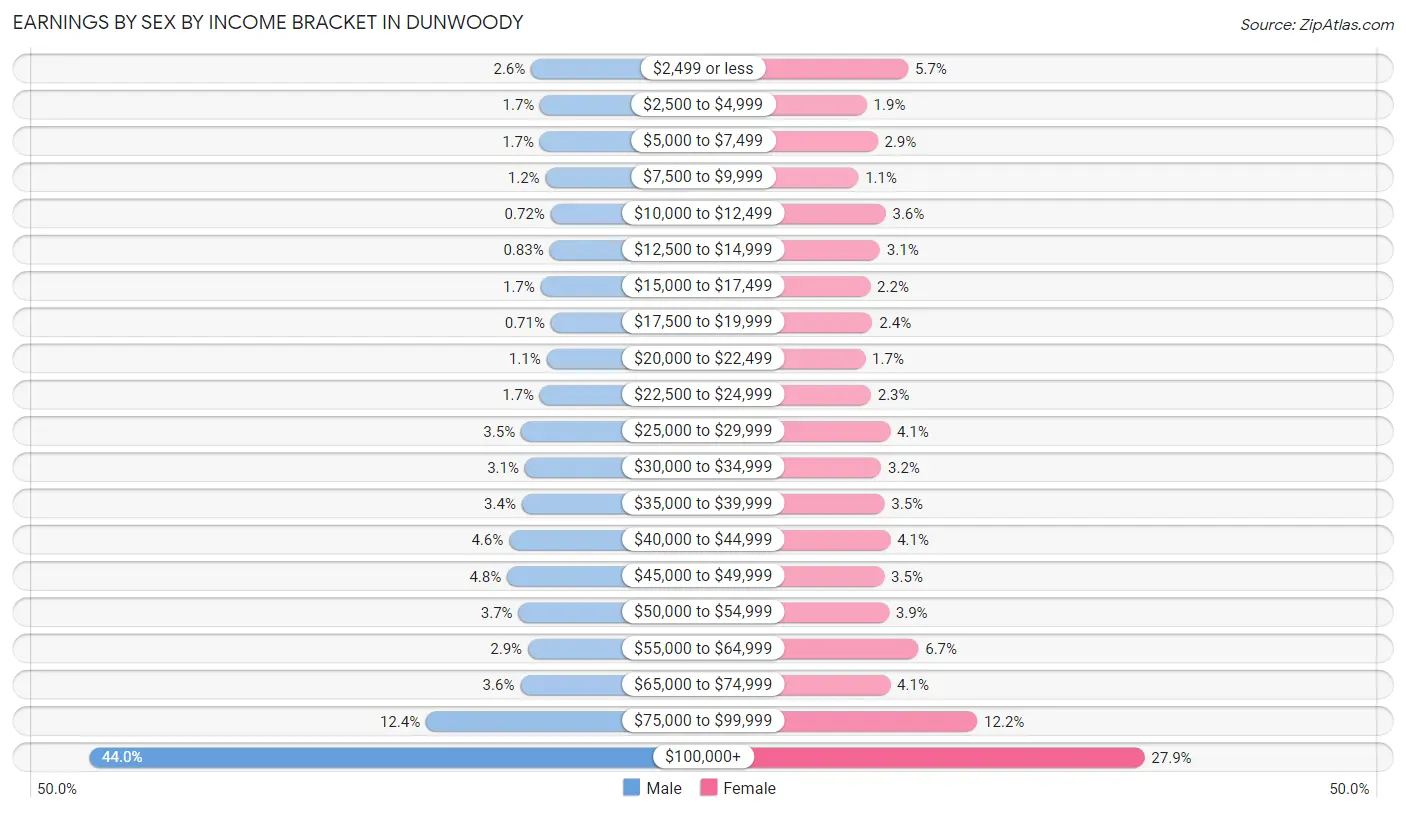
Earnings by Sex by Income Bracket in Dunwoody
The most common earnings brackets in Dunwoody are $100,000+ for men (6,961 | 44.0%) and $100,000+ for women (3,655 | 27.9%).
| Income | Male | Female |
| $2,499 or less | 404 (2.5%) | 753 (5.7%) |
| $2,500 to $4,999 | 270 (1.7%) | 244 (1.9%) |
| $5,000 to $7,499 | 275 (1.7%) | 378 (2.9%) |
| $7,500 to $9,999 | 192 (1.2%) | 140 (1.1%) |
| $10,000 to $12,499 | 114 (0.7%) | 476 (3.6%) |
| $12,500 to $14,999 | 132 (0.8%) | 406 (3.1%) |
| $15,000 to $17,499 | 263 (1.7%) | 287 (2.2%) |
| $17,500 to $19,999 | 112 (0.7%) | 315 (2.4%) |
| $20,000 to $22,499 | 176 (1.1%) | 226 (1.7%) |
| $22,500 to $24,999 | 275 (1.7%) | 295 (2.2%) |
| $25,000 to $29,999 | 555 (3.5%) | 531 (4.1%) |
| $30,000 to $34,999 | 498 (3.1%) | 421 (3.2%) |
| $35,000 to $39,999 | 543 (3.4%) | 462 (3.5%) |
| $40,000 to $44,999 | 732 (4.6%) | 534 (4.1%) |
| $45,000 to $49,999 | 761 (4.8%) | 459 (3.5%) |
| $50,000 to $54,999 | 593 (3.7%) | 516 (3.9%) |
| $55,000 to $64,999 | 452 (2.9%) | 879 (6.7%) |
| $65,000 to $74,999 | 566 (3.6%) | 532 (4.1%) |
| $75,000 to $99,999 | 1,963 (12.4%) | 1,601 (12.2%) |
| $100,000+ | 6,961 (44.0%) | 3,655 (27.9%) |
| Total | 15,837 (100.0%) | 13,110 (100.0%) |
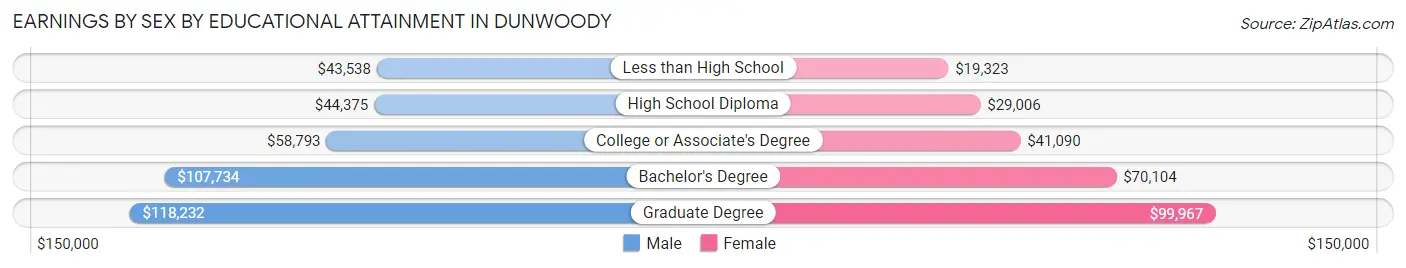
Earnings by Sex by Educational Attainment in Dunwoody
Average earnings in Dunwoody are $98,578 for men and $62,490 for women, a difference of 36.6%. Men with an educational attainment of graduate degree enjoy the highest average annual earnings of $118,232, while those with less than high school education earn the least with $43,538. Women with an educational attainment of graduate degree earn the most with the average annual earnings of $99,967, while those with less than high school education have the smallest earnings of $19,323.
| Educational Attainment | Male Income | Female Income |
| Less than High School | $43,538 | $19,323 |
| High School Diploma | $44,375 | $29,006 |
| College or Associate's Degree | $58,793 | $41,090 |
| Bachelor's Degree | $107,734 | $70,104 |
| Graduate Degree | $118,232 | $99,967 |
| Total | $98,578 | $62,490 |
Family Income in Dunwoody
Family Income Brackets in Dunwoody
According to the Dunwoody family income data, there are 4,908 families falling into the $200,000+ income range, which is the most common income bracket and makes up 39.5% of all families.
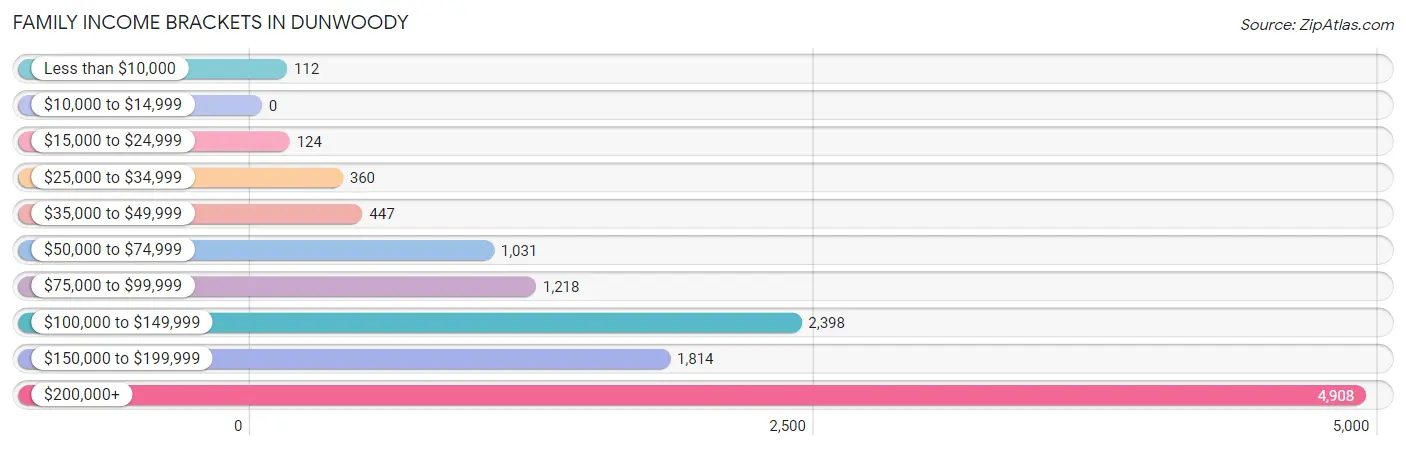
| Income Bracket | # Families | % Families |
| Less than $10,000 | 112 | 0.9% |
| $10,000 to $14,999 | 0 | 0.0% |
| $15,000 to $24,999 | 124 | 1.0% |
| $25,000 to $34,999 | 360 | 2.9% |
| $35,000 to $49,999 | 447 | 3.6% |
| $50,000 to $74,999 | 1,031 | 8.3% |
| $75,000 to $99,999 | 1,218 | 9.8% |
| $100,000 to $149,999 | 2,398 | 19.3% |
| $150,000 to $199,999 | 1,814 | 14.6% |
| $200,000+ | 4,908 | 39.5% |
Family Income by Famaliy Size in Dunwoody
4-person families (2,494 | 20.1%) account for the highest median family income in Dunwoody with $250,001 per family, while 2-person families (5,516 | 44.4%) have the highest median income of $69,936 per family member.
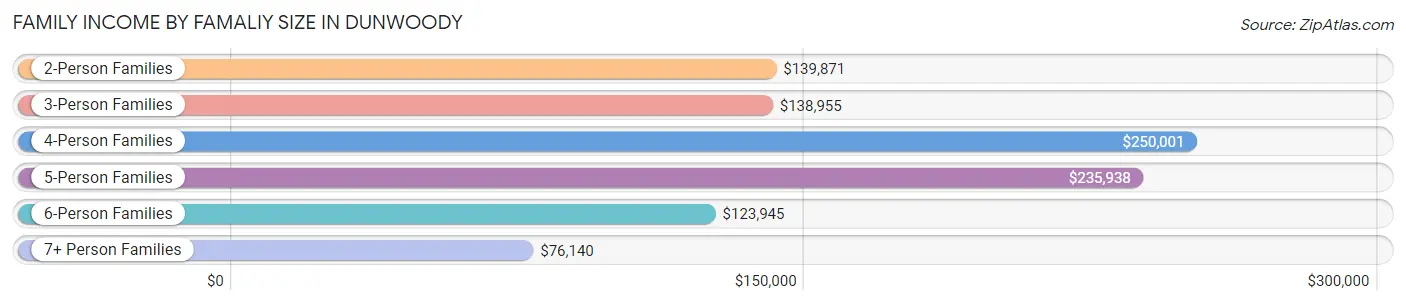
| Income Bracket | # Families | Median Income |
| 2-Person Families | 5,516 (44.4%) | $139,871 |
| 3-Person Families | 3,164 (25.5%) | $138,955 |
| 4-Person Families | 2,494 (20.1%) | $250,001 |
| 5-Person Families | 1,068 (8.6%) | $235,938 |
| 6-Person Families | 129 (1.0%) | $123,945 |
| 7+ Person Families | 55 (0.4%) | $76,140 |
| Total | 12,426 (100.0%) | $161,111 |
Family Income by Number of Earners in Dunwoody
The median family income in Dunwoody is $161,111, with families comprising 3+ earners (990) having the highest median family income of $237,000, while families with no earners (1,389) have the lowest median family income of $100,670, accounting for 8.0% and 11.2% of families, respectively.
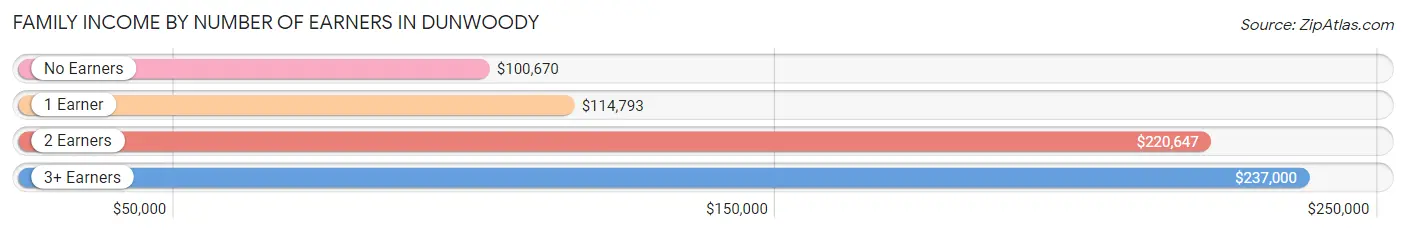
| Number of Earners | # Families | Median Income |
| No Earners | 1,389 (11.2%) | $100,670 |
| 1 Earner | 4,162 (33.5%) | $114,793 |
| 2 Earners | 5,885 (47.4%) | $220,647 |
| 3+ Earners | 990 (8.0%) | $237,000 |
| Total | 12,426 (100.0%) | $161,111 |
Household Income in Dunwoody
Household Income Brackets in Dunwoody
With 5,610 households falling in the category, the $200,000+ income range is the most frequent in Dunwoody, accounting for 26.1% of all households. In contrast, only 150 households (0.7%) fall into the $10,000 to $14,999 income bracket, making it the least populous group.
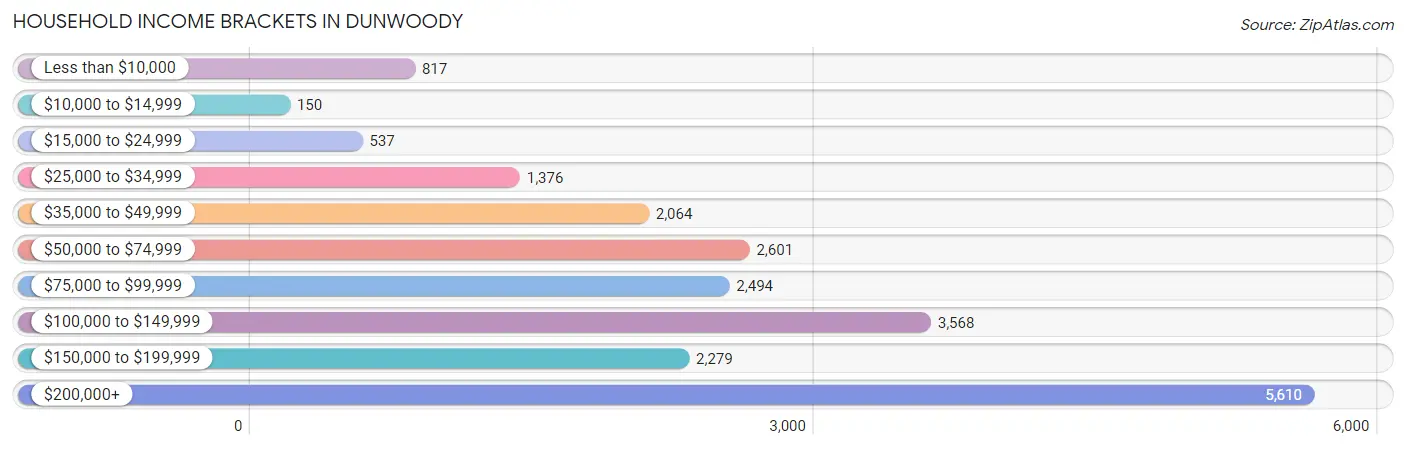
| Income Bracket | # Households | % Households |
| Less than $10,000 | 817 | 3.8% |
| $10,000 to $14,999 | 150 | 0.7% |
| $15,000 to $24,999 | 537 | 2.5% |
| $25,000 to $34,999 | 1,376 | 6.4% |
| $35,000 to $49,999 | 2,064 | 9.6% |
| $50,000 to $74,999 | 2,601 | 12.1% |
| $75,000 to $99,999 | 2,494 | 11.6% |
| $100,000 to $149,999 | 3,568 | 16.6% |
| $150,000 to $199,999 | 2,279 | 10.6% |
| $200,000+ | 5,610 | 26.1% |
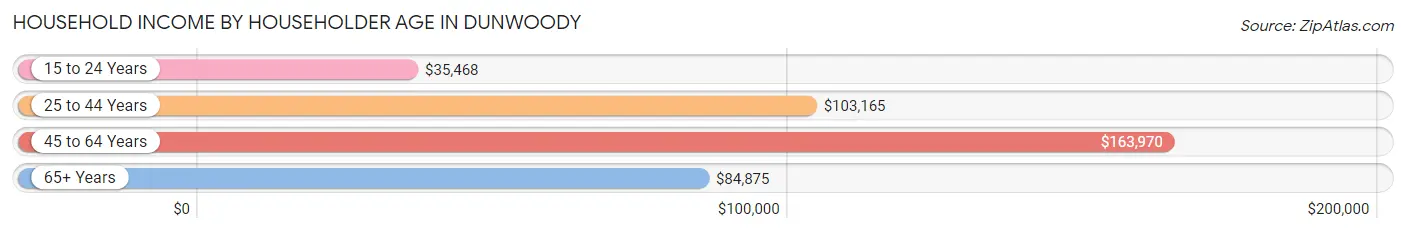
Household Income by Householder Age in Dunwoody
The median household income in Dunwoody is $106,710, with the highest median household income of $163,970 found in the 45 to 64 years age bracket for the primary householder. A total of 6,333 households (29.5%) fall into this category. Meanwhile, the 15 to 24 years age bracket for the primary householder has the lowest median household income of $35,468, with 695 households (3.2%) in this group.
| Income Bracket | # Households | Median Income |
| 15 to 24 Years | 695 (3.2%) | $35,468 |
| 25 to 44 Years | 9,711 (45.2%) | $103,165 |
| 45 to 64 Years | 6,333 (29.5%) | $163,970 |
| 65+ Years | 4,757 (22.1%) | $84,875 |
| Total | 21,496 (100.0%) | $106,710 |
Poverty in Dunwoody
Income Below Poverty by Sex and Age in Dunwoody
With 4.9% poverty level for males and 7.6% for females among the residents of Dunwoody, 12 to 14 year old males and 18 to 24 year old females are the most vulnerable to poverty, with 154 males (13.0%) and 407 females (22.6%) in their respective age groups living below the poverty level.
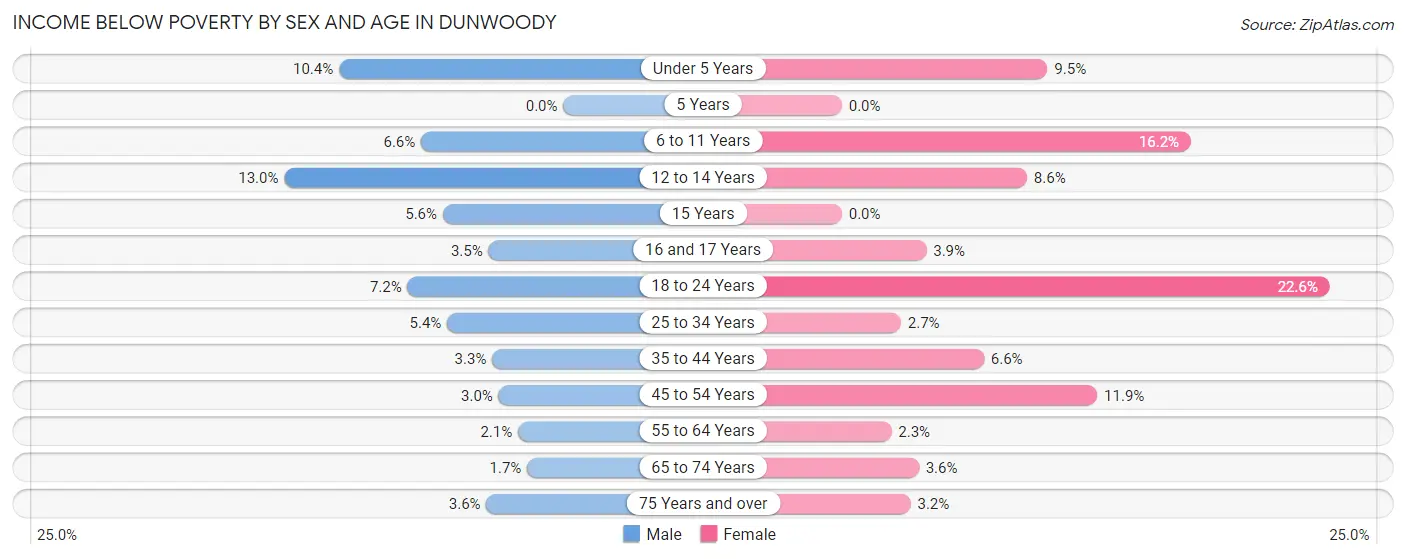
| Age Bracket | Male | Female |
| Under 5 Years | 169 (10.4%) | 181 (9.5%) |
| 5 Years | 0 (0.0%) | 0 (0.0%) |
| 6 to 11 Years | 158 (6.6%) | 272 (16.2%) |
| 12 to 14 Years | 154 (13.0%) | 83 (8.6%) |
| 15 Years | 28 (5.6%) | 0 (0.0%) |
| 16 and 17 Years | 20 (3.5%) | 28 (3.9%) |
| 18 to 24 Years | 108 (7.2%) | 407 (22.6%) |
| 25 to 34 Years | 222 (5.4%) | 111 (2.7%) |
| 35 to 44 Years | 150 (3.3%) | 250 (6.6%) |
| 45 to 54 Years | 78 (3.0%) | 461 (11.8%) |
| 55 to 64 Years | 55 (2.1%) | 52 (2.3%) |
| 65 to 74 Years | 28 (1.7%) | 78 (3.6%) |
| 75 Years and over | 55 (3.6%) | 67 (3.2%) |
| Total | 1,225 (4.9%) | 1,990 (7.6%) |
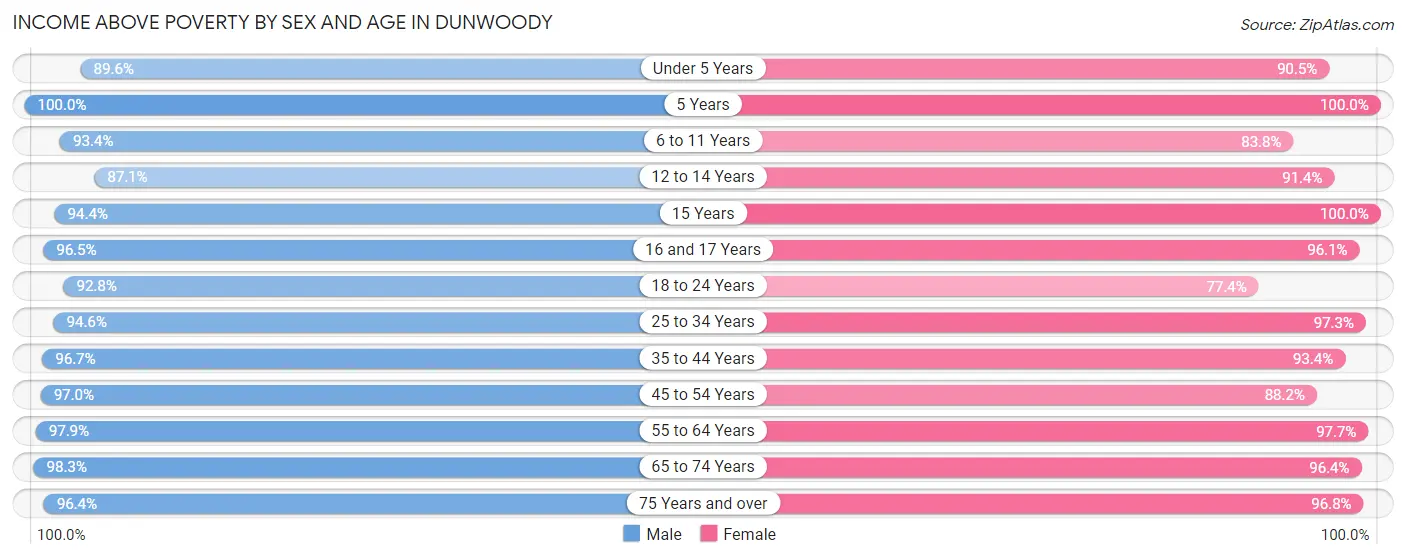
Income Above Poverty by Sex and Age in Dunwoody
According to the poverty statistics in Dunwoody, males aged 5 years and females aged 5 years are the age groups that are most secure financially, with 100.0% of males and 100.0% of females in these age groups living above the poverty line.
| Age Bracket | Male | Female |
| Under 5 Years | 1,455 (89.6%) | 1,716 (90.5%) |
| 5 Years | 320 (100.0%) | 234 (100.0%) |
| 6 to 11 Years | 2,237 (93.4%) | 1,407 (83.8%) |
| 12 to 14 Years | 1,035 (87.1%) | 883 (91.4%) |
| 15 Years | 473 (94.4%) | 507 (100.0%) |
| 16 and 17 Years | 556 (96.5%) | 687 (96.1%) |
| 18 to 24 Years | 1,386 (92.8%) | 1,391 (77.4%) |
| 25 to 34 Years | 3,897 (94.6%) | 3,939 (97.3%) |
| 35 to 44 Years | 4,393 (96.7%) | 3,542 (93.4%) |
| 45 to 54 Years | 2,523 (97.0%) | 3,430 (88.1%) |
| 55 to 64 Years | 2,566 (97.9%) | 2,204 (97.7%) |
| 65 to 74 Years | 1,642 (98.3%) | 2,109 (96.4%) |
| 75 Years and over | 1,486 (96.4%) | 2,031 (96.8%) |
| Total | 23,969 (95.1%) | 24,080 (92.4%) |
Income Below Poverty Among Married-Couple Families in Dunwoody
The poverty statistics for married-couple families in Dunwoody show that 0.9% or 98 of the total 10,582 families live below the poverty line. Families with 3 or 4 children have the highest poverty rate of 6.6%, comprising of 61 families. On the other hand, families with 1 or 2 children have the lowest poverty rate of 0.3%, which includes 13 families.
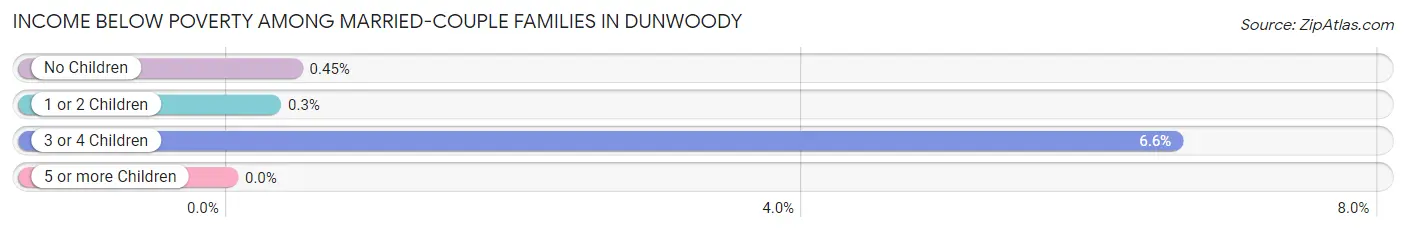
| Children | Above Poverty | Below Poverty |
| No Children | 5,269 (99.6%) | 24 (0.4%) |
| 1 or 2 Children | 4,349 (99.7%) | 13 (0.3%) |
| 3 or 4 Children | 866 (93.4%) | 61 (6.6%) |
| 5 or more Children | 0 (0.0%) | 0 (0.0%) |
| Total | 10,484 (99.1%) | 98 (0.9%) |
Income Below Poverty Among Single-Parent Households in Dunwoody
According to the poverty data in Dunwoody, 10.0% or 63 single-father households and 13.3% or 162 single-mother households are living below the poverty line. Among single-father households, those with 5 or more children have the highest poverty rate, with 12 households (100.0%) experiencing poverty. Likewise, among single-mother households, those with 3 or 4 children have the highest poverty rate, with 16 households (100.0%) falling below the poverty line.
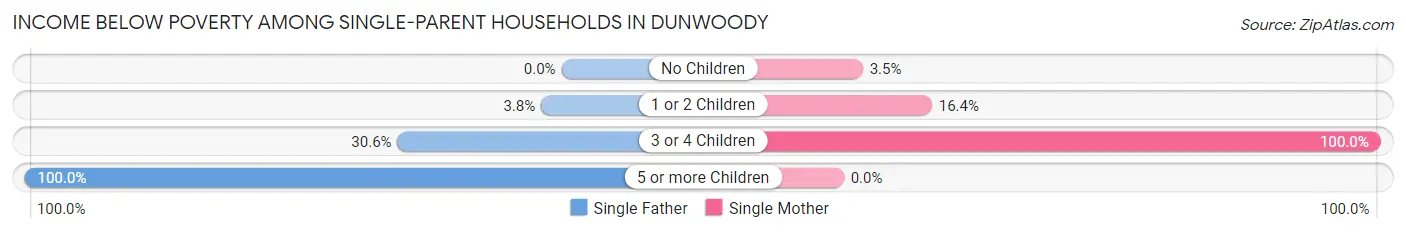
| Children | Single Father | Single Mother |
| No Children | 0 (0.0%) | 14 (3.5%) |
| 1 or 2 Children | 7 (3.8%) | 132 (16.4%) |
| 3 or 4 Children | 44 (30.6%) | 16 (100.0%) |
| 5 or more Children | 12 (100.0%) | 0 (0.0%) |
| Total | 63 (10.0%) | 162 (13.3%) |
Income Below Poverty Among Married-Couple vs Single-Parent Households in Dunwoody
The poverty data for Dunwoody shows that 98 of the married-couple family households (0.9%) and 225 of the single-parent households (12.2%) are living below the poverty level. Within the married-couple family households, those with 3 or 4 children have the highest poverty rate, with 61 households (6.6%) falling below the poverty line. Among the single-parent households, those with 5 or more children have the highest poverty rate, with 12 household (100.0%) living below poverty.
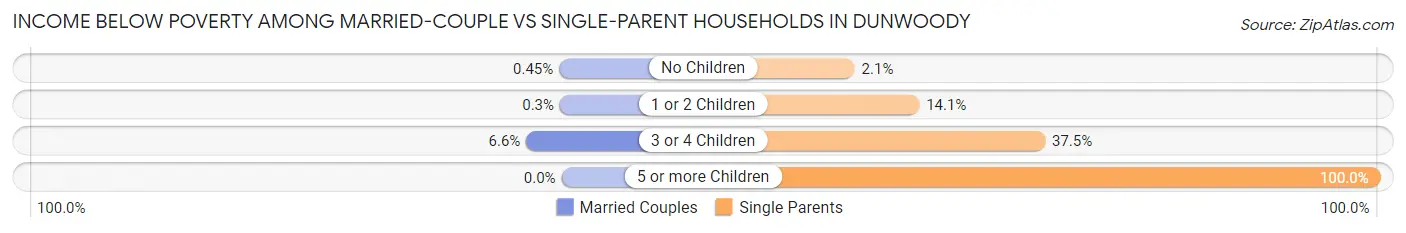
| Children | Married-Couple Families | Single-Parent Households |
| No Children | 24 (0.4%) | 14 (2.1%) |
| 1 or 2 Children | 13 (0.3%) | 139 (14.1%) |
| 3 or 4 Children | 61 (6.6%) | 60 (37.5%) |
| 5 or more Children | 0 (0.0%) | 12 (100.0%) |
| Total | 98 (0.9%) | 225 (12.2%) |
Race in Dunwoody
The most populous races in Dunwoody are White / Caucasian (31,600 | 61.4%), Asian (8,773 | 17.1%), and Black / African American (6,355 | 12.3%).
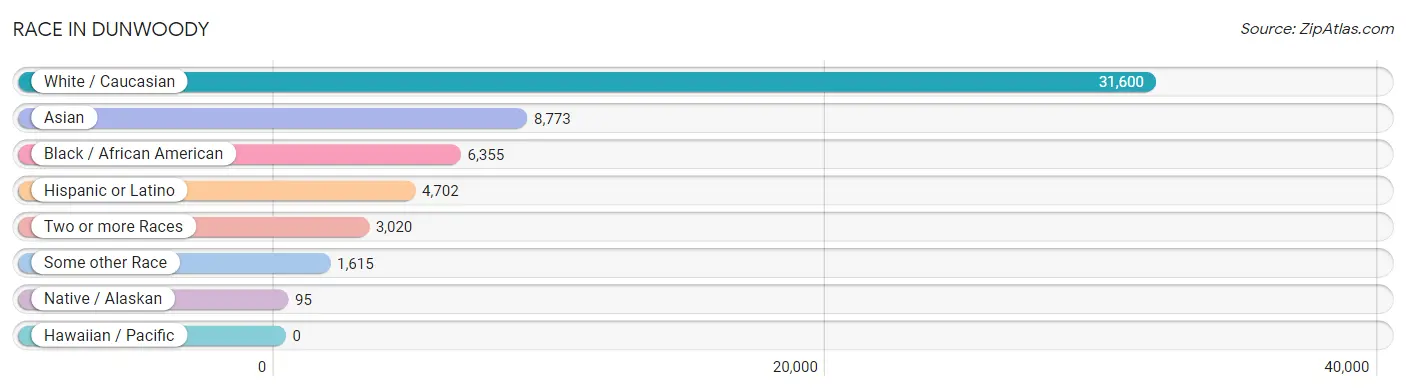
| Race | # Population | % Population |
| Asian | 8,773 | 17.1% |
| Black / African American | 6,355 | 12.3% |
| Hawaiian / Pacific | 0 | 0.0% |
| Hispanic or Latino | 4,702 | 9.1% |
| Native / Alaskan | 95 | 0.2% |
| White / Caucasian | 31,600 | 61.4% |
| Two or more Races | 3,020 | 5.9% |
| Some other Race | 1,615 | 3.1% |
| Total | 51,458 | 100.0% |
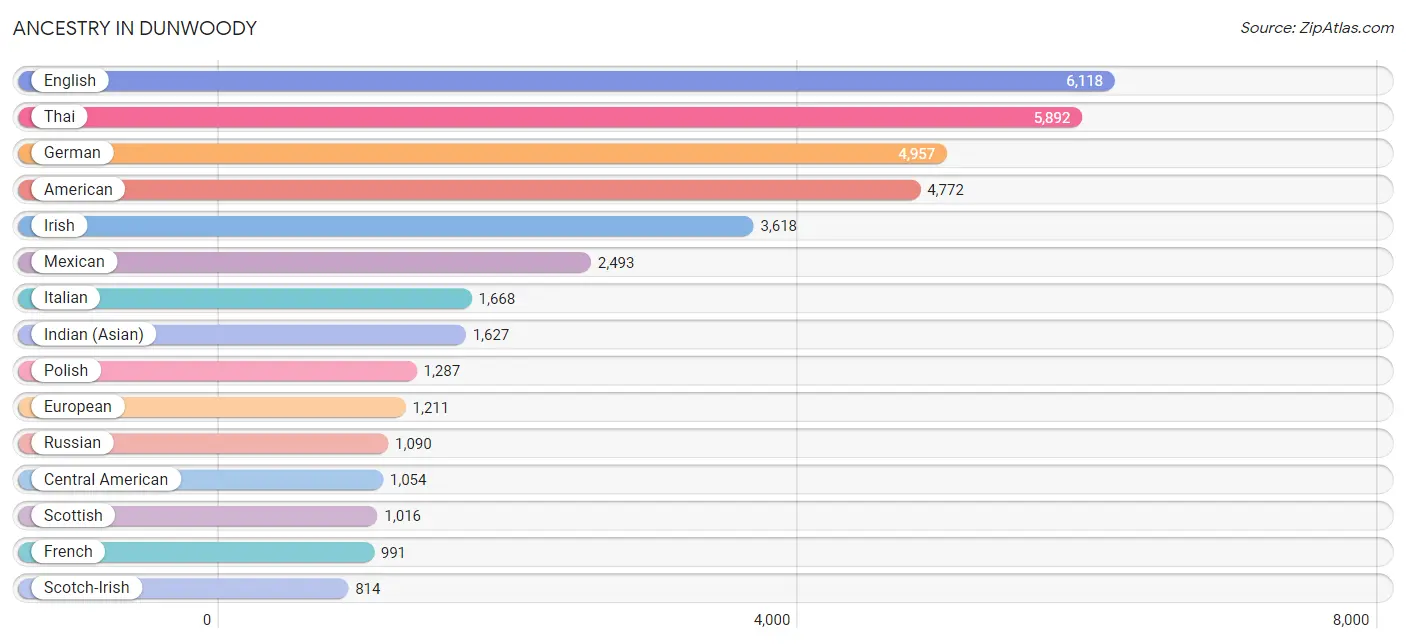
Ancestry in Dunwoody
The most populous ancestries reported in Dunwoody are English (6,118 | 11.9%), Thai (5,892 | 11.5%), German (4,957 | 9.6%), American (4,772 | 9.3%), and Irish (3,618 | 7.0%), together accounting for 49.3% of all Dunwoody residents.
| Ancestry | # Population | % Population |
| African | 223 | 0.4% |
| American | 4,772 | 9.3% |
| Arab | 282 | 0.5% |
| Armenian | 33 | 0.1% |
| Australian | 16 | 0.0% |
| Austrian | 194 | 0.4% |
| Belgian | 21 | 0.0% |
| Bhutanese | 515 | 1.0% |
| Brazilian | 19 | 0.0% |
| British | 700 | 1.4% |
| Burmese | 712 | 1.4% |
| Canadian | 78 | 0.2% |
| Celtic | 9 | 0.0% |
| Central American | 1,054 | 2.1% |
| Cherokee | 137 | 0.3% |
| Chickasaw | 20 | 0.0% |
| Choctaw | 77 | 0.2% |
| Colombian | 308 | 0.6% |
| Costa Rican | 28 | 0.1% |
| Croatian | 8 | 0.0% |
| Cuban | 81 | 0.2% |
| Czech | 293 | 0.6% |
| Czechoslovakian | 17 | 0.0% |
| Danish | 282 | 0.5% |
| Dominican | 65 | 0.1% |
| Dutch | 194 | 0.4% |
| Eastern European | 801 | 1.6% |
| Egyptian | 12 | 0.0% |
| English | 6,118 | 11.9% |
| Estonian | 13 | 0.0% |
| Ethiopian | 113 | 0.2% |
| European | 1,211 | 2.4% |
| Filipino | 153 | 0.3% |
| Finnish | 34 | 0.1% |
| French | 991 | 1.9% |
| French Canadian | 182 | 0.4% |
| German | 4,957 | 9.6% |
| Ghanaian | 90 | 0.2% |
| Greek | 528 | 1.0% |
| Guatemalan | 632 | 1.2% |
| Haitian | 190 | 0.4% |
| Honduran | 357 | 0.7% |
| Hungarian | 198 | 0.4% |
| Indian (Asian) | 1,627 | 3.2% |
| Iranian | 81 | 0.2% |
| Iraqi | 10 | 0.0% |
| Irish | 3,618 | 7.0% |
| Israeli | 183 | 0.4% |
| Italian | 1,668 | 3.2% |
| Jamaican | 52 | 0.1% |
| Japanese | 63 | 0.1% |
| Jordanian | 53 | 0.1% |
| Kenyan | 125 | 0.2% |
| Korean | 191 | 0.4% |
| Latvian | 21 | 0.0% |
| Lebanese | 176 | 0.3% |
| Liberian | 15 | 0.0% |
| Lithuanian | 189 | 0.4% |
| Macedonian | 5 | 0.0% |
| Malaysian | 67 | 0.1% |
| Mexican | 2,493 | 4.8% |
| Mexican American Indian | 97 | 0.2% |
| Mongolian | 20 | 0.0% |
| Moroccan | 11 | 0.0% |
| Nigerian | 86 | 0.2% |
| Northern European | 58 | 0.1% |
| Norwegian | 556 | 1.1% |
| Pakistani | 114 | 0.2% |
| Panamanian | 10 | 0.0% |
| Peruvian | 8 | 0.0% |
| Polish | 1,287 | 2.5% |
| Portuguese | 29 | 0.1% |
| Puerto Rican | 310 | 0.6% |
| Romanian | 18 | 0.0% |
| Russian | 1,090 | 2.1% |
| Salvadoran | 14 | 0.0% |
| Scandinavian | 109 | 0.2% |
| Scotch-Irish | 814 | 1.6% |
| Scottish | 1,016 | 2.0% |
| Serbian | 52 | 0.1% |
| Slavic | 45 | 0.1% |
| Slovak | 51 | 0.1% |
| South African | 33 | 0.1% |
| South American | 416 | 0.8% |
| Spaniard | 37 | 0.1% |
| Spanish | 10 | 0.0% |
| Sri Lankan | 348 | 0.7% |
| Subsaharan African | 763 | 1.5% |
| Swedish | 667 | 1.3% |
| Swiss | 226 | 0.4% |
| Syrian | 20 | 0.0% |
| Thai | 5,892 | 11.5% |
| Trinidadian and Tobagonian | 76 | 0.2% |
| Turkish | 68 | 0.1% |
| U.S. Virgin Islander | 61 | 0.1% |
| Ukrainian | 196 | 0.4% |
| Uruguayan | 12 | 0.0% |
| Venezuelan | 88 | 0.2% |
| Welsh | 370 | 0.7% |
| West Indian | 31 | 0.1% |
| Yugoslavian | 23 | 0.0% | View All 101 Rows |
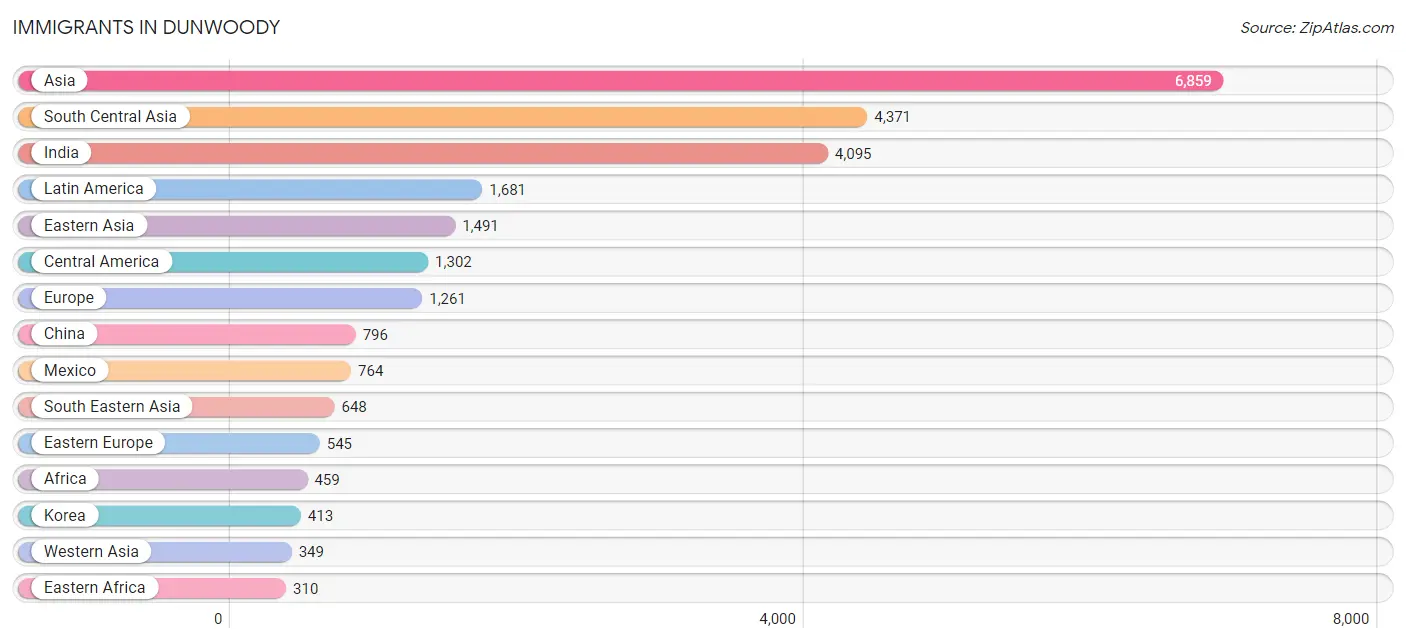
Immigrants in Dunwoody
The most numerous immigrant groups reported in Dunwoody came from Asia (6,859 | 13.3%), South Central Asia (4,371 | 8.5%), India (4,095 | 8.0%), Latin America (1,681 | 3.3%), and Eastern Asia (1,491 | 2.9%), together accounting for 36.0% of all Dunwoody residents.
| Immigration Origin | # Population | % Population |
| Africa | 459 | 0.9% |
| Asia | 6,859 | 13.3% |
| Australia | 22 | 0.0% |
| Bangladesh | 22 | 0.0% |
| Cambodia | 49 | 0.1% |
| Canada | 227 | 0.4% |
| Caribbean | 201 | 0.4% |
| Central America | 1,302 | 2.5% |
| China | 796 | 1.5% |
| Colombia | 70 | 0.1% |
| Costa Rica | 12 | 0.0% |
| Cuba | 16 | 0.0% |
| Czechoslovakia | 26 | 0.1% |
| Dominican Republic | 46 | 0.1% |
| Eastern Africa | 310 | 0.6% |
| Eastern Asia | 1,491 | 2.9% |
| Eastern Europe | 545 | 1.1% |
| Egypt | 12 | 0.0% |
| El Salvador | 114 | 0.2% |
| England | 85 | 0.2% |
| Ethiopia | 61 | 0.1% |
| Europe | 1,261 | 2.5% |
| France | 21 | 0.0% |
| Germany | 126 | 0.2% |
| Greece | 230 | 0.4% |
| Guatemala | 234 | 0.4% |
| Haiti | 17 | 0.0% |
| Honduras | 168 | 0.3% |
| Hong Kong | 10 | 0.0% |
| India | 4,095 | 8.0% |
| Indonesia | 31 | 0.1% |
| Iran | 24 | 0.1% |
| Israel | 114 | 0.2% |
| Italy | 13 | 0.0% |
| Jamaica | 47 | 0.1% |
| Japan | 282 | 0.5% |
| Jordan | 53 | 0.1% |
| Kenya | 177 | 0.3% |
| Korea | 413 | 0.8% |
| Kuwait | 11 | 0.0% |
| Laos | 33 | 0.1% |
| Latin America | 1,681 | 3.3% |
| Latvia | 112 | 0.2% |
| Lebanon | 34 | 0.1% |
| Lithuania | 61 | 0.1% |
| Malaysia | 20 | 0.0% |
| Mexico | 764 | 1.5% |
| Nepal | 25 | 0.1% |
| Nigeria | 3 | 0.0% |
| Northern Africa | 24 | 0.1% |
| Northern Europe | 297 | 0.6% |
| Norway | 113 | 0.2% |
| Oceania | 22 | 0.0% |
| Pakistan | 150 | 0.3% |
| Panama | 10 | 0.0% |
| Peru | 8 | 0.0% |
| Philippines | 112 | 0.2% |
| Poland | 89 | 0.2% |
| Portugal | 11 | 0.0% |
| Romania | 15 | 0.0% |
| Russia | 137 | 0.3% |
| Sierra Leone | 12 | 0.0% |
| Singapore | 37 | 0.1% |
| South Africa | 94 | 0.2% |
| South America | 178 | 0.4% |
| South Central Asia | 4,371 | 8.5% |
| South Eastern Asia | 648 | 1.3% |
| Southern Europe | 264 | 0.5% |
| Spain | 10 | 0.0% |
| Sri Lanka | 43 | 0.1% |
| Sudan | 12 | 0.0% |
| Switzerland | 8 | 0.0% |
| Taiwan | 73 | 0.1% |
| Thailand | 85 | 0.2% |
| Trinidad and Tobago | 75 | 0.2% |
| Turkey | 68 | 0.1% |
| Ukraine | 43 | 0.1% |
| Uruguay | 12 | 0.0% |
| Venezuela | 88 | 0.2% |
| Vietnam | 281 | 0.5% |
| Western Africa | 15 | 0.0% |
| Western Asia | 349 | 0.7% |
| Western Europe | 155 | 0.3% | View All 83 Rows |
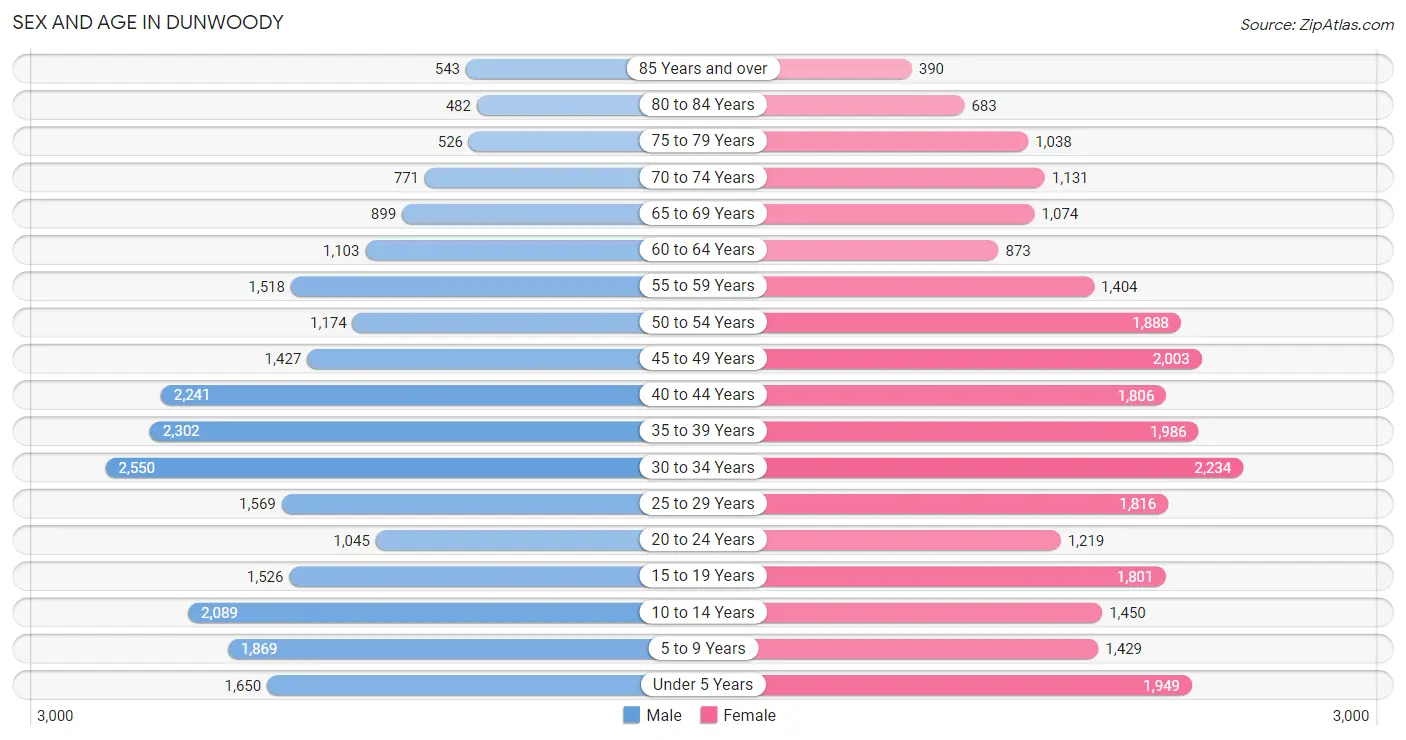
Sex and Age in Dunwoody
Sex and Age in Dunwoody
The most populous age groups in Dunwoody are 30 to 34 Years (2,550 | 10.1%) for men and 30 to 34 Years (2,234 | 8.5%) for women.
| Age Bracket | Male | Female |
| Under 5 Years | 1,650 (6.5%) | 1,949 (7.4%) |
| 5 to 9 Years | 1,869 (7.4%) | 1,429 (5.5%) |
| 10 to 14 Years | 2,089 (8.3%) | 1,450 (5.5%) |
| 15 to 19 Years | 1,526 (6.0%) | 1,801 (6.9%) |
| 20 to 24 Years | 1,045 (4.1%) | 1,219 (4.7%) |
| 25 to 29 Years | 1,569 (6.2%) | 1,816 (6.9%) |
| 30 to 34 Years | 2,550 (10.1%) | 2,234 (8.5%) |
| 35 to 39 Years | 2,302 (9.1%) | 1,986 (7.6%) |
| 40 to 44 Years | 2,241 (8.9%) | 1,806 (6.9%) |
| 45 to 49 Years | 1,427 (5.6%) | 2,003 (7.6%) |
| 50 to 54 Years | 1,174 (4.6%) | 1,888 (7.2%) |
| 55 to 59 Years | 1,518 (6.0%) | 1,404 (5.4%) |
| 60 to 64 Years | 1,103 (4.4%) | 873 (3.3%) |
| 65 to 69 Years | 899 (3.6%) | 1,074 (4.1%) |
| 70 to 74 Years | 771 (3.0%) | 1,131 (4.3%) |
| 75 to 79 Years | 526 (2.1%) | 1,038 (4.0%) |
| 80 to 84 Years | 482 (1.9%) | 683 (2.6%) |
| 85 Years and over | 543 (2.1%) | 390 (1.5%) |
| Total | 25,284 (100.0%) | 26,174 (100.0%) |
Families and Households in Dunwoody
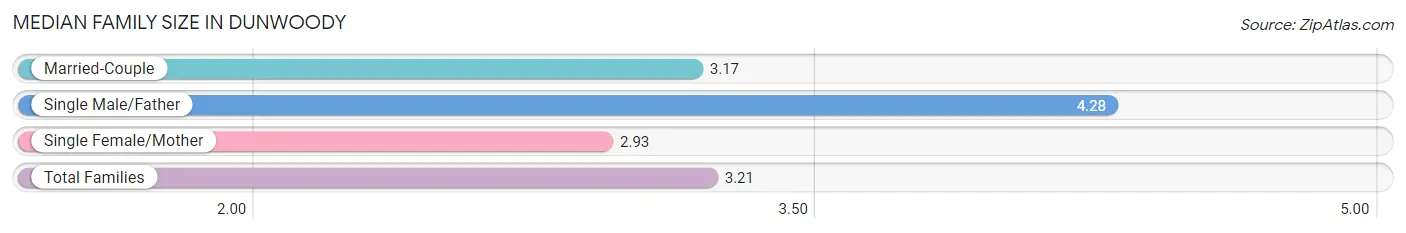
Median Family Size in Dunwoody
The median family size in Dunwoody is 3.21 persons per family, with single male/father families (628 | 5.1%) accounting for the largest median family size of 4.28 persons per family. On the other hand, single female/mother families (1,216 | 9.8%) represent the smallest median family size with 2.93 persons per family.
| Family Type | # Families | Family Size |
| Married-Couple | 10,582 (85.2%) | 3.17 |
| Single Male/Father | 628 (5.1%) | 4.28 |
| Single Female/Mother | 1,216 (9.8%) | 2.93 |
| Total Families | 12,426 (100.0%) | 3.21 |
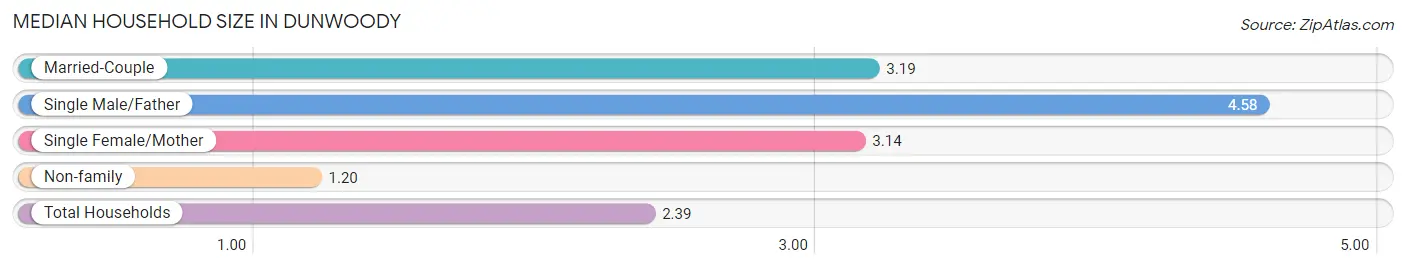
Median Household Size in Dunwoody
The median household size in Dunwoody is 2.39 persons per household, with single male/father households (628 | 2.9%) accounting for the largest median household size of 4.58 persons per household. non-family households (9,070 | 42.2%) represent the smallest median household size with 1.20 persons per household.
| Household Type | # Households | Household Size |
| Married-Couple | 10,582 (49.2%) | 3.19 |
| Single Male/Father | 628 (2.9%) | 4.58 |
| Single Female/Mother | 1,216 (5.7%) | 3.14 |
| Non-family | 9,070 (42.2%) | 1.20 |
| Total Households | 21,496 (100.0%) | 2.39 |
Household Size by Marriage Status in Dunwoody
Out of a total of 21,496 households in Dunwoody, 12,426 (57.8%) are family households, while 9,070 (42.2%) are nonfamily households. The most numerous type of family households are 2-person households, comprising 5,314, and the most common type of nonfamily households are 1-person households, comprising 7,864.
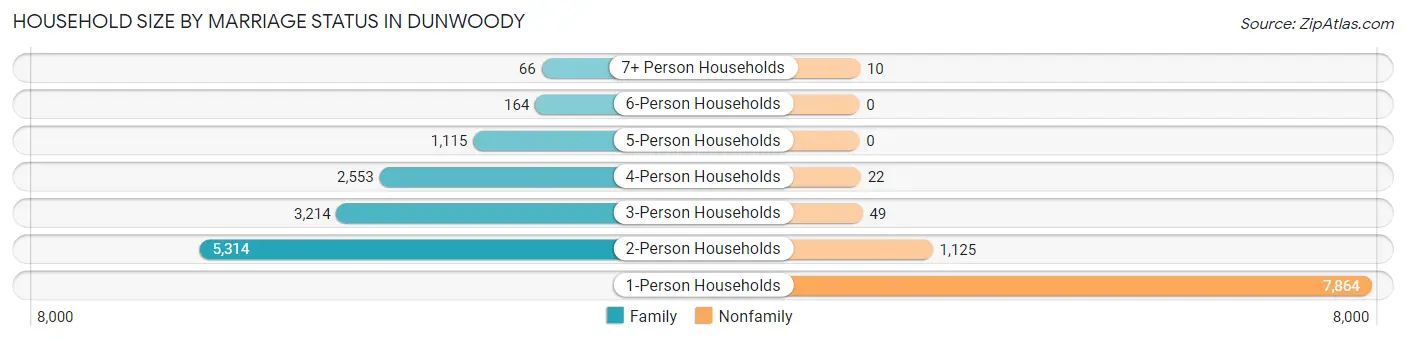
| Household Size | Family Households | Nonfamily Households |
| 1-Person Households | - | 7,864 (36.6%) |
| 2-Person Households | 5,314 (24.7%) | 1,125 (5.2%) |
| 3-Person Households | 3,214 (14.9%) | 49 (0.2%) |
| 4-Person Households | 2,553 (11.9%) | 22 (0.1%) |
| 5-Person Households | 1,115 (5.2%) | 0 (0.0%) |
| 6-Person Households | 164 (0.8%) | 0 (0.0%) |
| 7+ Person Households | 66 (0.3%) | 10 (0.1%) |
| Total | 12,426 (57.8%) | 9,070 (42.2%) |
Female Fertility in Dunwoody
Fertility by Age in Dunwoody
Average fertility rate in Dunwoody is 37.0 births per 1,000 women. Women in the age bracket of 20 to 34 years have the highest fertility rate with 44.0 births per 1,000 women. Women in the age bracket of 35 to 50 years acount for 51.8% of all women with births.
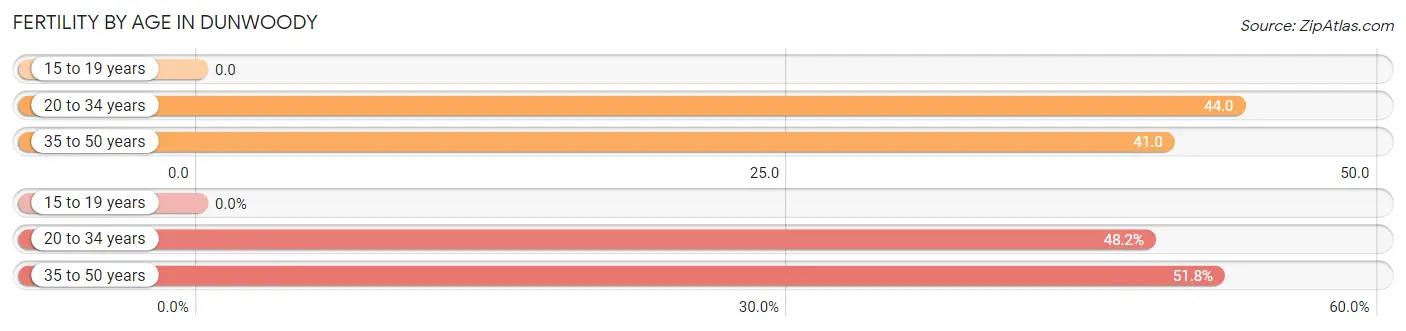
| Age Bracket | Women with Births | Births / 1,000 Women |
| 15 to 19 years | 0 (0.0%) | 0.0 |
| 20 to 34 years | 233 (48.2%) | 44.0 |
| 35 to 50 years | 250 (51.8%) | 41.0 |
| Total | 483 (100.0%) | 37.0 |
Fertility by Age by Marriage Status in Dunwoody
84.9% of women with births (483) in Dunwoody are married. The highest percentage of unmarried women with births falls into 35 to 50 years age bracket with 29.2% of them unmarried at the time of birth, while the lowest percentage of unmarried women with births belong to 20 to 34 years age bracket with 0.0% of them unmarried.
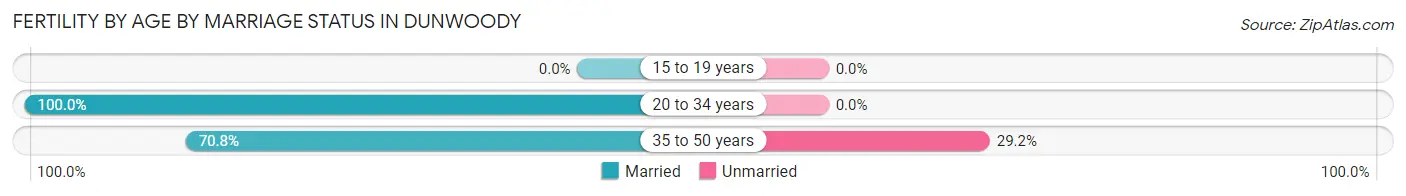
| Age Bracket | Married | Unmarried |
| 15 to 19 years | 0 (0.0%) | 0 (0.0%) |
| 20 to 34 years | 233 (100.0%) | 0 (0.0%) |
| 35 to 50 years | 177 (70.8%) | 73 (29.2%) |
| Total | 410 (84.9%) | 73 (15.1%) |
Fertility by Education in Dunwoody
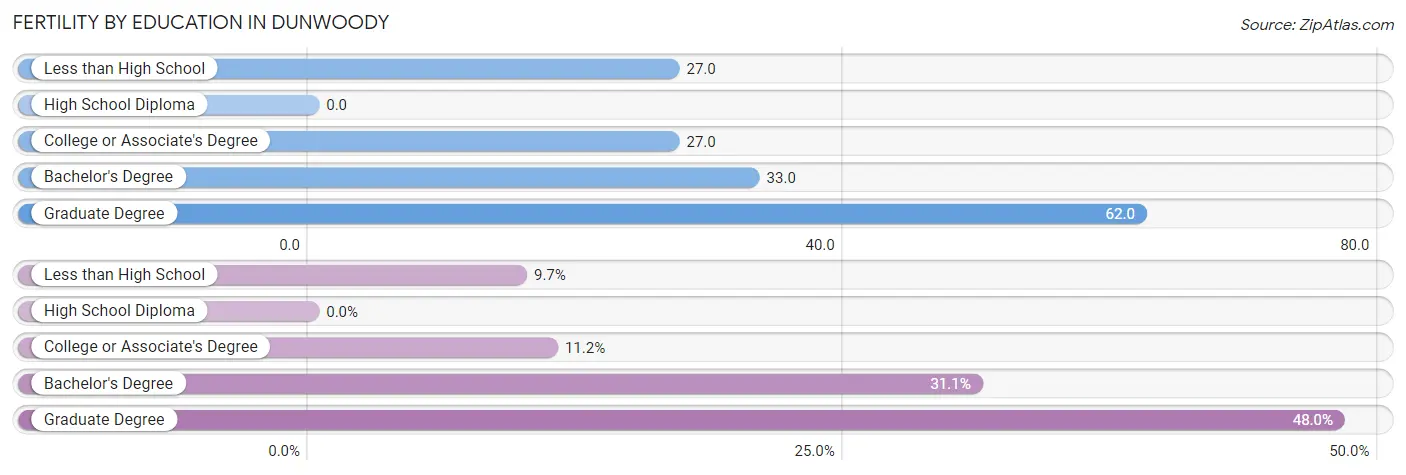
| Educational Attainment | Women with Births | Births / 1,000 Women |
| Less than High School | 47 (9.7%) | 27.0 |
| High School Diploma | 0 (0.0%) | 0.0 |
| College or Associate's Degree | 54 (11.2%) | 27.0 |
| Bachelor's Degree | 150 (31.1%) | 33.0 |
| Graduate Degree | 232 (48.0%) | 62.0 |
| Total | 483 (100.0%) | 37.0 |
Fertility by Education by Marriage Status in Dunwoody
15.1% of women with births in Dunwoody are unmarried. Women with the educational attainment of bachelor's degree are most likely to be married with 100.0% of them married at childbirth, while women with the educational attainment of less than high school are least likely to be married with 51.1% of them unmarried at childbirth.
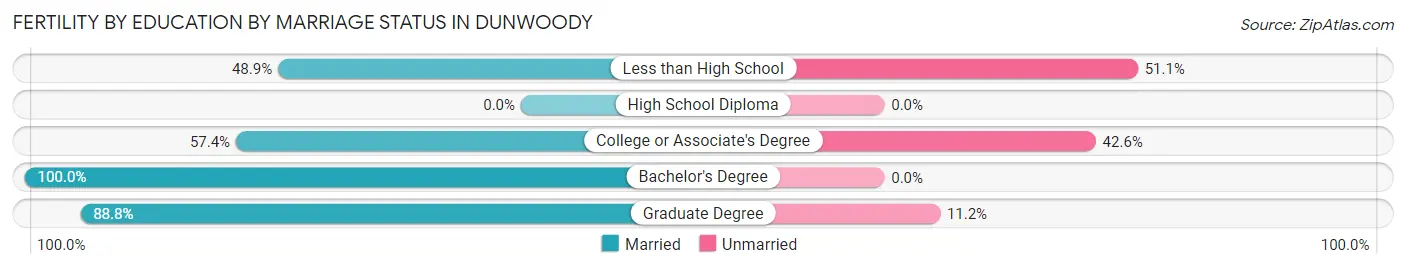
| Educational Attainment | Married | Unmarried |
| Less than High School | 23 (48.9%) | 24 (51.1%) |
| High School Diploma | 0 (0.0%) | 0 (0.0%) |
| College or Associate's Degree | 31 (57.4%) | 23 (42.6%) |
| Bachelor's Degree | 150 (100.0%) | 0 (0.0%) |
| Graduate Degree | 206 (88.8%) | 26 (11.2%) |
| Total | 410 (84.9%) | 73 (15.1%) |
Employment Characteristics in Dunwoody
Employment by Class of Employer in Dunwoody
Among the 26,905 employed individuals in Dunwoody, private company employees (19,678 | 73.1%), not-for-profit organizations (2,582 | 9.6%), and self-employed (incorporated) (1,741 | 6.5%) make up the most common classes of employment.
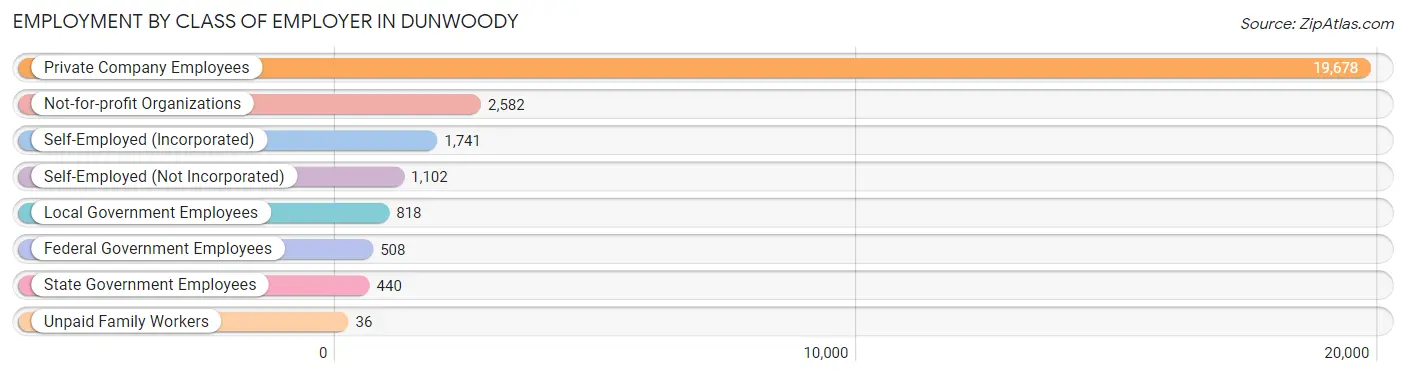
| Employer Class | # Employees | % Employees |
| Private Company Employees | 19,678 | 73.1% |
| Self-Employed (Incorporated) | 1,741 | 6.5% |
| Self-Employed (Not Incorporated) | 1,102 | 4.1% |
| Not-for-profit Organizations | 2,582 | 9.6% |
| Local Government Employees | 818 | 3.0% |
| State Government Employees | 440 | 1.6% |
| Federal Government Employees | 508 | 1.9% |
| Unpaid Family Workers | 36 | 0.1% |
| Total | 26,905 | 100.0% |
Employment Status by Age in Dunwoody
According to the labor force statistics for Dunwoody, out of the total population over 16 years of age (40,014), 69.4% or 27,770 individuals are in the labor force, with 1.8% or 500 of them unemployed. The age group with the highest labor force participation rate is 35 to 44 years, with 88.3% or 7,360 individuals in the labor force. Within the labor force, the 20 to 24 years age range has the highest percentage of unemployed individuals, with 10.6% or 181 of them being unemployed.
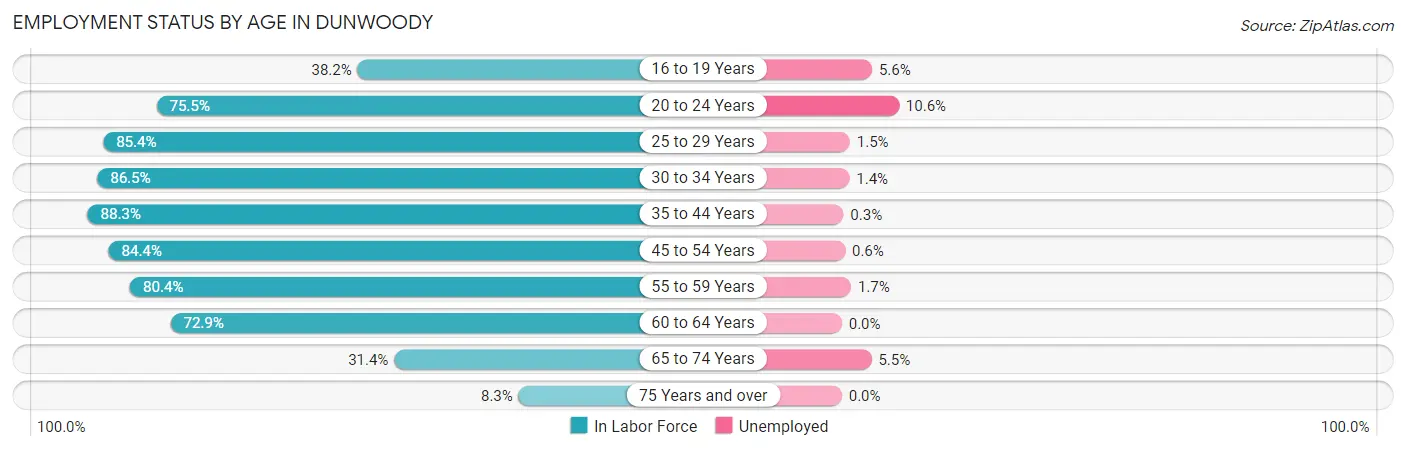
| Age Bracket | In Labor Force | Unemployed |
| 16 to 19 Years | 886 (38.2%) | 50 (5.6%) |
| 20 to 24 Years | 1,709 (75.5%) | 181 (10.6%) |
| 25 to 29 Years | 2,891 (85.4%) | 43 (1.5%) |
| 30 to 34 Years | 4,138 (86.5%) | 58 (1.4%) |
| 35 to 44 Years | 7,360 (88.3%) | 22 (0.3%) |
| 45 to 54 Years | 5,479 (84.4%) | 33 (0.6%) |
| 55 to 59 Years | 2,349 (80.4%) | 40 (1.7%) |
| 60 to 64 Years | 1,441 (72.9%) | 0 (0.0%) |
| 65 to 74 Years | 1,217 (31.4%) | 67 (5.5%) |
| 75 Years and over | 304 (8.3%) | 0 (0.0%) |
| Total | 27,770 (69.4%) | 500 (1.8%) |
Employment Status by Educational Attainment in Dunwoody
According to labor force statistics for Dunwoody, 84.8% of individuals (23,654) out of the total population between 25 and 64 years of age (27,894) are in the labor force, with 0.8% or 189 of them being unemployed. The group with the highest labor force participation rate are those with the educational attainment of high school diploma, with 88.7% or 1,760 individuals in the labor force. Within the labor force, individuals with high school diploma education have the highest percentage of unemployment, with 3.8% or 67 of them being unemployed.
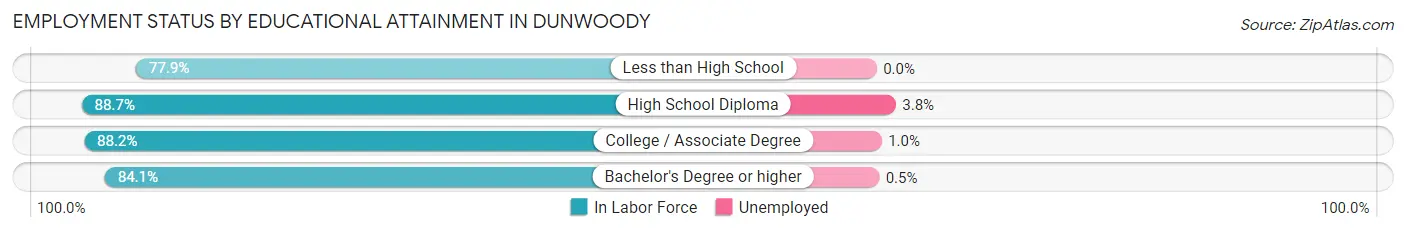
| Educational Attainment | In Labor Force | Unemployed |
| Less than High School | 858 (77.9%) | 0 (0.0%) |
| High School Diploma | 1,760 (88.7%) | 75 (3.8%) |
| College / Associate Degree | 3,734 (88.2%) | 42 (1.0%) |
| Bachelor's Degree or higher | 17,304 (84.1%) | 103 (0.5%) |
| Total | 23,654 (84.8%) | 223 (0.8%) |
Employment Occupations by Sex in Dunwoody
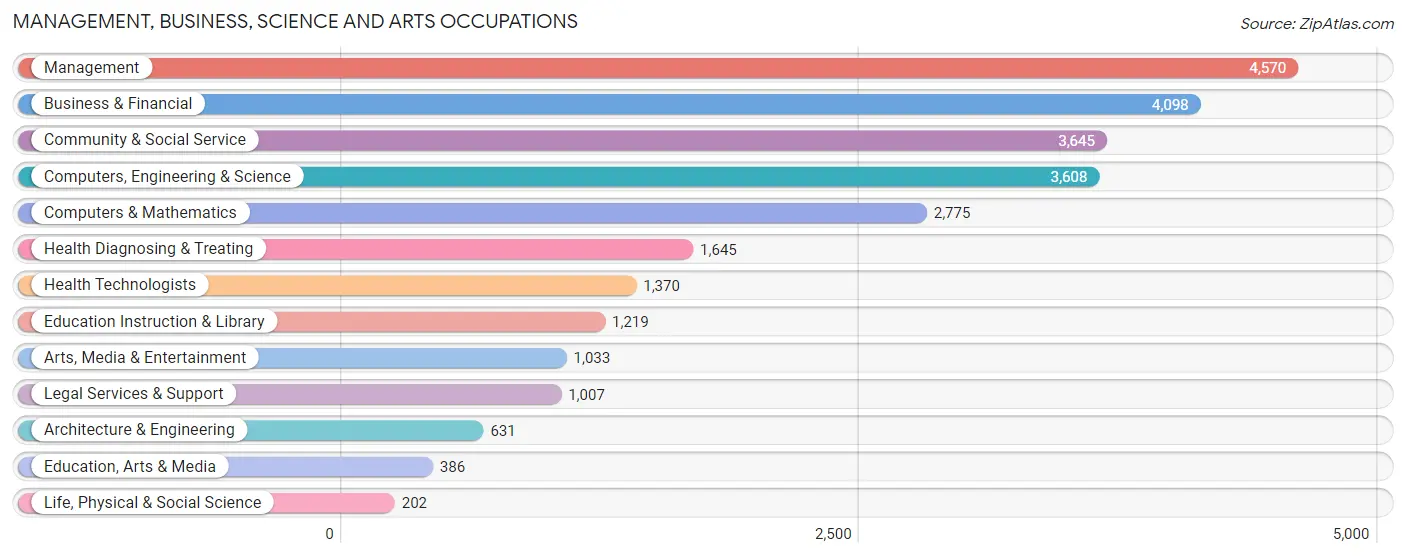
Management, Business, Science and Arts Occupations
The most common Management, Business, Science and Arts occupations in Dunwoody are Management (4,570 | 16.8%), Business & Financial (4,098 | 15.1%), Community & Social Service (3,645 | 13.4%), Computers, Engineering & Science (3,608 | 13.3%), and Computers & Mathematics (2,775 | 10.2%).
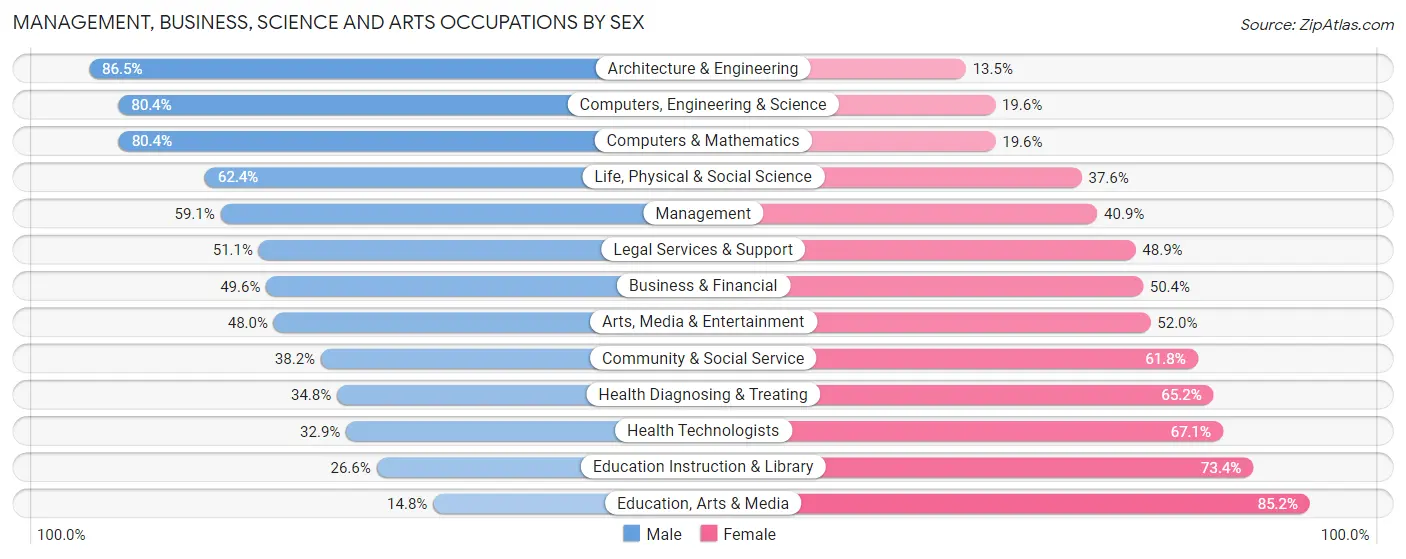
Management, Business, Science and Arts Occupations by Sex
Within the Management, Business, Science and Arts occupations in Dunwoody, the most male-oriented occupations are Architecture & Engineering (86.5%), Computers, Engineering & Science (80.4%), and Computers & Mathematics (80.4%), while the most female-oriented occupations are Education, Arts & Media (85.2%), Education Instruction & Library (73.4%), and Health Technologists (67.1%).
| Occupation | Male | Female |
| Management | 2,702 (59.1%) | 1,868 (40.9%) |
| Business & Financial | 2,032 (49.6%) | 2,066 (50.4%) |
| Computers, Engineering & Science | 2,902 (80.4%) | 706 (19.6%) |
| Computers & Mathematics | 2,230 (80.4%) | 545 (19.6%) |
| Architecture & Engineering | 546 (86.5%) | 85 (13.5%) |
| Life, Physical & Social Science | 126 (62.4%) | 76 (37.6%) |
| Community & Social Service | 1,392 (38.2%) | 2,253 (61.8%) |
| Education, Arts & Media | 57 (14.8%) | 329 (85.2%) |
| Legal Services & Support | 515 (51.1%) | 492 (48.9%) |
| Education Instruction & Library | 324 (26.6%) | 895 (73.4%) |
| Arts, Media & Entertainment | 496 (48.0%) | 537 (52.0%) |
| Health Diagnosing & Treating | 573 (34.8%) | 1,072 (65.2%) |
| Health Technologists | 451 (32.9%) | 919 (67.1%) |
| Total (Category) | 9,601 (54.7%) | 7,965 (45.3%) |
| Total (Overall) | 15,106 (55.5%) | 12,108 (44.5%) |
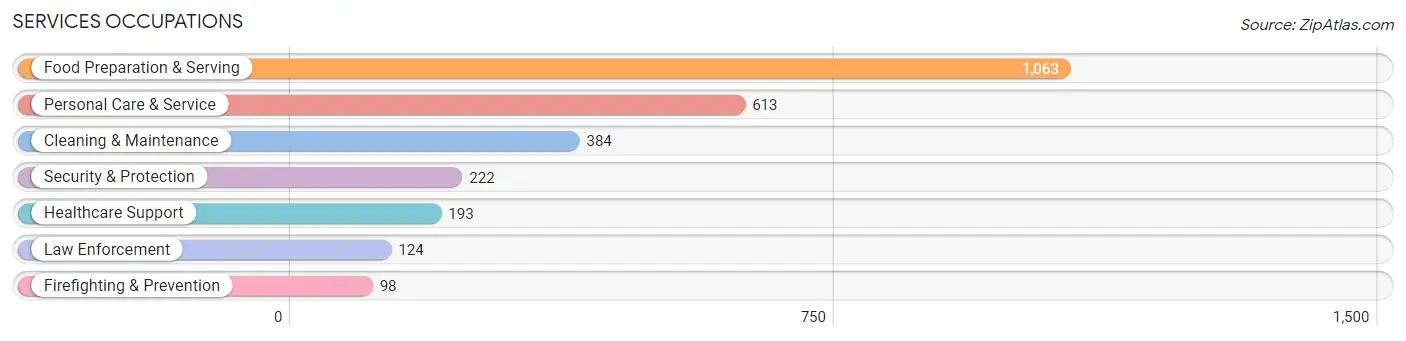
Services Occupations
The most common Services occupations in Dunwoody are Food Preparation & Serving (1,063 | 3.9%), Personal Care & Service (613 | 2.2%), Cleaning & Maintenance (384 | 1.4%), Security & Protection (222 | 0.8%), and Healthcare Support (193 | 0.7%).
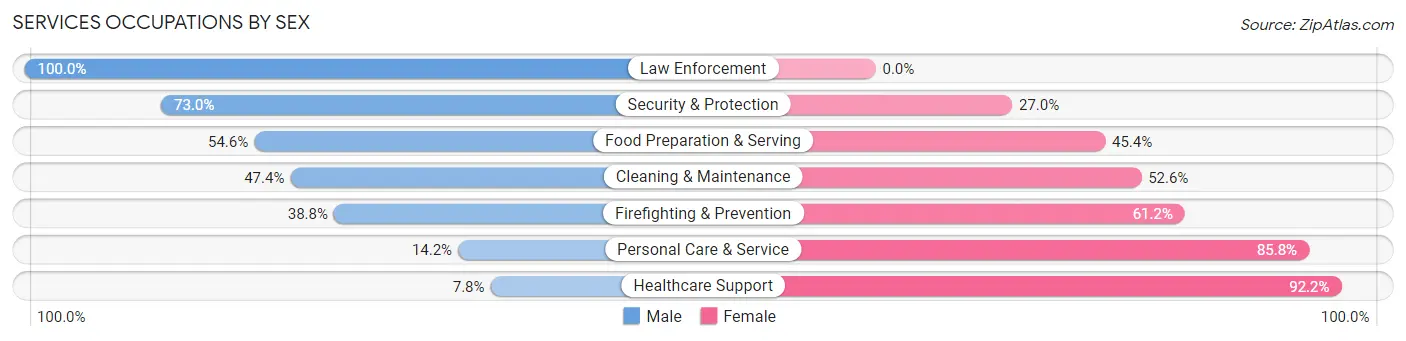
Services Occupations by Sex
Within the Services occupations in Dunwoody, the most male-oriented occupations are Law Enforcement (100.0%), Security & Protection (73.0%), and Food Preparation & Serving (54.6%), while the most female-oriented occupations are Healthcare Support (92.2%), Personal Care & Service (85.8%), and Firefighting & Prevention (61.2%).
| Occupation | Male | Female |
| Healthcare Support | 15 (7.8%) | 178 (92.2%) |
| Security & Protection | 162 (73.0%) | 60 (27.0%) |
| Firefighting & Prevention | 38 (38.8%) | 60 (61.2%) |
| Law Enforcement | 124 (100.0%) | 0 (0.0%) |
| Food Preparation & Serving | 580 (54.6%) | 483 (45.4%) |
| Cleaning & Maintenance | 182 (47.4%) | 202 (52.6%) |
| Personal Care & Service | 87 (14.2%) | 526 (85.8%) |
| Total (Category) | 1,026 (41.4%) | 1,449 (58.6%) |
| Total (Overall) | 15,106 (55.5%) | 12,108 (44.5%) |
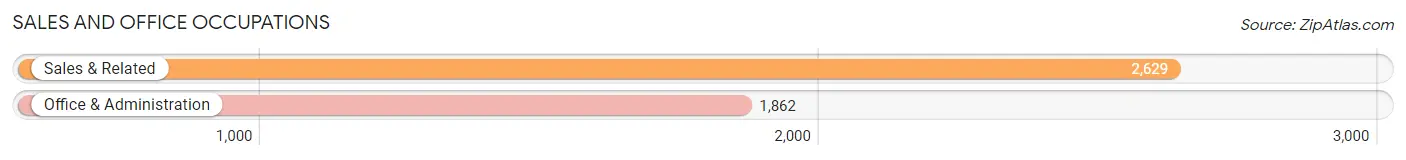
Sales and Office Occupations
The most common Sales and Office occupations in Dunwoody are Sales & Related (2,629 | 9.7%), and Office & Administration (1,862 | 6.8%).
Sales and Office Occupations by Sex
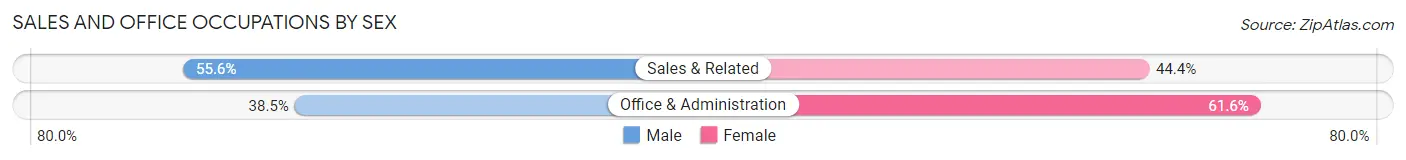
| Occupation | Male | Female |
| Sales & Related | 1,462 (55.6%) | 1,167 (44.4%) |
| Office & Administration | 716 (38.5%) | 1,146 (61.6%) |
| Total (Category) | 2,178 (48.5%) | 2,313 (51.5%) |
| Total (Overall) | 15,106 (55.5%) | 12,108 (44.5%) |
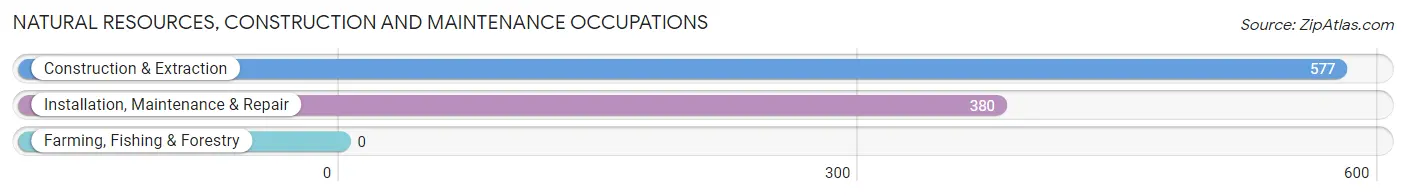
Natural Resources, Construction and Maintenance Occupations
The most common Natural Resources, Construction and Maintenance occupations in Dunwoody are Construction & Extraction (577 | 2.1%), and Installation, Maintenance & Repair (380 | 1.4%).
Natural Resources, Construction and Maintenance Occupations by Sex
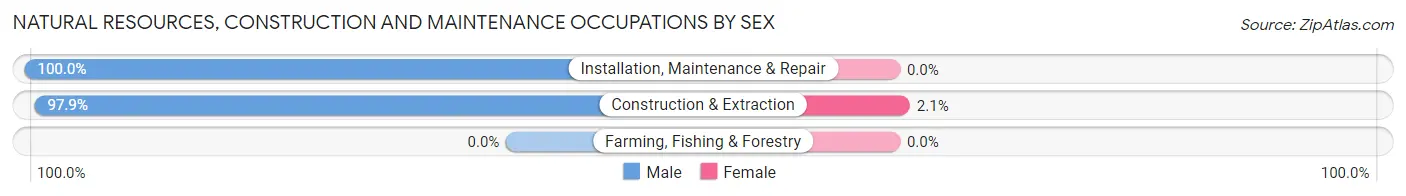
| Occupation | Male | Female |
| Farming, Fishing & Forestry | 0 (0.0%) | 0 (0.0%) |
| Construction & Extraction | 565 (97.9%) | 12 (2.1%) |
| Installation, Maintenance & Repair | 380 (100.0%) | 0 (0.0%) |
| Total (Category) | 945 (98.8%) | 12 (1.3%) |
| Total (Overall) | 15,106 (55.5%) | 12,108 (44.5%) |
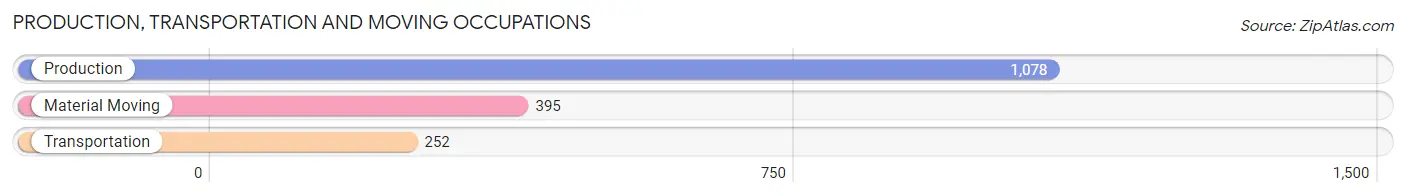
Production, Transportation and Moving Occupations
The most common Production, Transportation and Moving occupations in Dunwoody are Production (1,078 | 4.0%), Material Moving (395 | 1.5%), and Transportation (252 | 0.9%).
Production, Transportation and Moving Occupations by Sex
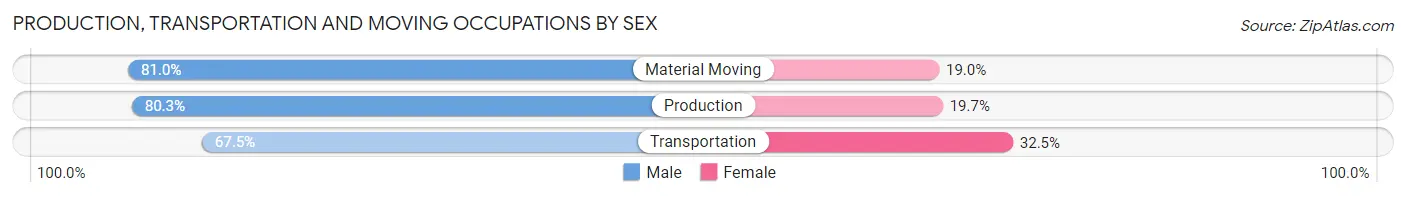
| Occupation | Male | Female |
| Production | 866 (80.3%) | 212 (19.7%) |
| Transportation | 170 (67.5%) | 82 (32.5%) |
| Material Moving | 320 (81.0%) | 75 (19.0%) |
| Total (Category) | 1,356 (78.6%) | 369 (21.4%) |
| Total (Overall) | 15,106 (55.5%) | 12,108 (44.5%) |
Employment Industries by Sex in Dunwoody
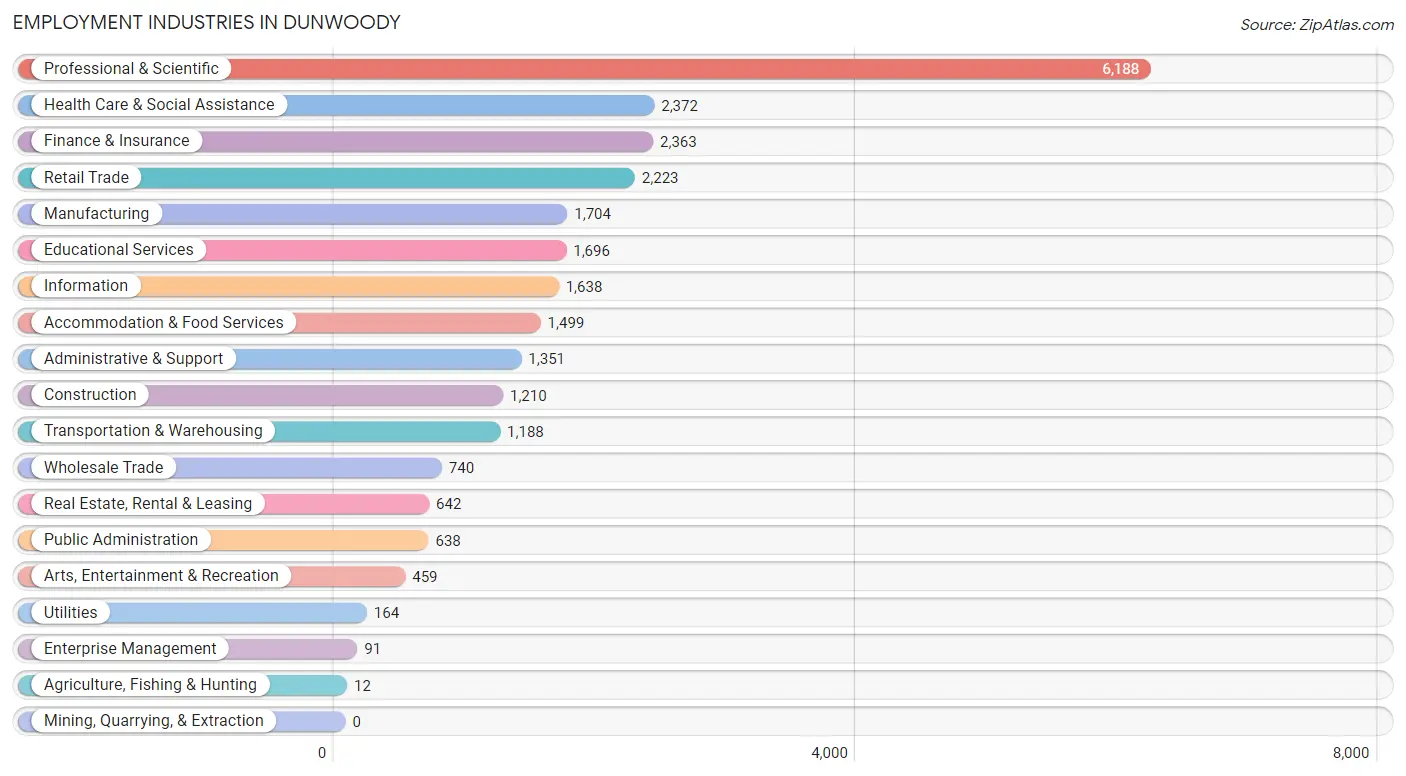
Employment Industries in Dunwoody
The major employment industries in Dunwoody include Professional & Scientific (6,188 | 22.7%), Health Care & Social Assistance (2,372 | 8.7%), Finance & Insurance (2,363 | 8.7%), Retail Trade (2,223 | 8.2%), and Manufacturing (1,704 | 6.3%).
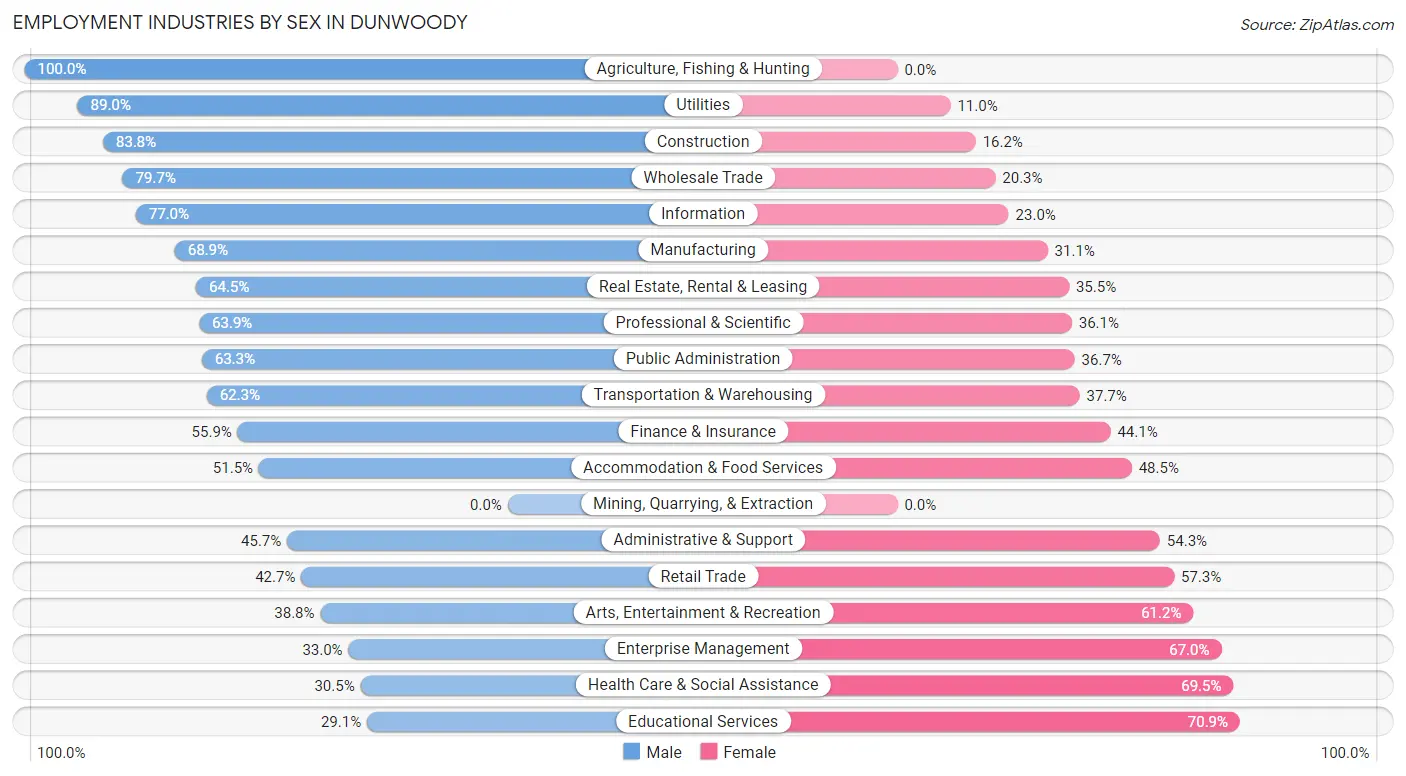
Employment Industries by Sex in Dunwoody
The Dunwoody industries that see more men than women are Agriculture, Fishing & Hunting (100.0%), Utilities (89.0%), and Construction (83.8%), whereas the industries that tend to have a higher number of women are Educational Services (70.9%), Health Care & Social Assistance (69.5%), and Enterprise Management (67.0%).
| Industry | Male | Female |
| Agriculture, Fishing & Hunting | 12 (100.0%) | 0 (0.0%) |
| Mining, Quarrying, & Extraction | 0 (0.0%) | 0 (0.0%) |
| Construction | 1,014 (83.8%) | 196 (16.2%) |
| Manufacturing | 1,174 (68.9%) | 530 (31.1%) |
| Wholesale Trade | 590 (79.7%) | 150 (20.3%) |
| Retail Trade | 950 (42.7%) | 1,273 (57.3%) |
| Transportation & Warehousing | 740 (62.3%) | 448 (37.7%) |
| Utilities | 146 (89.0%) | 18 (11.0%) |
| Information | 1,261 (77.0%) | 377 (23.0%) |
| Finance & Insurance | 1,321 (55.9%) | 1,042 (44.1%) |
| Real Estate, Rental & Leasing | 414 (64.5%) | 228 (35.5%) |
| Professional & Scientific | 3,955 (63.9%) | 2,233 (36.1%) |
| Enterprise Management | 30 (33.0%) | 61 (67.0%) |
| Administrative & Support | 617 (45.7%) | 734 (54.3%) |
| Educational Services | 494 (29.1%) | 1,202 (70.9%) |
| Health Care & Social Assistance | 723 (30.5%) | 1,649 (69.5%) |
| Arts, Entertainment & Recreation | 178 (38.8%) | 281 (61.2%) |
| Accommodation & Food Services | 772 (51.5%) | 727 (48.5%) |
| Public Administration | 404 (63.3%) | 234 (36.7%) |
| Total | 15,106 (55.5%) | 12,108 (44.5%) |
Education in Dunwoody
School Enrollment in Dunwoody
The most common levels of schooling among the 13,192 students in Dunwoody are elementary school (3,000 | 22.7%), middle school (2,930 | 22.2%), and high school (2,783 | 21.1%).
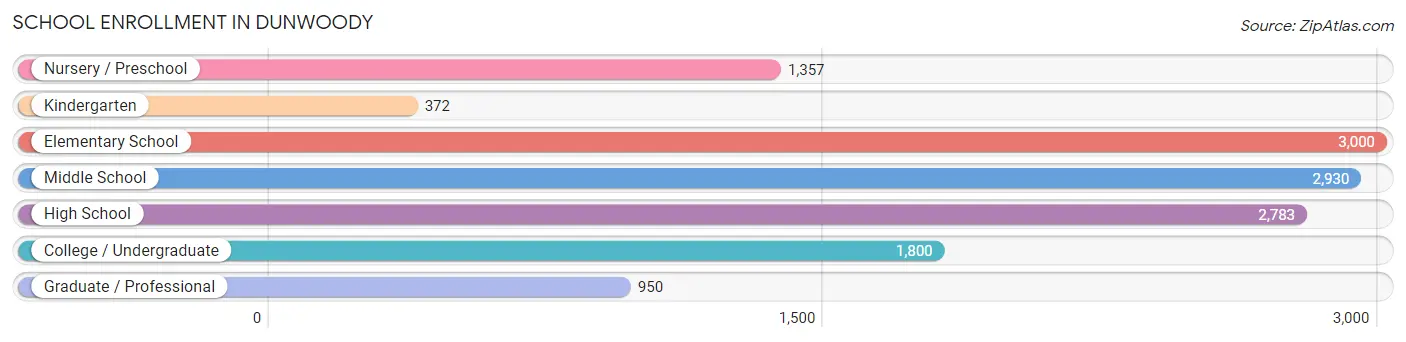
| School Level | # Students | % Students |
| Nursery / Preschool | 1,357 | 10.3% |
| Kindergarten | 372 | 2.8% |
| Elementary School | 3,000 | 22.7% |
| Middle School | 2,930 | 22.2% |
| High School | 2,783 | 21.1% |
| College / Undergraduate | 1,800 | 13.6% |
| Graduate / Professional | 950 | 7.2% |
| Total | 13,192 | 100.0% |
School Enrollment by Age by Funding Source in Dunwoody
Out of a total of 13,192 students who are enrolled in schools in Dunwoody, 4,393 (33.3%) attend a private institution, while the remaining 8,799 (66.7%) are enrolled in public schools. The age group of 3 to 4 year olds has the highest likelihood of being enrolled in private schools, with 645 (61.0% in the age bracket) enrolled. Conversely, the age group of 18 to 19 year olds has the lowest likelihood of being enrolled in a private school, with 678 (81.3% in the age bracket) attending a public institution.
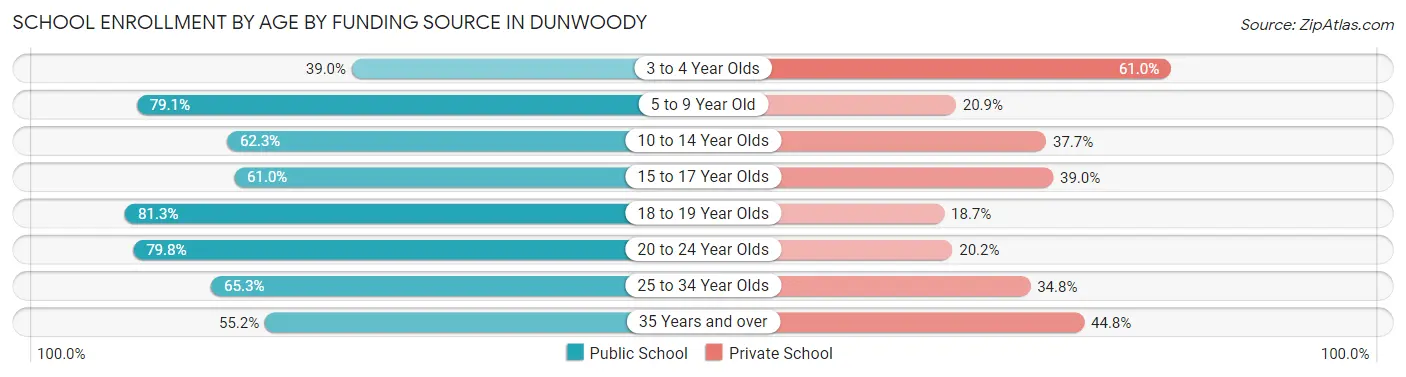
| Age Bracket | Public School | Private School |
| 3 to 4 Year Olds | 413 (39.0%) | 645 (61.0%) |
| 5 to 9 Year Old | 2,529 (79.1%) | 668 (20.9%) |
| 10 to 14 Year Olds | 2,168 (62.3%) | 1,312 (37.7%) |
| 15 to 17 Year Olds | 1,328 (61.0%) | 849 (39.0%) |
| 18 to 19 Year Olds | 678 (81.3%) | 156 (18.7%) |
| 20 to 24 Year Olds | 800 (79.8%) | 203 (20.2%) |
| 25 to 34 Year Olds | 522 (65.2%) | 278 (34.7%) |
| 35 Years and over | 355 (55.2%) | 288 (44.8%) |
| Total | 8,799 (66.7%) | 4,393 (33.3%) |
Educational Attainment by Field of Study in Dunwoody
Business (5,984 | 21.9%), engineering (3,550 | 13.0%), social sciences (2,716 | 10.0%), computers & mathematics (2,595 | 9.5%), and communications (2,097 | 7.7%) are the most common fields of study among 27,290 individuals in Dunwoody who have obtained a bachelor's degree or higher.
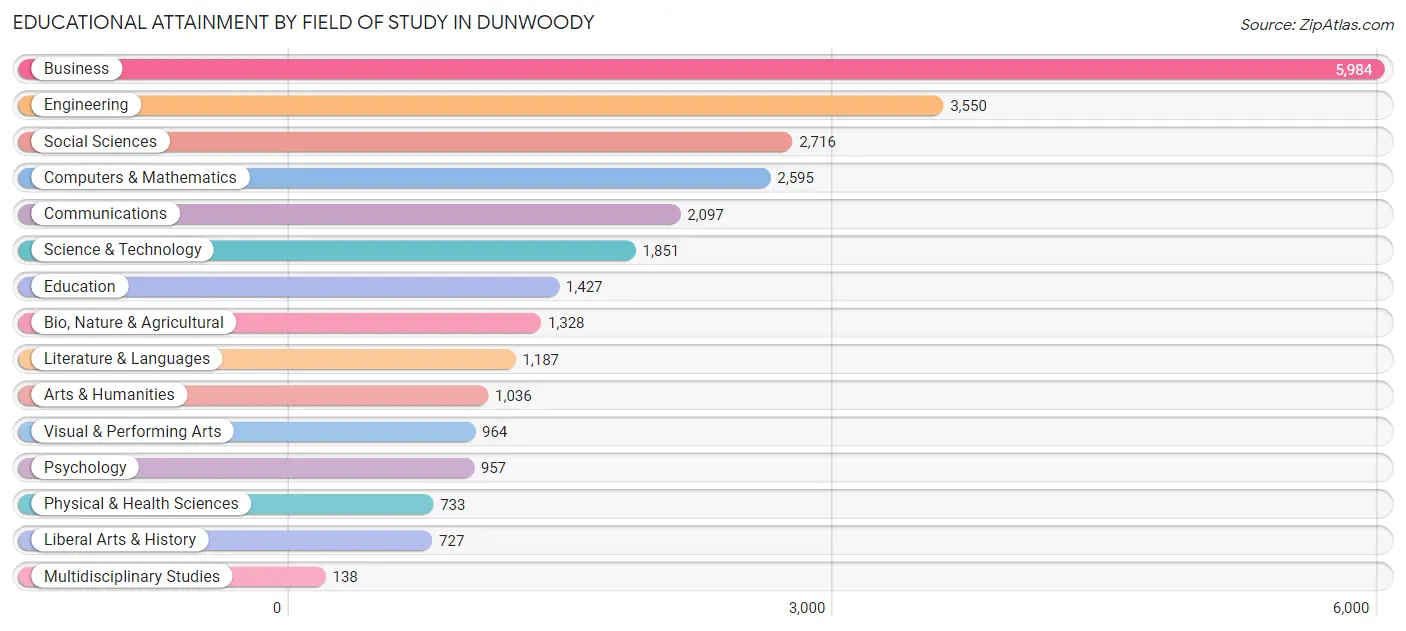
| Field of Study | # Graduates | % Graduates |
| Computers & Mathematics | 2,595 | 9.5% |
| Bio, Nature & Agricultural | 1,328 | 4.9% |
| Physical & Health Sciences | 733 | 2.7% |
| Psychology | 957 | 3.5% |
| Social Sciences | 2,716 | 10.0% |
| Engineering | 3,550 | 13.0% |
| Multidisciplinary Studies | 138 | 0.5% |
| Science & Technology | 1,851 | 6.8% |
| Business | 5,984 | 21.9% |
| Education | 1,427 | 5.2% |
| Literature & Languages | 1,187 | 4.3% |
| Liberal Arts & History | 727 | 2.7% |
| Visual & Performing Arts | 964 | 3.5% |
| Communications | 2,097 | 7.7% |
| Arts & Humanities | 1,036 | 3.8% |
| Total | 27,290 | 100.0% |
Transportation & Commute in Dunwoody
Vehicle Availability by Sex in Dunwoody
The most prevalent vehicle ownership categories in Dunwoody are males with 2 vehicles (6,714, accounting for 45.0%) and females with 2 vehicles (5,436, making up 56.0%).
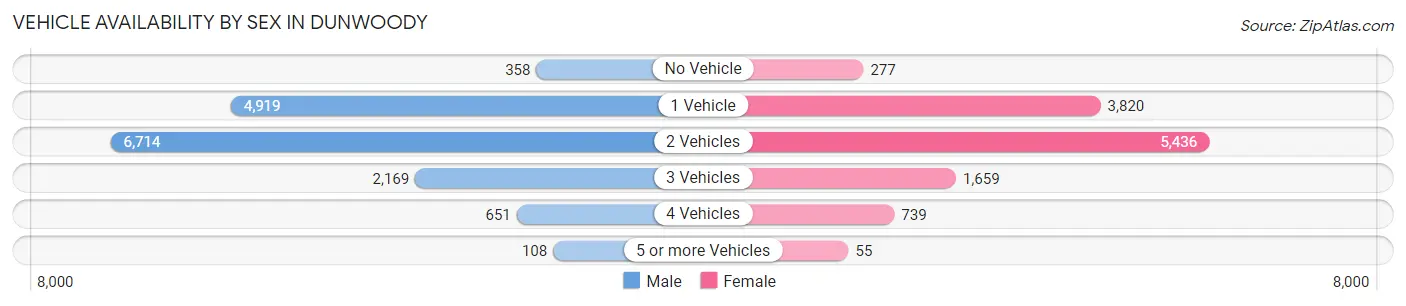
| Vehicles Available | Male | Female |
| No Vehicle | 358 (2.4%) | 277 (2.3%) |
| 1 Vehicle | 4,919 (33.0%) | 3,820 (31.9%) |
| 2 Vehicles | 6,714 (45.0%) | 5,436 (45.4%) |
| 3 Vehicles | 2,169 (14.5%) | 1,659 (13.8%) |
| 4 Vehicles | 651 (4.4%) | 739 (6.2%) |
| 5 or more Vehicles | 108 (0.7%) | 55 (0.5%) |
| Total | 14,919 (100.0%) | 11,986 (100.0%) |
Commute Time in Dunwoody
The most frequently occuring commute durations in Dunwoody are 20 to 24 minutes (3,625 commuters, 18.2%), 15 to 19 minutes (2,937 commuters, 14.7%), and 30 to 34 minutes (2,725 commuters, 13.7%).
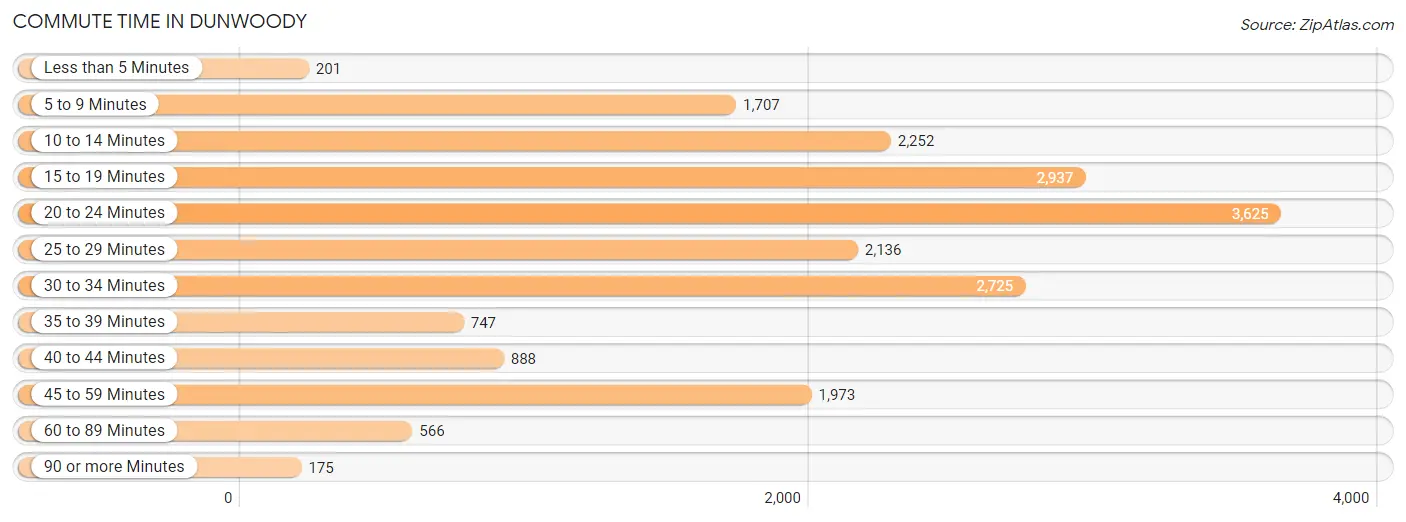
| Commute Time | # Commuters | % Commuters |
| Less than 5 Minutes | 201 | 1.0% |
| 5 to 9 Minutes | 1,707 | 8.6% |
| 10 to 14 Minutes | 2,252 | 11.3% |
| 15 to 19 Minutes | 2,937 | 14.7% |
| 20 to 24 Minutes | 3,625 | 18.2% |
| 25 to 29 Minutes | 2,136 | 10.7% |
| 30 to 34 Minutes | 2,725 | 13.7% |
| 35 to 39 Minutes | 747 | 3.7% |
| 40 to 44 Minutes | 888 | 4.5% |
| 45 to 59 Minutes | 1,973 | 9.9% |
| 60 to 89 Minutes | 566 | 2.8% |
| 90 or more Minutes | 175 | 0.9% |
Commute Time by Sex in Dunwoody
The most common commute times in Dunwoody are 20 to 24 minutes (2,002 commuters, 18.0%) for males and 20 to 24 minutes (1,623 commuters, 18.4%) for females.
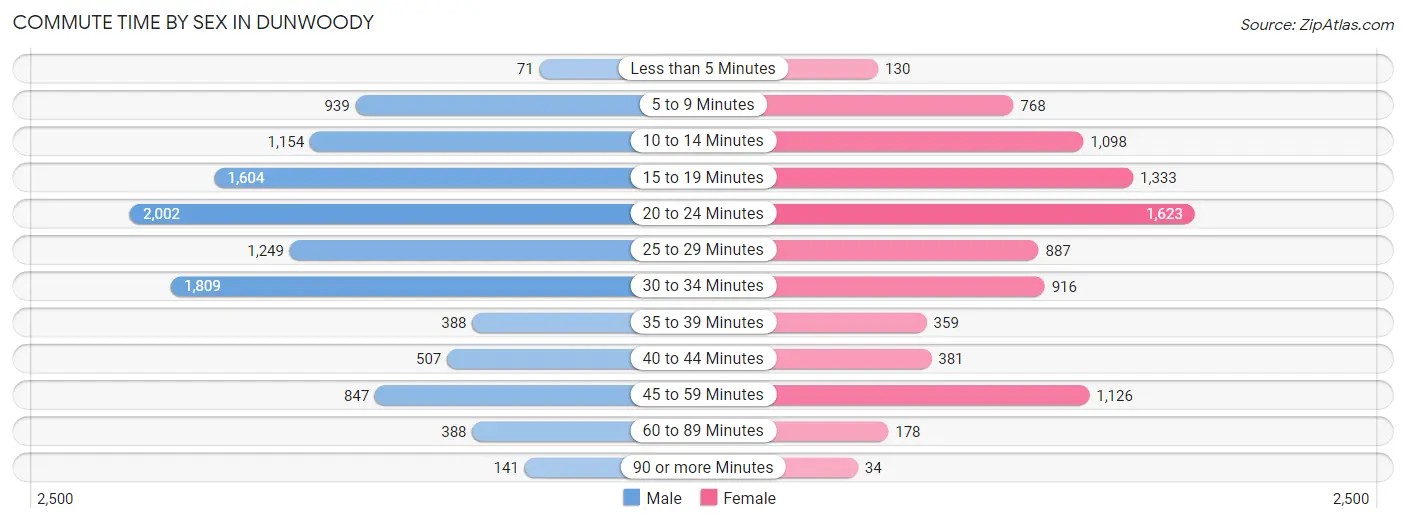
| Commute Time | Male | Female |
| Less than 5 Minutes | 71 (0.6%) | 130 (1.5%) |
| 5 to 9 Minutes | 939 (8.5%) | 768 (8.7%) |
| 10 to 14 Minutes | 1,154 (10.4%) | 1,098 (12.4%) |
| 15 to 19 Minutes | 1,604 (14.4%) | 1,333 (15.1%) |
| 20 to 24 Minutes | 2,002 (18.0%) | 1,623 (18.4%) |
| 25 to 29 Minutes | 1,249 (11.3%) | 887 (10.0%) |
| 30 to 34 Minutes | 1,809 (16.3%) | 916 (10.4%) |
| 35 to 39 Minutes | 388 (3.5%) | 359 (4.1%) |
| 40 to 44 Minutes | 507 (4.6%) | 381 (4.3%) |
| 45 to 59 Minutes | 847 (7.6%) | 1,126 (12.8%) |
| 60 to 89 Minutes | 388 (3.5%) | 178 (2.0%) |
| 90 or more Minutes | 141 (1.3%) | 34 (0.4%) |
Time of Departure to Work by Sex in Dunwoody
The most frequent times of departure to work in Dunwoody are 7:30 AM to 7:59 AM (2,238, 20.2%) for males and 7:00 AM to 7:29 AM (1,591, 18.0%) for females.
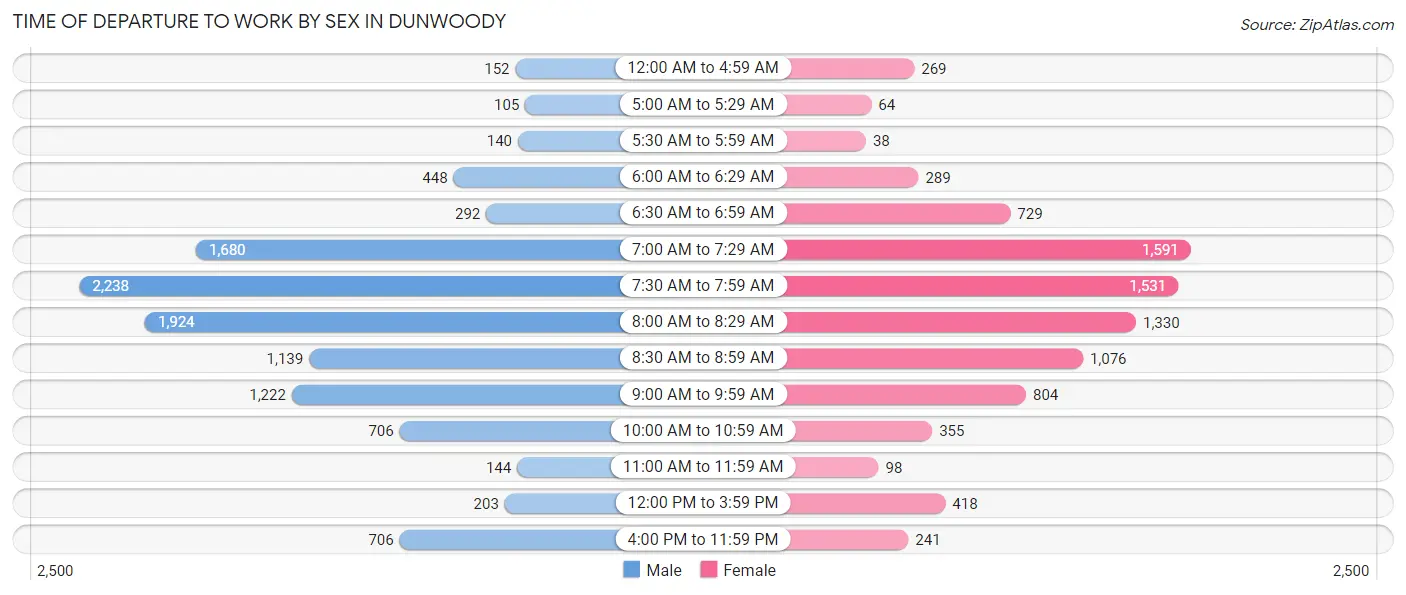
| Time of Departure | Male | Female |
| 12:00 AM to 4:59 AM | 152 (1.4%) | 269 (3.0%) |
| 5:00 AM to 5:29 AM | 105 (0.9%) | 64 (0.7%) |
| 5:30 AM to 5:59 AM | 140 (1.3%) | 38 (0.4%) |
| 6:00 AM to 6:29 AM | 448 (4.0%) | 289 (3.3%) |
| 6:30 AM to 6:59 AM | 292 (2.6%) | 729 (8.3%) |
| 7:00 AM to 7:29 AM | 1,680 (15.1%) | 1,591 (18.0%) |
| 7:30 AM to 7:59 AM | 2,238 (20.2%) | 1,531 (17.3%) |
| 8:00 AM to 8:29 AM | 1,924 (17.3%) | 1,330 (15.1%) |
| 8:30 AM to 8:59 AM | 1,139 (10.3%) | 1,076 (12.2%) |
| 9:00 AM to 9:59 AM | 1,222 (11.0%) | 804 (9.1%) |
| 10:00 AM to 10:59 AM | 706 (6.4%) | 355 (4.0%) |
| 11:00 AM to 11:59 AM | 144 (1.3%) | 98 (1.1%) |
| 12:00 PM to 3:59 PM | 203 (1.8%) | 418 (4.7%) |
| 4:00 PM to 11:59 PM | 706 (6.4%) | 241 (2.7%) |
| Total | 11,099 (100.0%) | 8,833 (100.0%) |
Housing Occupancy in Dunwoody
Occupancy by Ownership in Dunwoody
Of the total 21,496 dwellings in Dunwoody, owner-occupied units account for 11,973 (55.7%), while renter-occupied units make up 9,523 (44.3%).
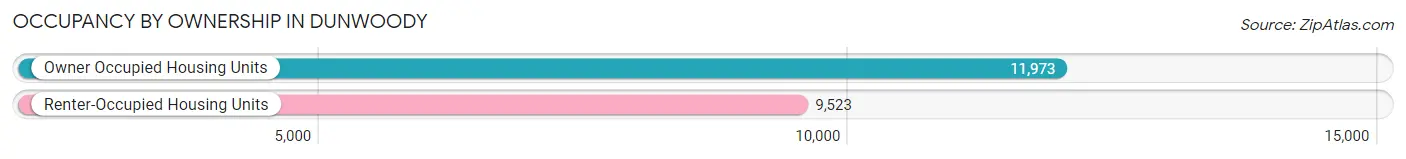
| Occupancy | # Housing Units | % Housing Units |
| Owner Occupied Housing Units | 11,973 | 55.7% |
| Renter-Occupied Housing Units | 9,523 | 44.3% |
| Total Occupied Housing Units | 21,496 | 100.0% |
Occupancy by Household Size in Dunwoody
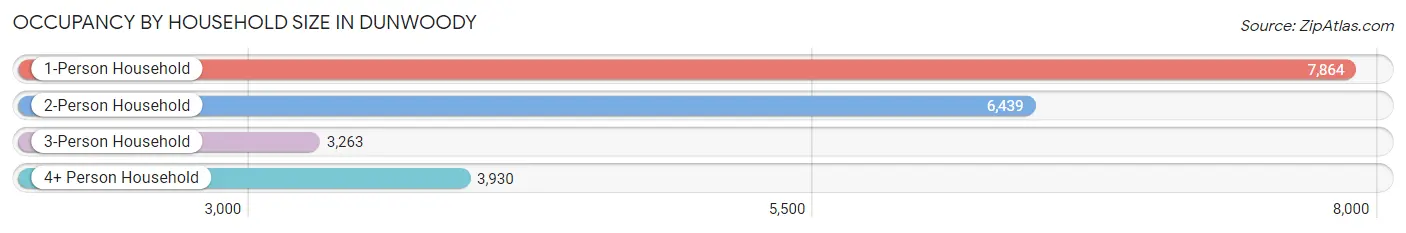
| Household Size | # Housing Units | % Housing Units |
| 1-Person Household | 7,864 | 36.6% |
| 2-Person Household | 6,439 | 29.9% |
| 3-Person Household | 3,263 | 15.2% |
| 4+ Person Household | 3,930 | 18.3% |
| Total Housing Units | 21,496 | 100.0% |
Occupancy by Ownership by Household Size in Dunwoody
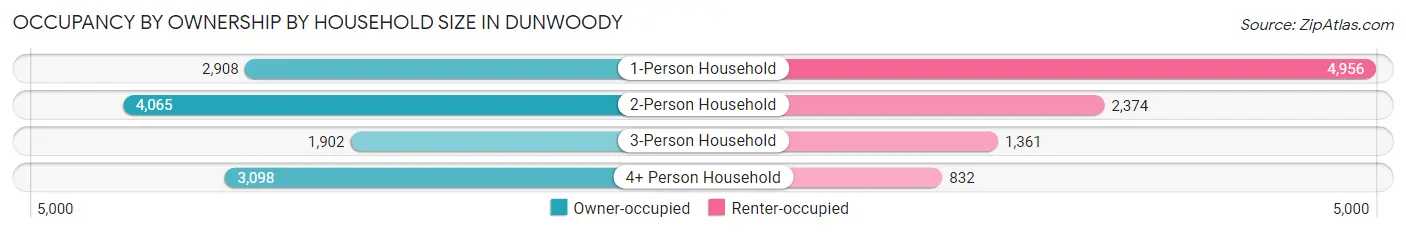
| Household Size | Owner-occupied | Renter-occupied |
| 1-Person Household | 2,908 (37.0%) | 4,956 (63.0%) |
| 2-Person Household | 4,065 (63.1%) | 2,374 (36.9%) |
| 3-Person Household | 1,902 (58.3%) | 1,361 (41.7%) |
| 4+ Person Household | 3,098 (78.8%) | 832 (21.2%) |
| Total Housing Units | 11,973 (55.7%) | 9,523 (44.3%) |
Occupancy by Educational Attainment in Dunwoody
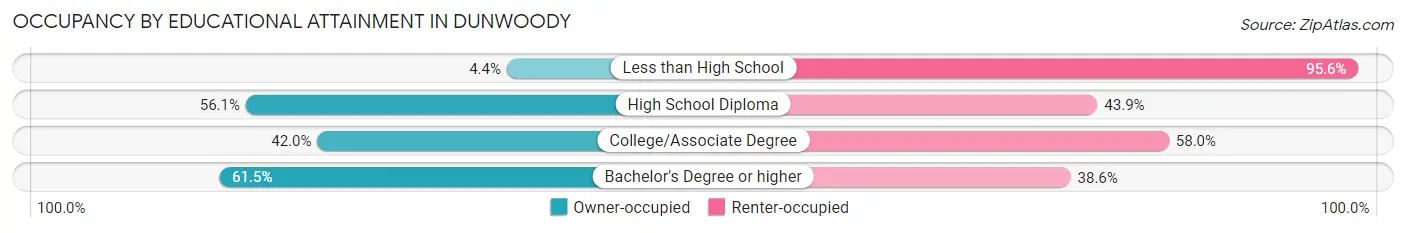
| Household Size | Owner-occupied | Renter-occupied |
| Less than High School | 33 (4.4%) | 717 (95.6%) |
| High School Diploma | 800 (56.1%) | 625 (43.9%) |
| College/Associate Degree | 1,578 (42.0%) | 2,182 (58.0%) |
| Bachelor's Degree or higher | 9,562 (61.5%) | 5,999 (38.6%) |
Occupancy by Age of Householder in Dunwoody
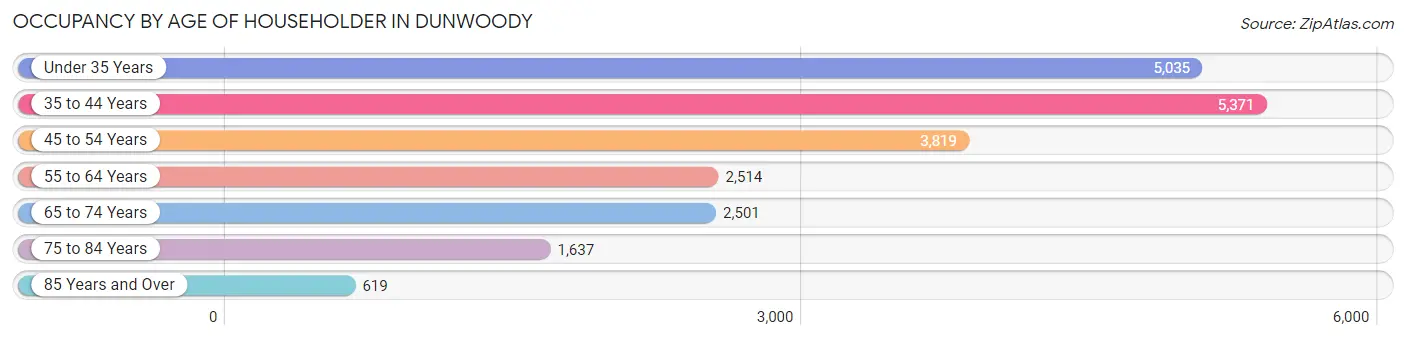
| Age Bracket | # Households | % Households |
| Under 35 Years | 5,035 | 23.4% |
| 35 to 44 Years | 5,371 | 25.0% |
| 45 to 54 Years | 3,819 | 17.8% |
| 55 to 64 Years | 2,514 | 11.7% |
| 65 to 74 Years | 2,501 | 11.6% |
| 75 to 84 Years | 1,637 | 7.6% |
| 85 Years and Over | 619 | 2.9% |
| Total | 21,496 | 100.0% |
Housing Finances in Dunwoody
Median Income by Occupancy in Dunwoody
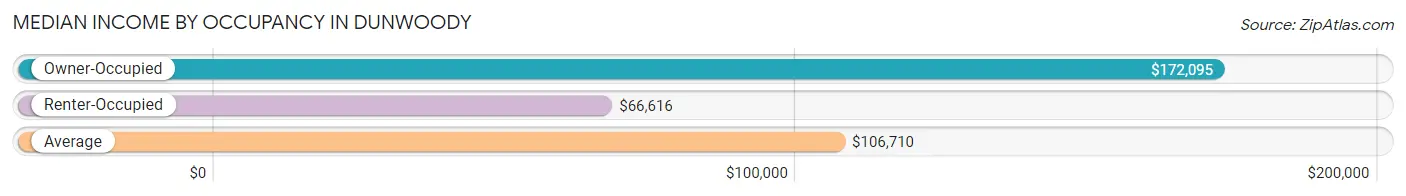
| Occupancy Type | # Households | Median Income |
| Owner-Occupied | 11,973 (55.7%) | $172,095 |
| Renter-Occupied | 9,523 (44.3%) | $66,616 |
| Average | 21,496 (100.0%) | $106,710 |
Occupancy by Householder Income Bracket in Dunwoody
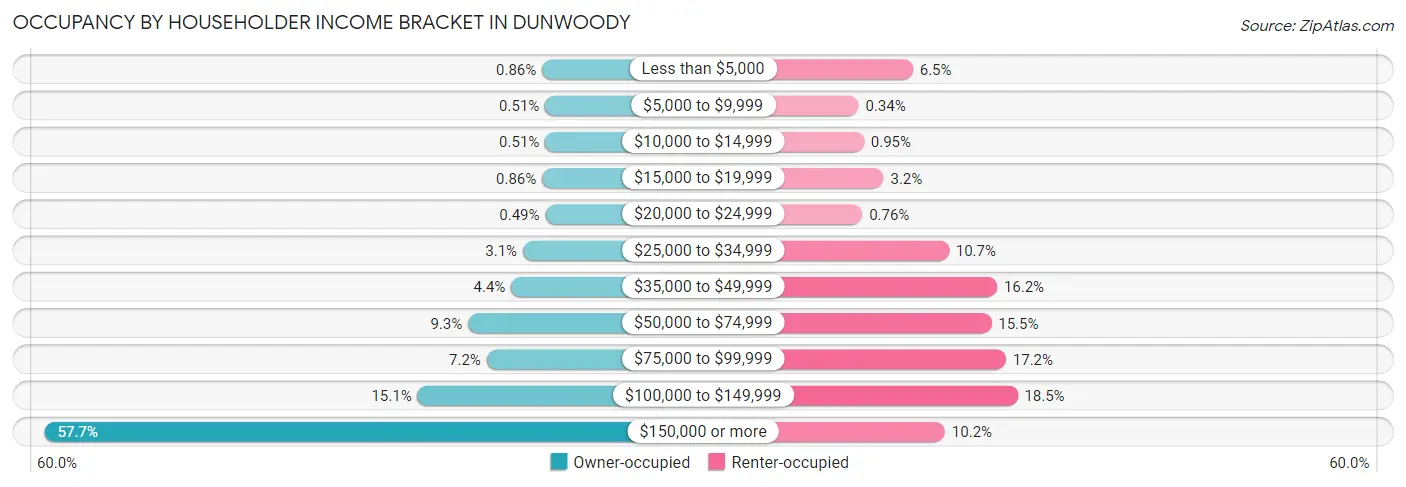
| Income Bracket | Owner-occupied | Renter-occupied |
| Less than $5,000 | 103 (0.9%) | 623 (6.5%) |
| $5,000 to $9,999 | 61 (0.5%) | 32 (0.3%) |
| $10,000 to $14,999 | 61 (0.5%) | 90 (0.9%) |
| $15,000 to $19,999 | 103 (0.9%) | 305 (3.2%) |
| $20,000 to $24,999 | 59 (0.5%) | 72 (0.8%) |
| $25,000 to $34,999 | 365 (3.0%) | 1,015 (10.7%) |
| $35,000 to $49,999 | 526 (4.4%) | 1,539 (16.2%) |
| $50,000 to $74,999 | 1,116 (9.3%) | 1,477 (15.5%) |
| $75,000 to $99,999 | 861 (7.2%) | 1,636 (17.2%) |
| $100,000 to $149,999 | 1,808 (15.1%) | 1,762 (18.5%) |
| $150,000 or more | 6,910 (57.7%) | 972 (10.2%) |
| Total | 11,973 (100.0%) | 9,523 (100.0%) |
Monthly Housing Cost Tiers in Dunwoody
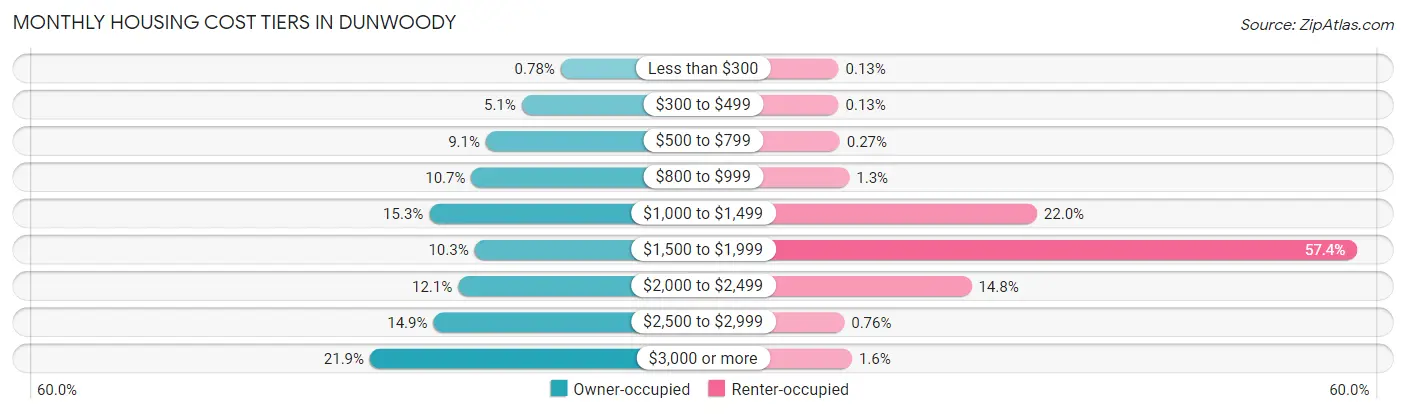
| Monthly Cost | Owner-occupied | Renter-occupied |
| Less than $300 | 93 (0.8%) | 12 (0.1%) |
| $300 to $499 | 610 (5.1%) | 12 (0.1%) |
| $500 to $799 | 1,083 (9.0%) | 26 (0.3%) |
| $800 to $999 | 1,275 (10.6%) | 126 (1.3%) |
| $1,000 to $1,499 | 1,833 (15.3%) | 2,099 (22.0%) |
| $1,500 to $1,999 | 1,233 (10.3%) | 5,466 (57.4%) |
| $2,000 to $2,499 | 1,451 (12.1%) | 1,410 (14.8%) |
| $2,500 to $2,999 | 1,778 (14.8%) | 72 (0.8%) |
| $3,000 or more | 2,617 (21.9%) | 153 (1.6%) |
| Total | 11,973 (100.0%) | 9,523 (100.0%) |
Physical Housing Characteristics in Dunwoody
Housing Structures in Dunwoody
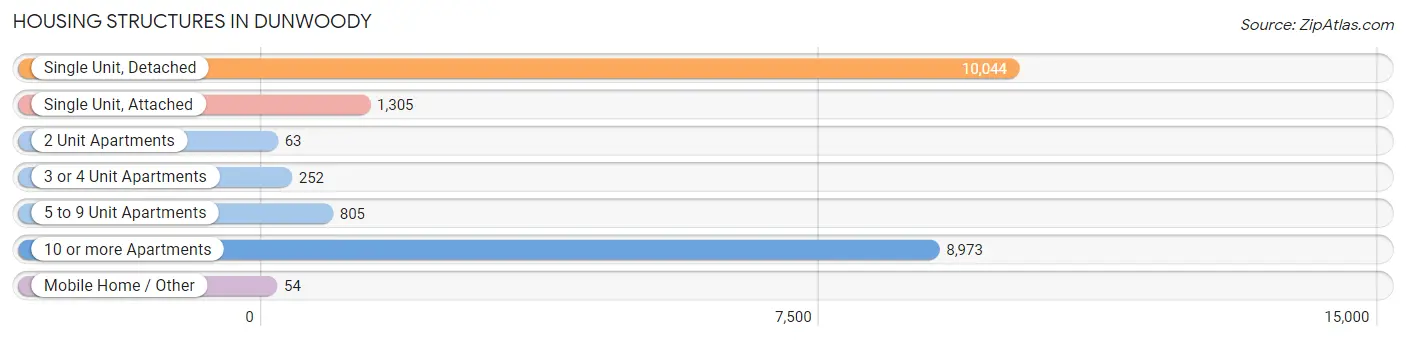
| Structure Type | # Housing Units | % Housing Units |
| Single Unit, Detached | 10,044 | 46.7% |
| Single Unit, Attached | 1,305 | 6.1% |
| 2 Unit Apartments | 63 | 0.3% |
| 3 or 4 Unit Apartments | 252 | 1.2% |
| 5 to 9 Unit Apartments | 805 | 3.7% |
| 10 or more Apartments | 8,973 | 41.7% |
| Mobile Home / Other | 54 | 0.3% |
| Total | 21,496 | 100.0% |
Housing Structures by Occupancy in Dunwoody
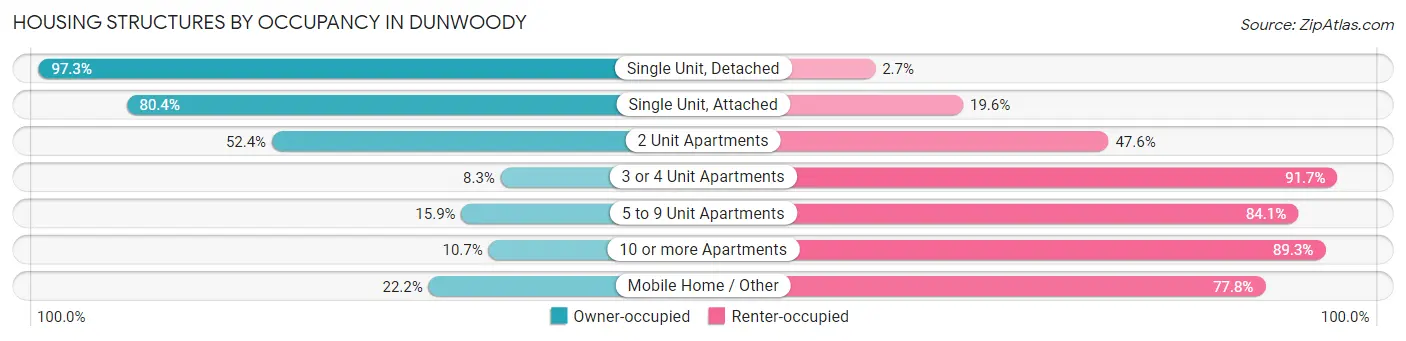
| Structure Type | Owner-occupied | Renter-occupied |
| Single Unit, Detached | 9,773 (97.3%) | 271 (2.7%) |
| Single Unit, Attached | 1,049 (80.4%) | 256 (19.6%) |
| 2 Unit Apartments | 33 (52.4%) | 30 (47.6%) |
| 3 or 4 Unit Apartments | 21 (8.3%) | 231 (91.7%) |
| 5 to 9 Unit Apartments | 128 (15.9%) | 677 (84.1%) |
| 10 or more Apartments | 957 (10.7%) | 8,016 (89.3%) |
| Mobile Home / Other | 12 (22.2%) | 42 (77.8%) |
| Total | 11,973 (55.7%) | 9,523 (44.3%) |
Housing Structures by Number of Rooms in Dunwoody
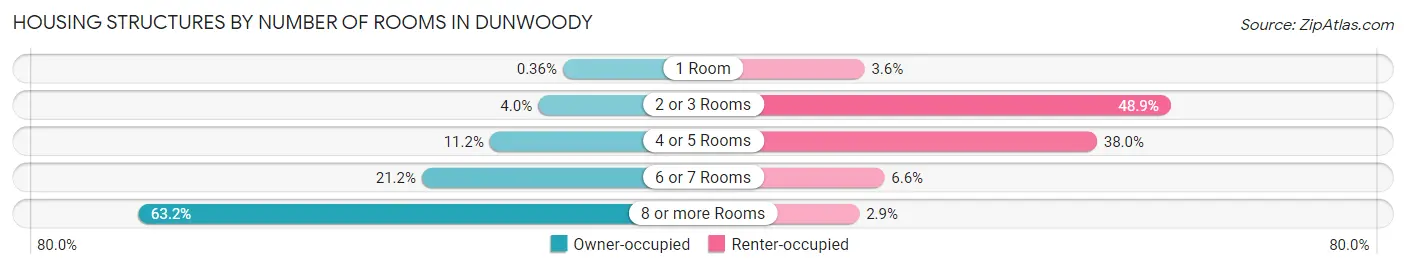
| Number of Rooms | Owner-occupied | Renter-occupied |
| 1 Room | 43 (0.4%) | 346 (3.6%) |
| 2 or 3 Rooms | 482 (4.0%) | 4,660 (48.9%) |
| 4 or 5 Rooms | 1,337 (11.2%) | 3,620 (38.0%) |
| 6 or 7 Rooms | 2,541 (21.2%) | 626 (6.6%) |
| 8 or more Rooms | 7,570 (63.2%) | 271 (2.9%) |
| Total | 11,973 (100.0%) | 9,523 (100.0%) |
Housing Structure by Heating Type in Dunwoody
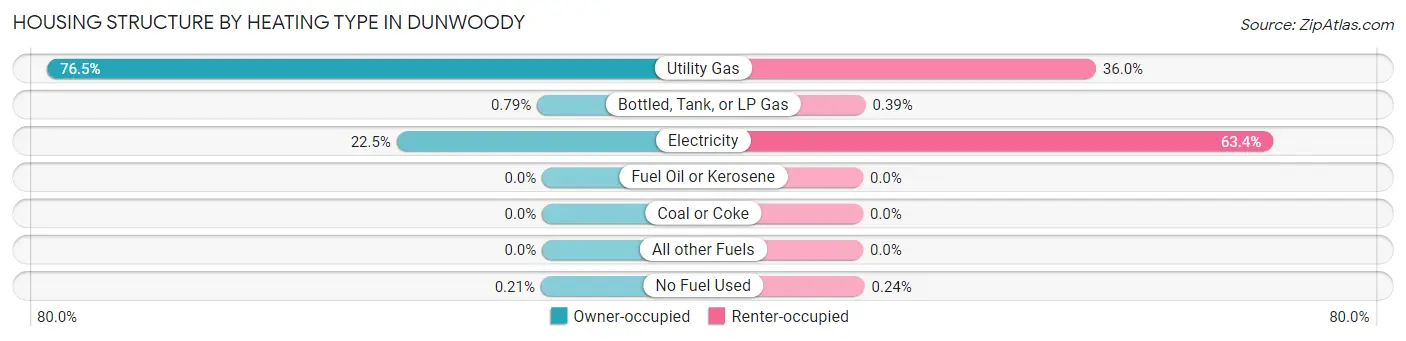
| Heating Type | Owner-occupied | Renter-occupied |
| Utility Gas | 9,162 (76.5%) | 3,428 (36.0%) |
| Bottled, Tank, or LP Gas | 95 (0.8%) | 37 (0.4%) |
| Electricity | 2,691 (22.5%) | 6,035 (63.4%) |
| Fuel Oil or Kerosene | 0 (0.0%) | 0 (0.0%) |
| Coal or Coke | 0 (0.0%) | 0 (0.0%) |
| All other Fuels | 0 (0.0%) | 0 (0.0%) |
| No Fuel Used | 25 (0.2%) | 23 (0.2%) |
| Total | 11,973 (100.0%) | 9,523 (100.0%) |
Household Vehicle Usage in Dunwoody
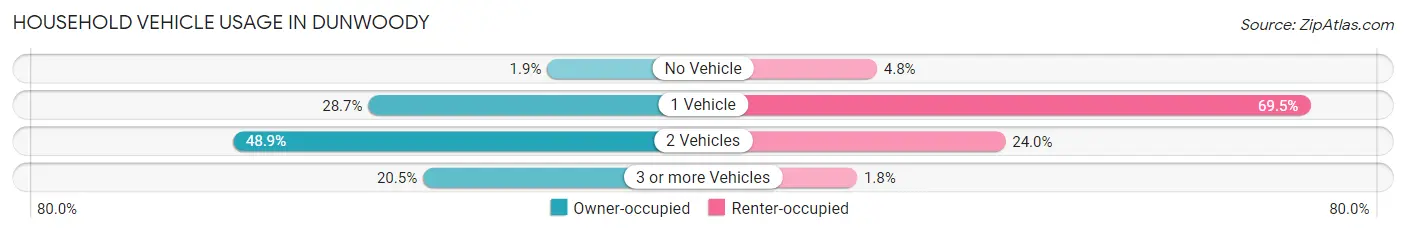
| Vehicles per Household | Owner-occupied | Renter-occupied |
| No Vehicle | 232 (1.9%) | 454 (4.8%) |
| 1 Vehicle | 3,433 (28.7%) | 6,617 (69.5%) |
| 2 Vehicles | 5,854 (48.9%) | 2,281 (23.9%) |
| 3 or more Vehicles | 2,454 (20.5%) | 171 (1.8%) |
| Total | 11,973 (100.0%) | 9,523 (100.0%) |
Real Estate & Mortgages in Dunwoody
Real Estate and Mortgage Overview in Dunwoody
| Characteristic | Without Mortgage | With Mortgage |
| Housing Units | 4,041 | 7,932 |
| Median Property Value | $486,700 | $572,700 |
| Median Household Income | $115,638 | $5,269 |
| Monthly Housing Costs | $852 | $2,617 |
| Real Estate Taxes | $4,850 | $134 |
Property Value by Mortgage Status in Dunwoody
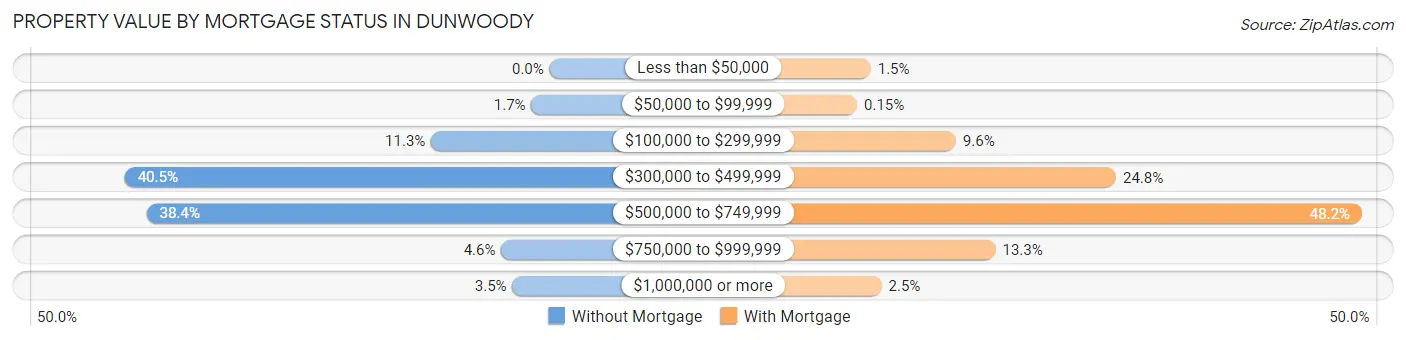
| Property Value | Without Mortgage | With Mortgage |
| Less than $50,000 | 0 (0.0%) | 115 (1.5%) |
| $50,000 to $99,999 | 70 (1.7%) | 12 (0.2%) |
| $100,000 to $299,999 | 456 (11.3%) | 758 (9.6%) |
| $300,000 to $499,999 | 1,635 (40.5%) | 1,968 (24.8%) |
| $500,000 to $749,999 | 1,551 (38.4%) | 3,825 (48.2%) |
| $750,000 to $999,999 | 186 (4.6%) | 1,057 (13.3%) |
| $1,000,000 or more | 143 (3.5%) | 197 (2.5%) |
| Total | 4,041 (100.0%) | 7,932 (100.0%) |
Household Income by Mortgage Status in Dunwoody
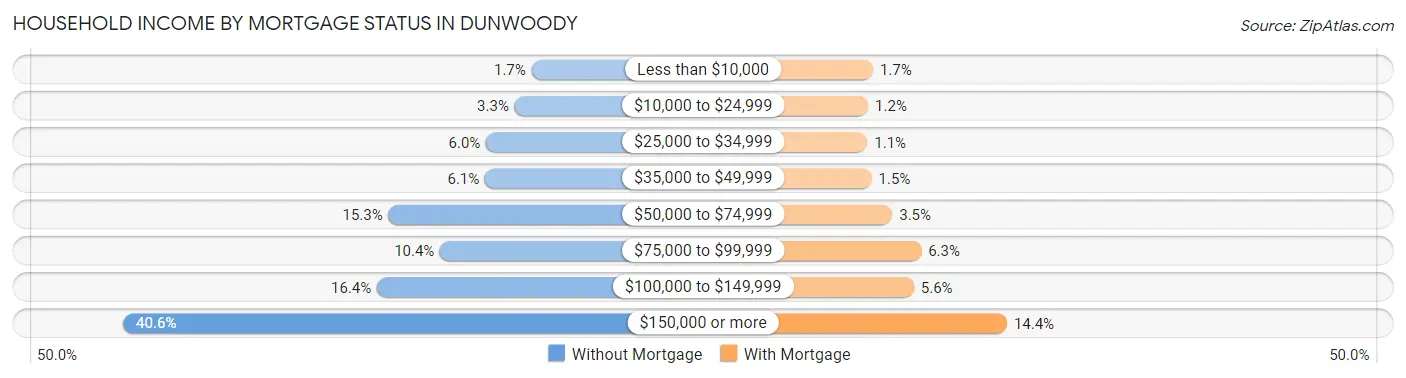
| Household Income | Without Mortgage | With Mortgage |
| Less than $10,000 | 69 (1.7%) | 132 (1.7%) |
| $10,000 to $24,999 | 134 (3.3%) | 95 (1.2%) |
| $25,000 to $34,999 | 244 (6.0%) | 89 (1.1%) |
| $35,000 to $49,999 | 248 (6.1%) | 121 (1.5%) |
| $50,000 to $74,999 | 620 (15.3%) | 278 (3.5%) |
| $75,000 to $99,999 | 421 (10.4%) | 496 (6.2%) |
| $100,000 to $149,999 | 664 (16.4%) | 440 (5.6%) |
| $150,000 or more | 1,641 (40.6%) | 1,144 (14.4%) |
| Total | 4,041 (100.0%) | 7,932 (100.0%) |
Property Value to Household Income Ratio in Dunwoody
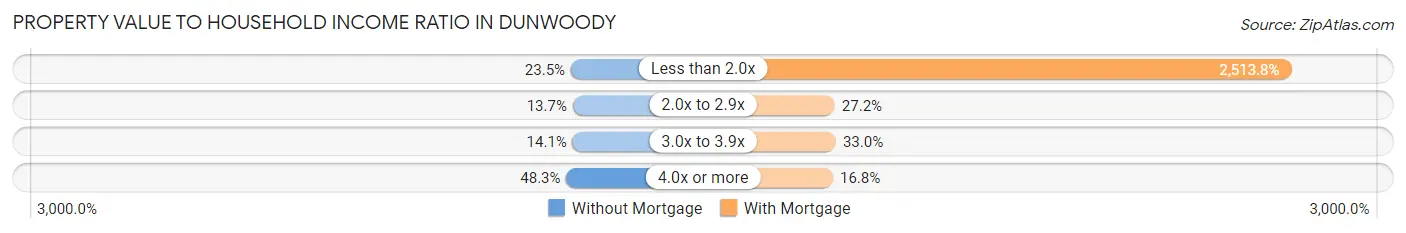
| Value-to-Income Ratio | Without Mortgage | With Mortgage |
| Less than 2.0x | 950 (23.5%) | 199,394 (2,513.8%) |
| 2.0x to 2.9x | 552 (13.7%) | 2,161 (27.2%) |
| 3.0x to 3.9x | 571 (14.1%) | 2,620 (33.0%) |
| 4.0x or more | 1,952 (48.3%) | 1,335 (16.8%) |
| Total | 4,041 (100.0%) | 7,932 (100.0%) |
Real Estate Taxes by Mortgage Status in Dunwoody
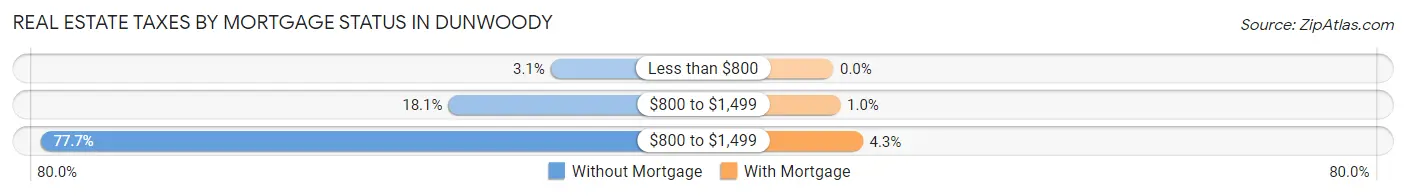
| Property Taxes | Without Mortgage | With Mortgage |
| Less than $800 | 127 (3.1%) | 0 (0.0%) |
| $800 to $1,499 | 731 (18.1%) | 82 (1.0%) |
| $800 to $1,499 | 3,139 (77.7%) | 342 (4.3%) |
| Total | 4,041 (100.0%) | 7,932 (100.0%) |
Health & Disability in Dunwoody
Health Insurance Coverage by Age in Dunwoody
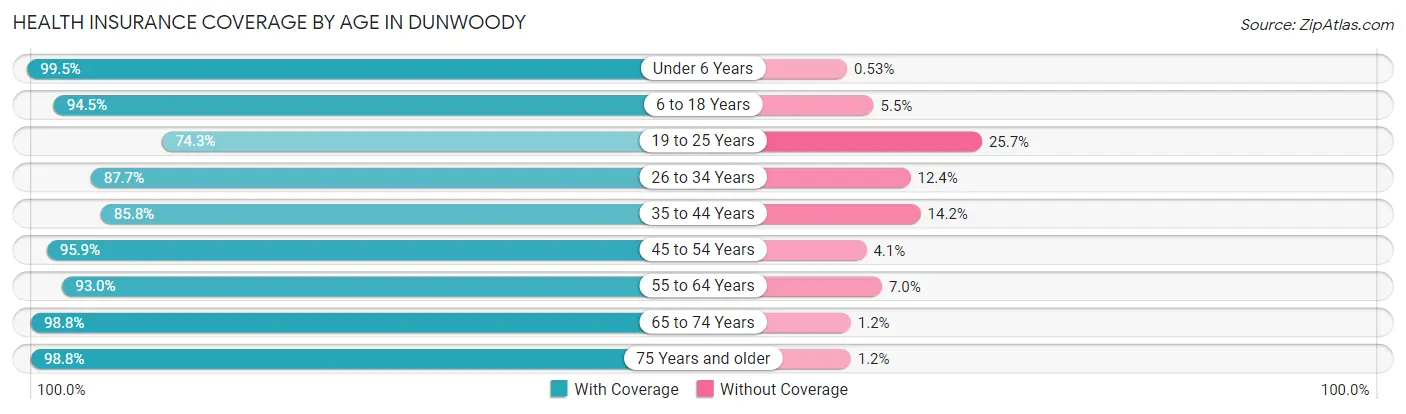
| Age Bracket | With Coverage | Without Coverage |
| Under 6 Years | 4,131 (99.5%) | 22 (0.5%) |
| 6 to 18 Years | 8,717 (94.5%) | 503 (5.5%) |
| 19 to 25 Years | 2,334 (74.3%) | 806 (25.7%) |
| 26 to 34 Years | 6,713 (87.6%) | 946 (12.3%) |
| 35 to 44 Years | 7,135 (85.8%) | 1,185 (14.2%) |
| 45 to 54 Years | 6,188 (95.9%) | 267 (4.1%) |
| 55 to 64 Years | 4,534 (93.0%) | 343 (7.0%) |
| 65 to 74 Years | 3,810 (98.8%) | 47 (1.2%) |
| 75 Years and older | 3,595 (98.8%) | 44 (1.2%) |
| Total | 47,157 (91.9%) | 4,163 (8.1%) |
Health Insurance Coverage by Citizenship Status in Dunwoody
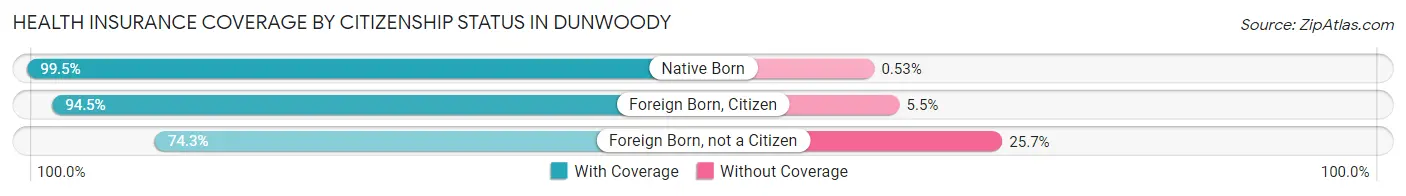
| Citizenship Status | With Coverage | Without Coverage |
| Native Born | 4,131 (99.5%) | 22 (0.5%) |
| Foreign Born, Citizen | 8,717 (94.5%) | 503 (5.5%) |
| Foreign Born, not a Citizen | 2,334 (74.3%) | 806 (25.7%) |
Health Insurance Coverage by Household Income in Dunwoody
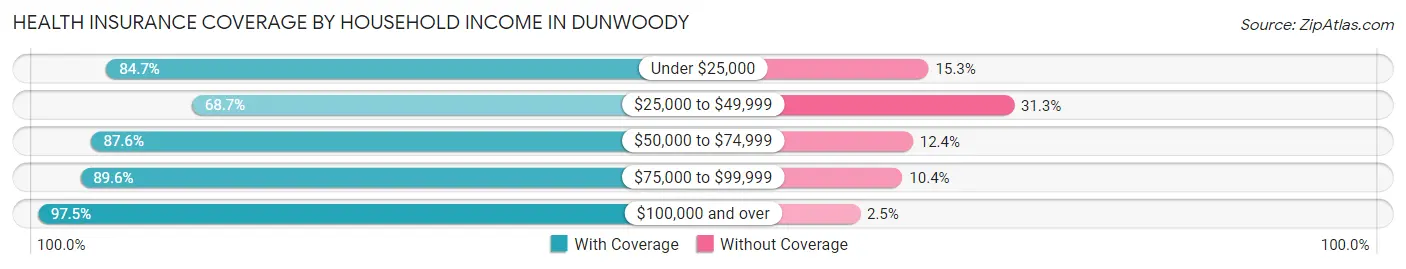
| Household Income | With Coverage | Without Coverage |
| Under $25,000 | 1,756 (84.7%) | 318 (15.3%) |
| $25,000 to $49,999 | 4,110 (68.7%) | 1,876 (31.3%) |
| $50,000 to $74,999 | 4,191 (87.6%) | 591 (12.4%) |
| $75,000 to $99,999 | 4,765 (89.6%) | 554 (10.4%) |
| $100,000 and over | 32,318 (97.5%) | 822 (2.5%) |
Public vs Private Health Insurance Coverage by Age in Dunwoody
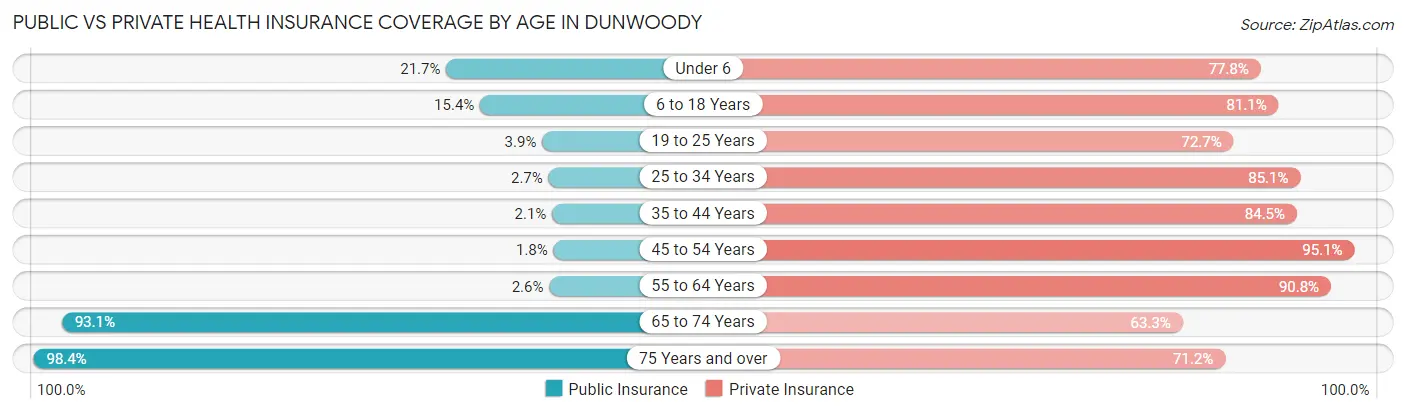
| Age Bracket | Public Insurance | Private Insurance |
| Under 6 | 902 (21.7%) | 3,229 (77.7%) |
| 6 to 18 Years | 1,424 (15.4%) | 7,475 (81.1%) |
| 19 to 25 Years | 123 (3.9%) | 2,283 (72.7%) |
| 25 to 34 Years | 210 (2.7%) | 6,518 (85.1%) |
| 35 to 44 Years | 173 (2.1%) | 7,027 (84.5%) |
| 45 to 54 Years | 117 (1.8%) | 6,141 (95.1%) |
| 55 to 64 Years | 127 (2.6%) | 4,428 (90.8%) |
| 65 to 74 Years | 3,591 (93.1%) | 2,440 (63.3%) |
| 75 Years and over | 3,579 (98.4%) | 2,589 (71.2%) |
| Total | 10,246 (20.0%) | 42,130 (82.1%) |
Disability Status by Sex by Age in Dunwoody
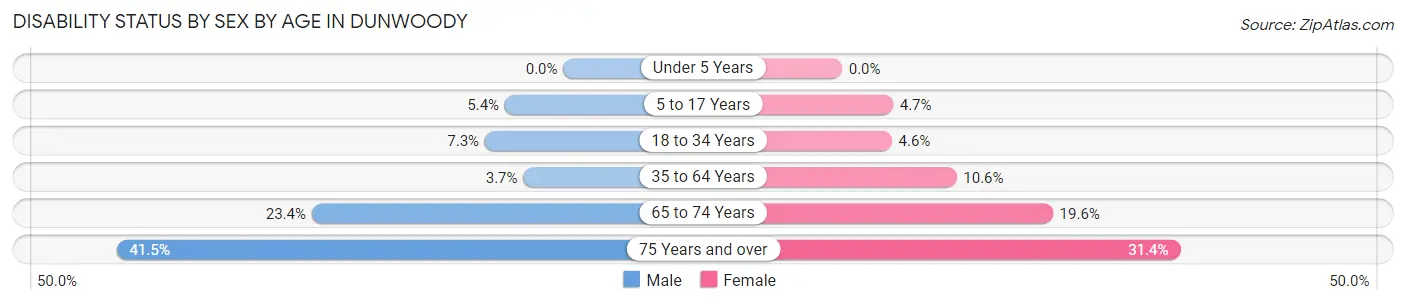
| Age Bracket | Male | Female |
| Under 5 Years | 0 (0.0%) | 0 (0.0%) |
| 5 to 17 Years | 273 (5.4%) | 194 (4.7%) |
| 18 to 34 Years | 407 (7.3%) | 270 (4.6%) |
| 35 to 64 Years | 360 (3.7%) | 1,057 (10.6%) |
| 65 to 74 Years | 390 (23.4%) | 428 (19.6%) |
| 75 Years and over | 639 (41.5%) | 659 (31.4%) |
Disability Class by Sex by Age in Dunwoody
Disability Class: Hearing Difficulty

| Age Bracket | Male | Female |
| Under 5 Years | 0 (0.0%) | 0 (0.0%) |
| 5 to 17 Years | 97 (1.9%) | 0 (0.0%) |
| 18 to 34 Years | 8 (0.1%) | 129 (2.2%) |
| 35 to 64 Years | 48 (0.5%) | 253 (2.5%) |
| 65 to 74 Years | 218 (13.1%) | 117 (5.3%) |
| 75 Years and over | 297 (19.3%) | 395 (18.8%) |
Disability Class: Vision Difficulty
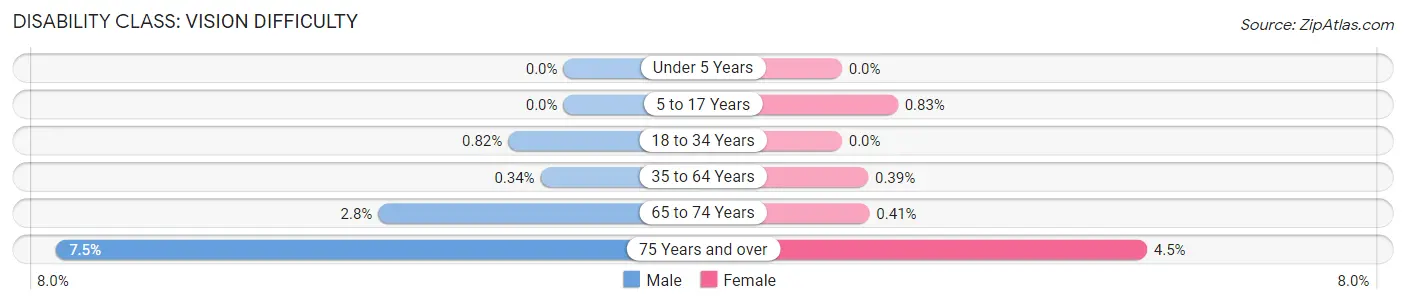
| Age Bracket | Male | Female |
| Under 5 Years | 0 (0.0%) | 0 (0.0%) |
| 5 to 17 Years | 0 (0.0%) | 34 (0.8%) |
| 18 to 34 Years | 46 (0.8%) | 0 (0.0%) |
| 35 to 64 Years | 33 (0.3%) | 39 (0.4%) |
| 65 to 74 Years | 46 (2.8%) | 9 (0.4%) |
| 75 Years and over | 116 (7.5%) | 95 (4.5%) |
Disability Class: Cognitive Difficulty
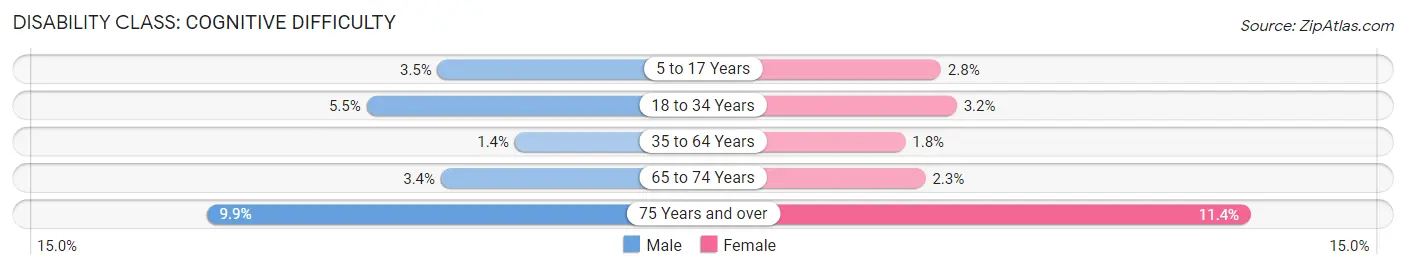
| Age Bracket | Male | Female |
| 5 to 17 Years | 176 (3.5%) | 113 (2.8%) |
| 18 to 34 Years | 306 (5.5%) | 187 (3.2%) |
| 35 to 64 Years | 131 (1.3%) | 176 (1.8%) |
| 65 to 74 Years | 57 (3.4%) | 51 (2.3%) |
| 75 Years and over | 153 (9.9%) | 239 (11.4%) |
Disability Class: Ambulatory Difficulty
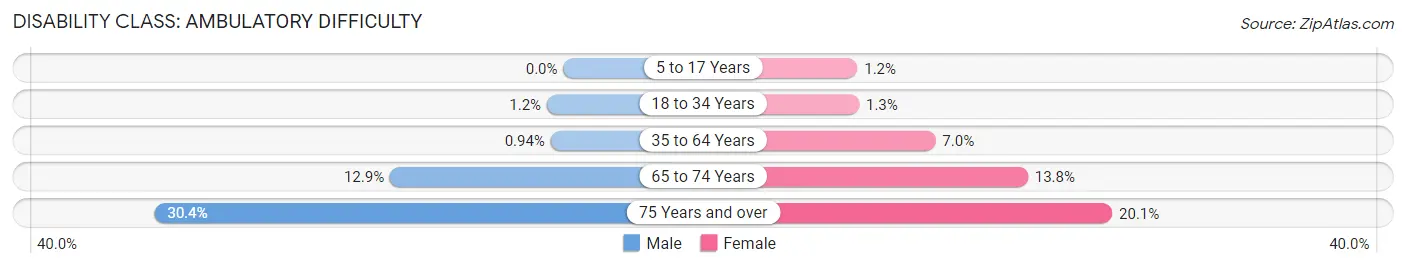
| Age Bracket | Male | Female |
| 5 to 17 Years | 0 (0.0%) | 47 (1.1%) |
| 18 to 34 Years | 68 (1.2%) | 75 (1.3%) |
| 35 to 64 Years | 91 (0.9%) | 691 (7.0%) |
| 65 to 74 Years | 215 (12.9%) | 302 (13.8%) |
| 75 Years and over | 468 (30.4%) | 421 (20.1%) |
Disability Class: Self-Care Difficulty
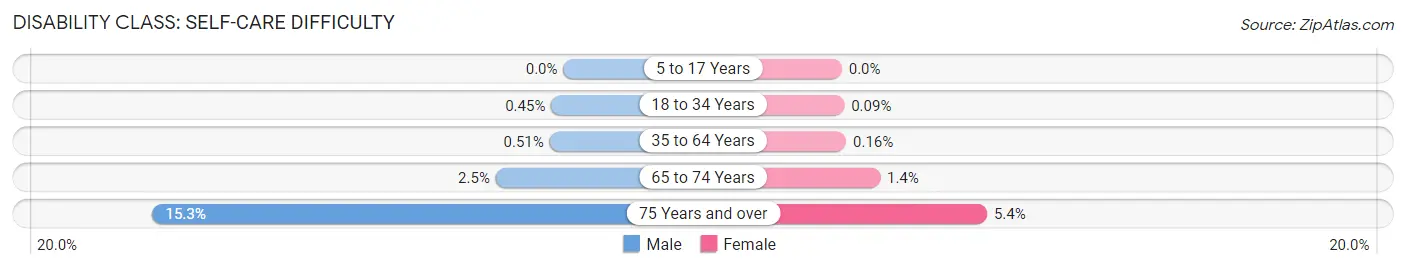
| Age Bracket | Male | Female |
| 5 to 17 Years | 0 (0.0%) | 0 (0.0%) |
| 18 to 34 Years | 25 (0.4%) | 5 (0.1%) |
| 35 to 64 Years | 50 (0.5%) | 16 (0.2%) |
| 65 to 74 Years | 42 (2.5%) | 31 (1.4%) |
| 75 Years and over | 235 (15.2%) | 113 (5.4%) |
Technology Access in Dunwoody
Computing Device Access in Dunwoody
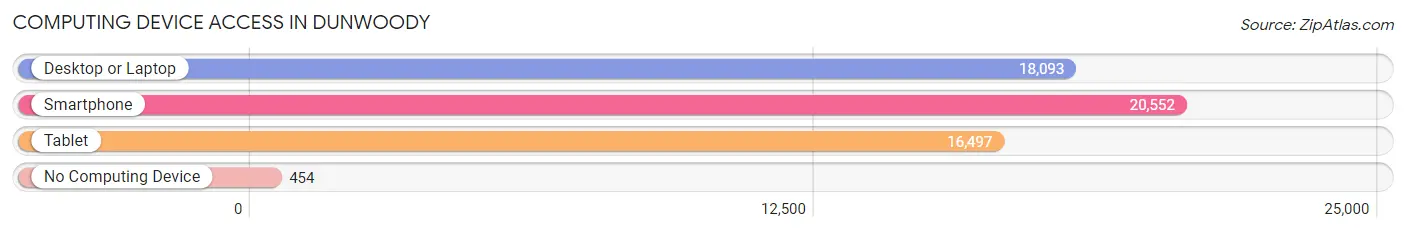
| Device Type | # Households | % Households |
| Desktop or Laptop | 18,093 | 84.2% |
| Smartphone | 20,552 | 95.6% |
| Tablet | 16,497 | 76.7% |
| No Computing Device | 454 | 2.1% |
| Total | 21,496 | 100.0% |
Internet Access in Dunwoody
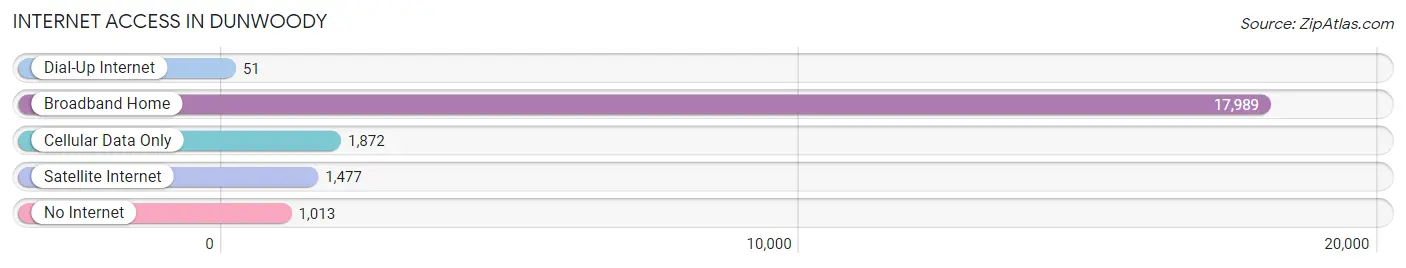
| Internet Type | # Households | % Households |
| Dial-Up Internet | 51 | 0.2% |
| Broadband Home | 17,989 | 83.7% |
| Cellular Data Only | 1,872 | 8.7% |
| Satellite Internet | 1,477 | 6.9% |
| No Internet | 1,013 | 4.7% |
| Total | 21,496 | 100.0% |
Dunwoody Summary
Dunwoody, Georgia is a city located in the northern suburbs of Atlanta, Georgia. It is located in DeKalb County and is part of the Atlanta metropolitan area. The city was incorporated in 2008 and is the largest city in DeKalb County. As of the 2010 census, the population of Dunwoody was 46,267.
History
The area that is now Dunwoody was originally inhabited by the Creek Indians. The area was first settled by European Americans in the early 19th century. The area was originally known as Dunwoody Station and was a stop on the Atlanta and Charlotte Air Line Railway. The area was named after Major Charles Dunwody, a Confederate soldier who was killed in the Civil War.
In the 1950s, the area began to experience rapid growth as the city of Atlanta expanded. The area was annexed by the city of Atlanta in the 1950s and was later incorporated as a city in 2008.
Geography
Dunwoody is located in northern DeKalb County, Georgia. It is located in the Atlanta metropolitan area and is bordered by the cities of Sandy Springs, Brookhaven, and Doraville. The city covers an area of 13.2 square miles and has a population density of 3,521 people per square mile.
The city is located in the Piedmont region of Georgia and is situated on the Chattahoochee River. The city has a humid subtropical climate with hot, humid summers and mild winters.
Economy
The economy of Dunwoody is largely based on the service industry. The city is home to several corporate headquarters, including the headquarters of the Home Depot, UPS, and the Georgia-Pacific Corporation. The city is also home to several shopping centers, including Perimeter Mall and Dunwoody Village.
The city is also home to several educational institutions, including Georgia State University, Oglethorpe University, and Emory University.
Demographics
As of the 2010 census, the population of Dunwoody was 46,267. The racial makeup of the city was 75.3% White, 11.3% African American, 0.3% Native American, 8.2% Asian, and 4.9% from other races. The median household income was $90,917 and the median family income was $103,917.
The city is home to a large Jewish population, with approximately 25% of the population identifying as Jewish. The city is also home to a large Asian population, with approximately 8% of the population identifying as Asian.
Conclusion
Dunwoody, Georgia is a city located in the northern suburbs of Atlanta, Georgia. It is located in DeKalb County and is part of the Atlanta metropolitan area. The city was incorporated in 2008 and is the largest city in DeKalb County. The economy of Dunwoody is largely based on the service industry and the city is home to several corporate headquarters, shopping centers, and educational institutions. As of the 2010 census, the population of Dunwoody was 46,267 and the racial makeup of the city was 75.3% White, 11.3% African American, 0.3% Native American, 8.2% Asian, and 4.9% from other races. The city is home to a large Jewish and Asian population.
Common Questions
What is Per Capita Income in Dunwoody?
Per Capita income in Dunwoody is $66,443.
What is the Median Family Income in Dunwoody?
Median Family Income in Dunwoody is $161,111.
What is the Median Household income in Dunwoody?
Median Household Income in Dunwoody is $106,710.
What is Income or Wage Gap in Dunwoody?
Income or Wage Gap in Dunwoody is 37.6%.
Women in Dunwoody earn 62.4 cents for every dollar earned by a man.
What is Family Income Deficit in Dunwoody?
Family Income Deficit in Dunwoody is $9,225.
Families that are below poverty line in Dunwoody earn $9,225 less on average than the poverty threshold level.
What is Inequality or Gini Index in Dunwoody?
Inequality or Gini Index in Dunwoody is 0.48.
What is the Total Population of Dunwoody?
Total Population of Dunwoody is 51,458.
What is the Total Male Population of Dunwoody?
Total Male Population of Dunwoody is 25,284.
What is the Total Female Population of Dunwoody?
Total Female Population of Dunwoody is 26,174.
What is the Ratio of Males per 100 Females in Dunwoody?
There are 96.60 Males per 100 Females in Dunwoody.
What is the Ratio of Females per 100 Males in Dunwoody?
There are 103.52 Females per 100 Males in Dunwoody.
What is the Median Population Age in Dunwoody?
Median Population Age in Dunwoody is 36.9 Years.
What is the Average Family Size in Dunwoody
Average Family Size in Dunwoody is 3.2 People.
What is the Average Household Size in Dunwoody
Average Household Size in Dunwoody is 2.4 People.
How Large is the Labor Force in Dunwoody?
There are 27,770 People in the Labor Forcein in Dunwoody.
What is the Percentage of People in the Labor Force in Dunwoody?
69.4% of People are in the Labor Force in Dunwoody.
What is the Unemployment Rate in Dunwoody?
Unemployment Rate in Dunwoody is 1.8%.