Cordele, GA Map & Demographics
Cordele Map
Cordele Overview
$22,633
PER CAPITA INCOME
$58,389
AVG FAMILY INCOME
$33,166
AVG HOUSEHOLD INCOME
29.8%
WAGE / INCOME GAP [ % ]
70.2¢/ $1
WAGE / INCOME GAP [ $ ]
$14,202
FAMILY INCOME DEFICIT
0.49
INEQUALITY / GINI INDEX
10,210
TOTAL POPULATION
4,559
MALE POPULATION
5,651
FEMALE POPULATION
80.68
MALES / 100 FEMALES
123.95
FEMALES / 100 MALES
36.7
MEDIAN AGE
3.1
AVG FAMILY SIZE
2.5
AVG HOUSEHOLD SIZE
4,712
LABOR FORCE [ PEOPLE ]
61.2%
PERCENT IN LABOR FORCE
8.8%
UNEMPLOYMENT RATE
Cordele Zip Codes
Cordele Area Codes
Income in Cordele
Income Overview in Cordele
Per Capita Income in Cordele is $22,633, while median incomes of families and households are $58,389 and $33,166 respectively.
| Characteristic | Number | Measure |
| Per Capita Income | 10,210 | $22,633 |
| Median Family Income | 2,623 | $58,389 |
| Mean Family Income | 2,623 | $65,614 |
| Median Household Income | 4,039 | $33,166 |
| Mean Household Income | 4,039 | $52,808 |
| Income Deficit | 2,623 | $14,202 |
| Wage / Income Gap (%) | 10,210 | 29.84% |
| Wage / Income Gap ($) | 10,210 | 70.16¢ per $1 |
| Gini / Inequality Index | 10,210 | 0.49 |
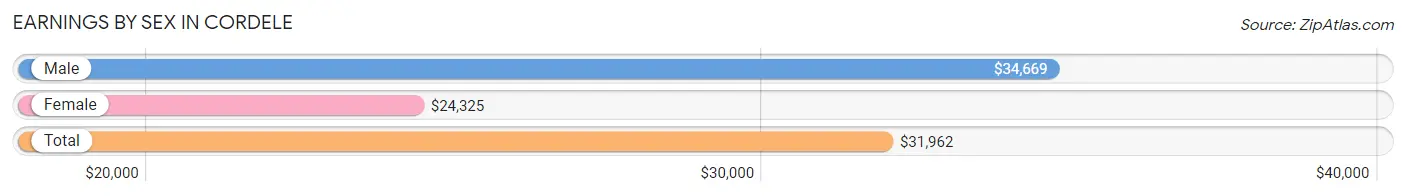
Earnings by Sex in Cordele
Average Earnings in Cordele are $31,962, $34,669 for men and $24,325 for women, a difference of 29.8%.
| Sex | Number | Average Earnings |
| Male | 2,154 (46.4%) | $34,669 |
| Female | 2,487 (53.6%) | $24,325 |
| Total | 4,641 (100.0%) | $31,962 |
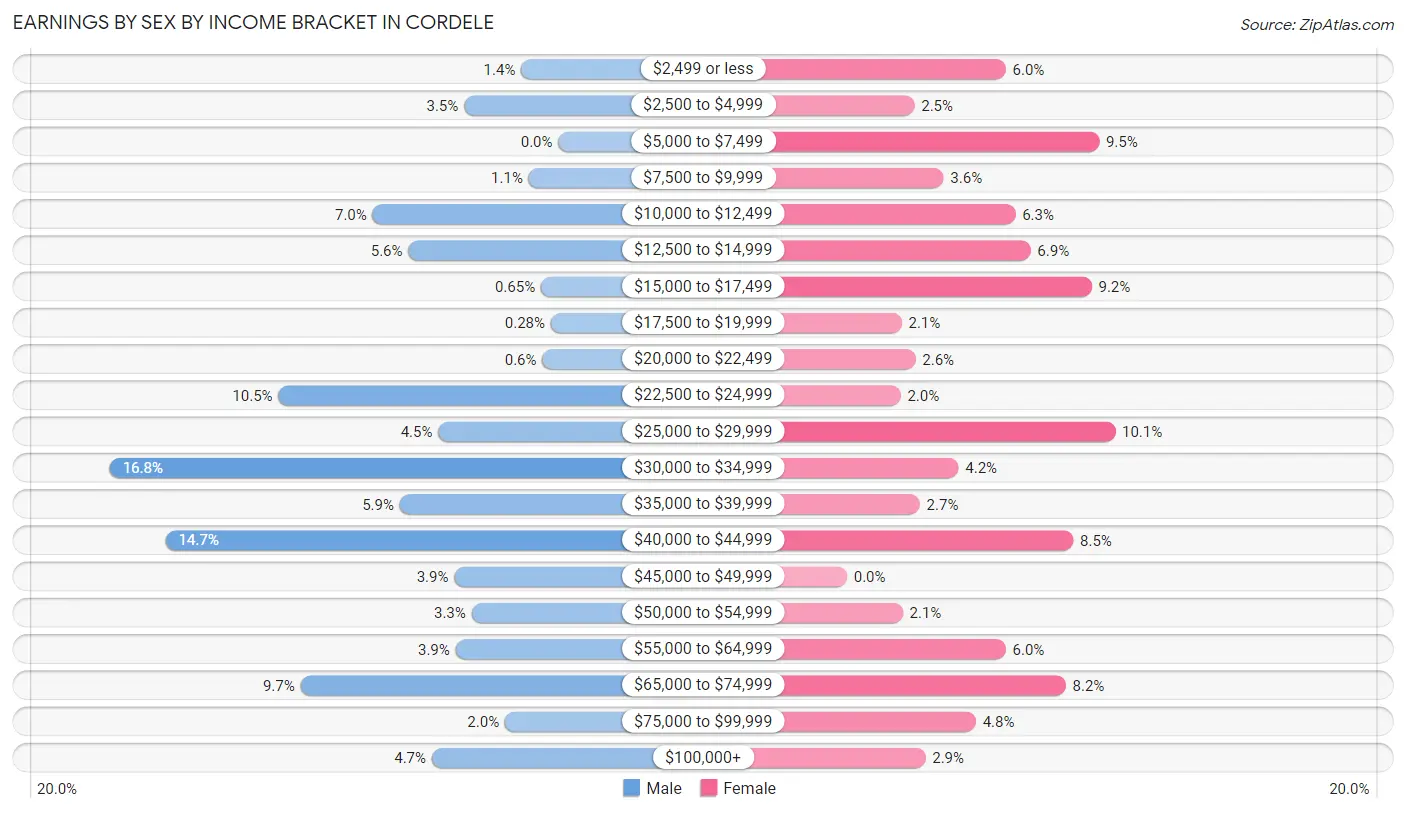
Earnings by Sex by Income Bracket in Cordele
The most common earnings brackets in Cordele are $30,000 to $34,999 for men (362 | 16.8%) and $25,000 to $29,999 for women (250 | 10.1%).
| Income | Male | Female |
| $2,499 or less | 30 (1.4%) | 148 (5.9%) |
| $2,500 to $4,999 | 76 (3.5%) | 63 (2.5%) |
| $5,000 to $7,499 | 0 (0.0%) | 235 (9.5%) |
| $7,500 to $9,999 | 24 (1.1%) | 90 (3.6%) |
| $10,000 to $12,499 | 150 (7.0%) | 157 (6.3%) |
| $12,500 to $14,999 | 121 (5.6%) | 171 (6.9%) |
| $15,000 to $17,499 | 14 (0.6%) | 228 (9.2%) |
| $17,500 to $19,999 | 6 (0.3%) | 51 (2.1%) |
| $20,000 to $22,499 | 13 (0.6%) | 64 (2.6%) |
| $22,500 to $24,999 | 226 (10.5%) | 50 (2.0%) |
| $25,000 to $29,999 | 97 (4.5%) | 250 (10.1%) |
| $30,000 to $34,999 | 362 (16.8%) | 104 (4.2%) |
| $35,000 to $39,999 | 128 (5.9%) | 68 (2.7%) |
| $40,000 to $44,999 | 317 (14.7%) | 211 (8.5%) |
| $45,000 to $49,999 | 84 (3.9%) | 0 (0.0%) |
| $50,000 to $54,999 | 70 (3.3%) | 52 (2.1%) |
| $55,000 to $64,999 | 83 (3.8%) | 148 (5.9%) |
| $65,000 to $74,999 | 208 (9.7%) | 204 (8.2%) |
| $75,000 to $99,999 | 43 (2.0%) | 120 (4.8%) |
| $100,000+ | 102 (4.7%) | 73 (2.9%) |
| Total | 2,154 (100.0%) | 2,487 (100.0%) |
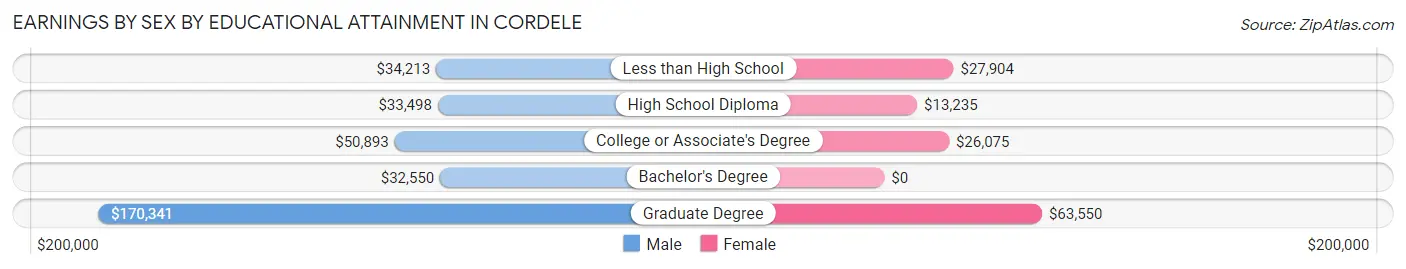
Earnings by Sex by Educational Attainment in Cordele
Average earnings in Cordele are $38,793 for men and $22,550 for women, a difference of 41.9%. Men with an educational attainment of graduate degree enjoy the highest average annual earnings of $170,341, while those with bachelor's degree education earn the least with $32,550. Women with an educational attainment of graduate degree earn the most with the average annual earnings of $63,550, while those with high school diploma education have the smallest earnings of $13,235.
| Educational Attainment | Male Income | Female Income |
| Less than High School | $34,213 | $27,904 |
| High School Diploma | $33,498 | $13,235 |
| College or Associate's Degree | $50,893 | $26,075 |
| Bachelor's Degree | $32,550 | $0 |
| Graduate Degree | $170,341 | $63,550 |
| Total | $38,793 | $22,550 |
Family Income in Cordele
Family Income Brackets in Cordele
According to the Cordele family income data, there are 470 families falling into the $25,000 to $34,999 income range, which is the most common income bracket and makes up 17.9% of all families. Conversely, the $150,000 to $199,999 income bracket is the least frequent group with only 37 families (1.4%) belonging to this category.
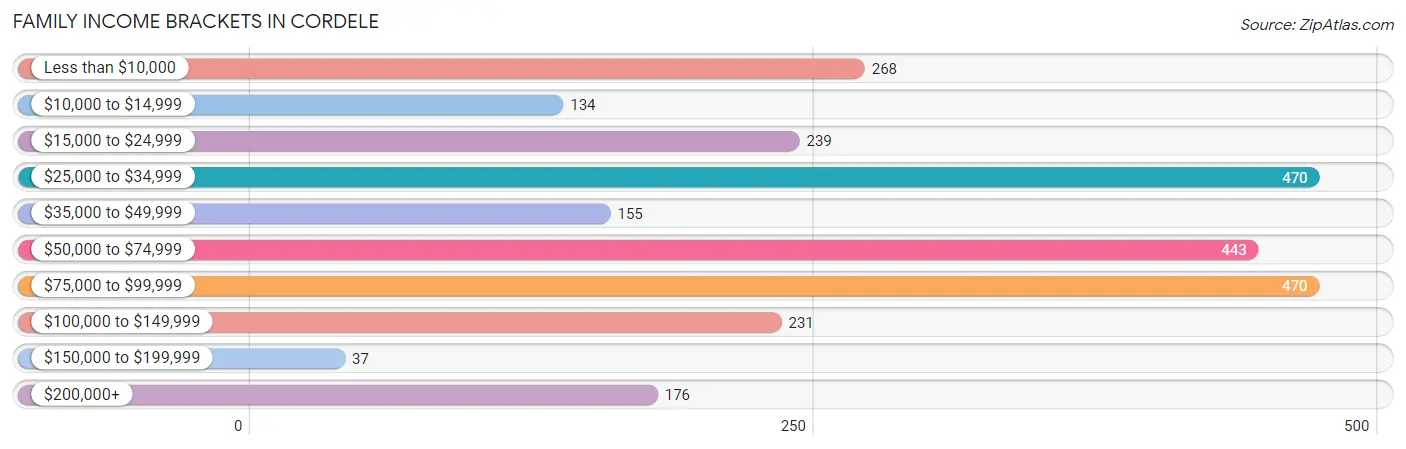
| Income Bracket | # Families | % Families |
| Less than $10,000 | 268 | 10.2% |
| $10,000 to $14,999 | 134 | 5.1% |
| $15,000 to $24,999 | 239 | 9.1% |
| $25,000 to $34,999 | 470 | 17.9% |
| $35,000 to $49,999 | 155 | 5.9% |
| $50,000 to $74,999 | 443 | 16.9% |
| $75,000 to $99,999 | 470 | 17.9% |
| $100,000 to $149,999 | 231 | 8.8% |
| $150,000 to $199,999 | 37 | 1.4% |
| $200,000+ | 176 | 6.7% |
Family Income by Famaliy Size in Cordele
4-person families (429 | 16.4%) account for the highest median family income in Cordele with $68,259 per family, while 2-person families (1,167 | 44.5%) have the highest median income of $30,800 per family member.
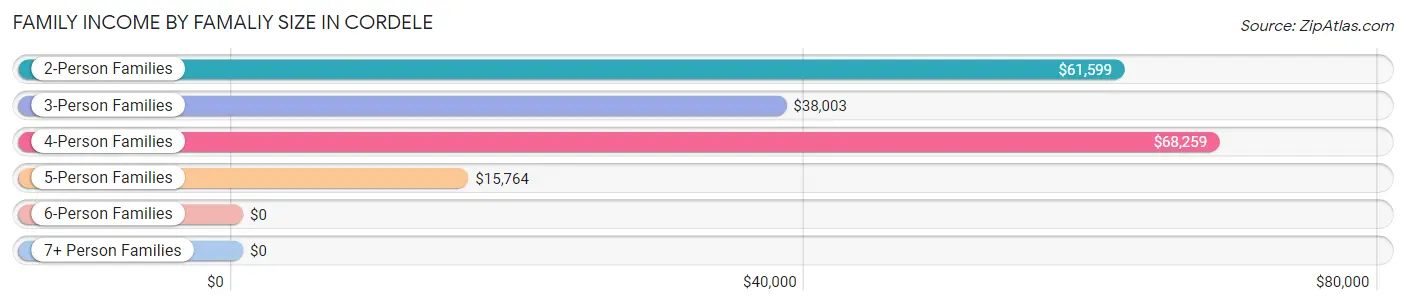
| Income Bracket | # Families | Median Income |
| 2-Person Families | 1,167 (44.5%) | $61,599 |
| 3-Person Families | 753 (28.7%) | $38,003 |
| 4-Person Families | 429 (16.4%) | $68,259 |
| 5-Person Families | 251 (9.6%) | $15,764 |
| 6-Person Families | 23 (0.9%) | $0 |
| 7+ Person Families | 0 (0.0%) | $0 |
| Total | 2,623 (100.0%) | $58,389 |
Family Income by Number of Earners in Cordele
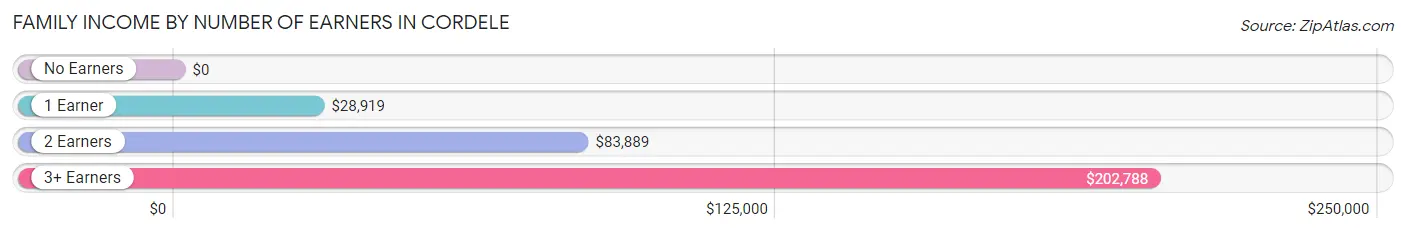
| Number of Earners | # Families | Median Income |
| No Earners | 353 (13.5%) | $0 |
| 1 Earner | 1,184 (45.1%) | $28,919 |
| 2 Earners | 994 (37.9%) | $83,889 |
| 3+ Earners | 92 (3.5%) | $202,788 |
| Total | 2,623 (100.0%) | $58,389 |
Household Income in Cordele
Household Income Brackets in Cordele
With 606 households falling in the category, the $15,000 to $24,999 income range is the most frequent in Cordele, accounting for 15.0% of all households. In contrast, only 36 households (0.9%) fall into the $150,000 to $199,999 income bracket, making it the least populous group.
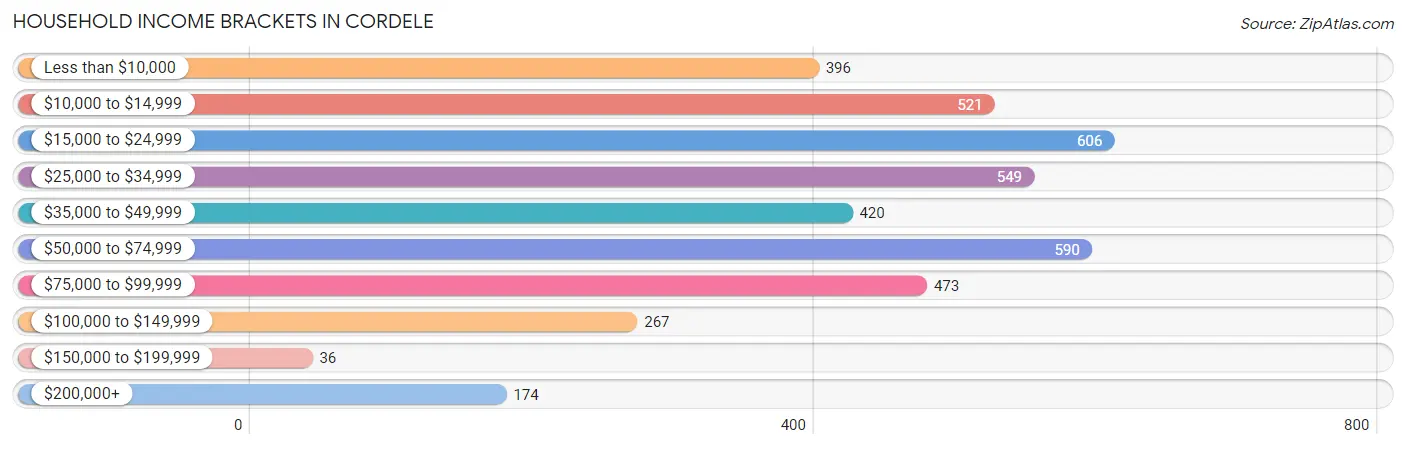
| Income Bracket | # Households | % Households |
| Less than $10,000 | 396 | 9.8% |
| $10,000 to $14,999 | 521 | 12.9% |
| $15,000 to $24,999 | 606 | 15.0% |
| $25,000 to $34,999 | 549 | 13.6% |
| $35,000 to $49,999 | 420 | 10.4% |
| $50,000 to $74,999 | 590 | 14.6% |
| $75,000 to $99,999 | 473 | 11.7% |
| $100,000 to $149,999 | 267 | 6.6% |
| $150,000 to $199,999 | 36 | 0.9% |
| $200,000+ | 174 | 4.3% |
Household Income by Householder Age in Cordele
The median household income in Cordele is $33,166, with the highest median household income of $40,750 found in the 45 to 64 years age bracket for the primary householder. A total of 1,252 households (31.0%) fall into this category. Meanwhile, the 15 to 24 years age bracket for the primary householder has the lowest median household income of $0, with 304 households (7.5%) in this group.
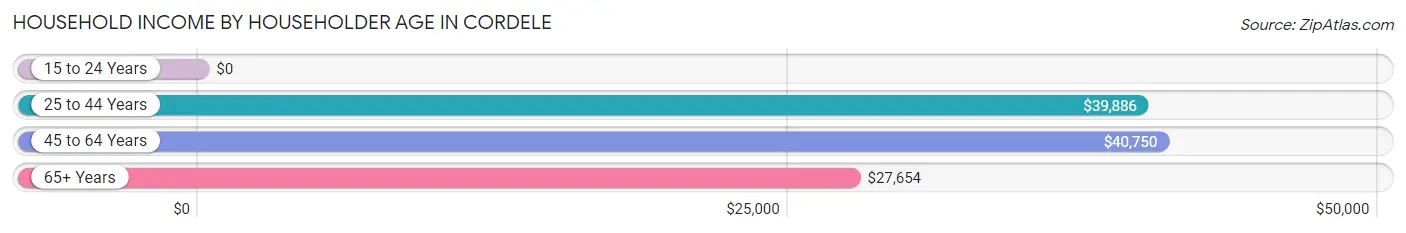
| Income Bracket | # Households | Median Income |
| 15 to 24 Years | 304 (7.5%) | $0 |
| 25 to 44 Years | 1,225 (30.3%) | $39,886 |
| 45 to 64 Years | 1,252 (31.0%) | $40,750 |
| 65+ Years | 1,258 (31.1%) | $27,654 |
| Total | 4,039 (100.0%) | $33,166 |
Poverty in Cordele
Income Below Poverty by Sex and Age in Cordele
With 32.0% poverty level for males and 32.6% for females among the residents of Cordele, 6 to 11 year old males and 15 year old females are the most vulnerable to poverty, with 372 males (93.0%) and 121 females (100.0%) in their respective age groups living below the poverty level.
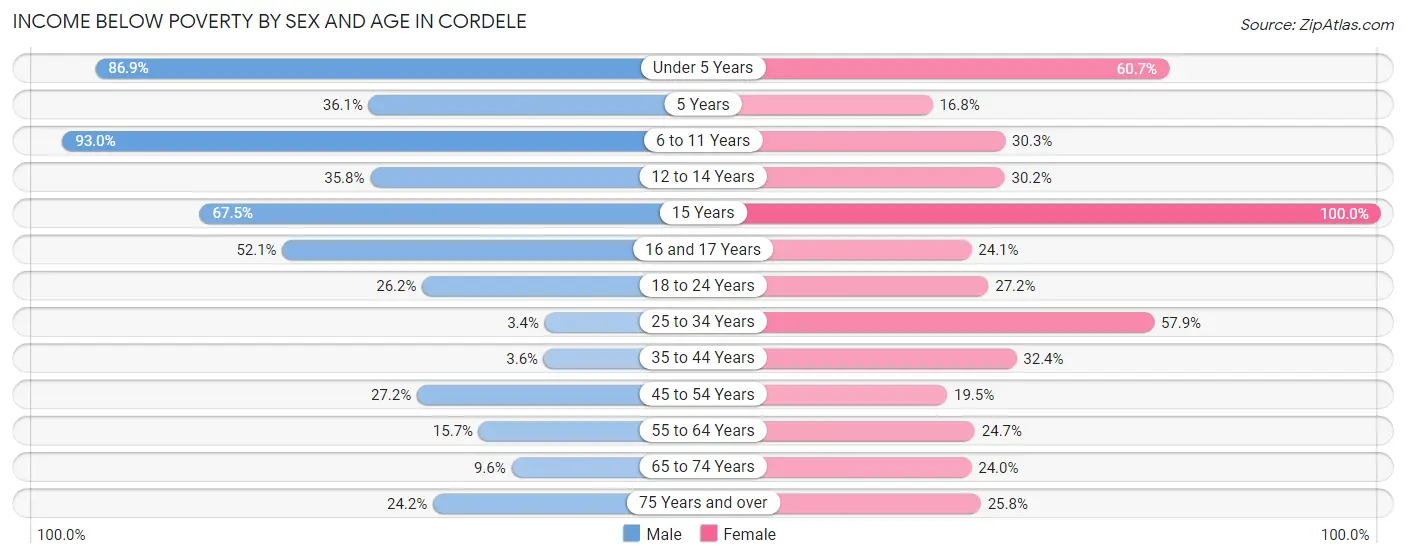
| Age Bracket | Male | Female |
| Under 5 Years | 364 (86.9%) | 122 (60.7%) |
| 5 Years | 13 (36.1%) | 34 (16.8%) |
| 6 to 11 Years | 372 (93.0%) | 104 (30.3%) |
| 12 to 14 Years | 110 (35.8%) | 87 (30.2%) |
| 15 Years | 54 (67.5%) | 121 (100.0%) |
| 16 and 17 Years | 73 (52.1%) | 19 (24.0%) |
| 18 to 24 Years | 128 (26.2%) | 176 (27.2%) |
| 25 to 34 Years | 16 (3.4%) | 365 (57.9%) |
| 35 to 44 Years | 24 (3.6%) | 220 (32.4%) |
| 45 to 54 Years | 123 (27.2%) | 110 (19.5%) |
| 55 to 64 Years | 84 (15.7%) | 166 (24.7%) |
| 65 to 74 Years | 33 (9.6%) | 137 (24.0%) |
| 75 Years and over | 30 (24.2%) | 130 (25.8%) |
| Total | 1,424 (32.0%) | 1,791 (32.6%) |
Income Above Poverty by Sex and Age in Cordele
According to the poverty statistics in Cordele, males aged 25 to 34 years and females aged 5 years are the age groups that are most secure financially, with 96.6% of males and 83.2% of females in these age groups living above the poverty line.
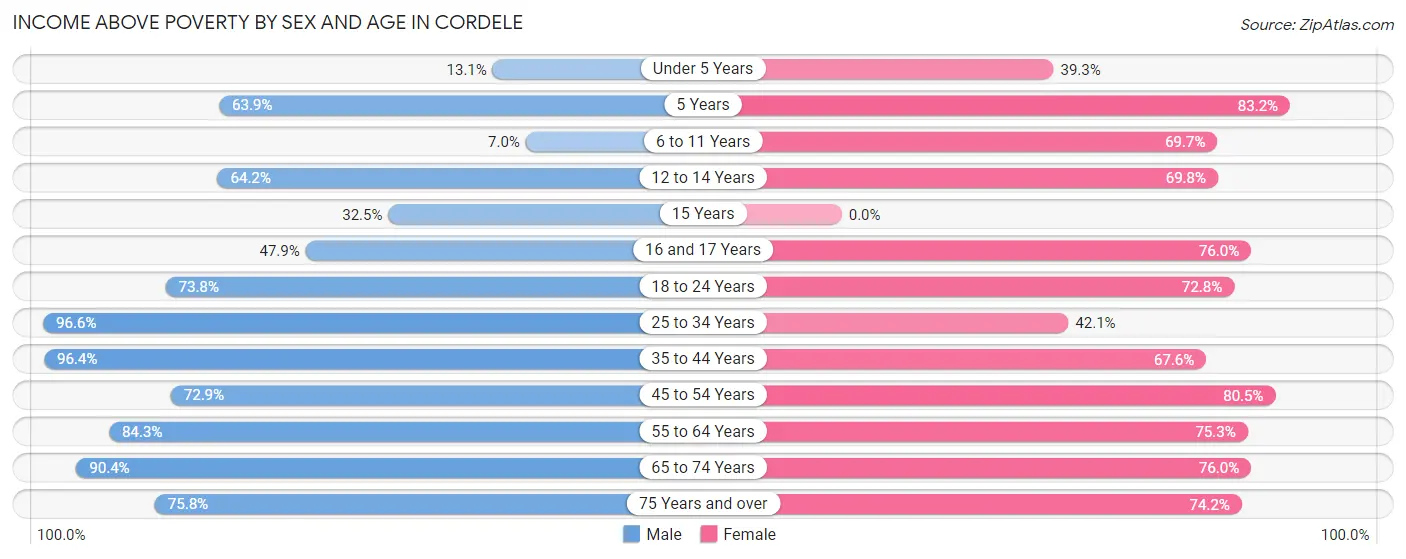
| Age Bracket | Male | Female |
| Under 5 Years | 55 (13.1%) | 79 (39.3%) |
| 5 Years | 23 (63.9%) | 168 (83.2%) |
| 6 to 11 Years | 28 (7.0%) | 239 (69.7%) |
| 12 to 14 Years | 197 (64.2%) | 201 (69.8%) |
| 15 Years | 26 (32.5%) | 0 (0.0%) |
| 16 and 17 Years | 67 (47.9%) | 60 (75.9%) |
| 18 to 24 Years | 361 (73.8%) | 471 (72.8%) |
| 25 to 34 Years | 449 (96.6%) | 265 (42.1%) |
| 35 to 44 Years | 641 (96.4%) | 459 (67.6%) |
| 45 to 54 Years | 330 (72.9%) | 453 (80.5%) |
| 55 to 64 Years | 452 (84.3%) | 506 (75.3%) |
| 65 to 74 Years | 310 (90.4%) | 433 (76.0%) |
| 75 Years and over | 94 (75.8%) | 374 (74.2%) |
| Total | 3,033 (68.0%) | 3,708 (67.4%) |
Income Below Poverty Among Married-Couple Families in Cordele
The poverty statistics for married-couple families in Cordele show that 6.0% or 61 of the total 1,010 families live below the poverty line. Families with 3 or 4 children have the highest poverty rate of 100.0%, comprising of 23 families. On the other hand, families with 1 or 2 children have the lowest poverty rate of 3.5%, which includes 14 families.
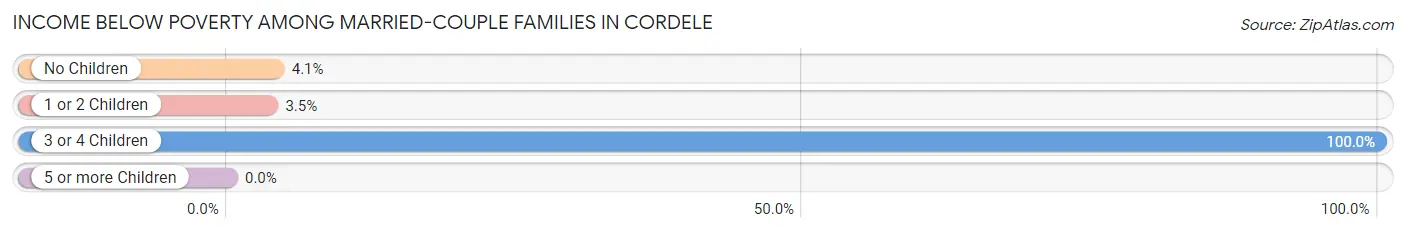
| Children | Above Poverty | Below Poverty |
| No Children | 565 (95.9%) | 24 (4.1%) |
| 1 or 2 Children | 384 (96.5%) | 14 (3.5%) |
| 3 or 4 Children | 0 (0.0%) | 23 (100.0%) |
| 5 or more Children | 0 (0.0%) | 0 (0.0%) |
| Total | 949 (94.0%) | 61 (6.0%) |
Income Below Poverty Among Single-Parent Households in Cordele
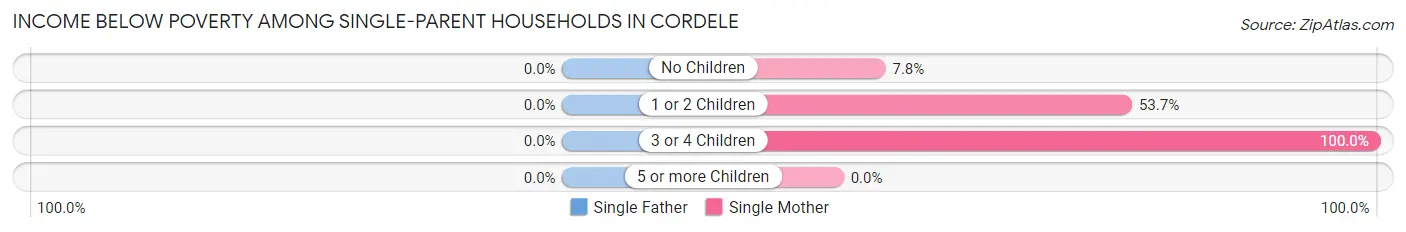
| Children | Single Father | Single Mother |
| No Children | 0 (0.0%) | 52 (7.8%) |
| 1 or 2 Children | 0 (0.0%) | 305 (53.7%) |
| 3 or 4 Children | 0 (0.0%) | 228 (100.0%) |
| 5 or more Children | 0 (0.0%) | 0 (0.0%) |
| Total | 0 (0.0%) | 585 (40.0%) |
Income Below Poverty Among Married-Couple vs Single-Parent Households in Cordele
The poverty data for Cordele shows that 61 of the married-couple family households (6.0%) and 585 of the single-parent households (36.3%) are living below the poverty level. Within the married-couple family households, those with 3 or 4 children have the highest poverty rate, with 23 households (100.0%) falling below the poverty line. Among the single-parent households, those with 3 or 4 children have the highest poverty rate, with 228 household (100.0%) living below poverty.
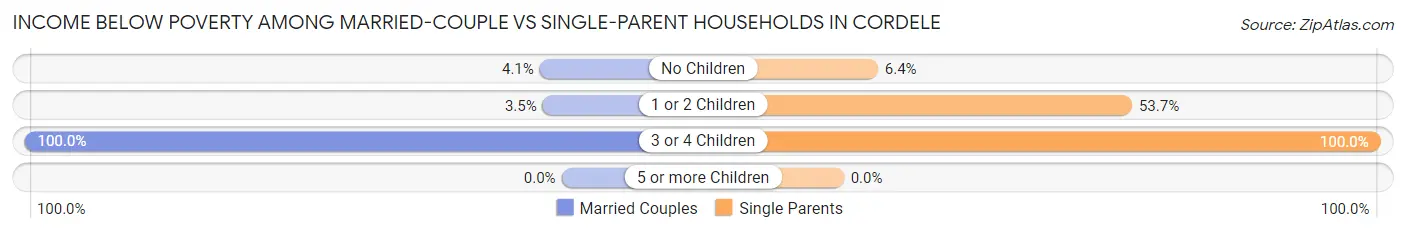
| Children | Married-Couple Families | Single-Parent Households |
| No Children | 24 (4.1%) | 52 (6.4%) |
| 1 or 2 Children | 14 (3.5%) | 305 (53.7%) |
| 3 or 4 Children | 23 (100.0%) | 228 (100.0%) |
| 5 or more Children | 0 (0.0%) | 0 (0.0%) |
| Total | 61 (6.0%) | 585 (36.3%) |
Race in Cordele
The most populous races in Cordele are Black / African American (7,119 | 69.7%), White / Caucasian (2,947 | 28.9%), and Hispanic or Latino (201 | 2.0%).
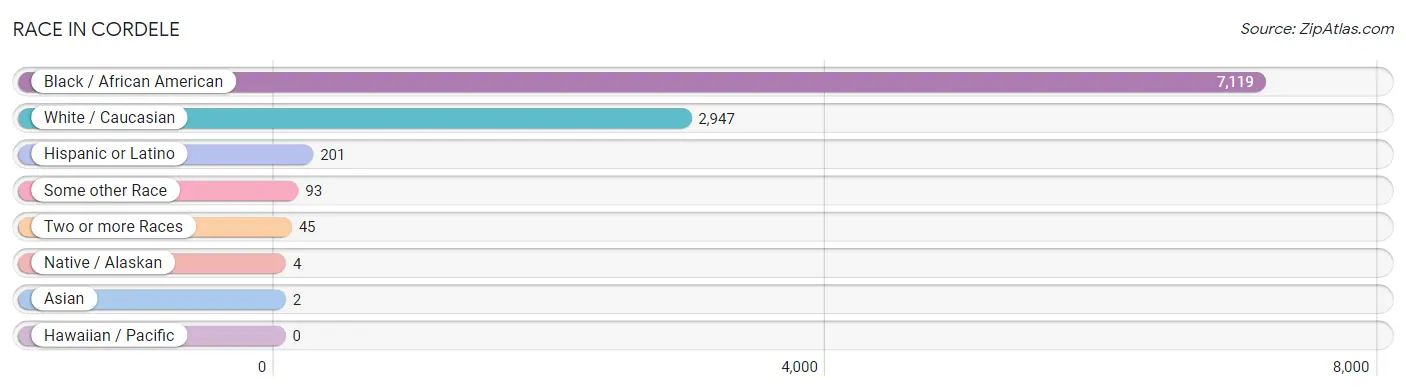
| Race | # Population | % Population |
| Asian | 2 | 0.0% |
| Black / African American | 7,119 | 69.7% |
| Hawaiian / Pacific | 0 | 0.0% |
| Hispanic or Latino | 201 | 2.0% |
| Native / Alaskan | 4 | 0.0% |
| White / Caucasian | 2,947 | 28.9% |
| Two or more Races | 45 | 0.4% |
| Some other Race | 93 | 0.9% |
| Total | 10,210 | 100.0% |
Ancestry in Cordele
The most populous ancestries reported in Cordele are American (987 | 9.7%), Mexican (108 | 1.1%), Central American (93 | 0.9%), English (93 | 0.9%), and Honduran (93 | 0.9%), together accounting for 13.5% of all Cordele residents.
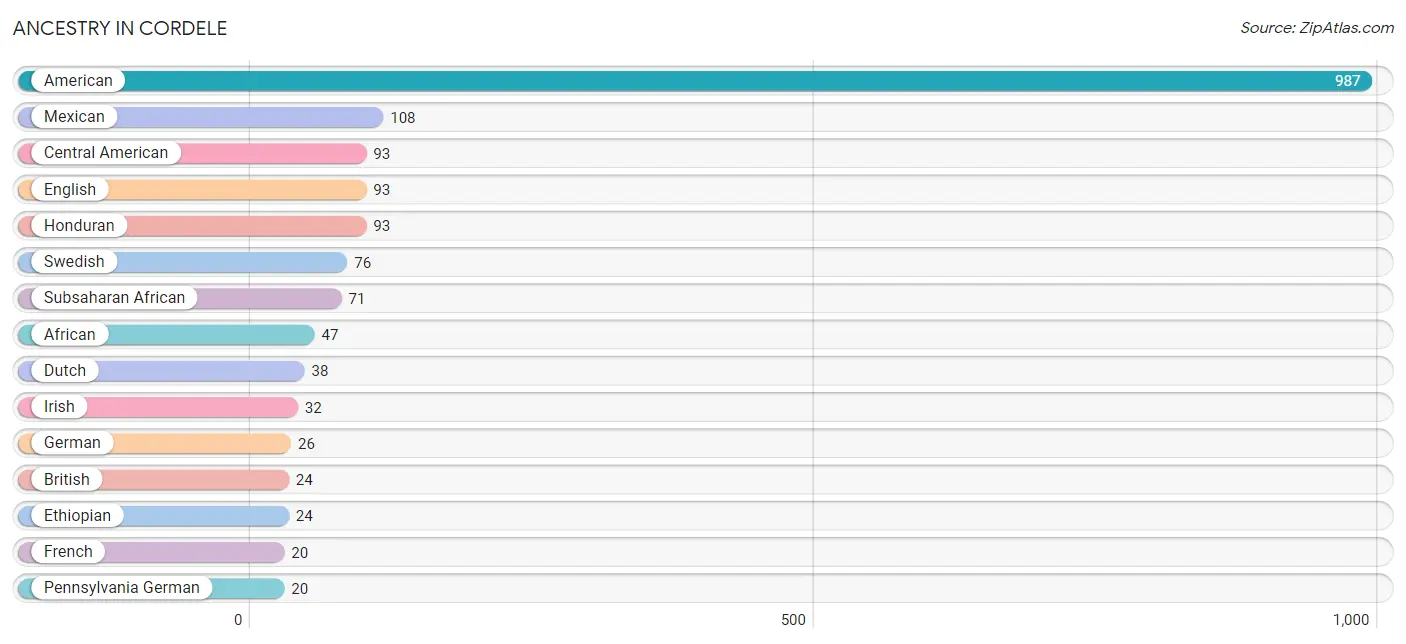
| Ancestry | # Population | % Population |
| African | 47 | 0.5% |
| American | 987 | 9.7% |
| British | 24 | 0.2% |
| Central American | 93 | 0.9% |
| Choctaw | 4 | 0.0% |
| Dutch | 38 | 0.4% |
| English | 93 | 0.9% |
| Ethiopian | 24 | 0.2% |
| French | 20 | 0.2% |
| German | 26 | 0.3% |
| Haitian | 13 | 0.1% |
| Honduran | 93 | 0.9% |
| Irish | 32 | 0.3% |
| Italian | 1 | 0.0% |
| Mexican | 108 | 1.1% |
| Pennsylvania German | 20 | 0.2% |
| Scottish | 16 | 0.2% |
| Subsaharan African | 71 | 0.7% |
| Swedish | 76 | 0.7% |
| Thai | 2 | 0.0% |
| Trinidadian and Tobagonian | 1 | 0.0% | View All 21 Rows |
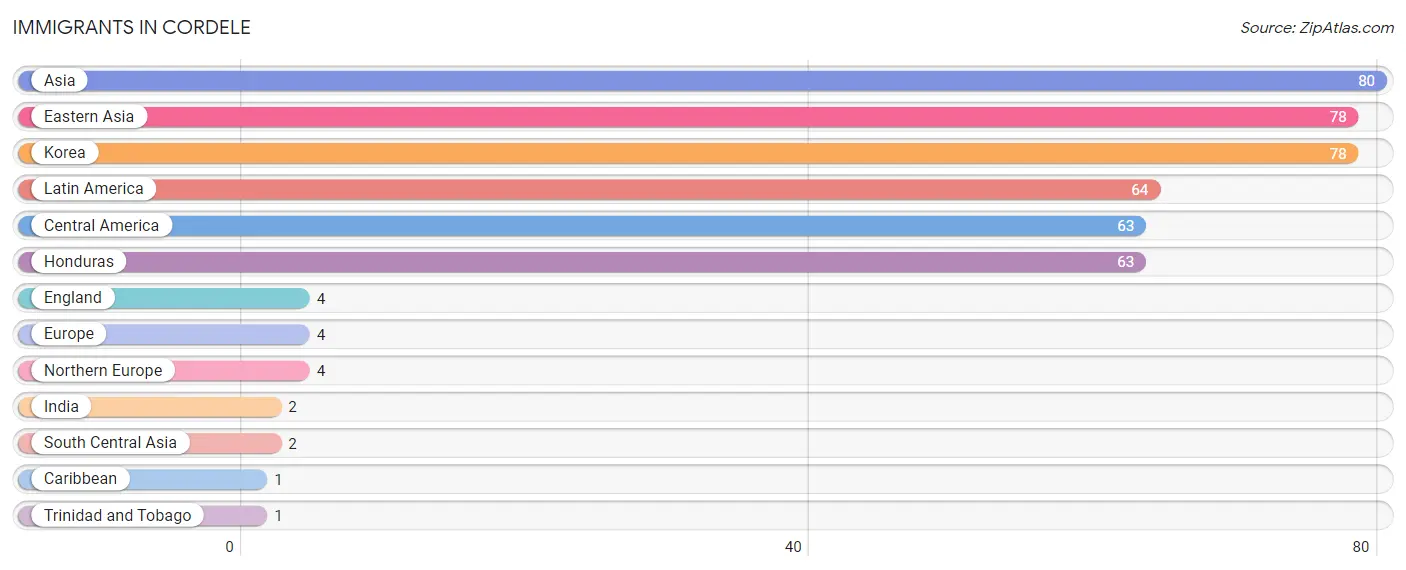
Immigrants in Cordele
The most numerous immigrant groups reported in Cordele came from Asia (80 | 0.8%), Eastern Asia (78 | 0.8%), Korea (78 | 0.8%), Latin America (64 | 0.6%), and Central America (63 | 0.6%), together accounting for 3.5% of all Cordele residents.
| Immigration Origin | # Population | % Population |
| Asia | 80 | 0.8% |
| Caribbean | 1 | 0.0% |
| Central America | 63 | 0.6% |
| Eastern Asia | 78 | 0.8% |
| England | 4 | 0.0% |
| Europe | 4 | 0.0% |
| Honduras | 63 | 0.6% |
| India | 2 | 0.0% |
| Korea | 78 | 0.8% |
| Latin America | 64 | 0.6% |
| Northern Europe | 4 | 0.0% |
| South Central Asia | 2 | 0.0% |
| Trinidad and Tobago | 1 | 0.0% | View All 13 Rows |
Sex and Age in Cordele
Sex and Age in Cordele
The most populous age groups in Cordele are 10 to 14 Years (427 | 9.4%) for men and 20 to 24 Years (514 | 9.1%) for women.
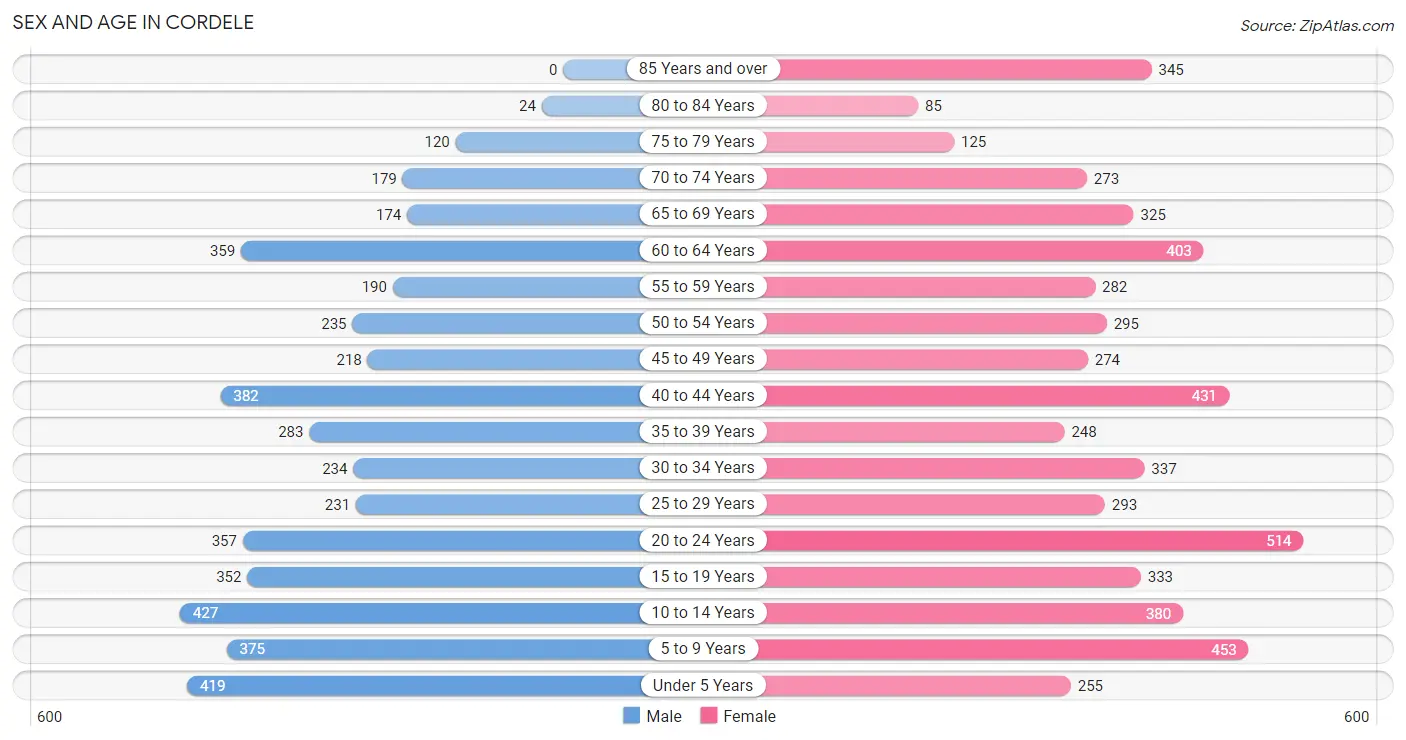
| Age Bracket | Male | Female |
| Under 5 Years | 419 (9.2%) | 255 (4.5%) |
| 5 to 9 Years | 375 (8.2%) | 453 (8.0%) |
| 10 to 14 Years | 427 (9.4%) | 380 (6.7%) |
| 15 to 19 Years | 352 (7.7%) | 333 (5.9%) |
| 20 to 24 Years | 357 (7.8%) | 514 (9.1%) |
| 25 to 29 Years | 231 (5.1%) | 293 (5.2%) |
| 30 to 34 Years | 234 (5.1%) | 337 (6.0%) |
| 35 to 39 Years | 283 (6.2%) | 248 (4.4%) |
| 40 to 44 Years | 382 (8.4%) | 431 (7.6%) |
| 45 to 49 Years | 218 (4.8%) | 274 (4.9%) |
| 50 to 54 Years | 235 (5.1%) | 295 (5.2%) |
| 55 to 59 Years | 190 (4.2%) | 282 (5.0%) |
| 60 to 64 Years | 359 (7.9%) | 403 (7.1%) |
| 65 to 69 Years | 174 (3.8%) | 325 (5.8%) |
| 70 to 74 Years | 179 (3.9%) | 273 (4.8%) |
| 75 to 79 Years | 120 (2.6%) | 125 (2.2%) |
| 80 to 84 Years | 24 (0.5%) | 85 (1.5%) |
| 85 Years and over | 0 (0.0%) | 345 (6.1%) |
| Total | 4,559 (100.0%) | 5,651 (100.0%) |
Families and Households in Cordele
Median Family Size in Cordele
The median family size in Cordele is 3.13 persons per family, with married-couple families (1,010 | 38.5%) accounting for the largest median family size of 3.19 persons per family. On the other hand, single male/father families (150 | 5.7%) represent the smallest median family size with 2.29 persons per family.
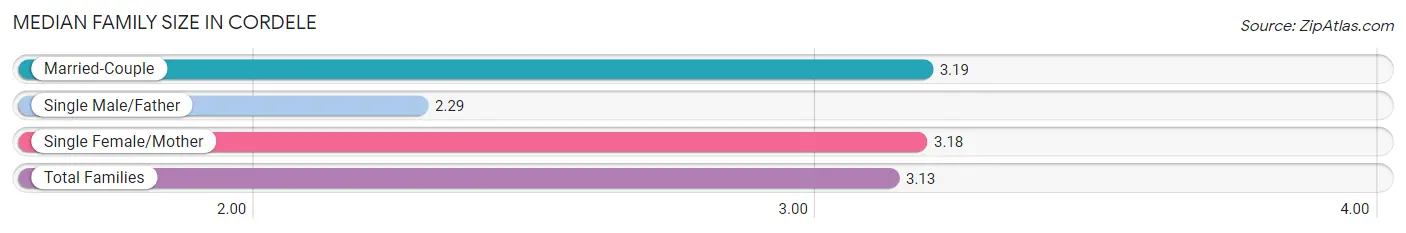
| Family Type | # Families | Family Size |
| Married-Couple | 1,010 (38.5%) | 3.19 |
| Single Male/Father | 150 (5.7%) | 2.29 |
| Single Female/Mother | 1,463 (55.8%) | 3.18 |
| Total Families | 2,623 (100.0%) | 3.13 |
Median Household Size in Cordele
The median household size in Cordele is 2.49 persons per household, with single female/mother households (1,463 | 36.2%) accounting for the largest median household size of 3.38 persons per household. non-family households (1,416 | 35.1%) represent the smallest median household size with 1.10 persons per household.
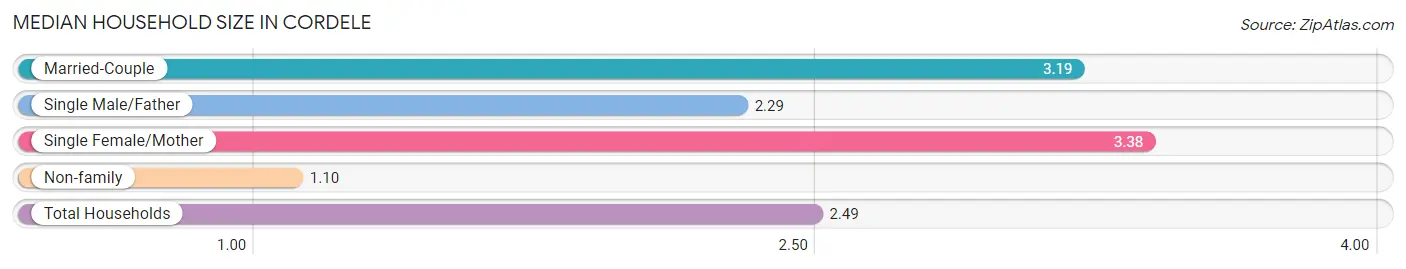
| Household Type | # Households | Household Size |
| Married-Couple | 1,010 (25.0%) | 3.19 |
| Single Male/Father | 150 (3.7%) | 2.29 |
| Single Female/Mother | 1,463 (36.2%) | 3.38 |
| Non-family | 1,416 (35.1%) | 1.10 |
| Total Households | 4,039 (100.0%) | 2.49 |
Household Size by Marriage Status in Cordele
Out of a total of 4,039 households in Cordele, 2,623 (64.9%) are family households, while 1,416 (35.1%) are nonfamily households. The most numerous type of family households are 2-person households, comprising 1,060, and the most common type of nonfamily households are 1-person households, comprising 1,332.
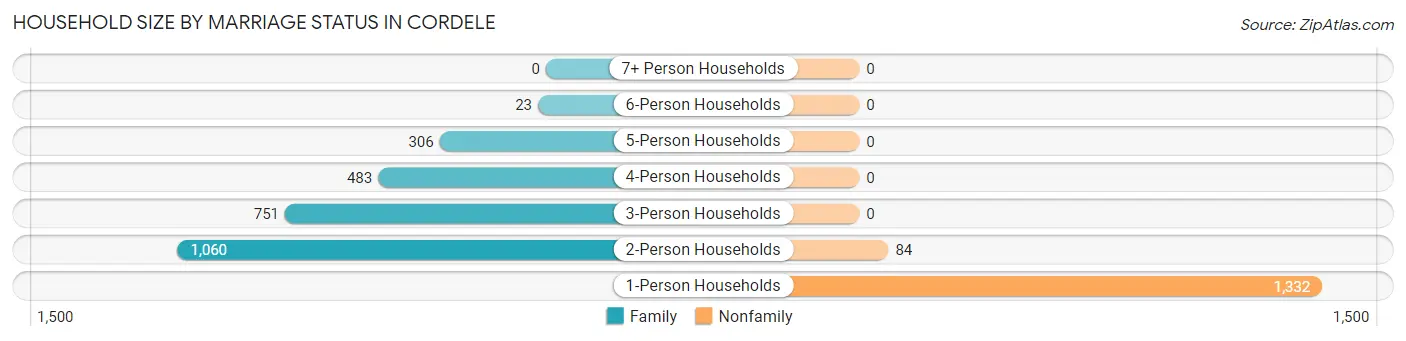
| Household Size | Family Households | Nonfamily Households |
| 1-Person Households | - | 1,332 (33.0%) |
| 2-Person Households | 1,060 (26.2%) | 84 (2.1%) |
| 3-Person Households | 751 (18.6%) | 0 (0.0%) |
| 4-Person Households | 483 (12.0%) | 0 (0.0%) |
| 5-Person Households | 306 (7.6%) | 0 (0.0%) |
| 6-Person Households | 23 (0.6%) | 0 (0.0%) |
| 7+ Person Households | 0 (0.0%) | 0 (0.0%) |
| Total | 2,623 (64.9%) | 1,416 (35.1%) |
Female Fertility in Cordele
Fertility by Age in Cordele
Average fertility rate in Cordele is 37.0 births per 1,000 women. Women in the age bracket of 15 to 19 years have the highest fertility rate with 75.0 births per 1,000 women. Women in the age bracket of 20 to 34 years acount for 72.2% of all women with births.
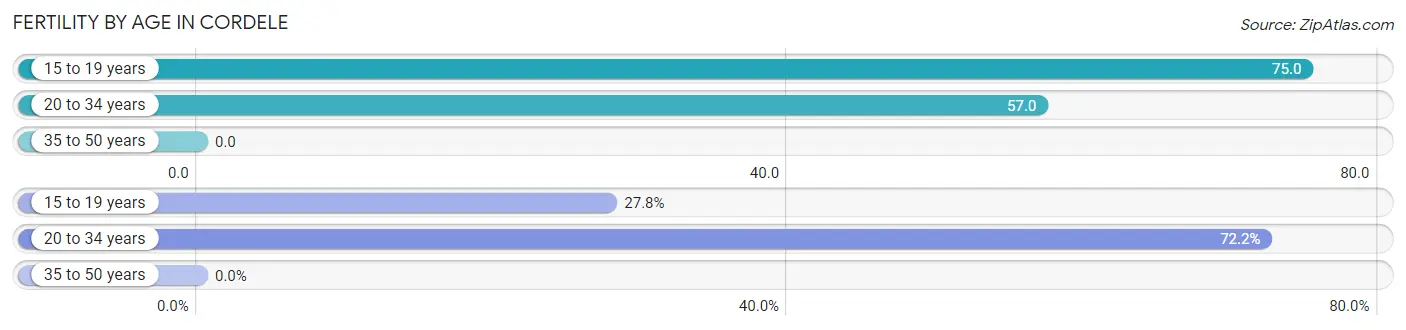
| Age Bracket | Women with Births | Births / 1,000 Women |
| 15 to 19 years | 25 (27.8%) | 75.0 |
| 20 to 34 years | 65 (72.2%) | 57.0 |
| 35 to 50 years | 0 (0.0%) | 0.0 |
| Total | 90 (100.0%) | 37.0 |
Fertility by Age by Marriage Status in Cordele
26.7% of women with births (90) in Cordele are married. The highest percentage of unmarried women with births falls into 15 to 19 years age bracket with 100.0% of them unmarried at the time of birth, while the lowest percentage of unmarried women with births belong to 20 to 34 years age bracket with 63.1% of them unmarried.
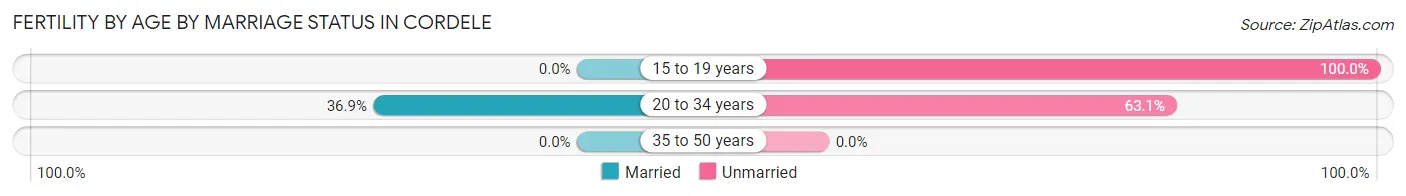
| Age Bracket | Married | Unmarried |
| 15 to 19 years | 0 (0.0%) | 25 (100.0%) |
| 20 to 34 years | 24 (36.9%) | 41 (63.1%) |
| 35 to 50 years | 0 (0.0%) | 0 (0.0%) |
| Total | 24 (26.7%) | 66 (73.3%) |
Fertility by Education in Cordele
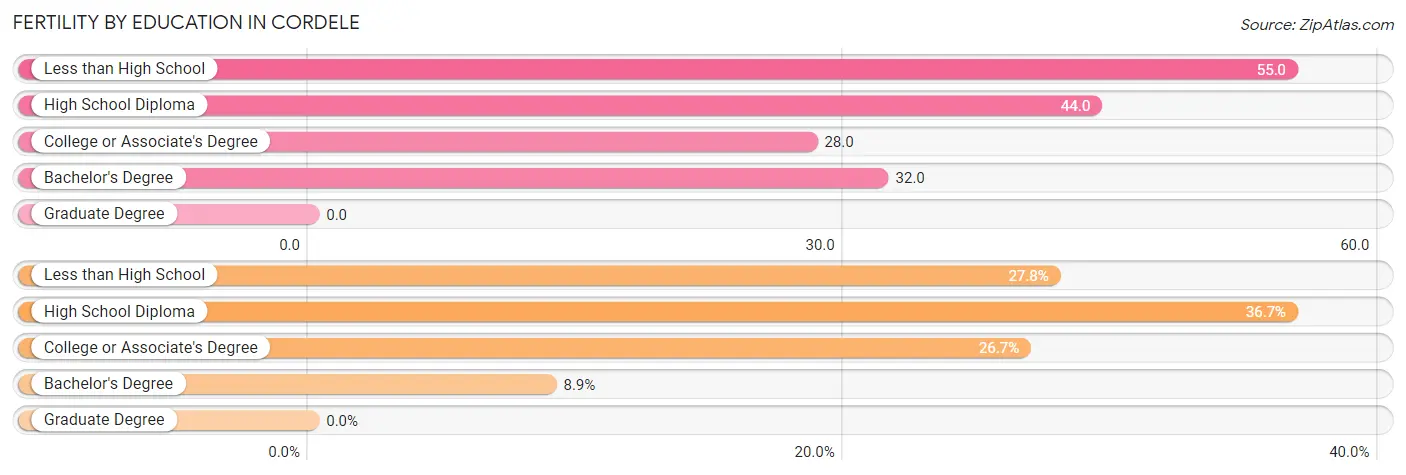
| Educational Attainment | Women with Births | Births / 1,000 Women |
| Less than High School | 25 (27.8%) | 55.0 |
| High School Diploma | 33 (36.7%) | 44.0 |
| College or Associate's Degree | 24 (26.7%) | 28.0 |
| Bachelor's Degree | 8 (8.9%) | 32.0 |
| Graduate Degree | 0 (0.0%) | 0.0 |
| Total | 90 (100.0%) | 37.0 |
Fertility by Education by Marriage Status in Cordele
73.3% of women with births in Cordele are unmarried. Women with the educational attainment of college or associate's degree are most likely to be married with 100.0% of them married at childbirth, while women with the educational attainment of less than high school are least likely to be married with 100.0% of them unmarried at childbirth.
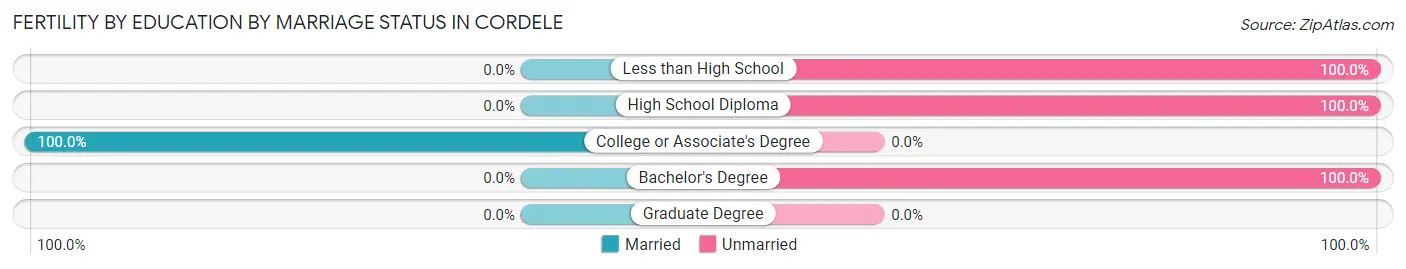
| Educational Attainment | Married | Unmarried |
| Less than High School | 0 (0.0%) | 25 (100.0%) |
| High School Diploma | 0 (0.0%) | 33 (100.0%) |
| College or Associate's Degree | 24 (100.0%) | 0 (0.0%) |
| Bachelor's Degree | 0 (0.0%) | 8 (100.0%) |
| Graduate Degree | 0 (0.0%) | 0 (0.0%) |
| Total | 24 (26.7%) | 66 (73.3%) |
Employment Characteristics in Cordele
Employment by Class of Employer in Cordele
Among the 4,083 employed individuals in Cordele, private company employees (2,845 | 69.7%), local government employees (484 | 11.8%), and state government employees (289 | 7.1%) make up the most common classes of employment.
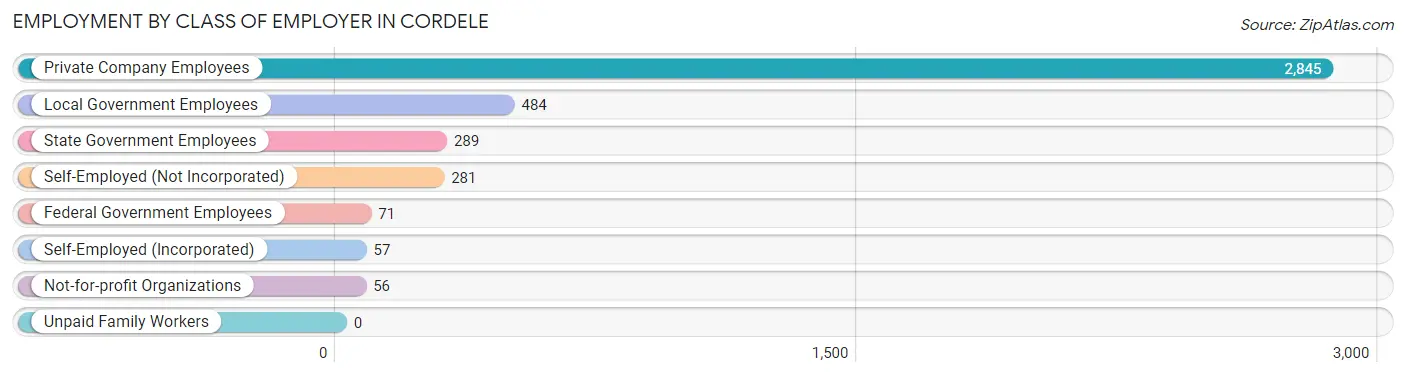
| Employer Class | # Employees | % Employees |
| Private Company Employees | 2,845 | 69.7% |
| Self-Employed (Incorporated) | 57 | 1.4% |
| Self-Employed (Not Incorporated) | 281 | 6.9% |
| Not-for-profit Organizations | 56 | 1.4% |
| Local Government Employees | 484 | 11.8% |
| State Government Employees | 289 | 7.1% |
| Federal Government Employees | 71 | 1.7% |
| Unpaid Family Workers | 0 | 0.0% |
| Total | 4,083 | 100.0% |
Employment Status by Age in Cordele
According to the labor force statistics for Cordele, out of the total population over 16 years of age (7,700), 61.2% or 4,712 individuals are in the labor force, with 8.8% or 415 of them unemployed. The age group with the highest labor force participation rate is 25 to 29 years, with 97.3% or 510 individuals in the labor force. Within the labor force, the 16 to 19 years age range has the highest percentage of unemployed individuals, with 51.4% or 126 of them being unemployed.
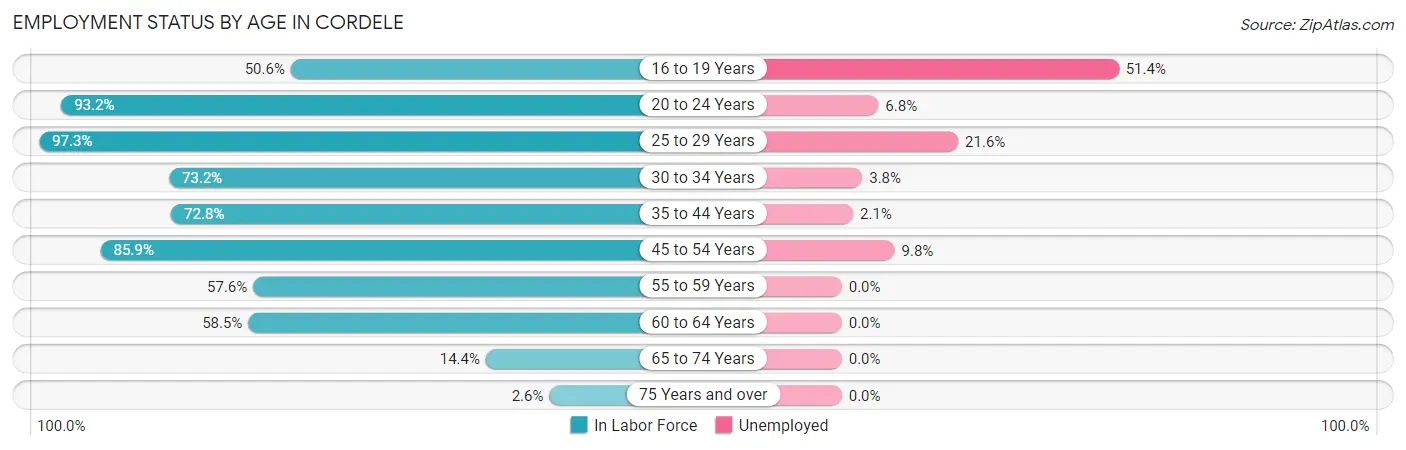
| Age Bracket | In Labor Force | Unemployed |
| 16 to 19 Years | 245 (50.6%) | 126 (51.4%) |
| 20 to 24 Years | 812 (93.2%) | 55 (6.8%) |
| 25 to 29 Years | 510 (97.3%) | 110 (21.6%) |
| 30 to 34 Years | 418 (73.2%) | 16 (3.8%) |
| 35 to 44 Years | 978 (72.8%) | 21 (2.1%) |
| 45 to 54 Years | 878 (85.9%) | 86 (9.8%) |
| 55 to 59 Years | 272 (57.6%) | 0 (0.0%) |
| 60 to 64 Years | 446 (58.5%) | 0 (0.0%) |
| 65 to 74 Years | 137 (14.4%) | 0 (0.0%) |
| 75 Years and over | 18 (2.6%) | 0 (0.0%) |
| Total | 4,712 (61.2%) | 415 (8.8%) |
Employment Status by Educational Attainment in Cordele
According to labor force statistics for Cordele, 74.6% of individuals (3,502) out of the total population between 25 and 64 years of age (4,695) are in the labor force, with 6.7% or 235 of them being unemployed. The group with the highest labor force participation rate are those with the educational attainment of bachelor's degree or higher, with 99.9% or 769 individuals in the labor force. Within the labor force, individuals with college / associate degree education have the highest percentage of unemployment, with 12.0% or 101 of them being unemployed.
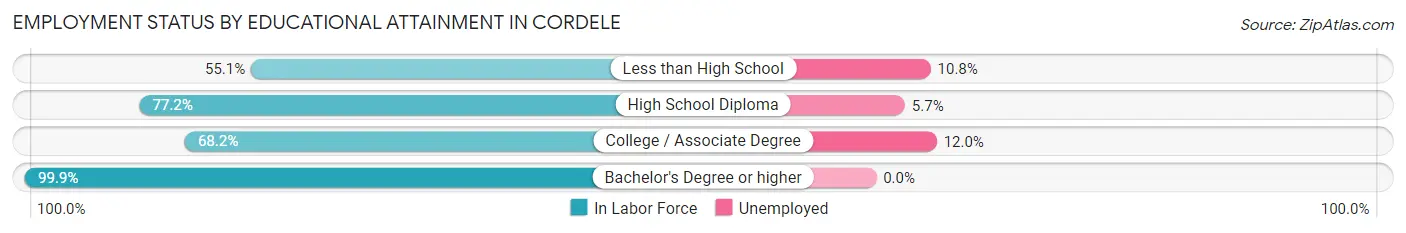
| Educational Attainment | In Labor Force | Unemployed |
| Less than High School | 464 (55.1%) | 91 (10.8%) |
| High School Diploma | 1,430 (77.2%) | 106 (5.7%) |
| College / Associate Degree | 840 (68.2%) | 148 (12.0%) |
| Bachelor's Degree or higher | 769 (99.9%) | 0 (0.0%) |
| Total | 3,502 (74.6%) | 315 (6.7%) |
Employment Occupations by Sex in Cordele
Management, Business, Science and Arts Occupations
The most common Management, Business, Science and Arts occupations in Cordele are Health Diagnosing & Treating (398 | 9.3%), Community & Social Service (382 | 8.9%), Health Technologists (366 | 8.5%), Education Instruction & Library (237 | 5.5%), and Management (137 | 3.2%).
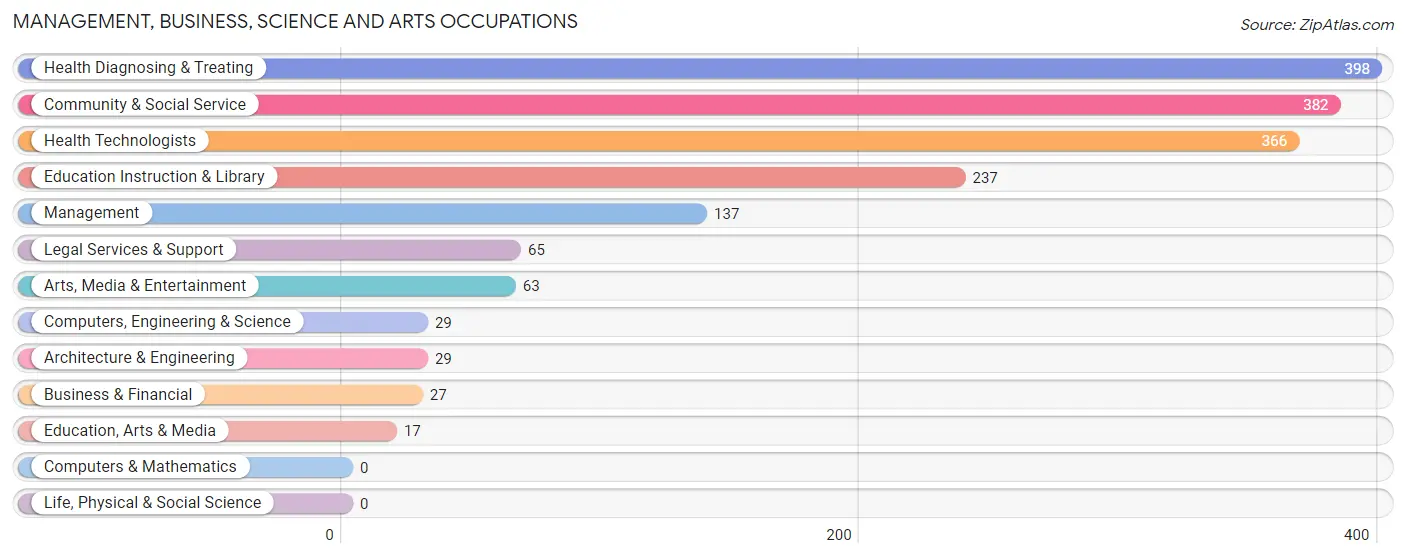
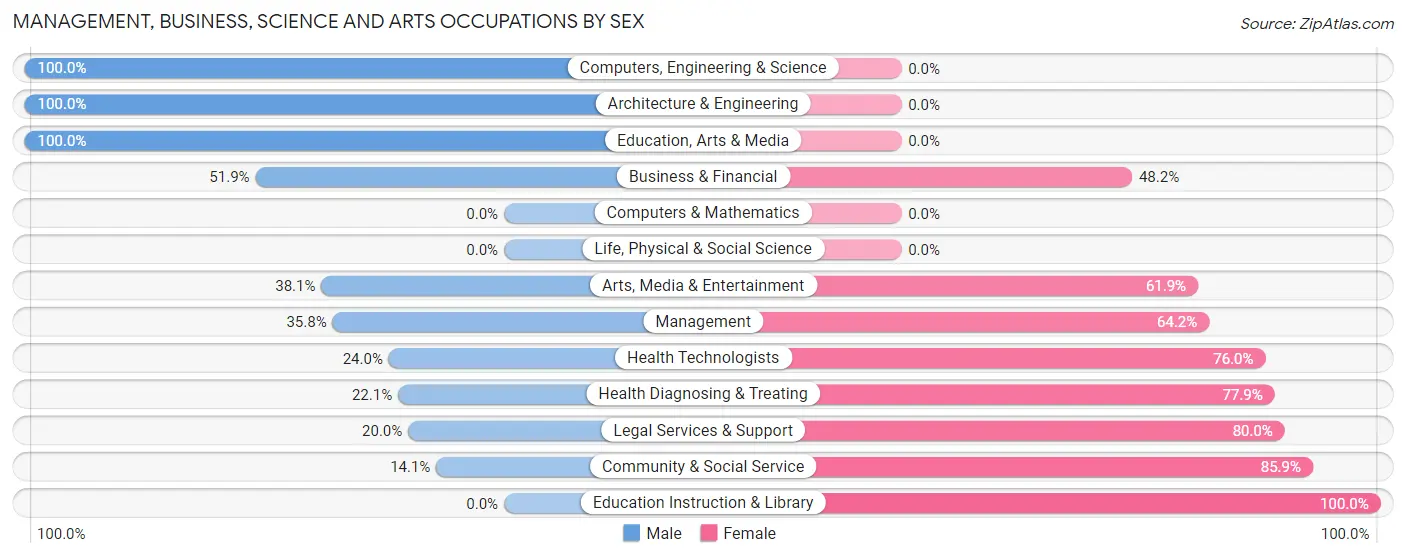
Management, Business, Science and Arts Occupations by Sex
Within the Management, Business, Science and Arts occupations in Cordele, the most male-oriented occupations are Computers, Engineering & Science (100.0%), Architecture & Engineering (100.0%), and Education, Arts & Media (100.0%), while the most female-oriented occupations are Education Instruction & Library (100.0%), Community & Social Service (85.9%), and Legal Services & Support (80.0%).
| Occupation | Male | Female |
| Management | 49 (35.8%) | 88 (64.2%) |
| Business & Financial | 14 (51.8%) | 13 (48.1%) |
| Computers, Engineering & Science | 29 (100.0%) | 0 (0.0%) |
| Computers & Mathematics | 0 (0.0%) | 0 (0.0%) |
| Architecture & Engineering | 29 (100.0%) | 0 (0.0%) |
| Life, Physical & Social Science | 0 (0.0%) | 0 (0.0%) |
| Community & Social Service | 54 (14.1%) | 328 (85.9%) |
| Education, Arts & Media | 17 (100.0%) | 0 (0.0%) |
| Legal Services & Support | 13 (20.0%) | 52 (80.0%) |
| Education Instruction & Library | 0 (0.0%) | 237 (100.0%) |
| Arts, Media & Entertainment | 24 (38.1%) | 39 (61.9%) |
| Health Diagnosing & Treating | 88 (22.1%) | 310 (77.9%) |
| Health Technologists | 88 (24.0%) | 278 (76.0%) |
| Total (Category) | 234 (24.0%) | 739 (75.9%) |
| Total (Overall) | 2,067 (48.1%) | 2,233 (51.9%) |
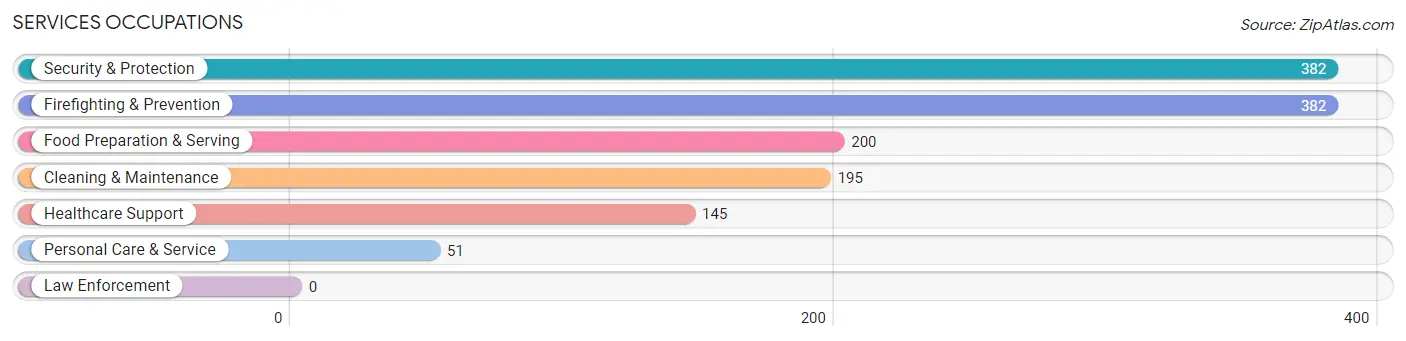
Services Occupations
The most common Services occupations in Cordele are Security & Protection (382 | 8.9%), Firefighting & Prevention (382 | 8.9%), Food Preparation & Serving (200 | 4.6%), Cleaning & Maintenance (195 | 4.5%), and Healthcare Support (145 | 3.4%).
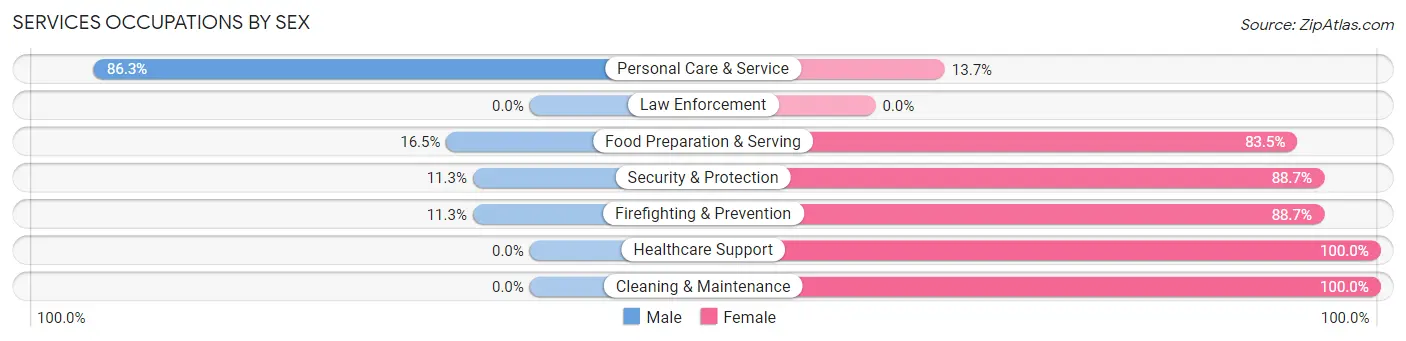
Services Occupations by Sex
Within the Services occupations in Cordele, the most male-oriented occupations are Personal Care & Service (86.3%), Food Preparation & Serving (16.5%), and Security & Protection (11.3%), while the most female-oriented occupations are Healthcare Support (100.0%), Cleaning & Maintenance (100.0%), and Security & Protection (88.7%).
| Occupation | Male | Female |
| Healthcare Support | 0 (0.0%) | 145 (100.0%) |
| Security & Protection | 43 (11.3%) | 339 (88.7%) |
| Firefighting & Prevention | 43 (11.3%) | 339 (88.7%) |
| Law Enforcement | 0 (0.0%) | 0 (0.0%) |
| Food Preparation & Serving | 33 (16.5%) | 167 (83.5%) |
| Cleaning & Maintenance | 0 (0.0%) | 195 (100.0%) |
| Personal Care & Service | 44 (86.3%) | 7 (13.7%) |
| Total (Category) | 120 (12.3%) | 853 (87.7%) |
| Total (Overall) | 2,067 (48.1%) | 2,233 (51.9%) |
Sales and Office Occupations
The most common Sales and Office occupations in Cordele are Sales & Related (458 | 10.6%), and Office & Administration (270 | 6.3%).

Sales and Office Occupations by Sex
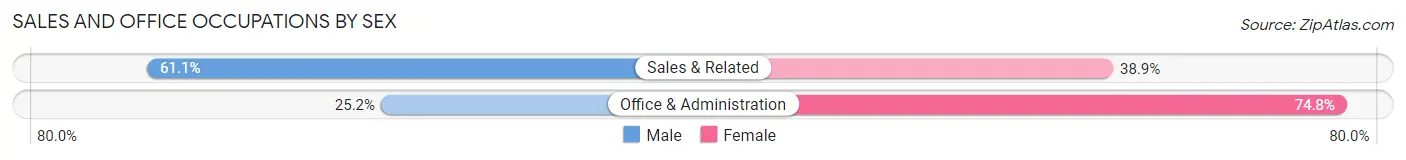
| Occupation | Male | Female |
| Sales & Related | 280 (61.1%) | 178 (38.9%) |
| Office & Administration | 68 (25.2%) | 202 (74.8%) |
| Total (Category) | 348 (47.8%) | 380 (52.2%) |
| Total (Overall) | 2,067 (48.1%) | 2,233 (51.9%) |
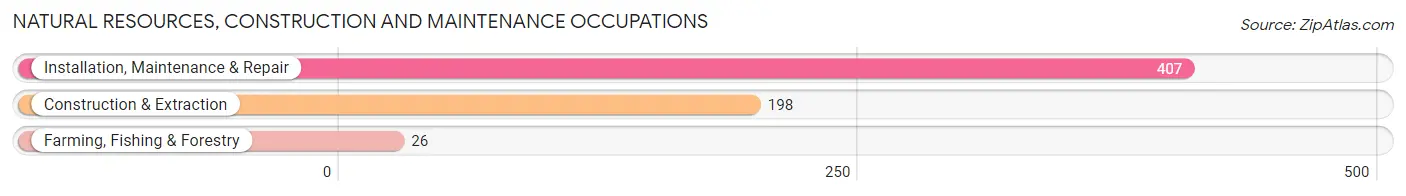
Natural Resources, Construction and Maintenance Occupations
The most common Natural Resources, Construction and Maintenance occupations in Cordele are Installation, Maintenance & Repair (407 | 9.5%), Construction & Extraction (198 | 4.6%), and Farming, Fishing & Forestry (26 | 0.6%).
Natural Resources, Construction and Maintenance Occupations by Sex
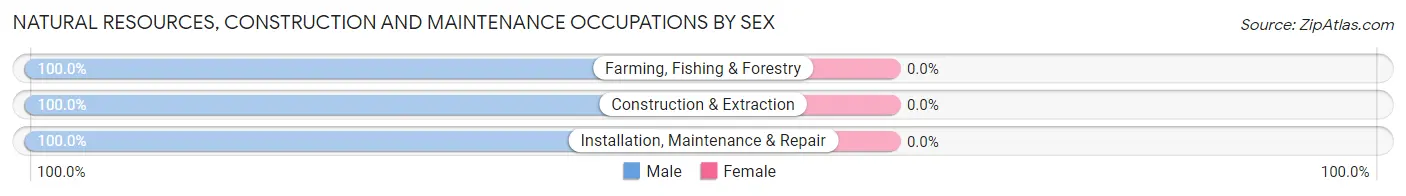
| Occupation | Male | Female |
| Farming, Fishing & Forestry | 26 (100.0%) | 0 (0.0%) |
| Construction & Extraction | 198 (100.0%) | 0 (0.0%) |
| Installation, Maintenance & Repair | 407 (100.0%) | 0 (0.0%) |
| Total (Category) | 631 (100.0%) | 0 (0.0%) |
| Total (Overall) | 2,067 (48.1%) | 2,233 (51.9%) |
Production, Transportation and Moving Occupations
The most common Production, Transportation and Moving occupations in Cordele are Material Moving (521 | 12.1%), Production (257 | 6.0%), and Transportation (217 | 5.1%).
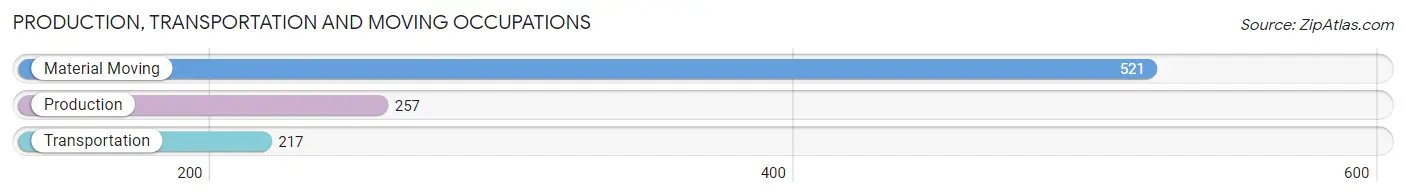
Production, Transportation and Moving Occupations by Sex
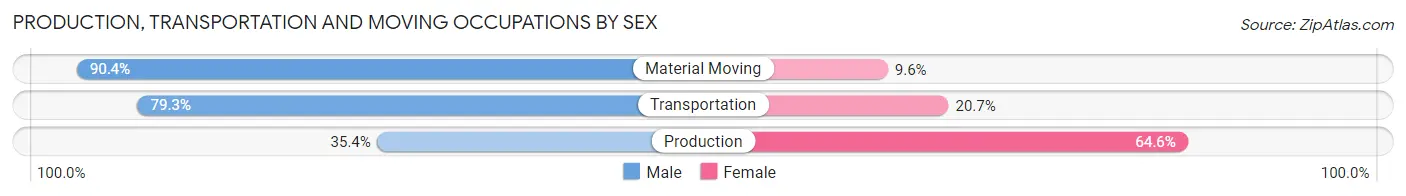
| Occupation | Male | Female |
| Production | 91 (35.4%) | 166 (64.6%) |
| Transportation | 172 (79.3%) | 45 (20.7%) |
| Material Moving | 471 (90.4%) | 50 (9.6%) |
| Total (Category) | 734 (73.8%) | 261 (26.2%) |
| Total (Overall) | 2,067 (48.1%) | 2,233 (51.9%) |
Employment Industries by Sex in Cordele
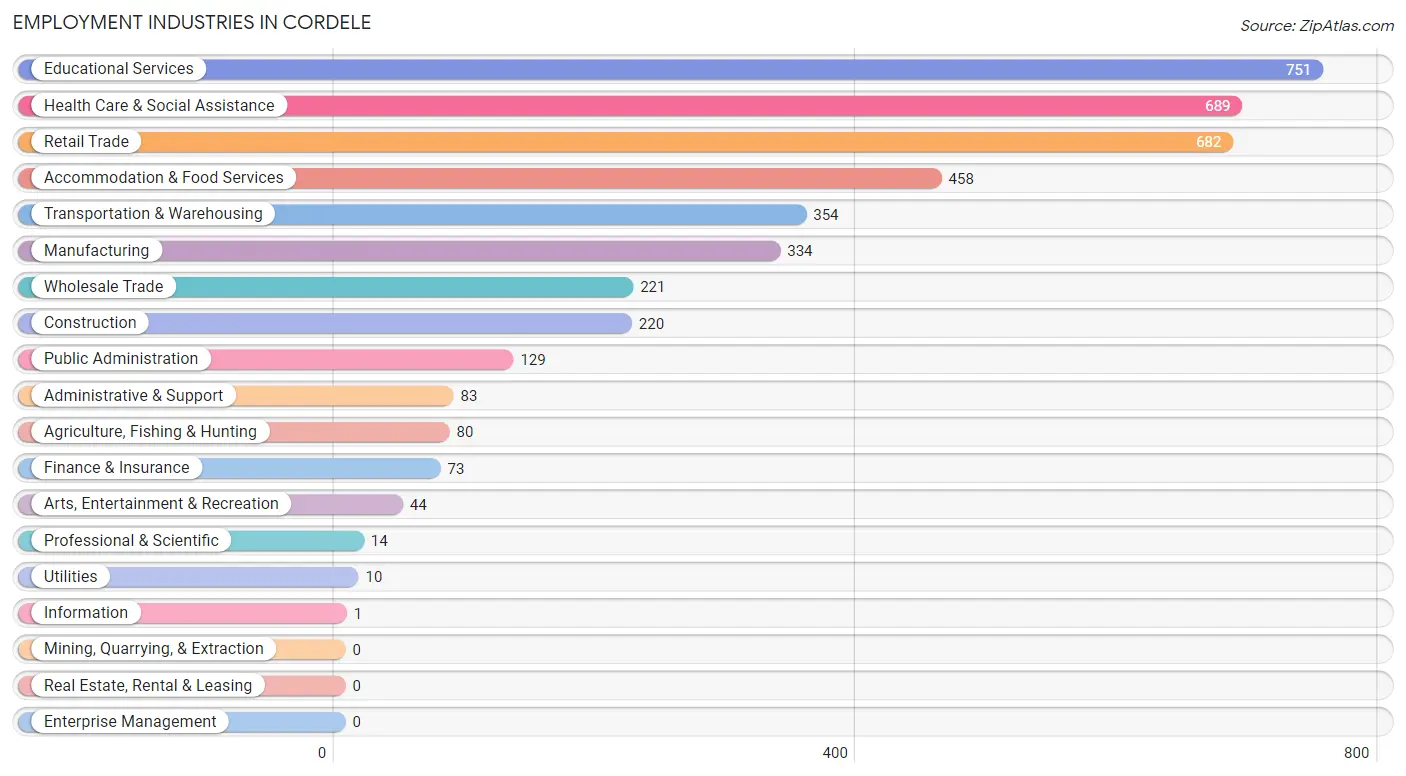
Employment Industries in Cordele
The major employment industries in Cordele include Educational Services (751 | 17.5%), Health Care & Social Assistance (689 | 16.0%), Retail Trade (682 | 15.9%), Accommodation & Food Services (458 | 10.6%), and Transportation & Warehousing (354 | 8.2%).
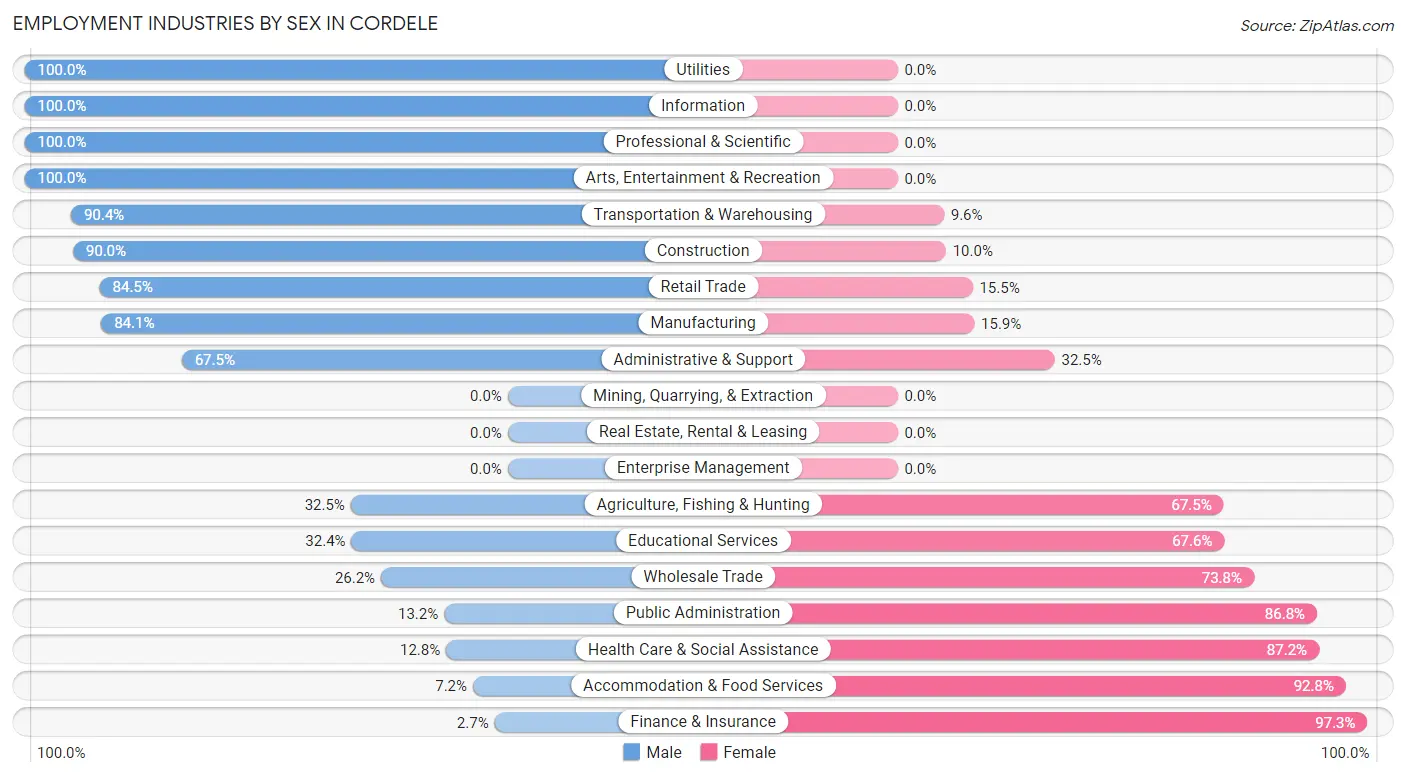
Employment Industries by Sex in Cordele
The Cordele industries that see more men than women are Utilities (100.0%), Information (100.0%), and Professional & Scientific (100.0%), whereas the industries that tend to have a higher number of women are Finance & Insurance (97.3%), Accommodation & Food Services (92.8%), and Health Care & Social Assistance (87.2%).
| Industry | Male | Female |
| Agriculture, Fishing & Hunting | 26 (32.5%) | 54 (67.5%) |
| Mining, Quarrying, & Extraction | 0 (0.0%) | 0 (0.0%) |
| Construction | 198 (90.0%) | 22 (10.0%) |
| Manufacturing | 281 (84.1%) | 53 (15.9%) |
| Wholesale Trade | 58 (26.2%) | 163 (73.8%) |
| Retail Trade | 576 (84.5%) | 106 (15.5%) |
| Transportation & Warehousing | 320 (90.4%) | 34 (9.6%) |
| Utilities | 10 (100.0%) | 0 (0.0%) |
| Information | 1 (100.0%) | 0 (0.0%) |
| Finance & Insurance | 2 (2.7%) | 71 (97.3%) |
| Real Estate, Rental & Leasing | 0 (0.0%) | 0 (0.0%) |
| Professional & Scientific | 14 (100.0%) | 0 (0.0%) |
| Enterprise Management | 0 (0.0%) | 0 (0.0%) |
| Administrative & Support | 56 (67.5%) | 27 (32.5%) |
| Educational Services | 243 (32.4%) | 508 (67.6%) |
| Health Care & Social Assistance | 88 (12.8%) | 601 (87.2%) |
| Arts, Entertainment & Recreation | 44 (100.0%) | 0 (0.0%) |
| Accommodation & Food Services | 33 (7.2%) | 425 (92.8%) |
| Public Administration | 17 (13.2%) | 112 (86.8%) |
| Total | 2,067 (48.1%) | 2,233 (51.9%) |
Education in Cordele
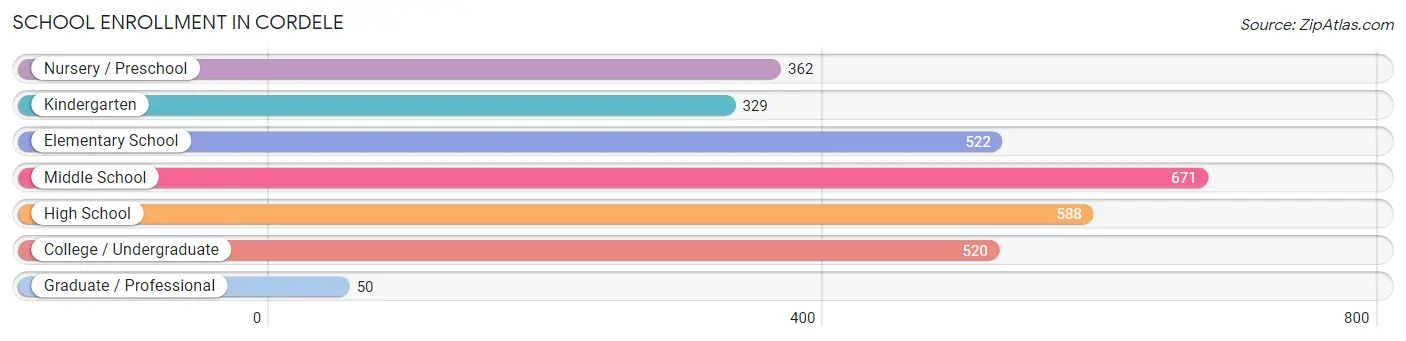
School Enrollment in Cordele
The most common levels of schooling among the 3,042 students in Cordele are middle school (671 | 22.1%), high school (588 | 19.3%), and elementary school (522 | 17.2%).
| School Level | # Students | % Students |
| Nursery / Preschool | 362 | 11.9% |
| Kindergarten | 329 | 10.8% |
| Elementary School | 522 | 17.2% |
| Middle School | 671 | 22.1% |
| High School | 588 | 19.3% |
| College / Undergraduate | 520 | 17.1% |
| Graduate / Professional | 50 | 1.6% |
| Total | 3,042 | 100.0% |
School Enrollment by Age by Funding Source in Cordele
Out of a total of 3,042 students who are enrolled in schools in Cordele, 192 (6.3%) attend a private institution, while the remaining 2,850 (93.7%) are enrolled in public schools. The age group of 35 years and over has the highest likelihood of being enrolled in private schools, with 100 (36.1% in the age bracket) enrolled. Conversely, the age group of 18 to 19 year olds has the lowest likelihood of being enrolled in a private school, with 143 (100.0% in the age bracket) attending a public institution.
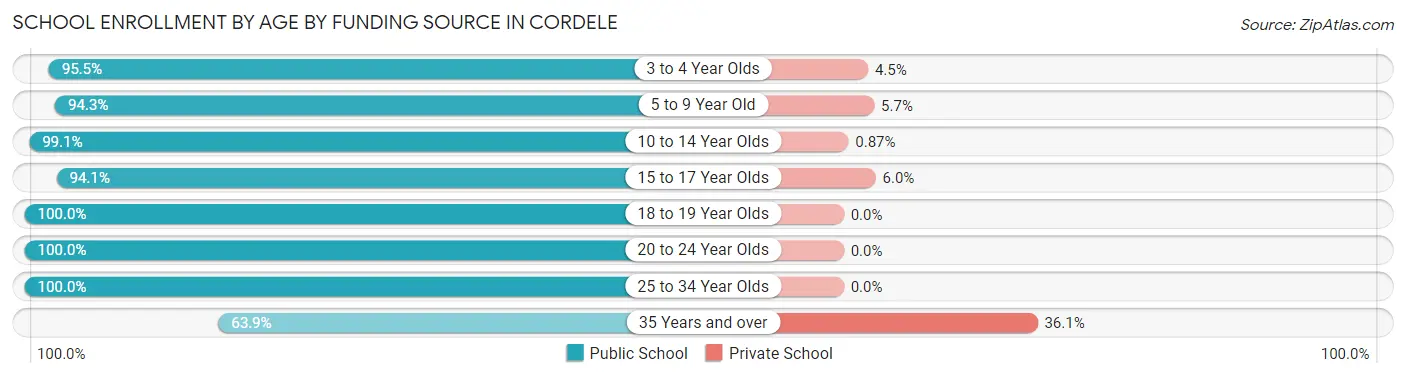
| Age Bracket | Public School | Private School |
| 3 to 4 Year Olds | 296 (95.5%) | 14 (4.5%) |
| 5 to 9 Year Old | 780 (94.3%) | 47 (5.7%) |
| 10 to 14 Year Olds | 800 (99.1%) | 7 (0.9%) |
| 15 to 17 Year Olds | 395 (94.1%) | 25 (5.9%) |
| 18 to 19 Year Olds | 143 (100.0%) | 0 (0.0%) |
| 20 to 24 Year Olds | 200 (100.0%) | 0 (0.0%) |
| 25 to 34 Year Olds | 58 (100.0%) | 0 (0.0%) |
| 35 Years and over | 177 (63.9%) | 100 (36.1%) |
| Total | 2,850 (93.7%) | 192 (6.3%) |
Educational Attainment by Field of Study in Cordele
Science & technology (214 | 21.6%), business (213 | 21.5%), education (191 | 19.3%), liberal arts & history (152 | 15.3%), and arts & humanities (88 | 8.9%) are the most common fields of study among 990 individuals in Cordele who have obtained a bachelor's degree or higher.
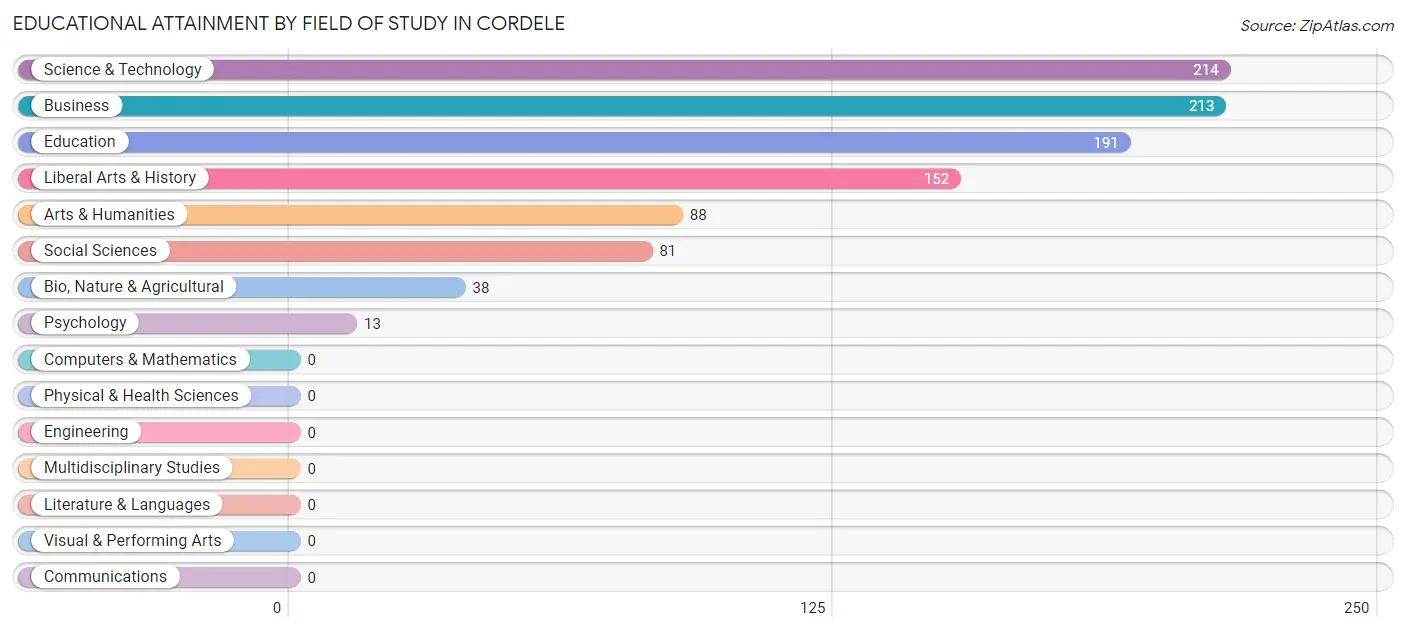
| Field of Study | # Graduates | % Graduates |
| Computers & Mathematics | 0 | 0.0% |
| Bio, Nature & Agricultural | 38 | 3.8% |
| Physical & Health Sciences | 0 | 0.0% |
| Psychology | 13 | 1.3% |
| Social Sciences | 81 | 8.2% |
| Engineering | 0 | 0.0% |
| Multidisciplinary Studies | 0 | 0.0% |
| Science & Technology | 214 | 21.6% |
| Business | 213 | 21.5% |
| Education | 191 | 19.3% |
| Literature & Languages | 0 | 0.0% |
| Liberal Arts & History | 152 | 15.3% |
| Visual & Performing Arts | 0 | 0.0% |
| Communications | 0 | 0.0% |
| Arts & Humanities | 88 | 8.9% |
| Total | 990 | 100.0% |
Transportation & Commute in Cordele
Vehicle Availability by Sex in Cordele
The most prevalent vehicle ownership categories in Cordele are males with 2 vehicles (741, accounting for 35.8%) and females with 2 vehicles (794, making up 36.8%).
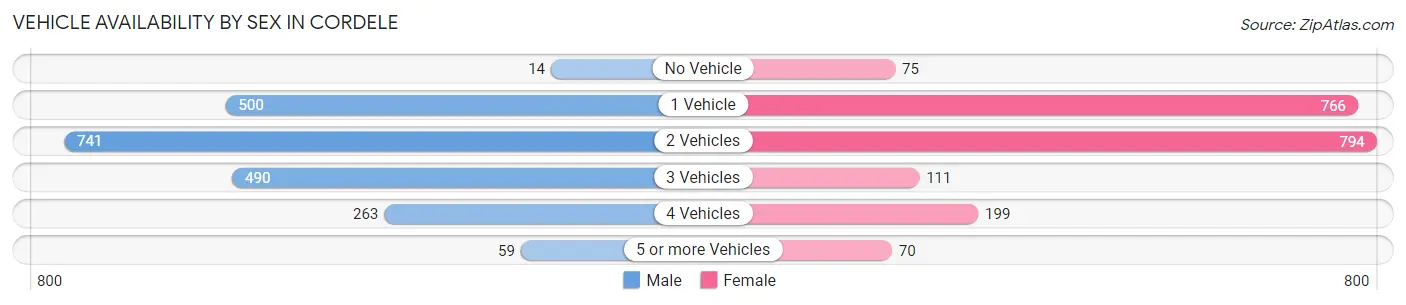
| Vehicles Available | Male | Female |
| No Vehicle | 14 (0.7%) | 75 (3.7%) |
| 1 Vehicle | 500 (24.2%) | 766 (38.0%) |
| 2 Vehicles | 741 (35.8%) | 794 (39.4%) |
| 3 Vehicles | 490 (23.7%) | 111 (5.5%) |
| 4 Vehicles | 263 (12.7%) | 199 (9.9%) |
| 5 or more Vehicles | 59 (2.9%) | 70 (3.5%) |
| Total | 2,067 (100.0%) | 2,015 (100.0%) |
Commute Time in Cordele
The most frequently occuring commute durations in Cordele are 10 to 14 minutes (880 commuters, 22.4%), 5 to 9 minutes (746 commuters, 19.0%), and 20 to 24 minutes (663 commuters, 16.8%).
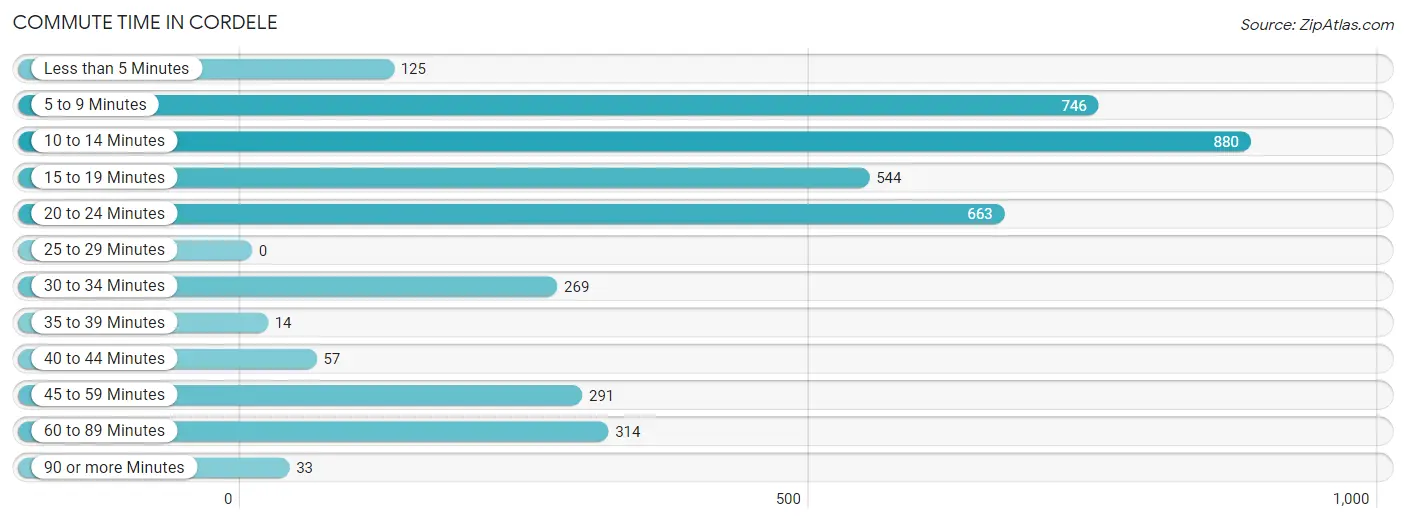
| Commute Time | # Commuters | % Commuters |
| Less than 5 Minutes | 125 | 3.2% |
| 5 to 9 Minutes | 746 | 19.0% |
| 10 to 14 Minutes | 880 | 22.4% |
| 15 to 19 Minutes | 544 | 13.8% |
| 20 to 24 Minutes | 663 | 16.8% |
| 25 to 29 Minutes | 0 | 0.0% |
| 30 to 34 Minutes | 269 | 6.8% |
| 35 to 39 Minutes | 14 | 0.4% |
| 40 to 44 Minutes | 57 | 1.5% |
| 45 to 59 Minutes | 291 | 7.4% |
| 60 to 89 Minutes | 314 | 8.0% |
| 90 or more Minutes | 33 | 0.8% |
Commute Time by Sex in Cordele
The most common commute times in Cordele are 5 to 9 minutes (463 commuters, 23.8%) for males and 10 to 14 minutes (534 commuters, 26.9%) for females.
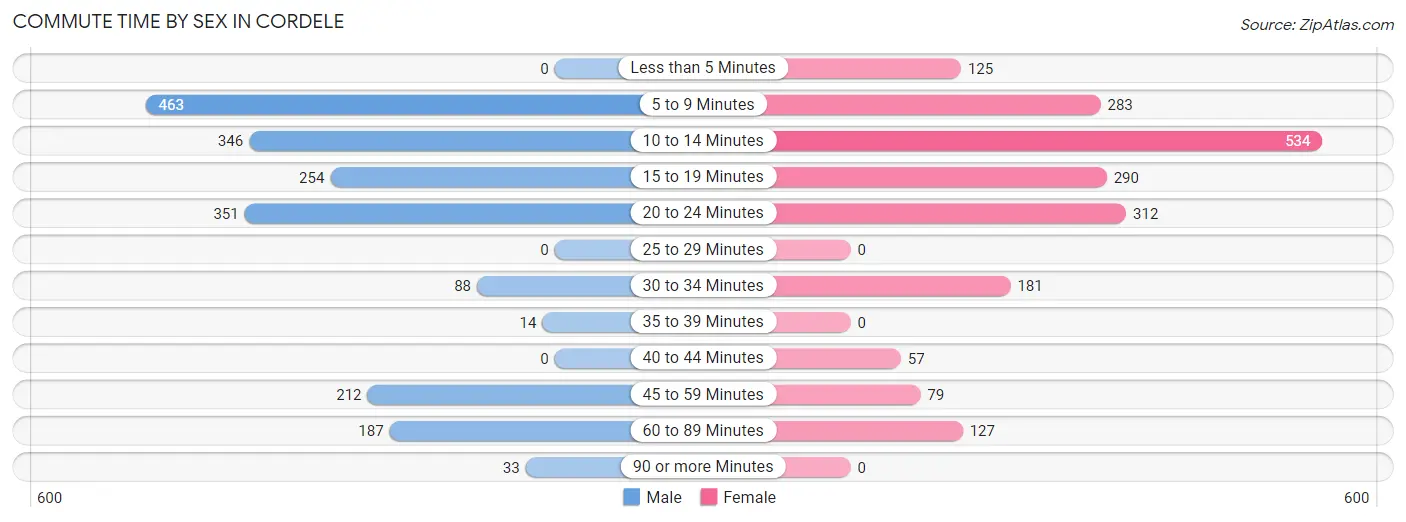
| Commute Time | Male | Female |
| Less than 5 Minutes | 0 (0.0%) | 125 (6.3%) |
| 5 to 9 Minutes | 463 (23.8%) | 283 (14.2%) |
| 10 to 14 Minutes | 346 (17.8%) | 534 (26.9%) |
| 15 to 19 Minutes | 254 (13.0%) | 290 (14.6%) |
| 20 to 24 Minutes | 351 (18.0%) | 312 (15.7%) |
| 25 to 29 Minutes | 0 (0.0%) | 0 (0.0%) |
| 30 to 34 Minutes | 88 (4.5%) | 181 (9.1%) |
| 35 to 39 Minutes | 14 (0.7%) | 0 (0.0%) |
| 40 to 44 Minutes | 0 (0.0%) | 57 (2.9%) |
| 45 to 59 Minutes | 212 (10.9%) | 79 (4.0%) |
| 60 to 89 Minutes | 187 (9.6%) | 127 (6.4%) |
| 90 or more Minutes | 33 (1.7%) | 0 (0.0%) |
Time of Departure to Work by Sex in Cordele
The most frequent times of departure to work in Cordele are 7:00 AM to 7:29 AM (363, 18.6%) for males and 8:30 AM to 8:59 AM (402, 20.2%) for females.
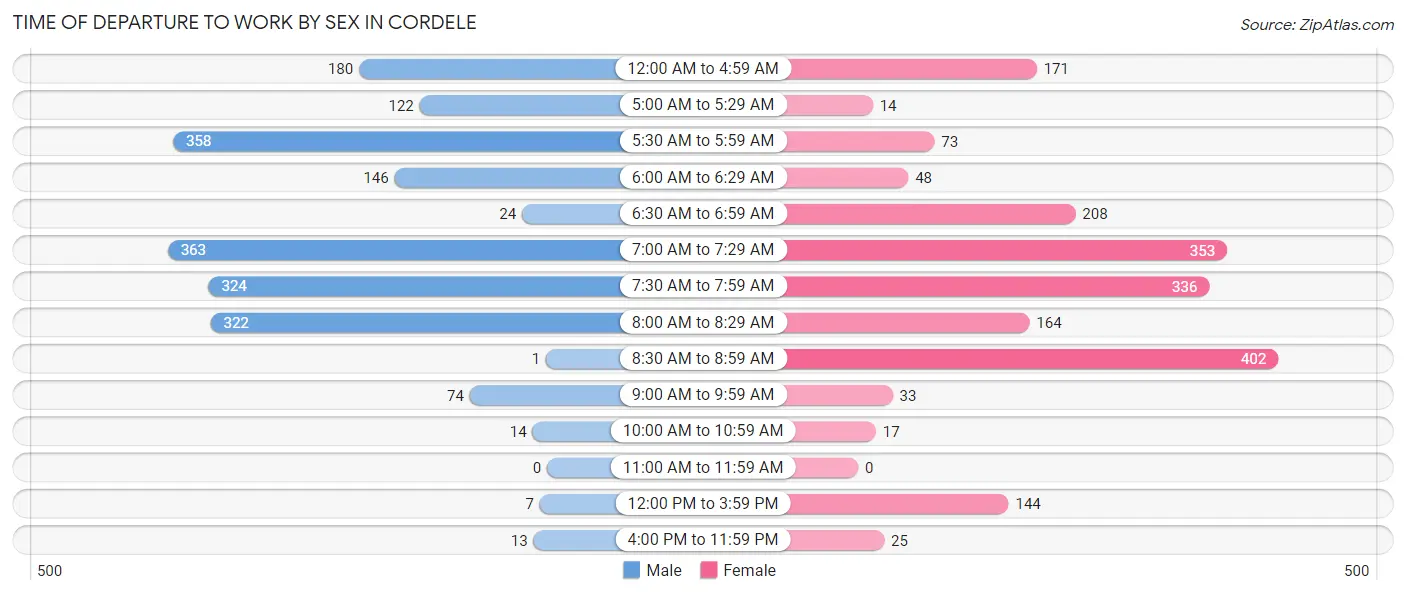
| Time of Departure | Male | Female |
| 12:00 AM to 4:59 AM | 180 (9.2%) | 171 (8.6%) |
| 5:00 AM to 5:29 AM | 122 (6.3%) | 14 (0.7%) |
| 5:30 AM to 5:59 AM | 358 (18.4%) | 73 (3.7%) |
| 6:00 AM to 6:29 AM | 146 (7.5%) | 48 (2.4%) |
| 6:30 AM to 6:59 AM | 24 (1.2%) | 208 (10.5%) |
| 7:00 AM to 7:29 AM | 363 (18.6%) | 353 (17.8%) |
| 7:30 AM to 7:59 AM | 324 (16.6%) | 336 (16.9%) |
| 8:00 AM to 8:29 AM | 322 (16.5%) | 164 (8.3%) |
| 8:30 AM to 8:59 AM | 1 (0.1%) | 402 (20.2%) |
| 9:00 AM to 9:59 AM | 74 (3.8%) | 33 (1.7%) |
| 10:00 AM to 10:59 AM | 14 (0.7%) | 17 (0.9%) |
| 11:00 AM to 11:59 AM | 0 (0.0%) | 0 (0.0%) |
| 12:00 PM to 3:59 PM | 7 (0.4%) | 144 (7.2%) |
| 4:00 PM to 11:59 PM | 13 (0.7%) | 25 (1.3%) |
| Total | 1,948 (100.0%) | 1,988 (100.0%) |
Housing Occupancy in Cordele
Occupancy by Ownership in Cordele
Of the total 4,039 dwellings in Cordele, owner-occupied units account for 1,519 (37.6%), while renter-occupied units make up 2,520 (62.4%).
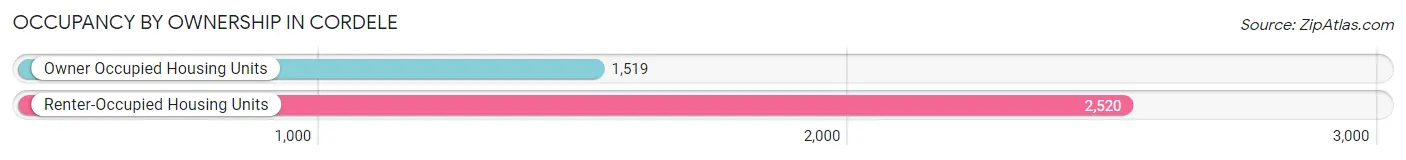
| Occupancy | # Housing Units | % Housing Units |
| Owner Occupied Housing Units | 1,519 | 37.6% |
| Renter-Occupied Housing Units | 2,520 | 62.4% |
| Total Occupied Housing Units | 4,039 | 100.0% |
Occupancy by Household Size in Cordele
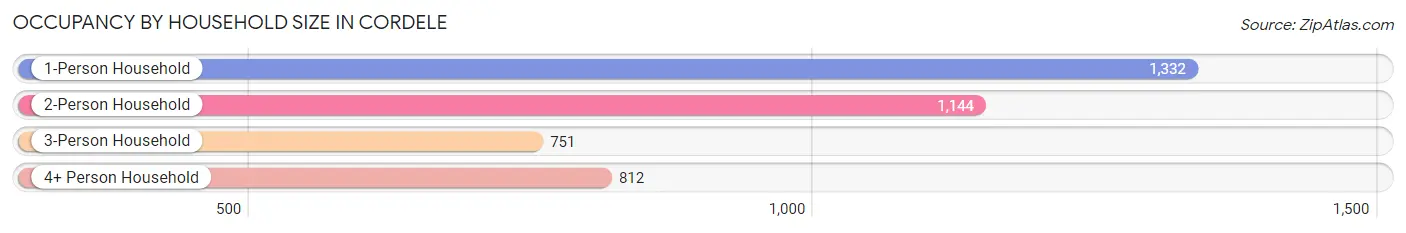
| Household Size | # Housing Units | % Housing Units |
| 1-Person Household | 1,332 | 33.0% |
| 2-Person Household | 1,144 | 28.3% |
| 3-Person Household | 751 | 18.6% |
| 4+ Person Household | 812 | 20.1% |
| Total Housing Units | 4,039 | 100.0% |
Occupancy by Ownership by Household Size in Cordele
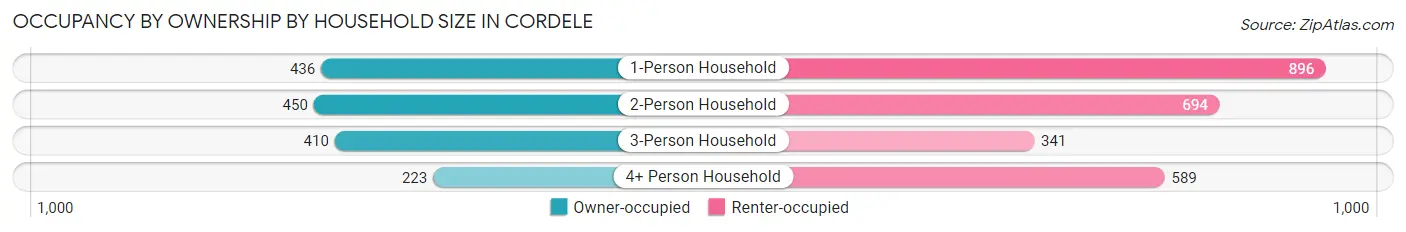
| Household Size | Owner-occupied | Renter-occupied |
| 1-Person Household | 436 (32.7%) | 896 (67.3%) |
| 2-Person Household | 450 (39.3%) | 694 (60.7%) |
| 3-Person Household | 410 (54.6%) | 341 (45.4%) |
| 4+ Person Household | 223 (27.5%) | 589 (72.5%) |
| Total Housing Units | 1,519 (37.6%) | 2,520 (62.4%) |
Occupancy by Educational Attainment in Cordele
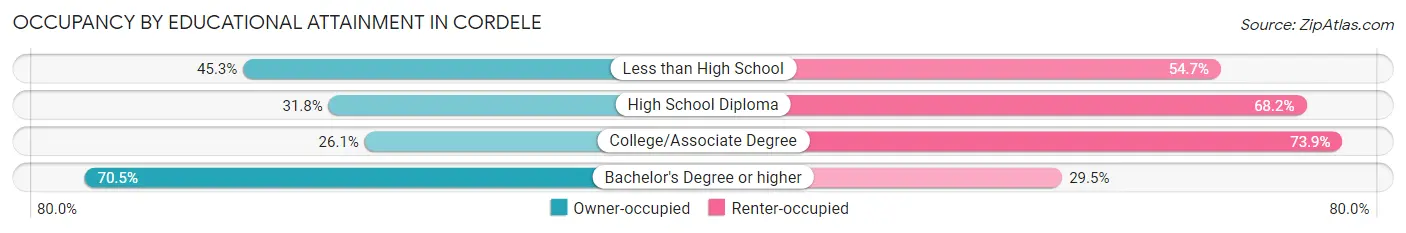
| Household Size | Owner-occupied | Renter-occupied |
| Less than High School | 418 (45.3%) | 504 (54.7%) |
| High School Diploma | 399 (31.8%) | 856 (68.2%) |
| College/Associate Degree | 358 (26.1%) | 1,016 (73.9%) |
| Bachelor's Degree or higher | 344 (70.5%) | 144 (29.5%) |
Occupancy by Age of Householder in Cordele
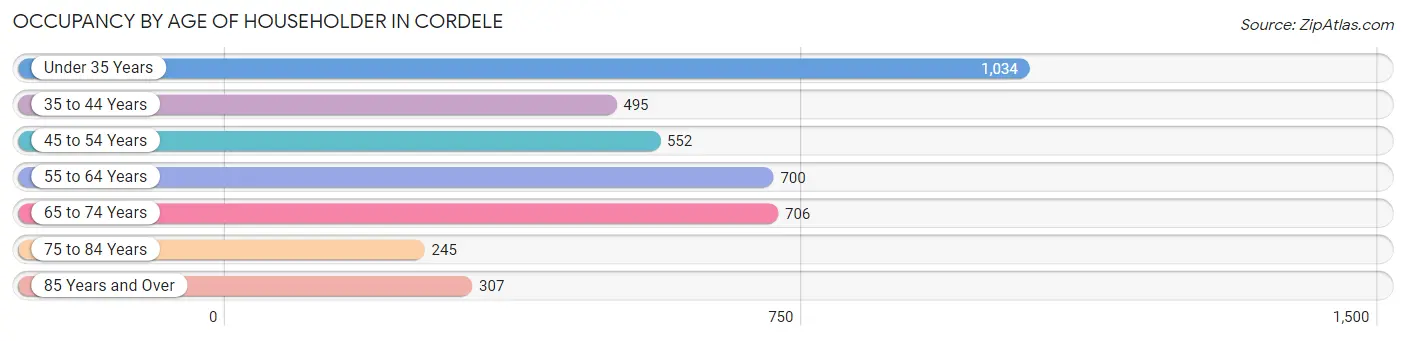
| Age Bracket | # Households | % Households |
| Under 35 Years | 1,034 | 25.6% |
| 35 to 44 Years | 495 | 12.3% |
| 45 to 54 Years | 552 | 13.7% |
| 55 to 64 Years | 700 | 17.3% |
| 65 to 74 Years | 706 | 17.5% |
| 75 to 84 Years | 245 | 6.1% |
| 85 Years and Over | 307 | 7.6% |
| Total | 4,039 | 100.0% |
Housing Finances in Cordele
Median Income by Occupancy in Cordele
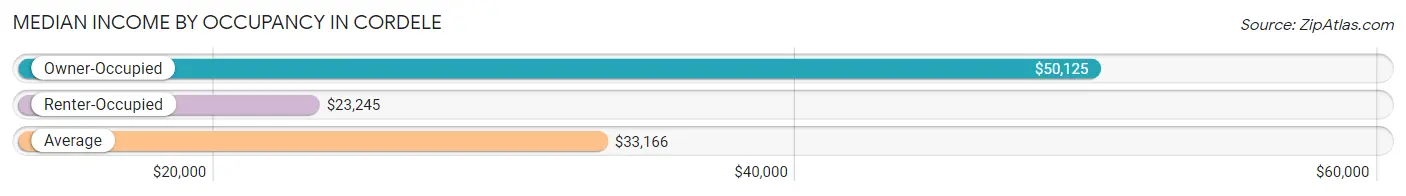
| Occupancy Type | # Households | Median Income |
| Owner-Occupied | 1,519 (37.6%) | $50,125 |
| Renter-Occupied | 2,520 (62.4%) | $23,245 |
| Average | 4,039 (100.0%) | $33,166 |
Occupancy by Householder Income Bracket in Cordele
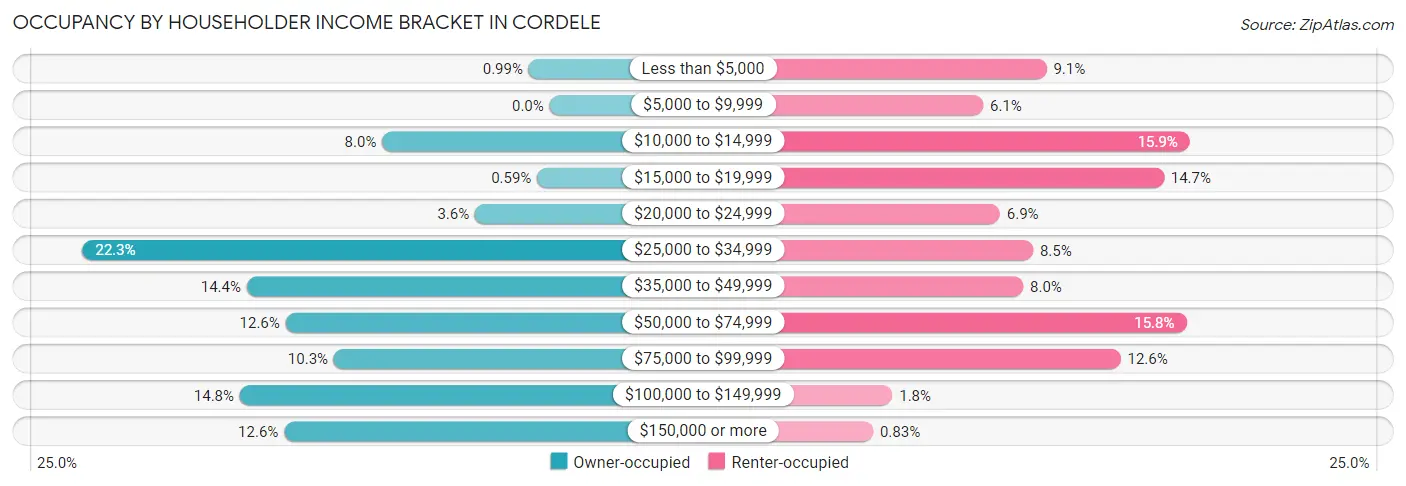
| Income Bracket | Owner-occupied | Renter-occupied |
| Less than $5,000 | 15 (1.0%) | 229 (9.1%) |
| $5,000 to $9,999 | 0 (0.0%) | 153 (6.1%) |
| $10,000 to $14,999 | 121 (8.0%) | 401 (15.9%) |
| $15,000 to $19,999 | 9 (0.6%) | 370 (14.7%) |
| $20,000 to $24,999 | 54 (3.5%) | 173 (6.9%) |
| $25,000 to $34,999 | 338 (22.3%) | 213 (8.5%) |
| $35,000 to $49,999 | 219 (14.4%) | 201 (8.0%) |
| $50,000 to $74,999 | 191 (12.6%) | 397 (15.8%) |
| $75,000 to $99,999 | 156 (10.3%) | 318 (12.6%) |
| $100,000 to $149,999 | 224 (14.7%) | 44 (1.8%) |
| $150,000 or more | 192 (12.6%) | 21 (0.8%) |
| Total | 1,519 (100.0%) | 2,520 (100.0%) |
Monthly Housing Cost Tiers in Cordele
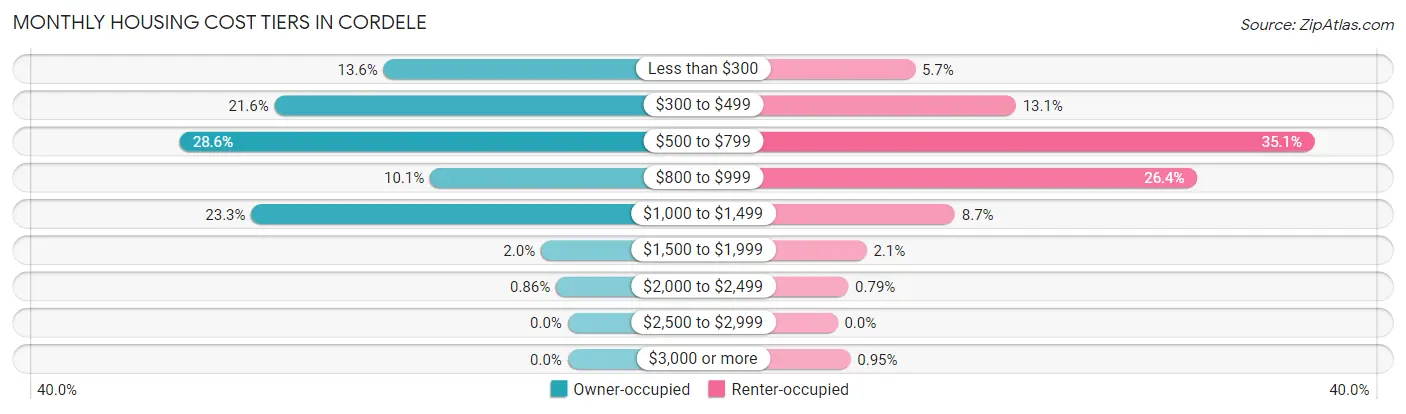
| Monthly Cost | Owner-occupied | Renter-occupied |
| Less than $300 | 206 (13.6%) | 144 (5.7%) |
| $300 to $499 | 328 (21.6%) | 331 (13.1%) |
| $500 to $799 | 434 (28.6%) | 884 (35.1%) |
| $800 to $999 | 154 (10.1%) | 666 (26.4%) |
| $1,000 to $1,499 | 354 (23.3%) | 218 (8.6%) |
| $1,500 to $1,999 | 30 (2.0%) | 54 (2.1%) |
| $2,000 to $2,499 | 13 (0.9%) | 20 (0.8%) |
| $2,500 to $2,999 | 0 (0.0%) | 0 (0.0%) |
| $3,000 or more | 0 (0.0%) | 24 (0.9%) |
| Total | 1,519 (100.0%) | 2,520 (100.0%) |
Physical Housing Characteristics in Cordele
Housing Structures in Cordele
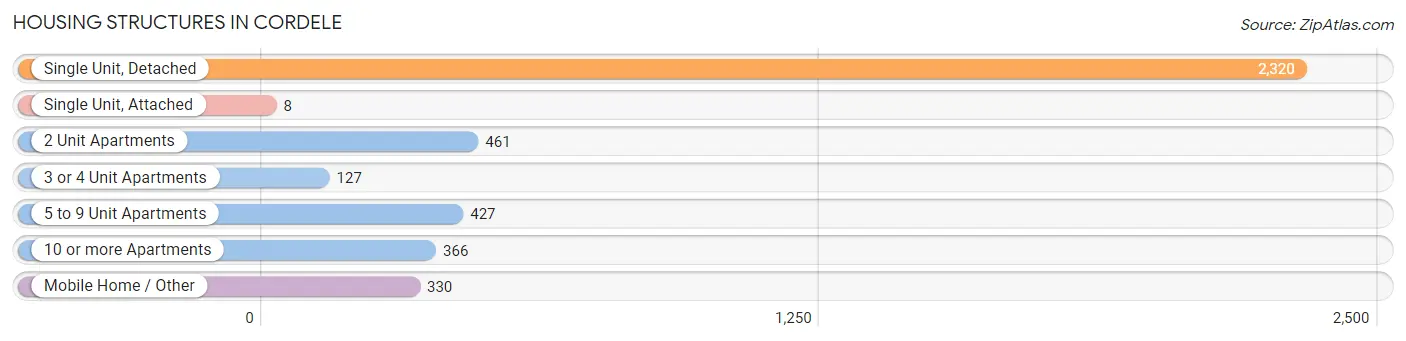
| Structure Type | # Housing Units | % Housing Units |
| Single Unit, Detached | 2,320 | 57.4% |
| Single Unit, Attached | 8 | 0.2% |
| 2 Unit Apartments | 461 | 11.4% |
| 3 or 4 Unit Apartments | 127 | 3.1% |
| 5 to 9 Unit Apartments | 427 | 10.6% |
| 10 or more Apartments | 366 | 9.1% |
| Mobile Home / Other | 330 | 8.2% |
| Total | 4,039 | 100.0% |
Housing Structures by Occupancy in Cordele
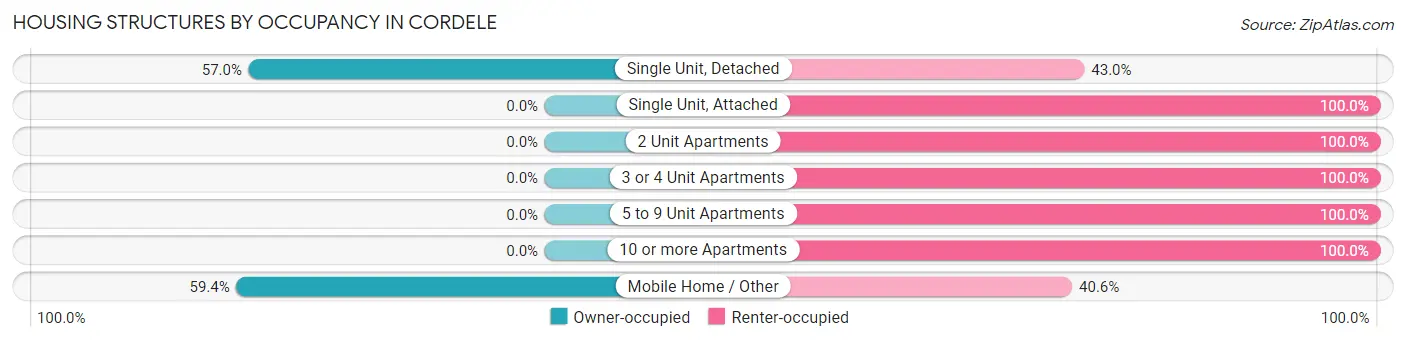
| Structure Type | Owner-occupied | Renter-occupied |
| Single Unit, Detached | 1,323 (57.0%) | 997 (43.0%) |
| Single Unit, Attached | 0 (0.0%) | 8 (100.0%) |
| 2 Unit Apartments | 0 (0.0%) | 461 (100.0%) |
| 3 or 4 Unit Apartments | 0 (0.0%) | 127 (100.0%) |
| 5 to 9 Unit Apartments | 0 (0.0%) | 427 (100.0%) |
| 10 or more Apartments | 0 (0.0%) | 366 (100.0%) |
| Mobile Home / Other | 196 (59.4%) | 134 (40.6%) |
| Total | 1,519 (37.6%) | 2,520 (62.4%) |
Housing Structures by Number of Rooms in Cordele
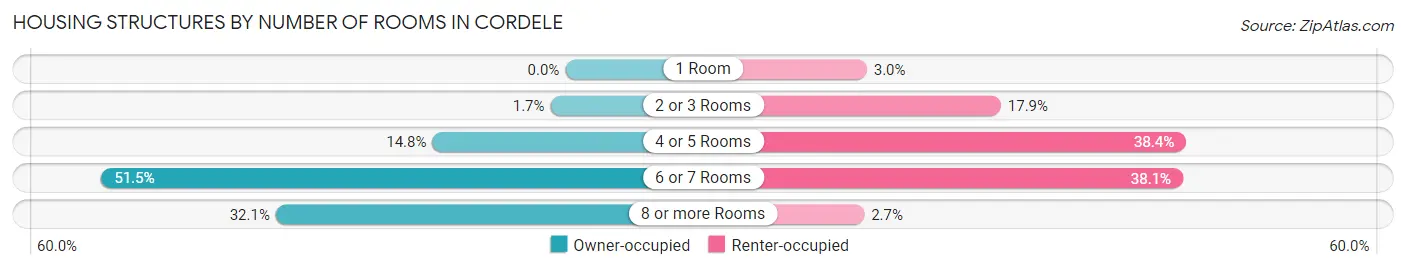
| Number of Rooms | Owner-occupied | Renter-occupied |
| 1 Room | 0 (0.0%) | 75 (3.0%) |
| 2 or 3 Rooms | 25 (1.7%) | 450 (17.9%) |
| 4 or 5 Rooms | 224 (14.7%) | 968 (38.4%) |
| 6 or 7 Rooms | 782 (51.5%) | 959 (38.1%) |
| 8 or more Rooms | 488 (32.1%) | 68 (2.7%) |
| Total | 1,519 (100.0%) | 2,520 (100.0%) |
Housing Structure by Heating Type in Cordele
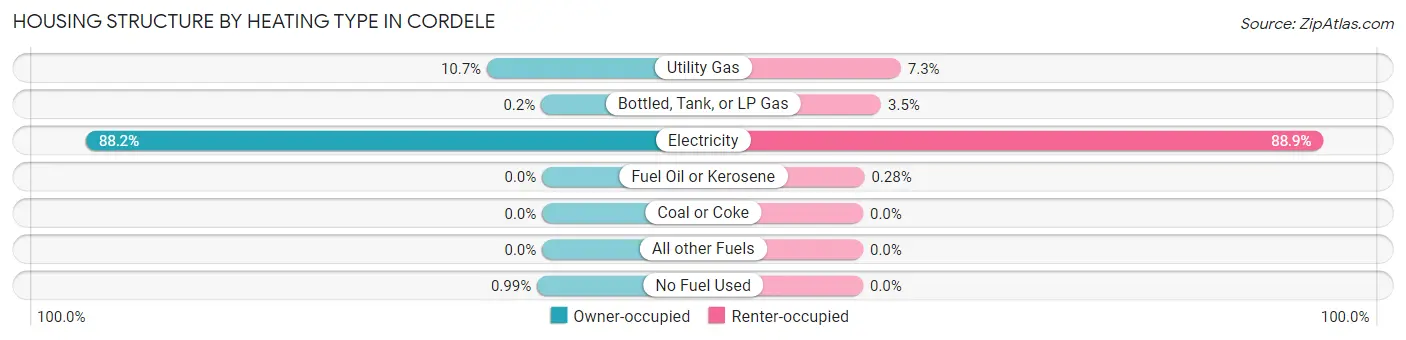
| Heating Type | Owner-occupied | Renter-occupied |
| Utility Gas | 162 (10.7%) | 184 (7.3%) |
| Bottled, Tank, or LP Gas | 3 (0.2%) | 88 (3.5%) |
| Electricity | 1,339 (88.1%) | 2,241 (88.9%) |
| Fuel Oil or Kerosene | 0 (0.0%) | 7 (0.3%) |
| Coal or Coke | 0 (0.0%) | 0 (0.0%) |
| All other Fuels | 0 (0.0%) | 0 (0.0%) |
| No Fuel Used | 15 (1.0%) | 0 (0.0%) |
| Total | 1,519 (100.0%) | 2,520 (100.0%) |
Household Vehicle Usage in Cordele
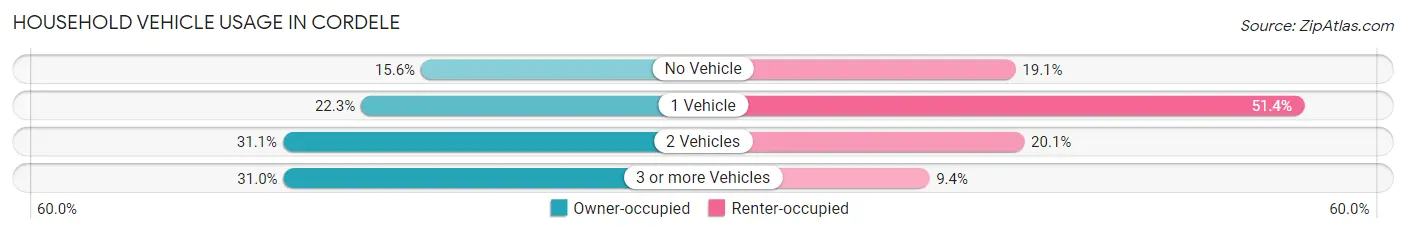
| Vehicles per Household | Owner-occupied | Renter-occupied |
| No Vehicle | 237 (15.6%) | 481 (19.1%) |
| 1 Vehicle | 339 (22.3%) | 1,295 (51.4%) |
| 2 Vehicles | 472 (31.1%) | 506 (20.1%) |
| 3 or more Vehicles | 471 (31.0%) | 238 (9.4%) |
| Total | 1,519 (100.0%) | 2,520 (100.0%) |
Real Estate & Mortgages in Cordele
Real Estate and Mortgage Overview in Cordele
| Characteristic | Without Mortgage | With Mortgage |
| Housing Units | 942 | 577 |
| Median Property Value | $59,000 | $103,100 |
| Median Household Income | $35,132 | $52 |
| Monthly Housing Costs | $461 | $0 |
| Real Estate Taxes | $782 | $7 |
Property Value by Mortgage Status in Cordele
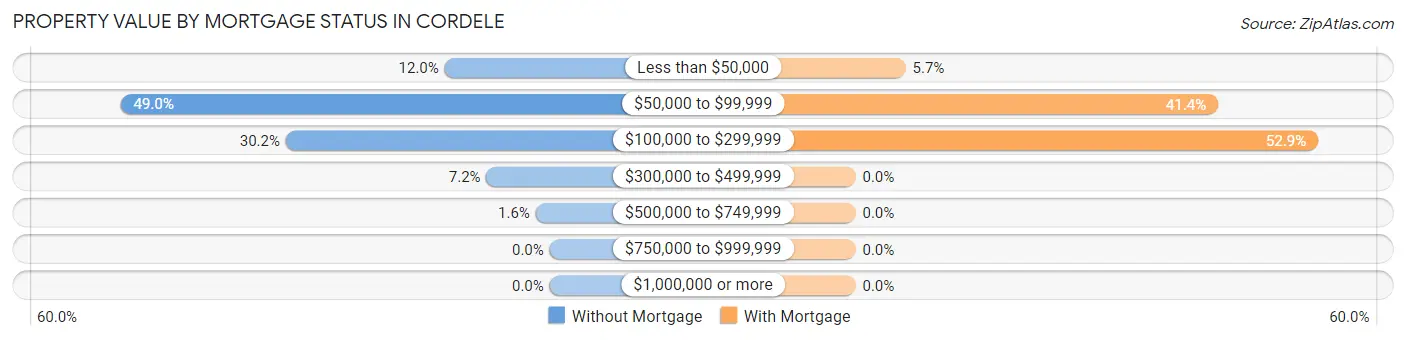
| Property Value | Without Mortgage | With Mortgage |
| Less than $50,000 | 113 (12.0%) | 33 (5.7%) |
| $50,000 to $99,999 | 462 (49.0%) | 239 (41.4%) |
| $100,000 to $299,999 | 284 (30.1%) | 305 (52.9%) |
| $300,000 to $499,999 | 68 (7.2%) | 0 (0.0%) |
| $500,000 to $749,999 | 15 (1.6%) | 0 (0.0%) |
| $750,000 to $999,999 | 0 (0.0%) | 0 (0.0%) |
| $1,000,000 or more | 0 (0.0%) | 0 (0.0%) |
| Total | 942 (100.0%) | 577 (100.0%) |
Household Income by Mortgage Status in Cordele
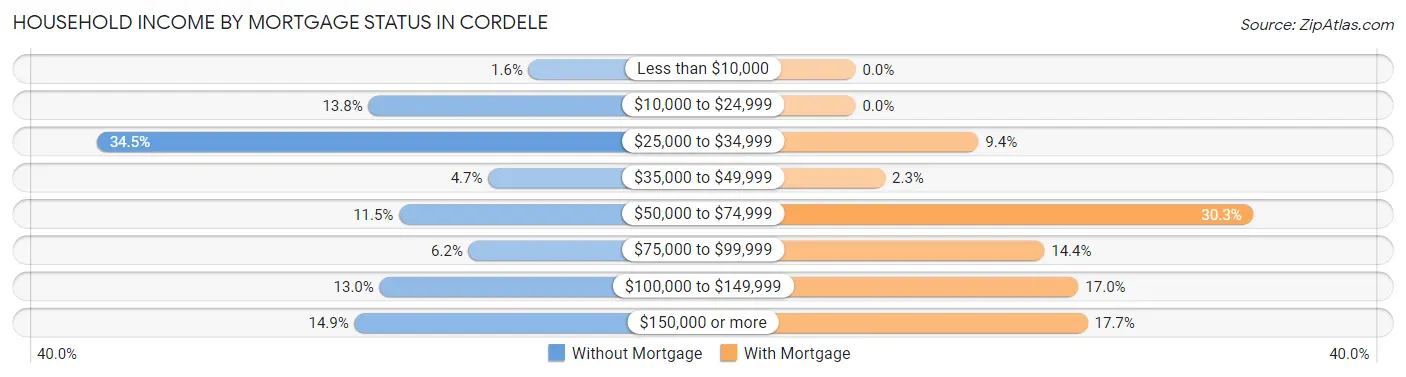
| Household Income | Without Mortgage | With Mortgage |
| Less than $10,000 | 15 (1.6%) | 0 (0.0%) |
| $10,000 to $24,999 | 130 (13.8%) | 0 (0.0%) |
| $25,000 to $34,999 | 325 (34.5%) | 54 (9.4%) |
| $35,000 to $49,999 | 44 (4.7%) | 13 (2.2%) |
| $50,000 to $74,999 | 108 (11.5%) | 175 (30.3%) |
| $75,000 to $99,999 | 58 (6.2%) | 83 (14.4%) |
| $100,000 to $149,999 | 122 (13.0%) | 98 (17.0%) |
| $150,000 or more | 140 (14.9%) | 102 (17.7%) |
| Total | 942 (100.0%) | 577 (100.0%) |
Property Value to Household Income Ratio in Cordele
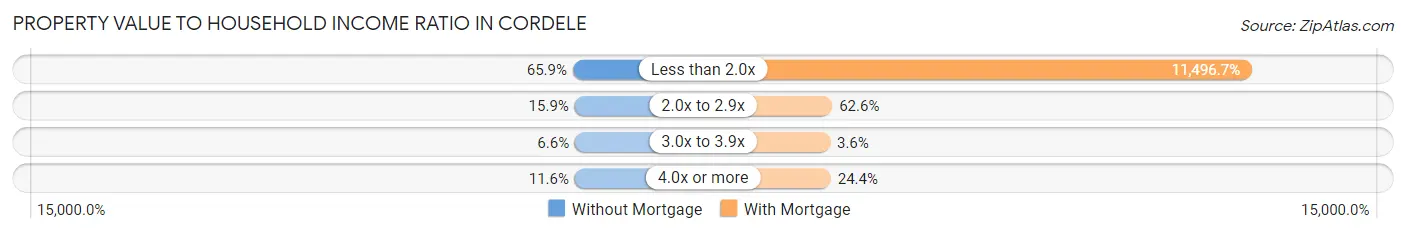
| Value-to-Income Ratio | Without Mortgage | With Mortgage |
| Less than 2.0x | 621 (65.9%) | 66,336 (11,496.7%) |
| 2.0x to 2.9x | 150 (15.9%) | 361 (62.6%) |
| 3.0x to 3.9x | 62 (6.6%) | 21 (3.6%) |
| 4.0x or more | 109 (11.6%) | 141 (24.4%) |
| Total | 942 (100.0%) | 577 (100.0%) |
Real Estate Taxes by Mortgage Status in Cordele
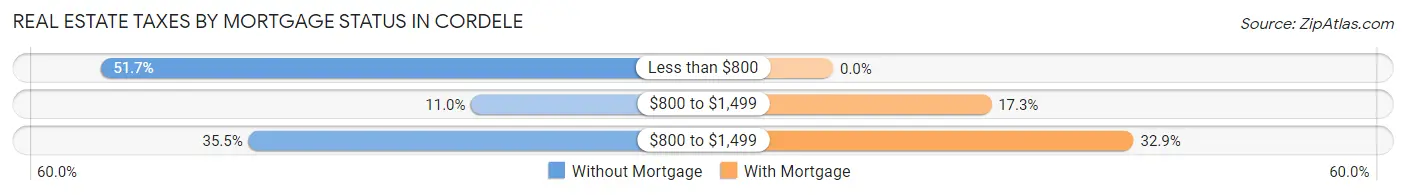
| Property Taxes | Without Mortgage | With Mortgage |
| Less than $800 | 487 (51.7%) | 0 (0.0%) |
| $800 to $1,499 | 104 (11.0%) | 100 (17.3%) |
| $800 to $1,499 | 334 (35.5%) | 190 (32.9%) |
| Total | 942 (100.0%) | 577 (100.0%) |
Health & Disability in Cordele
Health Insurance Coverage by Age in Cordele
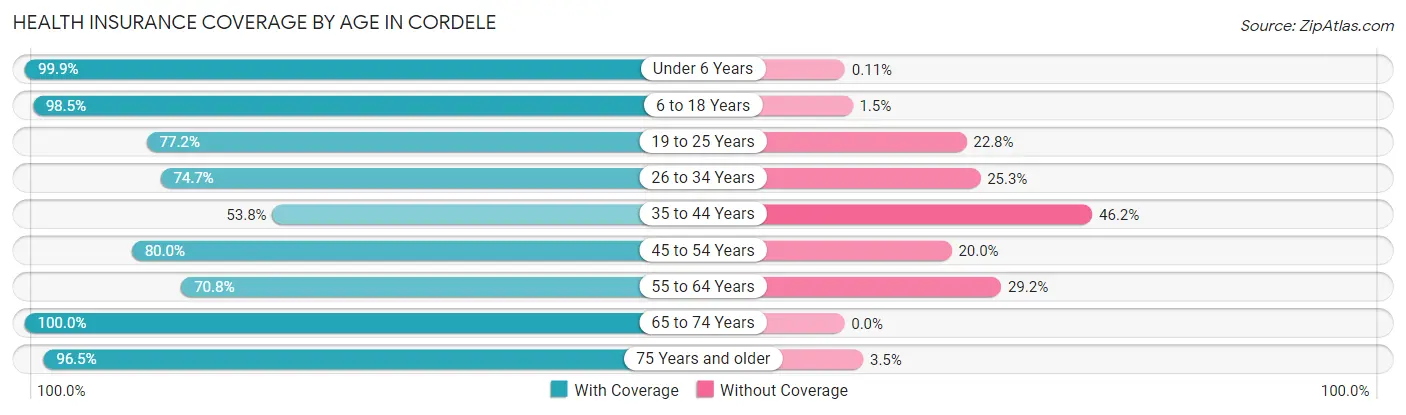
| Age Bracket | With Coverage | Without Coverage |
| Under 6 Years | 911 (99.9%) | 1 (0.1%) |
| 6 to 18 Years | 1,885 (98.5%) | 29 (1.5%) |
| 19 to 25 Years | 862 (77.2%) | 254 (22.8%) |
| 26 to 34 Years | 760 (74.7%) | 258 (25.3%) |
| 35 to 44 Years | 723 (53.8%) | 621 (46.2%) |
| 45 to 54 Years | 813 (80.0%) | 203 (20.0%) |
| 55 to 64 Years | 855 (70.8%) | 353 (29.2%) |
| 65 to 74 Years | 913 (100.0%) | 0 (0.0%) |
| 75 Years and older | 606 (96.5%) | 22 (3.5%) |
| Total | 8,328 (82.7%) | 1,741 (17.3%) |
Health Insurance Coverage by Citizenship Status in Cordele
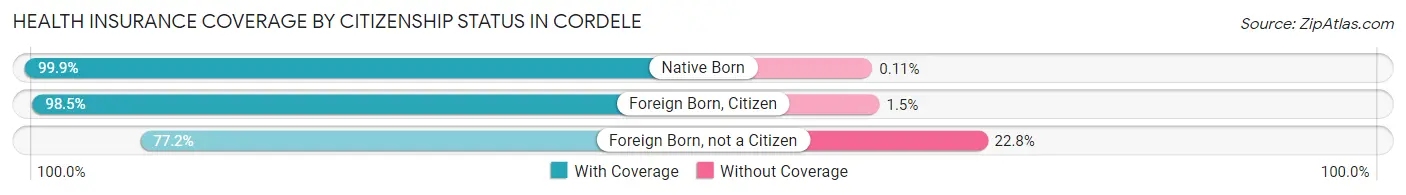
| Citizenship Status | With Coverage | Without Coverage |
| Native Born | 911 (99.9%) | 1 (0.1%) |
| Foreign Born, Citizen | 1,885 (98.5%) | 29 (1.5%) |
| Foreign Born, not a Citizen | 862 (77.2%) | 254 (22.8%) |
Health Insurance Coverage by Household Income in Cordele
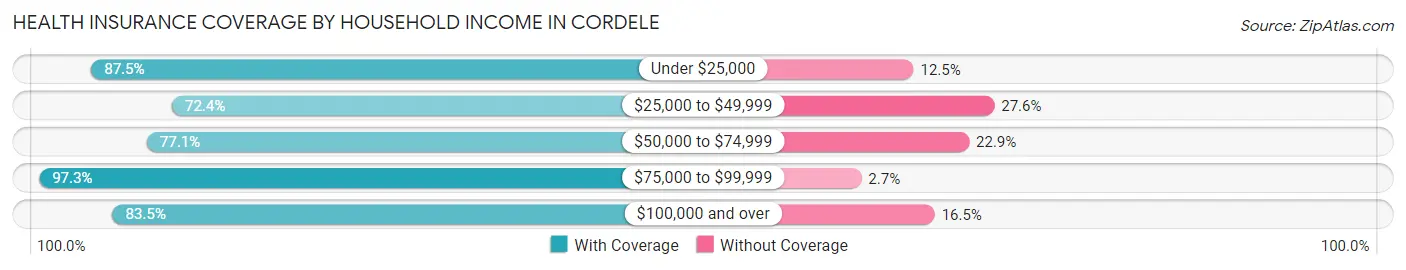
| Household Income | With Coverage | Without Coverage |
| Under $25,000 | 2,861 (87.5%) | 409 (12.5%) |
| $25,000 to $49,999 | 1,768 (72.4%) | 675 (27.6%) |
| $50,000 to $74,999 | 1,248 (77.1%) | 371 (22.9%) |
| $75,000 to $99,999 | 1,170 (97.3%) | 33 (2.7%) |
| $100,000 and over | 1,278 (83.5%) | 252 (16.5%) |
Public vs Private Health Insurance Coverage by Age in Cordele
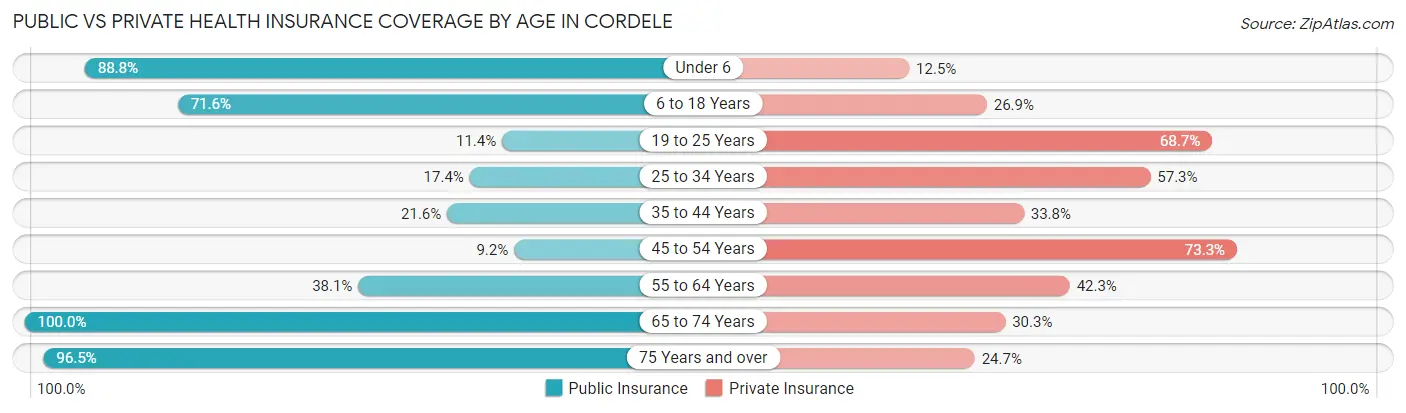
| Age Bracket | Public Insurance | Private Insurance |
| Under 6 | 810 (88.8%) | 114 (12.5%) |
| 6 to 18 Years | 1,370 (71.6%) | 515 (26.9%) |
| 19 to 25 Years | 127 (11.4%) | 767 (68.7%) |
| 25 to 34 Years | 177 (17.4%) | 583 (57.3%) |
| 35 to 44 Years | 290 (21.6%) | 454 (33.8%) |
| 45 to 54 Years | 93 (9.1%) | 745 (73.3%) |
| 55 to 64 Years | 460 (38.1%) | 511 (42.3%) |
| 65 to 74 Years | 913 (100.0%) | 277 (30.3%) |
| 75 Years and over | 606 (96.5%) | 155 (24.7%) |
| Total | 4,846 (48.1%) | 4,121 (40.9%) |
Disability Status by Sex by Age in Cordele
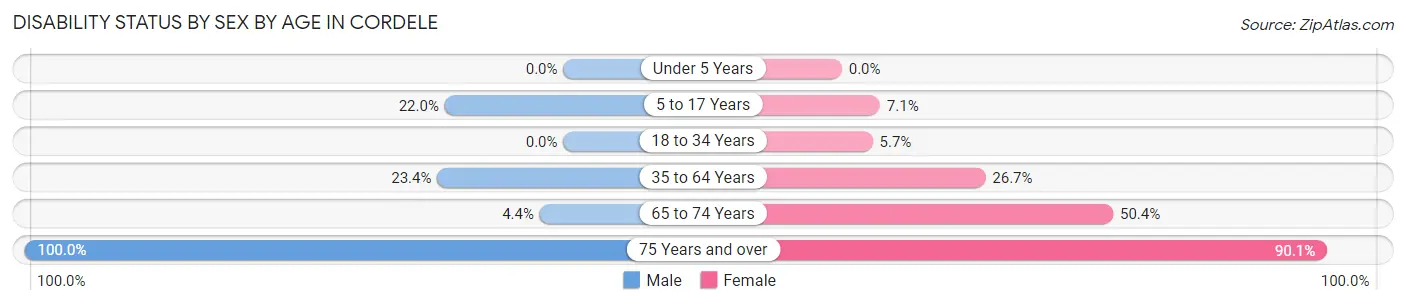
| Age Bracket | Male | Female |
| Under 5 Years | 0 (0.0%) | 0 (0.0%) |
| 5 to 17 Years | 225 (22.0%) | 73 (7.1%) |
| 18 to 34 Years | 0 (0.0%) | 73 (5.7%) |
| 35 to 64 Years | 387 (23.4%) | 510 (26.7%) |
| 65 to 74 Years | 15 (4.4%) | 287 (50.3%) |
| 75 Years and over | 124 (100.0%) | 454 (90.1%) |
Disability Class by Sex by Age in Cordele
Disability Class: Hearing Difficulty
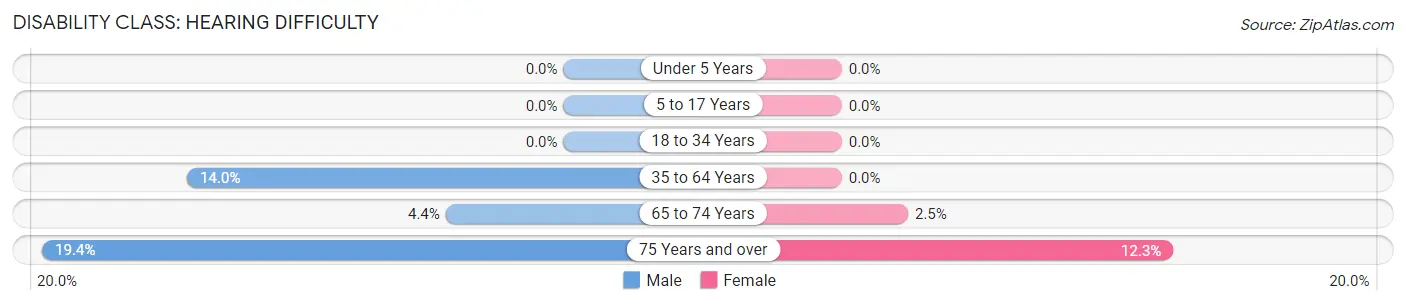
| Age Bracket | Male | Female |
| Under 5 Years | 0 (0.0%) | 0 (0.0%) |
| 5 to 17 Years | 0 (0.0%) | 0 (0.0%) |
| 18 to 34 Years | 0 (0.0%) | 0 (0.0%) |
| 35 to 64 Years | 231 (14.0%) | 0 (0.0%) |
| 65 to 74 Years | 15 (4.4%) | 14 (2.5%) |
| 75 Years and over | 24 (19.4%) | 62 (12.3%) |
Disability Class: Vision Difficulty
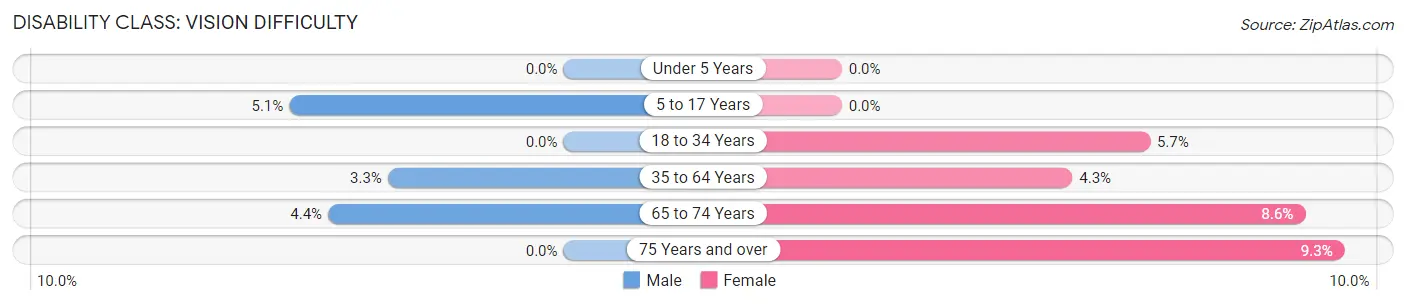
| Age Bracket | Male | Female |
| Under 5 Years | 0 (0.0%) | 0 (0.0%) |
| 5 to 17 Years | 52 (5.1%) | 0 (0.0%) |
| 18 to 34 Years | 0 (0.0%) | 73 (5.7%) |
| 35 to 64 Years | 54 (3.3%) | 82 (4.3%) |
| 65 to 74 Years | 15 (4.4%) | 49 (8.6%) |
| 75 Years and over | 0 (0.0%) | 47 (9.3%) |
Disability Class: Cognitive Difficulty
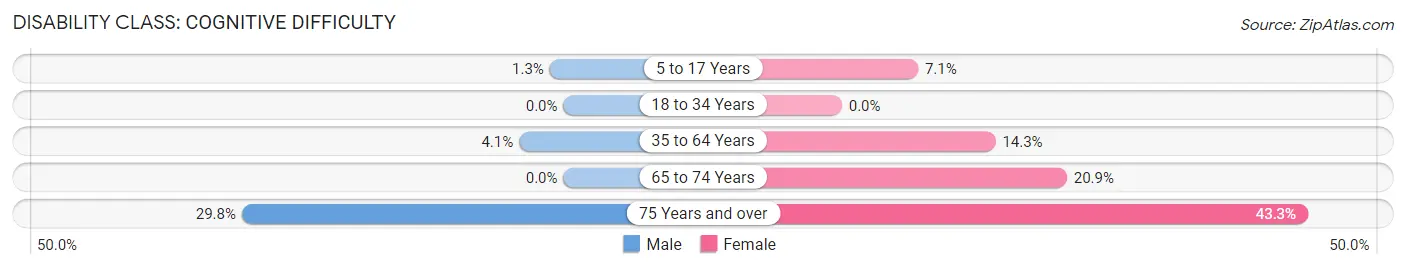
| Age Bracket | Male | Female |
| 5 to 17 Years | 13 (1.3%) | 73 (7.1%) |
| 18 to 34 Years | 0 (0.0%) | 0 (0.0%) |
| 35 to 64 Years | 68 (4.1%) | 273 (14.3%) |
| 65 to 74 Years | 0 (0.0%) | 119 (20.9%) |
| 75 Years and over | 37 (29.8%) | 218 (43.2%) |
Disability Class: Ambulatory Difficulty
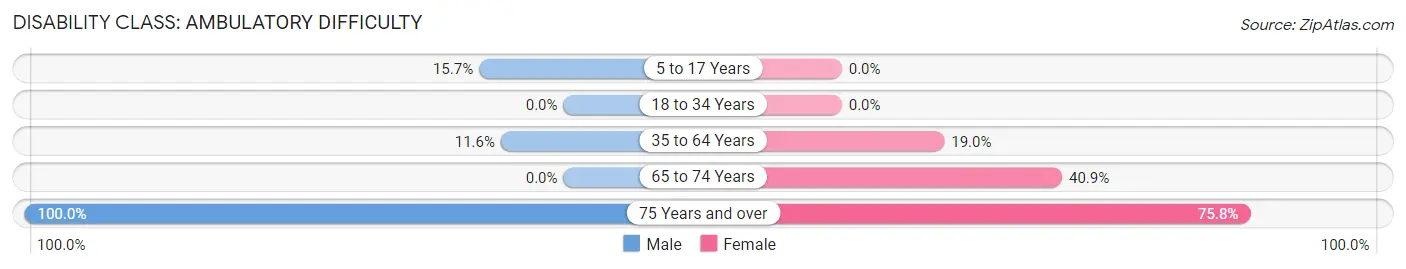
| Age Bracket | Male | Female |
| 5 to 17 Years | 160 (15.7%) | 0 (0.0%) |
| 18 to 34 Years | 0 (0.0%) | 0 (0.0%) |
| 35 to 64 Years | 192 (11.6%) | 364 (19.0%) |
| 65 to 74 Years | 0 (0.0%) | 233 (40.9%) |
| 75 Years and over | 124 (100.0%) | 382 (75.8%) |
Disability Class: Self-Care Difficulty
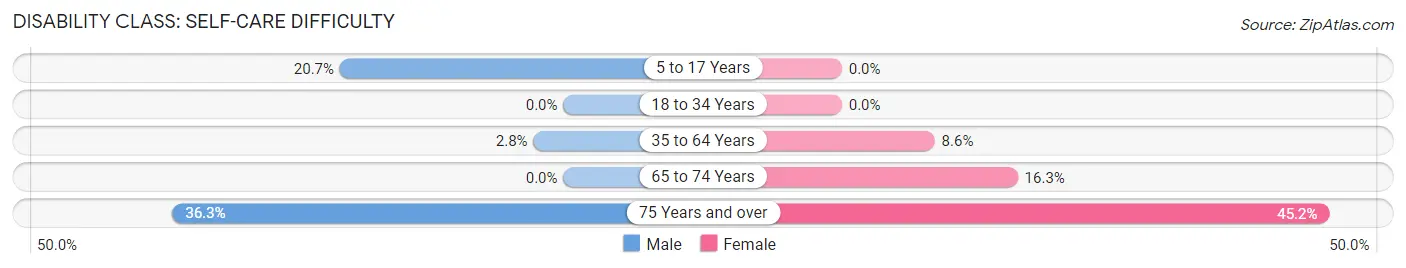
| Age Bracket | Male | Female |
| 5 to 17 Years | 212 (20.7%) | 0 (0.0%) |
| 18 to 34 Years | 0 (0.0%) | 0 (0.0%) |
| 35 to 64 Years | 46 (2.8%) | 165 (8.6%) |
| 65 to 74 Years | 0 (0.0%) | 93 (16.3%) |
| 75 Years and over | 45 (36.3%) | 228 (45.2%) |
Technology Access in Cordele
Computing Device Access in Cordele
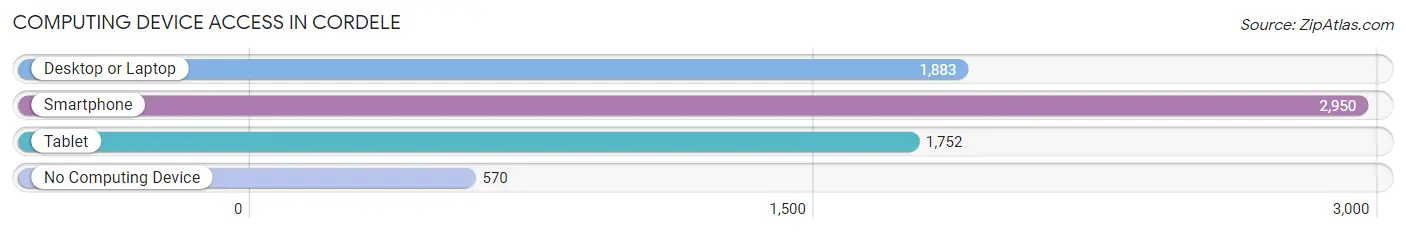
| Device Type | # Households | % Households |
| Desktop or Laptop | 1,883 | 46.6% |
| Smartphone | 2,950 | 73.0% |
| Tablet | 1,752 | 43.4% |
| No Computing Device | 570 | 14.1% |
| Total | 4,039 | 100.0% |
Internet Access in Cordele
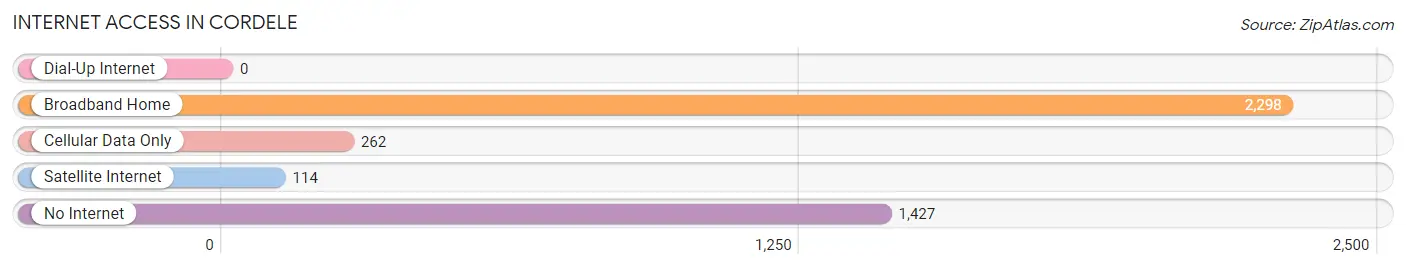
| Internet Type | # Households | % Households |
| Dial-Up Internet | 0 | 0.0% |
| Broadband Home | 2,298 | 56.9% |
| Cellular Data Only | 262 | 6.5% |
| Satellite Internet | 114 | 2.8% |
| No Internet | 1,427 | 35.3% |
| Total | 4,039 | 100.0% |
Cordele Summary
Cordele is a city located in Crisp County, Georgia, United States. It is the county seat of Crisp County and is located at the intersection of Interstate 75 and U.S. Route 280. The population was 11,147 at the 2010 census.
History
Cordele was founded in 1888 by the Seaboard Air Line Railway. The city was named after Cordelia Hawkins, the daughter of a local landowner. The city was incorporated in 1889 and was the first city in Crisp County.
In the early 1900s, Cordele was a major cotton-producing center. The city was also home to a large number of sawmills and turpentine stills. During World War II, the city was home to a large military base, Camp Wheeler.
Geography
Cordele is located at 31°57'45" North, 83°45'45" West (31.9625, -83.7625). According to the United States Census Bureau, the city has a total area of 11.2 square miles (29.0 km2), of which 11.1 square miles (28.7 km2) is land and 0.1 square miles (0.3 km2) is water.
Economy
Cordele is home to a variety of industries, including manufacturing, agriculture, and tourism. The city is home to several large manufacturing plants, including a Tyson Foods poultry processing plant, a Georgia-Pacific paper mill, and a Georgia-Pacific plywood plant.
Agriculture is also an important part of the local economy. The city is home to several large farms, including a large peanut farm and a large cotton farm.
Tourism is also an important part of the local economy. The city is home to several attractions, including the Georgia Veterans Memorial State Park, the Georgia Rural Telephone Museum, and the Georgia State Railroad Museum.
Demographics
As of the 2010 census, there were 11,147 people, 4,541 households, and 2,845 families residing in the city. The population density was 1,006.2 people per square mile (389.2/km2). There were 5,093 housing units at an average density of 459.2 per square mile (177.6/km2). The racial makeup of the city was 54.2% White, 40.3% African American, 0.3% Native American, 0.7% Asian, 0.1% Pacific Islander, 3.2% from other races, and 1.4% from two or more races. Hispanic or Latino of any race were 6.2% of the population.
There were 4,541 households, out of which 28.2% had children under the age of 18 living with them, 37.2% were married couples living together, 22.2% had a female householder with no husband present, and 36.2% were non-families. 32.2% of all households were made up of individuals, and 14.2% had someone living alone who was 65 years of age or older. The average household size was 2.41 and the average family size was 3.02.
In the city, the population was spread out, with 25.2% under the age of 18, 8.7% from 18 to 24, 25.3% from 25 to 44, 22.7% from 45 to 64, and 18.1% who were 65 years of age or older. The median age was 38 years. For every 100 females, there were 86.2 males. For every 100 females age 18 and over, there were 81.2 males.
The median income for a household in the city was $27,845, and the median income for a family was $35,938. Males had a median income of $30,917 versus $21,917 for females. The per capita income for the city was $15,945. About 17.2% of families and 20.7% of the population were below the poverty line, including 28.2% of those under age 18 and 16.2% of those age 65 or over.
Common Questions
What is Per Capita Income in Cordele?
Per Capita income in Cordele is $22,633.
What is the Median Family Income in Cordele?
Median Family Income in Cordele is $58,389.
What is the Median Household income in Cordele?
Median Household Income in Cordele is $33,166.
What is Income or Wage Gap in Cordele?
Income or Wage Gap in Cordele is 29.8%.
Women in Cordele earn 70.2 cents for every dollar earned by a man.
What is Family Income Deficit in Cordele?
Family Income Deficit in Cordele is $14,202.
Families that are below poverty line in Cordele earn $14,202 less on average than the poverty threshold level.
What is Inequality or Gini Index in Cordele?
Inequality or Gini Index in Cordele is 0.49.
What is the Total Population of Cordele?
Total Population of Cordele is 10,210.
What is the Total Male Population of Cordele?
Total Male Population of Cordele is 4,559.
What is the Total Female Population of Cordele?
Total Female Population of Cordele is 5,651.
What is the Ratio of Males per 100 Females in Cordele?
There are 80.68 Males per 100 Females in Cordele.
What is the Ratio of Females per 100 Males in Cordele?
There are 123.95 Females per 100 Males in Cordele.
What is the Median Population Age in Cordele?
Median Population Age in Cordele is 36.7 Years.
What is the Average Family Size in Cordele
Average Family Size in Cordele is 3.1 People.
What is the Average Household Size in Cordele
Average Household Size in Cordele is 2.5 People.
How Large is the Labor Force in Cordele?
There are 4,712 People in the Labor Forcein in Cordele.
What is the Percentage of People in the Labor Force in Cordele?
61.2% of People are in the Labor Force in Cordele.
What is the Unemployment Rate in Cordele?
Unemployment Rate in Cordele is 8.8%.