St Simons, GA Map & Demographics
St Simons Map
St Simons Overview
$66,552
PER CAPITA INCOME
$118,341
AVG FAMILY INCOME
$99,432
AVG HOUSEHOLD INCOME
36.7%
WAGE / INCOME GAP [ % ]
63.3¢/ $1
WAGE / INCOME GAP [ $ ]
$10,853
FAMILY INCOME DEFICIT
0.48
INEQUALITY / GINI INDEX
15,983
TOTAL POPULATION
7,507
MALE POPULATION
8,476
FEMALE POPULATION
88.57
MALES / 100 FEMALES
112.91
FEMALES / 100 MALES
57.4
MEDIAN AGE
2.6
AVG FAMILY SIZE
2.2
AVG HOUSEHOLD SIZE
7,285
LABOR FORCE [ PEOPLE ]
51.3%
PERCENT IN LABOR FORCE
2.7%
UNEMPLOYMENT RATE
Income in St Simons
Income Overview in St Simons
Per Capita Income in St Simons is $66,552, while median incomes of families and households are $118,341 and $99,432 respectively.
| Characteristic | Number | Measure |
| Per Capita Income | 15,983 | $66,552 |
| Median Family Income | 4,928 | $118,341 |
| Mean Family Income | 4,928 | $168,759 |
| Median Household Income | 7,258 | $99,432 |
| Mean Household Income | 7,258 | $144,642 |
| Income Deficit | 4,928 | $10,853 |
| Wage / Income Gap (%) | 15,983 | 36.68% |
| Wage / Income Gap ($) | 15,983 | 63.32¢ per $1 |
| Gini / Inequality Index | 15,983 | 0.48 |
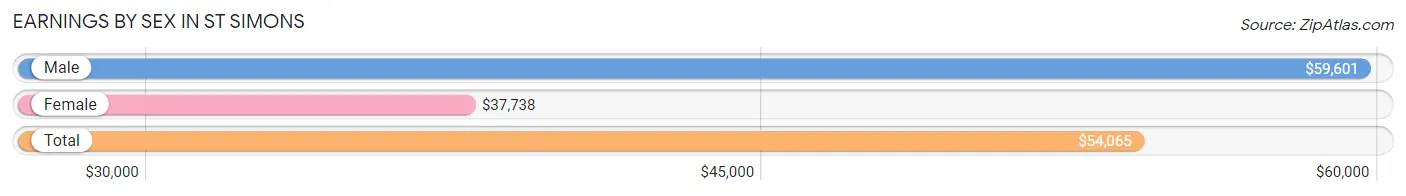
Earnings by Sex in St Simons
Average Earnings in St Simons are $54,065, $59,601 for men and $37,738 for women, a difference of 36.7%.
| Sex | Number | Average Earnings |
| Male | 4,078 (52.0%) | $59,601 |
| Female | 3,762 (48.0%) | $37,738 |
| Total | 7,840 (100.0%) | $54,065 |
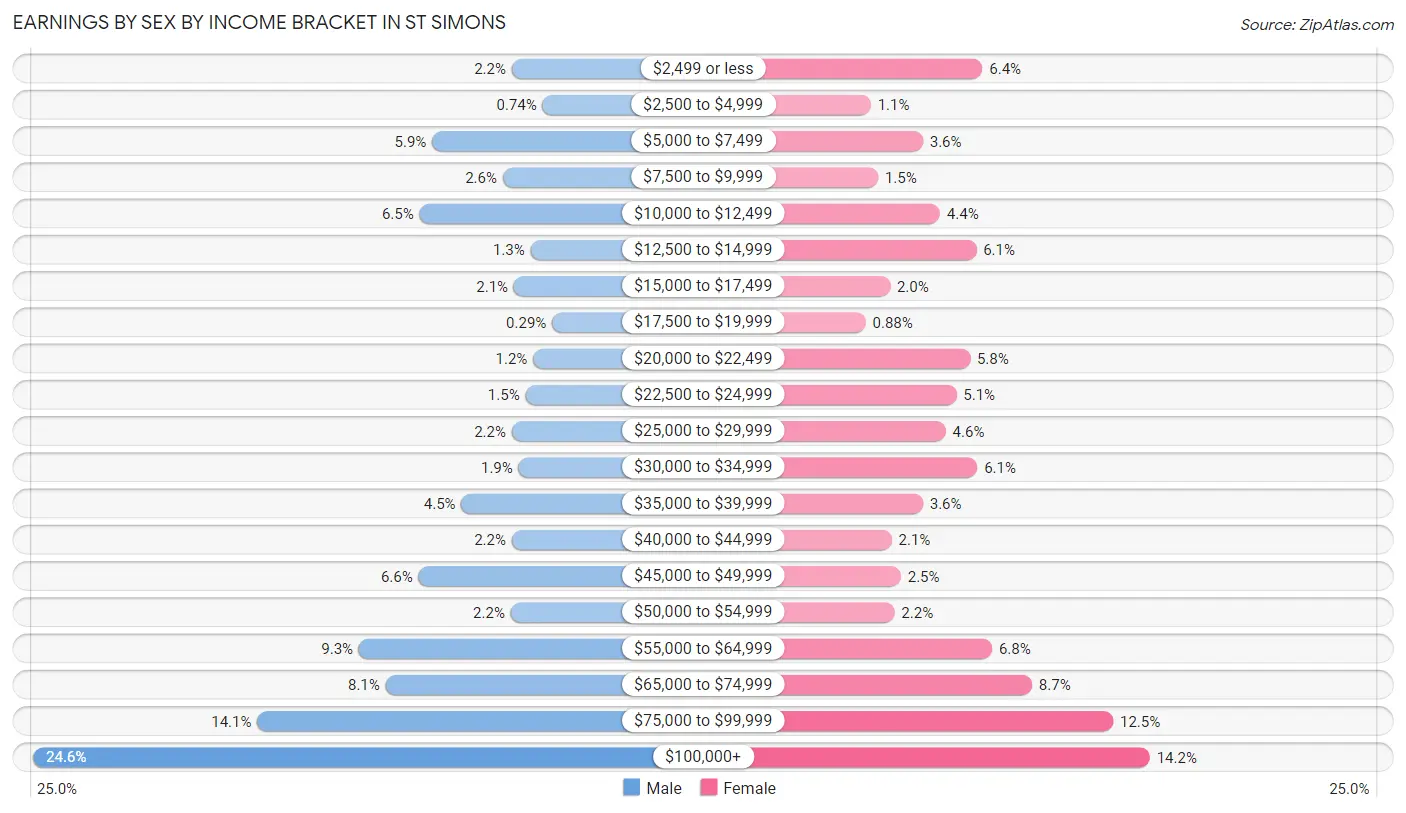
Earnings by Sex by Income Bracket in St Simons
The most common earnings brackets in St Simons are $100,000+ for men (1,003 | 24.6%) and $100,000+ for women (534 | 14.2%).
| Income | Male | Female |
| $2,499 or less | 89 (2.2%) | 239 (6.4%) |
| $2,500 to $4,999 | 30 (0.7%) | 42 (1.1%) |
| $5,000 to $7,499 | 241 (5.9%) | 134 (3.6%) |
| $7,500 to $9,999 | 106 (2.6%) | 55 (1.5%) |
| $10,000 to $12,499 | 265 (6.5%) | 164 (4.4%) |
| $12,500 to $14,999 | 53 (1.3%) | 228 (6.1%) |
| $15,000 to $17,499 | 85 (2.1%) | 76 (2.0%) |
| $17,500 to $19,999 | 12 (0.3%) | 33 (0.9%) |
| $20,000 to $22,499 | 48 (1.2%) | 217 (5.8%) |
| $22,500 to $24,999 | 63 (1.5%) | 193 (5.1%) |
| $25,000 to $29,999 | 89 (2.2%) | 174 (4.6%) |
| $30,000 to $34,999 | 76 (1.9%) | 230 (6.1%) |
| $35,000 to $39,999 | 185 (4.5%) | 134 (3.6%) |
| $40,000 to $44,999 | 89 (2.2%) | 79 (2.1%) |
| $45,000 to $49,999 | 267 (6.6%) | 95 (2.5%) |
| $50,000 to $54,999 | 91 (2.2%) | 84 (2.2%) |
| $55,000 to $64,999 | 381 (9.3%) | 256 (6.8%) |
| $65,000 to $74,999 | 330 (8.1%) | 326 (8.7%) |
| $75,000 to $99,999 | 575 (14.1%) | 469 (12.5%) |
| $100,000+ | 1,003 (24.6%) | 534 (14.2%) |
| Total | 4,078 (100.0%) | 3,762 (100.0%) |
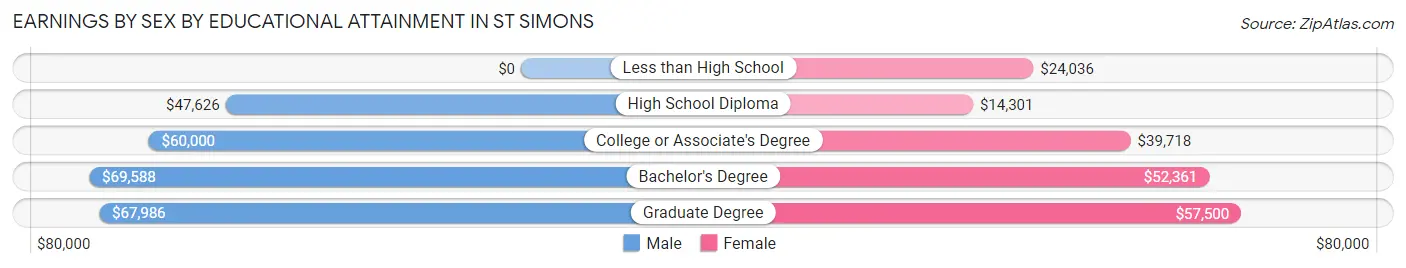
Earnings by Sex by Educational Attainment in St Simons
Average earnings in St Simons are $63,714 for men and $44,119 for women, a difference of 30.7%. Men with an educational attainment of bachelor's degree enjoy the highest average annual earnings of $69,588, while those with high school diploma education earn the least with $47,626. Women with an educational attainment of graduate degree earn the most with the average annual earnings of $57,500, while those with high school diploma education have the smallest earnings of $14,301.
| Educational Attainment | Male Income | Female Income |
| Less than High School | - | - |
| High School Diploma | $47,626 | $14,301 |
| College or Associate's Degree | $60,000 | $39,718 |
| Bachelor's Degree | $69,588 | $52,361 |
| Graduate Degree | $67,986 | $57,500 |
| Total | $63,714 | $44,119 |
Family Income in St Simons
Family Income Brackets in St Simons
According to the St Simons family income data, there are 1,173 families falling into the $100,000 to $149,999 income range, which is the most common income bracket and makes up 23.8% of all families. Conversely, the $15,000 to $24,999 income bracket is the least frequent group with only 34 families (0.7%) belonging to this category.
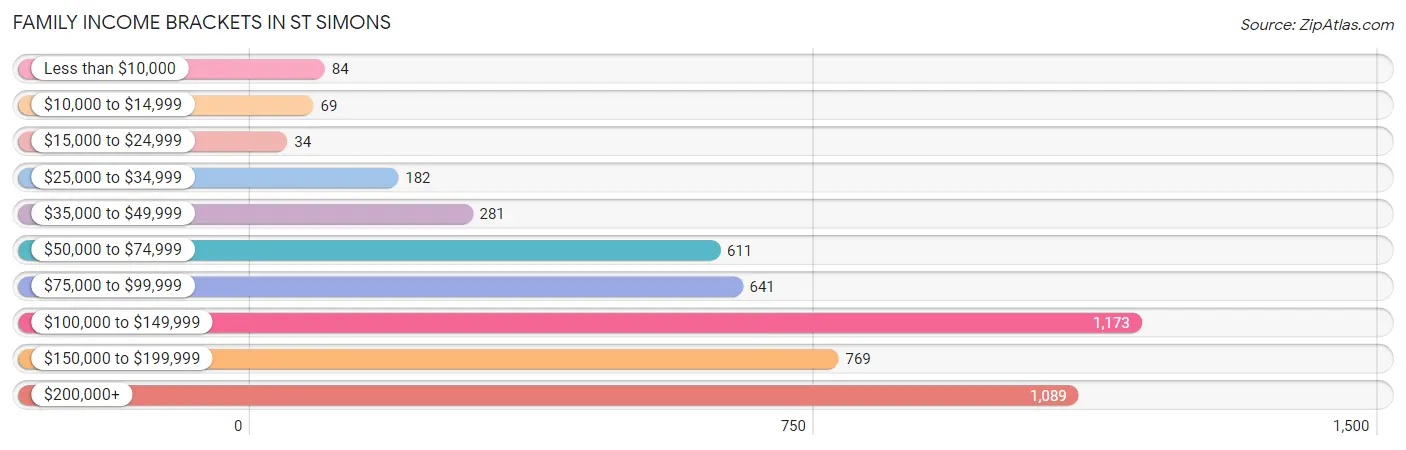
| Income Bracket | # Families | % Families |
| Less than $10,000 | 84 | 1.7% |
| $10,000 to $14,999 | 69 | 1.4% |
| $15,000 to $24,999 | 34 | 0.7% |
| $25,000 to $34,999 | 182 | 3.7% |
| $35,000 to $49,999 | 281 | 5.7% |
| $50,000 to $74,999 | 611 | 12.4% |
| $75,000 to $99,999 | 641 | 13.0% |
| $100,000 to $149,999 | 1,173 | 23.8% |
| $150,000 to $199,999 | 769 | 15.6% |
| $200,000+ | 1,089 | 22.1% |
Family Income by Famaliy Size in St Simons
6-person families (81 | 1.6%) account for the highest median family income in St Simons with $250,001 per family, while 2-person families (3,233 | 65.6%) have the highest median income of $55,675 per family member.
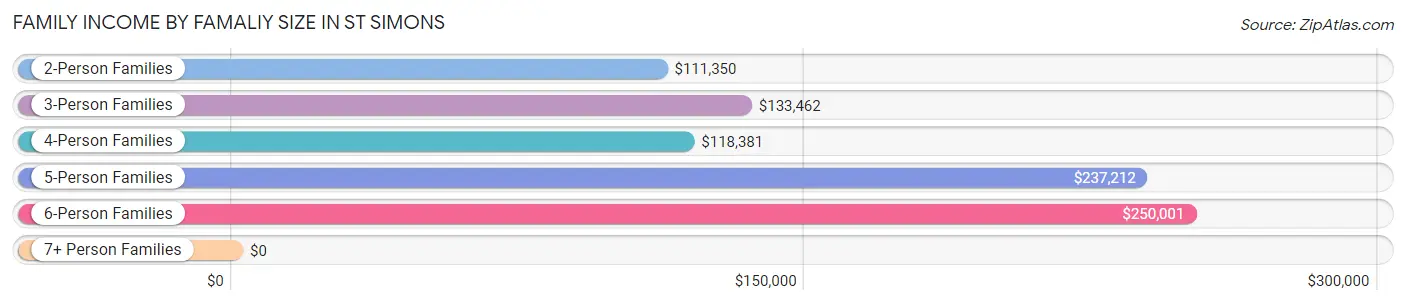
| Income Bracket | # Families | Median Income |
| 2-Person Families | 3,233 (65.6%) | $111,350 |
| 3-Person Families | 820 (16.6%) | $133,462 |
| 4-Person Families | 705 (14.3%) | $118,381 |
| 5-Person Families | 89 (1.8%) | $237,212 |
| 6-Person Families | 81 (1.6%) | $250,001 |
| 7+ Person Families | 0 (0.0%) | $0 |
| Total | 4,928 (100.0%) | $118,341 |
Family Income by Number of Earners in St Simons
The median family income in St Simons is $118,341, with families comprising 3+ earners (295) having the highest median family income of $180,179, while families with no earners (1,439) have the lowest median family income of $92,898, accounting for 6.0% and 29.2% of families, respectively.
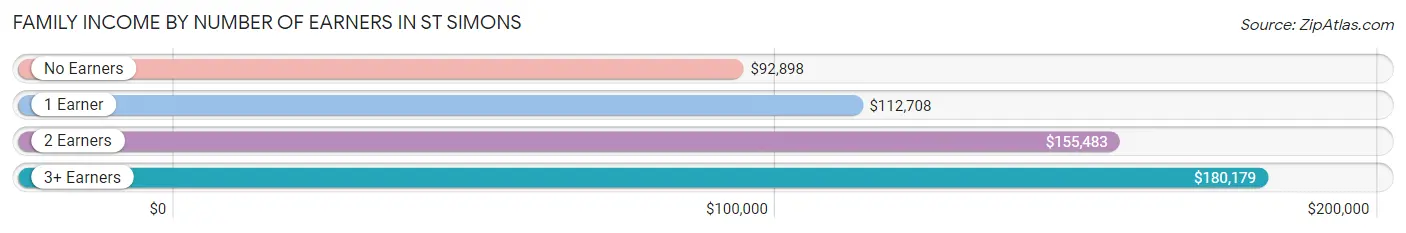
| Number of Earners | # Families | Median Income |
| No Earners | 1,439 (29.2%) | $92,898 |
| 1 Earner | 1,271 (25.8%) | $112,708 |
| 2 Earners | 1,923 (39.0%) | $155,483 |
| 3+ Earners | 295 (6.0%) | $180,179 |
| Total | 4,928 (100.0%) | $118,341 |
Household Income in St Simons
Household Income Brackets in St Simons
With 1,481 households falling in the category, the $100,000 to $149,999 income range is the most frequent in St Simons, accounting for 20.4% of all households. In contrast, only 123 households (1.7%) fall into the $10,000 to $14,999 income bracket, making it the least populous group.
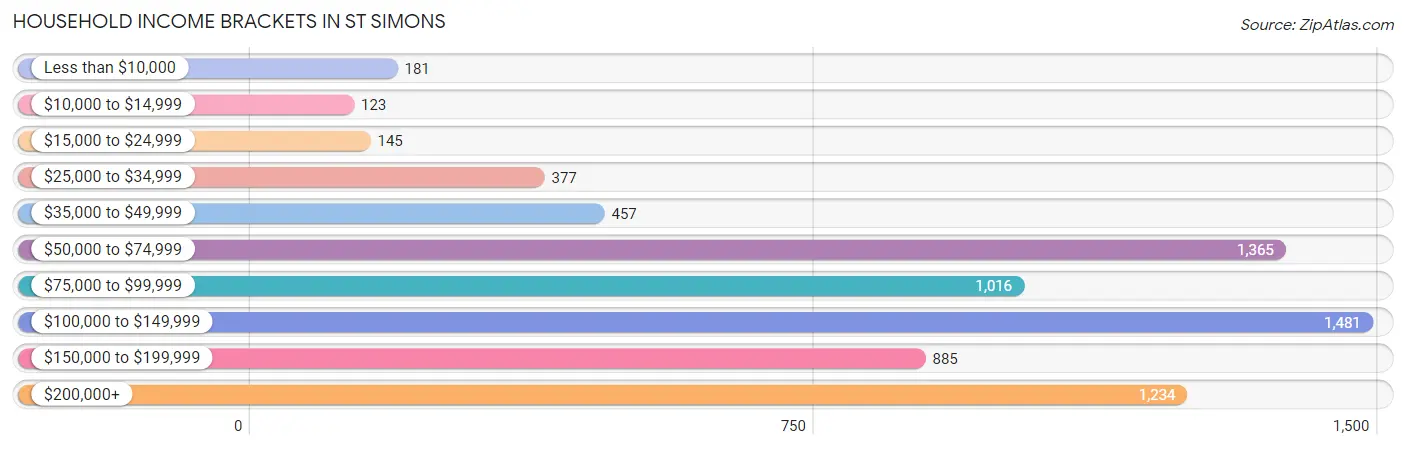
| Income Bracket | # Households | % Households |
| Less than $10,000 | 181 | 2.5% |
| $10,000 to $14,999 | 123 | 1.7% |
| $15,000 to $24,999 | 145 | 2.0% |
| $25,000 to $34,999 | 377 | 5.2% |
| $35,000 to $49,999 | 457 | 6.3% |
| $50,000 to $74,999 | 1,365 | 18.8% |
| $75,000 to $99,999 | 1,016 | 14.0% |
| $100,000 to $149,999 | 1,481 | 20.4% |
| $150,000 to $199,999 | 885 | 12.2% |
| $200,000+ | 1,234 | 17.0% |
Household Income by Householder Age in St Simons
The median household income in St Simons is $99,432, with the highest median household income of $106,172 found in the 25 to 44 years age bracket for the primary householder. A total of 1,188 households (16.4%) fall into this category. Meanwhile, the 15 to 24 years age bracket for the primary householder has the lowest median household income of $0, with 103 households (1.4%) in this group.
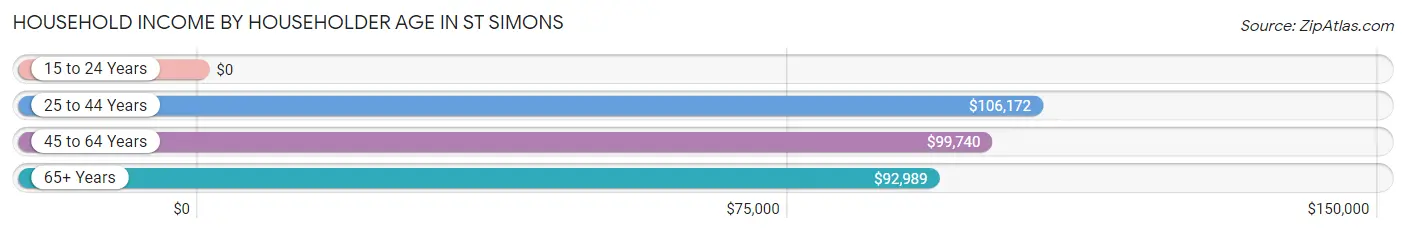
| Income Bracket | # Households | Median Income |
| 15 to 24 Years | 103 (1.4%) | $0 |
| 25 to 44 Years | 1,188 (16.4%) | $106,172 |
| 45 to 64 Years | 2,459 (33.9%) | $99,740 |
| 65+ Years | 3,508 (48.3%) | $92,989 |
| Total | 7,258 (100.0%) | $99,432 |
Poverty in St Simons
Income Below Poverty by Sex and Age in St Simons
With 4.1% poverty level for males and 5.0% for females among the residents of St Simons, 15 year old males and 55 to 64 year old females are the most vulnerable to poverty, with 18 males (26.5%) and 135 females (9.8%) in their respective age groups living below the poverty level.
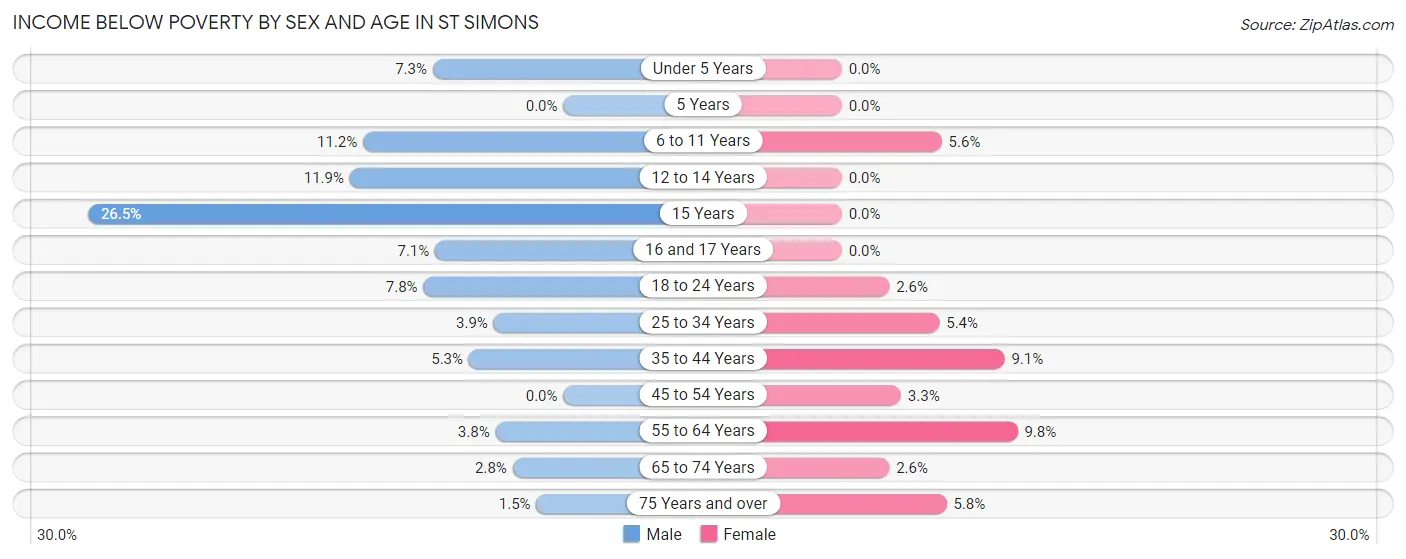
| Age Bracket | Male | Female |
| Under 5 Years | 25 (7.3%) | 0 (0.0%) |
| 5 Years | 0 (0.0%) | 0 (0.0%) |
| 6 to 11 Years | 35 (11.2%) | 19 (5.6%) |
| 12 to 14 Years | 22 (11.9%) | 0 (0.0%) |
| 15 Years | 18 (26.5%) | 0 (0.0%) |
| 16 and 17 Years | 7 (7.1%) | 0 (0.0%) |
| 18 to 24 Years | 24 (7.8%) | 12 (2.6%) |
| 25 to 34 Years | 25 (3.9%) | 37 (5.4%) |
| 35 to 44 Years | 36 (5.3%) | 58 (9.1%) |
| 45 to 54 Years | 0 (0.0%) | 33 (3.3%) |
| 55 to 64 Years | 47 (3.8%) | 135 (9.8%) |
| 65 to 74 Years | 49 (2.8%) | 51 (2.6%) |
| 75 Years and over | 13 (1.5%) | 72 (5.8%) |
| Total | 301 (4.1%) | 417 (5.0%) |
Income Above Poverty by Sex and Age in St Simons
According to the poverty statistics in St Simons, males aged 5 years and females aged under 5 years are the age groups that are most secure financially, with 100.0% of males and 100.0% of females in these age groups living above the poverty line.
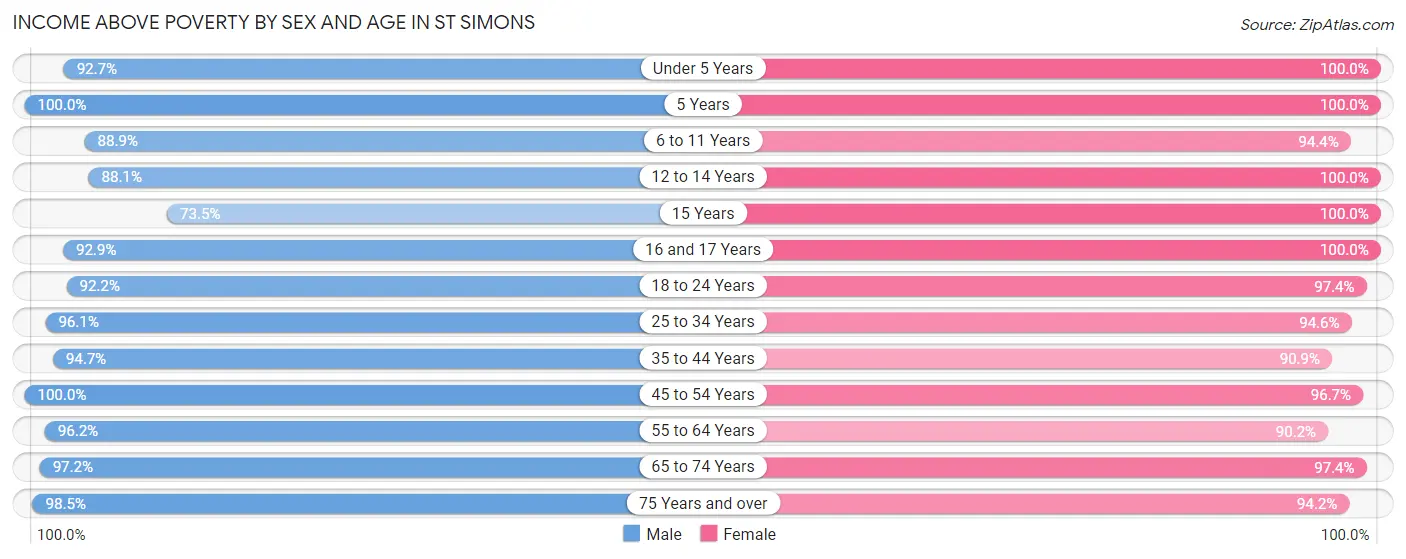
| Age Bracket | Male | Female |
| Under 5 Years | 319 (92.7%) | 302 (100.0%) |
| 5 Years | 8 (100.0%) | 35 (100.0%) |
| 6 to 11 Years | 279 (88.8%) | 323 (94.4%) |
| 12 to 14 Years | 163 (88.1%) | 116 (100.0%) |
| 15 Years | 50 (73.5%) | 36 (100.0%) |
| 16 and 17 Years | 91 (92.9%) | 192 (100.0%) |
| 18 to 24 Years | 284 (92.2%) | 442 (97.4%) |
| 25 to 34 Years | 620 (96.1%) | 644 (94.6%) |
| 35 to 44 Years | 648 (94.7%) | 582 (90.9%) |
| 45 to 54 Years | 912 (100.0%) | 969 (96.7%) |
| 55 to 64 Years | 1,196 (96.2%) | 1,245 (90.2%) |
| 65 to 74 Years | 1,688 (97.2%) | 1,883 (97.4%) |
| 75 Years and over | 856 (98.5%) | 1,162 (94.2%) |
| Total | 7,114 (95.9%) | 7,931 (95.0%) |
Income Below Poverty Among Married-Couple Families in St Simons
The poverty statistics for married-couple families in St Simons show that 2.3% or 100 of the total 4,331 families live below the poverty line. Families with no children have the highest poverty rate of 2.4%, comprising of 81 families. On the other hand, families with 3 or 4 children have the lowest poverty rate of 0.0%, which includes 0 families.
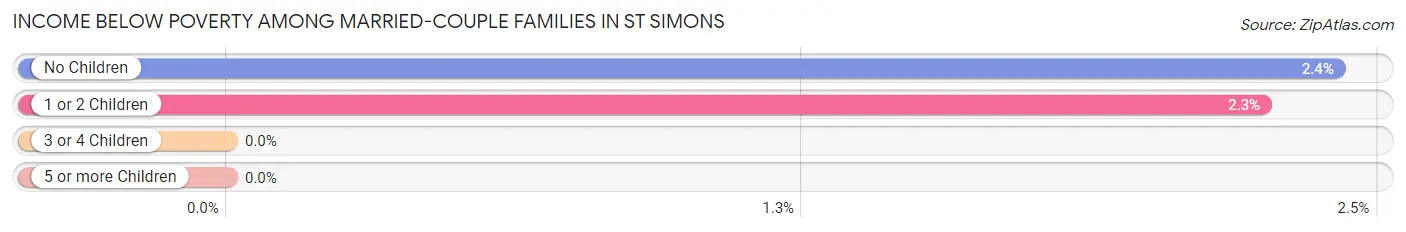
| Children | Above Poverty | Below Poverty |
| No Children | 3,286 (97.6%) | 81 (2.4%) |
| 1 or 2 Children | 827 (97.8%) | 19 (2.2%) |
| 3 or 4 Children | 118 (100.0%) | 0 (0.0%) |
| 5 or more Children | 0 (0.0%) | 0 (0.0%) |
| Total | 4,231 (97.7%) | 100 (2.3%) |
Income Below Poverty Among Single-Parent Households in St Simons
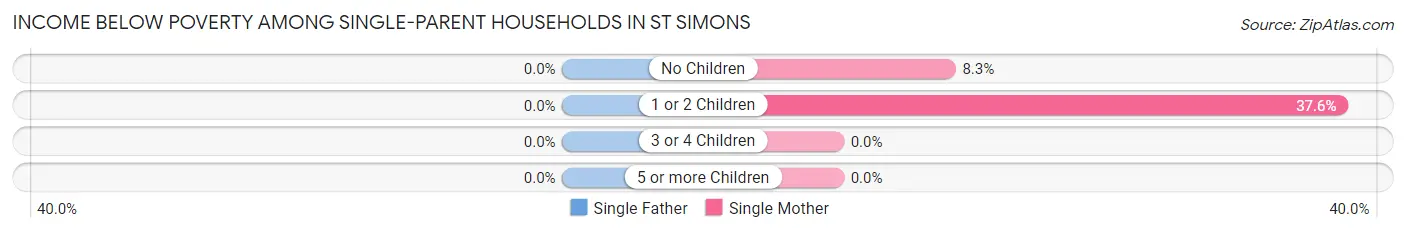
| Children | Single Father | Single Mother |
| No Children | 0 (0.0%) | 33 (8.3%) |
| 1 or 2 Children | 0 (0.0%) | 53 (37.6%) |
| 3 or 4 Children | 0 (0.0%) | 0 (0.0%) |
| 5 or more Children | 0 (0.0%) | 0 (0.0%) |
| Total | 0 (0.0%) | 86 (15.3%) |
Income Below Poverty Among Married-Couple vs Single-Parent Households in St Simons
The poverty data for St Simons shows that 100 of the married-couple family households (2.3%) and 86 of the single-parent households (14.4%) are living below the poverty level. Within the married-couple family households, those with no children have the highest poverty rate, with 81 households (2.4%) falling below the poverty line. Among the single-parent households, those with 1 or 2 children have the highest poverty rate, with 53 household (37.6%) living below poverty.
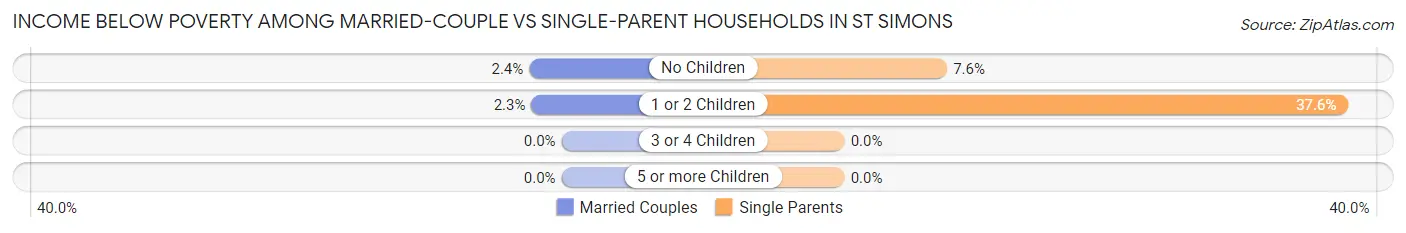
| Children | Married-Couple Families | Single-Parent Households |
| No Children | 81 (2.4%) | 33 (7.6%) |
| 1 or 2 Children | 19 (2.2%) | 53 (37.6%) |
| 3 or 4 Children | 0 (0.0%) | 0 (0.0%) |
| 5 or more Children | 0 (0.0%) | 0 (0.0%) |
| Total | 100 (2.3%) | 86 (14.4%) |
Race in St Simons
The most populous races in St Simons are White / Caucasian (15,075 | 94.3%), Hispanic or Latino (416 | 2.6%), and Two or more Races (304 | 1.9%).
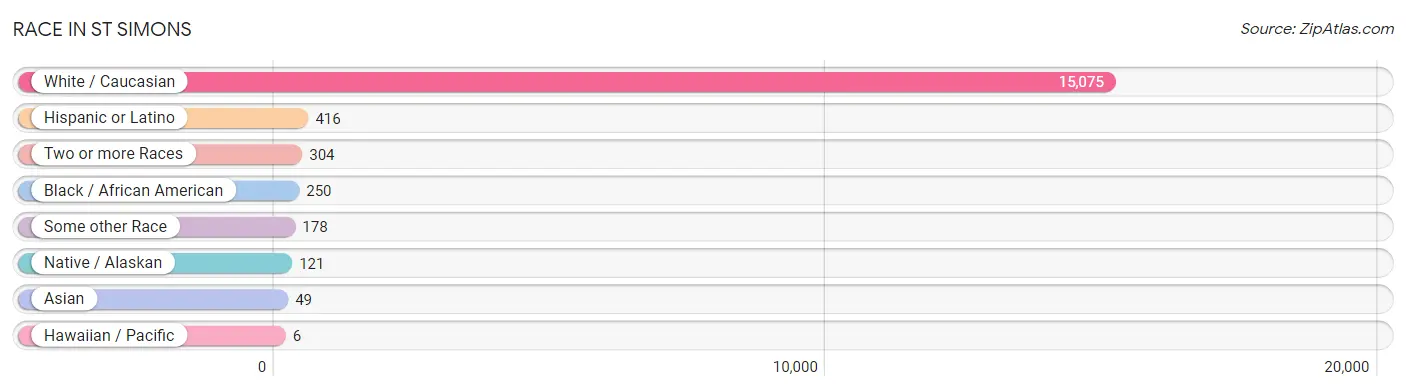
| Race | # Population | % Population |
| Asian | 49 | 0.3% |
| Black / African American | 250 | 1.6% |
| Hawaiian / Pacific | 6 | 0.0% |
| Hispanic or Latino | 416 | 2.6% |
| Native / Alaskan | 121 | 0.8% |
| White / Caucasian | 15,075 | 94.3% |
| Two or more Races | 304 | 1.9% |
| Some other Race | 178 | 1.1% |
| Total | 15,983 | 100.0% |
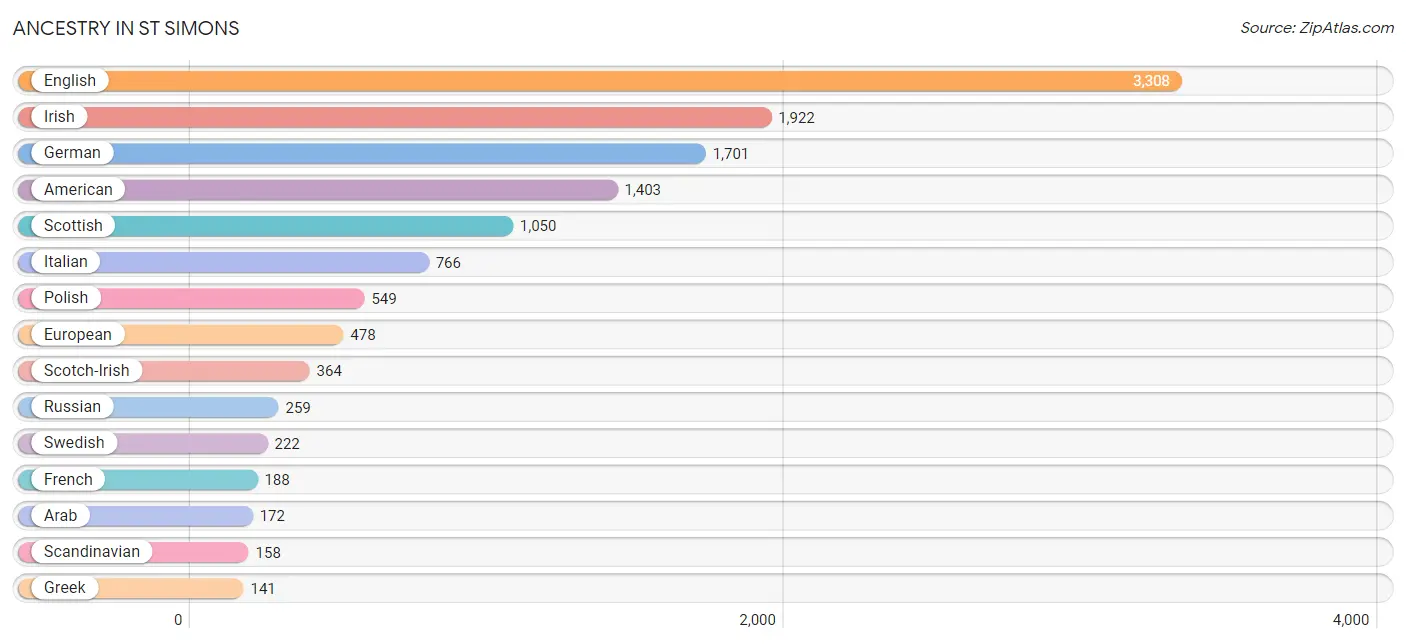
Ancestry in St Simons
The most populous ancestries reported in St Simons are English (3,308 | 20.7%), Irish (1,922 | 12.0%), German (1,701 | 10.6%), American (1,403 | 8.8%), and Scottish (1,050 | 6.6%), together accounting for 58.7% of all St Simons residents.
| Ancestry | # Population | % Population |
| African | 3 | 0.0% |
| American | 1,403 | 8.8% |
| Arab | 172 | 1.1% |
| Austrian | 70 | 0.4% |
| Belgian | 36 | 0.2% |
| Bhutanese | 9 | 0.1% |
| Brazilian | 4 | 0.0% |
| British | 120 | 0.7% |
| Burmese | 16 | 0.1% |
| Canadian | 24 | 0.2% |
| Central American | 135 | 0.8% |
| Cherokee | 11 | 0.1% |
| Choctaw | 86 | 0.5% |
| Colombian | 6 | 0.0% |
| Cuban | 66 | 0.4% |
| Czech | 12 | 0.1% |
| Czechoslovakian | 55 | 0.3% |
| Danish | 65 | 0.4% |
| Dutch | 116 | 0.7% |
| Eastern European | 31 | 0.2% |
| Ecuadorian | 30 | 0.2% |
| English | 3,308 | 20.7% |
| European | 478 | 3.0% |
| Finnish | 9 | 0.1% |
| French | 188 | 1.2% |
| French Canadian | 103 | 0.6% |
| German | 1,701 | 10.6% |
| Greek | 141 | 0.9% |
| Hungarian | 71 | 0.4% |
| Irish | 1,922 | 12.0% |
| Italian | 766 | 4.8% |
| Korean | 12 | 0.1% |
| Lebanese | 43 | 0.3% |
| Lithuanian | 78 | 0.5% |
| Luxembourger | 5 | 0.0% |
| Mexican | 88 | 0.5% |
| Northern European | 7 | 0.0% |
| Norwegian | 102 | 0.6% |
| Pakistani | 20 | 0.1% |
| Pennsylvania German | 10 | 0.1% |
| Polish | 549 | 3.4% |
| Puerto Rican | 23 | 0.1% |
| Romanian | 13 | 0.1% |
| Russian | 259 | 1.6% |
| Salvadoran | 135 | 0.8% |
| Samoan | 6 | 0.0% |
| Scandinavian | 158 | 1.0% |
| Scotch-Irish | 364 | 2.3% |
| Scottish | 1,050 | 6.6% |
| Serbian | 15 | 0.1% |
| Slavic | 10 | 0.1% |
| South American | 36 | 0.2% |
| Subsaharan African | 3 | 0.0% |
| Swedish | 222 | 1.4% |
| Swiss | 15 | 0.1% |
| Syrian | 4 | 0.0% |
| Thai | 19 | 0.1% |
| Ukrainian | 8 | 0.1% |
| Welsh | 110 | 0.7% | View All 59 Rows |
Immigrants in St Simons
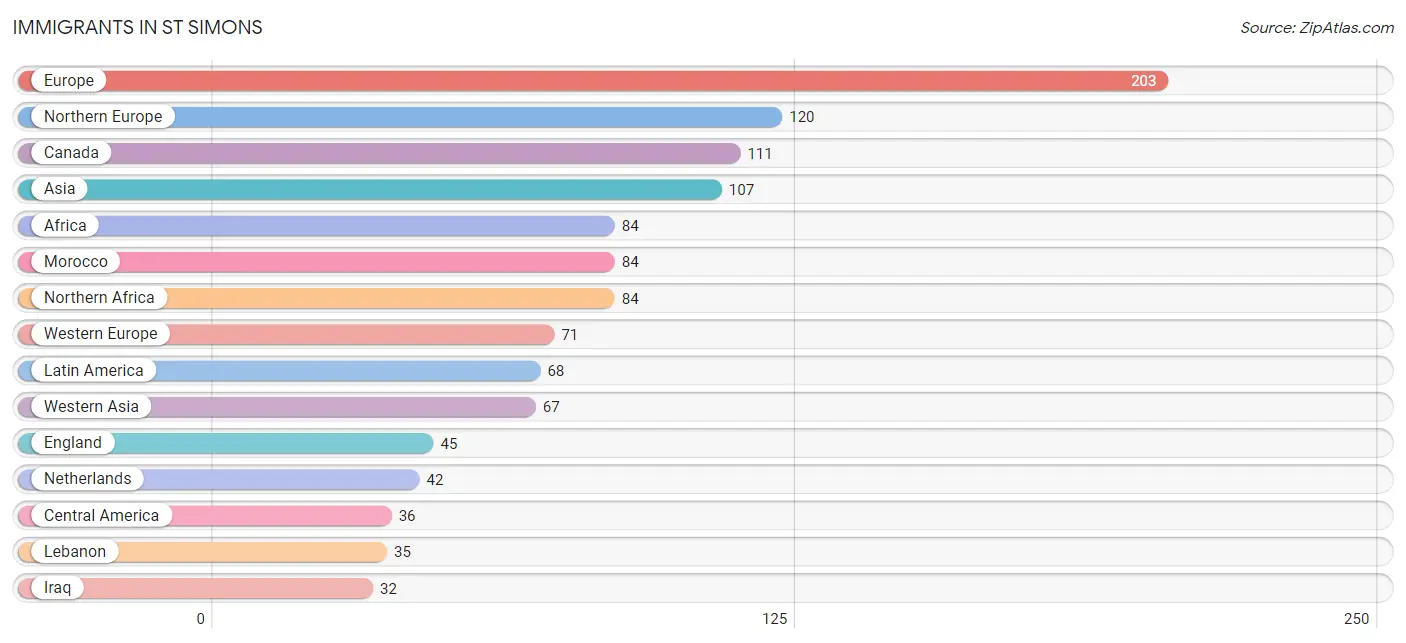
The most numerous immigrant groups reported in St Simons came from Europe (203 | 1.3%), Northern Europe (120 | 0.7%), Canada (111 | 0.7%), Asia (107 | 0.7%), and Africa (84 | 0.5%), together accounting for 3.9% of all St Simons residents.
| Immigration Origin | # Population | % Population |
| Africa | 84 | 0.5% |
| Asia | 107 | 0.7% |
| Bangladesh | 16 | 0.1% |
| Belgium | 14 | 0.1% |
| Brazil | 4 | 0.0% |
| Canada | 111 | 0.7% |
| Central America | 36 | 0.2% |
| El Salvador | 26 | 0.2% |
| England | 45 | 0.3% |
| Europe | 203 | 1.3% |
| Germany | 15 | 0.1% |
| Guyana | 28 | 0.2% |
| India | 10 | 0.1% |
| Iraq | 32 | 0.2% |
| Latin America | 68 | 0.4% |
| Lebanon | 35 | 0.2% |
| Mexico | 10 | 0.1% |
| Morocco | 84 | 0.5% |
| Netherlands | 42 | 0.3% |
| Northern Africa | 84 | 0.5% |
| Northern Europe | 120 | 0.7% |
| Philippines | 5 | 0.0% |
| Portugal | 12 | 0.1% |
| Scotland | 11 | 0.1% |
| South America | 32 | 0.2% |
| South Central Asia | 26 | 0.2% |
| South Eastern Asia | 14 | 0.1% |
| Southern Europe | 12 | 0.1% |
| Sweden | 29 | 0.2% |
| Thailand | 9 | 0.1% |
| Western Asia | 67 | 0.4% |
| Western Europe | 71 | 0.4% | View All 32 Rows |
Sex and Age in St Simons
Sex and Age in St Simons
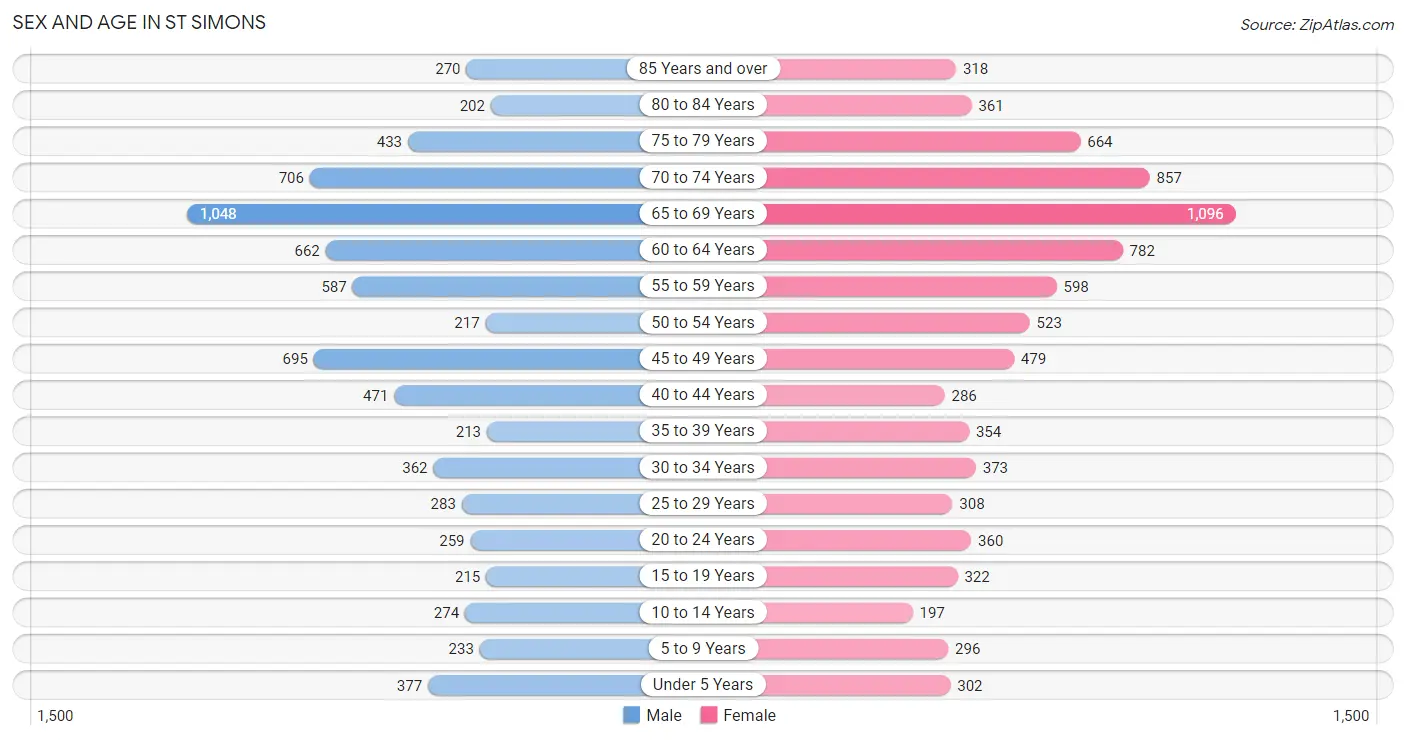
The most populous age groups in St Simons are 65 to 69 Years (1,048 | 14.0%) for men and 65 to 69 Years (1,096 | 12.9%) for women.
| Age Bracket | Male | Female |
| Under 5 Years | 377 (5.0%) | 302 (3.6%) |
| 5 to 9 Years | 233 (3.1%) | 296 (3.5%) |
| 10 to 14 Years | 274 (3.6%) | 197 (2.3%) |
| 15 to 19 Years | 215 (2.9%) | 322 (3.8%) |
| 20 to 24 Years | 259 (3.5%) | 360 (4.3%) |
| 25 to 29 Years | 283 (3.8%) | 308 (3.6%) |
| 30 to 34 Years | 362 (4.8%) | 373 (4.4%) |
| 35 to 39 Years | 213 (2.8%) | 354 (4.2%) |
| 40 to 44 Years | 471 (6.3%) | 286 (3.4%) |
| 45 to 49 Years | 695 (9.3%) | 479 (5.7%) |
| 50 to 54 Years | 217 (2.9%) | 523 (6.2%) |
| 55 to 59 Years | 587 (7.8%) | 598 (7.1%) |
| 60 to 64 Years | 662 (8.8%) | 782 (9.2%) |
| 65 to 69 Years | 1,048 (14.0%) | 1,096 (12.9%) |
| 70 to 74 Years | 706 (9.4%) | 857 (10.1%) |
| 75 to 79 Years | 433 (5.8%) | 664 (7.8%) |
| 80 to 84 Years | 202 (2.7%) | 361 (4.3%) |
| 85 Years and over | 270 (3.6%) | 318 (3.7%) |
| Total | 7,507 (100.0%) | 8,476 (100.0%) |
Families and Households in St Simons
Median Family Size in St Simons
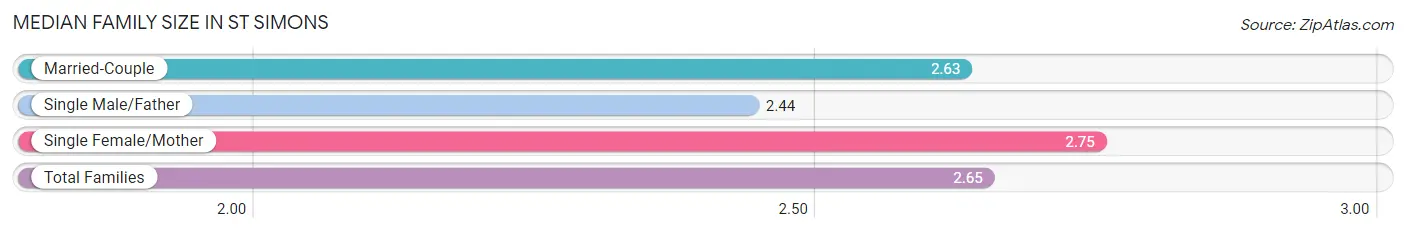
The median family size in St Simons is 2.65 persons per family, with single female/mother families (561 | 11.4%) accounting for the largest median family size of 2.75 persons per family. On the other hand, single male/father families (36 | 0.7%) represent the smallest median family size with 2.44 persons per family.
| Family Type | # Families | Family Size |
| Married-Couple | 4,331 (87.9%) | 2.63 |
| Single Male/Father | 36 (0.7%) | 2.44 |
| Single Female/Mother | 561 (11.4%) | 2.75 |
| Total Families | 4,928 (100.0%) | 2.65 |
Median Household Size in St Simons
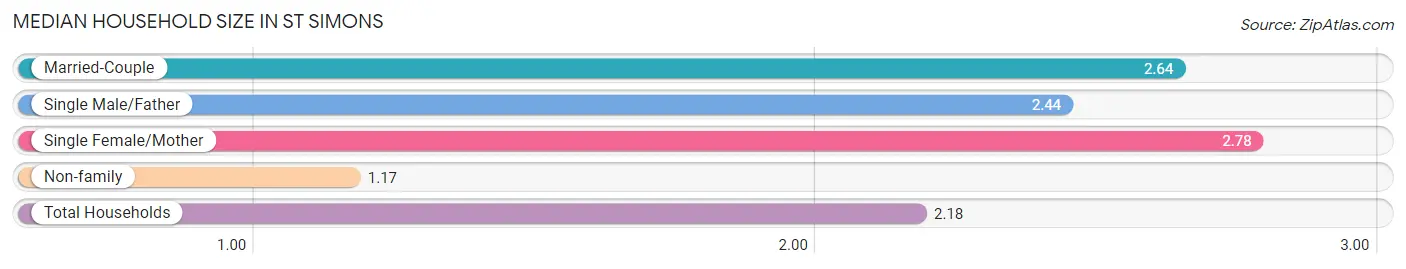
The median household size in St Simons is 2.18 persons per household, with single female/mother households (561 | 7.7%) accounting for the largest median household size of 2.78 persons per household. non-family households (2,330 | 32.1%) represent the smallest median household size with 1.17 persons per household.
| Household Type | # Households | Household Size |
| Married-Couple | 4,331 (59.7%) | 2.64 |
| Single Male/Father | 36 (0.5%) | 2.44 |
| Single Female/Mother | 561 (7.7%) | 2.78 |
| Non-family | 2,330 (32.1%) | 1.17 |
| Total Households | 7,258 (100.0%) | 2.18 |
Household Size by Marriage Status in St Simons
Out of a total of 7,258 households in St Simons, 4,928 (67.9%) are family households, while 2,330 (32.1%) are nonfamily households. The most numerous type of family households are 2-person households, comprising 3,233, and the most common type of nonfamily households are 1-person households, comprising 1,993.
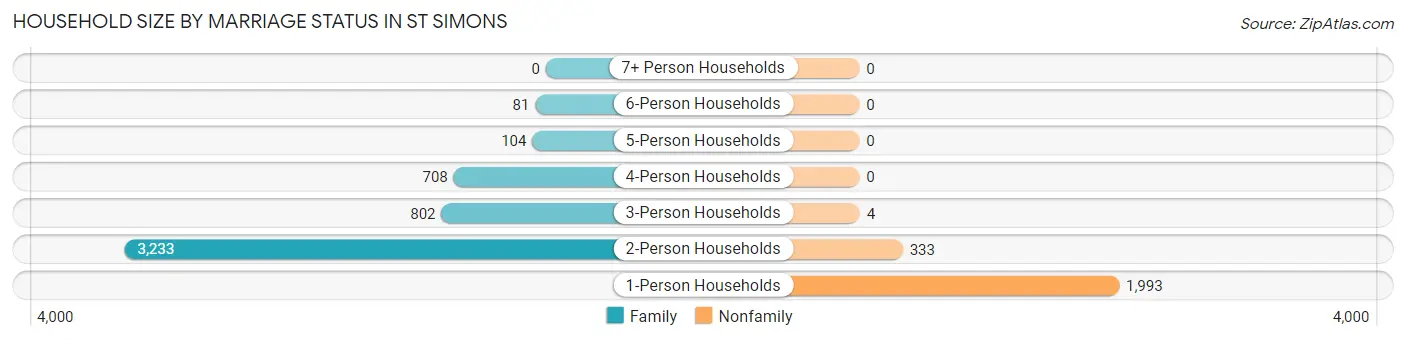
| Household Size | Family Households | Nonfamily Households |
| 1-Person Households | - | 1,993 (27.5%) |
| 2-Person Households | 3,233 (44.5%) | 333 (4.6%) |
| 3-Person Households | 802 (11.1%) | 4 (0.1%) |
| 4-Person Households | 708 (9.8%) | 0 (0.0%) |
| 5-Person Households | 104 (1.4%) | 0 (0.0%) |
| 6-Person Households | 81 (1.1%) | 0 (0.0%) |
| 7+ Person Households | 0 (0.0%) | 0 (0.0%) |
| Total | 4,928 (67.9%) | 2,330 (32.1%) |
Female Fertility in St Simons
Fertility by Age in St Simons
Average fertility rate in St Simons is 28.0 births per 1,000 women. Women in the age bracket of 20 to 34 years have the highest fertility rate with 46.0 births per 1,000 women. Women in the age bracket of 20 to 34 years acount for 67.6% of all women with births.
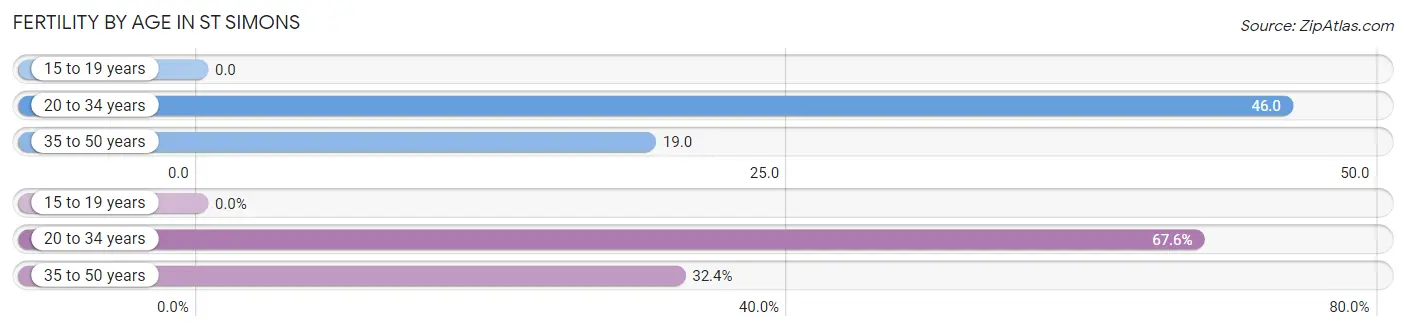
| Age Bracket | Women with Births | Births / 1,000 Women |
| 15 to 19 years | 0 (0.0%) | 0.0 |
| 20 to 34 years | 48 (67.6%) | 46.0 |
| 35 to 50 years | 23 (32.4%) | 19.0 |
| Total | 71 (100.0%) | 28.0 |
Fertility by Age by Marriage Status in St Simons
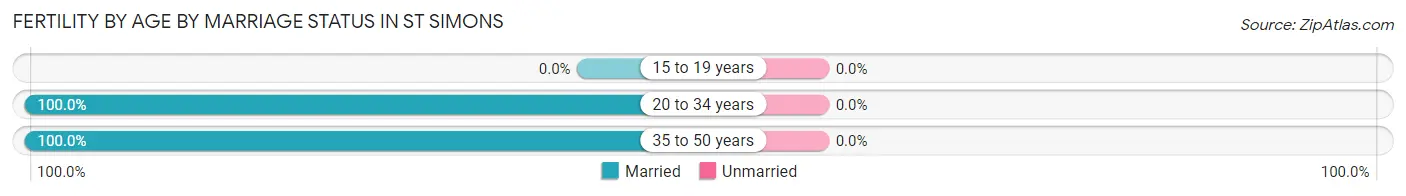
| Age Bracket | Married | Unmarried |
| 15 to 19 years | 0 (0.0%) | 0 (0.0%) |
| 20 to 34 years | 48 (100.0%) | 0 (0.0%) |
| 35 to 50 years | 23 (100.0%) | 0 (0.0%) |
| Total | 71 (100.0%) | 0 (0.0%) |
Fertility by Education in St Simons
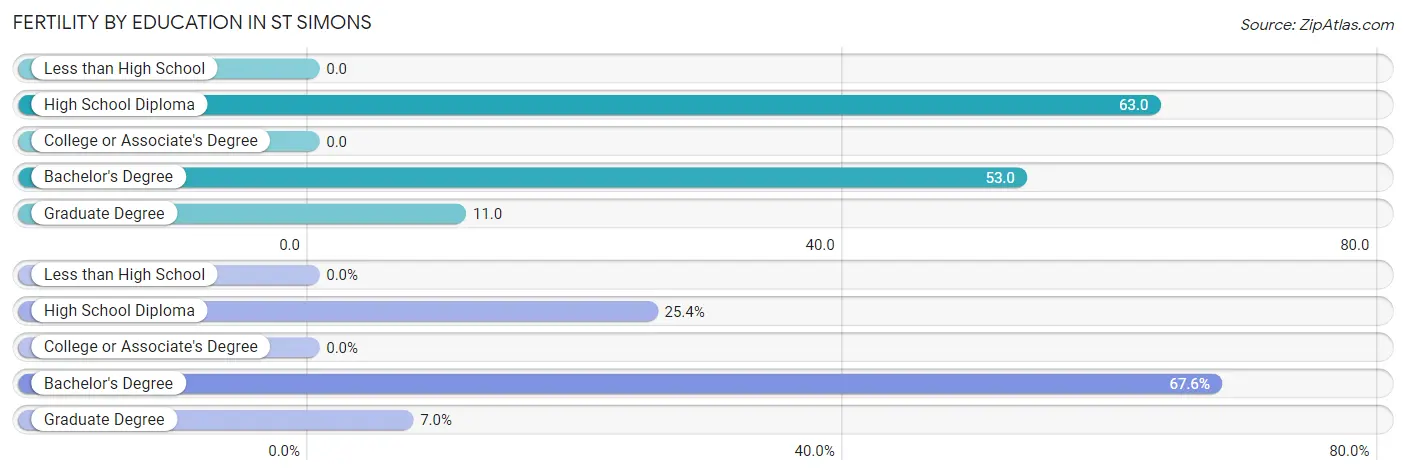
| Educational Attainment | Women with Births | Births / 1,000 Women |
| Less than High School | 0 (0.0%) | 0.0 |
| High School Diploma | 18 (25.4%) | 63.0 |
| College or Associate's Degree | 0 (0.0%) | 0.0 |
| Bachelor's Degree | 48 (67.6%) | 53.0 |
| Graduate Degree | 5 (7.0%) | 11.0 |
| Total | 71 (100.0%) | 28.0 |
Fertility by Education by Marriage Status in St Simons
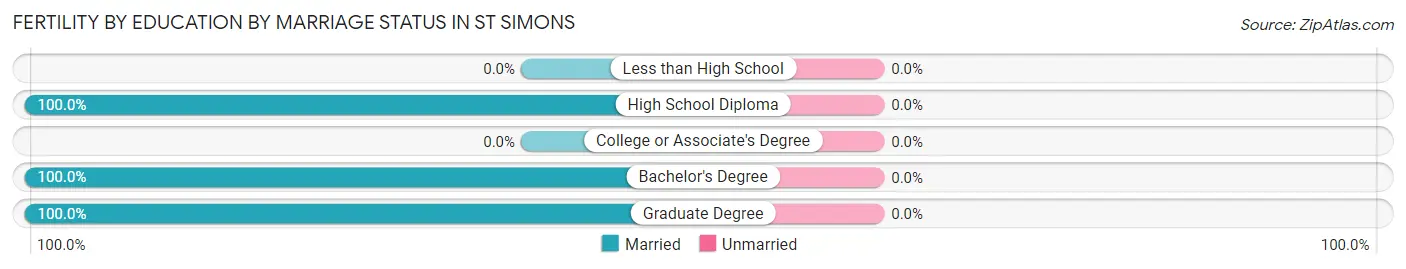
| Educational Attainment | Married | Unmarried |
| Less than High School | 0 (0.0%) | 0 (0.0%) |
| High School Diploma | 18 (100.0%) | 0 (0.0%) |
| College or Associate's Degree | 0 (0.0%) | 0 (0.0%) |
| Bachelor's Degree | 48 (100.0%) | 0 (0.0%) |
| Graduate Degree | 5 (100.0%) | 0 (0.0%) |
| Total | 71 (100.0%) | 0 (0.0%) |
Employment Characteristics in St Simons
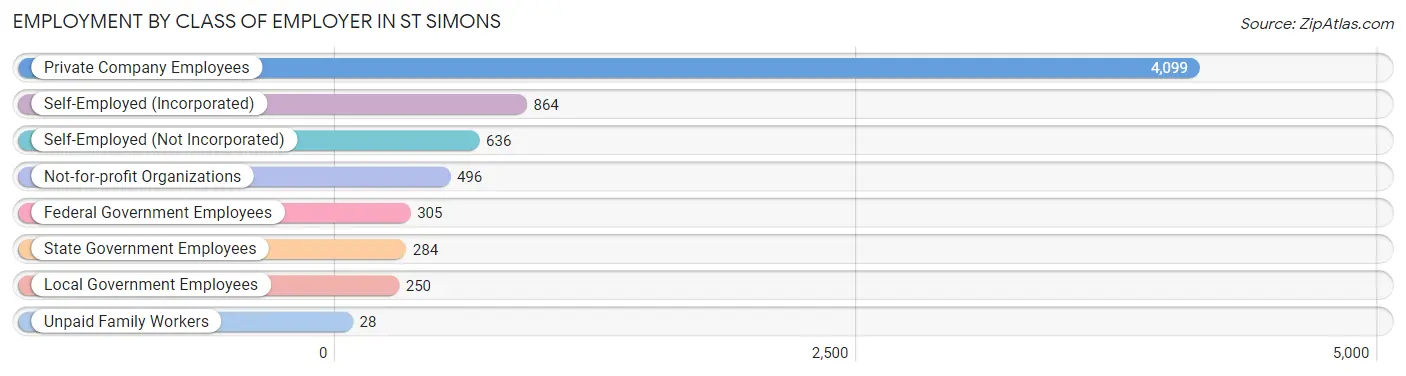
Employment by Class of Employer in St Simons
Among the 6,962 employed individuals in St Simons, private company employees (4,099 | 58.9%), self-employed (incorporated) (864 | 12.4%), and self-employed (not incorporated) (636 | 9.1%) make up the most common classes of employment.
| Employer Class | # Employees | % Employees |
| Private Company Employees | 4,099 | 58.9% |
| Self-Employed (Incorporated) | 864 | 12.4% |
| Self-Employed (Not Incorporated) | 636 | 9.1% |
| Not-for-profit Organizations | 496 | 7.1% |
| Local Government Employees | 250 | 3.6% |
| State Government Employees | 284 | 4.1% |
| Federal Government Employees | 305 | 4.4% |
| Unpaid Family Workers | 28 | 0.4% |
| Total | 6,962 | 100.0% |
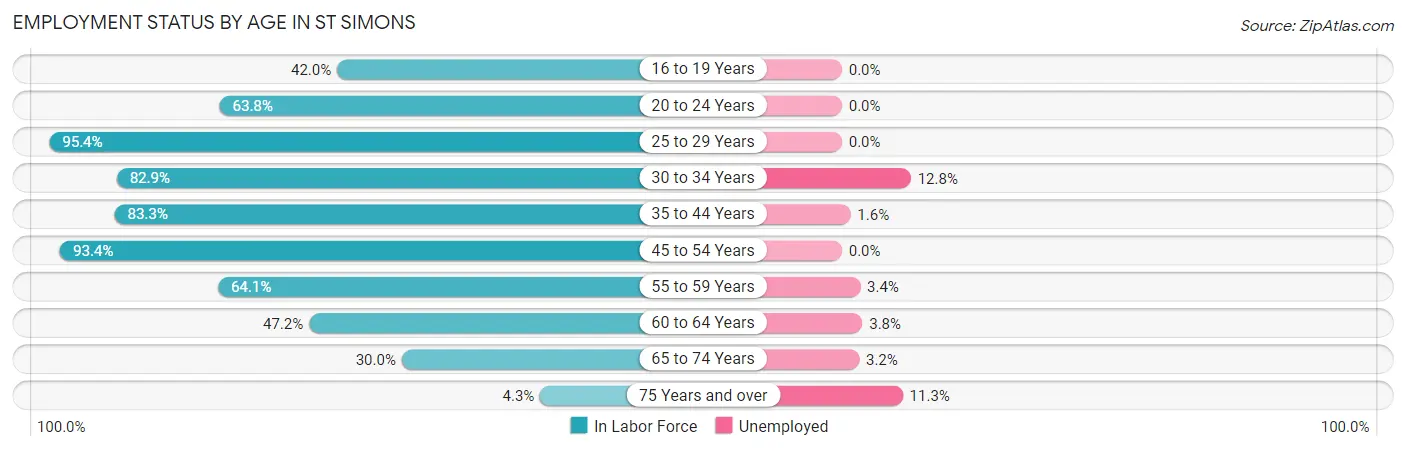
Employment Status by Age in St Simons
According to the labor force statistics for St Simons, out of the total population over 16 years of age (14,200), 51.3% or 7,285 individuals are in the labor force, with 2.7% or 197 of them unemployed. The age group with the highest labor force participation rate is 25 to 29 years, with 95.4% or 564 individuals in the labor force. Within the labor force, the 30 to 34 years age range has the highest percentage of unemployed individuals, with 12.8% or 78 of them being unemployed.
| Age Bracket | In Labor Force | Unemployed |
| 16 to 19 Years | 182 (42.0%) | 0 (0.0%) |
| 20 to 24 Years | 395 (63.8%) | 0 (0.0%) |
| 25 to 29 Years | 564 (95.4%) | 0 (0.0%) |
| 30 to 34 Years | 609 (82.9%) | 78 (12.8%) |
| 35 to 44 Years | 1,103 (83.3%) | 18 (1.6%) |
| 45 to 54 Years | 1,788 (93.4%) | 0 (0.0%) |
| 55 to 59 Years | 760 (64.1%) | 26 (3.4%) |
| 60 to 64 Years | 682 (47.2%) | 26 (3.8%) |
| 65 to 74 Years | 1,112 (30.0%) | 36 (3.2%) |
| 75 Years and over | 97 (4.3%) | 11 (11.3%) |
| Total | 7,285 (51.3%) | 197 (2.7%) |
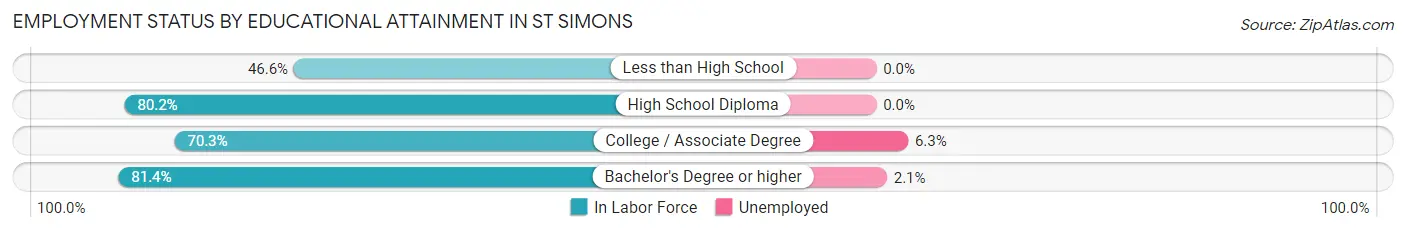
Employment Status by Educational Attainment in St Simons
According to labor force statistics for St Simons, 76.5% of individuals (5,503) out of the total population between 25 and 64 years of age (7,193) are in the labor force, with 2.7% or 149 of them being unemployed. The group with the highest labor force participation rate are those with the educational attainment of bachelor's degree or higher, with 81.4% or 3,212 individuals in the labor force. Within the labor force, individuals with college / associate degree education have the highest percentage of unemployment, with 6.3% or 80 of them being unemployed.
| Educational Attainment | In Labor Force | Unemployed |
| Less than High School | 184 (46.6%) | 0 (0.0%) |
| High School Diploma | 836 (80.2%) | 0 (0.0%) |
| College / Associate Degree | 1,272 (70.3%) | 114 (6.3%) |
| Bachelor's Degree or higher | 3,212 (81.4%) | 83 (2.1%) |
| Total | 5,503 (76.5%) | 194 (2.7%) |
Employment Occupations by Sex in St Simons
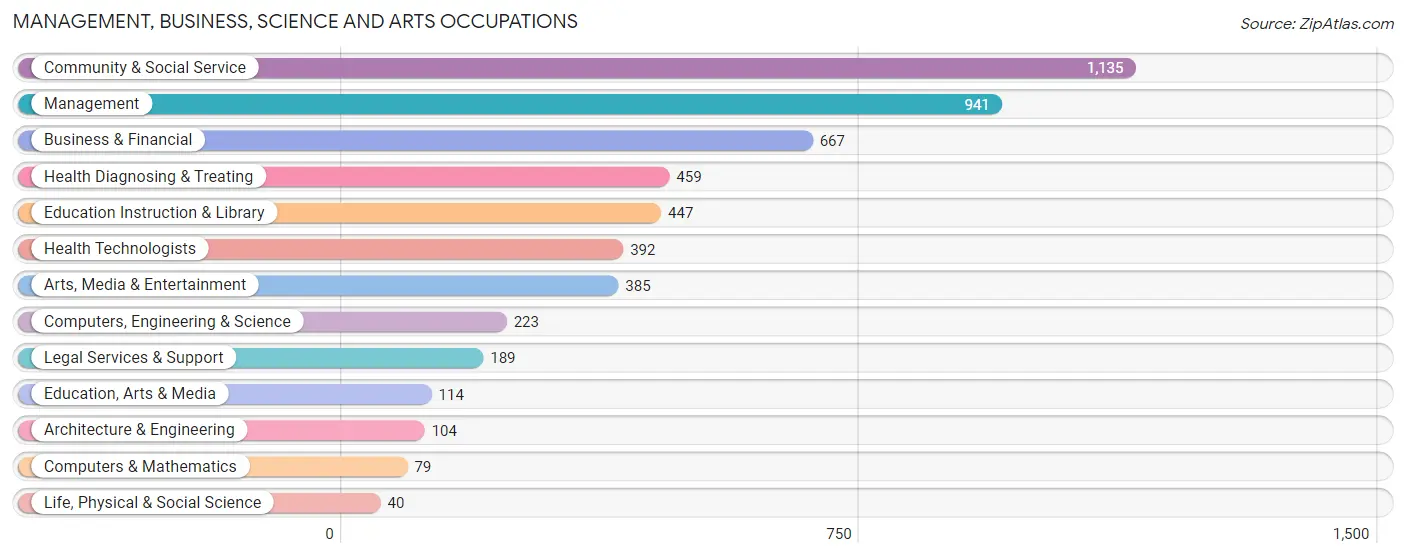
Management, Business, Science and Arts Occupations
The most common Management, Business, Science and Arts occupations in St Simons are Community & Social Service (1,135 | 16.0%), Management (941 | 13.3%), Business & Financial (667 | 9.4%), Health Diagnosing & Treating (459 | 6.5%), and Education Instruction & Library (447 | 6.3%).
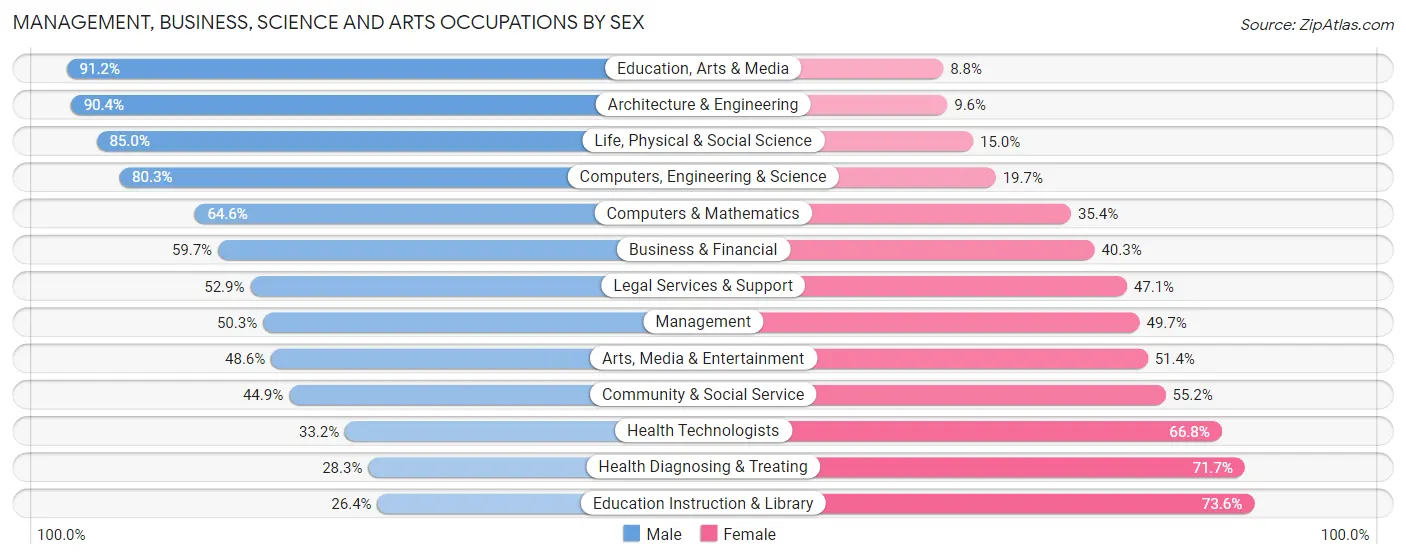
Management, Business, Science and Arts Occupations by Sex
Within the Management, Business, Science and Arts occupations in St Simons, the most male-oriented occupations are Education, Arts & Media (91.2%), Architecture & Engineering (90.4%), and Life, Physical & Social Science (85.0%), while the most female-oriented occupations are Education Instruction & Library (73.6%), Health Diagnosing & Treating (71.7%), and Health Technologists (66.8%).
| Occupation | Male | Female |
| Management | 473 (50.3%) | 468 (49.7%) |
| Business & Financial | 398 (59.7%) | 269 (40.3%) |
| Computers, Engineering & Science | 179 (80.3%) | 44 (19.7%) |
| Computers & Mathematics | 51 (64.6%) | 28 (35.4%) |
| Architecture & Engineering | 94 (90.4%) | 10 (9.6%) |
| Life, Physical & Social Science | 34 (85.0%) | 6 (15.0%) |
| Community & Social Service | 509 (44.9%) | 626 (55.1%) |
| Education, Arts & Media | 104 (91.2%) | 10 (8.8%) |
| Legal Services & Support | 100 (52.9%) | 89 (47.1%) |
| Education Instruction & Library | 118 (26.4%) | 329 (73.6%) |
| Arts, Media & Entertainment | 187 (48.6%) | 198 (51.4%) |
| Health Diagnosing & Treating | 130 (28.3%) | 329 (71.7%) |
| Health Technologists | 130 (33.2%) | 262 (66.8%) |
| Total (Category) | 1,689 (49.3%) | 1,736 (50.7%) |
| Total (Overall) | 3,751 (52.9%) | 3,345 (47.1%) |
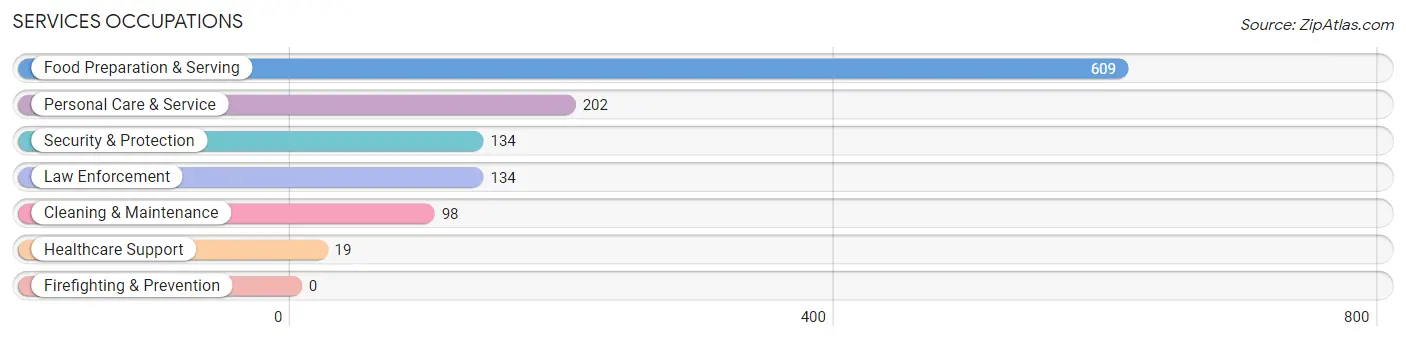
Services Occupations
The most common Services occupations in St Simons are Food Preparation & Serving (609 | 8.6%), Personal Care & Service (202 | 2.9%), Security & Protection (134 | 1.9%), Law Enforcement (134 | 1.9%), and Cleaning & Maintenance (98 | 1.4%).
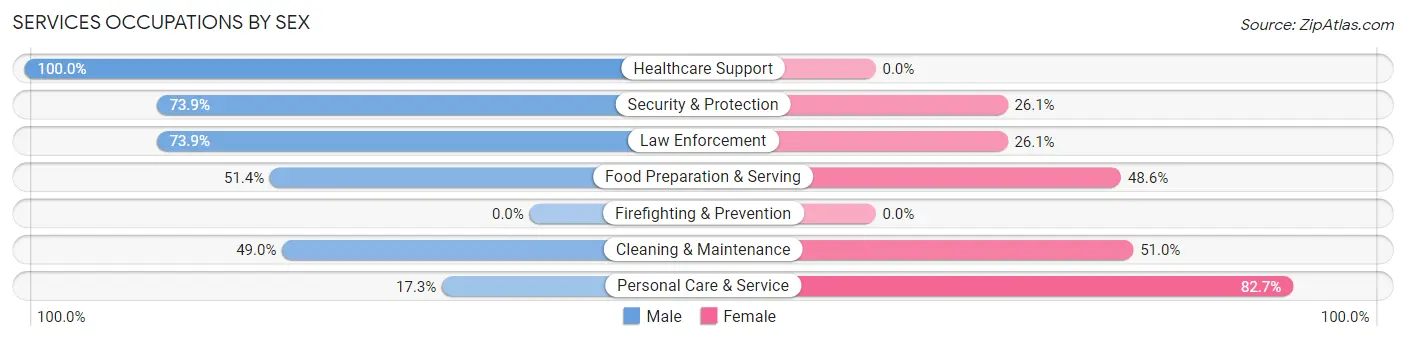
Services Occupations by Sex
Within the Services occupations in St Simons, the most male-oriented occupations are Healthcare Support (100.0%), Security & Protection (73.9%), and Law Enforcement (73.9%), while the most female-oriented occupations are Personal Care & Service (82.7%), Cleaning & Maintenance (51.0%), and Food Preparation & Serving (48.6%).
| Occupation | Male | Female |
| Healthcare Support | 19 (100.0%) | 0 (0.0%) |
| Security & Protection | 99 (73.9%) | 35 (26.1%) |
| Firefighting & Prevention | 0 (0.0%) | 0 (0.0%) |
| Law Enforcement | 99 (73.9%) | 35 (26.1%) |
| Food Preparation & Serving | 313 (51.4%) | 296 (48.6%) |
| Cleaning & Maintenance | 48 (49.0%) | 50 (51.0%) |
| Personal Care & Service | 35 (17.3%) | 167 (82.7%) |
| Total (Category) | 514 (48.4%) | 548 (51.6%) |
| Total (Overall) | 3,751 (52.9%) | 3,345 (47.1%) |
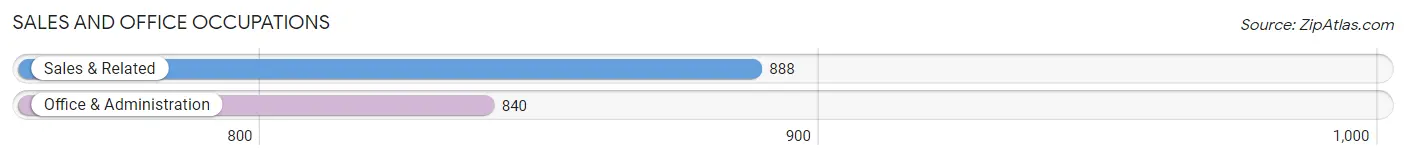
Sales and Office Occupations
The most common Sales and Office occupations in St Simons are Sales & Related (888 | 12.5%), and Office & Administration (840 | 11.8%).
Sales and Office Occupations by Sex
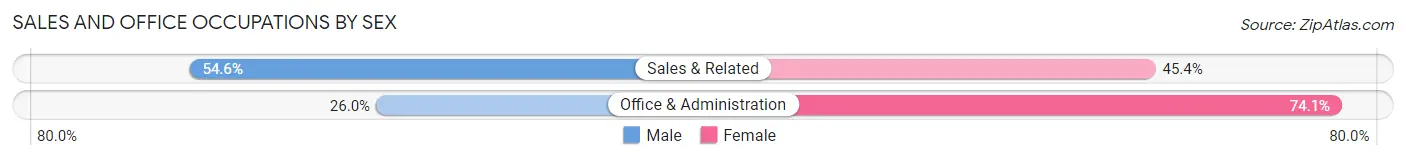
| Occupation | Male | Female |
| Sales & Related | 485 (54.6%) | 403 (45.4%) |
| Office & Administration | 218 (26.0%) | 622 (74.1%) |
| Total (Category) | 703 (40.7%) | 1,025 (59.3%) |
| Total (Overall) | 3,751 (52.9%) | 3,345 (47.1%) |
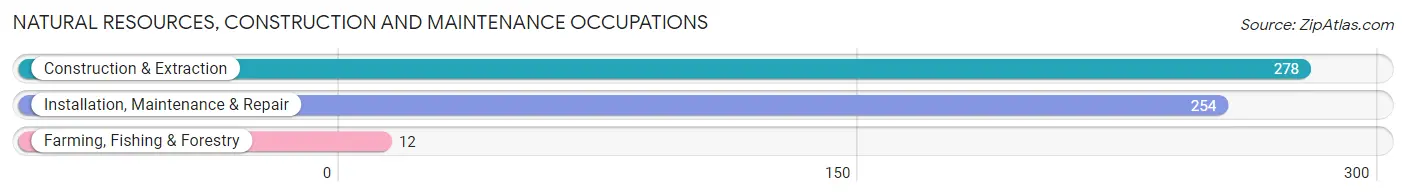
Natural Resources, Construction and Maintenance Occupations
The most common Natural Resources, Construction and Maintenance occupations in St Simons are Construction & Extraction (278 | 3.9%), Installation, Maintenance & Repair (254 | 3.6%), and Farming, Fishing & Forestry (12 | 0.2%).
Natural Resources, Construction and Maintenance Occupations by Sex
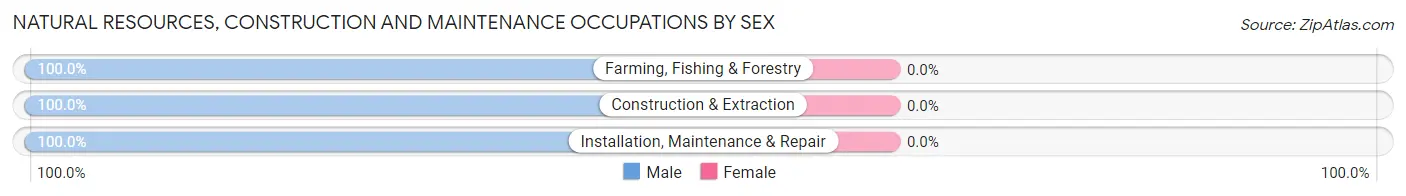
| Occupation | Male | Female |
| Farming, Fishing & Forestry | 12 (100.0%) | 0 (0.0%) |
| Construction & Extraction | 278 (100.0%) | 0 (0.0%) |
| Installation, Maintenance & Repair | 254 (100.0%) | 0 (0.0%) |
| Total (Category) | 544 (100.0%) | 0 (0.0%) |
| Total (Overall) | 3,751 (52.9%) | 3,345 (47.1%) |
Production, Transportation and Moving Occupations
The most common Production, Transportation and Moving occupations in St Simons are Material Moving (205 | 2.9%), Production (99 | 1.4%), and Transportation (33 | 0.5%).
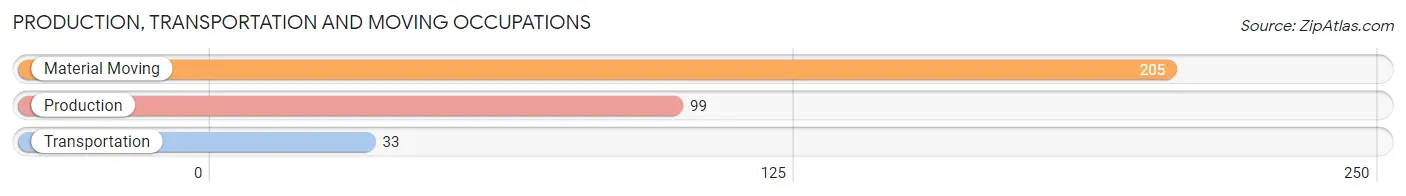
Production, Transportation and Moving Occupations by Sex
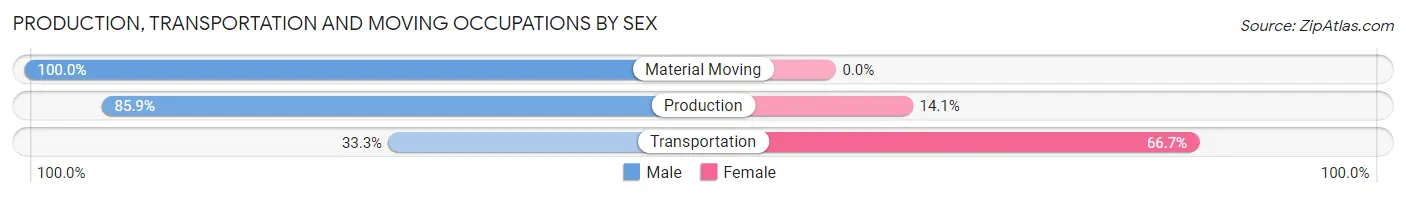
| Occupation | Male | Female |
| Production | 85 (85.9%) | 14 (14.1%) |
| Transportation | 11 (33.3%) | 22 (66.7%) |
| Material Moving | 205 (100.0%) | 0 (0.0%) |
| Total (Category) | 301 (89.3%) | 36 (10.7%) |
| Total (Overall) | 3,751 (52.9%) | 3,345 (47.1%) |
Employment Industries by Sex in St Simons
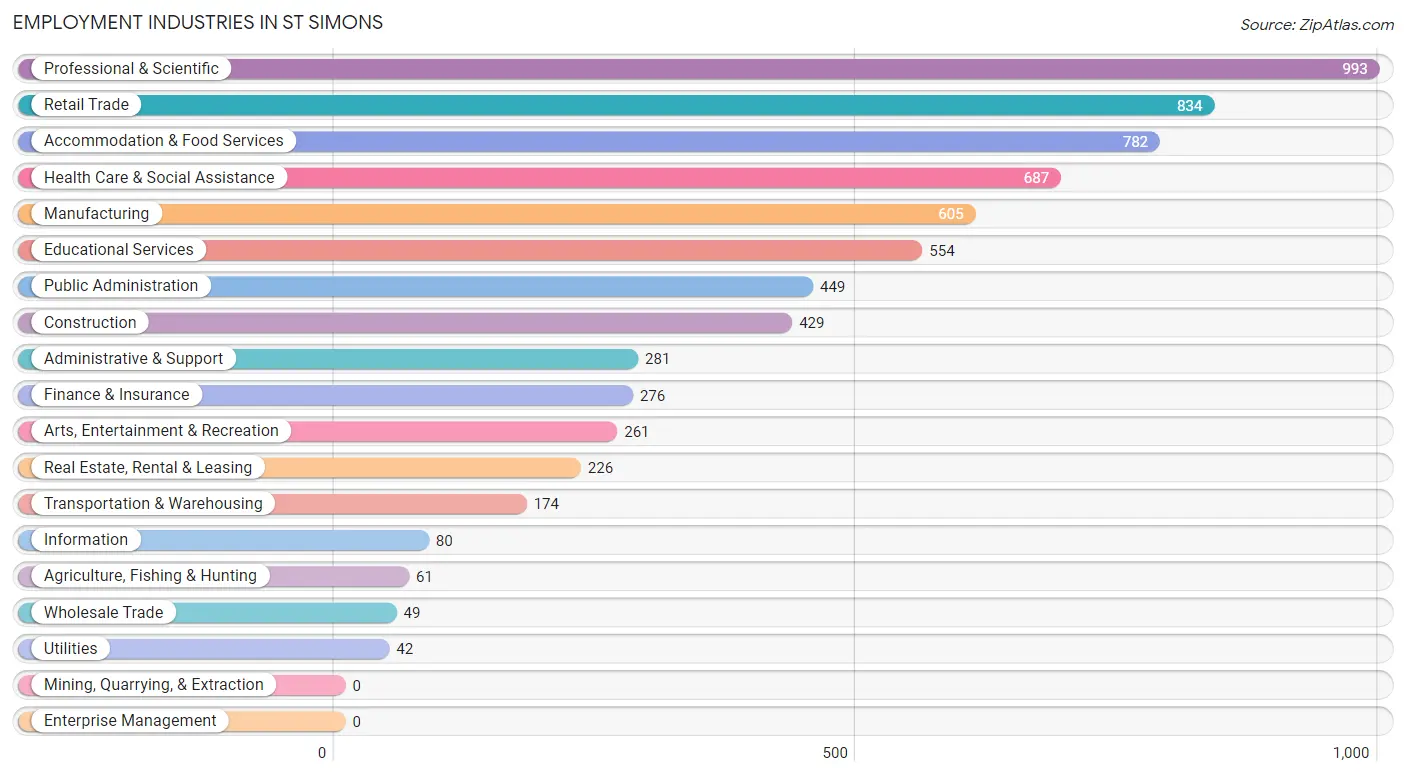
Employment Industries in St Simons
The major employment industries in St Simons include Professional & Scientific (993 | 14.0%), Retail Trade (834 | 11.7%), Accommodation & Food Services (782 | 11.0%), Health Care & Social Assistance (687 | 9.7%), and Manufacturing (605 | 8.5%).
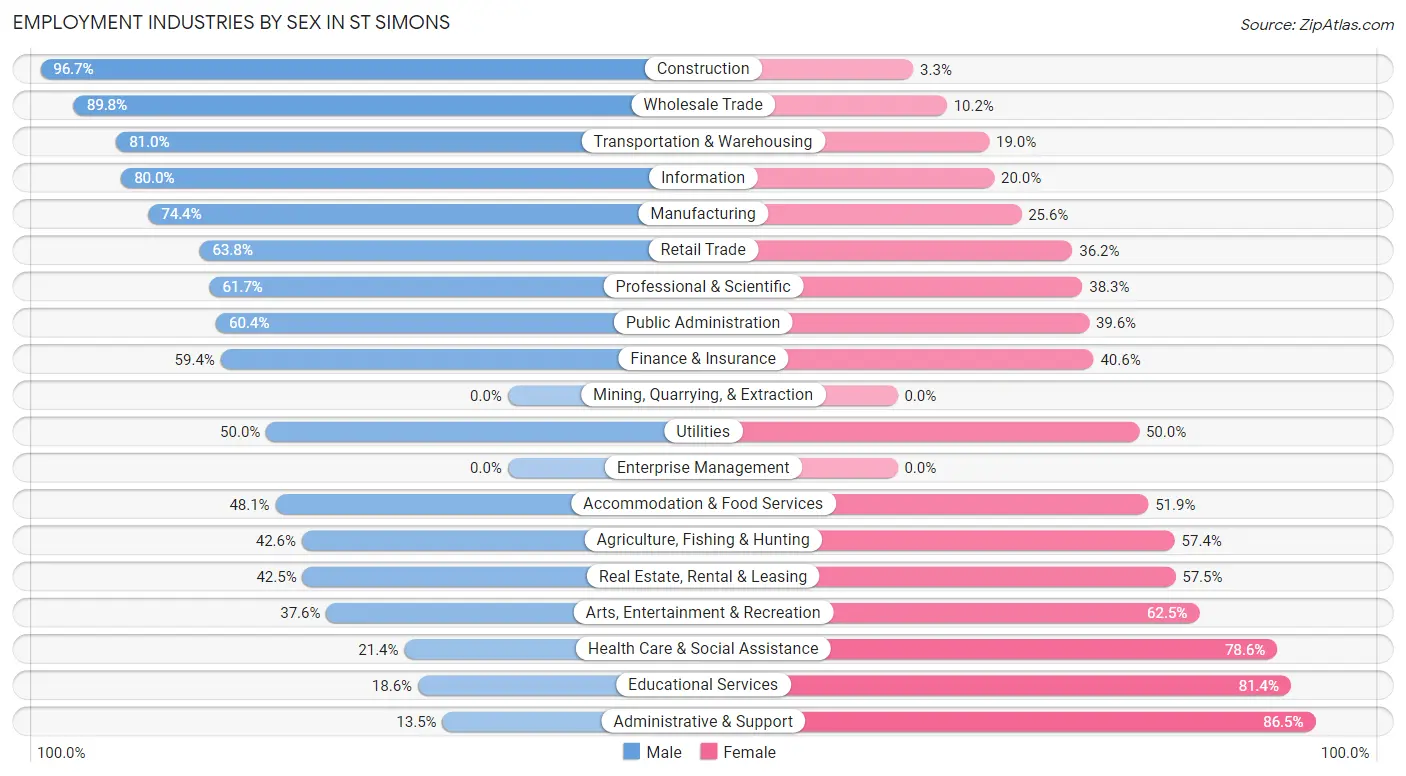
Employment Industries by Sex in St Simons
The St Simons industries that see more men than women are Construction (96.7%), Wholesale Trade (89.8%), and Transportation & Warehousing (81.0%), whereas the industries that tend to have a higher number of women are Administrative & Support (86.5%), Educational Services (81.4%), and Health Care & Social Assistance (78.6%).
| Industry | Male | Female |
| Agriculture, Fishing & Hunting | 26 (42.6%) | 35 (57.4%) |
| Mining, Quarrying, & Extraction | 0 (0.0%) | 0 (0.0%) |
| Construction | 415 (96.7%) | 14 (3.3%) |
| Manufacturing | 450 (74.4%) | 155 (25.6%) |
| Wholesale Trade | 44 (89.8%) | 5 (10.2%) |
| Retail Trade | 532 (63.8%) | 302 (36.2%) |
| Transportation & Warehousing | 141 (81.0%) | 33 (19.0%) |
| Utilities | 21 (50.0%) | 21 (50.0%) |
| Information | 64 (80.0%) | 16 (20.0%) |
| Finance & Insurance | 164 (59.4%) | 112 (40.6%) |
| Real Estate, Rental & Leasing | 96 (42.5%) | 130 (57.5%) |
| Professional & Scientific | 613 (61.7%) | 380 (38.3%) |
| Enterprise Management | 0 (0.0%) | 0 (0.0%) |
| Administrative & Support | 38 (13.5%) | 243 (86.5%) |
| Educational Services | 103 (18.6%) | 451 (81.4%) |
| Health Care & Social Assistance | 147 (21.4%) | 540 (78.6%) |
| Arts, Entertainment & Recreation | 98 (37.6%) | 163 (62.5%) |
| Accommodation & Food Services | 376 (48.1%) | 406 (51.9%) |
| Public Administration | 271 (60.4%) | 178 (39.6%) |
| Total | 3,751 (52.9%) | 3,345 (47.1%) |
Education in St Simons
School Enrollment in St Simons
The most common levels of schooling among the 2,324 students in St Simons are high school (688 | 29.6%), elementary school (498 | 21.4%), and college / undergraduate (343 | 14.8%).
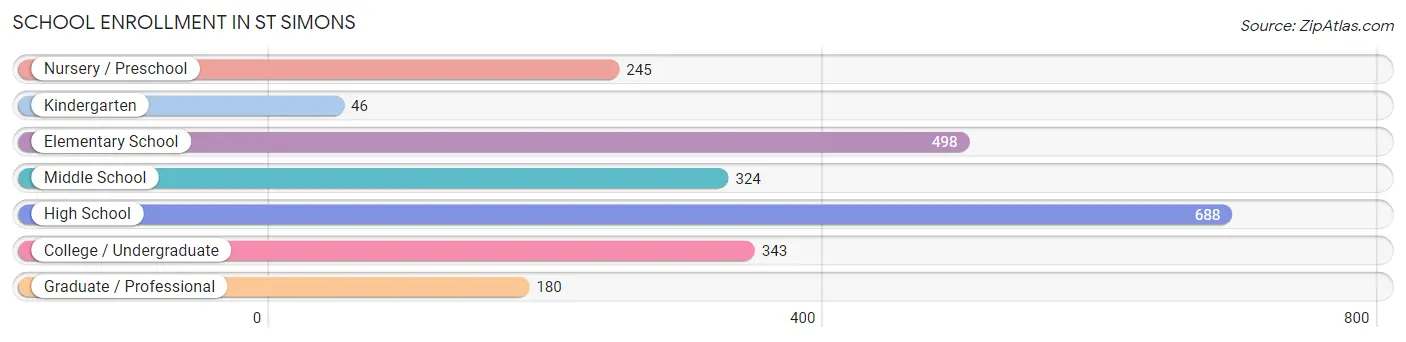
| School Level | # Students | % Students |
| Nursery / Preschool | 245 | 10.5% |
| Kindergarten | 46 | 2.0% |
| Elementary School | 498 | 21.4% |
| Middle School | 324 | 13.9% |
| High School | 688 | 29.6% |
| College / Undergraduate | 343 | 14.8% |
| Graduate / Professional | 180 | 7.7% |
| Total | 2,324 | 100.0% |
School Enrollment by Age by Funding Source in St Simons
Out of a total of 2,324 students who are enrolled in schools in St Simons, 704 (30.3%) attend a private institution, while the remaining 1,620 (69.7%) are enrolled in public schools. The age group of 3 to 4 year olds has the highest likelihood of being enrolled in private schools, with 151 (69.9% in the age bracket) enrolled. Conversely, the age group of 18 to 19 year olds has the lowest likelihood of being enrolled in a private school, with 143 (100.0% in the age bracket) attending a public institution.
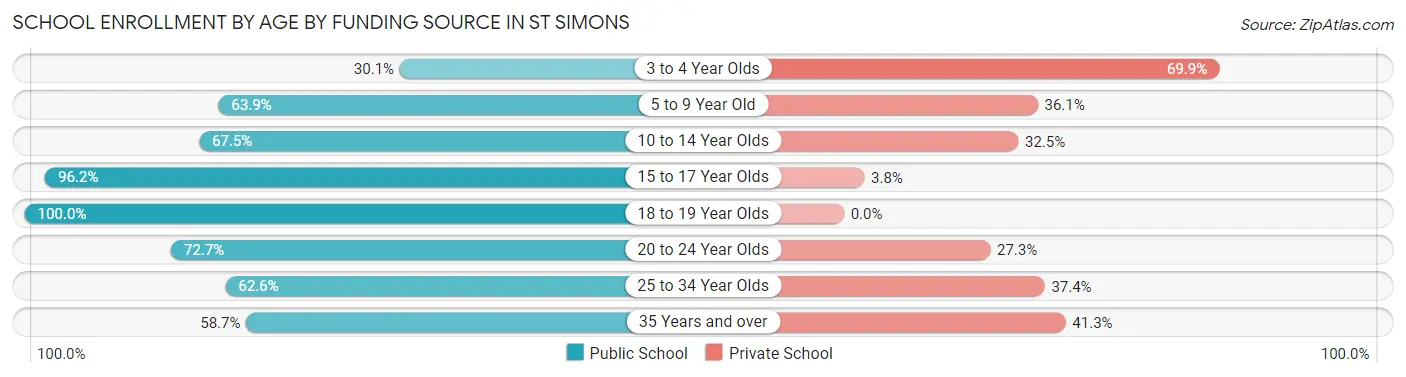
| Age Bracket | Public School | Private School |
| 3 to 4 Year Olds | 65 (30.1%) | 151 (69.9%) |
| 5 to 9 Year Old | 338 (63.9%) | 191 (36.1%) |
| 10 to 14 Year Olds | 318 (67.5%) | 153 (32.5%) |
| 15 to 17 Year Olds | 379 (96.2%) | 15 (3.8%) |
| 18 to 19 Year Olds | 143 (100.0%) | 0 (0.0%) |
| 20 to 24 Year Olds | 192 (72.7%) | 72 (27.3%) |
| 25 to 34 Year Olds | 77 (62.6%) | 46 (37.4%) |
| 35 Years and over | 108 (58.7%) | 76 (41.3%) |
| Total | 1,620 (69.7%) | 704 (30.3%) |
Educational Attainment by Field of Study in St Simons
Business (1,820 | 24.3%), education (976 | 13.0%), social sciences (815 | 10.9%), liberal arts & history (602 | 8.0%), and science & technology (591 | 7.9%) are the most common fields of study among 7,485 individuals in St Simons who have obtained a bachelor's degree or higher.
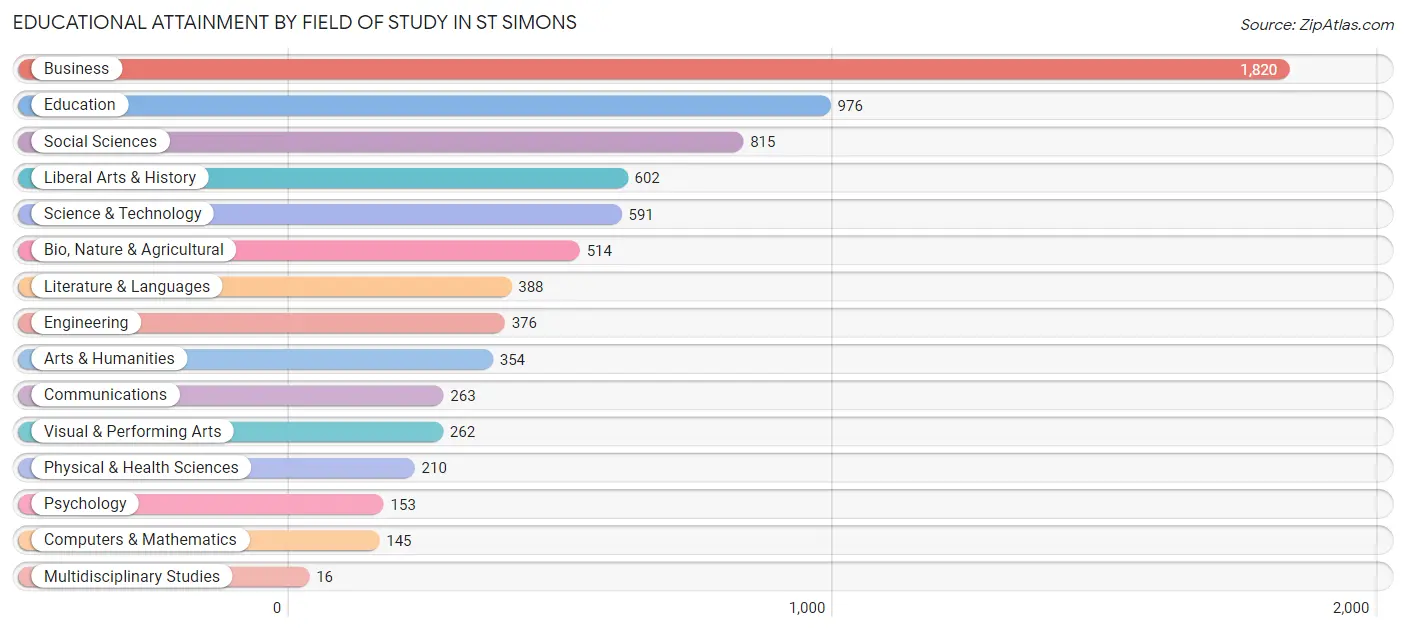
| Field of Study | # Graduates | % Graduates |
| Computers & Mathematics | 145 | 1.9% |
| Bio, Nature & Agricultural | 514 | 6.9% |
| Physical & Health Sciences | 210 | 2.8% |
| Psychology | 153 | 2.0% |
| Social Sciences | 815 | 10.9% |
| Engineering | 376 | 5.0% |
| Multidisciplinary Studies | 16 | 0.2% |
| Science & Technology | 591 | 7.9% |
| Business | 1,820 | 24.3% |
| Education | 976 | 13.0% |
| Literature & Languages | 388 | 5.2% |
| Liberal Arts & History | 602 | 8.0% |
| Visual & Performing Arts | 262 | 3.5% |
| Communications | 263 | 3.5% |
| Arts & Humanities | 354 | 4.7% |
| Total | 7,485 | 100.0% |
Transportation & Commute in St Simons
Vehicle Availability by Sex in St Simons
The most prevalent vehicle ownership categories in St Simons are males with 2 vehicles (2,039, accounting for 55.3%) and females with 2 vehicles (1,677, making up 62.3%).
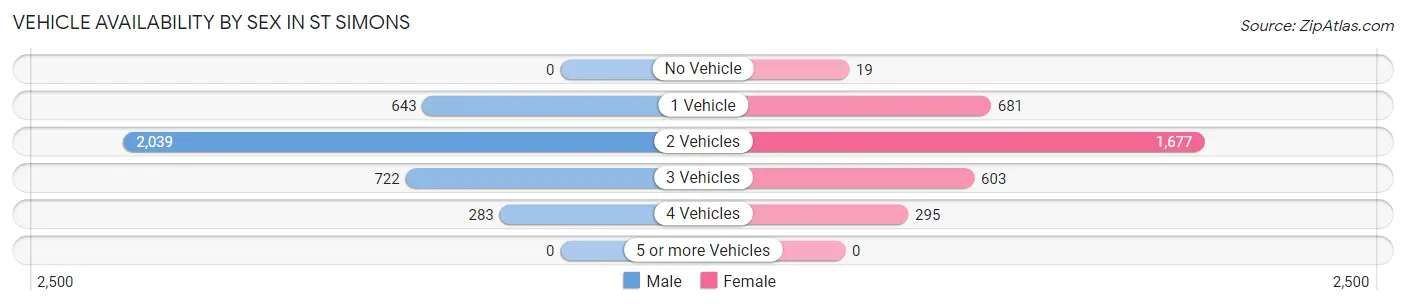
| Vehicles Available | Male | Female |
| No Vehicle | 0 (0.0%) | 19 (0.6%) |
| 1 Vehicle | 643 (17.4%) | 681 (20.8%) |
| 2 Vehicles | 2,039 (55.3%) | 1,677 (51.2%) |
| 3 Vehicles | 722 (19.6%) | 603 (18.4%) |
| 4 Vehicles | 283 (7.7%) | 295 (9.0%) |
| 5 or more Vehicles | 0 (0.0%) | 0 (0.0%) |
| Total | 3,687 (100.0%) | 3,275 (100.0%) |
Commute Time in St Simons
The most frequently occuring commute durations in St Simons are 10 to 14 minutes (1,361 commuters, 23.0%), 20 to 24 minutes (1,267 commuters, 21.4%), and 5 to 9 minutes (949 commuters, 16.1%).
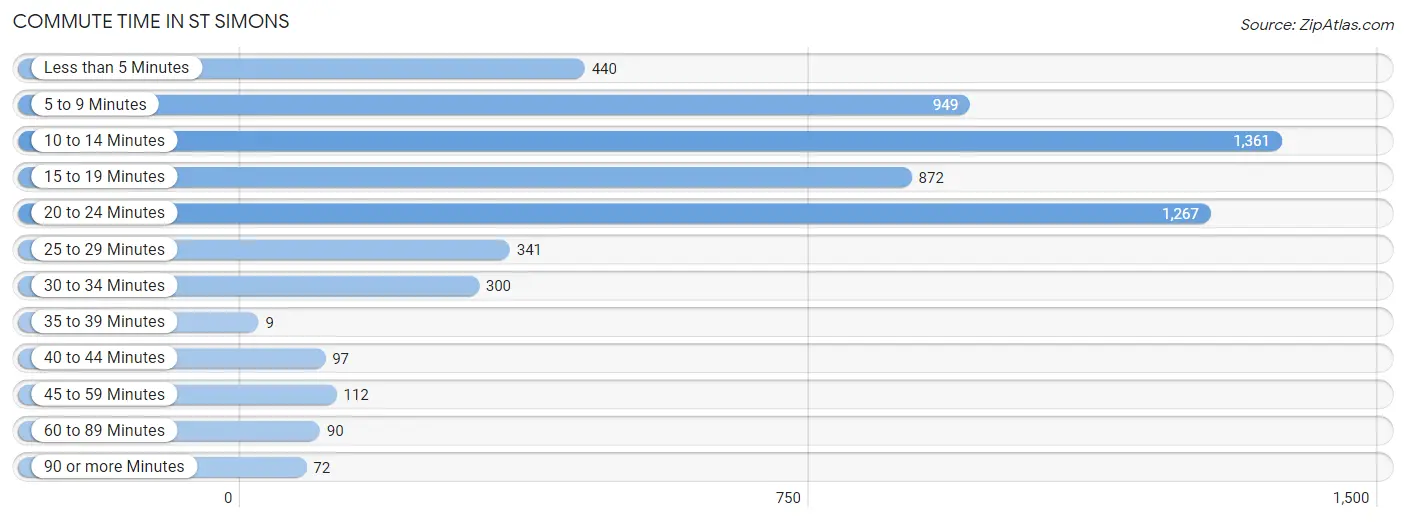
| Commute Time | # Commuters | % Commuters |
| Less than 5 Minutes | 440 | 7.4% |
| 5 to 9 Minutes | 949 | 16.1% |
| 10 to 14 Minutes | 1,361 | 23.0% |
| 15 to 19 Minutes | 872 | 14.7% |
| 20 to 24 Minutes | 1,267 | 21.4% |
| 25 to 29 Minutes | 341 | 5.8% |
| 30 to 34 Minutes | 300 | 5.1% |
| 35 to 39 Minutes | 9 | 0.2% |
| 40 to 44 Minutes | 97 | 1.6% |
| 45 to 59 Minutes | 112 | 1.9% |
| 60 to 89 Minutes | 90 | 1.5% |
| 90 or more Minutes | 72 | 1.2% |
Commute Time by Sex in St Simons
The most common commute times in St Simons are 20 to 24 minutes (840 commuters, 25.3%) for males and 10 to 14 minutes (630 commuters, 24.3%) for females.
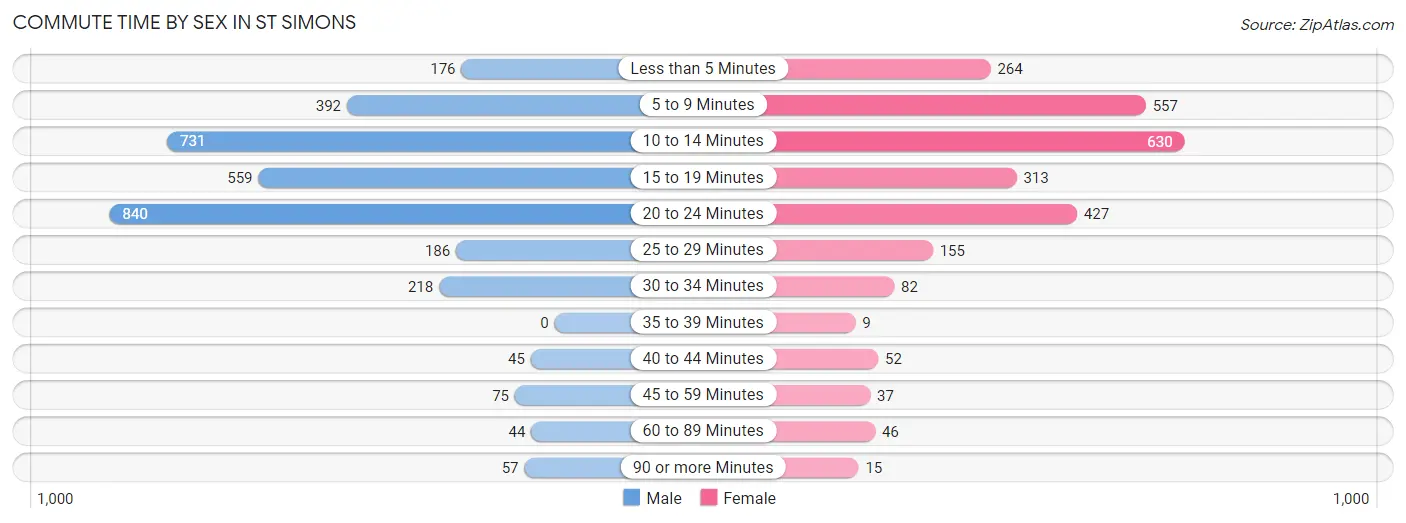
| Commute Time | Male | Female |
| Less than 5 Minutes | 176 (5.3%) | 264 (10.2%) |
| 5 to 9 Minutes | 392 (11.8%) | 557 (21.5%) |
| 10 to 14 Minutes | 731 (22.0%) | 630 (24.3%) |
| 15 to 19 Minutes | 559 (16.8%) | 313 (12.1%) |
| 20 to 24 Minutes | 840 (25.3%) | 427 (16.5%) |
| 25 to 29 Minutes | 186 (5.6%) | 155 (6.0%) |
| 30 to 34 Minutes | 218 (6.6%) | 82 (3.2%) |
| 35 to 39 Minutes | 0 (0.0%) | 9 (0.4%) |
| 40 to 44 Minutes | 45 (1.3%) | 52 (2.0%) |
| 45 to 59 Minutes | 75 (2.3%) | 37 (1.4%) |
| 60 to 89 Minutes | 44 (1.3%) | 46 (1.8%) |
| 90 or more Minutes | 57 (1.7%) | 15 (0.6%) |
Time of Departure to Work by Sex in St Simons
The most frequent times of departure to work in St Simons are 7:30 AM to 7:59 AM (622, 18.7%) for males and 8:00 AM to 8:29 AM (405, 15.7%) for females.
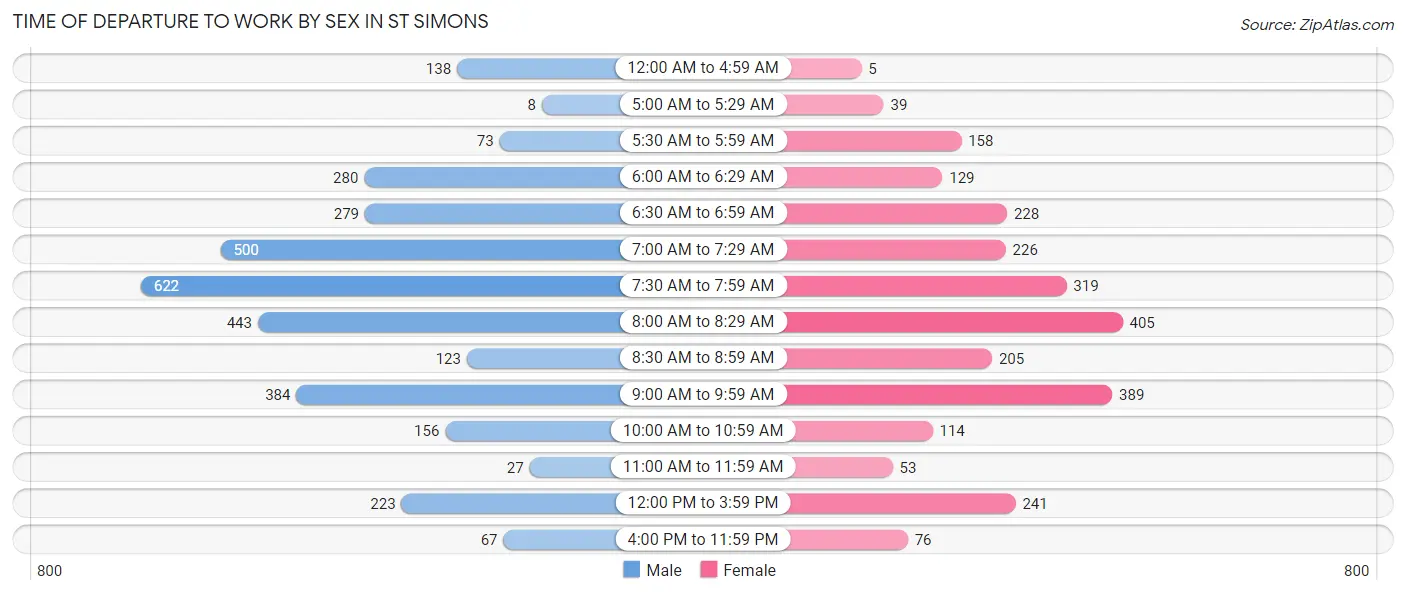
| Time of Departure | Male | Female |
| 12:00 AM to 4:59 AM | 138 (4.2%) | 5 (0.2%) |
| 5:00 AM to 5:29 AM | 8 (0.2%) | 39 (1.5%) |
| 5:30 AM to 5:59 AM | 73 (2.2%) | 158 (6.1%) |
| 6:00 AM to 6:29 AM | 280 (8.4%) | 129 (5.0%) |
| 6:30 AM to 6:59 AM | 279 (8.4%) | 228 (8.8%) |
| 7:00 AM to 7:29 AM | 500 (15.0%) | 226 (8.7%) |
| 7:30 AM to 7:59 AM | 622 (18.7%) | 319 (12.3%) |
| 8:00 AM to 8:29 AM | 443 (13.3%) | 405 (15.7%) |
| 8:30 AM to 8:59 AM | 123 (3.7%) | 205 (7.9%) |
| 9:00 AM to 9:59 AM | 384 (11.6%) | 389 (15.0%) |
| 10:00 AM to 10:59 AM | 156 (4.7%) | 114 (4.4%) |
| 11:00 AM to 11:59 AM | 27 (0.8%) | 53 (2.1%) |
| 12:00 PM to 3:59 PM | 223 (6.7%) | 241 (9.3%) |
| 4:00 PM to 11:59 PM | 67 (2.0%) | 76 (2.9%) |
| Total | 3,323 (100.0%) | 2,587 (100.0%) |
Housing Occupancy in St Simons
Occupancy by Ownership in St Simons
Of the total 7,258 dwellings in St Simons, owner-occupied units account for 6,160 (84.9%), while renter-occupied units make up 1,098 (15.1%).
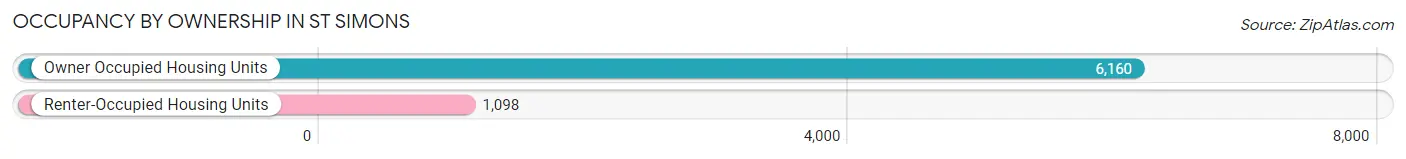
| Occupancy | # Housing Units | % Housing Units |
| Owner Occupied Housing Units | 6,160 | 84.9% |
| Renter-Occupied Housing Units | 1,098 | 15.1% |
| Total Occupied Housing Units | 7,258 | 100.0% |
Occupancy by Household Size in St Simons
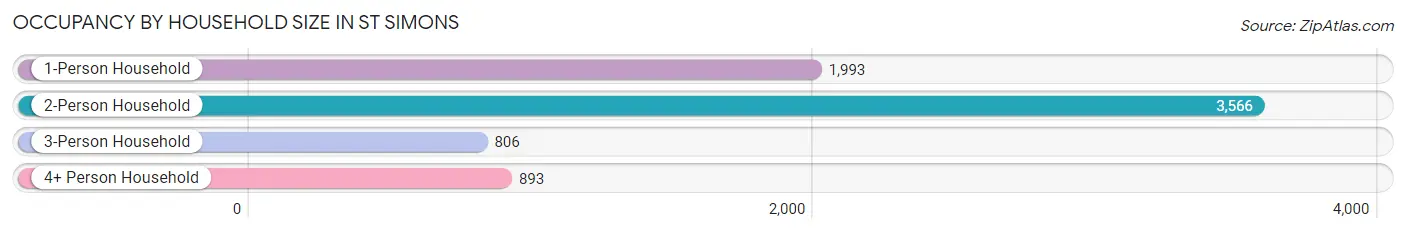
| Household Size | # Housing Units | % Housing Units |
| 1-Person Household | 1,993 | 27.5% |
| 2-Person Household | 3,566 | 49.1% |
| 3-Person Household | 806 | 11.1% |
| 4+ Person Household | 893 | 12.3% |
| Total Housing Units | 7,258 | 100.0% |
Occupancy by Ownership by Household Size in St Simons
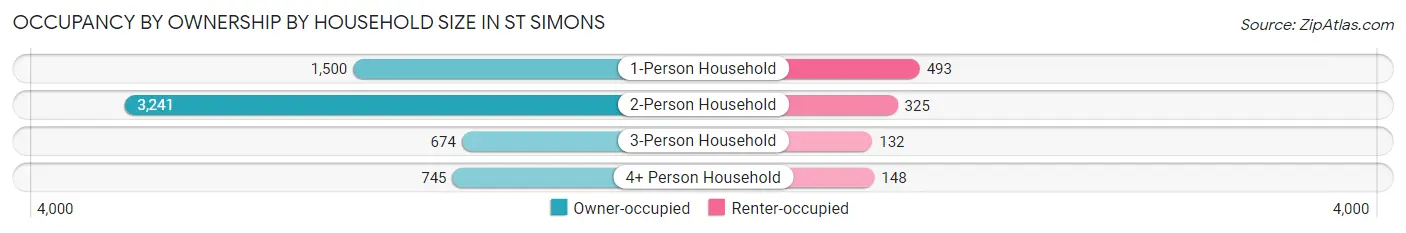
| Household Size | Owner-occupied | Renter-occupied |
| 1-Person Household | 1,500 (75.3%) | 493 (24.7%) |
| 2-Person Household | 3,241 (90.9%) | 325 (9.1%) |
| 3-Person Household | 674 (83.6%) | 132 (16.4%) |
| 4+ Person Household | 745 (83.4%) | 148 (16.6%) |
| Total Housing Units | 6,160 (84.9%) | 1,098 (15.1%) |
Occupancy by Educational Attainment in St Simons
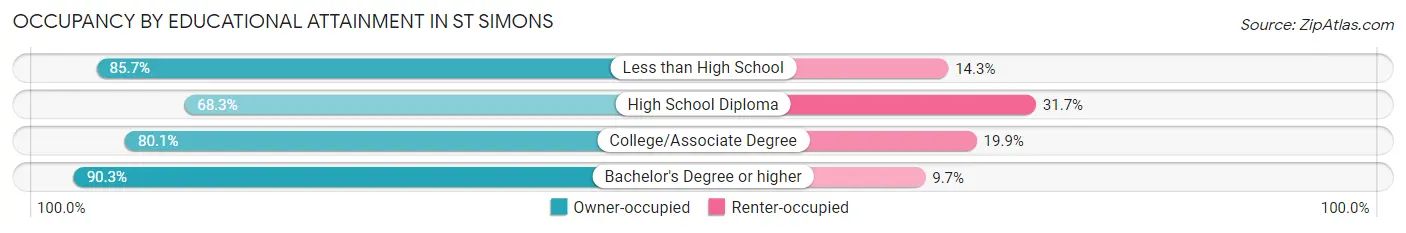
| Household Size | Owner-occupied | Renter-occupied |
| Less than High School | 186 (85.7%) | 31 (14.3%) |
| High School Diploma | 630 (68.3%) | 292 (31.7%) |
| College/Associate Degree | 1,407 (80.1%) | 350 (19.9%) |
| Bachelor's Degree or higher | 3,937 (90.3%) | 425 (9.7%) |
Occupancy by Age of Householder in St Simons
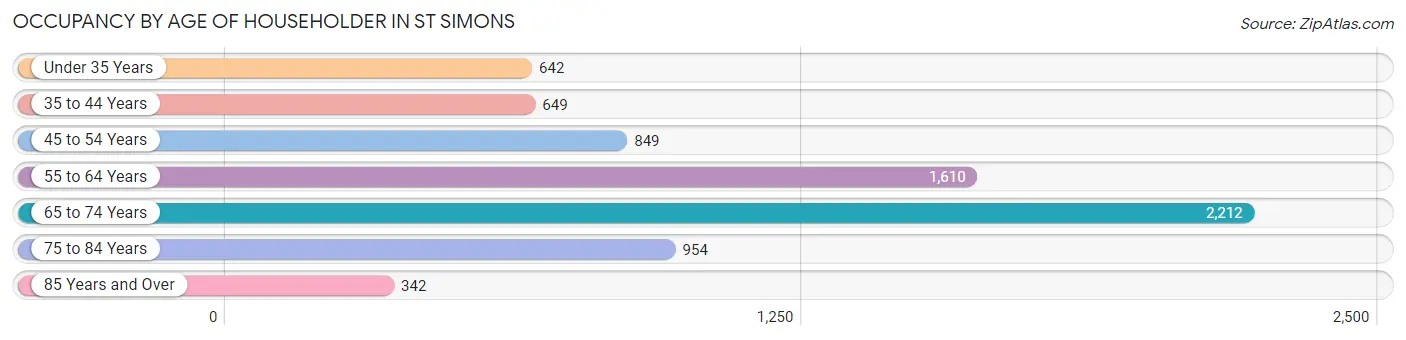
| Age Bracket | # Households | % Households |
| Under 35 Years | 642 | 8.8% |
| 35 to 44 Years | 649 | 8.9% |
| 45 to 54 Years | 849 | 11.7% |
| 55 to 64 Years | 1,610 | 22.2% |
| 65 to 74 Years | 2,212 | 30.5% |
| 75 to 84 Years | 954 | 13.1% |
| 85 Years and Over | 342 | 4.7% |
| Total | 7,258 | 100.0% |
Housing Finances in St Simons
Median Income by Occupancy in St Simons
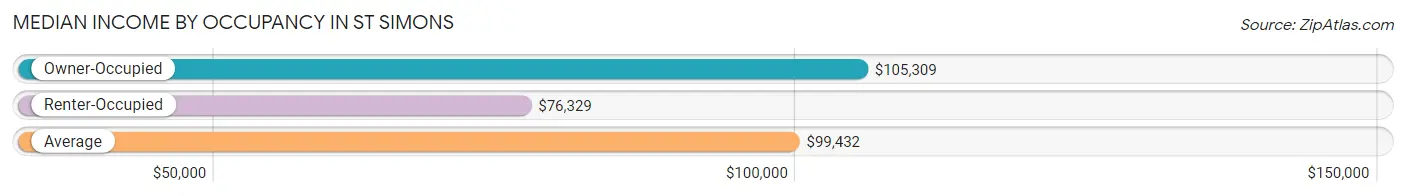
| Occupancy Type | # Households | Median Income |
| Owner-Occupied | 6,160 (84.9%) | $105,309 |
| Renter-Occupied | 1,098 (15.1%) | $76,329 |
| Average | 7,258 (100.0%) | $99,432 |
Occupancy by Householder Income Bracket in St Simons
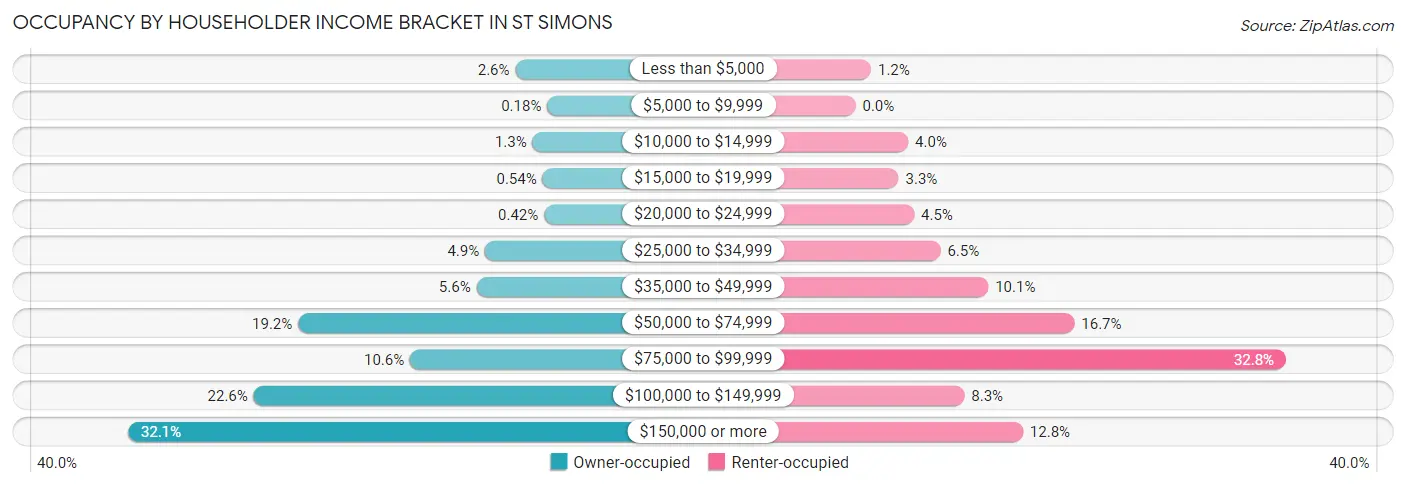
| Income Bracket | Owner-occupied | Renter-occupied |
| Less than $5,000 | 161 (2.6%) | 13 (1.2%) |
| $5,000 to $9,999 | 11 (0.2%) | 0 (0.0%) |
| $10,000 to $14,999 | 80 (1.3%) | 44 (4.0%) |
| $15,000 to $19,999 | 33 (0.5%) | 36 (3.3%) |
| $20,000 to $24,999 | 26 (0.4%) | 49 (4.5%) |
| $25,000 to $34,999 | 303 (4.9%) | 71 (6.5%) |
| $35,000 to $49,999 | 343 (5.6%) | 111 (10.1%) |
| $50,000 to $74,999 | 1,180 (19.2%) | 183 (16.7%) |
| $75,000 to $99,999 | 655 (10.6%) | 360 (32.8%) |
| $100,000 to $149,999 | 1,389 (22.6%) | 91 (8.3%) |
| $150,000 or more | 1,979 (32.1%) | 140 (12.8%) |
| Total | 6,160 (100.0%) | 1,098 (100.0%) |
Monthly Housing Cost Tiers in St Simons
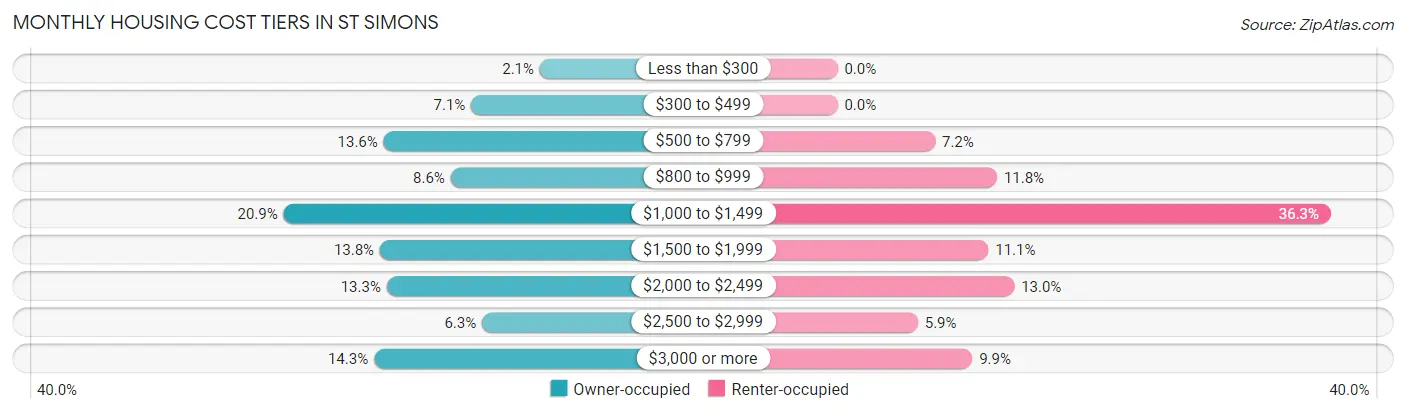
| Monthly Cost | Owner-occupied | Renter-occupied |
| Less than $300 | 126 (2.1%) | 0 (0.0%) |
| $300 to $499 | 438 (7.1%) | 0 (0.0%) |
| $500 to $799 | 835 (13.6%) | 79 (7.2%) |
| $800 to $999 | 531 (8.6%) | 129 (11.7%) |
| $1,000 to $1,499 | 1,289 (20.9%) | 399 (36.3%) |
| $1,500 to $1,999 | 852 (13.8%) | 122 (11.1%) |
| $2,000 to $2,499 | 821 (13.3%) | 143 (13.0%) |
| $2,500 to $2,999 | 389 (6.3%) | 65 (5.9%) |
| $3,000 or more | 879 (14.3%) | 109 (9.9%) |
| Total | 6,160 (100.0%) | 1,098 (100.0%) |
Physical Housing Characteristics in St Simons
Housing Structures in St Simons
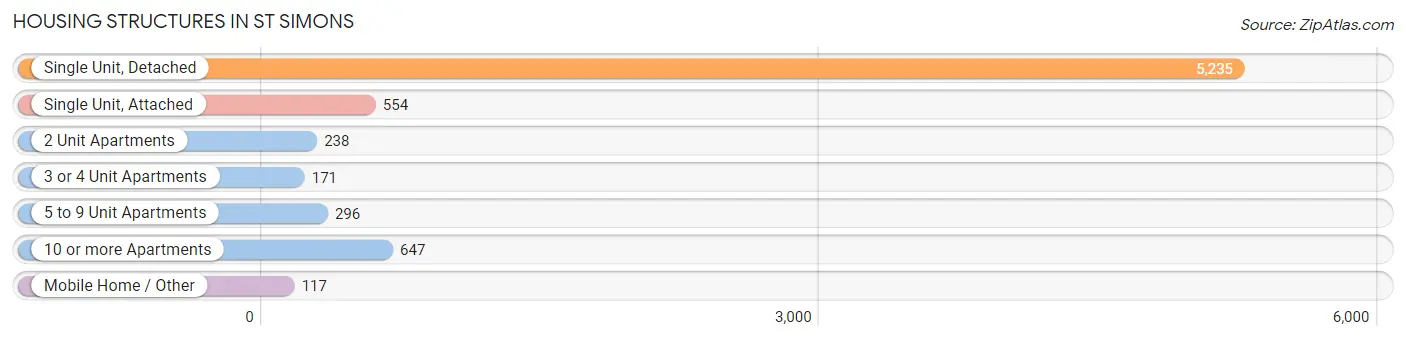
| Structure Type | # Housing Units | % Housing Units |
| Single Unit, Detached | 5,235 | 72.1% |
| Single Unit, Attached | 554 | 7.6% |
| 2 Unit Apartments | 238 | 3.3% |
| 3 or 4 Unit Apartments | 171 | 2.4% |
| 5 to 9 Unit Apartments | 296 | 4.1% |
| 10 or more Apartments | 647 | 8.9% |
| Mobile Home / Other | 117 | 1.6% |
| Total | 7,258 | 100.0% |
Housing Structures by Occupancy in St Simons
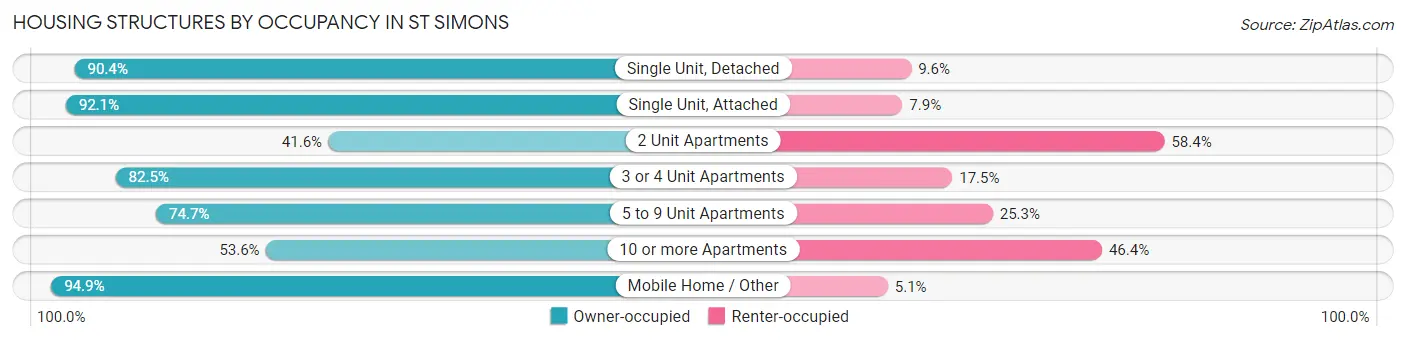
| Structure Type | Owner-occupied | Renter-occupied |
| Single Unit, Detached | 4,731 (90.4%) | 504 (9.6%) |
| Single Unit, Attached | 510 (92.1%) | 44 (7.9%) |
| 2 Unit Apartments | 99 (41.6%) | 139 (58.4%) |
| 3 or 4 Unit Apartments | 141 (82.5%) | 30 (17.5%) |
| 5 to 9 Unit Apartments | 221 (74.7%) | 75 (25.3%) |
| 10 or more Apartments | 347 (53.6%) | 300 (46.4%) |
| Mobile Home / Other | 111 (94.9%) | 6 (5.1%) |
| Total | 6,160 (84.9%) | 1,098 (15.1%) |
Housing Structures by Number of Rooms in St Simons
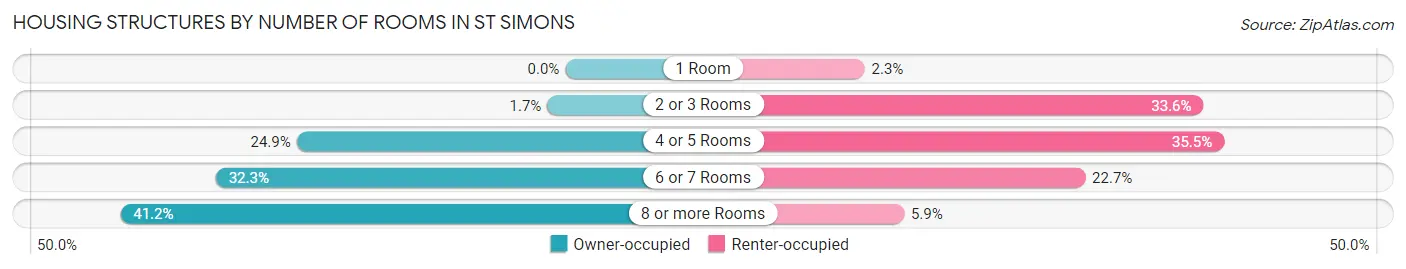
| Number of Rooms | Owner-occupied | Renter-occupied |
| 1 Room | 0 (0.0%) | 25 (2.3%) |
| 2 or 3 Rooms | 103 (1.7%) | 369 (33.6%) |
| 4 or 5 Rooms | 1,531 (24.8%) | 390 (35.5%) |
| 6 or 7 Rooms | 1,991 (32.3%) | 249 (22.7%) |
| 8 or more Rooms | 2,535 (41.1%) | 65 (5.9%) |
| Total | 6,160 (100.0%) | 1,098 (100.0%) |
Housing Structure by Heating Type in St Simons
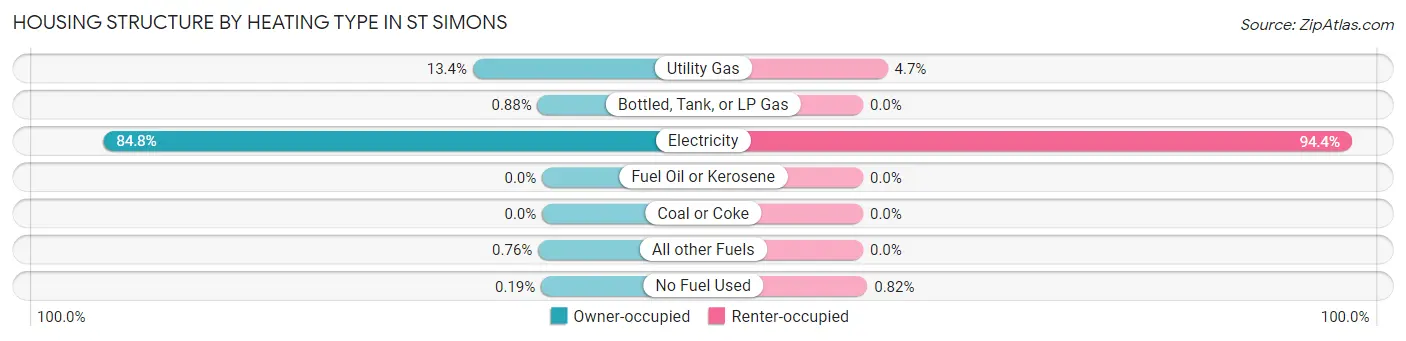
| Heating Type | Owner-occupied | Renter-occupied |
| Utility Gas | 825 (13.4%) | 52 (4.7%) |
| Bottled, Tank, or LP Gas | 54 (0.9%) | 0 (0.0%) |
| Electricity | 5,222 (84.8%) | 1,037 (94.4%) |
| Fuel Oil or Kerosene | 0 (0.0%) | 0 (0.0%) |
| Coal or Coke | 0 (0.0%) | 0 (0.0%) |
| All other Fuels | 47 (0.8%) | 0 (0.0%) |
| No Fuel Used | 12 (0.2%) | 9 (0.8%) |
| Total | 6,160 (100.0%) | 1,098 (100.0%) |
Household Vehicle Usage in St Simons
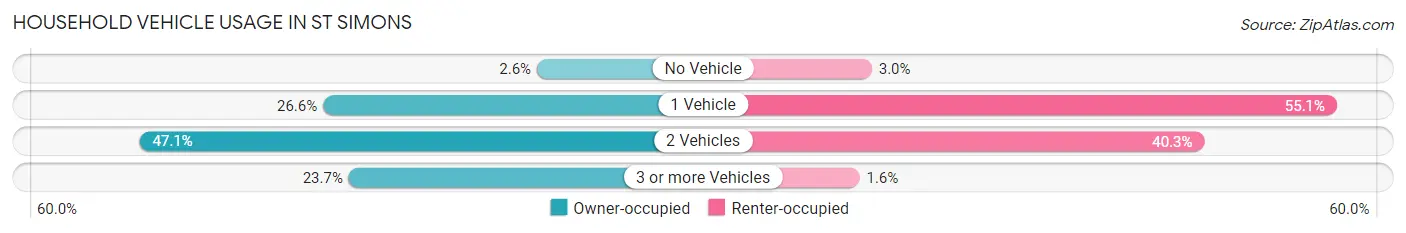
| Vehicles per Household | Owner-occupied | Renter-occupied |
| No Vehicle | 161 (2.6%) | 33 (3.0%) |
| 1 Vehicle | 1,637 (26.6%) | 605 (55.1%) |
| 2 Vehicles | 2,903 (47.1%) | 442 (40.3%) |
| 3 or more Vehicles | 1,459 (23.7%) | 18 (1.6%) |
| Total | 6,160 (100.0%) | 1,098 (100.0%) |
Real Estate & Mortgages in St Simons
Real Estate and Mortgage Overview in St Simons
| Characteristic | Without Mortgage | With Mortgage |
| Housing Units | 2,377 | 3,783 |
| Median Property Value | $470,500 | $436,600 |
| Median Household Income | $81,446 | $1,461 |
| Monthly Housing Costs | $735 | $868 |
| Real Estate Taxes | $2,382 | $64 |
Property Value by Mortgage Status in St Simons
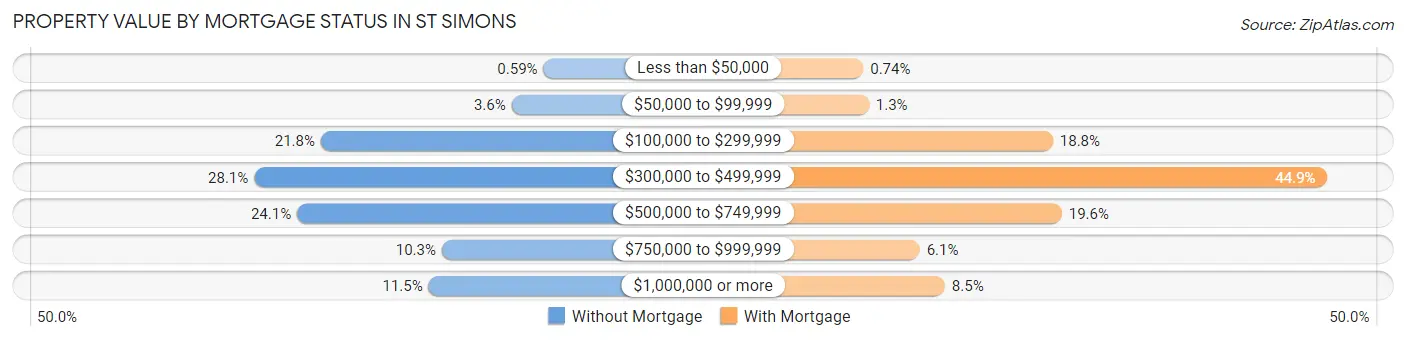
| Property Value | Without Mortgage | With Mortgage |
| Less than $50,000 | 14 (0.6%) | 28 (0.7%) |
| $50,000 to $99,999 | 86 (3.6%) | 48 (1.3%) |
| $100,000 to $299,999 | 518 (21.8%) | 711 (18.8%) |
| $300,000 to $499,999 | 669 (28.1%) | 1,700 (44.9%) |
| $500,000 to $749,999 | 572 (24.1%) | 743 (19.6%) |
| $750,000 to $999,999 | 244 (10.3%) | 231 (6.1%) |
| $1,000,000 or more | 274 (11.5%) | 322 (8.5%) |
| Total | 2,377 (100.0%) | 3,783 (100.0%) |
Household Income by Mortgage Status in St Simons
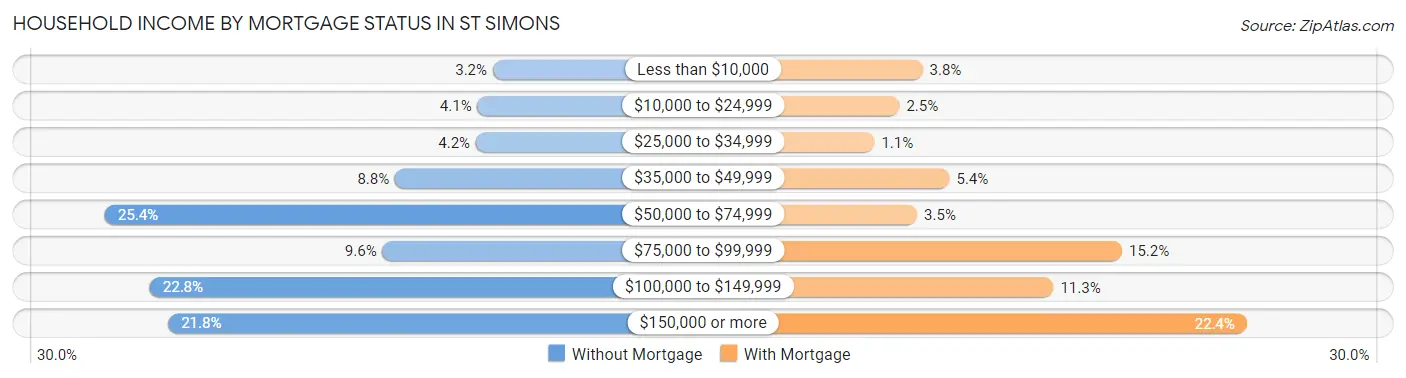
| Household Income | Without Mortgage | With Mortgage |
| Less than $10,000 | 77 (3.2%) | 145 (3.8%) |
| $10,000 to $24,999 | 98 (4.1%) | 95 (2.5%) |
| $25,000 to $34,999 | 100 (4.2%) | 41 (1.1%) |
| $35,000 to $49,999 | 210 (8.8%) | 203 (5.4%) |
| $50,000 to $74,999 | 604 (25.4%) | 133 (3.5%) |
| $75,000 to $99,999 | 227 (9.6%) | 576 (15.2%) |
| $100,000 to $149,999 | 543 (22.8%) | 428 (11.3%) |
| $150,000 or more | 518 (21.8%) | 846 (22.4%) |
| Total | 2,377 (100.0%) | 3,783 (100.0%) |
Property Value to Household Income Ratio in St Simons
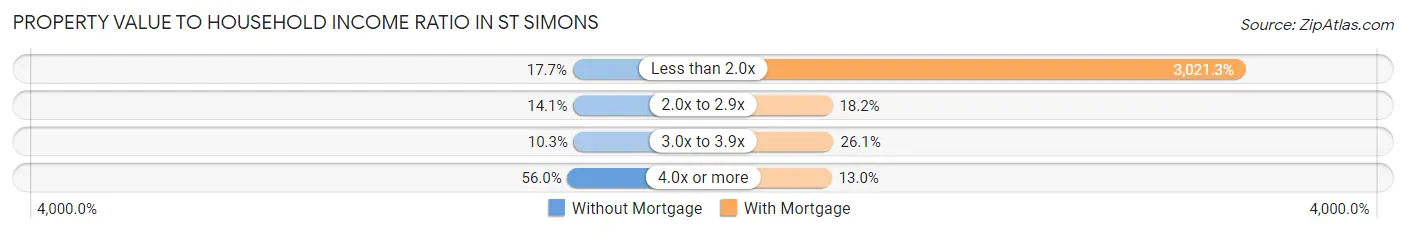
| Value-to-Income Ratio | Without Mortgage | With Mortgage |
| Less than 2.0x | 420 (17.7%) | 114,294 (3,021.2%) |
| 2.0x to 2.9x | 336 (14.1%) | 688 (18.2%) |
| 3.0x to 3.9x | 245 (10.3%) | 988 (26.1%) |
| 4.0x or more | 1,331 (56.0%) | 490 (13.0%) |
| Total | 2,377 (100.0%) | 3,783 (100.0%) |
Real Estate Taxes by Mortgage Status in St Simons
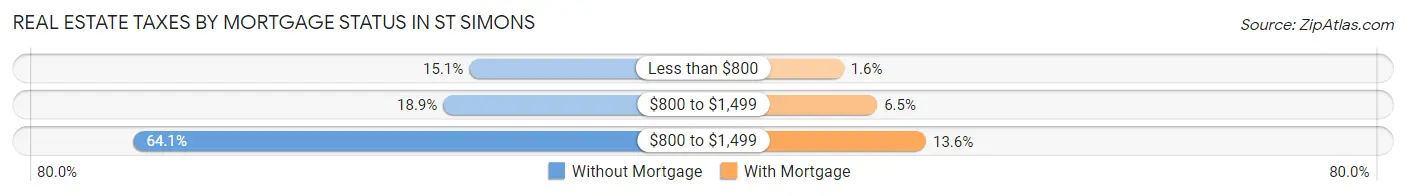
| Property Taxes | Without Mortgage | With Mortgage |
| Less than $800 | 358 (15.1%) | 59 (1.6%) |
| $800 to $1,499 | 448 (18.9%) | 244 (6.5%) |
| $800 to $1,499 | 1,523 (64.1%) | 514 (13.6%) |
| Total | 2,377 (100.0%) | 3,783 (100.0%) |
Health & Disability in St Simons
Health Insurance Coverage by Age in St Simons
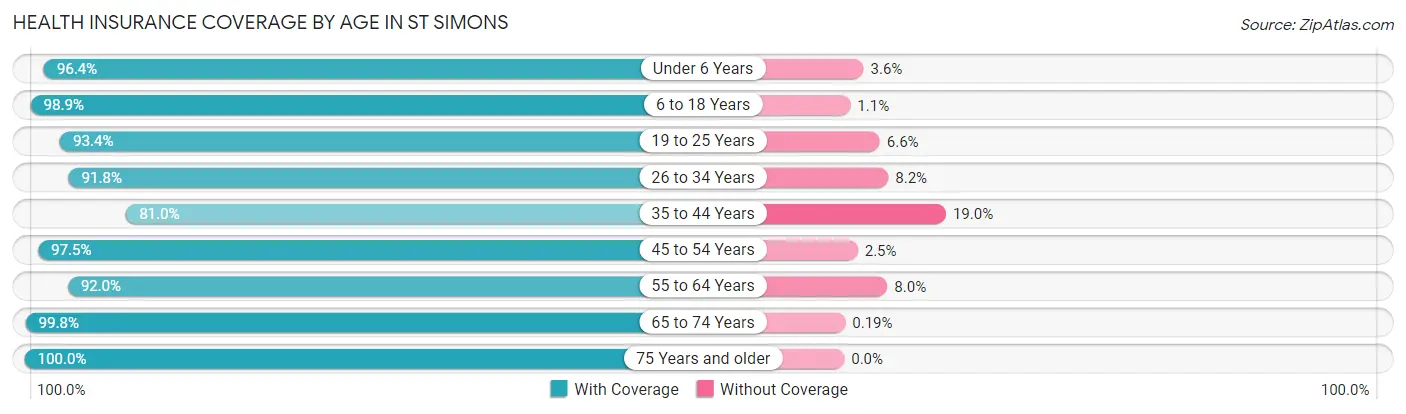
| Age Bracket | With Coverage | Without Coverage |
| Under 6 Years | 696 (96.4%) | 26 (3.6%) |
| 6 to 18 Years | 1,475 (98.9%) | 17 (1.1%) |
| 19 to 25 Years | 760 (93.4%) | 54 (6.6%) |
| 26 to 34 Years | 1,040 (91.8%) | 93 (8.2%) |
| 35 to 44 Years | 1,073 (81.0%) | 251 (19.0%) |
| 45 to 54 Years | 1,866 (97.5%) | 48 (2.5%) |
| 55 to 64 Years | 2,412 (92.0%) | 211 (8.0%) |
| 65 to 74 Years | 3,664 (99.8%) | 7 (0.2%) |
| 75 Years and older | 2,103 (100.0%) | 0 (0.0%) |
| Total | 15,089 (95.5%) | 707 (4.5%) |
Health Insurance Coverage by Citizenship Status in St Simons
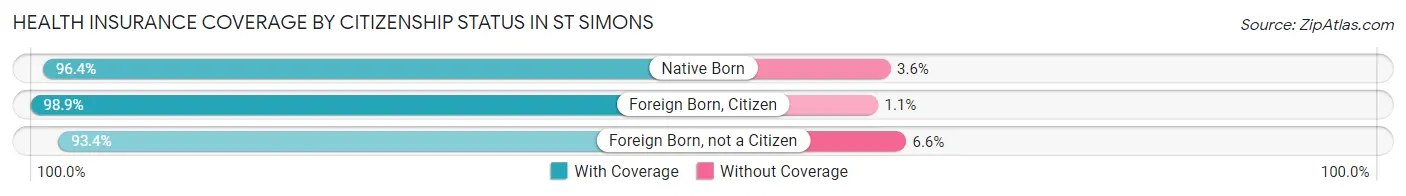
| Citizenship Status | With Coverage | Without Coverage |
| Native Born | 696 (96.4%) | 26 (3.6%) |
| Foreign Born, Citizen | 1,475 (98.9%) | 17 (1.1%) |
| Foreign Born, not a Citizen | 760 (93.4%) | 54 (6.6%) |
Health Insurance Coverage by Household Income in St Simons
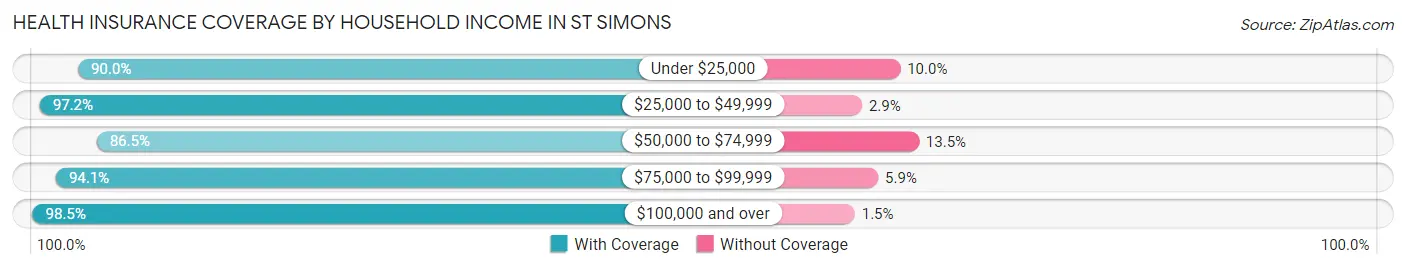
| Household Income | With Coverage | Without Coverage |
| Under $25,000 | 674 (90.0%) | 75 (10.0%) |
| $25,000 to $49,999 | 1,466 (97.2%) | 43 (2.9%) |
| $50,000 to $74,999 | 2,035 (86.5%) | 318 (13.5%) |
| $75,000 to $99,999 | 2,112 (94.1%) | 132 (5.9%) |
| $100,000 and over | 8,802 (98.5%) | 134 (1.5%) |
Public vs Private Health Insurance Coverage by Age in St Simons
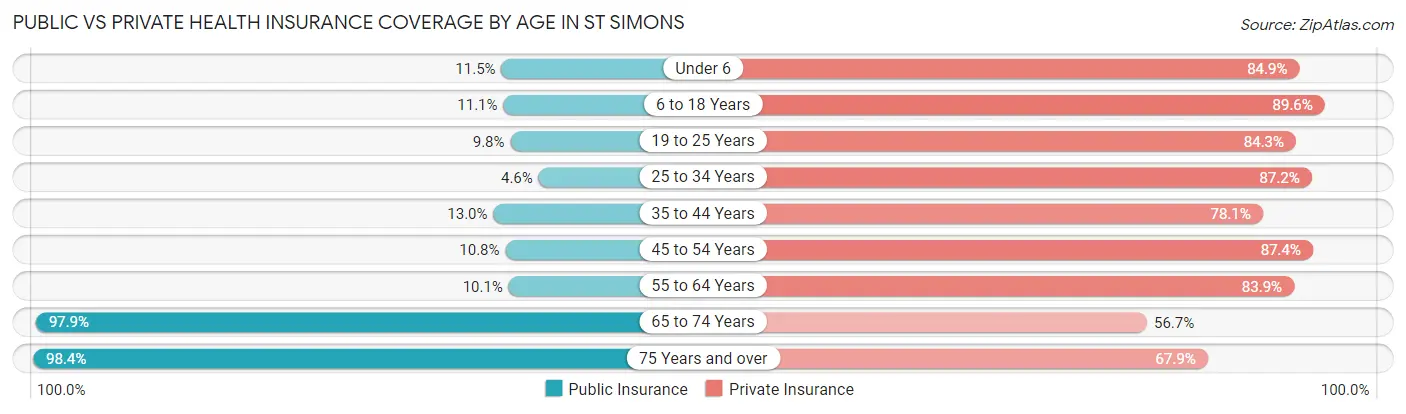
| Age Bracket | Public Insurance | Private Insurance |
| Under 6 | 83 (11.5%) | 613 (84.9%) |
| 6 to 18 Years | 166 (11.1%) | 1,337 (89.6%) |
| 19 to 25 Years | 80 (9.8%) | 686 (84.3%) |
| 25 to 34 Years | 52 (4.6%) | 988 (87.2%) |
| 35 to 44 Years | 172 (13.0%) | 1,034 (78.1%) |
| 45 to 54 Years | 206 (10.8%) | 1,673 (87.4%) |
| 55 to 64 Years | 266 (10.1%) | 2,201 (83.9%) |
| 65 to 74 Years | 3,595 (97.9%) | 2,080 (56.7%) |
| 75 Years and over | 2,070 (98.4%) | 1,428 (67.9%) |
| Total | 6,690 (42.3%) | 12,040 (76.2%) |
Disability Status by Sex by Age in St Simons
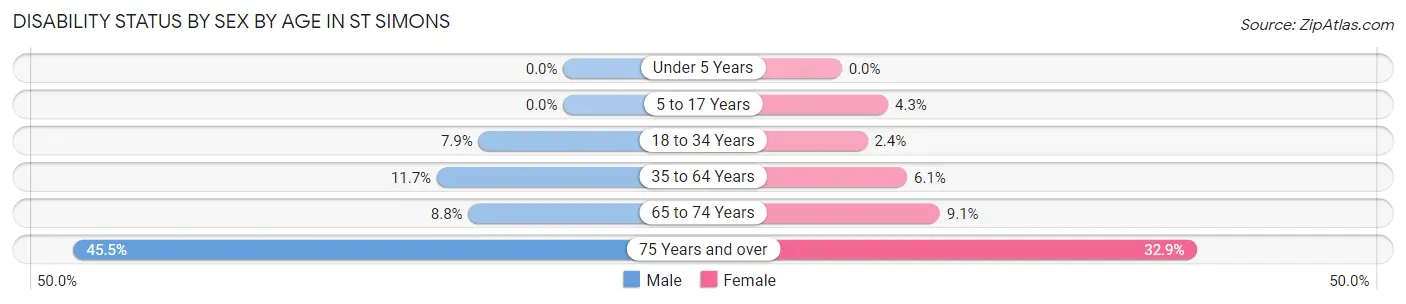
| Age Bracket | Male | Female |
| Under 5 Years | 0 (0.0%) | 0 (0.0%) |
| 5 to 17 Years | 0 (0.0%) | 31 (4.3%) |
| 18 to 34 Years | 75 (7.9%) | 27 (2.4%) |
| 35 to 64 Years | 333 (11.7%) | 183 (6.1%) |
| 65 to 74 Years | 153 (8.8%) | 176 (9.1%) |
| 75 Years and over | 395 (45.5%) | 406 (32.9%) |
Disability Class by Sex by Age in St Simons
Disability Class: Hearing Difficulty
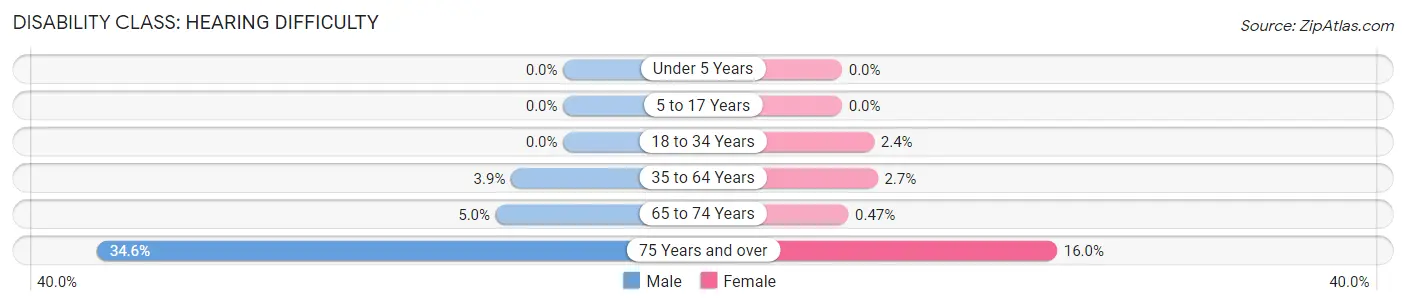
| Age Bracket | Male | Female |
| Under 5 Years | 0 (0.0%) | 0 (0.0%) |
| 5 to 17 Years | 0 (0.0%) | 0 (0.0%) |
| 18 to 34 Years | 0 (0.0%) | 27 (2.4%) |
| 35 to 64 Years | 110 (3.9%) | 80 (2.6%) |
| 65 to 74 Years | 87 (5.0%) | 9 (0.5%) |
| 75 Years and over | 301 (34.6%) | 197 (16.0%) |
Disability Class: Vision Difficulty
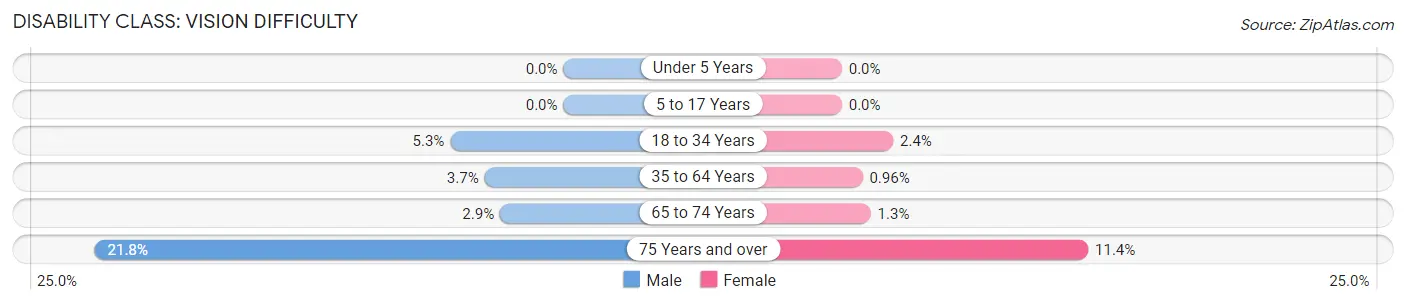
| Age Bracket | Male | Female |
| Under 5 Years | 0 (0.0%) | 0 (0.0%) |
| 5 to 17 Years | 0 (0.0%) | 0 (0.0%) |
| 18 to 34 Years | 50 (5.2%) | 27 (2.4%) |
| 35 to 64 Years | 104 (3.7%) | 29 (1.0%) |
| 65 to 74 Years | 51 (2.9%) | 26 (1.3%) |
| 75 Years and over | 189 (21.7%) | 141 (11.4%) |
Disability Class: Cognitive Difficulty
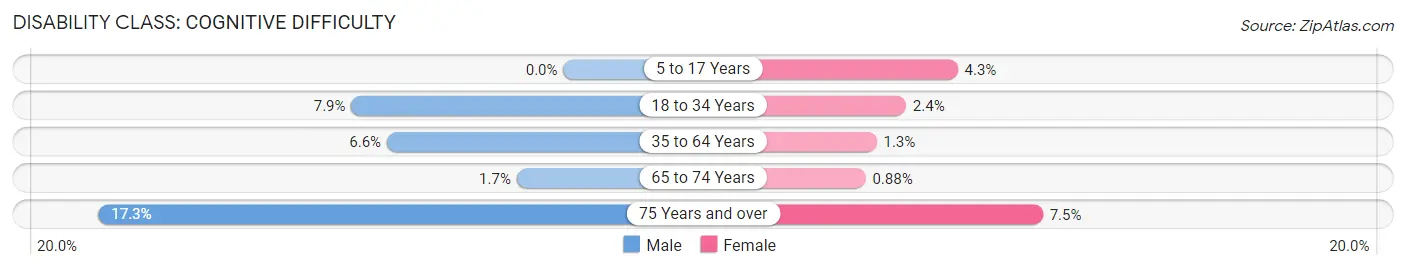
| Age Bracket | Male | Female |
| 5 to 17 Years | 0 (0.0%) | 31 (4.3%) |
| 18 to 34 Years | 75 (7.9%) | 27 (2.4%) |
| 35 to 64 Years | 186 (6.6%) | 39 (1.3%) |
| 65 to 74 Years | 30 (1.7%) | 17 (0.9%) |
| 75 Years and over | 150 (17.3%) | 92 (7.5%) |
Disability Class: Ambulatory Difficulty
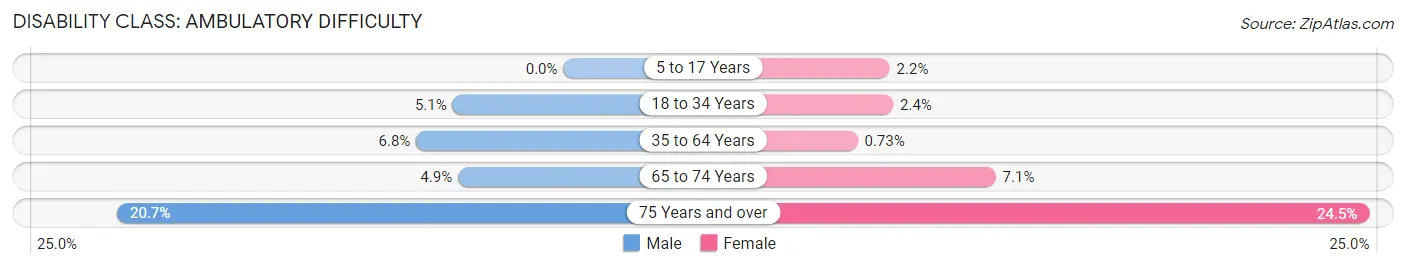
| Age Bracket | Male | Female |
| 5 to 17 Years | 0 (0.0%) | 16 (2.2%) |
| 18 to 34 Years | 49 (5.1%) | 27 (2.4%) |
| 35 to 64 Years | 194 (6.8%) | 22 (0.7%) |
| 65 to 74 Years | 85 (4.9%) | 138 (7.1%) |
| 75 Years and over | 180 (20.7%) | 302 (24.5%) |
Disability Class: Self-Care Difficulty
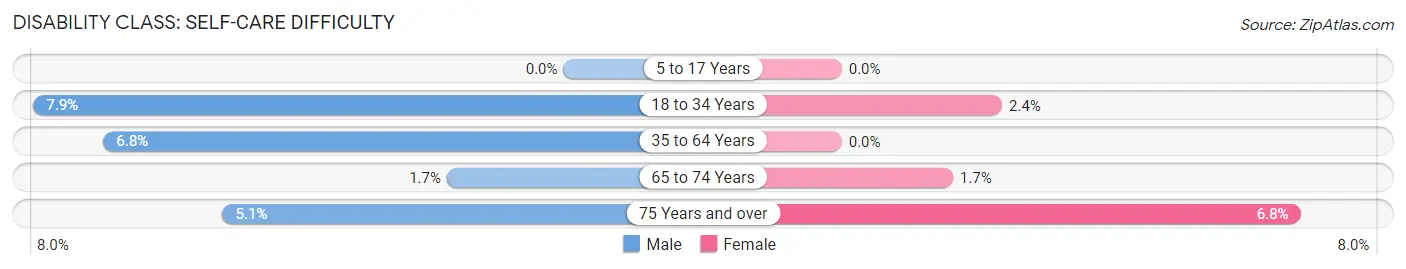
| Age Bracket | Male | Female |
| 5 to 17 Years | 0 (0.0%) | 0 (0.0%) |
| 18 to 34 Years | 75 (7.9%) | 27 (2.4%) |
| 35 to 64 Years | 194 (6.8%) | 0 (0.0%) |
| 65 to 74 Years | 30 (1.7%) | 32 (1.7%) |
| 75 Years and over | 44 (5.1%) | 84 (6.8%) |
Technology Access in St Simons
Computing Device Access in St Simons
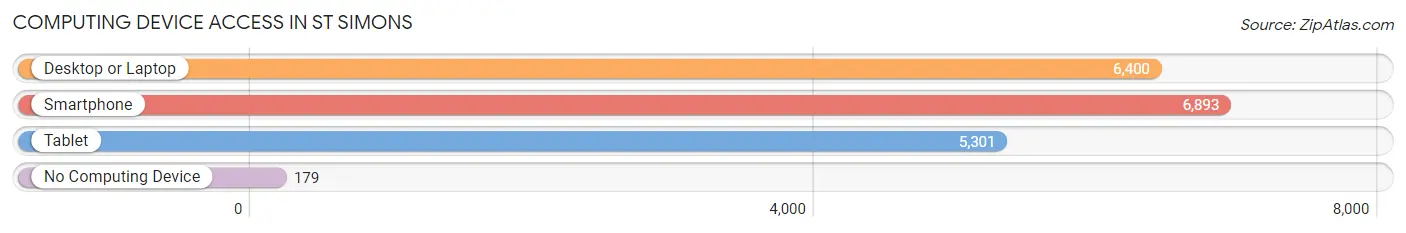
| Device Type | # Households | % Households |
| Desktop or Laptop | 6,400 | 88.2% |
| Smartphone | 6,893 | 95.0% |
| Tablet | 5,301 | 73.0% |
| No Computing Device | 179 | 2.5% |
| Total | 7,258 | 100.0% |
Internet Access in St Simons
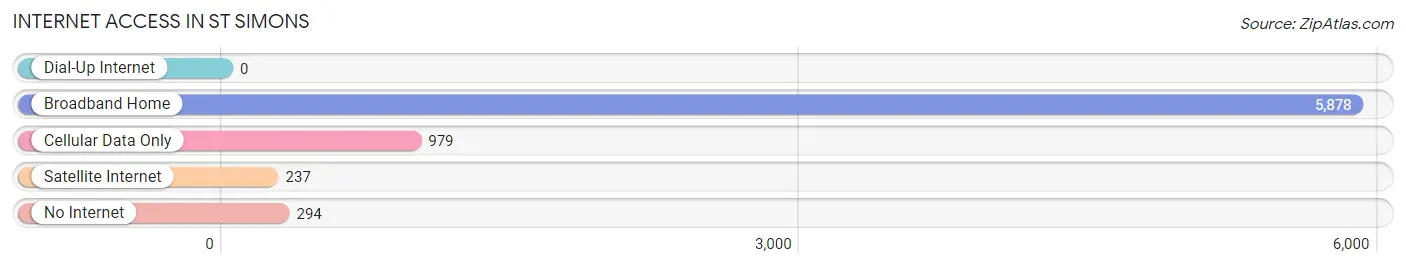
| Internet Type | # Households | % Households |
| Dial-Up Internet | 0 | 0.0% |
| Broadband Home | 5,878 | 81.0% |
| Cellular Data Only | 979 | 13.5% |
| Satellite Internet | 237 | 3.3% |
| No Internet | 294 | 4.1% |
| Total | 7,258 | 100.0% |
St Simons Summary
Simons Island, Georgia is a small barrier island located off the coast of Georgia in the southeastern United States. It is part of the Golden Isles of Georgia, which includes four other barrier islands and two mainland cities. St. Simons Island is the largest of the Golden Isles and is the most populous, with a population of approximately 13,000 people.
History
The history of St. Simons Island dates back to the 16th century when Spanish explorers first arrived in the area. The island was named after a Spanish monk, Simon de San Miguel, who was shipwrecked on the island in 1566. The island was then inhabited by Native Americans, including the Guale and Mocama tribes. In 1736, General James Oglethorpe established Fort Frederica on the island, which was used to protect the British colony of Georgia from Spanish attacks.
In the 19th century, St. Simons Island became a popular destination for wealthy plantation owners from the mainland. The island was home to several large plantations, including the Retreat Plantation, which was owned by the prominent Gould family. The island also became a popular vacation destination for wealthy families from the North.
In the 20th century, St. Simons Island became a popular tourist destination. The island was developed with resorts, golf courses, and other attractions. In the 1950s, the island was connected to the mainland by a causeway, which made it more accessible to visitors.
Geography
St. Simons Island is located off the coast of Georgia in the southeastern United States. It is part of the Golden Isles of Georgia, which includes four other barrier islands and two mainland cities. St. Simons Island is the largest of the Golden Isles and is the most populous, with a population of approximately 13,000 people.
The island is approximately 15 miles long and 5 miles wide. It is bordered by the Atlantic Ocean to the east and the Brunswick River to the west. The island is mostly flat, with an elevation of just 10 feet above sea level. The climate is humid subtropical, with hot, humid summers and mild winters.
Economy
The economy of St. Simons Island is largely based on tourism. The island is home to several resorts, golf courses, and other attractions that draw visitors from around the world. The island is also home to several marinas, which provide services to boaters and fishermen.
In addition to tourism, the island is home to several businesses that provide goods and services to the local population. These businesses include restaurants, retail stores, and other services. The island is also home to several manufacturing companies, which produce a variety of products, including boats, furniture, and clothing.
Demographics
As of the 2010 census, the population of St. Simons Island was 13,000. The population is predominantly white (86.3%), with African Americans making up 8.3% of the population. Other racial groups include Asians (2.2%), Hispanics (1.7%), and Native Americans (0.3%).
The median household income on the island is $63,000, and the median home value is $400,000. The unemployment rate is 4.2%, which is lower than the national average. The island is home to several colleges and universities, including the College of Coastal Georgia and the University of Georgia.
Common Questions
What is Per Capita Income in St Simons?
Per Capita income in St Simons is $66,552.
What is the Median Family Income in St Simons?
Median Family Income in St Simons is $118,341.
What is the Median Household income in St Simons?
Median Household Income in St Simons is $99,432.
What is Income or Wage Gap in St Simons?
Income or Wage Gap in St Simons is 36.7%.
Women in St Simons earn 63.3 cents for every dollar earned by a man.
What is Family Income Deficit in St Simons?
Family Income Deficit in St Simons is $10,853.
Families that are below poverty line in St Simons earn $10,853 less on average than the poverty threshold level.
What is Inequality or Gini Index in St Simons?
Inequality or Gini Index in St Simons is 0.48.
What is the Total Population of St Simons?
Total Population of St Simons is 15,983.
What is the Total Male Population of St Simons?
Total Male Population of St Simons is 7,507.
What is the Total Female Population of St Simons?
Total Female Population of St Simons is 8,476.
What is the Ratio of Males per 100 Females in St Simons?
There are 88.57 Males per 100 Females in St Simons.
What is the Ratio of Females per 100 Males in St Simons?
There are 112.91 Females per 100 Males in St Simons.
What is the Median Population Age in St Simons?
Median Population Age in St Simons is 57.4 Years.
What is the Average Family Size in St Simons
Average Family Size in St Simons is 2.6 People.
What is the Average Household Size in St Simons
Average Household Size in St Simons is 2.2 People.
How Large is the Labor Force in St Simons?
There are 7,285 People in the Labor Forcein in St Simons.
What is the Percentage of People in the Labor Force in St Simons?
51.3% of People are in the Labor Force in St Simons.
What is the Unemployment Rate in St Simons?
Unemployment Rate in St Simons is 2.7%.