Zip Codes with the Highest Percentage of Population Employed in Legal Services & Support in Stone Mountain, GA
RELATED REPORTS & OPTIONS
Legal Services & Support
Stone Mountain
Compare Zip Codes
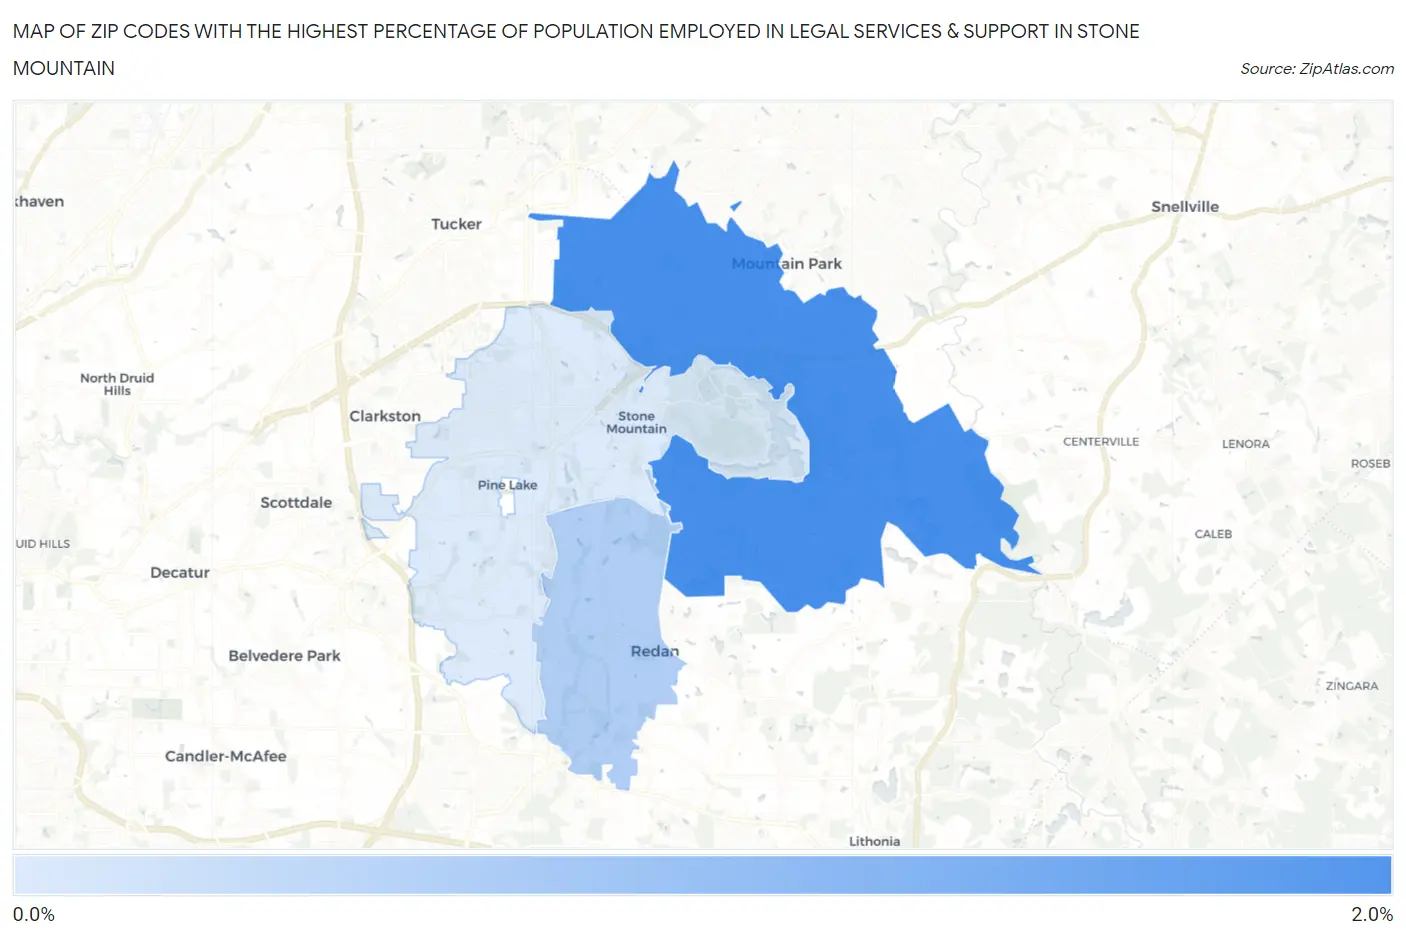
Map of Zip Codes with the Highest Percentage of Population Employed in Legal Services & Support in Stone Mountain
0.39%
1.5%
Zip Codes with the Highest Percentage of Population Employed in Legal Services & Support in Stone Mountain, GA
| Zip Code | % Employed | vs State | vs National | |
| 1. | 30087 | 1.5% | 1.1%(+0.418)#111 | 1.2%(+0.338)#4,949 |
| 2. | 30088 | 0.74% | 1.1%(-0.361)#239 | 1.2%(-0.442)#9,991 |
| 3. | 30083 | 0.39% | 1.1%(-0.717)#351 | 1.2%(-0.798)#13,993 |
1
Common Questions
What are the Top Zip Codes with the Highest Percentage of Population Employed in Legal Services & Support in Stone Mountain, GA?
Top Zip Codes with the Highest Percentage of Population Employed in Legal Services & Support in Stone Mountain, GA are:
What zip code has the Highest Percentage of Population Employed in Legal Services & Support in Stone Mountain, GA?
30087 has the Highest Percentage of Population Employed in Legal Services & Support in Stone Mountain, GA with 1.5%.
What is the Percentage of Population Employed in Legal Services & Support in Stone Mountain, GA?
Percentage of Population Employed in Legal Services & Support in Stone Mountain is 0.31%.
What is the Percentage of Population Employed in Legal Services & Support in Georgia?
Percentage of Population Employed in Legal Services & Support in Georgia is 1.1%.
What is the Percentage of Population Employed in Legal Services & Support in the United States?
Percentage of Population Employed in Legal Services & Support in the United States is 1.2%.