Deenwood, GA Map & Demographics
Deenwood Map
Deenwood Overview
$29,240
PER CAPITA INCOME
$56,910
AVG FAMILY INCOME
$49,417
AVG HOUSEHOLD INCOME
22.6%
WAGE / INCOME GAP [ % ]
77.4¢/ $1
WAGE / INCOME GAP [ $ ]
0.46
INEQUALITY / GINI INDEX
2,146
TOTAL POPULATION
993
MALE POPULATION
1,153
FEMALE POPULATION
86.12
MALES / 100 FEMALES
116.11
FEMALES / 100 MALES
41.5
MEDIAN AGE
3.3
AVG FAMILY SIZE
2.6
AVG HOUSEHOLD SIZE
753
LABOR FORCE [ PEOPLE ]
43.6%
PERCENT IN LABOR FORCE
3.3%
UNEMPLOYMENT RATE
Income in Deenwood
Income Overview in Deenwood
Per Capita Income in Deenwood is $29,240, while median incomes of families and households are $56,910 and $49,417 respectively.
| Characteristic | Number | Measure |
| Per Capita Income | 2,146 | $29,240 |
| Median Family Income | 527 | $56,910 |
| Mean Family Income | 527 | $83,818 |
| Median Household Income | 823 | $49,417 |
| Mean Household Income | 823 | $70,056 |
| Income Deficit | 527 | $0 |
| Wage / Income Gap (%) | 2,146 | 22.57% |
| Wage / Income Gap ($) | 2,146 | 77.43¢ per $1 |
| Gini / Inequality Index | 2,146 | 0.46 |
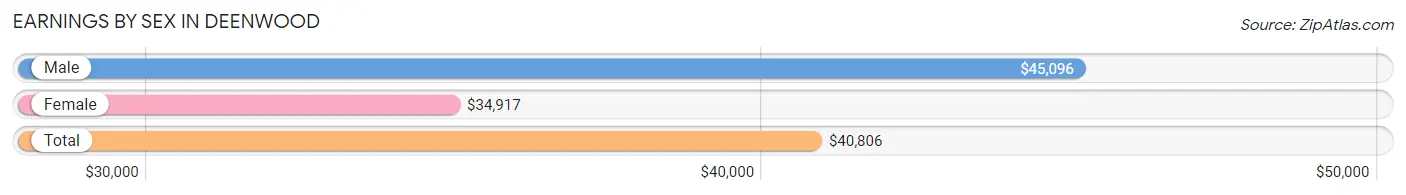
Earnings by Sex in Deenwood
Average Earnings in Deenwood are $40,806, $45,096 for men and $34,917 for women, a difference of 22.6%.
| Sex | Number | Average Earnings |
| Male | 394 (53.0%) | $45,096 |
| Female | 349 (47.0%) | $34,917 |
| Total | 743 (100.0%) | $40,806 |
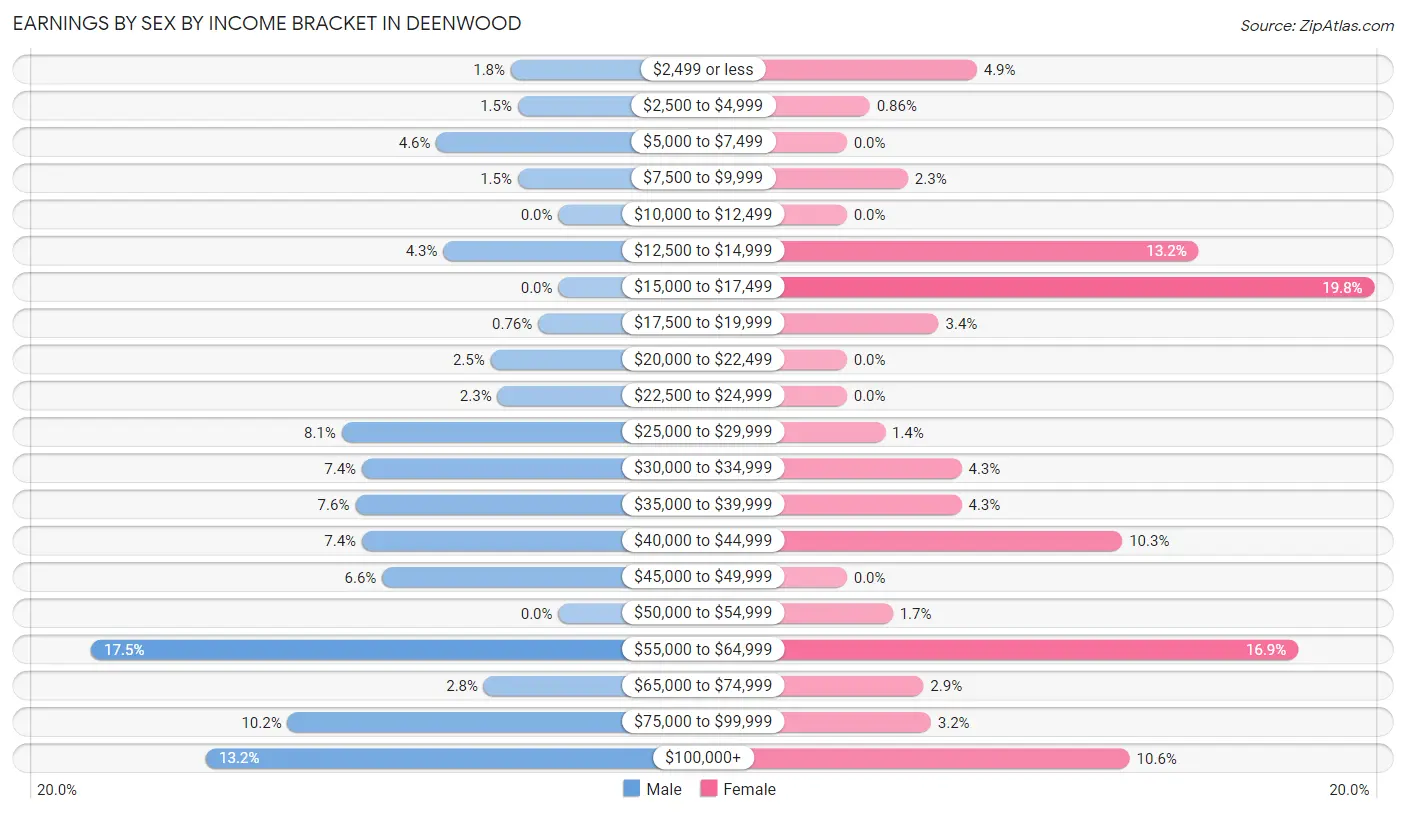
Earnings by Sex by Income Bracket in Deenwood
The most common earnings brackets in Deenwood are $55,000 to $64,999 for men (69 | 17.5%) and $15,000 to $17,499 for women (69 | 19.8%).
| Income | Male | Female |
| $2,499 or less | 7 (1.8%) | 17 (4.9%) |
| $2,500 to $4,999 | 6 (1.5%) | 3 (0.9%) |
| $5,000 to $7,499 | 18 (4.6%) | 0 (0.0%) |
| $7,500 to $9,999 | 6 (1.5%) | 8 (2.3%) |
| $10,000 to $12,499 | 0 (0.0%) | 0 (0.0%) |
| $12,500 to $14,999 | 17 (4.3%) | 46 (13.2%) |
| $15,000 to $17,499 | 0 (0.0%) | 69 (19.8%) |
| $17,500 to $19,999 | 3 (0.8%) | 12 (3.4%) |
| $20,000 to $22,499 | 10 (2.5%) | 0 (0.0%) |
| $22,500 to $24,999 | 9 (2.3%) | 0 (0.0%) |
| $25,000 to $29,999 | 32 (8.1%) | 5 (1.4%) |
| $30,000 to $34,999 | 29 (7.4%) | 15 (4.3%) |
| $35,000 to $39,999 | 30 (7.6%) | 15 (4.3%) |
| $40,000 to $44,999 | 29 (7.4%) | 36 (10.3%) |
| $45,000 to $49,999 | 26 (6.6%) | 0 (0.0%) |
| $50,000 to $54,999 | 0 (0.0%) | 6 (1.7%) |
| $55,000 to $64,999 | 69 (17.5%) | 59 (16.9%) |
| $65,000 to $74,999 | 11 (2.8%) | 10 (2.9%) |
| $75,000 to $99,999 | 40 (10.2%) | 11 (3.2%) |
| $100,000+ | 52 (13.2%) | 37 (10.6%) |
| Total | 394 (100.0%) | 349 (100.0%) |
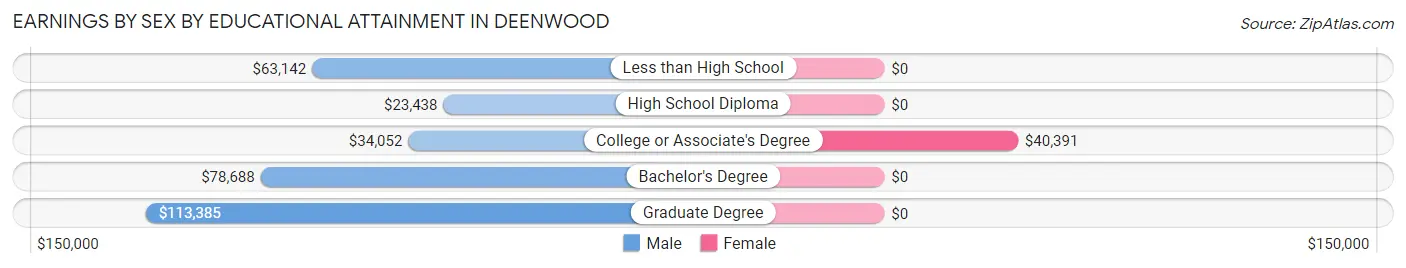
Earnings by Sex by Educational Attainment in Deenwood
Average earnings in Deenwood are $42,026 for men and $39,750 for women, a difference of 5.4%. Men with an educational attainment of graduate degree enjoy the highest average annual earnings of $113,385, while those with high school diploma education earn the least with $23,438. Women with an educational attainment of college or associate's degree earn the most with the average annual earnings of $40,391, while those with college or associate's degree education have the smallest earnings of $40,391.
| Educational Attainment | Male Income | Female Income |
| Less than High School | $63,142 | $0 |
| High School Diploma | $23,438 | $0 |
| College or Associate's Degree | $34,052 | $40,391 |
| Bachelor's Degree | $78,688 | $0 |
| Graduate Degree | $113,385 | $0 |
| Total | $42,026 | $39,750 |
Family Income in Deenwood
Family Income Brackets in Deenwood
According to the Deenwood family income data, there are 140 families falling into the $50,000 to $74,999 income range, which is the most common income bracket and makes up 26.6% of all families.
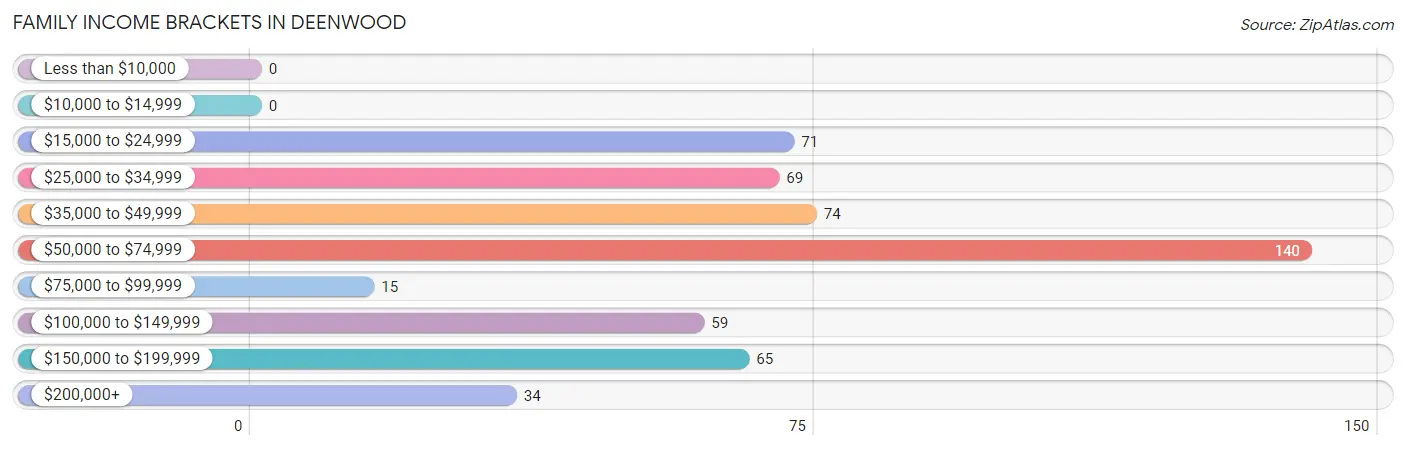
| Income Bracket | # Families | % Families |
| Less than $10,000 | 0 | 0.0% |
| $10,000 to $14,999 | 0 | 0.0% |
| $15,000 to $24,999 | 71 | 13.5% |
| $25,000 to $34,999 | 69 | 13.1% |
| $35,000 to $49,999 | 74 | 14.0% |
| $50,000 to $74,999 | 140 | 26.6% |
| $75,000 to $99,999 | 15 | 2.8% |
| $100,000 to $149,999 | 59 | 11.2% |
| $150,000 to $199,999 | 65 | 12.3% |
| $200,000+ | 34 | 6.5% |
Family Income by Famaliy Size in Deenwood
4-person families (89 | 16.9%) account for the highest median family income in Deenwood with $63,155 per family, while 2-person families (288 | 54.6%) have the highest median income of $28,444 per family member.
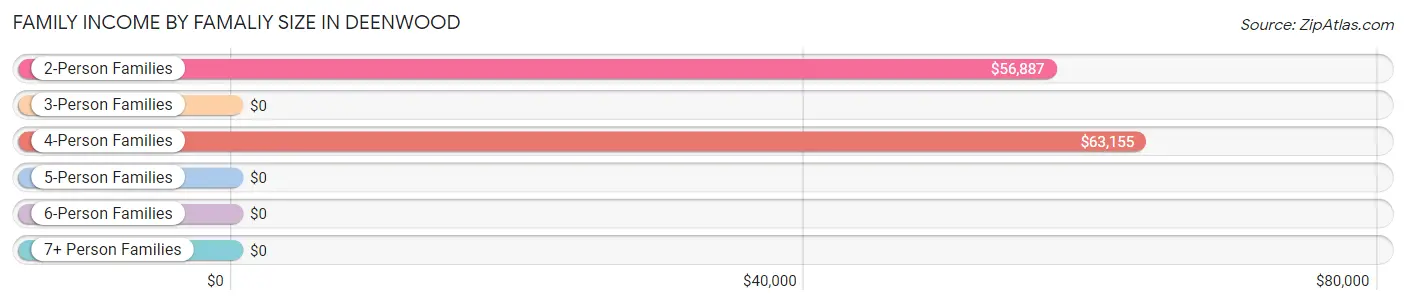
| Income Bracket | # Families | Median Income |
| 2-Person Families | 288 (54.6%) | $56,887 |
| 3-Person Families | 141 (26.8%) | $0 |
| 4-Person Families | 89 (16.9%) | $63,155 |
| 5-Person Families | 9 (1.7%) | $0 |
| 6-Person Families | 0 (0.0%) | $0 |
| 7+ Person Families | 0 (0.0%) | $0 |
| Total | 527 (100.0%) | $56,910 |
Family Income by Number of Earners in Deenwood
The median family income in Deenwood is $56,910, with families comprising 2 earners (100) having the highest median family income of $144,671, while families with 1 earner (237) have the lowest median family income of $43,125, accounting for 19.0% and 45.0% of families, respectively.
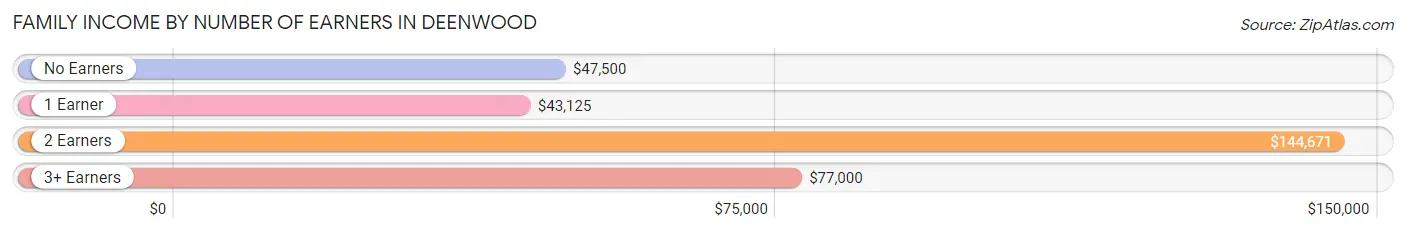
| Number of Earners | # Families | Median Income |
| No Earners | 172 (32.6%) | $47,500 |
| 1 Earner | 237 (45.0%) | $43,125 |
| 2 Earners | 100 (19.0%) | $144,671 |
| 3+ Earners | 18 (3.4%) | $77,000 |
| Total | 527 (100.0%) | $56,910 |
Household Income in Deenwood
Household Income Brackets in Deenwood
With 187 households falling in the category, the $50,000 to $74,999 income range is the most frequent in Deenwood, accounting for 22.7% of all households. In contrast, only 15 households (1.8%) fall into the $75,000 to $99,999 income bracket, making it the least populous group.
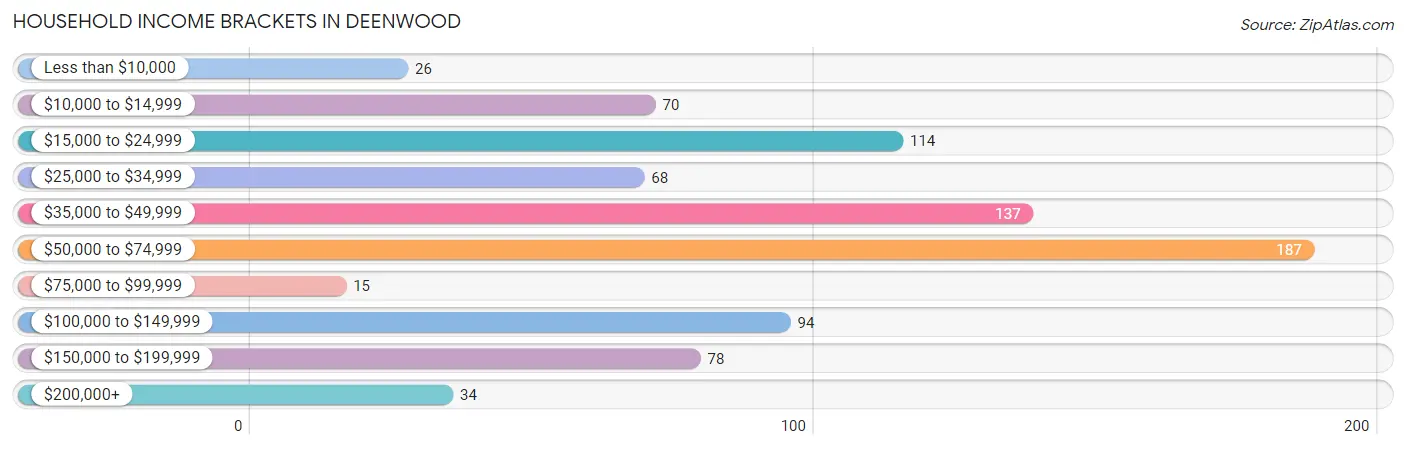
| Income Bracket | # Households | % Households |
| Less than $10,000 | 26 | 3.2% |
| $10,000 to $14,999 | 70 | 8.5% |
| $15,000 to $24,999 | 114 | 13.9% |
| $25,000 to $34,999 | 68 | 8.3% |
| $35,000 to $49,999 | 137 | 16.6% |
| $50,000 to $74,999 | 187 | 22.7% |
| $75,000 to $99,999 | 15 | 1.8% |
| $100,000 to $149,999 | 94 | 11.4% |
| $150,000 to $199,999 | 78 | 9.5% |
| $200,000+ | 34 | 4.1% |
Household Income by Householder Age in Deenwood
The median household income in Deenwood is $49,417, with the highest median household income of $73,000 found in the 45 to 64 years age bracket for the primary householder. A total of 178 households (21.6%) fall into this category. Meanwhile, the 15 to 24 years age bracket for the primary householder has the lowest median household income of $0, with 13 households (1.6%) in this group.
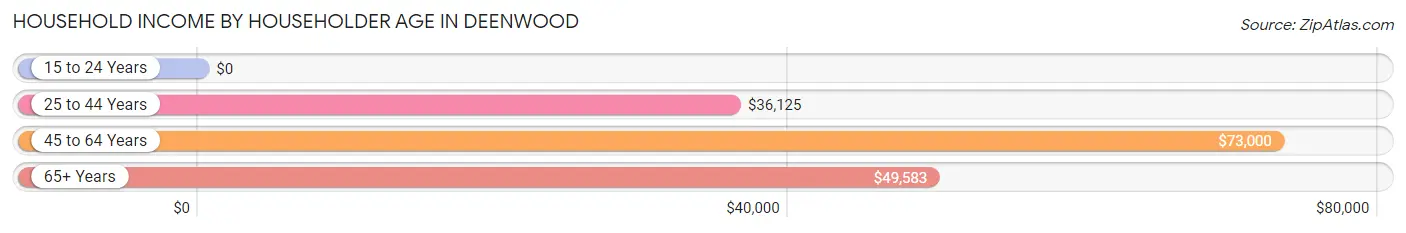
| Income Bracket | # Households | Median Income |
| 15 to 24 Years | 13 (1.6%) | $0 |
| 25 to 44 Years | 235 (28.5%) | $36,125 |
| 45 to 64 Years | 178 (21.6%) | $73,000 |
| 65+ Years | 397 (48.2%) | $49,583 |
| Total | 823 (100.0%) | $49,417 |
Poverty in Deenwood
Income Below Poverty by Sex and Age in Deenwood
With 8.4% poverty level for males and 31.9% for females among the residents of Deenwood, 5 year old males and 5 year old females are the most vulnerable to poverty, with 7 males (31.8%) and 20 females (100.0%) in their respective age groups living below the poverty level.
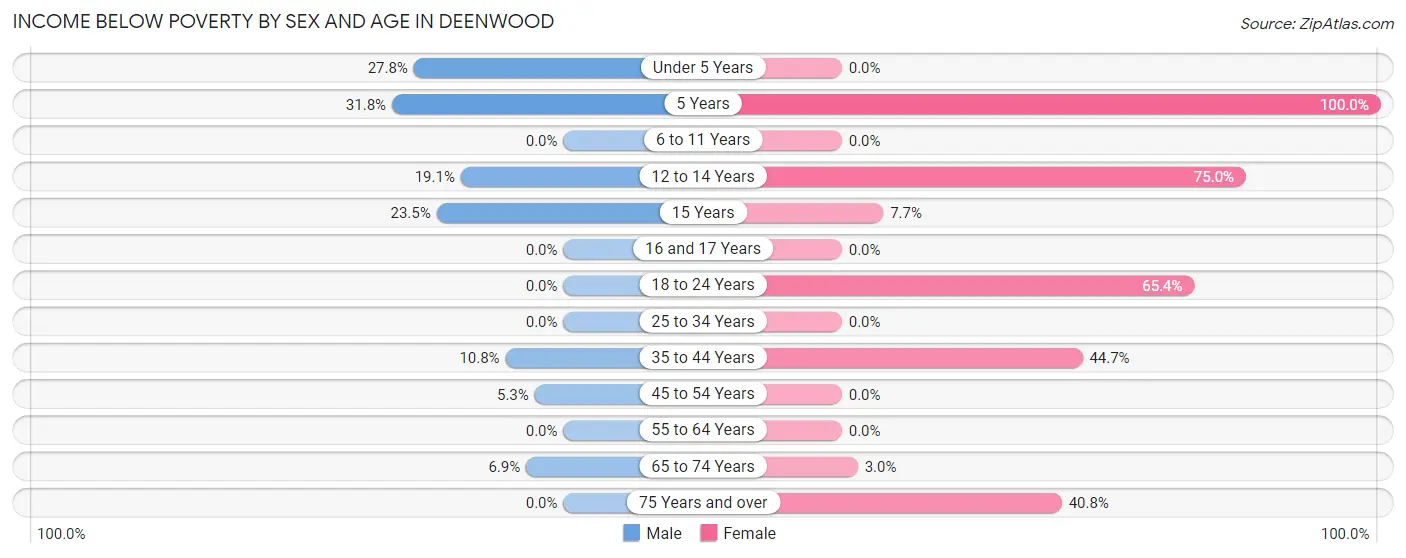
| Age Bracket | Male | Female |
| Under 5 Years | 20 (27.8%) | 0 (0.0%) |
| 5 Years | 7 (31.8%) | 20 (100.0%) |
| 6 to 11 Years | 0 (0.0%) | 0 (0.0%) |
| 12 to 14 Years | 4 (19.1%) | 66 (75.0%) |
| 15 Years | 24 (23.5%) | 3 (7.7%) |
| 16 and 17 Years | 0 (0.0%) | 0 (0.0%) |
| 18 to 24 Years | 0 (0.0%) | 106 (65.4%) |
| 25 to 34 Years | 0 (0.0%) | 0 (0.0%) |
| 35 to 44 Years | 10 (10.7%) | 88 (44.7%) |
| 45 to 54 Years | 7 (5.3%) | 0 (0.0%) |
| 55 to 64 Years | 0 (0.0%) | 0 (0.0%) |
| 65 to 74 Years | 11 (6.9%) | 5 (3.0%) |
| 75 Years and over | 0 (0.0%) | 80 (40.8%) |
| Total | 83 (8.4%) | 368 (31.9%) |
Income Above Poverty by Sex and Age in Deenwood
According to the poverty statistics in Deenwood, males aged 6 to 11 years and females aged under 5 years are the age groups that are most secure financially, with 100.0% of males and 100.0% of females in these age groups living above the poverty line.
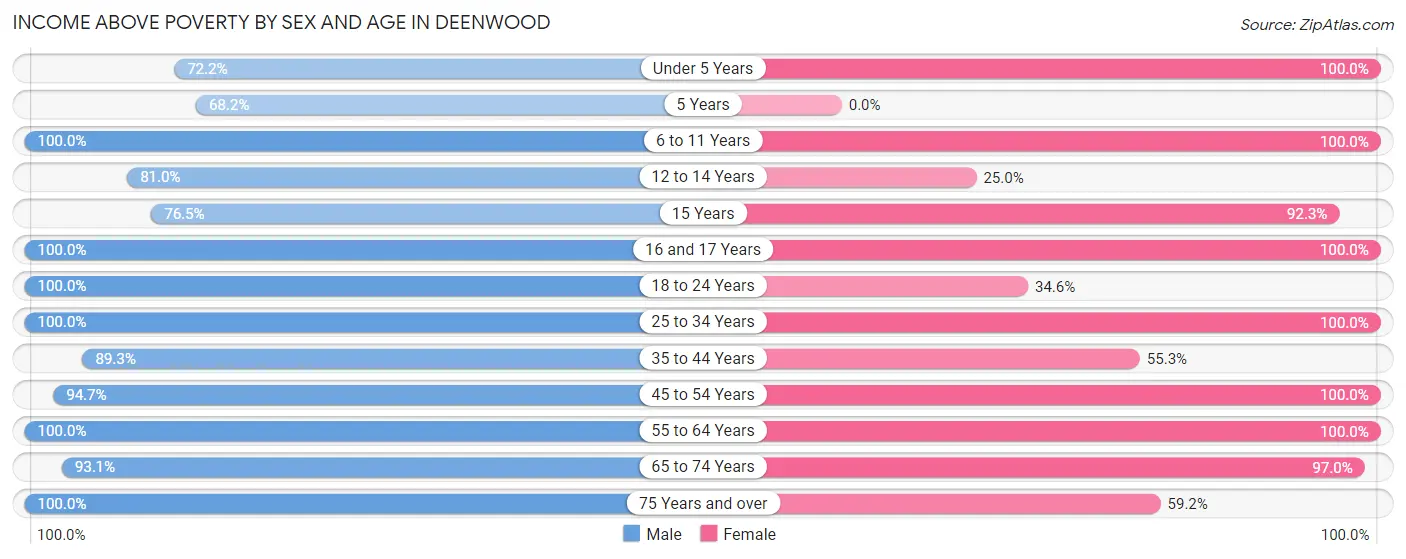
| Age Bracket | Male | Female |
| Under 5 Years | 52 (72.2%) | 7 (100.0%) |
| 5 Years | 15 (68.2%) | 0 (0.0%) |
| 6 to 11 Years | 9 (100.0%) | 40 (100.0%) |
| 12 to 14 Years | 17 (80.9%) | 22 (25.0%) |
| 15 Years | 78 (76.5%) | 36 (92.3%) |
| 16 and 17 Years | 34 (100.0%) | 44 (100.0%) |
| 18 to 24 Years | 29 (100.0%) | 56 (34.6%) |
| 25 to 34 Years | 151 (100.0%) | 46 (100.0%) |
| 35 to 44 Years | 83 (89.2%) | 109 (55.3%) |
| 45 to 54 Years | 124 (94.7%) | 42 (100.0%) |
| 55 to 64 Years | 81 (100.0%) | 103 (100.0%) |
| 65 to 74 Years | 148 (93.1%) | 164 (97.0%) |
| 75 Years and over | 89 (100.0%) | 116 (59.2%) |
| Total | 910 (91.6%) | 785 (68.1%) |
Income Below Poverty Among Married-Couple Families in Deenwood
The poverty statistics for married-couple families in Deenwood show that 2.6% or 10 of the total 382 families live below the poverty line. Families with 1 or 2 children have the highest poverty rate of 10.7%, comprising of 10 families. On the other hand, families with no children have the lowest poverty rate of 0.0%, which includes 0 families.
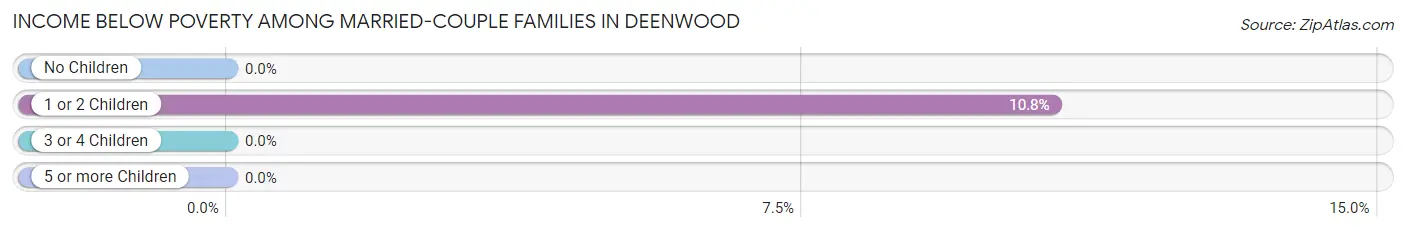
| Children | Above Poverty | Below Poverty |
| No Children | 280 (100.0%) | 0 (0.0%) |
| 1 or 2 Children | 83 (89.2%) | 10 (10.7%) |
| 3 or 4 Children | 9 (100.0%) | 0 (0.0%) |
| 5 or more Children | 0 (0.0%) | 0 (0.0%) |
| Total | 372 (97.4%) | 10 (2.6%) |
Income Below Poverty Among Single-Parent Households in Deenwood
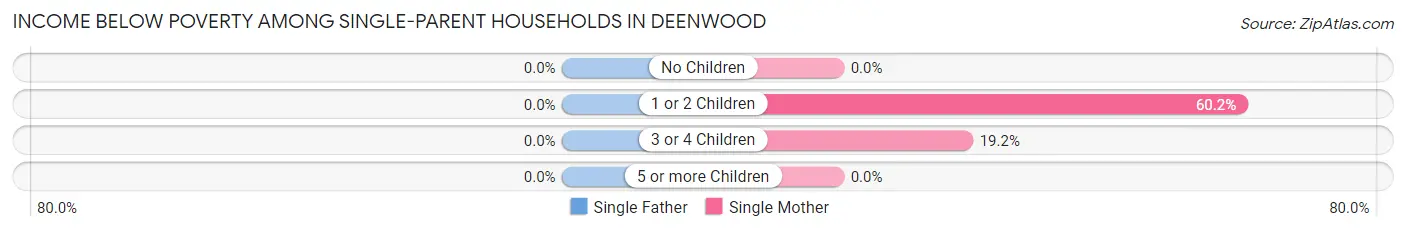
| Children | Single Father | Single Mother |
| No Children | 0 (0.0%) | 0 (0.0%) |
| 1 or 2 Children | 0 (0.0%) | 50 (60.2%) |
| 3 or 4 Children | 0 (0.0%) | 5 (19.2%) |
| 5 or more Children | 0 (0.0%) | 0 (0.0%) |
| Total | 0 (0.0%) | 55 (47.4%) |
Income Below Poverty Among Married-Couple vs Single-Parent Households in Deenwood
The poverty data for Deenwood shows that 10 of the married-couple family households (2.6%) and 55 of the single-parent households (37.9%) are living below the poverty level. Within the married-couple family households, those with 1 or 2 children have the highest poverty rate, with 10 households (10.7%) falling below the poverty line. Among the single-parent households, those with 1 or 2 children have the highest poverty rate, with 50 household (55.6%) living below poverty.
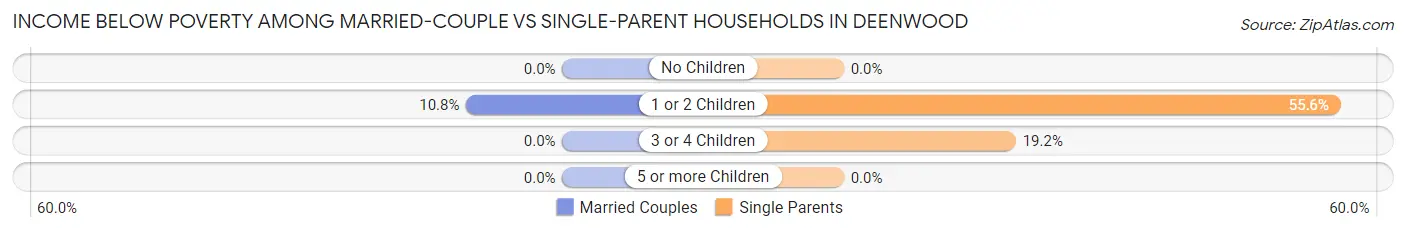
| Children | Married-Couple Families | Single-Parent Households |
| No Children | 0 (0.0%) | 0 (0.0%) |
| 1 or 2 Children | 10 (10.7%) | 50 (55.6%) |
| 3 or 4 Children | 0 (0.0%) | 5 (19.2%) |
| 5 or more Children | 0 (0.0%) | 0 (0.0%) |
| Total | 10 (2.6%) | 55 (37.9%) |
Race in Deenwood
The most populous races in Deenwood are White / Caucasian (1,586 | 73.9%), Black / African American (275 | 12.8%), and Asian (144 | 6.7%).

| Race | # Population | % Population |
| Asian | 144 | 6.7% |
| Black / African American | 275 | 12.8% |
| Hawaiian / Pacific | 0 | 0.0% |
| Hispanic or Latino | 115 | 5.4% |
| Native / Alaskan | 28 | 1.3% |
| White / Caucasian | 1,586 | 73.9% |
| Two or more Races | 99 | 4.6% |
| Some other Race | 14 | 0.6% |
| Total | 2,146 | 100.0% |
Ancestry in Deenwood
The most populous ancestries reported in Deenwood are American (270 | 12.6%), English (200 | 9.3%), Irish (173 | 8.1%), Thai (144 | 6.7%), and German (95 | 4.4%), together accounting for 41.1% of all Deenwood residents.
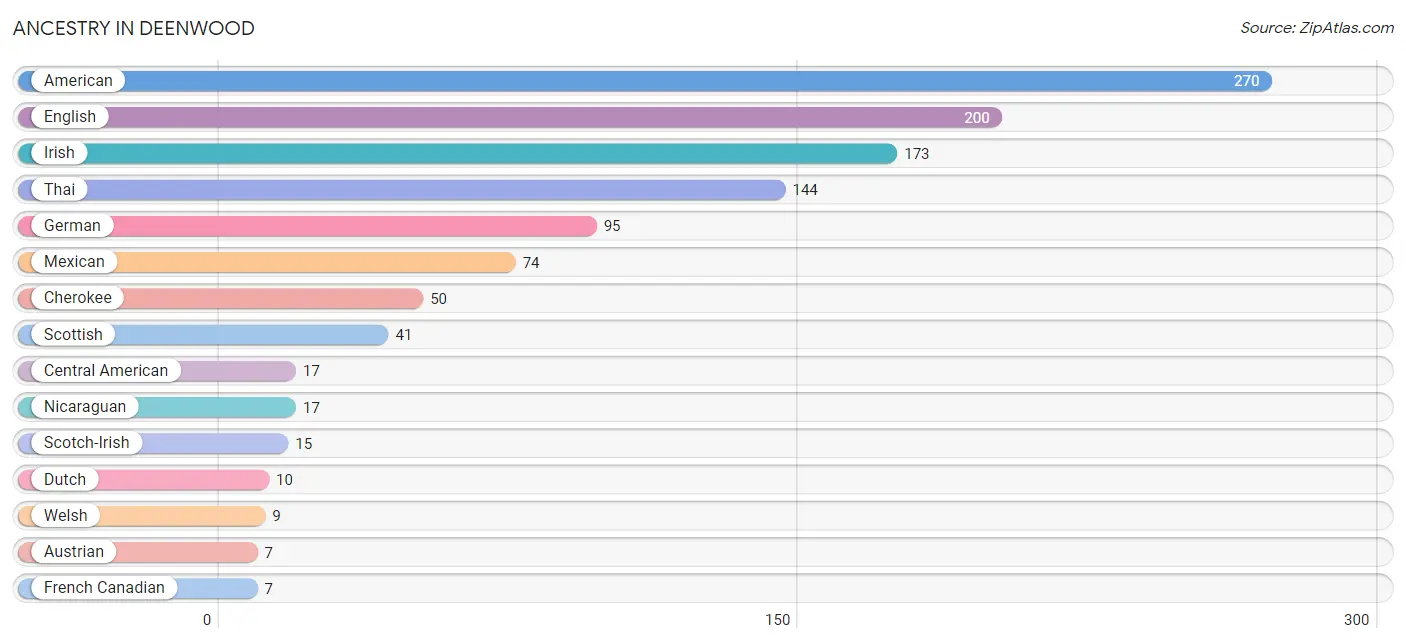
| Ancestry | # Population | % Population |
| American | 270 | 12.6% |
| Austrian | 7 | 0.3% |
| Burmese | 5 | 0.2% |
| Central American | 17 | 0.8% |
| Cherokee | 50 | 2.3% |
| Dutch | 10 | 0.5% |
| English | 200 | 9.3% |
| French Canadian | 7 | 0.3% |
| German | 95 | 4.4% |
| Irish | 173 | 8.1% |
| Mexican | 74 | 3.5% |
| Nicaraguan | 17 | 0.8% |
| Scotch-Irish | 15 | 0.7% |
| Scottish | 41 | 1.9% |
| Thai | 144 | 6.7% |
| Welsh | 9 | 0.4% | View All 16 Rows |
Immigrants in Deenwood
The most numerous immigrant groups reported in Deenwood came from Asia (87 | 4.1%), India (87 | 4.1%), and South Central Asia (87 | 4.1%), together accounting for 12.1% of all Deenwood residents.
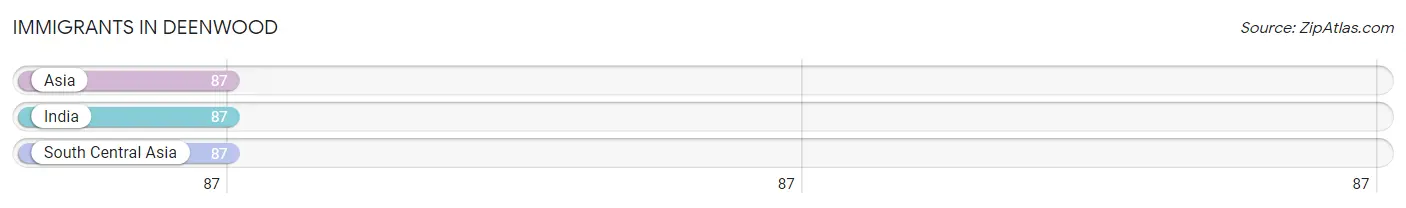
| Immigration Origin | # Population | % Population |
| Asia | 87 | 4.1% |
| India | 87 | 4.1% |
| South Central Asia | 87 | 4.1% | View All 3 Rows |
Sex and Age in Deenwood
Sex and Age in Deenwood
The most populous age groups in Deenwood are 15 to 19 Years (136 | 13.7%) for men and 15 to 19 Years (223 | 19.3%) for women.
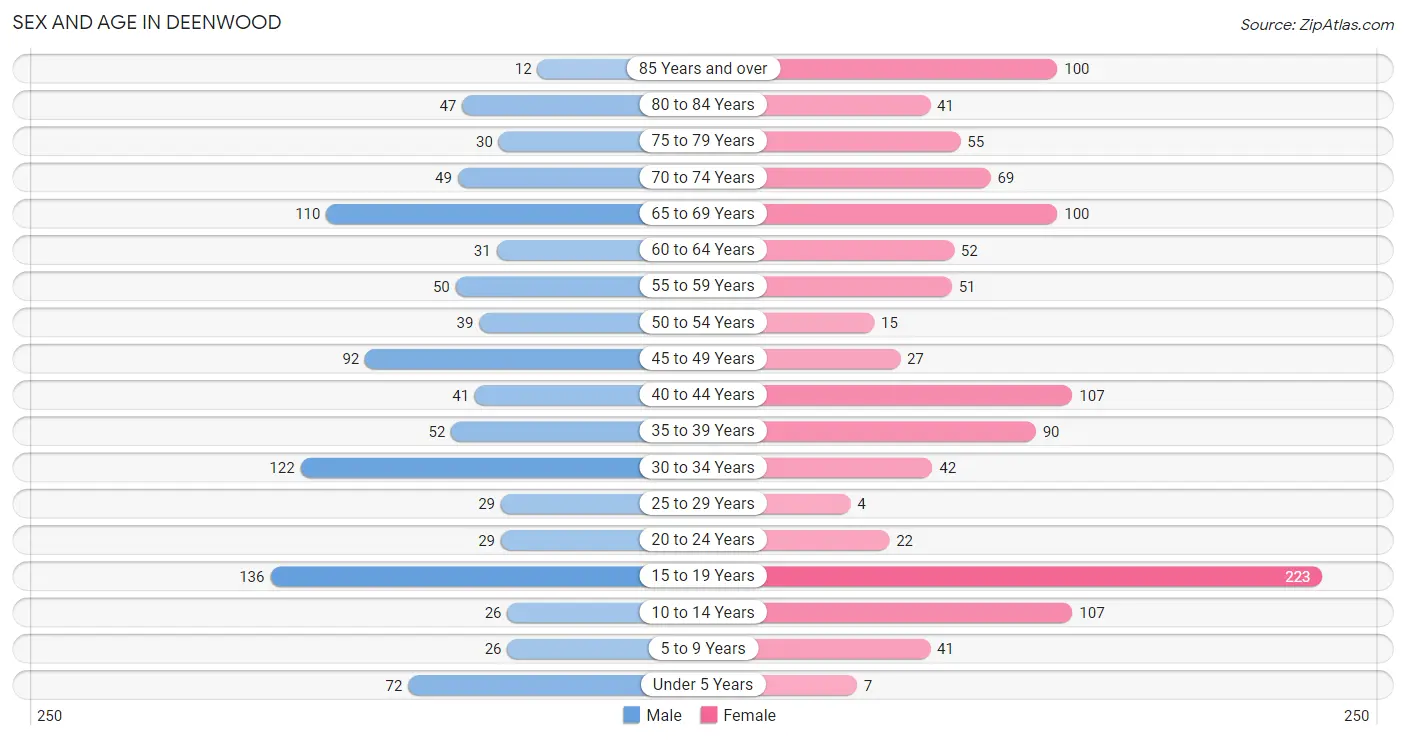
| Age Bracket | Male | Female |
| Under 5 Years | 72 (7.2%) | 7 (0.6%) |
| 5 to 9 Years | 26 (2.6%) | 41 (3.6%) |
| 10 to 14 Years | 26 (2.6%) | 107 (9.3%) |
| 15 to 19 Years | 136 (13.7%) | 223 (19.3%) |
| 20 to 24 Years | 29 (2.9%) | 22 (1.9%) |
| 25 to 29 Years | 29 (2.9%) | 4 (0.4%) |
| 30 to 34 Years | 122 (12.3%) | 42 (3.6%) |
| 35 to 39 Years | 52 (5.2%) | 90 (7.8%) |
| 40 to 44 Years | 41 (4.1%) | 107 (9.3%) |
| 45 to 49 Years | 92 (9.3%) | 27 (2.3%) |
| 50 to 54 Years | 39 (3.9%) | 15 (1.3%) |
| 55 to 59 Years | 50 (5.0%) | 51 (4.4%) |
| 60 to 64 Years | 31 (3.1%) | 52 (4.5%) |
| 65 to 69 Years | 110 (11.1%) | 100 (8.7%) |
| 70 to 74 Years | 49 (4.9%) | 69 (6.0%) |
| 75 to 79 Years | 30 (3.0%) | 55 (4.8%) |
| 80 to 84 Years | 47 (4.7%) | 41 (3.6%) |
| 85 Years and over | 12 (1.2%) | 100 (8.7%) |
| Total | 993 (100.0%) | 1,153 (100.0%) |
Families and Households in Deenwood
Median Family Size in Deenwood
The median family size in Deenwood is 3.34 persons per family, with single female/mother families (116 | 22.0%) accounting for the largest median family size of 4.97 persons per family. On the other hand, married-couple families (382 | 72.5%) represent the smallest median family size with 2.87 persons per family.
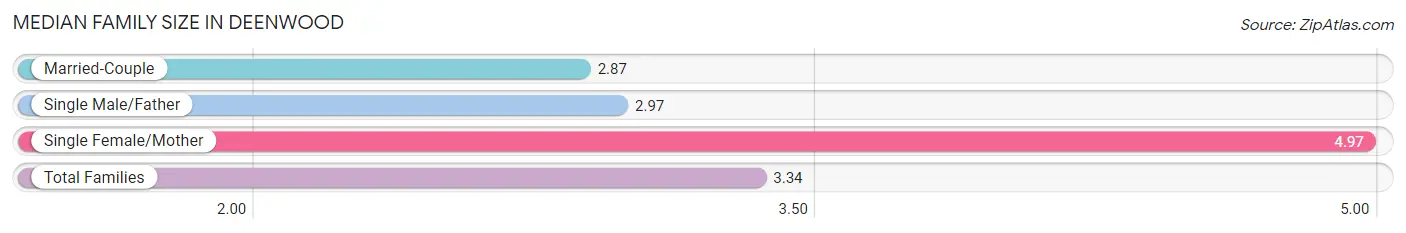
| Family Type | # Families | Family Size |
| Married-Couple | 382 (72.5%) | 2.87 |
| Single Male/Father | 29 (5.5%) | 2.97 |
| Single Female/Mother | 116 (22.0%) | 4.97 |
| Total Families | 527 (100.0%) | 3.34 |
Median Household Size in Deenwood
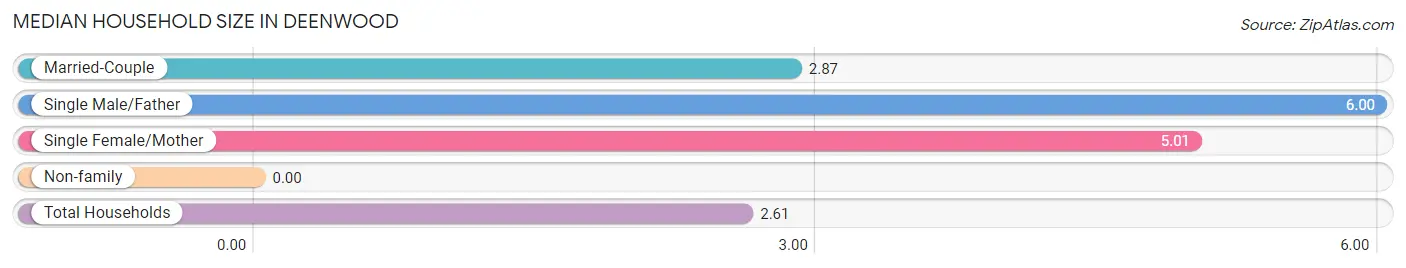
| Household Type | # Households | Household Size |
| Married-Couple | 382 (46.4%) | 2.87 |
| Single Male/Father | 29 (3.5%) | 6.00 |
| Single Female/Mother | 116 (14.1%) | 5.01 |
| Non-family | 296 (36.0%) | - |
| Total Households | 823 (100.0%) | 2.61 |
Household Size by Marriage Status in Deenwood
Out of a total of 823 households in Deenwood, 527 (64.0%) are family households, while 296 (36.0%) are nonfamily households. The most numerous type of family households are 2-person households, comprising 258, and the most common type of nonfamily households are 1-person households, comprising 296.
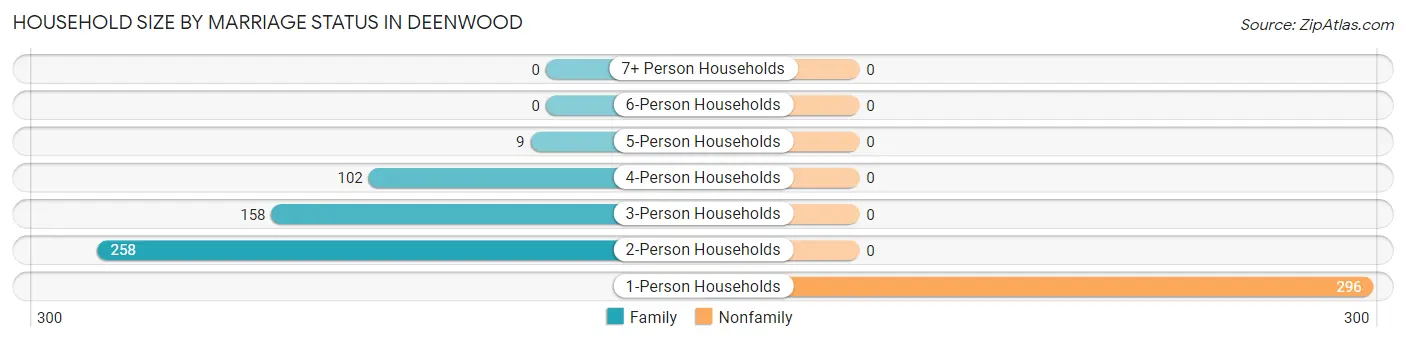
| Household Size | Family Households | Nonfamily Households |
| 1-Person Households | - | 296 (36.0%) |
| 2-Person Households | 258 (31.4%) | 0 (0.0%) |
| 3-Person Households | 158 (19.2%) | 0 (0.0%) |
| 4-Person Households | 102 (12.4%) | 0 (0.0%) |
| 5-Person Households | 9 (1.1%) | 0 (0.0%) |
| 6-Person Households | 0 (0.0%) | 0 (0.0%) |
| 7+ Person Households | 0 (0.0%) | 0 (0.0%) |
| Total | 527 (64.0%) | 296 (36.0%) |
Female Fertility in Deenwood
Fertility by Age in Deenwood
Average fertility rate in Deenwood is 41.0 births per 1,000 women. Women in the age bracket of 20 to 34 years have the highest fertility rate with 191.0 births per 1,000 women. Women in the age bracket of 20 to 34 years acount for 61.9% of all women with births.
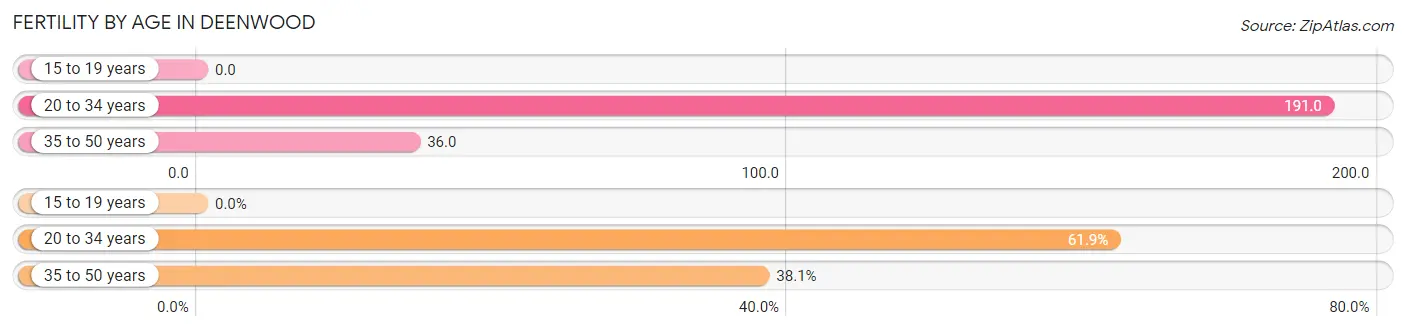
| Age Bracket | Women with Births | Births / 1,000 Women |
| 15 to 19 years | 0 (0.0%) | 0.0 |
| 20 to 34 years | 13 (61.9%) | 191.0 |
| 35 to 50 years | 8 (38.1%) | 36.0 |
| Total | 21 (100.0%) | 41.0 |
Fertility by Age by Marriage Status in Deenwood
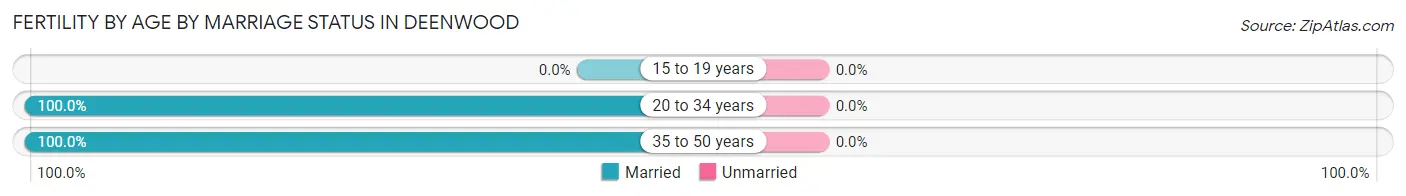
| Age Bracket | Married | Unmarried |
| 15 to 19 years | 0 (0.0%) | 0 (0.0%) |
| 20 to 34 years | 13 (100.0%) | 0 (0.0%) |
| 35 to 50 years | 8 (100.0%) | 0 (0.0%) |
| Total | 21 (100.0%) | 0 (0.0%) |
Fertility by Education in Deenwood
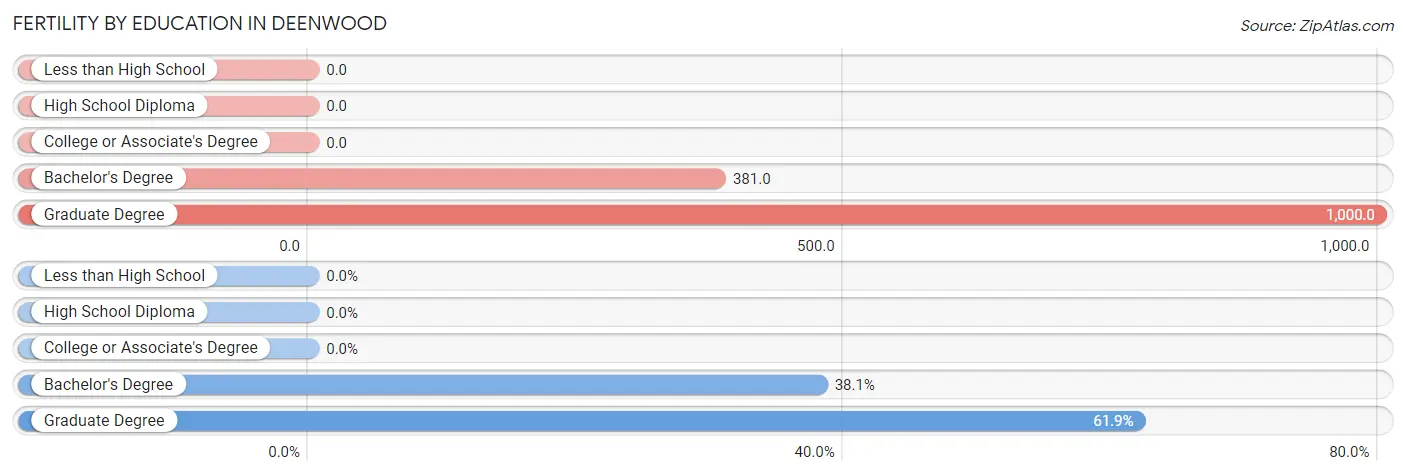
| Educational Attainment | Women with Births | Births / 1,000 Women |
| Less than High School | 0 (0.0%) | 0.0 |
| High School Diploma | 0 (0.0%) | 0.0 |
| College or Associate's Degree | 0 (0.0%) | 0.0 |
| Bachelor's Degree | 8 (38.1%) | 381.0 |
| Graduate Degree | 13 (61.9%) | 1,000.0 |
| Total | 21 (100.0%) | 41.0 |
Fertility by Education by Marriage Status in Deenwood
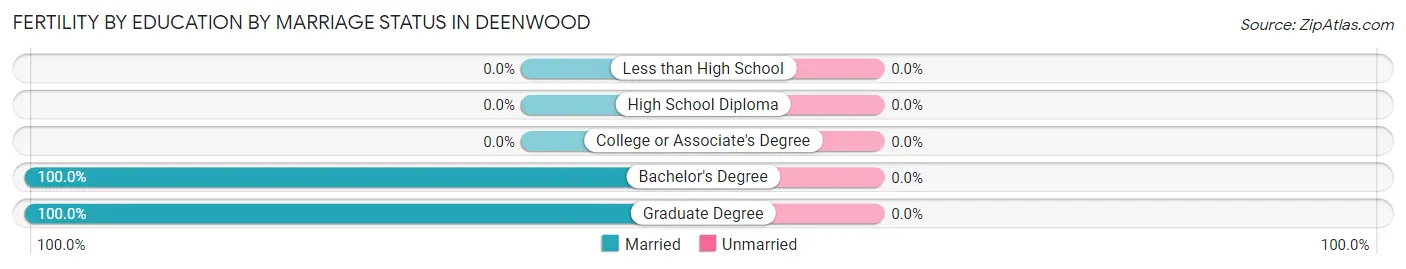
| Educational Attainment | Married | Unmarried |
| Less than High School | 0 (0.0%) | 0 (0.0%) |
| High School Diploma | 0 (0.0%) | 0 (0.0%) |
| College or Associate's Degree | 0 (0.0%) | 0 (0.0%) |
| Bachelor's Degree | 8 (100.0%) | 0 (0.0%) |
| Graduate Degree | 13 (100.0%) | 0 (0.0%) |
| Total | 21 (100.0%) | 0 (0.0%) |
Employment Characteristics in Deenwood
Employment by Class of Employer in Deenwood
Among the 706 employed individuals in Deenwood, private company employees (508 | 72.0%), state government employees (102 | 14.4%), and local government employees (35 | 5.0%) make up the most common classes of employment.
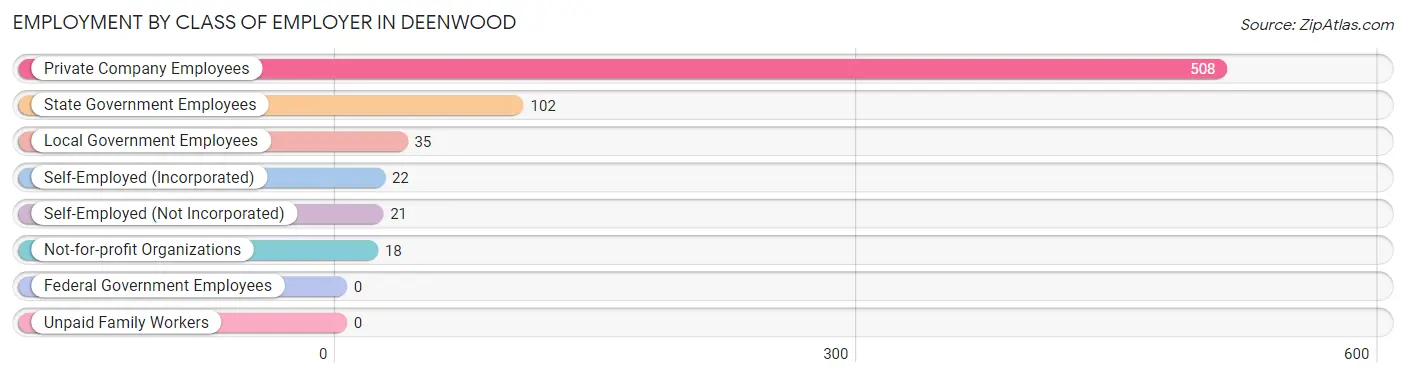
| Employer Class | # Employees | % Employees |
| Private Company Employees | 508 | 72.0% |
| Self-Employed (Incorporated) | 22 | 3.1% |
| Self-Employed (Not Incorporated) | 21 | 3.0% |
| Not-for-profit Organizations | 18 | 2.5% |
| Local Government Employees | 35 | 5.0% |
| State Government Employees | 102 | 14.4% |
| Federal Government Employees | 0 | 0.0% |
| Unpaid Family Workers | 0 | 0.0% |
| Total | 706 | 100.0% |
Employment Status by Age in Deenwood
According to the labor force statistics for Deenwood, out of the total population over 16 years of age (1,726), 43.6% or 753 individuals are in the labor force, with 3.3% or 25 of them unemployed. The age group with the highest labor force participation rate is 25 to 29 years, with 100.0% or 33 individuals in the labor force. Within the labor force, the 20 to 24 years age range has the highest percentage of unemployed individuals, with 25.8% or 8 of them being unemployed.
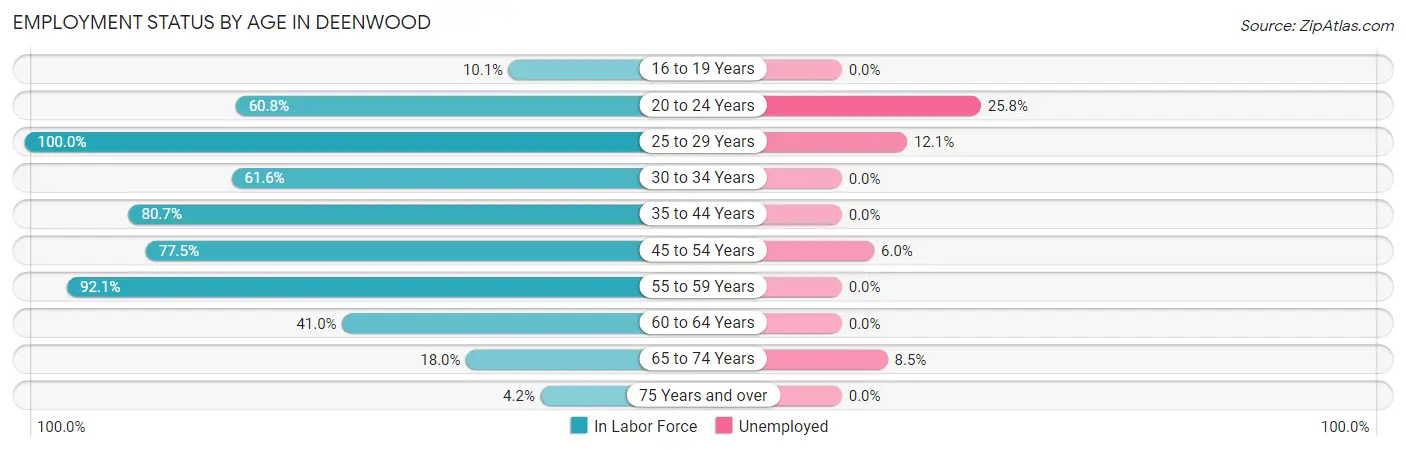
| Age Bracket | In Labor Force | Unemployed |
| 16 to 19 Years | 22 (10.1%) | 0 (0.0%) |
| 20 to 24 Years | 31 (60.8%) | 8 (25.8%) |
| 25 to 29 Years | 33 (100.0%) | 4 (12.1%) |
| 30 to 34 Years | 101 (61.6%) | 0 (0.0%) |
| 35 to 44 Years | 234 (80.7%) | 0 (0.0%) |
| 45 to 54 Years | 134 (77.5%) | 8 (6.0%) |
| 55 to 59 Years | 93 (92.1%) | 0 (0.0%) |
| 60 to 64 Years | 34 (41.0%) | 0 (0.0%) |
| 65 to 74 Years | 59 (18.0%) | 5 (8.5%) |
| 75 Years and over | 12 (4.2%) | 0 (0.0%) |
| Total | 753 (43.6%) | 25 (3.3%) |
Employment Status by Educational Attainment in Deenwood
According to labor force statistics for Deenwood, 74.5% of individuals (629) out of the total population between 25 and 64 years of age (844) are in the labor force, with 1.9% or 12 of them being unemployed. The group with the highest labor force participation rate are those with the educational attainment of less than high school, with 85.2% or 69 individuals in the labor force. Within the labor force, individuals with bachelor's degree or higher education have the highest percentage of unemployment, with 3.9% or 8 of them being unemployed.
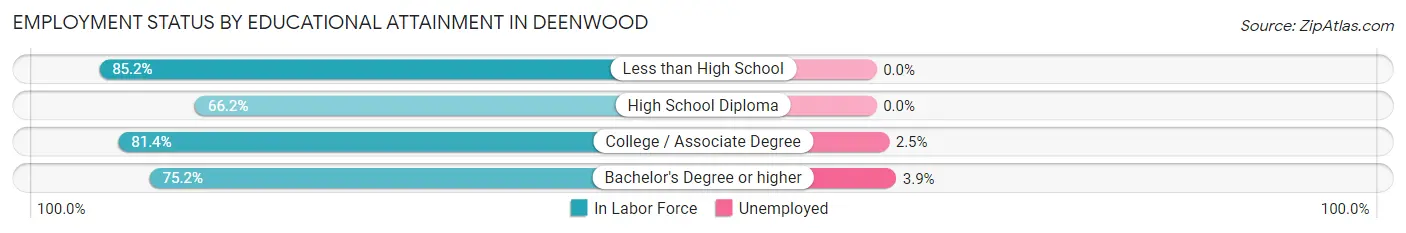
| Educational Attainment | In Labor Force | Unemployed |
| Less than High School | 69 (85.2%) | 0 (0.0%) |
| High School Diploma | 192 (66.2%) | 0 (0.0%) |
| College / Associate Degree | 162 (81.4%) | 5 (2.5%) |
| Bachelor's Degree or higher | 206 (75.2%) | 11 (3.9%) |
| Total | 629 (74.5%) | 16 (1.9%) |
Employment Occupations by Sex in Deenwood
Management, Business, Science and Arts Occupations
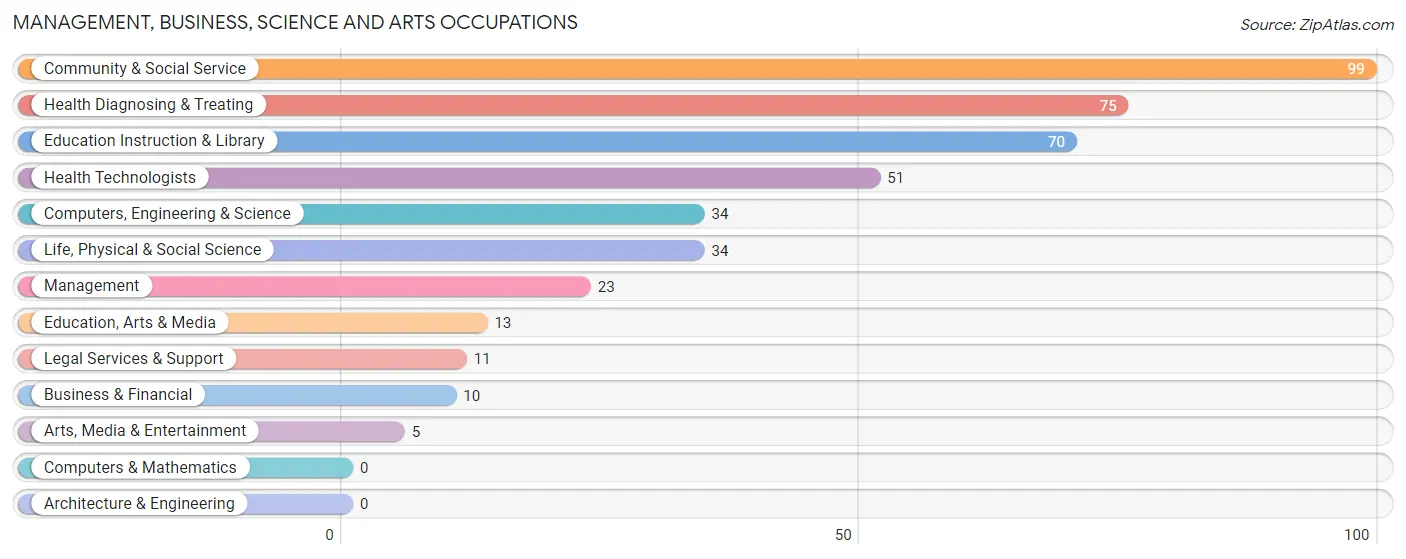
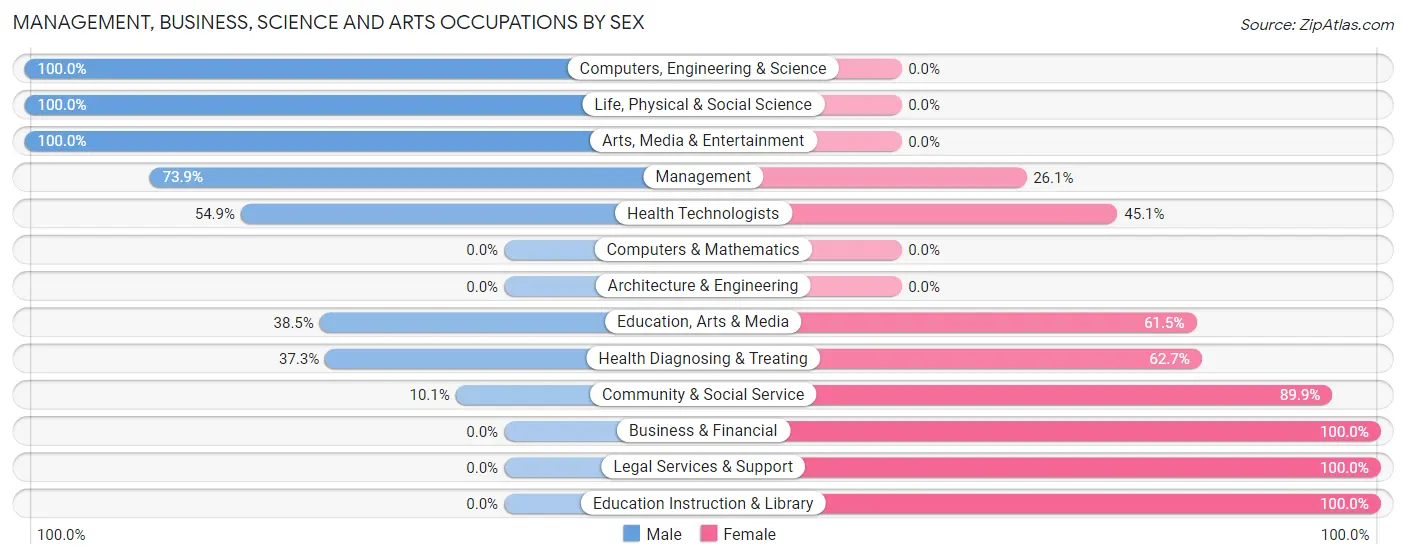
The most common Management, Business, Science and Arts occupations in Deenwood are Community & Social Service (99 | 13.6%), Health Diagnosing & Treating (75 | 10.3%), Education Instruction & Library (70 | 9.6%), Health Technologists (51 | 7.0%), and Computers, Engineering & Science (34 | 4.7%).
Management, Business, Science and Arts Occupations by Sex
Within the Management, Business, Science and Arts occupations in Deenwood, the most male-oriented occupations are Computers, Engineering & Science (100.0%), Life, Physical & Social Science (100.0%), and Arts, Media & Entertainment (100.0%), while the most female-oriented occupations are Business & Financial (100.0%), Legal Services & Support (100.0%), and Education Instruction & Library (100.0%).
| Occupation | Male | Female |
| Management | 17 (73.9%) | 6 (26.1%) |
| Business & Financial | 0 (0.0%) | 10 (100.0%) |
| Computers, Engineering & Science | 34 (100.0%) | 0 (0.0%) |
| Computers & Mathematics | 0 (0.0%) | 0 (0.0%) |
| Architecture & Engineering | 0 (0.0%) | 0 (0.0%) |
| Life, Physical & Social Science | 34 (100.0%) | 0 (0.0%) |
| Community & Social Service | 10 (10.1%) | 89 (89.9%) |
| Education, Arts & Media | 5 (38.5%) | 8 (61.5%) |
| Legal Services & Support | 0 (0.0%) | 11 (100.0%) |
| Education Instruction & Library | 0 (0.0%) | 70 (100.0%) |
| Arts, Media & Entertainment | 5 (100.0%) | 0 (0.0%) |
| Health Diagnosing & Treating | 28 (37.3%) | 47 (62.7%) |
| Health Technologists | 28 (54.9%) | 23 (45.1%) |
| Total (Category) | 89 (36.9%) | 152 (63.1%) |
| Total (Overall) | 387 (53.2%) | 341 (46.8%) |
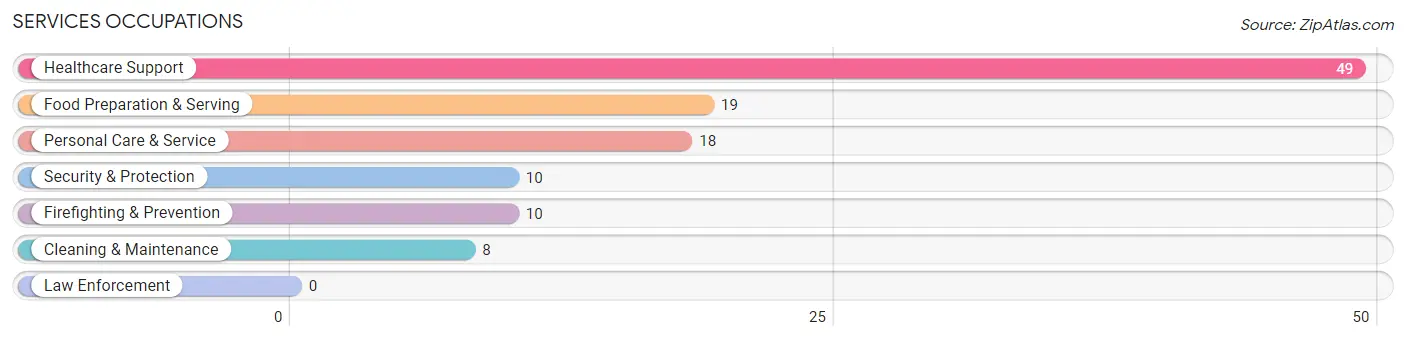
Services Occupations
The most common Services occupations in Deenwood are Healthcare Support (49 | 6.7%), Food Preparation & Serving (19 | 2.6%), Personal Care & Service (18 | 2.5%), Security & Protection (10 | 1.4%), and Firefighting & Prevention (10 | 1.4%).
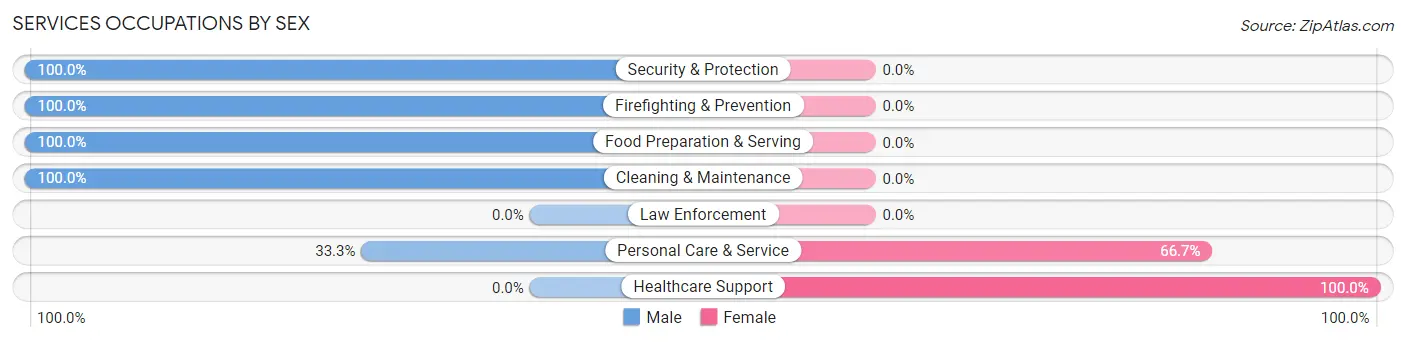
Services Occupations by Sex
Within the Services occupations in Deenwood, the most male-oriented occupations are Security & Protection (100.0%), Firefighting & Prevention (100.0%), and Food Preparation & Serving (100.0%), while the most female-oriented occupations are Healthcare Support (100.0%), and Personal Care & Service (66.7%).
| Occupation | Male | Female |
| Healthcare Support | 0 (0.0%) | 49 (100.0%) |
| Security & Protection | 10 (100.0%) | 0 (0.0%) |
| Firefighting & Prevention | 10 (100.0%) | 0 (0.0%) |
| Law Enforcement | 0 (0.0%) | 0 (0.0%) |
| Food Preparation & Serving | 19 (100.0%) | 0 (0.0%) |
| Cleaning & Maintenance | 8 (100.0%) | 0 (0.0%) |
| Personal Care & Service | 6 (33.3%) | 12 (66.7%) |
| Total (Category) | 43 (41.3%) | 61 (58.7%) |
| Total (Overall) | 387 (53.2%) | 341 (46.8%) |
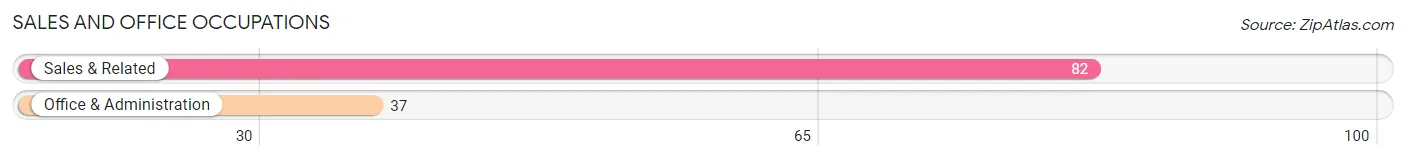
Sales and Office Occupations
The most common Sales and Office occupations in Deenwood are Sales & Related (82 | 11.3%), and Office & Administration (37 | 5.1%).
Sales and Office Occupations by Sex
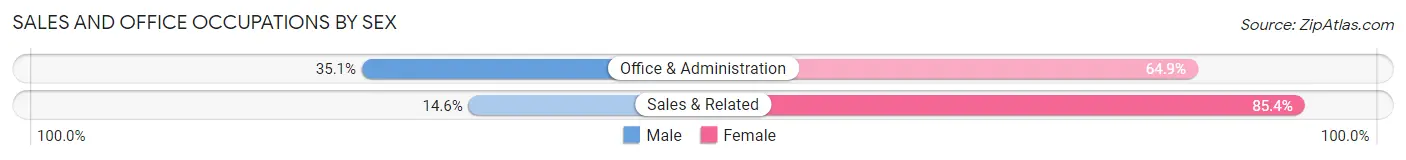
| Occupation | Male | Female |
| Sales & Related | 12 (14.6%) | 70 (85.4%) |
| Office & Administration | 13 (35.1%) | 24 (64.9%) |
| Total (Category) | 25 (21.0%) | 94 (79.0%) |
| Total (Overall) | 387 (53.2%) | 341 (46.8%) |
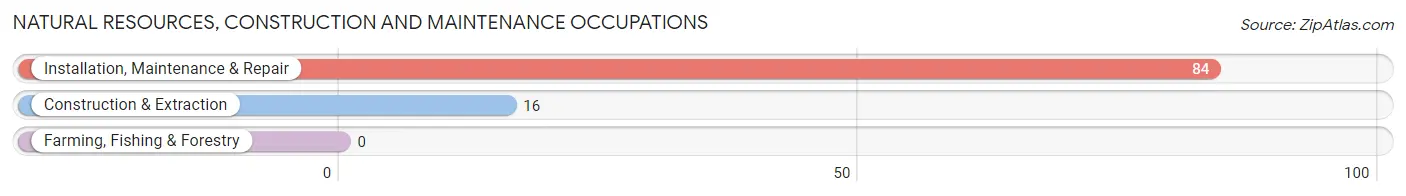
Natural Resources, Construction and Maintenance Occupations
The most common Natural Resources, Construction and Maintenance occupations in Deenwood are Installation, Maintenance & Repair (84 | 11.5%), and Construction & Extraction (16 | 2.2%).
Natural Resources, Construction and Maintenance Occupations by Sex
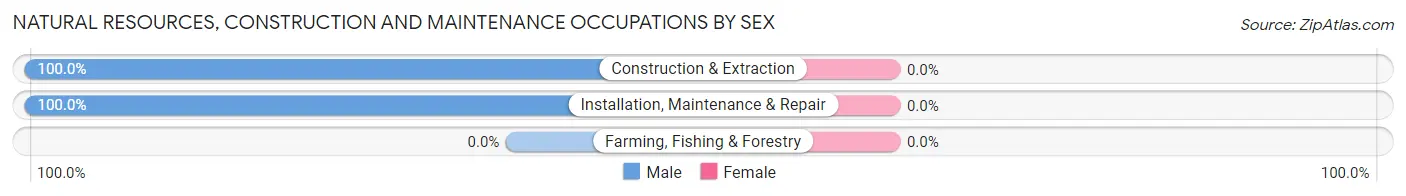
| Occupation | Male | Female |
| Farming, Fishing & Forestry | 0 (0.0%) | 0 (0.0%) |
| Construction & Extraction | 16 (100.0%) | 0 (0.0%) |
| Installation, Maintenance & Repair | 84 (100.0%) | 0 (0.0%) |
| Total (Category) | 100 (100.0%) | 0 (0.0%) |
| Total (Overall) | 387 (53.2%) | 341 (46.8%) |
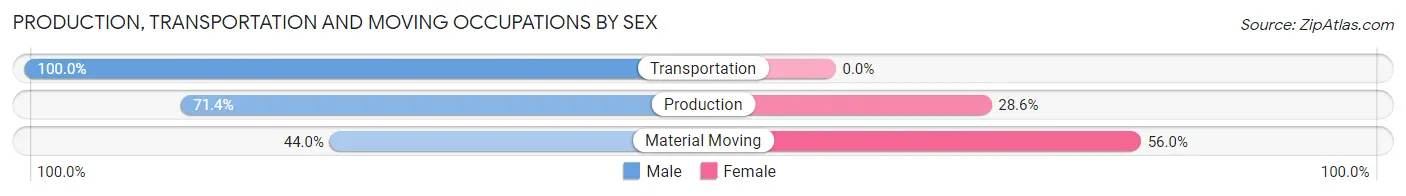
Production, Transportation and Moving Occupations
The most common Production, Transportation and Moving occupations in Deenwood are Production (70 | 9.6%), Transportation (69 | 9.5%), and Material Moving (25 | 3.4%).
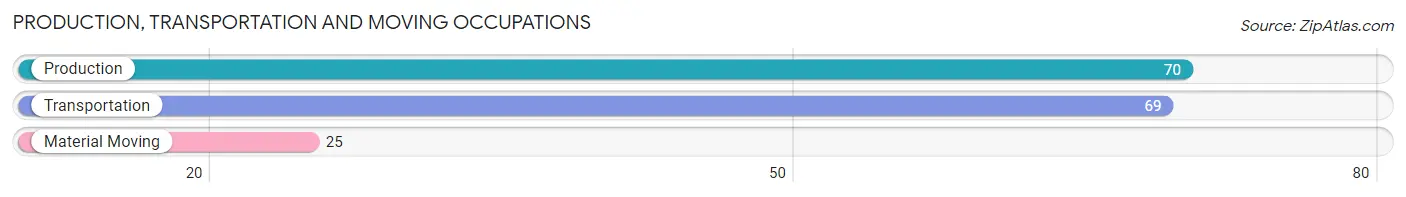
Production, Transportation and Moving Occupations by Sex
| Occupation | Male | Female |
| Production | 50 (71.4%) | 20 (28.6%) |
| Transportation | 69 (100.0%) | 0 (0.0%) |
| Material Moving | 11 (44.0%) | 14 (56.0%) |
| Total (Category) | 130 (79.3%) | 34 (20.7%) |
| Total (Overall) | 387 (53.2%) | 341 (46.8%) |
Employment Industries by Sex in Deenwood
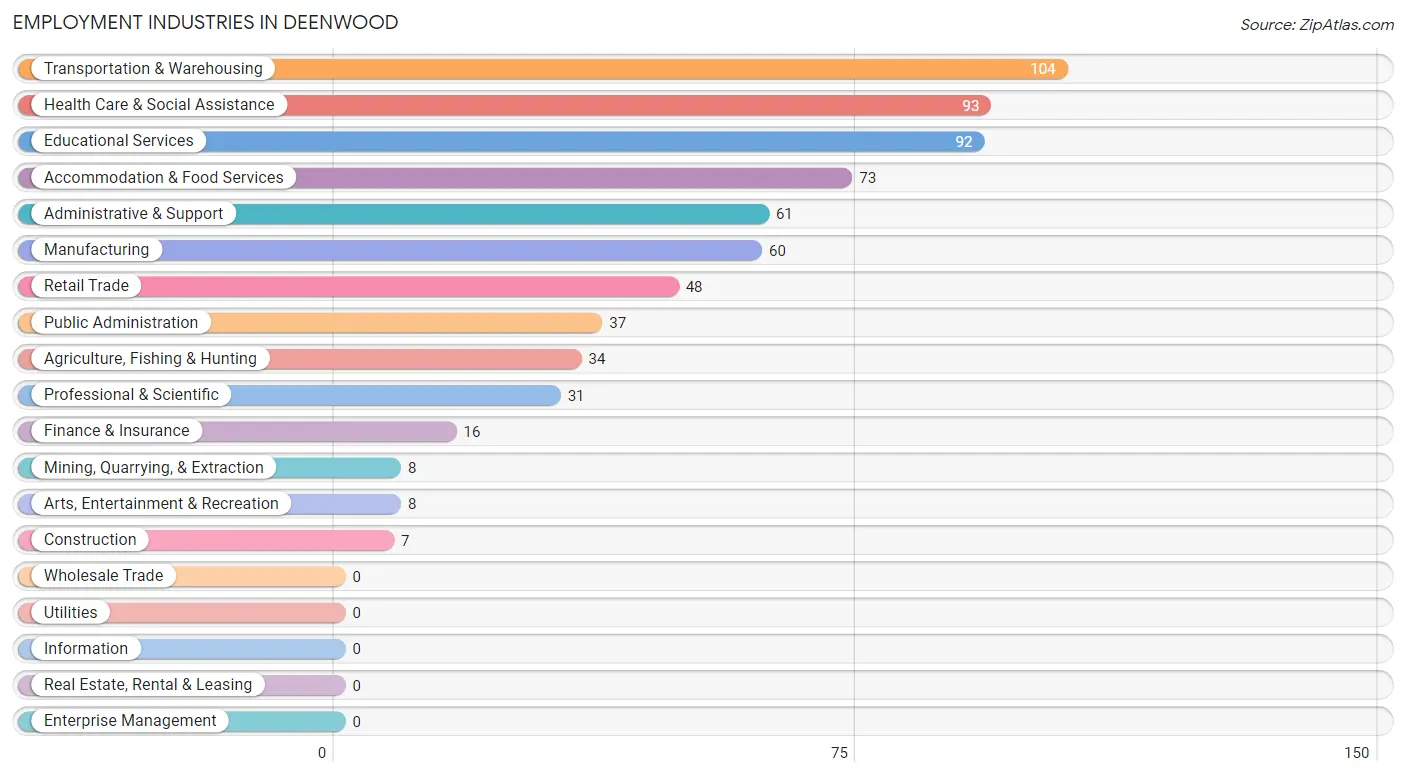
Employment Industries in Deenwood
The major employment industries in Deenwood include Transportation & Warehousing (104 | 14.3%), Health Care & Social Assistance (93 | 12.8%), Educational Services (92 | 12.6%), Accommodation & Food Services (73 | 10.0%), and Administrative & Support (61 | 8.4%).
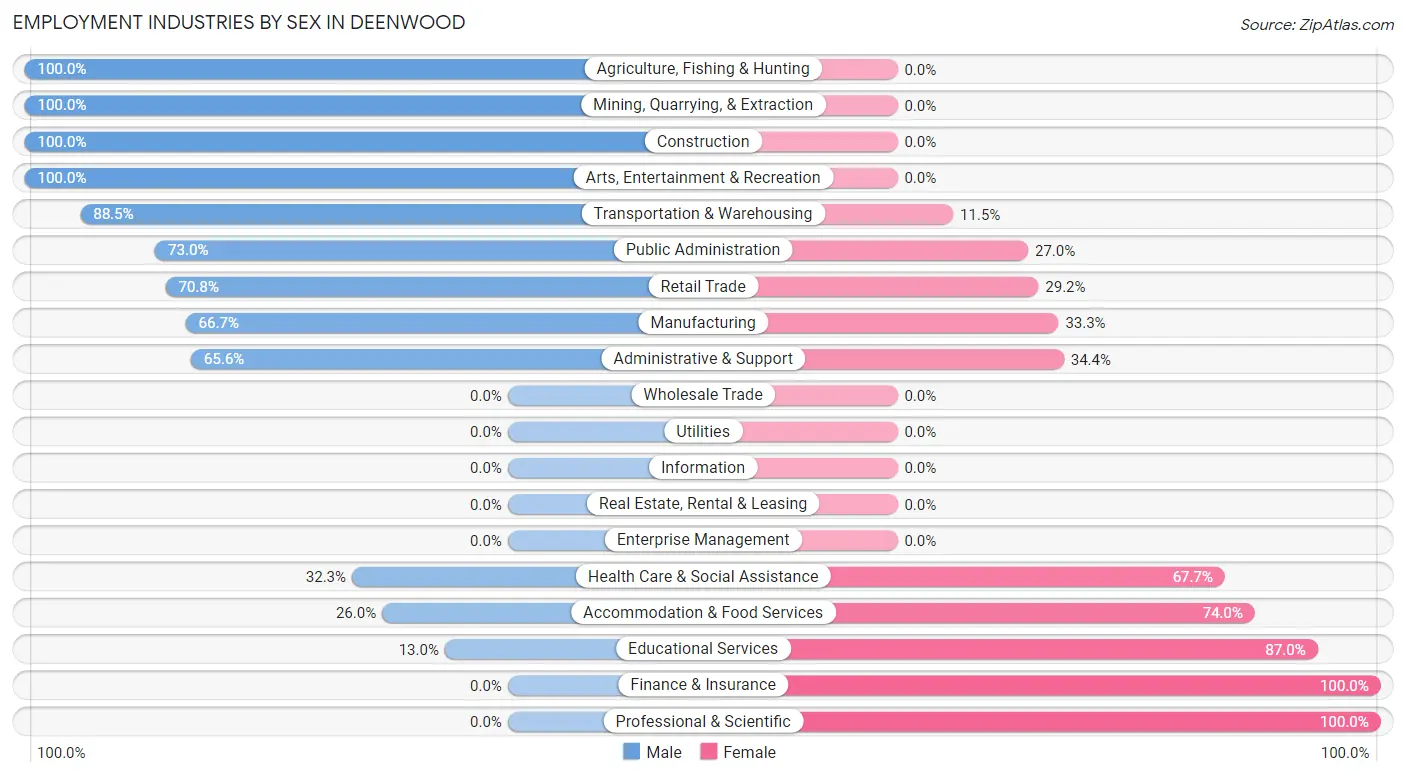
Employment Industries by Sex in Deenwood
The Deenwood industries that see more men than women are Agriculture, Fishing & Hunting (100.0%), Mining, Quarrying, & Extraction (100.0%), and Construction (100.0%), whereas the industries that tend to have a higher number of women are Finance & Insurance (100.0%), Professional & Scientific (100.0%), and Educational Services (87.0%).
| Industry | Male | Female |
| Agriculture, Fishing & Hunting | 34 (100.0%) | 0 (0.0%) |
| Mining, Quarrying, & Extraction | 8 (100.0%) | 0 (0.0%) |
| Construction | 7 (100.0%) | 0 (0.0%) |
| Manufacturing | 40 (66.7%) | 20 (33.3%) |
| Wholesale Trade | 0 (0.0%) | 0 (0.0%) |
| Retail Trade | 34 (70.8%) | 14 (29.2%) |
| Transportation & Warehousing | 92 (88.5%) | 12 (11.5%) |
| Utilities | 0 (0.0%) | 0 (0.0%) |
| Information | 0 (0.0%) | 0 (0.0%) |
| Finance & Insurance | 0 (0.0%) | 16 (100.0%) |
| Real Estate, Rental & Leasing | 0 (0.0%) | 0 (0.0%) |
| Professional & Scientific | 0 (0.0%) | 31 (100.0%) |
| Enterprise Management | 0 (0.0%) | 0 (0.0%) |
| Administrative & Support | 40 (65.6%) | 21 (34.4%) |
| Educational Services | 12 (13.0%) | 80 (87.0%) |
| Health Care & Social Assistance | 30 (32.3%) | 63 (67.7%) |
| Arts, Entertainment & Recreation | 8 (100.0%) | 0 (0.0%) |
| Accommodation & Food Services | 19 (26.0%) | 54 (74.0%) |
| Public Administration | 27 (73.0%) | 10 (27.0%) |
| Total | 387 (53.2%) | 341 (46.8%) |
Education in Deenwood
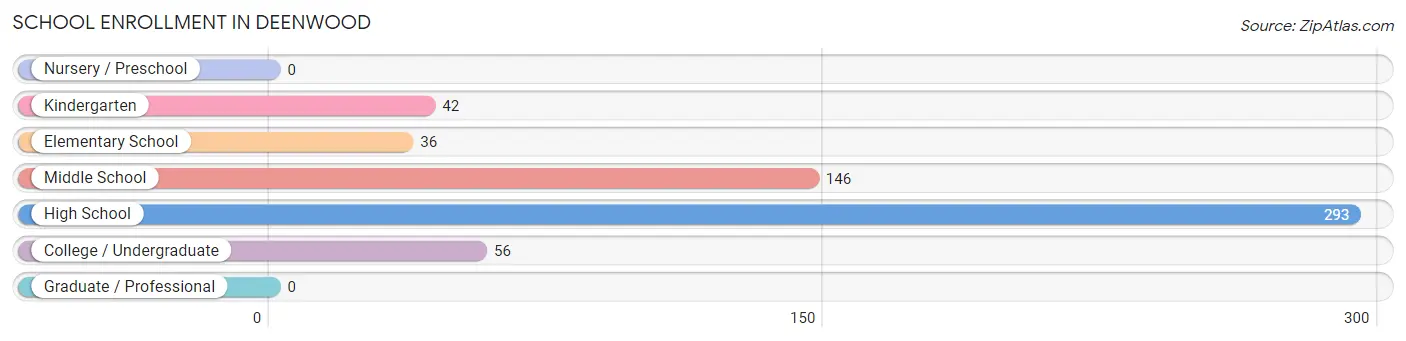
School Enrollment in Deenwood
The most common levels of schooling among the 573 students in Deenwood are high school (293 | 51.1%), middle school (146 | 25.5%), and college / undergraduate (56 | 9.8%).
| School Level | # Students | % Students |
| Nursery / Preschool | 0 | 0.0% |
| Kindergarten | 42 | 7.3% |
| Elementary School | 36 | 6.3% |
| Middle School | 146 | 25.5% |
| High School | 293 | 51.1% |
| College / Undergraduate | 56 | 9.8% |
| Graduate / Professional | 0 | 0.0% |
| Total | 573 | 100.0% |
School Enrollment by Age by Funding Source in Deenwood
Out of a total of 573 students who are enrolled in schools in Deenwood, 65 (11.3%) attend a private institution, while the remaining 508 (88.7%) are enrolled in public schools. The age group of 18 to 19 year olds has the highest likelihood of being enrolled in private schools, with 28 (22.2% in the age bracket) enrolled. Conversely, the age group of 5 to 9 year old has the lowest likelihood of being enrolled in a private school, with 67 (100.0% in the age bracket) attending a public institution.
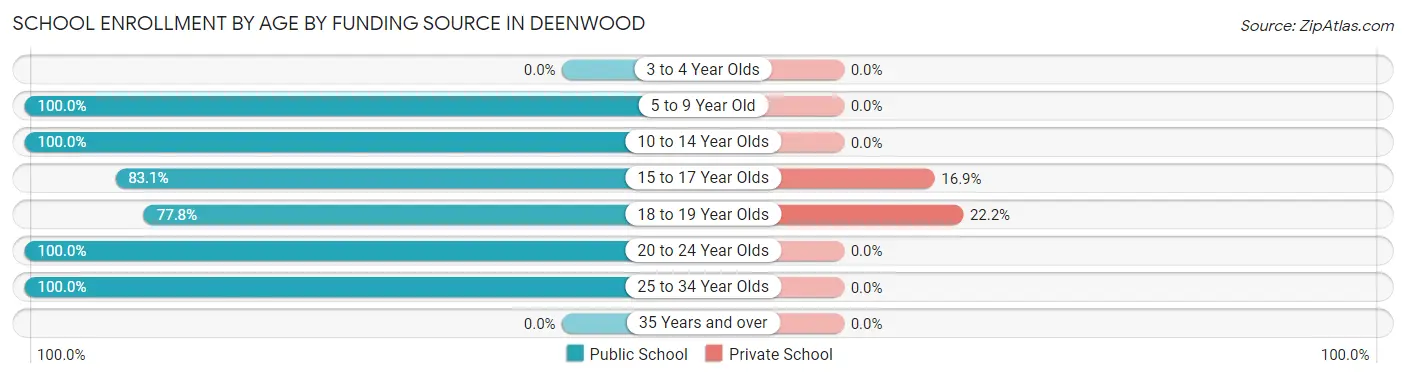
| Age Bracket | Public School | Private School |
| 3 to 4 Year Olds | 0 (0.0%) | 0 (0.0%) |
| 5 to 9 Year Old | 67 (100.0%) | 0 (0.0%) |
| 10 to 14 Year Olds | 133 (100.0%) | 0 (0.0%) |
| 15 to 17 Year Olds | 182 (83.1%) | 37 (16.9%) |
| 18 to 19 Year Olds | 98 (77.8%) | 28 (22.2%) |
| 20 to 24 Year Olds | 20 (100.0%) | 0 (0.0%) |
| 25 to 34 Year Olds | 8 (100.0%) | 0 (0.0%) |
| 35 Years and over | 0 (0.0%) | 0 (0.0%) |
| Total | 508 (88.7%) | 65 (11.3%) |
Educational Attainment by Field of Study in Deenwood
Bio, nature & agricultural (104 | 28.8%), engineering (103 | 28.5%), science & technology (61 | 16.9%), education (58 | 16.1%), and arts & humanities (16 | 4.4%) are the most common fields of study among 361 individuals in Deenwood who have obtained a bachelor's degree or higher.
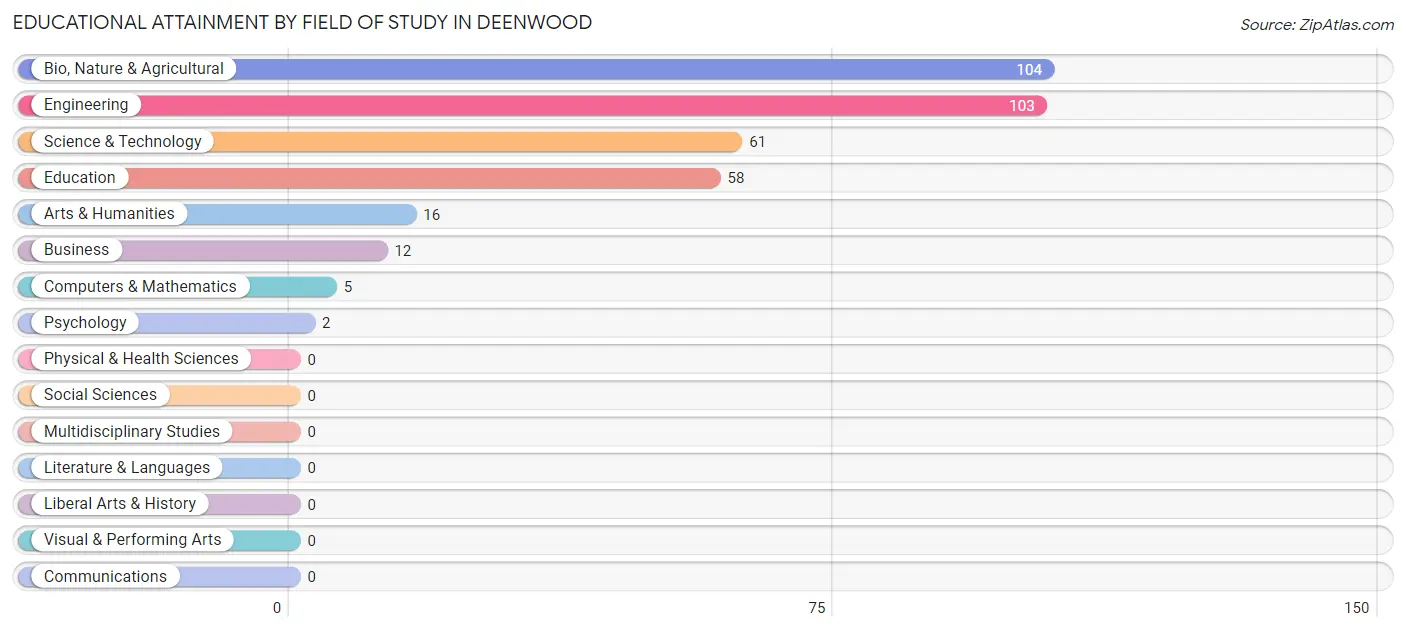
| Field of Study | # Graduates | % Graduates |
| Computers & Mathematics | 5 | 1.4% |
| Bio, Nature & Agricultural | 104 | 28.8% |
| Physical & Health Sciences | 0 | 0.0% |
| Psychology | 2 | 0.5% |
| Social Sciences | 0 | 0.0% |
| Engineering | 103 | 28.5% |
| Multidisciplinary Studies | 0 | 0.0% |
| Science & Technology | 61 | 16.9% |
| Business | 12 | 3.3% |
| Education | 58 | 16.1% |
| Literature & Languages | 0 | 0.0% |
| Liberal Arts & History | 0 | 0.0% |
| Visual & Performing Arts | 0 | 0.0% |
| Communications | 0 | 0.0% |
| Arts & Humanities | 16 | 4.4% |
| Total | 361 | 100.0% |
Transportation & Commute in Deenwood
Vehicle Availability by Sex in Deenwood
The most prevalent vehicle ownership categories in Deenwood are males with 2 vehicles (200, accounting for 52.5%) and females with 2 vehicles (141, making up 61.5%).
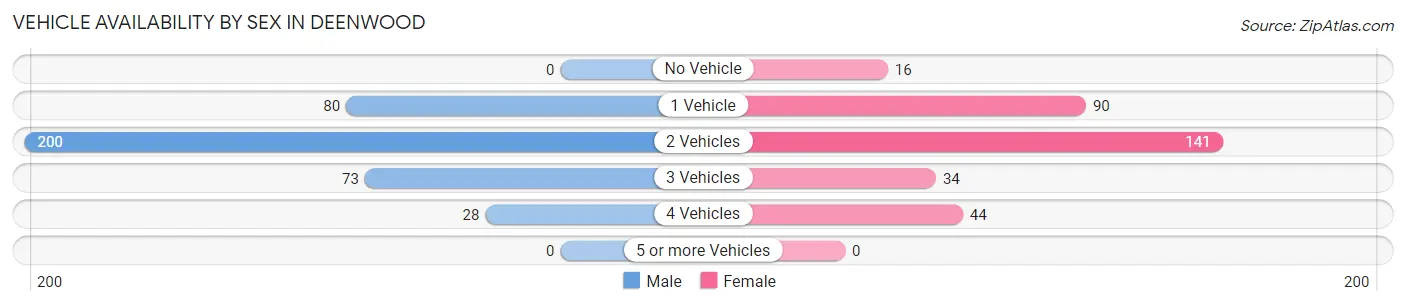
| Vehicles Available | Male | Female |
| No Vehicle | 0 (0.0%) | 16 (4.9%) |
| 1 Vehicle | 80 (21.0%) | 90 (27.7%) |
| 2 Vehicles | 200 (52.5%) | 141 (43.4%) |
| 3 Vehicles | 73 (19.2%) | 34 (10.5%) |
| 4 Vehicles | 28 (7.3%) | 44 (13.5%) |
| 5 or more Vehicles | 0 (0.0%) | 0 (0.0%) |
| Total | 381 (100.0%) | 325 (100.0%) |
Commute Time in Deenwood
The most frequently occuring commute durations in Deenwood are 15 to 19 minutes (175 commuters, 25.2%), 20 to 24 minutes (169 commuters, 24.3%), and 10 to 14 minutes (100 commuters, 14.4%).
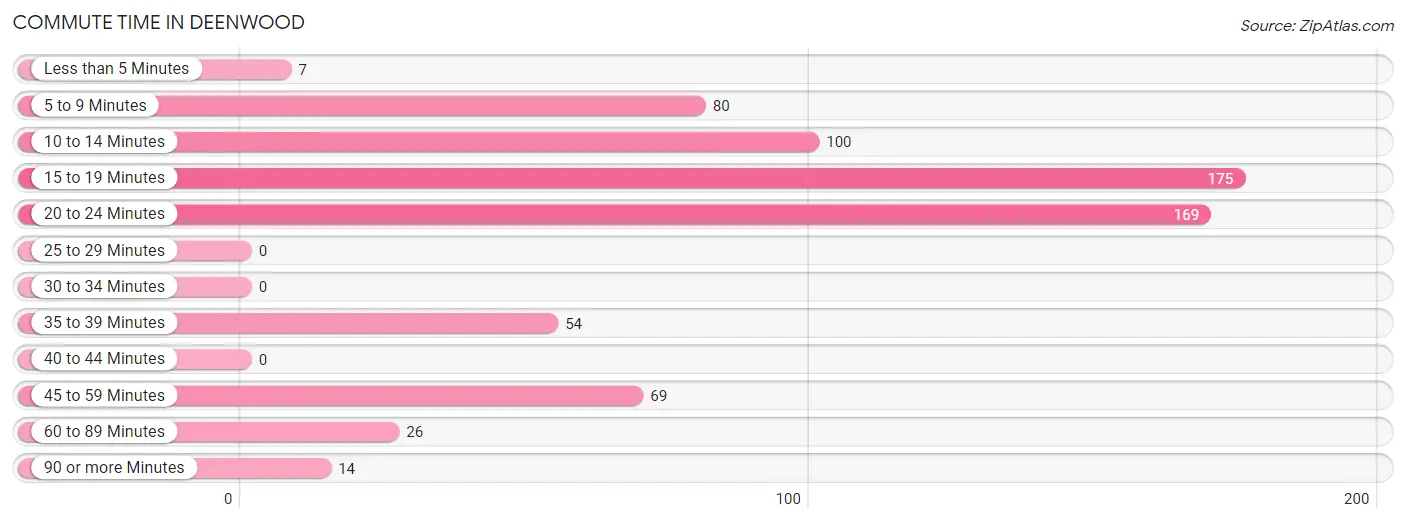
| Commute Time | # Commuters | % Commuters |
| Less than 5 Minutes | 7 | 1.0% |
| 5 to 9 Minutes | 80 | 11.5% |
| 10 to 14 Minutes | 100 | 14.4% |
| 15 to 19 Minutes | 175 | 25.2% |
| 20 to 24 Minutes | 169 | 24.3% |
| 25 to 29 Minutes | 0 | 0.0% |
| 30 to 34 Minutes | 0 | 0.0% |
| 35 to 39 Minutes | 54 | 7.8% |
| 40 to 44 Minutes | 0 | 0.0% |
| 45 to 59 Minutes | 69 | 9.9% |
| 60 to 89 Minutes | 26 | 3.7% |
| 90 or more Minutes | 14 | 2.0% |
Commute Time by Sex in Deenwood
The most common commute times in Deenwood are 20 to 24 minutes (82 commuters, 22.2%) for males and 15 to 19 minutes (120 commuters, 36.9%) for females.
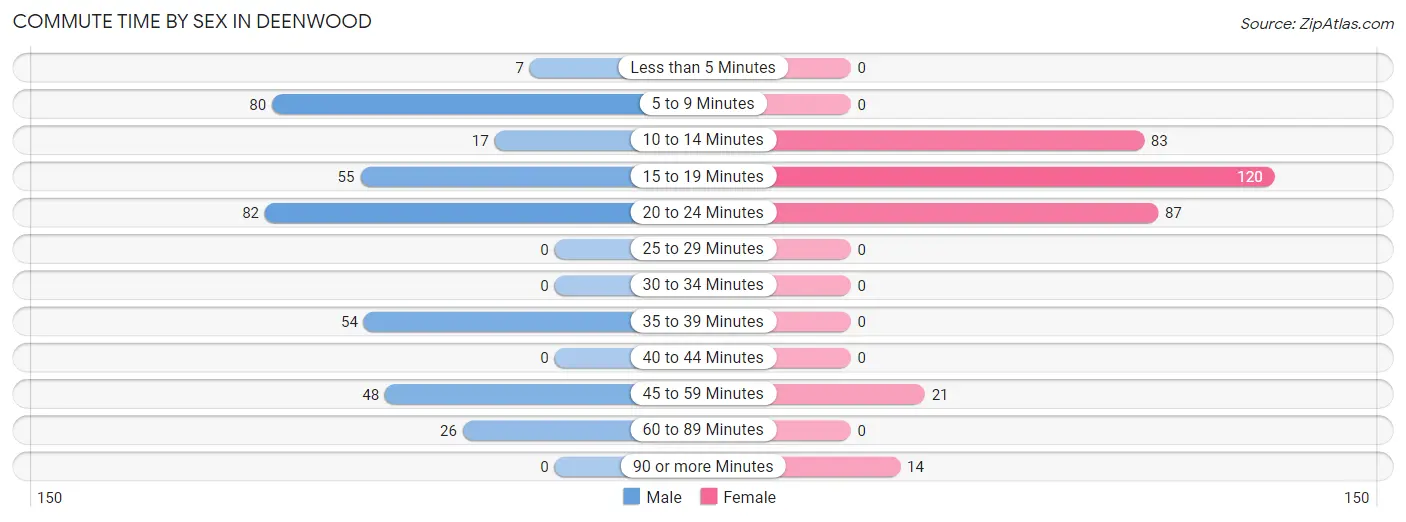
| Commute Time | Male | Female |
| Less than 5 Minutes | 7 (1.9%) | 0 (0.0%) |
| 5 to 9 Minutes | 80 (21.7%) | 0 (0.0%) |
| 10 to 14 Minutes | 17 (4.6%) | 83 (25.5%) |
| 15 to 19 Minutes | 55 (14.9%) | 120 (36.9%) |
| 20 to 24 Minutes | 82 (22.2%) | 87 (26.8%) |
| 25 to 29 Minutes | 0 (0.0%) | 0 (0.0%) |
| 30 to 34 Minutes | 0 (0.0%) | 0 (0.0%) |
| 35 to 39 Minutes | 54 (14.6%) | 0 (0.0%) |
| 40 to 44 Minutes | 0 (0.0%) | 0 (0.0%) |
| 45 to 59 Minutes | 48 (13.0%) | 21 (6.5%) |
| 60 to 89 Minutes | 26 (7.0%) | 0 (0.0%) |
| 90 or more Minutes | 0 (0.0%) | 14 (4.3%) |
Time of Departure to Work by Sex in Deenwood
The most frequent times of departure to work in Deenwood are 6:00 AM to 6:29 AM (74, 20.1%) for males and 7:00 AM to 7:29 AM (99, 30.5%) for females.
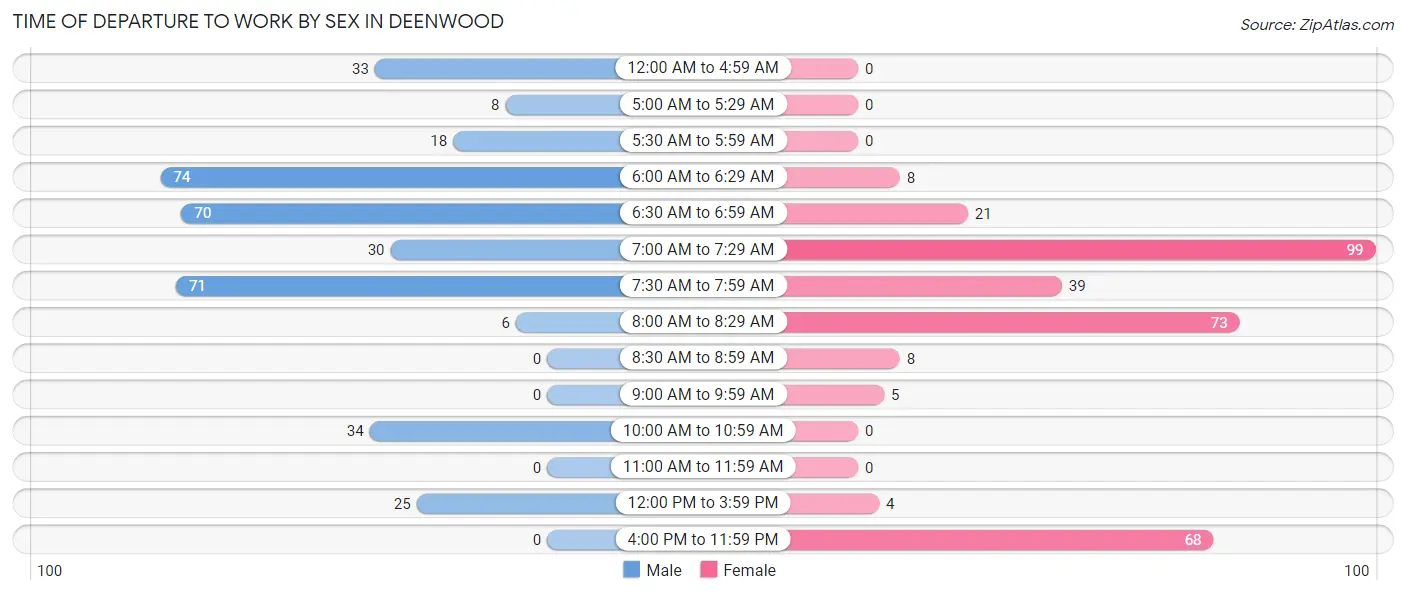
| Time of Departure | Male | Female |
| 12:00 AM to 4:59 AM | 33 (8.9%) | 0 (0.0%) |
| 5:00 AM to 5:29 AM | 8 (2.2%) | 0 (0.0%) |
| 5:30 AM to 5:59 AM | 18 (4.9%) | 0 (0.0%) |
| 6:00 AM to 6:29 AM | 74 (20.1%) | 8 (2.5%) |
| 6:30 AM to 6:59 AM | 70 (19.0%) | 21 (6.5%) |
| 7:00 AM to 7:29 AM | 30 (8.1%) | 99 (30.5%) |
| 7:30 AM to 7:59 AM | 71 (19.2%) | 39 (12.0%) |
| 8:00 AM to 8:29 AM | 6 (1.6%) | 73 (22.5%) |
| 8:30 AM to 8:59 AM | 0 (0.0%) | 8 (2.5%) |
| 9:00 AM to 9:59 AM | 0 (0.0%) | 5 (1.5%) |
| 10:00 AM to 10:59 AM | 34 (9.2%) | 0 (0.0%) |
| 11:00 AM to 11:59 AM | 0 (0.0%) | 0 (0.0%) |
| 12:00 PM to 3:59 PM | 25 (6.8%) | 4 (1.2%) |
| 4:00 PM to 11:59 PM | 0 (0.0%) | 68 (20.9%) |
| Total | 369 (100.0%) | 325 (100.0%) |
Housing Occupancy in Deenwood
Occupancy by Ownership in Deenwood
Of the total 823 dwellings in Deenwood, owner-occupied units account for 584 (71.0%), while renter-occupied units make up 239 (29.0%).
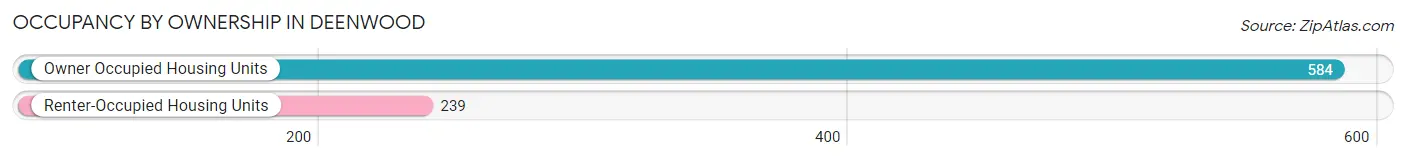
| Occupancy | # Housing Units | % Housing Units |
| Owner Occupied Housing Units | 584 | 71.0% |
| Renter-Occupied Housing Units | 239 | 29.0% |
| Total Occupied Housing Units | 823 | 100.0% |
Occupancy by Household Size in Deenwood
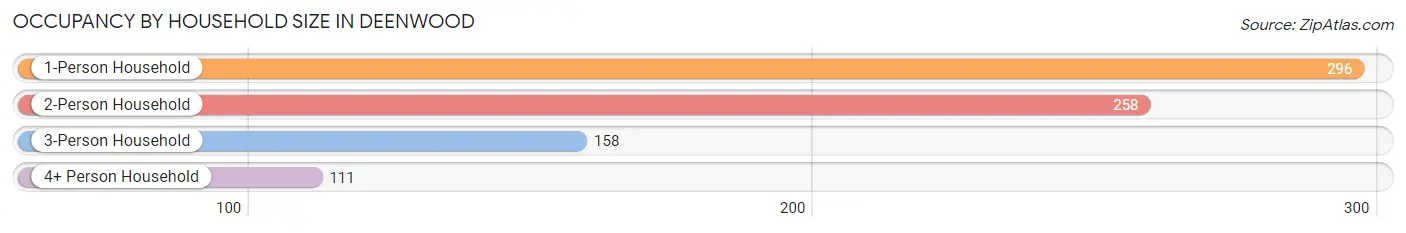
| Household Size | # Housing Units | % Housing Units |
| 1-Person Household | 296 | 36.0% |
| 2-Person Household | 258 | 31.4% |
| 3-Person Household | 158 | 19.2% |
| 4+ Person Household | 111 | 13.5% |
| Total Housing Units | 823 | 100.0% |
Occupancy by Ownership by Household Size in Deenwood
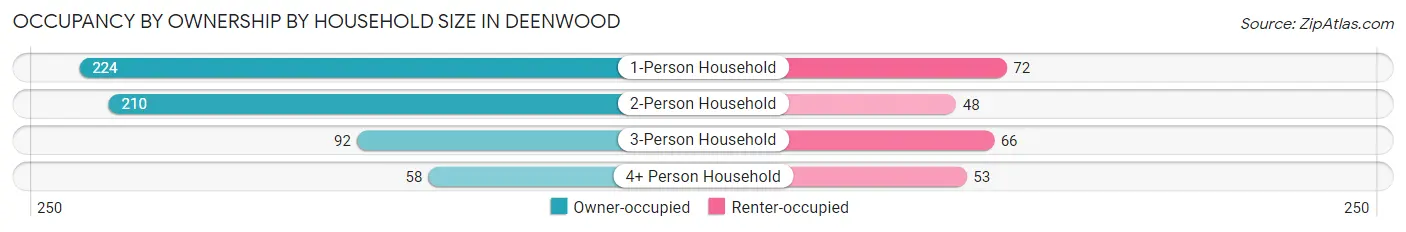
| Household Size | Owner-occupied | Renter-occupied |
| 1-Person Household | 224 (75.7%) | 72 (24.3%) |
| 2-Person Household | 210 (81.4%) | 48 (18.6%) |
| 3-Person Household | 92 (58.2%) | 66 (41.8%) |
| 4+ Person Household | 58 (52.2%) | 53 (47.7%) |
| Total Housing Units | 584 (71.0%) | 239 (29.0%) |
Occupancy by Educational Attainment in Deenwood
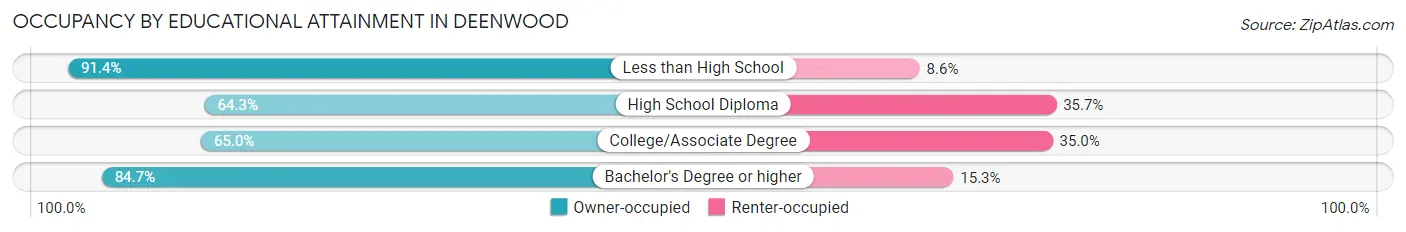
| Household Size | Owner-occupied | Renter-occupied |
| Less than High School | 53 (91.4%) | 5 (8.6%) |
| High School Diploma | 218 (64.3%) | 121 (35.7%) |
| College/Associate Degree | 158 (65.0%) | 85 (35.0%) |
| Bachelor's Degree or higher | 155 (84.7%) | 28 (15.3%) |
Occupancy by Age of Householder in Deenwood
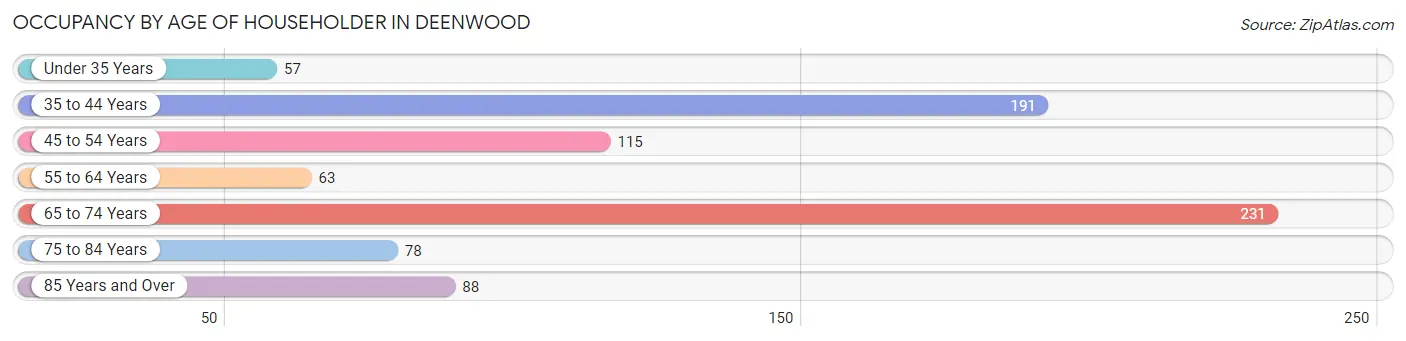
| Age Bracket | # Households | % Households |
| Under 35 Years | 57 | 6.9% |
| 35 to 44 Years | 191 | 23.2% |
| 45 to 54 Years | 115 | 14.0% |
| 55 to 64 Years | 63 | 7.6% |
| 65 to 74 Years | 231 | 28.1% |
| 75 to 84 Years | 78 | 9.5% |
| 85 Years and Over | 88 | 10.7% |
| Total | 823 | 100.0% |
Housing Finances in Deenwood
Median Income by Occupancy in Deenwood
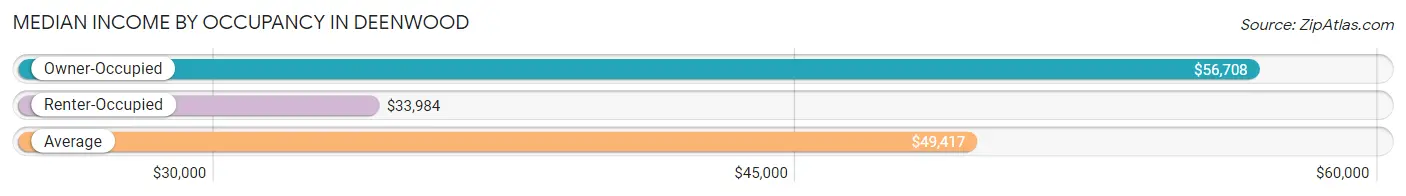
| Occupancy Type | # Households | Median Income |
| Owner-Occupied | 584 (71.0%) | $56,708 |
| Renter-Occupied | 239 (29.0%) | $33,984 |
| Average | 823 (100.0%) | $49,417 |
Occupancy by Householder Income Bracket in Deenwood
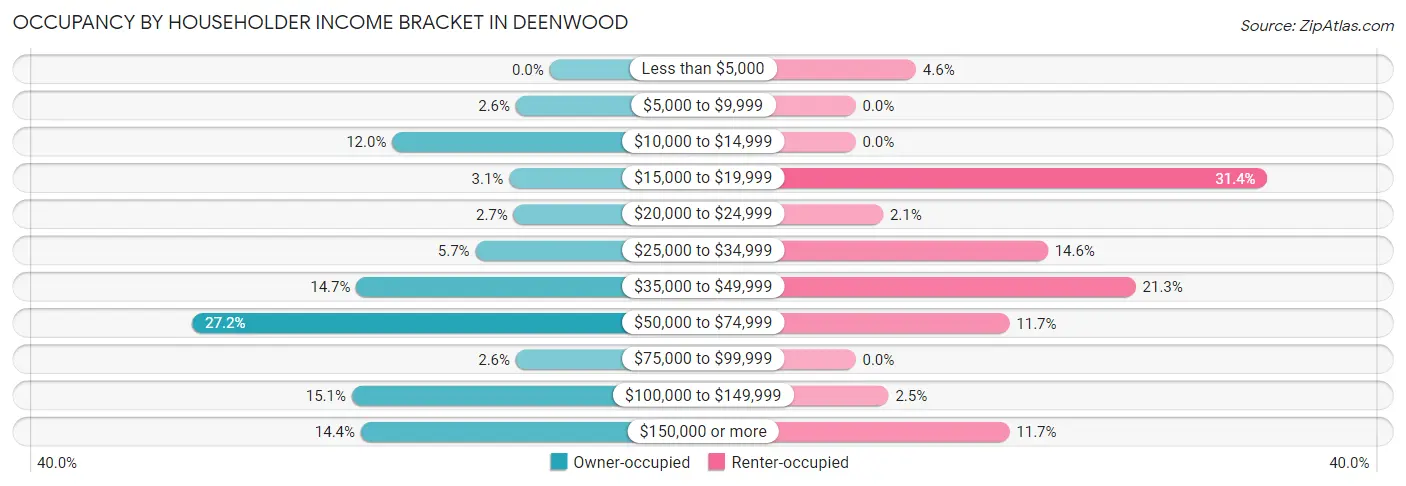
| Income Bracket | Owner-occupied | Renter-occupied |
| Less than $5,000 | 0 (0.0%) | 11 (4.6%) |
| $5,000 to $9,999 | 15 (2.6%) | 0 (0.0%) |
| $10,000 to $14,999 | 70 (12.0%) | 0 (0.0%) |
| $15,000 to $19,999 | 18 (3.1%) | 75 (31.4%) |
| $20,000 to $24,999 | 16 (2.7%) | 5 (2.1%) |
| $25,000 to $34,999 | 33 (5.7%) | 35 (14.6%) |
| $35,000 to $49,999 | 86 (14.7%) | 51 (21.3%) |
| $50,000 to $74,999 | 159 (27.2%) | 28 (11.7%) |
| $75,000 to $99,999 | 15 (2.6%) | 0 (0.0%) |
| $100,000 to $149,999 | 88 (15.1%) | 6 (2.5%) |
| $150,000 or more | 84 (14.4%) | 28 (11.7%) |
| Total | 584 (100.0%) | 239 (100.0%) |
Monthly Housing Cost Tiers in Deenwood
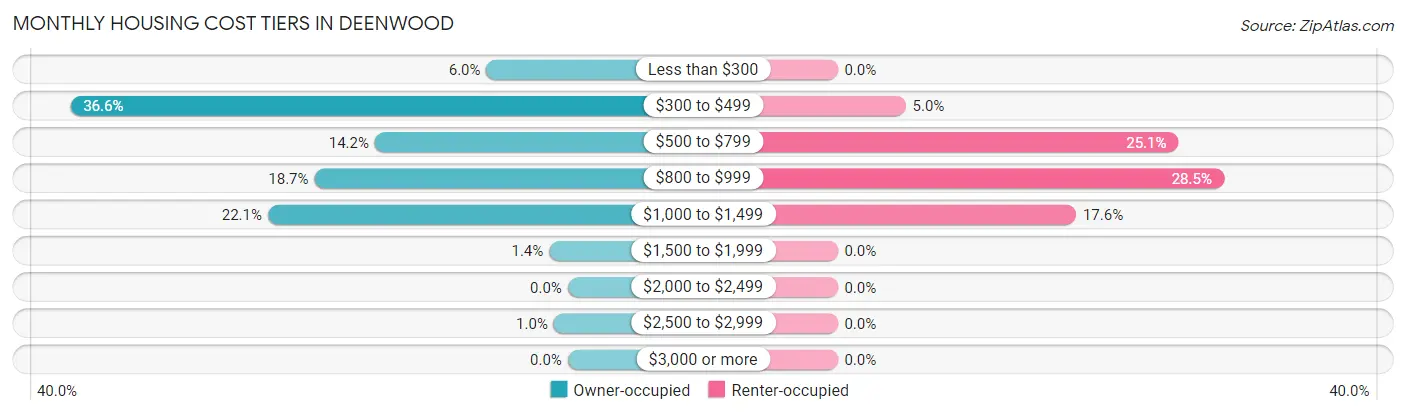
| Monthly Cost | Owner-occupied | Renter-occupied |
| Less than $300 | 35 (6.0%) | 0 (0.0%) |
| $300 to $499 | 214 (36.6%) | 12 (5.0%) |
| $500 to $799 | 83 (14.2%) | 60 (25.1%) |
| $800 to $999 | 109 (18.7%) | 68 (28.4%) |
| $1,000 to $1,499 | 129 (22.1%) | 42 (17.6%) |
| $1,500 to $1,999 | 8 (1.4%) | 0 (0.0%) |
| $2,000 to $2,499 | 0 (0.0%) | 0 (0.0%) |
| $2,500 to $2,999 | 6 (1.0%) | 0 (0.0%) |
| $3,000 or more | 0 (0.0%) | 0 (0.0%) |
| Total | 584 (100.0%) | 239 (100.0%) |
Physical Housing Characteristics in Deenwood
Housing Structures in Deenwood
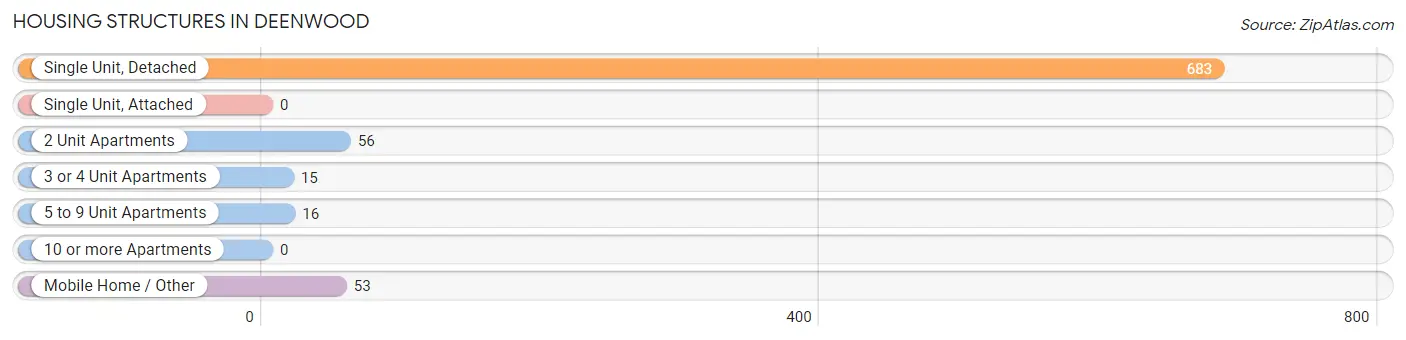
| Structure Type | # Housing Units | % Housing Units |
| Single Unit, Detached | 683 | 83.0% |
| Single Unit, Attached | 0 | 0.0% |
| 2 Unit Apartments | 56 | 6.8% |
| 3 or 4 Unit Apartments | 15 | 1.8% |
| 5 to 9 Unit Apartments | 16 | 1.9% |
| 10 or more Apartments | 0 | 0.0% |
| Mobile Home / Other | 53 | 6.4% |
| Total | 823 | 100.0% |
Housing Structures by Occupancy in Deenwood
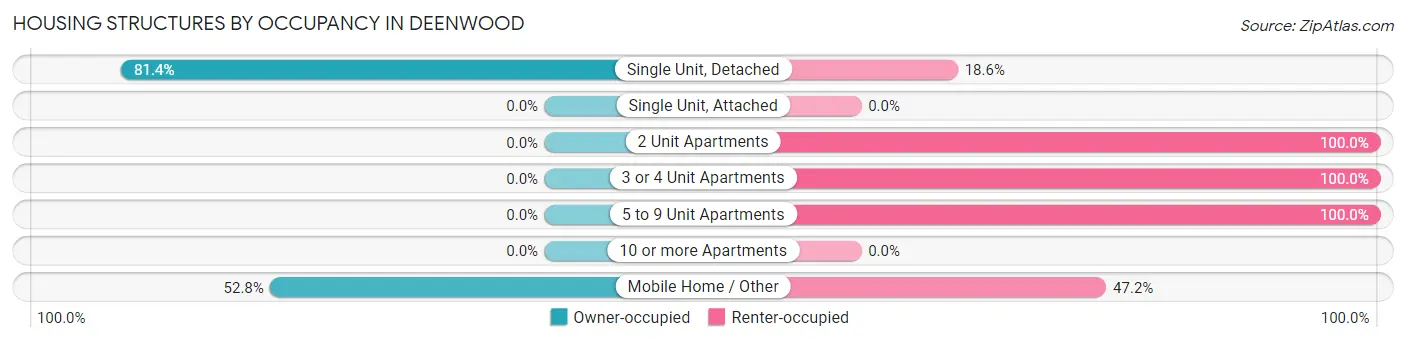
| Structure Type | Owner-occupied | Renter-occupied |
| Single Unit, Detached | 556 (81.4%) | 127 (18.6%) |
| Single Unit, Attached | 0 (0.0%) | 0 (0.0%) |
| 2 Unit Apartments | 0 (0.0%) | 56 (100.0%) |
| 3 or 4 Unit Apartments | 0 (0.0%) | 15 (100.0%) |
| 5 to 9 Unit Apartments | 0 (0.0%) | 16 (100.0%) |
| 10 or more Apartments | 0 (0.0%) | 0 (0.0%) |
| Mobile Home / Other | 28 (52.8%) | 25 (47.2%) |
| Total | 584 (71.0%) | 239 (29.0%) |
Housing Structures by Number of Rooms in Deenwood
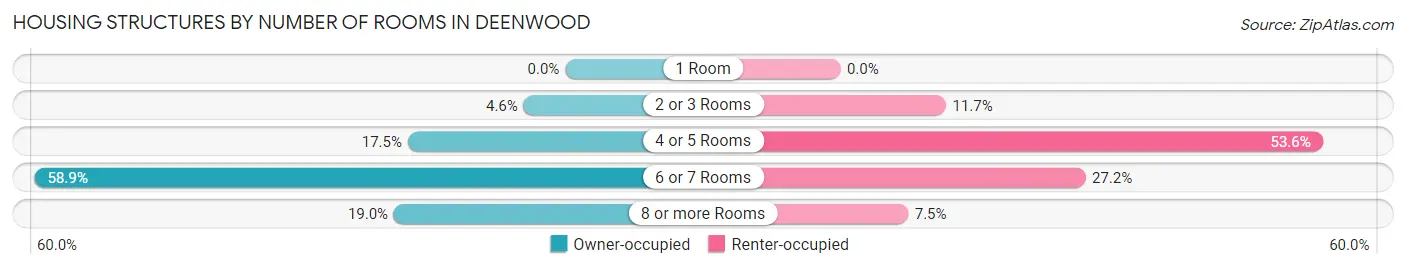
| Number of Rooms | Owner-occupied | Renter-occupied |
| 1 Room | 0 (0.0%) | 0 (0.0%) |
| 2 or 3 Rooms | 27 (4.6%) | 28 (11.7%) |
| 4 or 5 Rooms | 102 (17.5%) | 128 (53.6%) |
| 6 or 7 Rooms | 344 (58.9%) | 65 (27.2%) |
| 8 or more Rooms | 111 (19.0%) | 18 (7.5%) |
| Total | 584 (100.0%) | 239 (100.0%) |
Housing Structure by Heating Type in Deenwood
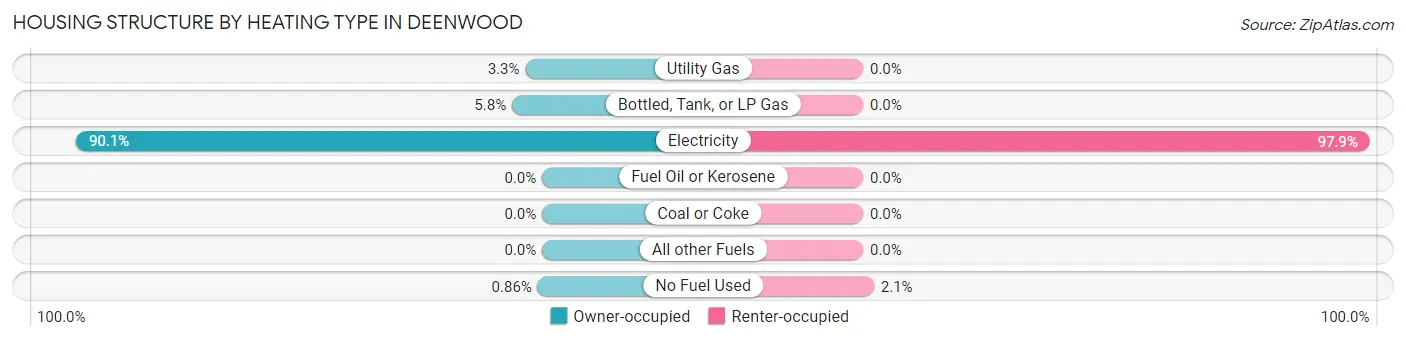
| Heating Type | Owner-occupied | Renter-occupied |
| Utility Gas | 19 (3.3%) | 0 (0.0%) |
| Bottled, Tank, or LP Gas | 34 (5.8%) | 0 (0.0%) |
| Electricity | 526 (90.1%) | 234 (97.9%) |
| Fuel Oil or Kerosene | 0 (0.0%) | 0 (0.0%) |
| Coal or Coke | 0 (0.0%) | 0 (0.0%) |
| All other Fuels | 0 (0.0%) | 0 (0.0%) |
| No Fuel Used | 5 (0.9%) | 5 (2.1%) |
| Total | 584 (100.0%) | 239 (100.0%) |
Household Vehicle Usage in Deenwood
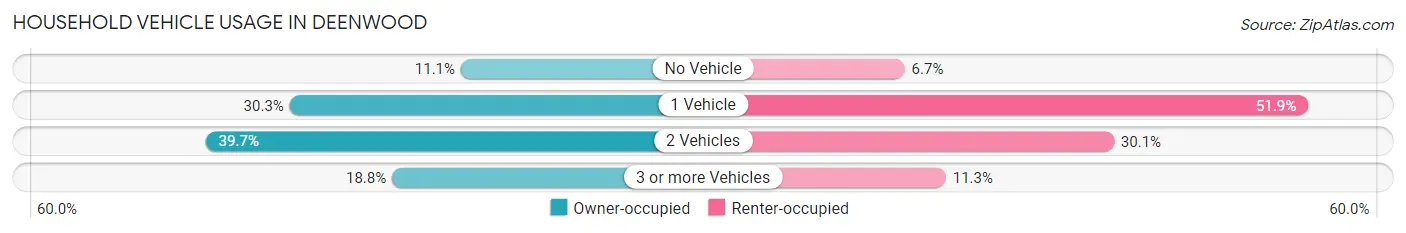
| Vehicles per Household | Owner-occupied | Renter-occupied |
| No Vehicle | 65 (11.1%) | 16 (6.7%) |
| 1 Vehicle | 177 (30.3%) | 124 (51.9%) |
| 2 Vehicles | 232 (39.7%) | 72 (30.1%) |
| 3 or more Vehicles | 110 (18.8%) | 27 (11.3%) |
| Total | 584 (100.0%) | 239 (100.0%) |
Real Estate & Mortgages in Deenwood
Real Estate and Mortgage Overview in Deenwood
| Characteristic | Without Mortgage | With Mortgage |
| Housing Units | 336 | 248 |
| Median Property Value | $125,000 | $138,500 |
| Median Household Income | $39,435 | $39 |
| Monthly Housing Costs | $432 | $0 |
| Real Estate Taxes | $1,357 | $8 |
Property Value by Mortgage Status in Deenwood
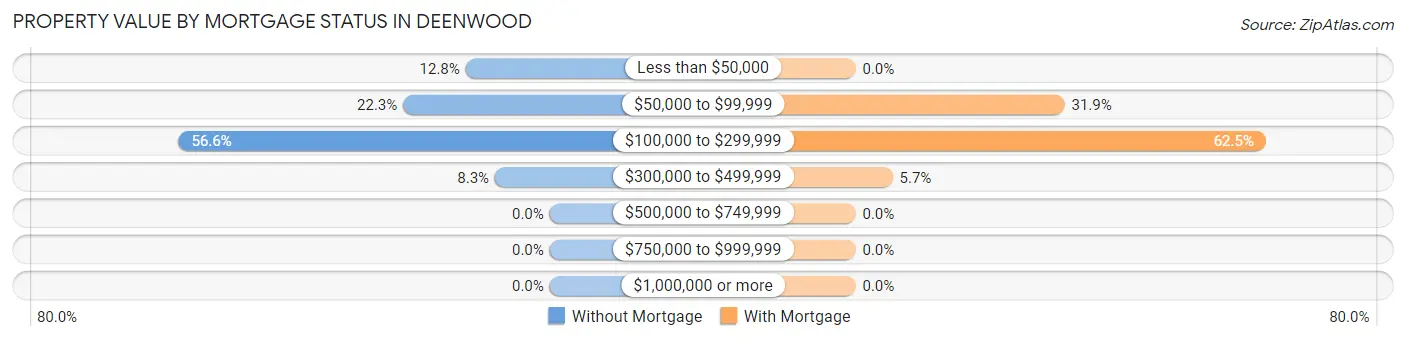
| Property Value | Without Mortgage | With Mortgage |
| Less than $50,000 | 43 (12.8%) | 0 (0.0%) |
| $50,000 to $99,999 | 75 (22.3%) | 79 (31.9%) |
| $100,000 to $299,999 | 190 (56.6%) | 155 (62.5%) |
| $300,000 to $499,999 | 28 (8.3%) | 14 (5.7%) |
| $500,000 to $749,999 | 0 (0.0%) | 0 (0.0%) |
| $750,000 to $999,999 | 0 (0.0%) | 0 (0.0%) |
| $1,000,000 or more | 0 (0.0%) | 0 (0.0%) |
| Total | 336 (100.0%) | 248 (100.0%) |
Household Income by Mortgage Status in Deenwood
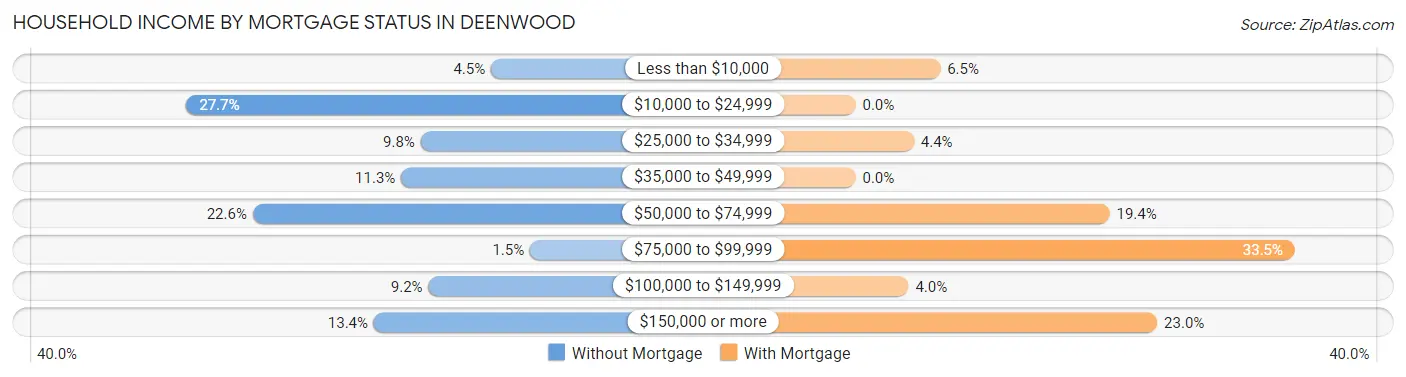
| Household Income | Without Mortgage | With Mortgage |
| Less than $10,000 | 15 (4.5%) | 16 (6.5%) |
| $10,000 to $24,999 | 93 (27.7%) | 0 (0.0%) |
| $25,000 to $34,999 | 33 (9.8%) | 11 (4.4%) |
| $35,000 to $49,999 | 38 (11.3%) | 0 (0.0%) |
| $50,000 to $74,999 | 76 (22.6%) | 48 (19.4%) |
| $75,000 to $99,999 | 5 (1.5%) | 83 (33.5%) |
| $100,000 to $149,999 | 31 (9.2%) | 10 (4.0%) |
| $150,000 or more | 45 (13.4%) | 57 (23.0%) |
| Total | 336 (100.0%) | 248 (100.0%) |
Property Value to Household Income Ratio in Deenwood
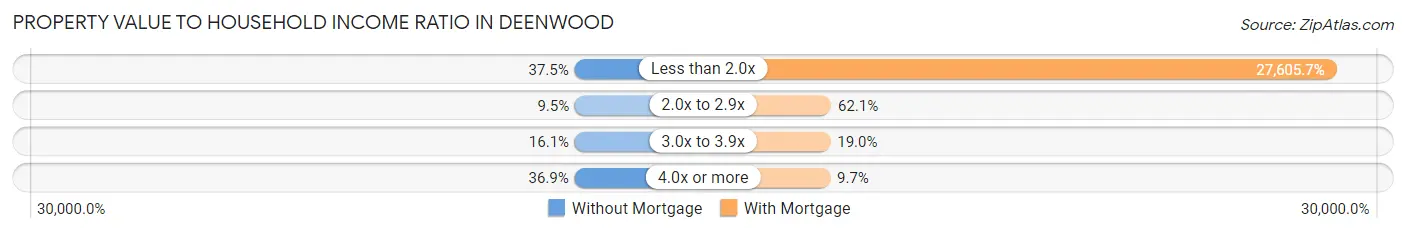
| Value-to-Income Ratio | Without Mortgage | With Mortgage |
| Less than 2.0x | 126 (37.5%) | 68,462 (27,605.7%) |
| 2.0x to 2.9x | 32 (9.5%) | 154 (62.1%) |
| 3.0x to 3.9x | 54 (16.1%) | 47 (19.0%) |
| 4.0x or more | 124 (36.9%) | 24 (9.7%) |
| Total | 336 (100.0%) | 248 (100.0%) |
Real Estate Taxes by Mortgage Status in Deenwood
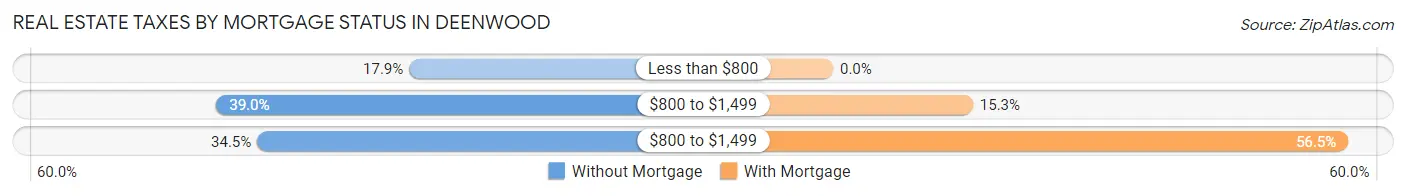
| Property Taxes | Without Mortgage | With Mortgage |
| Less than $800 | 60 (17.9%) | 0 (0.0%) |
| $800 to $1,499 | 131 (39.0%) | 38 (15.3%) |
| $800 to $1,499 | 116 (34.5%) | 140 (56.5%) |
| Total | 336 (100.0%) | 248 (100.0%) |
Health & Disability in Deenwood
Health Insurance Coverage by Age in Deenwood
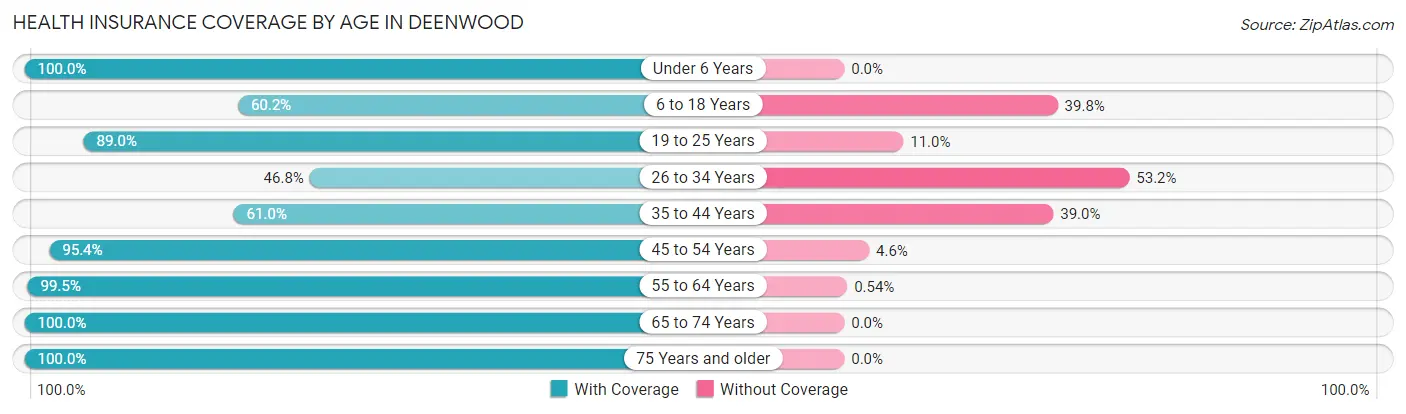
| Age Bracket | With Coverage | Without Coverage |
| Under 6 Years | 121 (100.0%) | 0 (0.0%) |
| 6 to 18 Years | 286 (60.2%) | 189 (39.8%) |
| 19 to 25 Years | 89 (89.0%) | 11 (11.0%) |
| 26 to 34 Years | 89 (46.8%) | 101 (53.2%) |
| 35 to 44 Years | 177 (61.0%) | 113 (39.0%) |
| 45 to 54 Years | 165 (95.4%) | 8 (4.6%) |
| 55 to 64 Years | 183 (99.5%) | 1 (0.5%) |
| 65 to 74 Years | 328 (100.0%) | 0 (0.0%) |
| 75 Years and older | 285 (100.0%) | 0 (0.0%) |
| Total | 1,723 (80.3%) | 423 (19.7%) |
Health Insurance Coverage by Citizenship Status in Deenwood
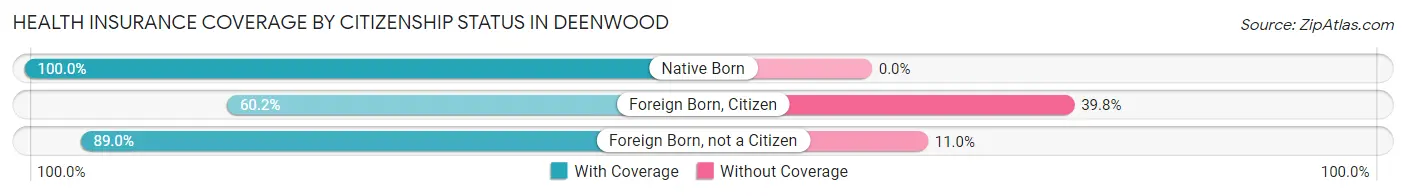
| Citizenship Status | With Coverage | Without Coverage |
| Native Born | 121 (100.0%) | 0 (0.0%) |
| Foreign Born, Citizen | 286 (60.2%) | 189 (39.8%) |
| Foreign Born, not a Citizen | 89 (89.0%) | 11 (11.0%) |
Health Insurance Coverage by Household Income in Deenwood
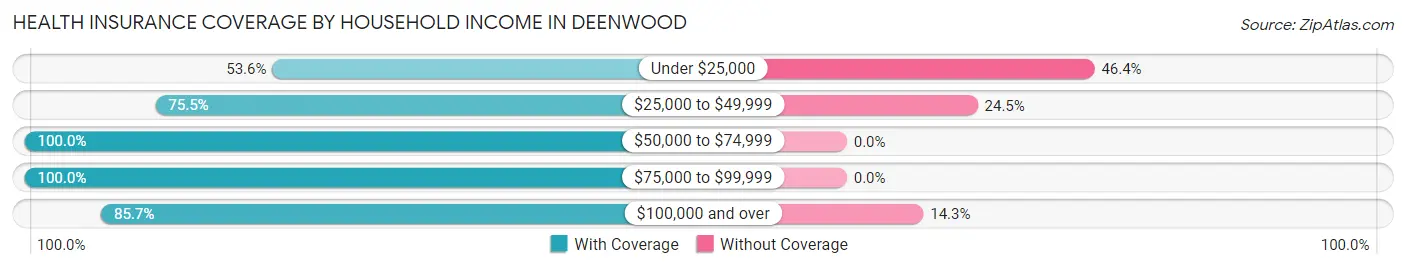
| Household Income | With Coverage | Without Coverage |
| Under $25,000 | 253 (53.6%) | 219 (46.4%) |
| $25,000 to $49,999 | 348 (75.5%) | 113 (24.5%) |
| $50,000 to $74,999 | 514 (100.0%) | 0 (0.0%) |
| $75,000 to $99,999 | 64 (100.0%) | 0 (0.0%) |
| $100,000 and over | 544 (85.7%) | 91 (14.3%) |
Public vs Private Health Insurance Coverage by Age in Deenwood
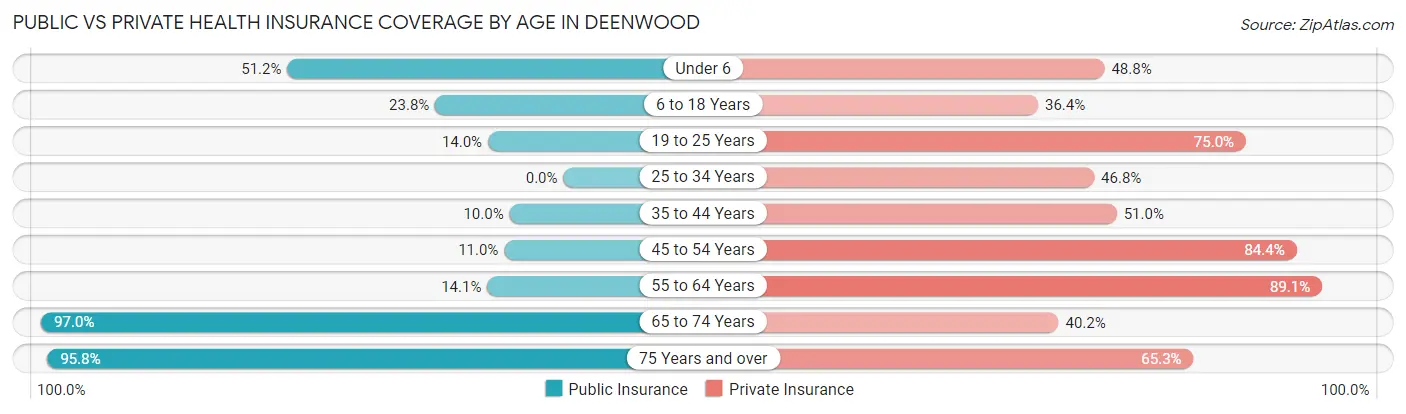
| Age Bracket | Public Insurance | Private Insurance |
| Under 6 | 62 (51.2%) | 59 (48.8%) |
| 6 to 18 Years | 113 (23.8%) | 173 (36.4%) |
| 19 to 25 Years | 14 (14.0%) | 75 (75.0%) |
| 25 to 34 Years | 0 (0.0%) | 89 (46.8%) |
| 35 to 44 Years | 29 (10.0%) | 148 (51.0%) |
| 45 to 54 Years | 19 (11.0%) | 146 (84.4%) |
| 55 to 64 Years | 26 (14.1%) | 164 (89.1%) |
| 65 to 74 Years | 318 (97.0%) | 132 (40.2%) |
| 75 Years and over | 273 (95.8%) | 186 (65.3%) |
| Total | 854 (39.8%) | 1,172 (54.6%) |
Disability Status by Sex by Age in Deenwood
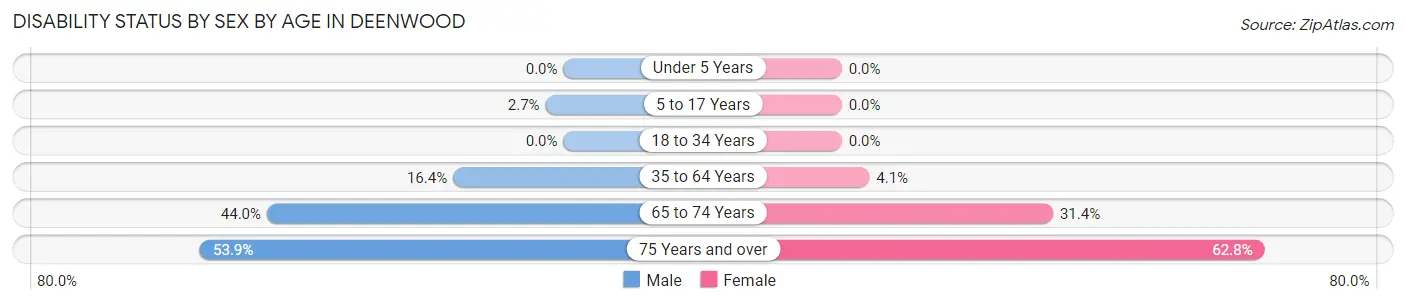
| Age Bracket | Male | Female |
| Under 5 Years | 0 (0.0%) | 0 (0.0%) |
| 5 to 17 Years | 5 (2.7%) | 0 (0.0%) |
| 18 to 34 Years | 0 (0.0%) | 0 (0.0%) |
| 35 to 64 Years | 50 (16.4%) | 14 (4.1%) |
| 65 to 74 Years | 70 (44.0%) | 53 (31.4%) |
| 75 Years and over | 48 (53.9%) | 123 (62.8%) |
Disability Class by Sex by Age in Deenwood
Disability Class: Hearing Difficulty
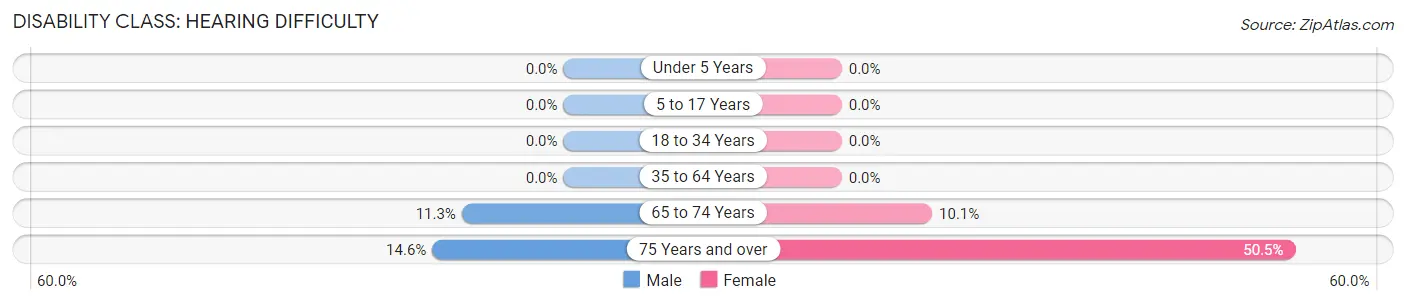
| Age Bracket | Male | Female |
| Under 5 Years | 0 (0.0%) | 0 (0.0%) |
| 5 to 17 Years | 0 (0.0%) | 0 (0.0%) |
| 18 to 34 Years | 0 (0.0%) | 0 (0.0%) |
| 35 to 64 Years | 0 (0.0%) | 0 (0.0%) |
| 65 to 74 Years | 18 (11.3%) | 17 (10.1%) |
| 75 Years and over | 13 (14.6%) | 99 (50.5%) |
Disability Class: Vision Difficulty
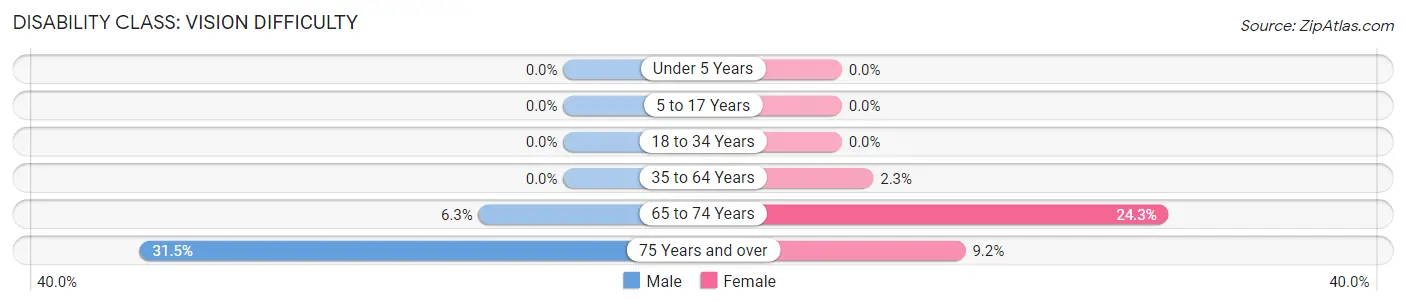
| Age Bracket | Male | Female |
| Under 5 Years | 0 (0.0%) | 0 (0.0%) |
| 5 to 17 Years | 0 (0.0%) | 0 (0.0%) |
| 18 to 34 Years | 0 (0.0%) | 0 (0.0%) |
| 35 to 64 Years | 0 (0.0%) | 8 (2.3%) |
| 65 to 74 Years | 10 (6.3%) | 41 (24.3%) |
| 75 Years and over | 28 (31.5%) | 18 (9.2%) |
Disability Class: Cognitive Difficulty
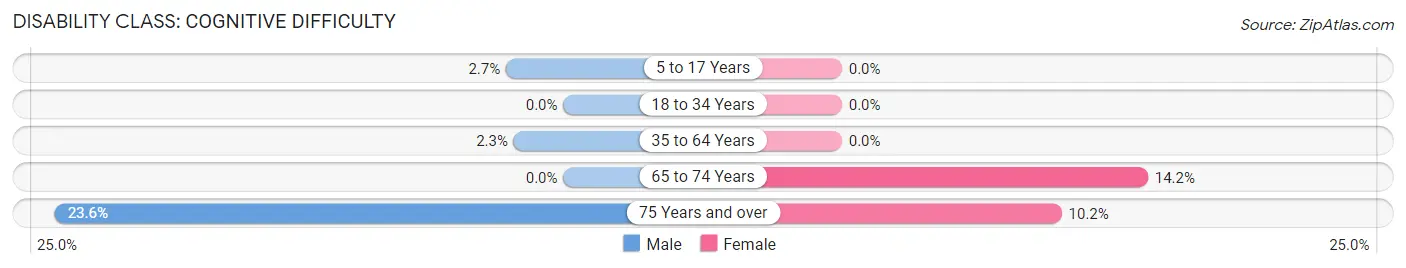
| Age Bracket | Male | Female |
| 5 to 17 Years | 5 (2.7%) | 0 (0.0%) |
| 18 to 34 Years | 0 (0.0%) | 0 (0.0%) |
| 35 to 64 Years | 7 (2.3%) | 0 (0.0%) |
| 65 to 74 Years | 0 (0.0%) | 24 (14.2%) |
| 75 Years and over | 21 (23.6%) | 20 (10.2%) |
Disability Class: Ambulatory Difficulty
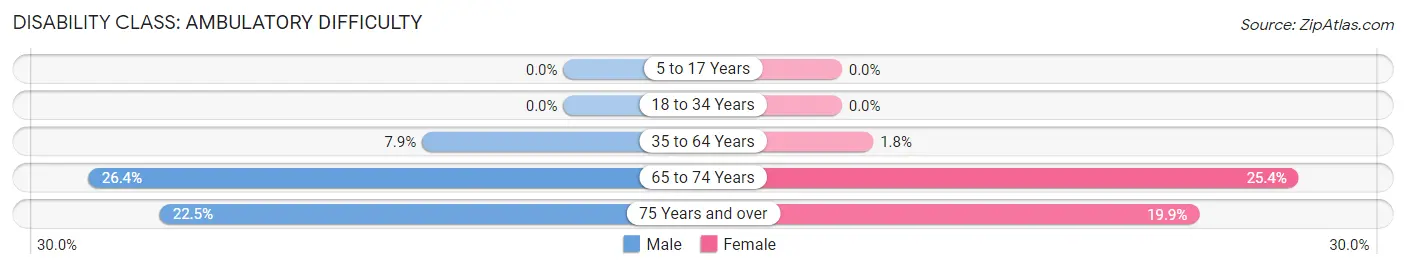
| Age Bracket | Male | Female |
| 5 to 17 Years | 0 (0.0%) | 0 (0.0%) |
| 18 to 34 Years | 0 (0.0%) | 0 (0.0%) |
| 35 to 64 Years | 24 (7.9%) | 6 (1.8%) |
| 65 to 74 Years | 42 (26.4%) | 43 (25.4%) |
| 75 Years and over | 20 (22.5%) | 39 (19.9%) |
Disability Class: Self-Care Difficulty
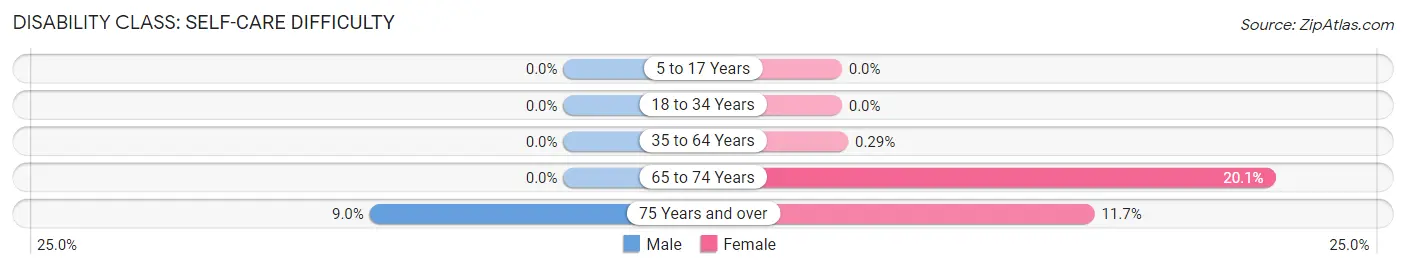
| Age Bracket | Male | Female |
| 5 to 17 Years | 0 (0.0%) | 0 (0.0%) |
| 18 to 34 Years | 0 (0.0%) | 0 (0.0%) |
| 35 to 64 Years | 0 (0.0%) | 1 (0.3%) |
| 65 to 74 Years | 0 (0.0%) | 34 (20.1%) |
| 75 Years and over | 8 (9.0%) | 23 (11.7%) |
Technology Access in Deenwood
Computing Device Access in Deenwood
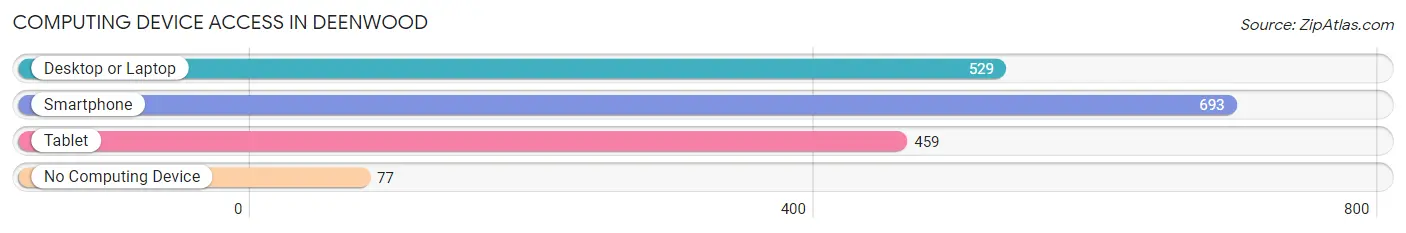
| Device Type | # Households | % Households |
| Desktop or Laptop | 529 | 64.3% |
| Smartphone | 693 | 84.2% |
| Tablet | 459 | 55.8% |
| No Computing Device | 77 | 9.4% |
| Total | 823 | 100.0% |
Internet Access in Deenwood
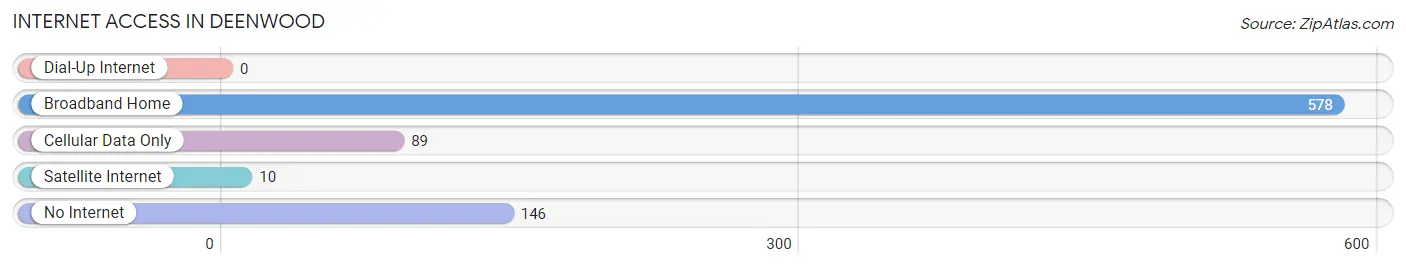
| Internet Type | # Households | % Households |
| Dial-Up Internet | 0 | 0.0% |
| Broadband Home | 578 | 70.2% |
| Cellular Data Only | 89 | 10.8% |
| Satellite Internet | 10 | 1.2% |
| No Internet | 146 | 17.7% |
| Total | 823 | 100.0% |
Deenwood Summary
Deenwood, Georgia is a small town located in the northwest corner of the state, near the Alabama border. It is part of the Chattahoochee National Forest and is home to a population of just over 1,000 people. The town is known for its rural charm and its proximity to the Appalachian Trail.
Geography
Deenwood is located in the northwest corner of Georgia, near the Alabama border. It is part of the Chattahoochee National Forest and is surrounded by the Chattahoochee River and the Appalachian Mountains. The town is situated at an elevation of 1,000 feet and has a total area of 1.2 square miles. The climate is humid subtropical, with hot summers and mild winters.
Economy
Deenwood’s economy is largely based on agriculture and forestry. The town is home to several small farms, as well as a sawmill and a lumber mill. The town also has a few small businesses, including a general store, a gas station, and a few restaurants.
Demographics
As of the 2010 census, Deenwood had a population of 1,072 people. The racial makeup of the town was 95.3% White, 1.2% African American, 0.3% Native American, 0.2% Asian, 0.1% Pacific Islander, and 2.9% from other races. The median household income was $30,000, and the median age was 40.
History
Deenwood was founded in 1820 by a group of settlers from North Carolina. The town was named after a local creek, which was named after a Native American chief. The town grew slowly over the years, and by the late 19th century, it had become a popular destination for hunters and fishermen. In the early 20th century, the town began to attract tourists, and it became a popular spot for camping and hiking.
Today, Deenwood is a small, rural town that is known for its rural charm and its proximity to the Appalachian Trail. The town is home to a few small businesses, and it is a popular destination for outdoor enthusiasts.
Common Questions
What is Per Capita Income in Deenwood?
Per Capita income in Deenwood is $29,240.
What is the Median Family Income in Deenwood?
Median Family Income in Deenwood is $56,910.
What is the Median Household income in Deenwood?
Median Household Income in Deenwood is $49,417.
What is Income or Wage Gap in Deenwood?
Income or Wage Gap in Deenwood is 22.6%.
Women in Deenwood earn 77.4 cents for every dollar earned by a man.
What is Inequality or Gini Index in Deenwood?
Inequality or Gini Index in Deenwood is 0.46.
What is the Total Population of Deenwood?
Total Population of Deenwood is 2,146.
What is the Total Male Population of Deenwood?
Total Male Population of Deenwood is 993.
What is the Total Female Population of Deenwood?
Total Female Population of Deenwood is 1,153.
What is the Ratio of Males per 100 Females in Deenwood?
There are 86.12 Males per 100 Females in Deenwood.
What is the Ratio of Females per 100 Males in Deenwood?
There are 116.11 Females per 100 Males in Deenwood.
What is the Median Population Age in Deenwood?
Median Population Age in Deenwood is 41.5 Years.
What is the Average Family Size in Deenwood
Average Family Size in Deenwood is 3.3 People.
What is the Average Household Size in Deenwood
Average Household Size in Deenwood is 2.6 People.
How Large is the Labor Force in Deenwood?
There are 753 People in the Labor Forcein in Deenwood.
What is the Percentage of People in the Labor Force in Deenwood?
43.6% of People are in the Labor Force in Deenwood.
What is the Unemployment Rate in Deenwood?
Unemployment Rate in Deenwood is 3.3%.