Peachtree Corners, GA Map & Demographics
Peachtree Corners Map
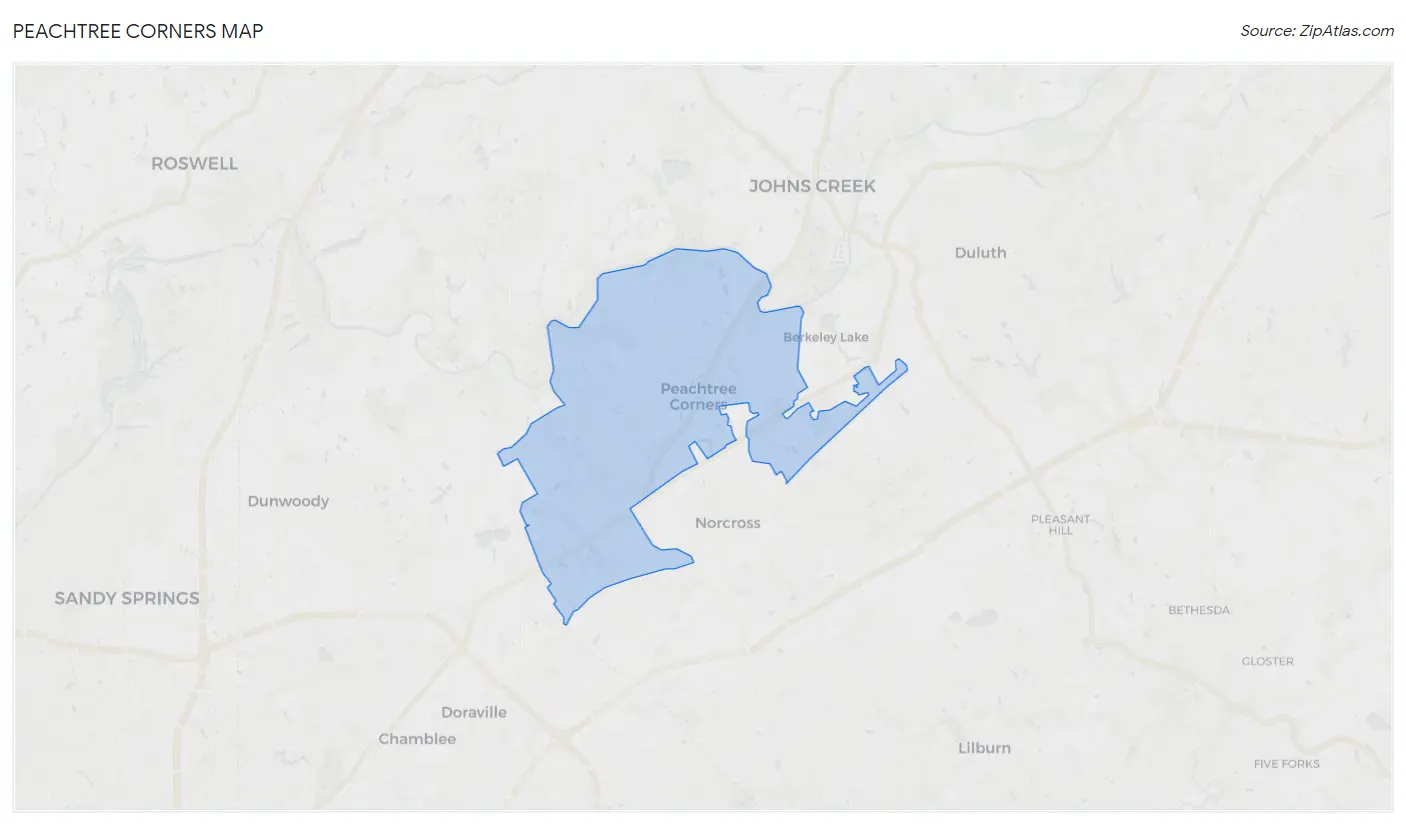
Peachtree Corners Overview
$48,523
PER CAPITA INCOME
$103,080
AVG FAMILY INCOME
$74,716
AVG HOUSEHOLD INCOME
25.9%
WAGE / INCOME GAP [ % ]
74.1¢/ $1
WAGE / INCOME GAP [ $ ]
$9,471
FAMILY INCOME DEFICIT
0.50
INEQUALITY / GINI INDEX
42,147
TOTAL POPULATION
20,575
MALE POPULATION
21,572
FEMALE POPULATION
95.38
MALES / 100 FEMALES
104.85
FEMALES / 100 MALES
35.5
MEDIAN AGE
3.1
AVG FAMILY SIZE
2.5
AVG HOUSEHOLD SIZE
23,275
LABOR FORCE [ PEOPLE ]
69.4%
PERCENT IN LABOR FORCE
3.3%
UNEMPLOYMENT RATE
Peachtree Corners Zip Codes
Income in Peachtree Corners
Income Overview in Peachtree Corners
Per Capita Income in Peachtree Corners is $48,523, while median incomes of families and households are $103,080 and $74,716 respectively.
| Characteristic | Number | Measure |
| Per Capita Income | 42,147 | $48,523 |
| Median Family Income | 11,184 | $103,080 |
| Mean Family Income | 11,184 | $147,507 |
| Median Household Income | 17,231 | $74,716 |
| Mean Household Income | 17,231 | $116,975 |
| Income Deficit | 11,184 | $9,471 |
| Wage / Income Gap (%) | 42,147 | 25.88% |
| Wage / Income Gap ($) | 42,147 | 74.12¢ per $1 |
| Gini / Inequality Index | 42,147 | 0.50 |
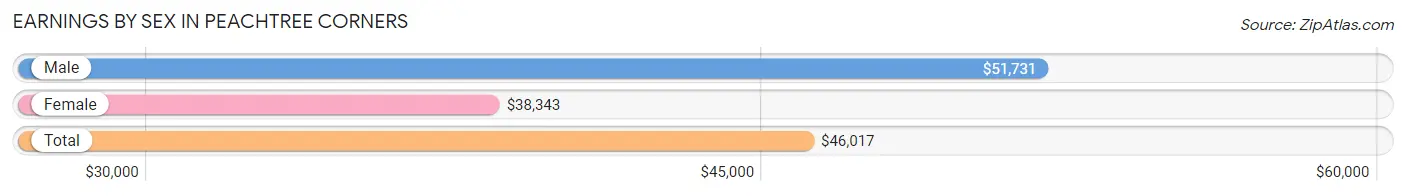
Earnings by Sex in Peachtree Corners
Average Earnings in Peachtree Corners are $46,017, $51,731 for men and $38,343 for women, a difference of 25.9%.
| Sex | Number | Average Earnings |
| Male | 12,929 (52.8%) | $51,731 |
| Female | 11,566 (47.2%) | $38,343 |
| Total | 24,495 (100.0%) | $46,017 |
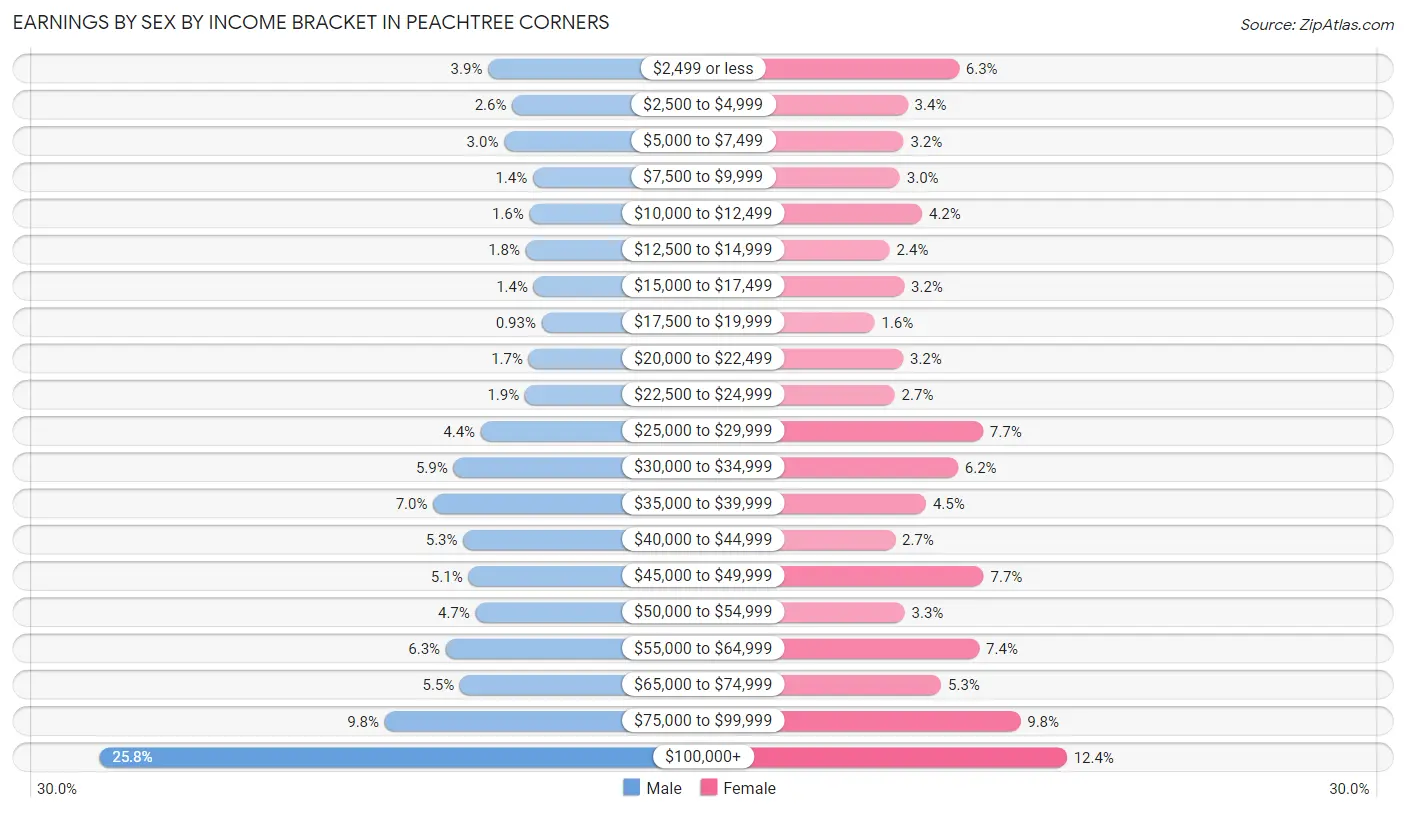
Earnings by Sex by Income Bracket in Peachtree Corners
The most common earnings brackets in Peachtree Corners are $100,000+ for men (3,336 | 25.8%) and $100,000+ for women (1,430 | 12.4%).
| Income | Male | Female |
| $2,499 or less | 509 (3.9%) | 729 (6.3%) |
| $2,500 to $4,999 | 335 (2.6%) | 395 (3.4%) |
| $5,000 to $7,499 | 393 (3.0%) | 369 (3.2%) |
| $7,500 to $9,999 | 183 (1.4%) | 345 (3.0%) |
| $10,000 to $12,499 | 210 (1.6%) | 489 (4.2%) |
| $12,500 to $14,999 | 236 (1.8%) | 279 (2.4%) |
| $15,000 to $17,499 | 179 (1.4%) | 372 (3.2%) |
| $17,500 to $19,999 | 120 (0.9%) | 180 (1.6%) |
| $20,000 to $22,499 | 215 (1.7%) | 365 (3.2%) |
| $22,500 to $24,999 | 242 (1.9%) | 311 (2.7%) |
| $25,000 to $29,999 | 563 (4.3%) | 885 (7.6%) |
| $30,000 to $34,999 | 762 (5.9%) | 722 (6.2%) |
| $35,000 to $39,999 | 909 (7.0%) | 515 (4.4%) |
| $40,000 to $44,999 | 691 (5.3%) | 313 (2.7%) |
| $45,000 to $49,999 | 653 (5.1%) | 889 (7.7%) |
| $50,000 to $54,999 | 601 (4.6%) | 376 (3.3%) |
| $55,000 to $64,999 | 817 (6.3%) | 861 (7.4%) |
| $65,000 to $74,999 | 714 (5.5%) | 613 (5.3%) |
| $75,000 to $99,999 | 1,261 (9.8%) | 1,128 (9.8%) |
| $100,000+ | 3,336 (25.8%) | 1,430 (12.4%) |
| Total | 12,929 (100.0%) | 11,566 (100.0%) |
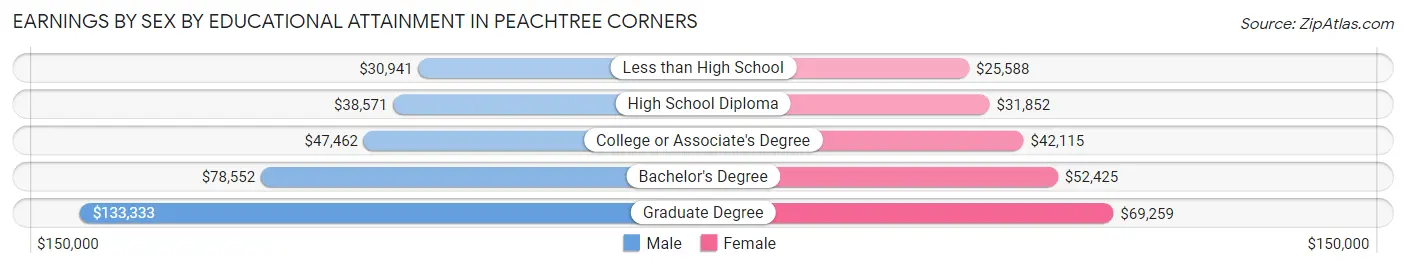
Earnings by Sex by Educational Attainment in Peachtree Corners
Average earnings in Peachtree Corners are $63,502 for men and $46,469 for women, a difference of 26.8%. Men with an educational attainment of graduate degree enjoy the highest average annual earnings of $133,333, while those with less than high school education earn the least with $30,941. Women with an educational attainment of graduate degree earn the most with the average annual earnings of $69,259, while those with less than high school education have the smallest earnings of $25,588.
| Educational Attainment | Male Income | Female Income |
| Less than High School | $30,941 | $25,588 |
| High School Diploma | $38,571 | $31,852 |
| College or Associate's Degree | $47,462 | $42,115 |
| Bachelor's Degree | $78,552 | $52,425 |
| Graduate Degree | $133,333 | $69,259 |
| Total | $63,502 | $46,469 |
Family Income in Peachtree Corners
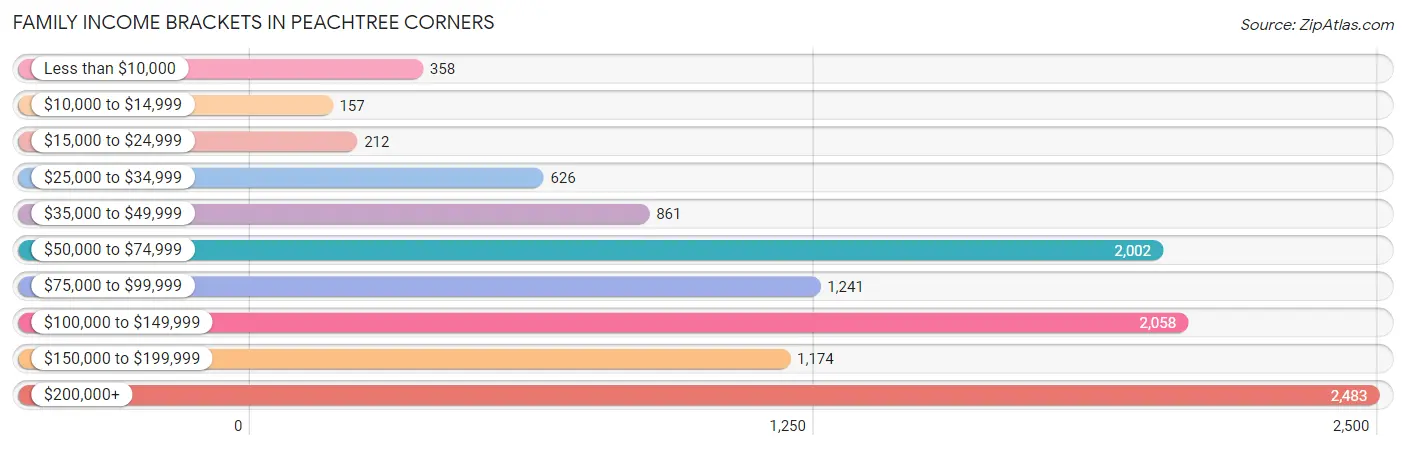
Family Income Brackets in Peachtree Corners
According to the Peachtree Corners family income data, there are 2,483 families falling into the $200,000+ income range, which is the most common income bracket and makes up 22.2% of all families. Conversely, the $10,000 to $14,999 income bracket is the least frequent group with only 157 families (1.4%) belonging to this category.
| Income Bracket | # Families | % Families |
| Less than $10,000 | 358 | 3.2% |
| $10,000 to $14,999 | 157 | 1.4% |
| $15,000 to $24,999 | 212 | 1.9% |
| $25,000 to $34,999 | 626 | 5.6% |
| $35,000 to $49,999 | 861 | 7.7% |
| $50,000 to $74,999 | 2,002 | 17.9% |
| $75,000 to $99,999 | 1,241 | 11.1% |
| $100,000 to $149,999 | 2,058 | 18.4% |
| $150,000 to $199,999 | 1,174 | 10.5% |
| $200,000+ | 2,483 | 22.2% |
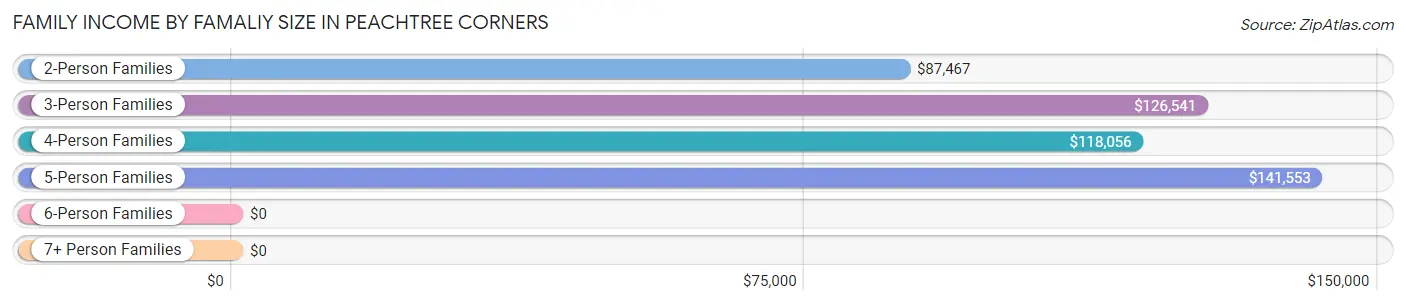
Family Income by Famaliy Size in Peachtree Corners
5-person families (697 | 6.2%) account for the highest median family income in Peachtree Corners with $141,553 per family, while 2-person families (5,429 | 48.5%) have the highest median income of $43,734 per family member.
| Income Bracket | # Families | Median Income |
| 2-Person Families | 5,429 (48.5%) | $87,467 |
| 3-Person Families | 2,229 (19.9%) | $126,541 |
| 4-Person Families | 2,214 (19.8%) | $118,056 |
| 5-Person Families | 697 (6.2%) | $141,553 |
| 6-Person Families | 522 (4.7%) | $0 |
| 7+ Person Families | 93 (0.8%) | $0 |
| Total | 11,184 (100.0%) | $103,080 |
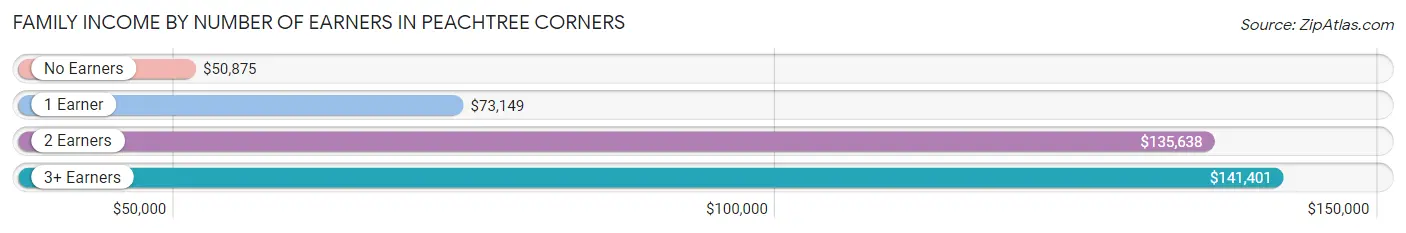
Family Income by Number of Earners in Peachtree Corners
The median family income in Peachtree Corners is $103,080, with families comprising 3+ earners (1,318) having the highest median family income of $141,401, while families with no earners (1,178) have the lowest median family income of $50,875, accounting for 11.8% and 10.5% of families, respectively.
| Number of Earners | # Families | Median Income |
| No Earners | 1,178 (10.5%) | $50,875 |
| 1 Earner | 3,738 (33.4%) | $73,149 |
| 2 Earners | 4,950 (44.3%) | $135,638 |
| 3+ Earners | 1,318 (11.8%) | $141,401 |
| Total | 11,184 (100.0%) | $103,080 |
Household Income in Peachtree Corners
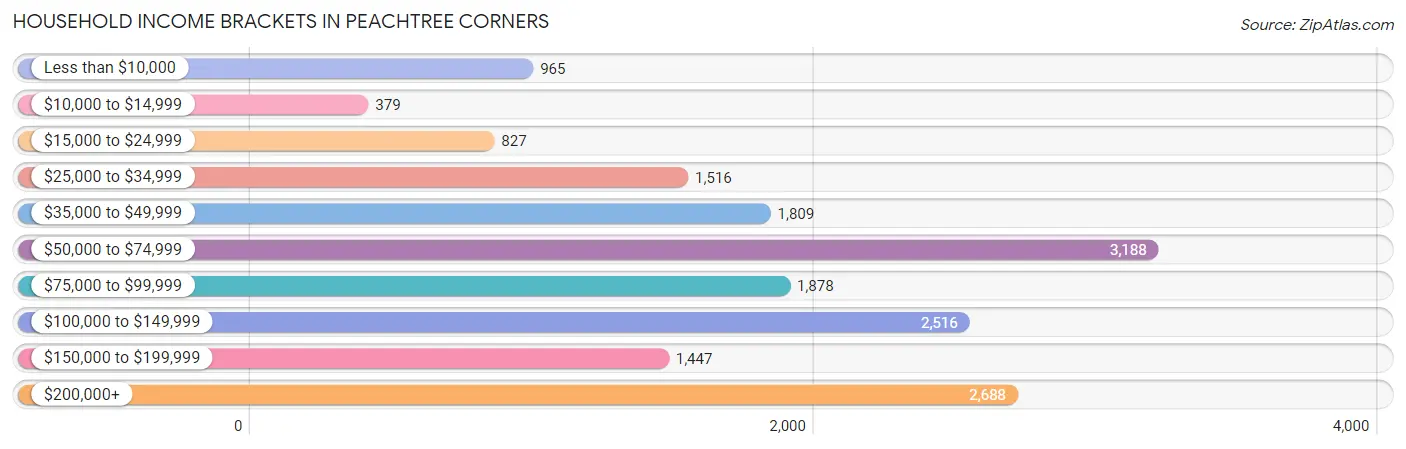
Household Income Brackets in Peachtree Corners
With 3,188 households falling in the category, the $50,000 to $74,999 income range is the most frequent in Peachtree Corners, accounting for 18.5% of all households. In contrast, only 379 households (2.2%) fall into the $10,000 to $14,999 income bracket, making it the least populous group.
| Income Bracket | # Households | % Households |
| Less than $10,000 | 965 | 5.6% |
| $10,000 to $14,999 | 379 | 2.2% |
| $15,000 to $24,999 | 827 | 4.8% |
| $25,000 to $34,999 | 1,516 | 8.8% |
| $35,000 to $49,999 | 1,809 | 10.5% |
| $50,000 to $74,999 | 3,188 | 18.5% |
| $75,000 to $99,999 | 1,878 | 10.9% |
| $100,000 to $149,999 | 2,516 | 14.6% |
| $150,000 to $199,999 | 1,447 | 8.4% |
| $200,000+ | 2,688 | 15.6% |
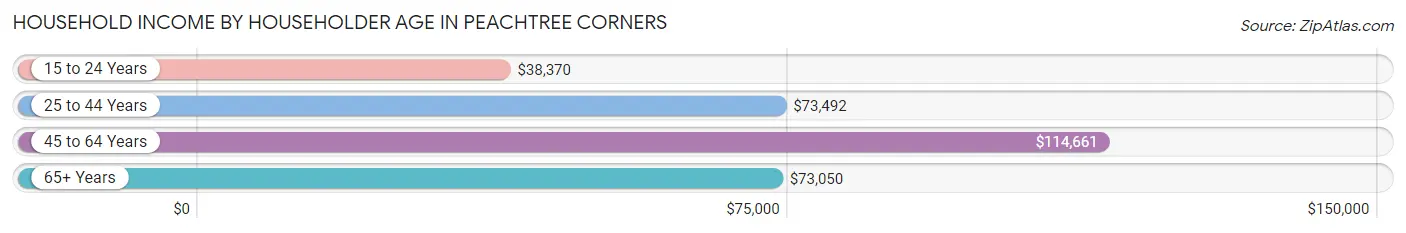
Household Income by Householder Age in Peachtree Corners
The median household income in Peachtree Corners is $74,716, with the highest median household income of $114,661 found in the 45 to 64 years age bracket for the primary householder. A total of 5,704 households (33.1%) fall into this category. Meanwhile, the 15 to 24 years age bracket for the primary householder has the lowest median household income of $38,370, with 1,244 households (7.2%) in this group.
| Income Bracket | # Households | Median Income |
| 15 to 24 Years | 1,244 (7.2%) | $38,370 |
| 25 to 44 Years | 6,889 (40.0%) | $73,492 |
| 45 to 64 Years | 5,704 (33.1%) | $114,661 |
| 65+ Years | 3,394 (19.7%) | $73,050 |
| Total | 17,231 (100.0%) | $74,716 |
Poverty in Peachtree Corners
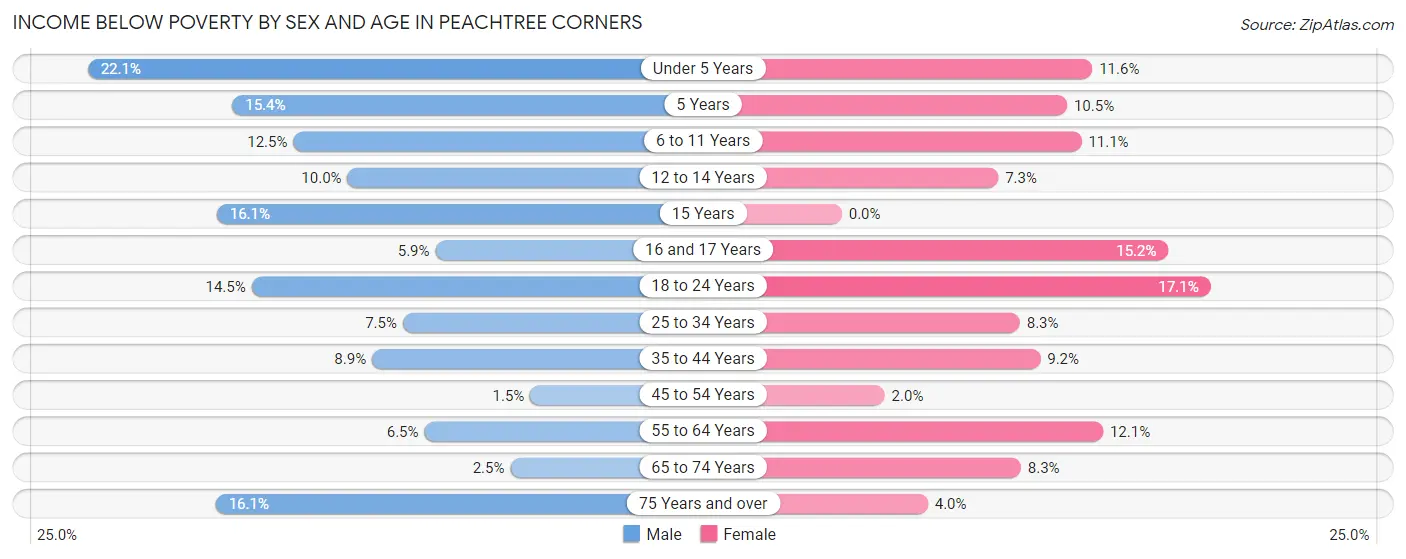
Income Below Poverty by Sex and Age in Peachtree Corners
With 9.1% poverty level for males and 9.2% for females among the residents of Peachtree Corners, under 5 year old males and 18 to 24 year old females are the most vulnerable to poverty, with 273 males (22.1%) and 357 females (17.1%) in their respective age groups living below the poverty level.
| Age Bracket | Male | Female |
| Under 5 Years | 273 (22.1%) | 174 (11.6%) |
| 5 Years | 53 (15.4%) | 21 (10.4%) |
| 6 to 11 Years | 186 (12.5%) | 184 (11.1%) |
| 12 to 14 Years | 93 (10.0%) | 63 (7.3%) |
| 15 Years | 32 (16.1%) | 0 (0.0%) |
| 16 and 17 Years | 32 (5.9%) | 73 (15.1%) |
| 18 to 24 Years | 310 (14.5%) | 357 (17.1%) |
| 25 to 34 Years | 257 (7.4%) | 292 (8.3%) |
| 35 to 44 Years | 266 (8.9%) | 242 (9.2%) |
| 45 to 54 Years | 33 (1.5%) | 56 (2.0%) |
| 55 to 64 Years | 180 (6.5%) | 297 (12.1%) |
| 65 to 74 Years | 39 (2.5%) | 200 (8.3%) |
| 75 Years and over | 120 (16.1%) | 30 (4.0%) |
| Total | 1,874 (9.1%) | 1,989 (9.2%) |
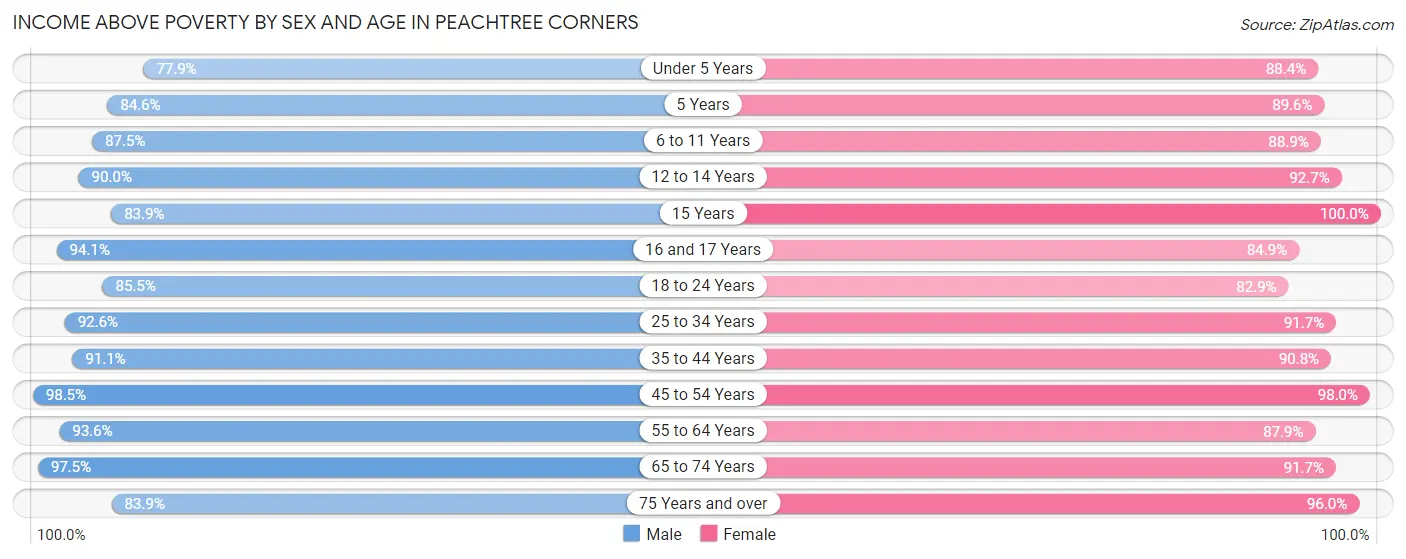
Income Above Poverty by Sex and Age in Peachtree Corners
According to the poverty statistics in Peachtree Corners, males aged 45 to 54 years and females aged 15 years are the age groups that are most secure financially, with 98.5% of males and 100.0% of females in these age groups living above the poverty line.
| Age Bracket | Male | Female |
| Under 5 Years | 964 (77.9%) | 1,323 (88.4%) |
| 5 Years | 292 (84.6%) | 180 (89.5%) |
| 6 to 11 Years | 1,298 (87.5%) | 1,471 (88.9%) |
| 12 to 14 Years | 835 (90.0%) | 805 (92.7%) |
| 15 Years | 167 (83.9%) | 188 (100.0%) |
| 16 and 17 Years | 507 (94.1%) | 409 (84.9%) |
| 18 to 24 Years | 1,833 (85.5%) | 1,730 (82.9%) |
| 25 to 34 Years | 3,193 (92.5%) | 3,243 (91.7%) |
| 35 to 44 Years | 2,728 (91.1%) | 2,387 (90.8%) |
| 45 to 54 Years | 2,105 (98.5%) | 2,756 (98.0%) |
| 55 to 64 Years | 2,611 (93.5%) | 2,154 (87.9%) |
| 65 to 74 Years | 1,544 (97.5%) | 2,208 (91.7%) |
| 75 Years and over | 624 (83.9%) | 722 (96.0%) |
| Total | 18,701 (90.9%) | 19,576 (90.8%) |
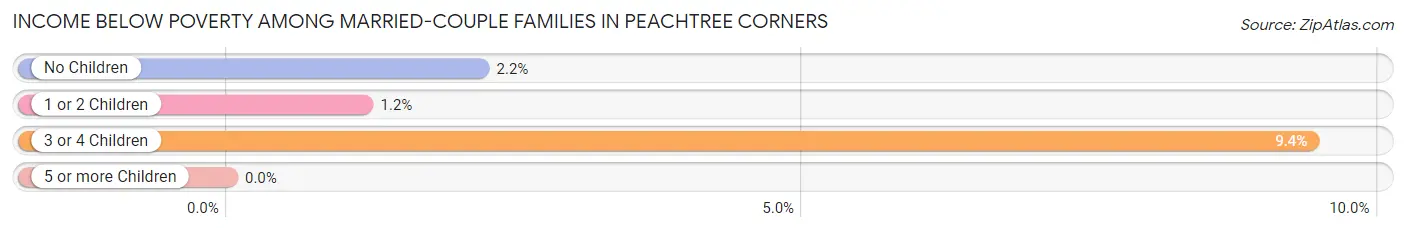
Income Below Poverty Among Married-Couple Families in Peachtree Corners
The poverty statistics for married-couple families in Peachtree Corners show that 2.6% or 207 of the total 8,047 families live below the poverty line. Families with 3 or 4 children have the highest poverty rate of 9.4%, comprising of 75 families. On the other hand, families with 5 or more children have the lowest poverty rate of 0.0%, which includes 0 families.
| Children | Above Poverty | Below Poverty |
| No Children | 4,514 (97.8%) | 101 (2.2%) |
| 1 or 2 Children | 2,593 (98.8%) | 31 (1.2%) |
| 3 or 4 Children | 722 (90.6%) | 75 (9.4%) |
| 5 or more Children | 11 (100.0%) | 0 (0.0%) |
| Total | 7,840 (97.4%) | 207 (2.6%) |
Income Below Poverty Among Single-Parent Households in Peachtree Corners
According to the poverty data in Peachtree Corners, 13.1% or 100 single-father households and 22.3% or 529 single-mother households are living below the poverty line. Among single-father households, those with 1 or 2 children have the highest poverty rate, with 75 households (15.7%) experiencing poverty. Likewise, among single-mother households, those with 3 or 4 children have the highest poverty rate, with 27 households (69.2%) falling below the poverty line.
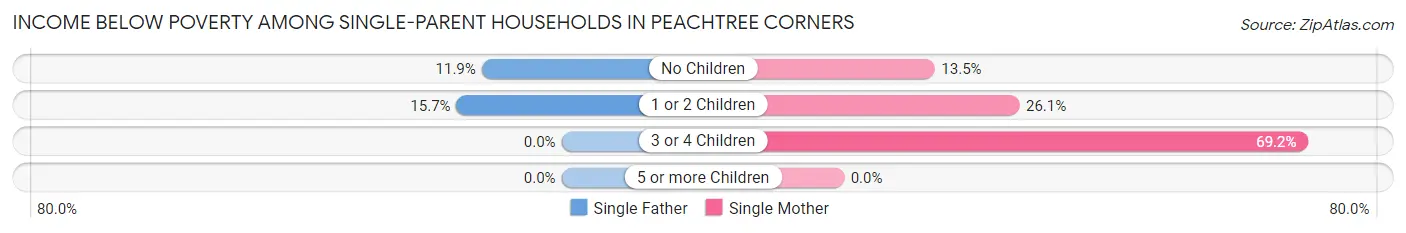
| Children | Single Father | Single Mother |
| No Children | 25 (11.9%) | 116 (13.5%) |
| 1 or 2 Children | 75 (15.7%) | 386 (26.1%) |
| 3 or 4 Children | 0 (0.0%) | 27 (69.2%) |
| 5 or more Children | 0 (0.0%) | 0 (0.0%) |
| Total | 100 (13.1%) | 529 (22.3%) |
Income Below Poverty Among Married-Couple vs Single-Parent Households in Peachtree Corners
The poverty data for Peachtree Corners shows that 207 of the married-couple family households (2.6%) and 629 of the single-parent households (20.1%) are living below the poverty level. Within the married-couple family households, those with 3 or 4 children have the highest poverty rate, with 75 households (9.4%) falling below the poverty line. Among the single-parent households, those with 3 or 4 children have the highest poverty rate, with 27 household (23.9%) living below poverty.
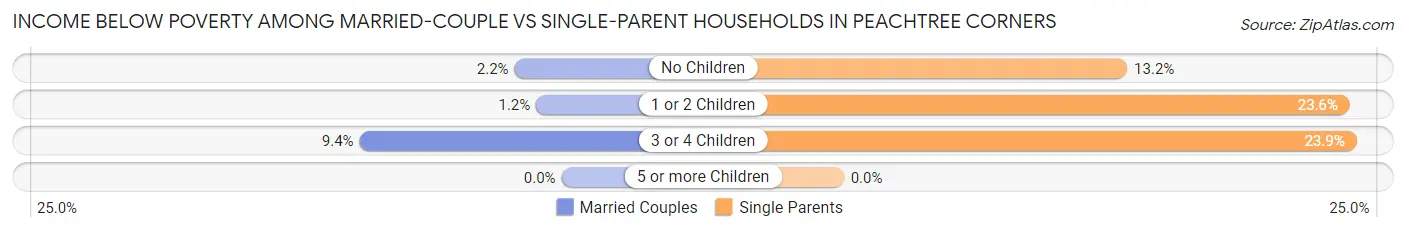
| Children | Married-Couple Families | Single-Parent Households |
| No Children | 101 (2.2%) | 141 (13.2%) |
| 1 or 2 Children | 31 (1.2%) | 461 (23.6%) |
| 3 or 4 Children | 75 (9.4%) | 27 (23.9%) |
| 5 or more Children | 0 (0.0%) | 0 (0.0%) |
| Total | 207 (2.6%) | 629 (20.1%) |
Race in Peachtree Corners
The most populous races in Peachtree Corners are White / Caucasian (20,889 | 49.6%), Black / African American (10,253 | 24.3%), and Hispanic or Latino (6,982 | 16.6%).
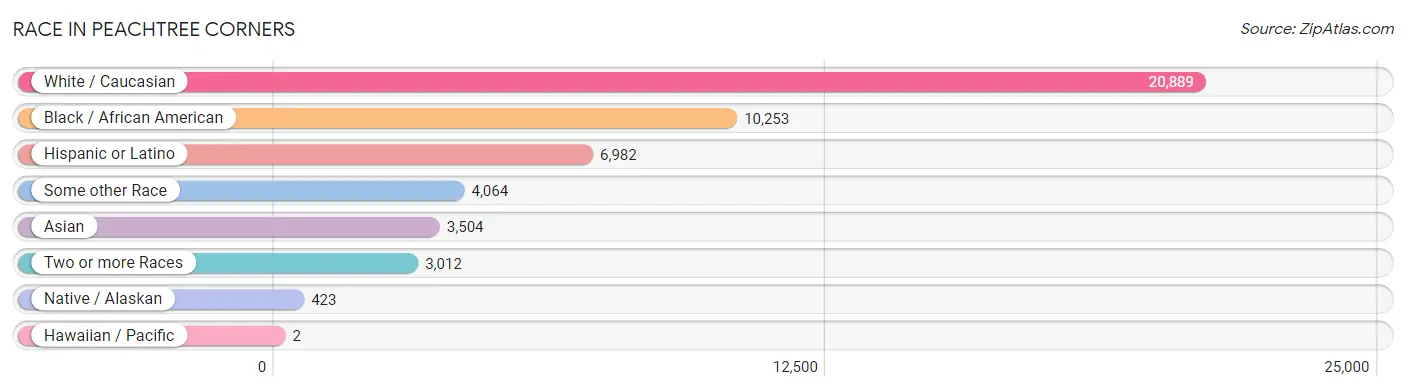
| Race | # Population | % Population |
| Asian | 3,504 | 8.3% |
| Black / African American | 10,253 | 24.3% |
| Hawaiian / Pacific | 2 | 0.0% |
| Hispanic or Latino | 6,982 | 16.6% |
| Native / Alaskan | 423 | 1.0% |
| White / Caucasian | 20,889 | 49.6% |
| Two or more Races | 3,012 | 7.1% |
| Some other Race | 4,064 | 9.6% |
| Total | 42,147 | 100.0% |
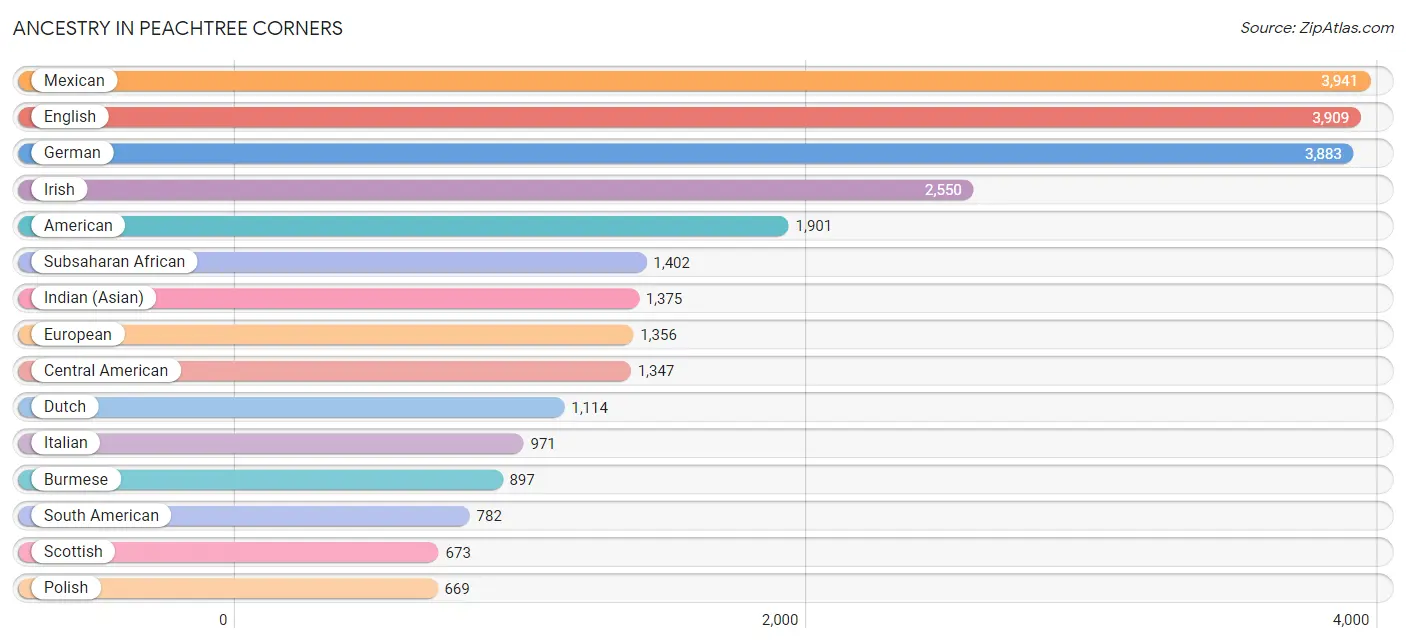
Ancestry in Peachtree Corners
The most populous ancestries reported in Peachtree Corners are Mexican (3,941 | 9.3%), English (3,909 | 9.3%), German (3,883 | 9.2%), Irish (2,550 | 6.0%), and American (1,901 | 4.5%), together accounting for 38.4% of all Peachtree Corners residents.
| Ancestry | # Population | % Population |
| African | 395 | 0.9% |
| American | 1,901 | 4.5% |
| Apache | 53 | 0.1% |
| Arab | 411 | 1.0% |
| Armenian | 15 | 0.0% |
| Austrian | 30 | 0.1% |
| Bangladeshi | 57 | 0.1% |
| Barbadian | 52 | 0.1% |
| Bermudan | 37 | 0.1% |
| Bhutanese | 151 | 0.4% |
| Blackfeet | 58 | 0.1% |
| British | 286 | 0.7% |
| British West Indian | 62 | 0.2% |
| Burmese | 897 | 2.1% |
| Cajun | 9 | 0.0% |
| Canadian | 94 | 0.2% |
| Cape Verdean | 32 | 0.1% |
| Central American | 1,347 | 3.2% |
| Central American Indian | 30 | 0.1% |
| Cherokee | 83 | 0.2% |
| Chilean | 1 | 0.0% |
| Chippewa | 7 | 0.0% |
| Colombian | 152 | 0.4% |
| Costa Rican | 178 | 0.4% |
| Croatian | 8 | 0.0% |
| Cuban | 131 | 0.3% |
| Czech | 136 | 0.3% |
| Czechoslovakian | 8 | 0.0% |
| Danish | 64 | 0.2% |
| Dominican | 135 | 0.3% |
| Dutch | 1,114 | 2.6% |
| Eastern European | 256 | 0.6% |
| Ecuadorian | 245 | 0.6% |
| Egyptian | 18 | 0.0% |
| English | 3,909 | 9.3% |
| Estonian | 15 | 0.0% |
| Ethiopian | 138 | 0.3% |
| European | 1,356 | 3.2% |
| Filipino | 36 | 0.1% |
| Finnish | 58 | 0.1% |
| French | 529 | 1.3% |
| French Canadian | 36 | 0.1% |
| German | 3,883 | 9.2% |
| Ghanaian | 158 | 0.4% |
| Greek | 166 | 0.4% |
| Guamanian / Chamorro | 2 | 0.0% |
| Guatemalan | 431 | 1.0% |
| Guyanese | 96 | 0.2% |
| Haitian | 230 | 0.5% |
| Honduran | 411 | 1.0% |
| Hungarian | 98 | 0.2% |
| Indian (Asian) | 1,375 | 3.3% |
| Iranian | 115 | 0.3% |
| Iraqi | 60 | 0.1% |
| Irish | 2,550 | 6.0% |
| Israeli | 120 | 0.3% |
| Italian | 971 | 2.3% |
| Jamaican | 531 | 1.3% |
| Japanese | 22 | 0.1% |
| Jordanian | 60 | 0.1% |
| Korean | 182 | 0.4% |
| Latvian | 8 | 0.0% |
| Lebanese | 90 | 0.2% |
| Liberian | 16 | 0.0% |
| Lithuanian | 41 | 0.1% |
| Maltese | 10 | 0.0% |
| Mexican | 3,941 | 9.3% |
| Mexican American Indian | 204 | 0.5% |
| Moroccan | 105 | 0.3% |
| Nigerian | 585 | 1.4% |
| Northern European | 52 | 0.1% |
| Norwegian | 171 | 0.4% |
| Pakistani | 53 | 0.1% |
| Peruvian | 63 | 0.2% |
| Polish | 669 | 1.6% |
| Portuguese | 26 | 0.1% |
| Puerto Rican | 377 | 0.9% |
| Romanian | 27 | 0.1% |
| Russian | 423 | 1.0% |
| Salvadoran | 327 | 0.8% |
| Scandinavian | 101 | 0.2% |
| Scotch-Irish | 462 | 1.1% |
| Scottish | 673 | 1.6% |
| Sierra Leonean | 31 | 0.1% |
| Sioux | 1 | 0.0% |
| Slovak | 29 | 0.1% |
| Slovene | 25 | 0.1% |
| South African | 29 | 0.1% |
| South American | 782 | 1.9% |
| Spaniard | 53 | 0.1% |
| Spanish | 25 | 0.1% |
| Sri Lankan | 373 | 0.9% |
| Subsaharan African | 1,402 | 3.3% |
| Swedish | 135 | 0.3% |
| Swiss | 50 | 0.1% |
| Syrian | 66 | 0.2% |
| Thai | 646 | 1.5% |
| Trinidadian and Tobagonian | 24 | 0.1% |
| Turkish | 8 | 0.0% |
| Ukrainian | 79 | 0.2% |
| Uruguayan | 42 | 0.1% |
| Venezuelan | 279 | 0.7% |
| Vietnamese | 72 | 0.2% |
| Welsh | 129 | 0.3% |
| West Indian | 39 | 0.1% | View All 105 Rows |
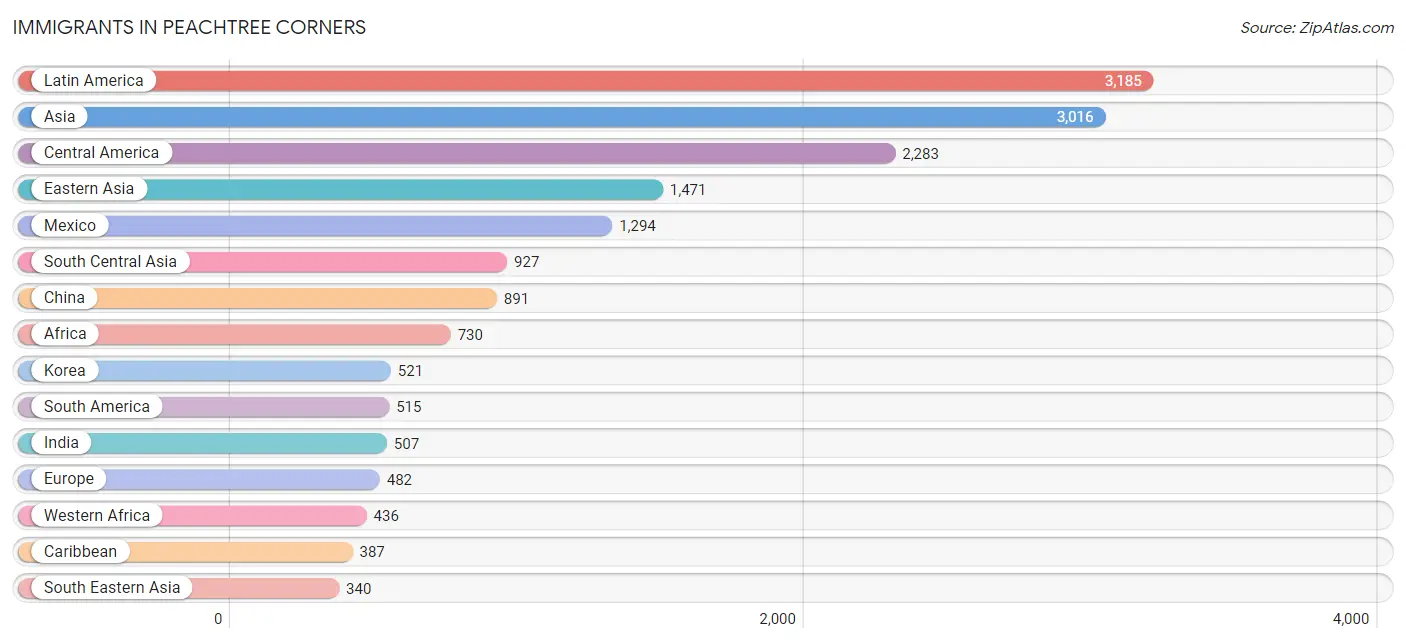
Immigrants in Peachtree Corners
The most numerous immigrant groups reported in Peachtree Corners came from Latin America (3,185 | 7.6%), Asia (3,016 | 7.2%), Central America (2,283 | 5.4%), Eastern Asia (1,471 | 3.5%), and Mexico (1,294 | 3.1%), together accounting for 26.7% of all Peachtree Corners residents.
| Immigration Origin | # Population | % Population |
| Africa | 730 | 1.7% |
| Asia | 3,016 | 7.2% |
| Australia | 14 | 0.0% |
| Bangladesh | 88 | 0.2% |
| Belarus | 25 | 0.1% |
| Cambodia | 10 | 0.0% |
| Canada | 272 | 0.6% |
| Caribbean | 387 | 0.9% |
| Central America | 2,283 | 5.4% |
| China | 891 | 2.1% |
| Colombia | 83 | 0.2% |
| Costa Rica | 178 | 0.4% |
| Cuba | 36 | 0.1% |
| Czechoslovakia | 35 | 0.1% |
| Dominican Republic | 90 | 0.2% |
| Eastern Africa | 153 | 0.4% |
| Eastern Asia | 1,471 | 3.5% |
| Eastern Europe | 191 | 0.4% |
| Ecuador | 104 | 0.3% |
| Egypt | 18 | 0.0% |
| El Salvador | 234 | 0.6% |
| England | 21 | 0.1% |
| Eritrea | 24 | 0.1% |
| Ethiopia | 58 | 0.1% |
| Europe | 482 | 1.1% |
| France | 35 | 0.1% |
| Germany | 59 | 0.1% |
| Ghana | 81 | 0.2% |
| Greece | 15 | 0.0% |
| Guatemala | 277 | 0.7% |
| Guyana | 45 | 0.1% |
| Honduras | 300 | 0.7% |
| Hong Kong | 26 | 0.1% |
| Hungary | 6 | 0.0% |
| India | 507 | 1.2% |
| Indonesia | 9 | 0.0% |
| Iran | 122 | 0.3% |
| Iraq | 60 | 0.1% |
| Israel | 114 | 0.3% |
| Italy | 7 | 0.0% |
| Jamaica | 221 | 0.5% |
| Japan | 59 | 0.1% |
| Jordan | 30 | 0.1% |
| Korea | 521 | 1.2% |
| Laos | 39 | 0.1% |
| Latin America | 3,185 | 7.6% |
| Lebanon | 19 | 0.1% |
| Lithuania | 11 | 0.0% |
| Mexico | 1,294 | 3.1% |
| Morocco | 32 | 0.1% |
| Netherlands | 10 | 0.0% |
| Nigeria | 269 | 0.6% |
| Northern Africa | 50 | 0.1% |
| Northern Europe | 154 | 0.4% |
| Oceania | 14 | 0.0% |
| Pakistan | 121 | 0.3% |
| Peru | 73 | 0.2% |
| Philippines | 59 | 0.1% |
| Portugal | 11 | 0.0% |
| Romania | 7 | 0.0% |
| Russia | 92 | 0.2% |
| South Africa | 91 | 0.2% |
| South America | 515 | 1.2% |
| South Central Asia | 927 | 2.2% |
| South Eastern Asia | 340 | 0.8% |
| Southern Europe | 33 | 0.1% |
| Sri Lanka | 10 | 0.0% |
| Sweden | 7 | 0.0% |
| Syria | 42 | 0.1% |
| Taiwan | 258 | 0.6% |
| Thailand | 29 | 0.1% |
| Trinidad and Tobago | 22 | 0.1% |
| Uzbekistan | 79 | 0.2% |
| Venezuela | 210 | 0.5% |
| Vietnam | 194 | 0.5% |
| Western Africa | 436 | 1.0% |
| Western Asia | 278 | 0.7% |
| Western Europe | 104 | 0.3% |
| Zimbabwe | 71 | 0.2% | View All 79 Rows |
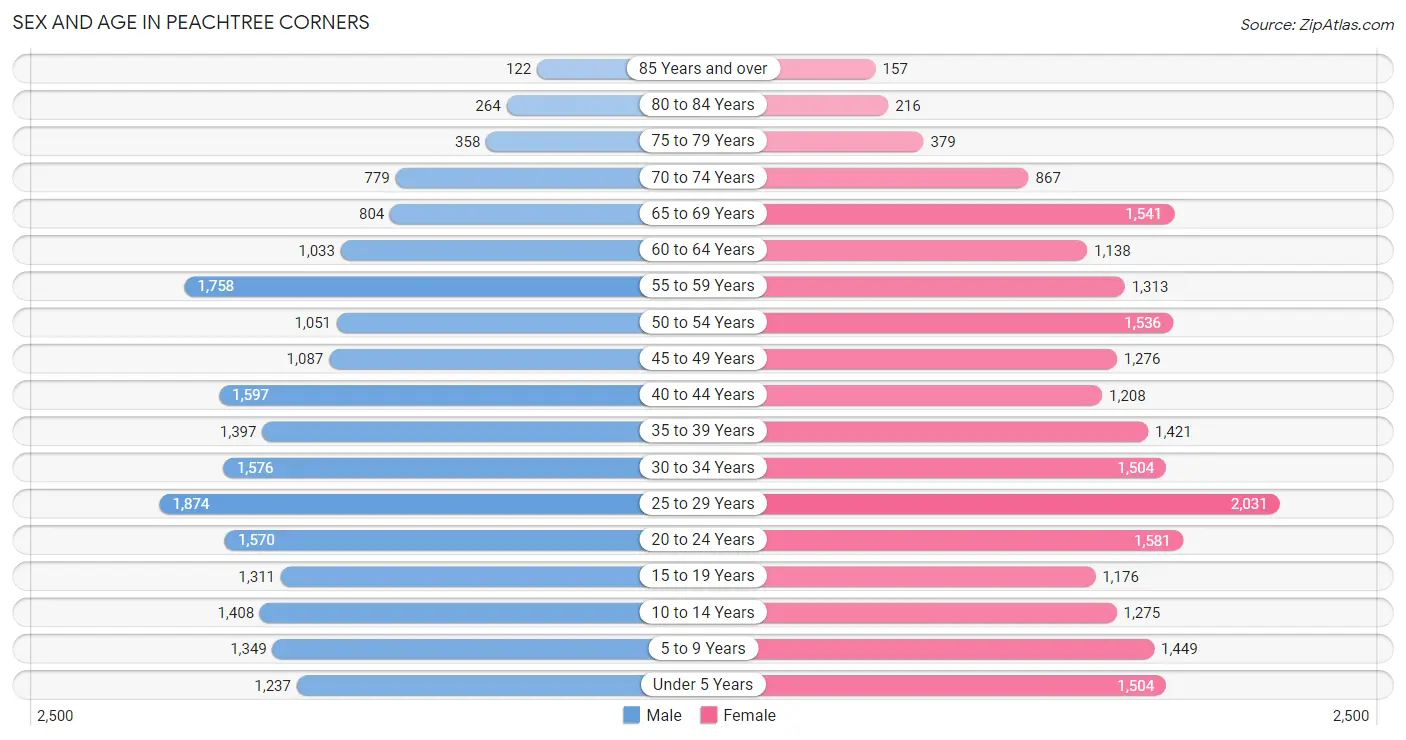
Sex and Age in Peachtree Corners
Sex and Age in Peachtree Corners
The most populous age groups in Peachtree Corners are 25 to 29 Years (1,874 | 9.1%) for men and 25 to 29 Years (2,031 | 9.4%) for women.
| Age Bracket | Male | Female |
| Under 5 Years | 1,237 (6.0%) | 1,504 (7.0%) |
| 5 to 9 Years | 1,349 (6.6%) | 1,449 (6.7%) |
| 10 to 14 Years | 1,408 (6.8%) | 1,275 (5.9%) |
| 15 to 19 Years | 1,311 (6.4%) | 1,176 (5.4%) |
| 20 to 24 Years | 1,570 (7.6%) | 1,581 (7.3%) |
| 25 to 29 Years | 1,874 (9.1%) | 2,031 (9.4%) |
| 30 to 34 Years | 1,576 (7.7%) | 1,504 (7.0%) |
| 35 to 39 Years | 1,397 (6.8%) | 1,421 (6.6%) |
| 40 to 44 Years | 1,597 (7.8%) | 1,208 (5.6%) |
| 45 to 49 Years | 1,087 (5.3%) | 1,276 (5.9%) |
| 50 to 54 Years | 1,051 (5.1%) | 1,536 (7.1%) |
| 55 to 59 Years | 1,758 (8.5%) | 1,313 (6.1%) |
| 60 to 64 Years | 1,033 (5.0%) | 1,138 (5.3%) |
| 65 to 69 Years | 804 (3.9%) | 1,541 (7.1%) |
| 70 to 74 Years | 779 (3.8%) | 867 (4.0%) |
| 75 to 79 Years | 358 (1.7%) | 379 (1.8%) |
| 80 to 84 Years | 264 (1.3%) | 216 (1.0%) |
| 85 Years and over | 122 (0.6%) | 157 (0.7%) |
| Total | 20,575 (100.0%) | 21,572 (100.0%) |
Families and Households in Peachtree Corners
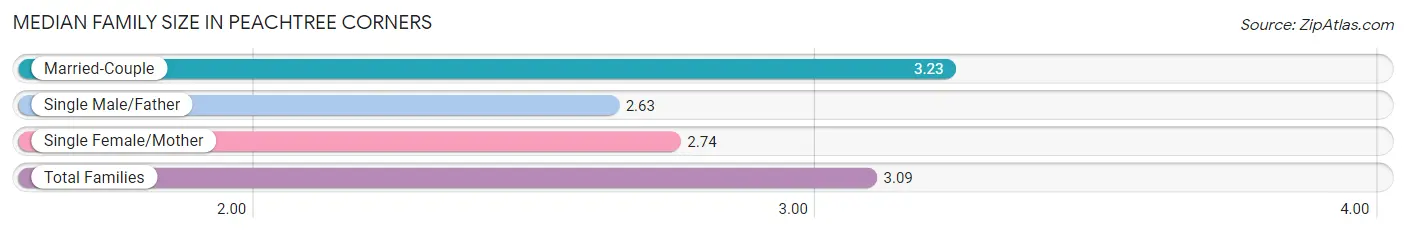
Median Family Size in Peachtree Corners
The median family size in Peachtree Corners is 3.09 persons per family, with married-couple families (8,047 | 72.0%) accounting for the largest median family size of 3.23 persons per family. On the other hand, single male/father families (763 | 6.8%) represent the smallest median family size with 2.63 persons per family.
| Family Type | # Families | Family Size |
| Married-Couple | 8,047 (72.0%) | 3.23 |
| Single Male/Father | 763 (6.8%) | 2.63 |
| Single Female/Mother | 2,374 (21.2%) | 2.74 |
| Total Families | 11,184 (100.0%) | 3.09 |
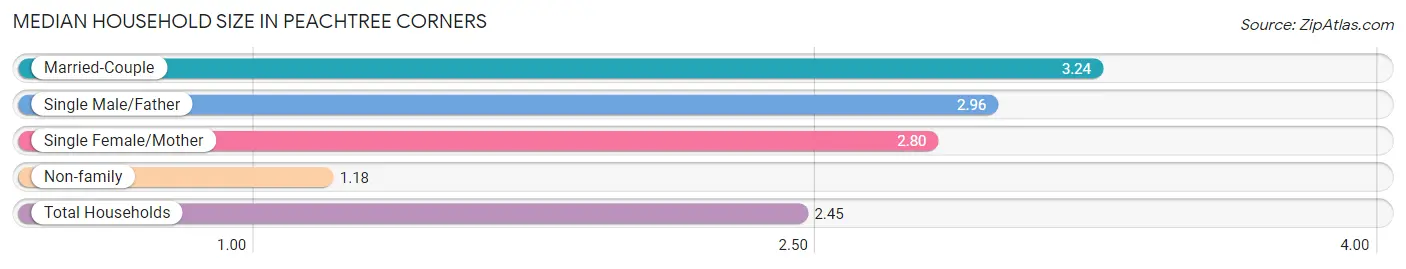
Median Household Size in Peachtree Corners
The median household size in Peachtree Corners is 2.45 persons per household, with married-couple households (8,047 | 46.7%) accounting for the largest median household size of 3.24 persons per household. non-family households (6,047 | 35.1%) represent the smallest median household size with 1.18 persons per household.
| Household Type | # Households | Household Size |
| Married-Couple | 8,047 (46.7%) | 3.24 |
| Single Male/Father | 763 (4.4%) | 2.96 |
| Single Female/Mother | 2,374 (13.8%) | 2.80 |
| Non-family | 6,047 (35.1%) | 1.18 |
| Total Households | 17,231 (100.0%) | 2.45 |
Household Size by Marriage Status in Peachtree Corners
Out of a total of 17,231 households in Peachtree Corners, 11,184 (64.9%) are family households, while 6,047 (35.1%) are nonfamily households. The most numerous type of family households are 2-person households, comprising 5,098, and the most common type of nonfamily households are 1-person households, comprising 5,162.
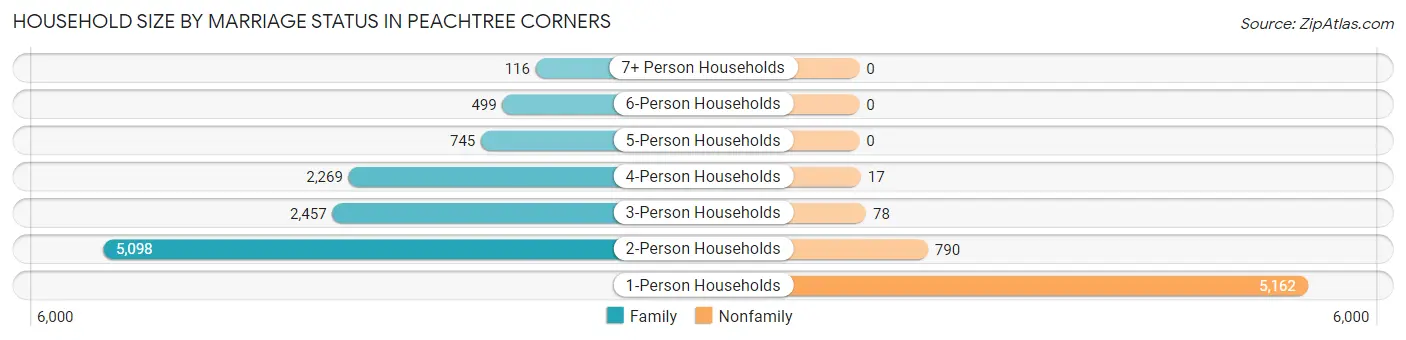
| Household Size | Family Households | Nonfamily Households |
| 1-Person Households | - | 5,162 (30.0%) |
| 2-Person Households | 5,098 (29.6%) | 790 (4.6%) |
| 3-Person Households | 2,457 (14.3%) | 78 (0.4%) |
| 4-Person Households | 2,269 (13.2%) | 17 (0.1%) |
| 5-Person Households | 745 (4.3%) | 0 (0.0%) |
| 6-Person Households | 499 (2.9%) | 0 (0.0%) |
| 7+ Person Households | 116 (0.7%) | 0 (0.0%) |
| Total | 11,184 (64.9%) | 6,047 (35.1%) |
Female Fertility in Peachtree Corners
Fertility by Age in Peachtree Corners
Average fertility rate in Peachtree Corners is 35.0 births per 1,000 women. Women in the age bracket of 35 to 50 years have the highest fertility rate with 45.0 births per 1,000 women. Women in the age bracket of 35 to 50 years acount for 52.0% of all women with births.
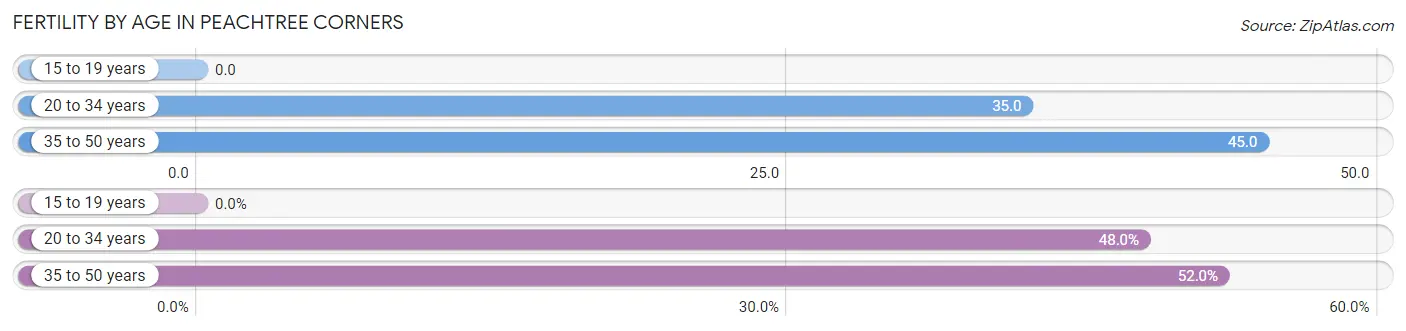
| Age Bracket | Women with Births | Births / 1,000 Women |
| 15 to 19 years | 0 (0.0%) | 0.0 |
| 20 to 34 years | 179 (48.0%) | 35.0 |
| 35 to 50 years | 194 (52.0%) | 45.0 |
| Total | 373 (100.0%) | 35.0 |
Fertility by Age by Marriage Status in Peachtree Corners
75.1% of women with births (373) in Peachtree Corners are married. The highest percentage of unmarried women with births falls into 20 to 34 years age bracket with 44.1% of them unmarried at the time of birth, while the lowest percentage of unmarried women with births belong to 35 to 50 years age bracket with 7.2% of them unmarried.
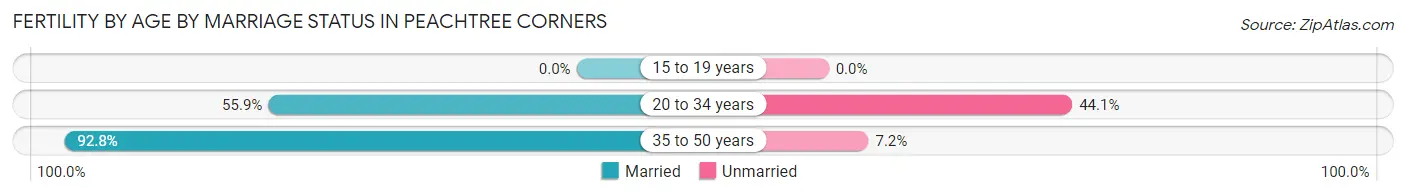
| Age Bracket | Married | Unmarried |
| 15 to 19 years | 0 (0.0%) | 0 (0.0%) |
| 20 to 34 years | 100 (55.9%) | 79 (44.1%) |
| 35 to 50 years | 180 (92.8%) | 14 (7.2%) |
| Total | 280 (75.1%) | 93 (24.9%) |
Fertility by Education in Peachtree Corners
Average fertility rate in Peachtree Corners is 35.0 births per 1,000 women. Women with the education attainment of bachelor's degree have the highest fertility rate of 52.0 births per 1,000 women, while women with the education attainment of college or associate's degree have the lowest fertility at 15.0 births per 1,000 women. Women with the education attainment of bachelor's degree represent 43.7% of all women with births.
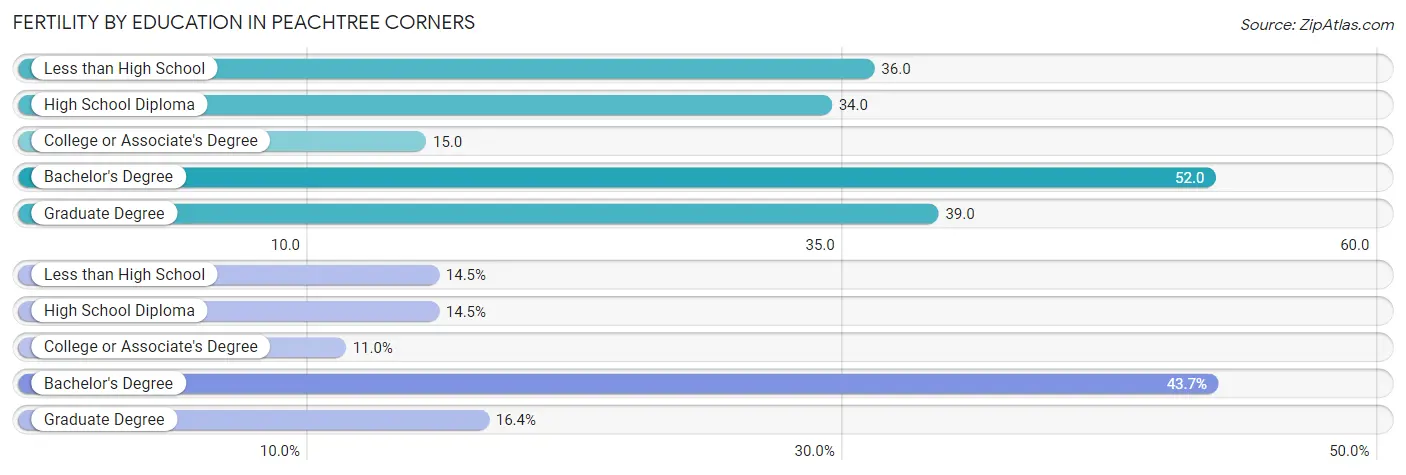
| Educational Attainment | Women with Births | Births / 1,000 Women |
| Less than High School | 54 (14.5%) | 36.0 |
| High School Diploma | 54 (14.5%) | 34.0 |
| College or Associate's Degree | 41 (11.0%) | 15.0 |
| Bachelor's Degree | 163 (43.7%) | 52.0 |
| Graduate Degree | 61 (16.4%) | 39.0 |
| Total | 373 (100.0%) | 35.0 |
Fertility by Education by Marriage Status in Peachtree Corners
24.9% of women with births in Peachtree Corners are unmarried. Women with the educational attainment of graduate degree are most likely to be married with 100.0% of them married at childbirth, while women with the educational attainment of high school diploma are least likely to be married with 55.6% of them unmarried at childbirth.
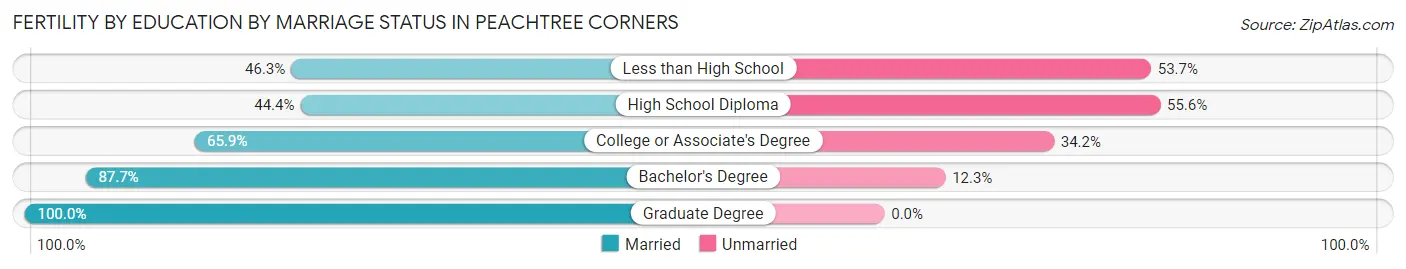
| Educational Attainment | Married | Unmarried |
| Less than High School | 25 (46.3%) | 29 (53.7%) |
| High School Diploma | 24 (44.4%) | 30 (55.6%) |
| College or Associate's Degree | 27 (65.8%) | 14 (34.2%) |
| Bachelor's Degree | 143 (87.7%) | 20 (12.3%) |
| Graduate Degree | 61 (100.0%) | 0 (0.0%) |
| Total | 280 (75.1%) | 93 (24.9%) |
Employment Characteristics in Peachtree Corners
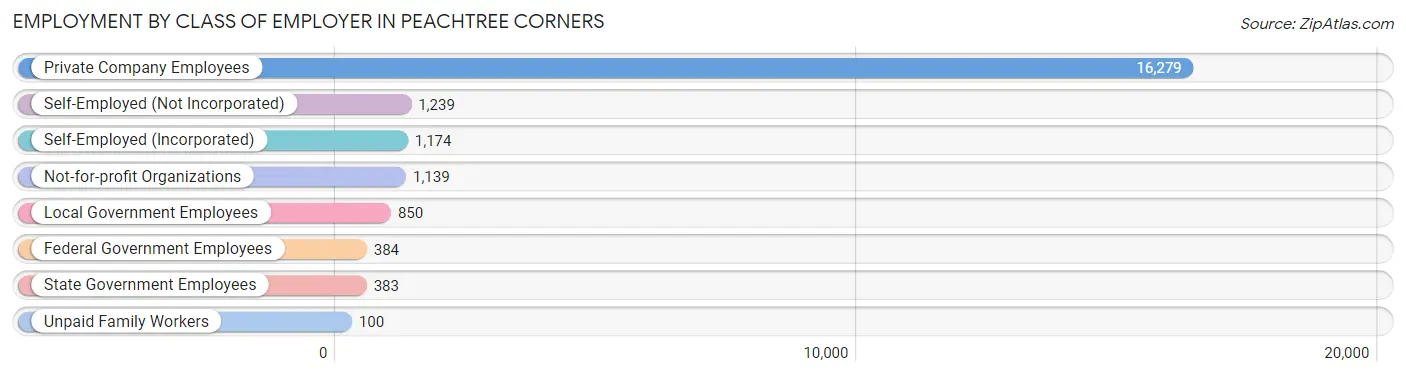
Employment by Class of Employer in Peachtree Corners
Among the 21,548 employed individuals in Peachtree Corners, private company employees (16,279 | 75.5%), self-employed (not incorporated) (1,239 | 5.8%), and self-employed (incorporated) (1,174 | 5.4%) make up the most common classes of employment.
| Employer Class | # Employees | % Employees |
| Private Company Employees | 16,279 | 75.5% |
| Self-Employed (Incorporated) | 1,174 | 5.4% |
| Self-Employed (Not Incorporated) | 1,239 | 5.8% |
| Not-for-profit Organizations | 1,139 | 5.3% |
| Local Government Employees | 850 | 3.9% |
| State Government Employees | 383 | 1.8% |
| Federal Government Employees | 384 | 1.8% |
| Unpaid Family Workers | 100 | 0.5% |
| Total | 21,548 | 100.0% |
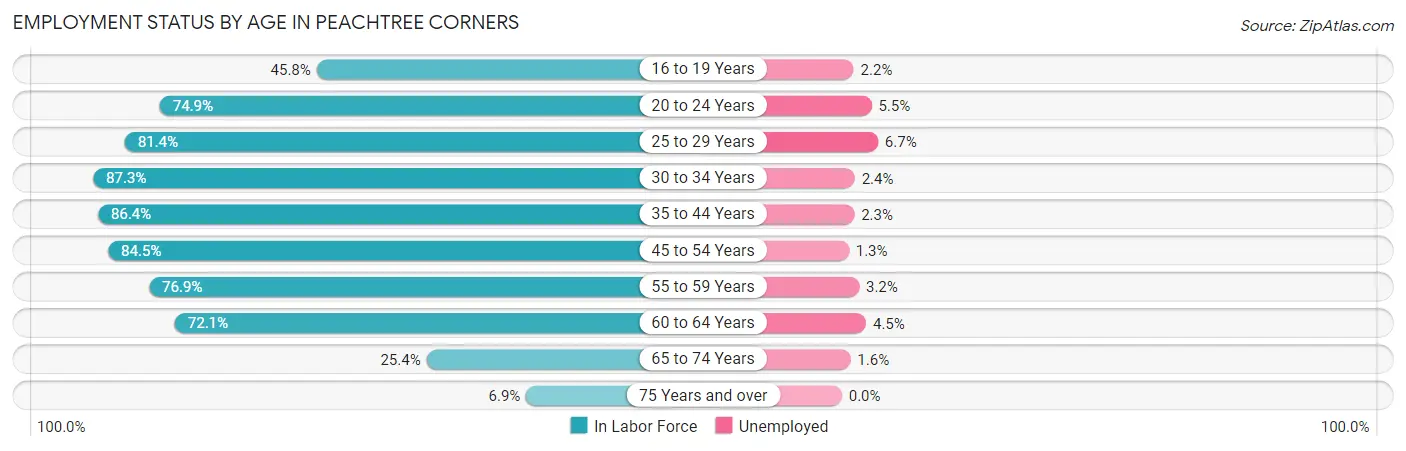
Employment Status by Age in Peachtree Corners
According to the labor force statistics for Peachtree Corners, out of the total population over 16 years of age (33,538), 69.4% or 23,275 individuals are in the labor force, with 3.3% or 768 of them unemployed. The age group with the highest labor force participation rate is 30 to 34 years, with 87.3% or 2,689 individuals in the labor force. Within the labor force, the 25 to 29 years age range has the highest percentage of unemployed individuals, with 6.7% or 213 of them being unemployed.
| Age Bracket | In Labor Force | Unemployed |
| 16 to 19 Years | 962 (45.8%) | 21 (2.2%) |
| 20 to 24 Years | 2,360 (74.9%) | 130 (5.5%) |
| 25 to 29 Years | 3,179 (81.4%) | 213 (6.7%) |
| 30 to 34 Years | 2,689 (87.3%) | 65 (2.4%) |
| 35 to 44 Years | 4,858 (86.4%) | 112 (2.3%) |
| 45 to 54 Years | 4,183 (84.5%) | 54 (1.3%) |
| 55 to 59 Years | 2,362 (76.9%) | 76 (3.2%) |
| 60 to 64 Years | 1,565 (72.1%) | 70 (4.5%) |
| 65 to 74 Years | 1,014 (25.4%) | 16 (1.6%) |
| 75 Years and over | 103 (6.9%) | 0 (0.0%) |
| Total | 23,275 (69.4%) | 768 (3.3%) |
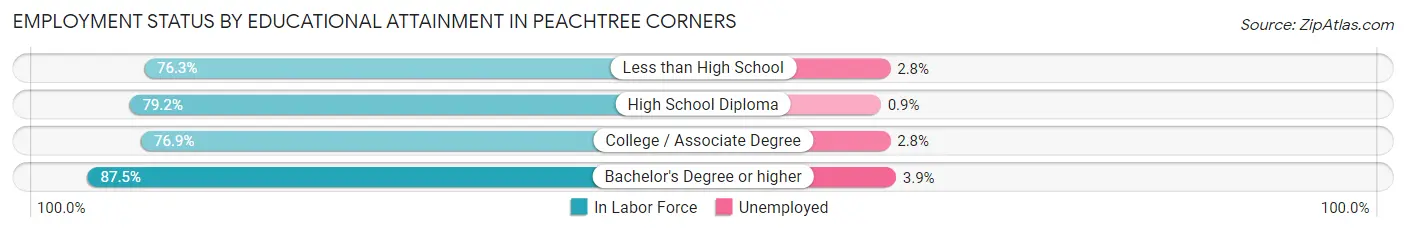
Employment Status by Educational Attainment in Peachtree Corners
According to labor force statistics for Peachtree Corners, 82.6% of individuals (18,833) out of the total population between 25 and 64 years of age (22,800) are in the labor force, with 3.1% or 584 of them being unemployed. The group with the highest labor force participation rate are those with the educational attainment of bachelor's degree or higher, with 87.5% or 10,224 individuals in the labor force. Within the labor force, individuals with bachelor's degree or higher education have the highest percentage of unemployment, with 3.9% or 399 of them being unemployed.
| Educational Attainment | In Labor Force | Unemployed |
| Less than High School | 1,389 (76.3%) | 51 (2.8%) |
| High School Diploma | 2,821 (79.2%) | 32 (0.9%) |
| College / Associate Degree | 4,409 (76.9%) | 161 (2.8%) |
| Bachelor's Degree or higher | 10,224 (87.5%) | 456 (3.9%) |
| Total | 18,833 (82.6%) | 707 (3.1%) |
Employment Occupations by Sex in Peachtree Corners
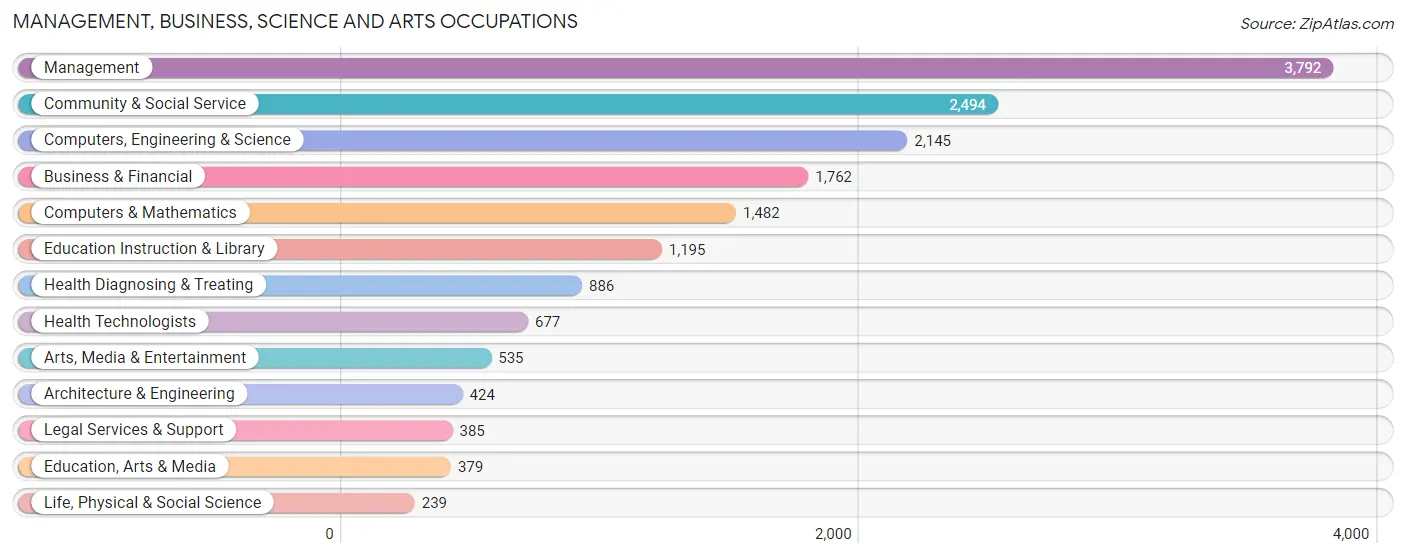
Management, Business, Science and Arts Occupations
The most common Management, Business, Science and Arts occupations in Peachtree Corners are Management (3,792 | 16.8%), Community & Social Service (2,494 | 11.1%), Computers, Engineering & Science (2,145 | 9.5%), Business & Financial (1,762 | 7.8%), and Computers & Mathematics (1,482 | 6.6%).
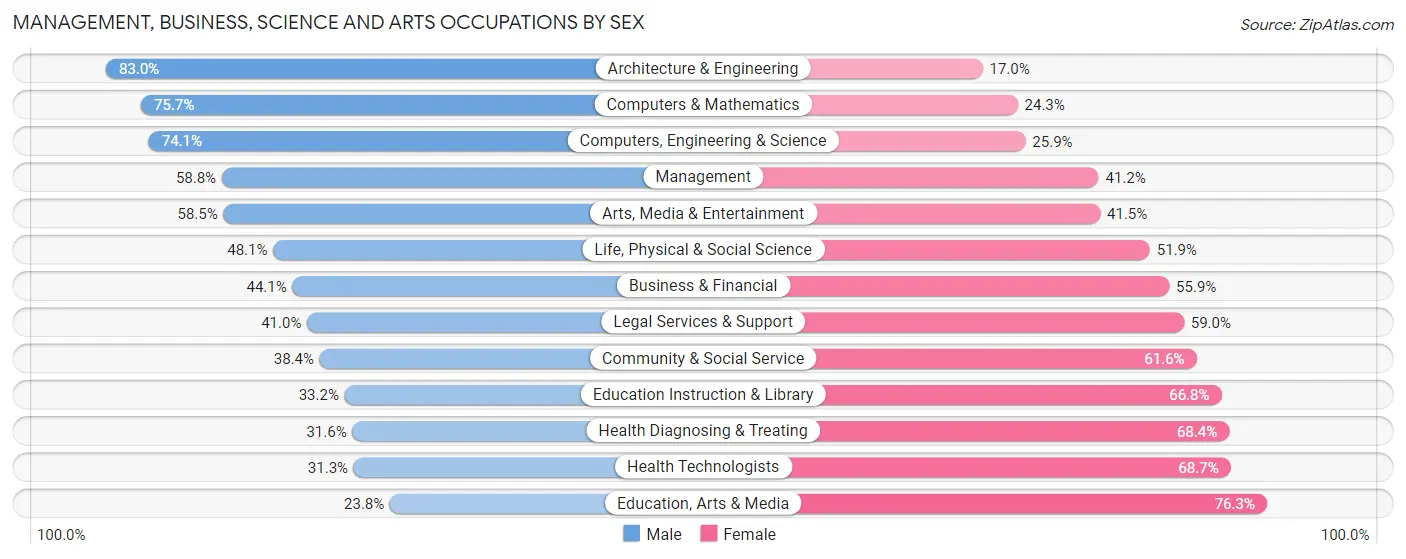
Management, Business, Science and Arts Occupations by Sex
Within the Management, Business, Science and Arts occupations in Peachtree Corners, the most male-oriented occupations are Architecture & Engineering (83.0%), Computers & Mathematics (75.7%), and Computers, Engineering & Science (74.1%), while the most female-oriented occupations are Education, Arts & Media (76.2%), Health Technologists (68.7%), and Health Diagnosing & Treating (68.4%).
| Occupation | Male | Female |
| Management | 2,231 (58.8%) | 1,561 (41.2%) |
| Business & Financial | 777 (44.1%) | 985 (55.9%) |
| Computers, Engineering & Science | 1,589 (74.1%) | 556 (25.9%) |
| Computers & Mathematics | 1,122 (75.7%) | 360 (24.3%) |
| Architecture & Engineering | 352 (83.0%) | 72 (17.0%) |
| Life, Physical & Social Science | 115 (48.1%) | 124 (51.9%) |
| Community & Social Service | 958 (38.4%) | 1,536 (61.6%) |
| Education, Arts & Media | 90 (23.7%) | 289 (76.2%) |
| Legal Services & Support | 158 (41.0%) | 227 (59.0%) |
| Education Instruction & Library | 397 (33.2%) | 798 (66.8%) |
| Arts, Media & Entertainment | 313 (58.5%) | 222 (41.5%) |
| Health Diagnosing & Treating | 280 (31.6%) | 606 (68.4%) |
| Health Technologists | 212 (31.3%) | 465 (68.7%) |
| Total (Category) | 5,835 (52.7%) | 5,244 (47.3%) |
| Total (Overall) | 12,244 (54.4%) | 10,275 (45.6%) |
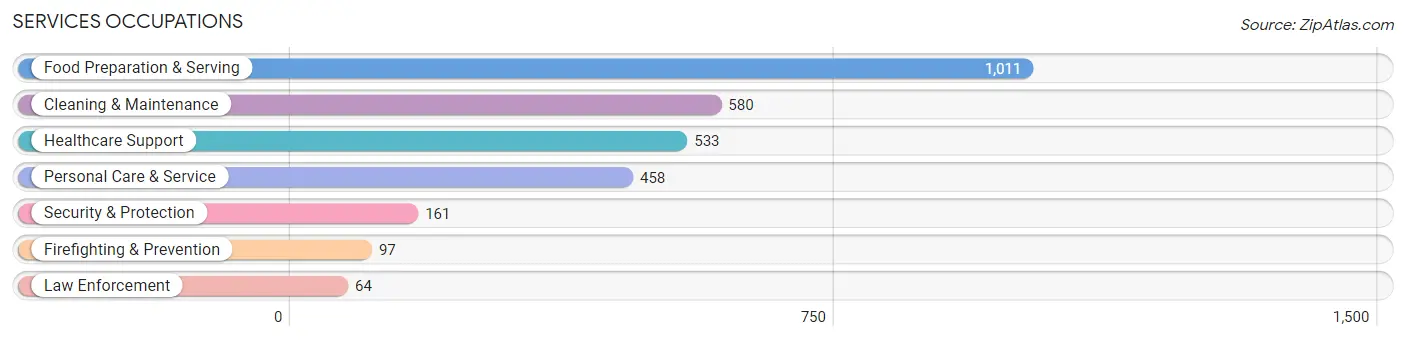
Services Occupations
The most common Services occupations in Peachtree Corners are Food Preparation & Serving (1,011 | 4.5%), Cleaning & Maintenance (580 | 2.6%), Healthcare Support (533 | 2.4%), Personal Care & Service (458 | 2.0%), and Security & Protection (161 | 0.7%).
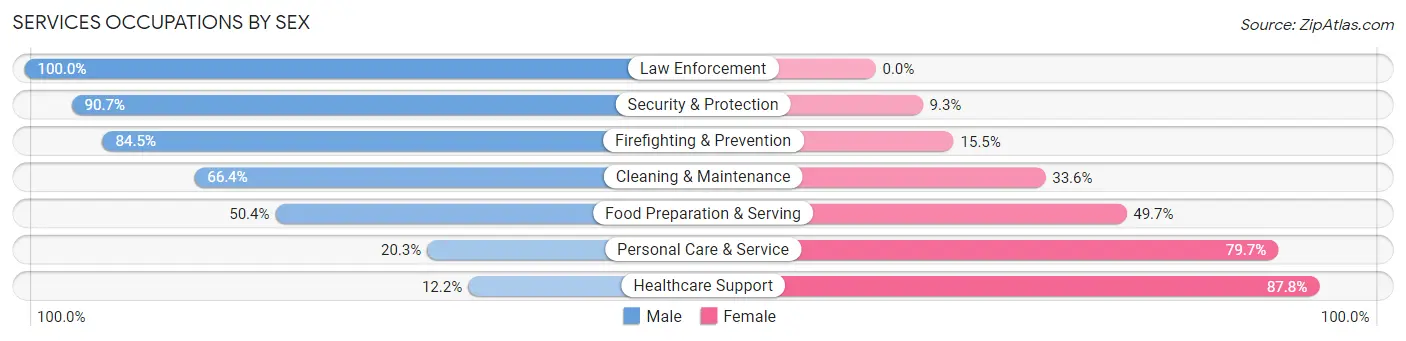
Services Occupations by Sex
Within the Services occupations in Peachtree Corners, the most male-oriented occupations are Law Enforcement (100.0%), Security & Protection (90.7%), and Firefighting & Prevention (84.5%), while the most female-oriented occupations are Healthcare Support (87.8%), Personal Care & Service (79.7%), and Food Preparation & Serving (49.6%).
| Occupation | Male | Female |
| Healthcare Support | 65 (12.2%) | 468 (87.8%) |
| Security & Protection | 146 (90.7%) | 15 (9.3%) |
| Firefighting & Prevention | 82 (84.5%) | 15 (15.5%) |
| Law Enforcement | 64 (100.0%) | 0 (0.0%) |
| Food Preparation & Serving | 509 (50.3%) | 502 (49.6%) |
| Cleaning & Maintenance | 385 (66.4%) | 195 (33.6%) |
| Personal Care & Service | 93 (20.3%) | 365 (79.7%) |
| Total (Category) | 1,198 (43.7%) | 1,545 (56.3%) |
| Total (Overall) | 12,244 (54.4%) | 10,275 (45.6%) |
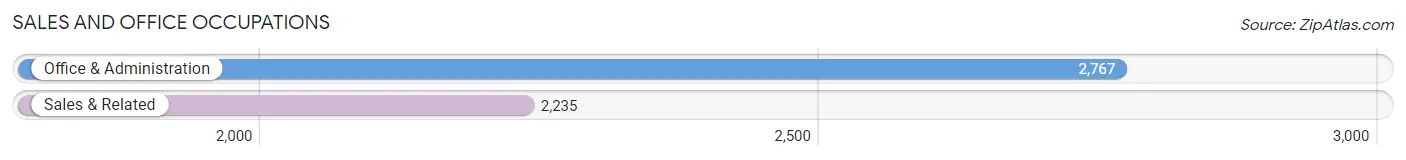
Sales and Office Occupations
The most common Sales and Office occupations in Peachtree Corners are Office & Administration (2,767 | 12.3%), and Sales & Related (2,235 | 9.9%).
Sales and Office Occupations by Sex
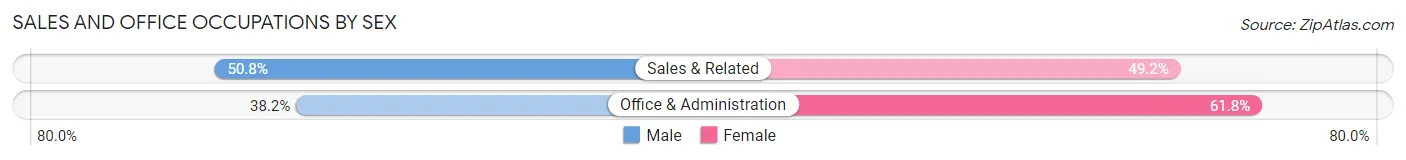
| Occupation | Male | Female |
| Sales & Related | 1,135 (50.8%) | 1,100 (49.2%) |
| Office & Administration | 1,058 (38.2%) | 1,709 (61.8%) |
| Total (Category) | 2,193 (43.8%) | 2,809 (56.2%) |
| Total (Overall) | 12,244 (54.4%) | 10,275 (45.6%) |
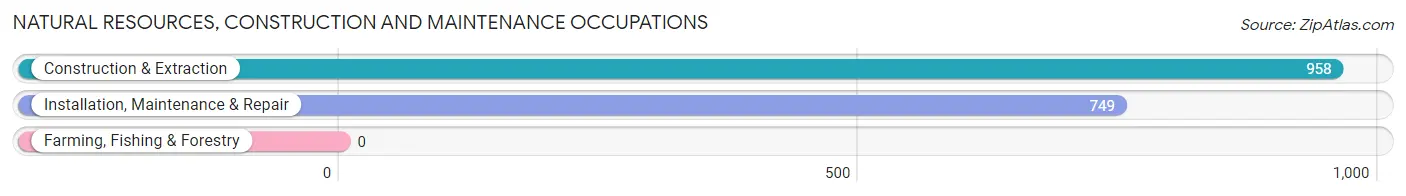
Natural Resources, Construction and Maintenance Occupations
The most common Natural Resources, Construction and Maintenance occupations in Peachtree Corners are Construction & Extraction (958 | 4.3%), and Installation, Maintenance & Repair (749 | 3.3%).
Natural Resources, Construction and Maintenance Occupations by Sex
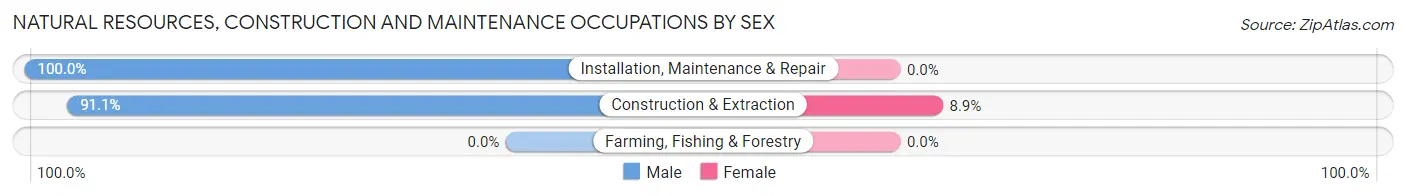
| Occupation | Male | Female |
| Farming, Fishing & Forestry | 0 (0.0%) | 0 (0.0%) |
| Construction & Extraction | 873 (91.1%) | 85 (8.9%) |
| Installation, Maintenance & Repair | 749 (100.0%) | 0 (0.0%) |
| Total (Category) | 1,622 (95.0%) | 85 (5.0%) |
| Total (Overall) | 12,244 (54.4%) | 10,275 (45.6%) |
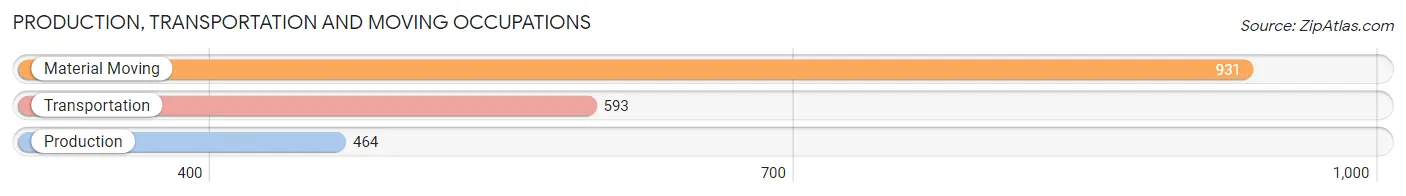
Production, Transportation and Moving Occupations
The most common Production, Transportation and Moving occupations in Peachtree Corners are Material Moving (931 | 4.1%), Transportation (593 | 2.6%), and Production (464 | 2.1%).
Production, Transportation and Moving Occupations by Sex
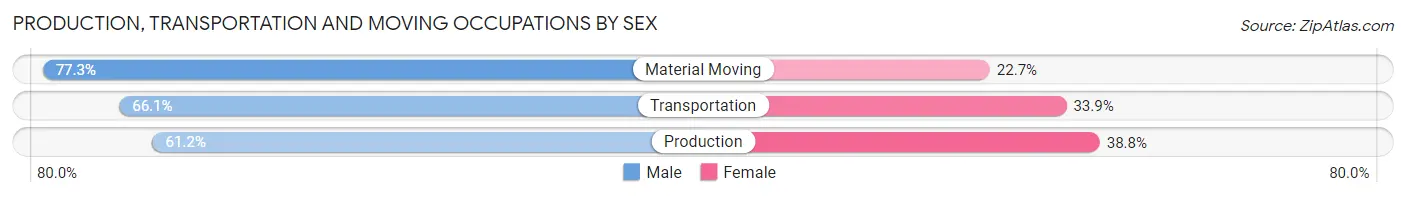
| Occupation | Male | Female |
| Production | 284 (61.2%) | 180 (38.8%) |
| Transportation | 392 (66.1%) | 201 (33.9%) |
| Material Moving | 720 (77.3%) | 211 (22.7%) |
| Total (Category) | 1,396 (70.2%) | 592 (29.8%) |
| Total (Overall) | 12,244 (54.4%) | 10,275 (45.6%) |
Employment Industries by Sex in Peachtree Corners
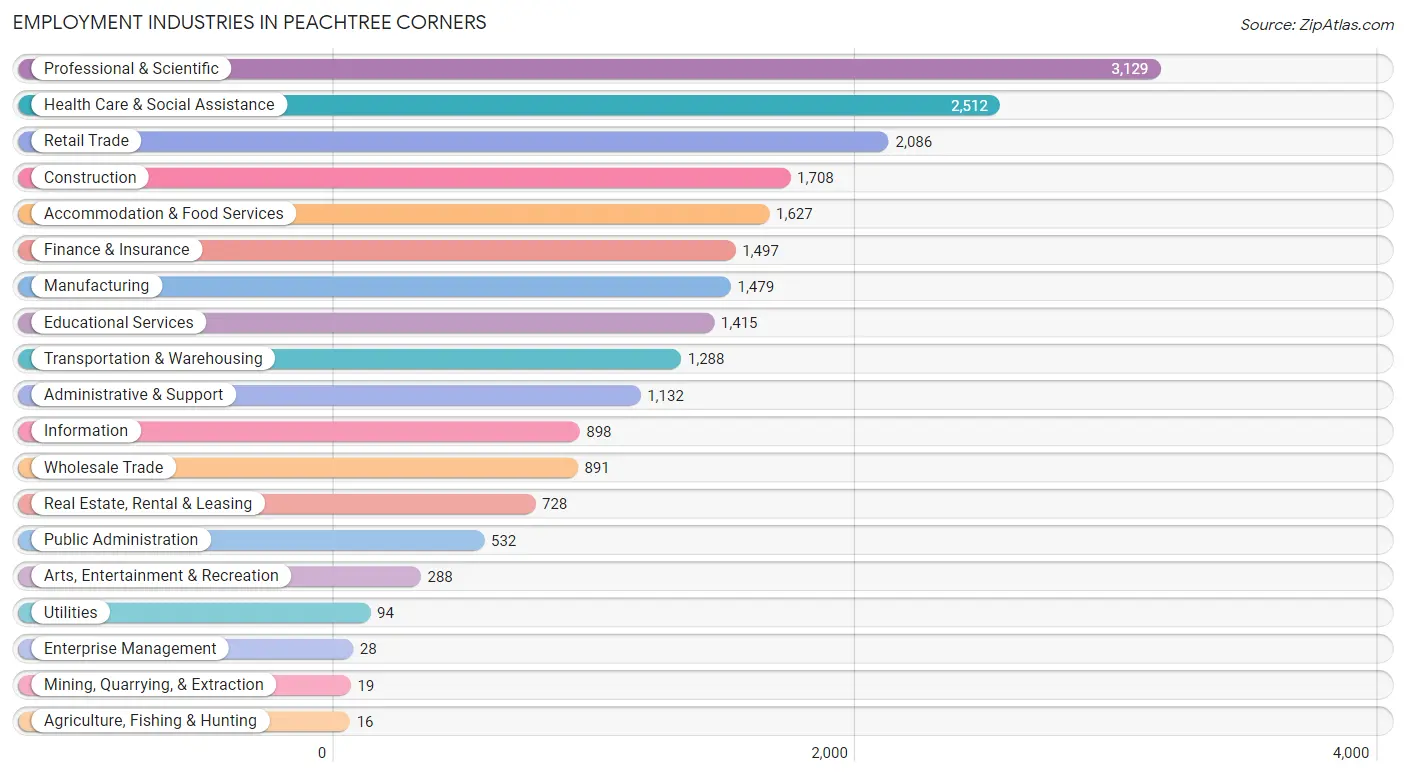
Employment Industries in Peachtree Corners
The major employment industries in Peachtree Corners include Professional & Scientific (3,129 | 13.9%), Health Care & Social Assistance (2,512 | 11.2%), Retail Trade (2,086 | 9.3%), Construction (1,708 | 7.6%), and Accommodation & Food Services (1,627 | 7.2%).
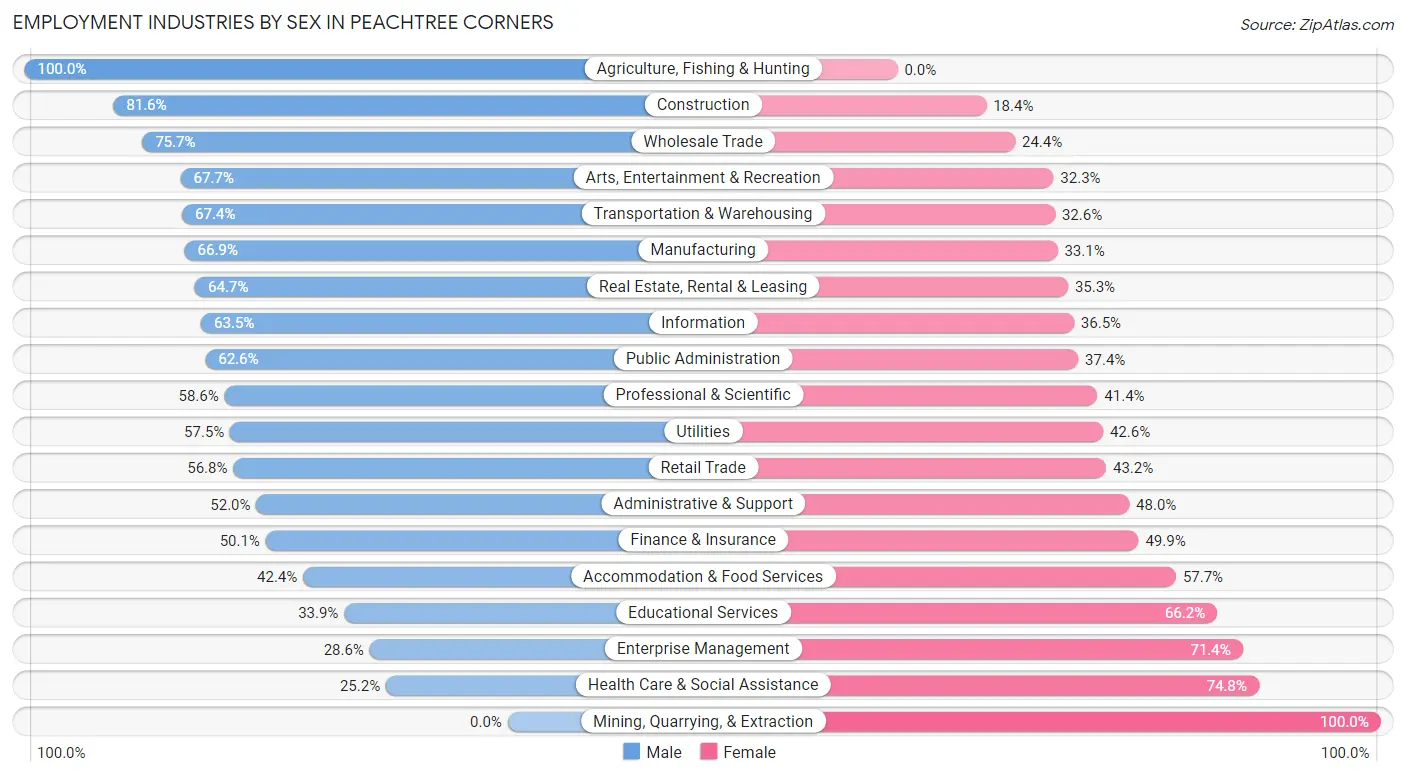
Employment Industries by Sex in Peachtree Corners
The Peachtree Corners industries that see more men than women are Agriculture, Fishing & Hunting (100.0%), Construction (81.6%), and Wholesale Trade (75.6%), whereas the industries that tend to have a higher number of women are Mining, Quarrying, & Extraction (100.0%), Health Care & Social Assistance (74.8%), and Enterprise Management (71.4%).
| Industry | Male | Female |
| Agriculture, Fishing & Hunting | 16 (100.0%) | 0 (0.0%) |
| Mining, Quarrying, & Extraction | 0 (0.0%) | 19 (100.0%) |
| Construction | 1,394 (81.6%) | 314 (18.4%) |
| Manufacturing | 989 (66.9%) | 490 (33.1%) |
| Wholesale Trade | 674 (75.6%) | 217 (24.3%) |
| Retail Trade | 1,185 (56.8%) | 901 (43.2%) |
| Transportation & Warehousing | 868 (67.4%) | 420 (32.6%) |
| Utilities | 54 (57.5%) | 40 (42.5%) |
| Information | 570 (63.5%) | 328 (36.5%) |
| Finance & Insurance | 750 (50.1%) | 747 (49.9%) |
| Real Estate, Rental & Leasing | 471 (64.7%) | 257 (35.3%) |
| Professional & Scientific | 1,834 (58.6%) | 1,295 (41.4%) |
| Enterprise Management | 8 (28.6%) | 20 (71.4%) |
| Administrative & Support | 589 (52.0%) | 543 (48.0%) |
| Educational Services | 479 (33.9%) | 936 (66.1%) |
| Health Care & Social Assistance | 633 (25.2%) | 1,879 (74.8%) |
| Arts, Entertainment & Recreation | 195 (67.7%) | 93 (32.3%) |
| Accommodation & Food Services | 689 (42.3%) | 938 (57.7%) |
| Public Administration | 333 (62.6%) | 199 (37.4%) |
| Total | 12,244 (54.4%) | 10,275 (45.6%) |
Education in Peachtree Corners
School Enrollment in Peachtree Corners
The most common levels of schooling among the 10,467 students in Peachtree Corners are middle school (2,211 | 21.1%), college / undergraduate (2,034 | 19.4%), and high school (2,032 | 19.4%).
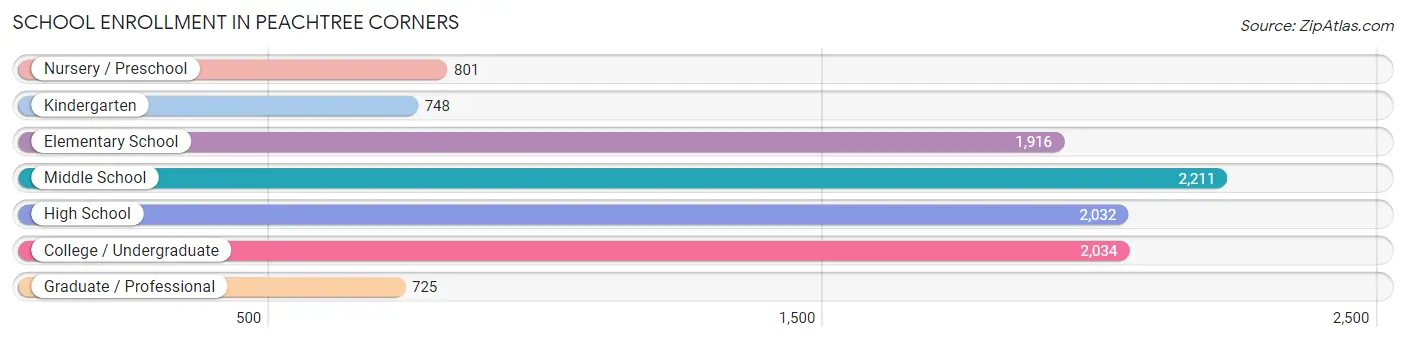
| School Level | # Students | % Students |
| Nursery / Preschool | 801 | 7.6% |
| Kindergarten | 748 | 7.1% |
| Elementary School | 1,916 | 18.3% |
| Middle School | 2,211 | 21.1% |
| High School | 2,032 | 19.4% |
| College / Undergraduate | 2,034 | 19.4% |
| Graduate / Professional | 725 | 6.9% |
| Total | 10,467 | 100.0% |
School Enrollment by Age by Funding Source in Peachtree Corners
Out of a total of 10,467 students who are enrolled in schools in Peachtree Corners, 2,135 (20.4%) attend a private institution, while the remaining 8,332 (79.6%) are enrolled in public schools. The age group of 3 to 4 year olds has the highest likelihood of being enrolled in private schools, with 212 (35.7% in the age bracket) enrolled. Conversely, the age group of 20 to 24 year olds has the lowest likelihood of being enrolled in a private school, with 937 (89.1% in the age bracket) attending a public institution.
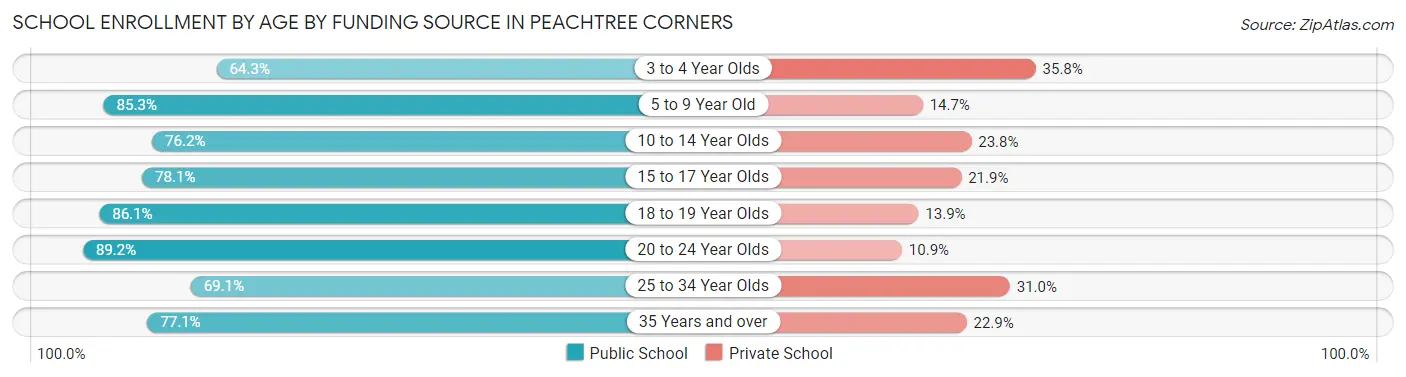
| Age Bracket | Public School | Private School |
| 3 to 4 Year Olds | 381 (64.2%) | 212 (35.7%) |
| 5 to 9 Year Old | 2,329 (85.3%) | 402 (14.7%) |
| 10 to 14 Year Olds | 2,027 (76.2%) | 632 (23.8%) |
| 15 to 17 Year Olds | 1,091 (78.1%) | 306 (21.9%) |
| 18 to 19 Year Olds | 637 (86.1%) | 103 (13.9%) |
| 20 to 24 Year Olds | 937 (89.1%) | 114 (10.8%) |
| 25 to 34 Year Olds | 569 (69.1%) | 255 (30.9%) |
| 35 Years and over | 364 (77.1%) | 108 (22.9%) |
| Total | 8,332 (79.6%) | 2,135 (20.4%) |
Educational Attainment by Field of Study in Peachtree Corners
Business (4,143 | 26.8%), engineering (1,559 | 10.1%), education (1,394 | 9.0%), computers & mathematics (1,233 | 8.0%), and social sciences (1,143 | 7.4%) are the most common fields of study among 15,468 individuals in Peachtree Corners who have obtained a bachelor's degree or higher.
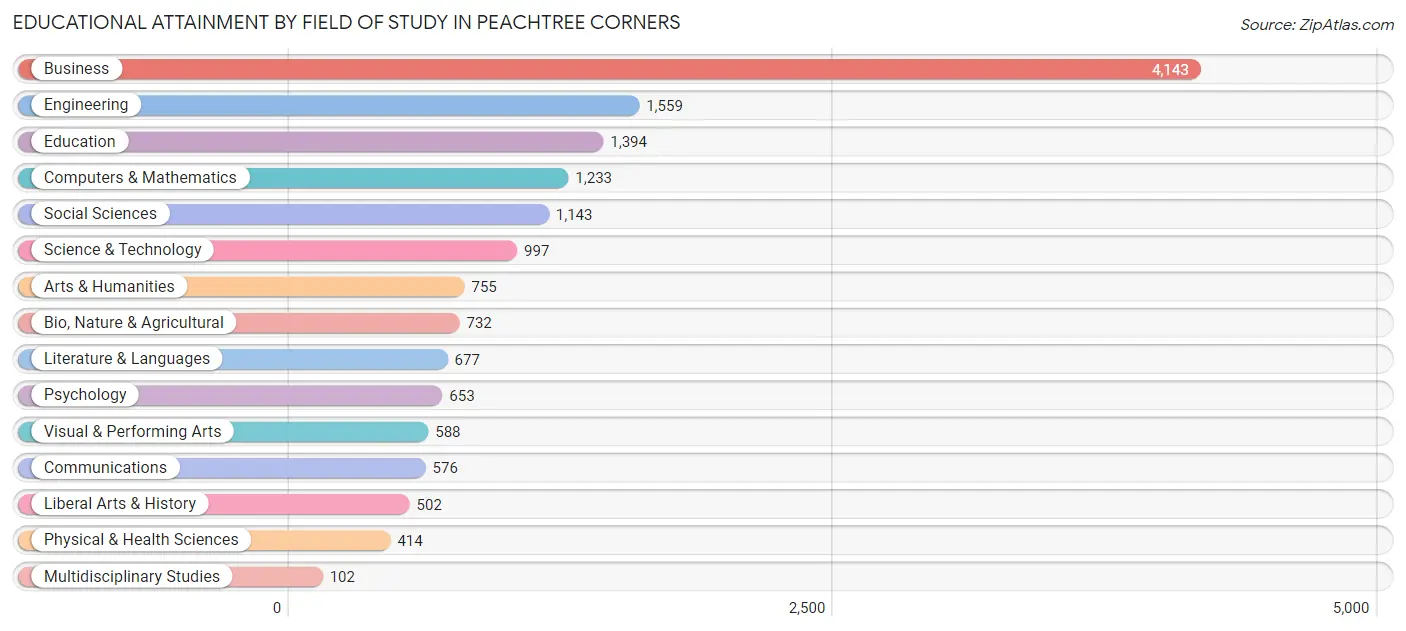
| Field of Study | # Graduates | % Graduates |
| Computers & Mathematics | 1,233 | 8.0% |
| Bio, Nature & Agricultural | 732 | 4.7% |
| Physical & Health Sciences | 414 | 2.7% |
| Psychology | 653 | 4.2% |
| Social Sciences | 1,143 | 7.4% |
| Engineering | 1,559 | 10.1% |
| Multidisciplinary Studies | 102 | 0.7% |
| Science & Technology | 997 | 6.5% |
| Business | 4,143 | 26.8% |
| Education | 1,394 | 9.0% |
| Literature & Languages | 677 | 4.4% |
| Liberal Arts & History | 502 | 3.3% |
| Visual & Performing Arts | 588 | 3.8% |
| Communications | 576 | 3.7% |
| Arts & Humanities | 755 | 4.9% |
| Total | 15,468 | 100.0% |
Transportation & Commute in Peachtree Corners
Vehicle Availability by Sex in Peachtree Corners
The most prevalent vehicle ownership categories in Peachtree Corners are males with 2 vehicles (5,590, accounting for 47.4%) and females with 2 vehicles (4,458, making up 57.4%).
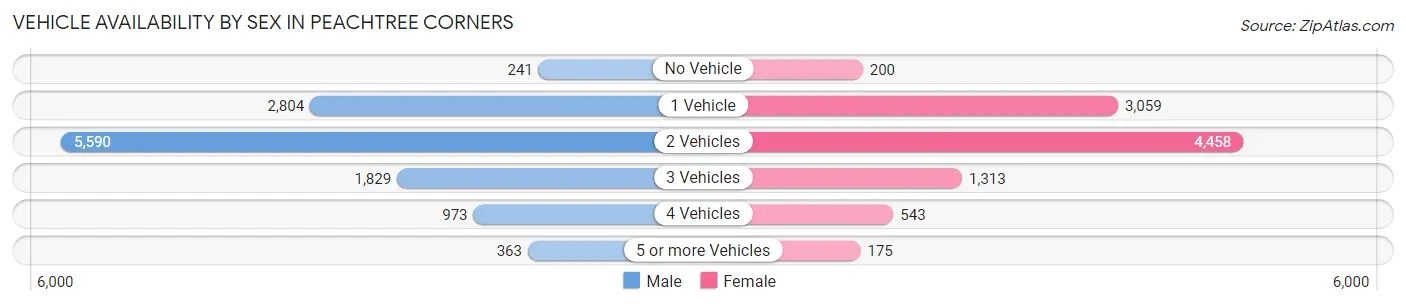
| Vehicles Available | Male | Female |
| No Vehicle | 241 (2.0%) | 200 (2.1%) |
| 1 Vehicle | 2,804 (23.8%) | 3,059 (31.4%) |
| 2 Vehicles | 5,590 (47.4%) | 4,458 (45.7%) |
| 3 Vehicles | 1,829 (15.5%) | 1,313 (13.5%) |
| 4 Vehicles | 973 (8.3%) | 543 (5.6%) |
| 5 or more Vehicles | 363 (3.1%) | 175 (1.8%) |
| Total | 11,800 (100.0%) | 9,748 (100.0%) |
Commute Time in Peachtree Corners
The most frequently occuring commute durations in Peachtree Corners are 30 to 34 minutes (3,335 commuters, 19.2%), 20 to 24 minutes (2,408 commuters, 13.9%), and 15 to 19 minutes (2,026 commuters, 11.7%).
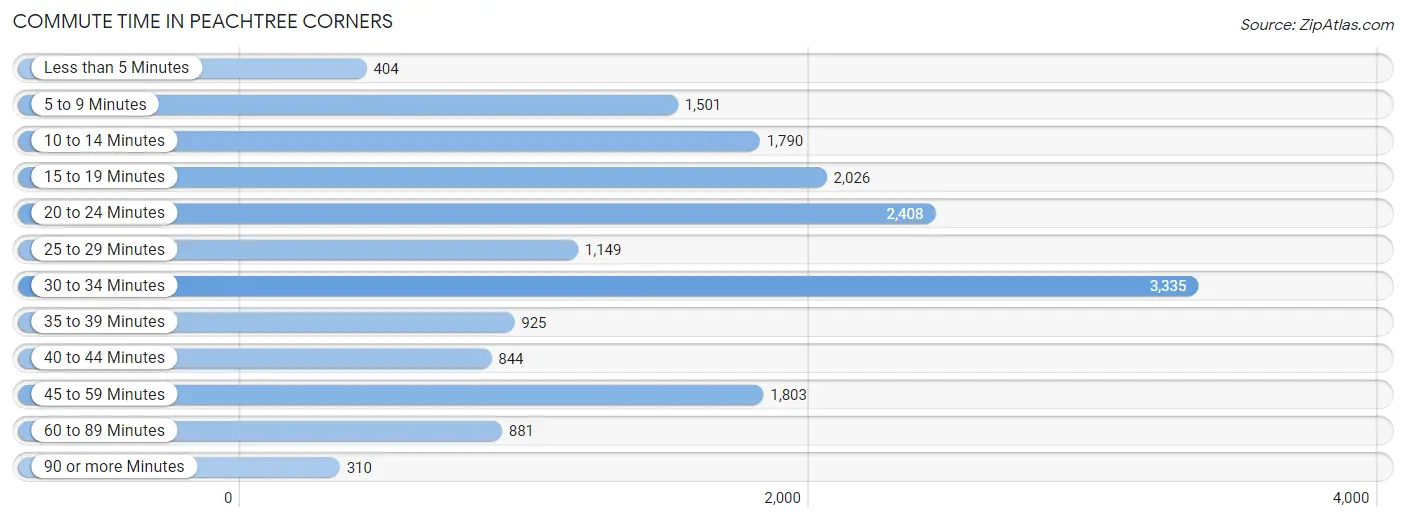
| Commute Time | # Commuters | % Commuters |
| Less than 5 Minutes | 404 | 2.3% |
| 5 to 9 Minutes | 1,501 | 8.6% |
| 10 to 14 Minutes | 1,790 | 10.3% |
| 15 to 19 Minutes | 2,026 | 11.7% |
| 20 to 24 Minutes | 2,408 | 13.9% |
| 25 to 29 Minutes | 1,149 | 6.6% |
| 30 to 34 Minutes | 3,335 | 19.2% |
| 35 to 39 Minutes | 925 | 5.3% |
| 40 to 44 Minutes | 844 | 4.9% |
| 45 to 59 Minutes | 1,803 | 10.4% |
| 60 to 89 Minutes | 881 | 5.1% |
| 90 or more Minutes | 310 | 1.8% |
Commute Time by Sex in Peachtree Corners
The most common commute times in Peachtree Corners are 30 to 34 minutes (2,114 commuters, 22.3%) for males and 20 to 24 minutes (1,385 commuters, 17.5%) for females.
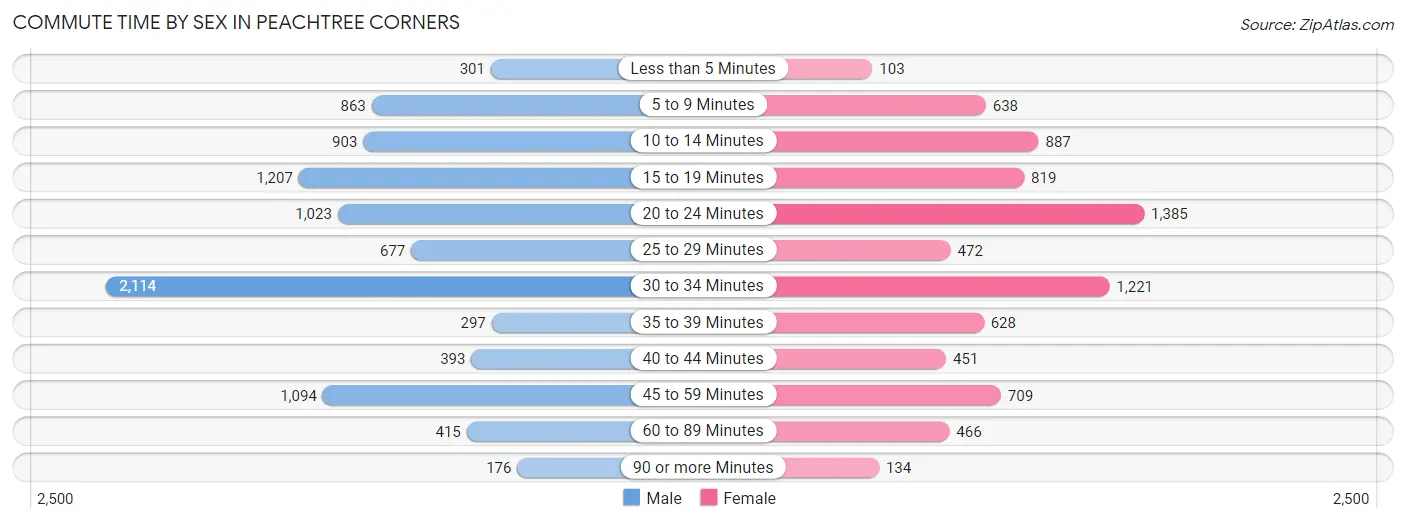
| Commute Time | Male | Female |
| Less than 5 Minutes | 301 (3.2%) | 103 (1.3%) |
| 5 to 9 Minutes | 863 (9.1%) | 638 (8.1%) |
| 10 to 14 Minutes | 903 (9.5%) | 887 (11.2%) |
| 15 to 19 Minutes | 1,207 (12.8%) | 819 (10.3%) |
| 20 to 24 Minutes | 1,023 (10.8%) | 1,385 (17.5%) |
| 25 to 29 Minutes | 677 (7.1%) | 472 (6.0%) |
| 30 to 34 Minutes | 2,114 (22.3%) | 1,221 (15.4%) |
| 35 to 39 Minutes | 297 (3.1%) | 628 (7.9%) |
| 40 to 44 Minutes | 393 (4.2%) | 451 (5.7%) |
| 45 to 59 Minutes | 1,094 (11.6%) | 709 (9.0%) |
| 60 to 89 Minutes | 415 (4.4%) | 466 (5.9%) |
| 90 or more Minutes | 176 (1.9%) | 134 (1.7%) |
Time of Departure to Work by Sex in Peachtree Corners
The most frequent times of departure to work in Peachtree Corners are 8:00 AM to 8:29 AM (1,962, 20.7%) for males and 8:00 AM to 8:29 AM (1,697, 21.4%) for females.
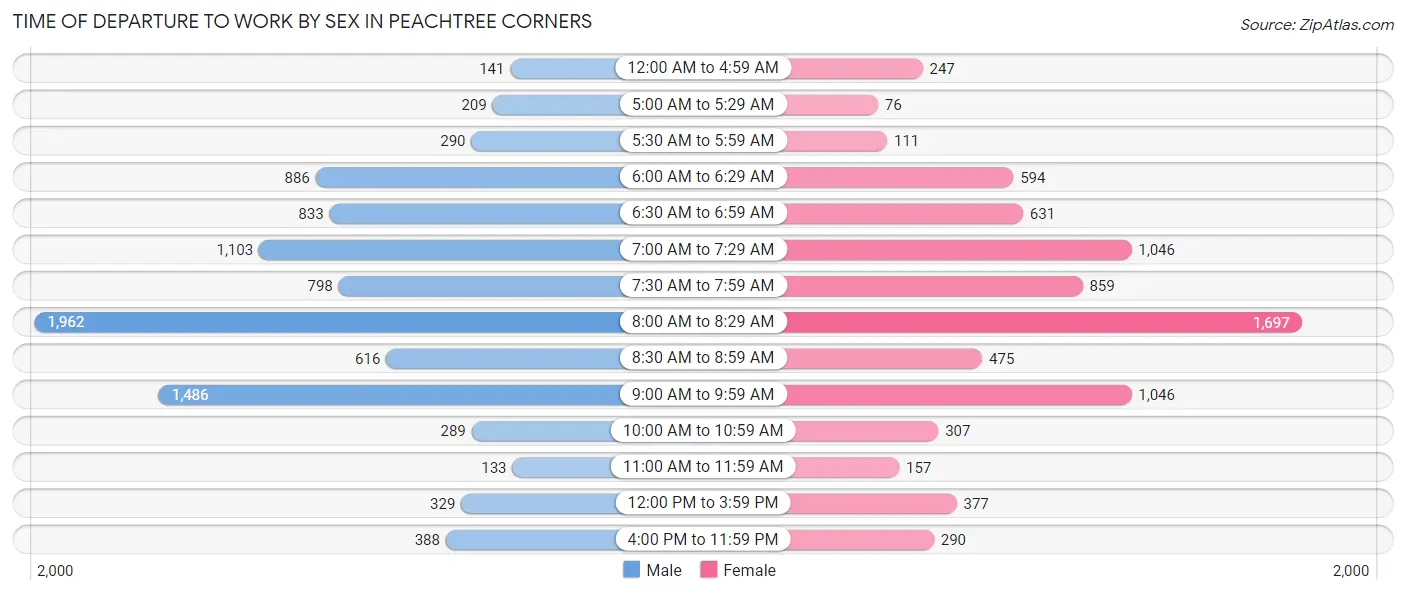
| Time of Departure | Male | Female |
| 12:00 AM to 4:59 AM | 141 (1.5%) | 247 (3.1%) |
| 5:00 AM to 5:29 AM | 209 (2.2%) | 76 (1.0%) |
| 5:30 AM to 5:59 AM | 290 (3.1%) | 111 (1.4%) |
| 6:00 AM to 6:29 AM | 886 (9.4%) | 594 (7.5%) |
| 6:30 AM to 6:59 AM | 833 (8.8%) | 631 (8.0%) |
| 7:00 AM to 7:29 AM | 1,103 (11.7%) | 1,046 (13.2%) |
| 7:30 AM to 7:59 AM | 798 (8.4%) | 859 (10.9%) |
| 8:00 AM to 8:29 AM | 1,962 (20.7%) | 1,697 (21.4%) |
| 8:30 AM to 8:59 AM | 616 (6.5%) | 475 (6.0%) |
| 9:00 AM to 9:59 AM | 1,486 (15.7%) | 1,046 (13.2%) |
| 10:00 AM to 10:59 AM | 289 (3.0%) | 307 (3.9%) |
| 11:00 AM to 11:59 AM | 133 (1.4%) | 157 (2.0%) |
| 12:00 PM to 3:59 PM | 329 (3.5%) | 377 (4.8%) |
| 4:00 PM to 11:59 PM | 388 (4.1%) | 290 (3.7%) |
| Total | 9,463 (100.0%) | 7,913 (100.0%) |
Housing Occupancy in Peachtree Corners
Occupancy by Ownership in Peachtree Corners
Of the total 17,231 dwellings in Peachtree Corners, owner-occupied units account for 8,739 (50.7%), while renter-occupied units make up 8,492 (49.3%).
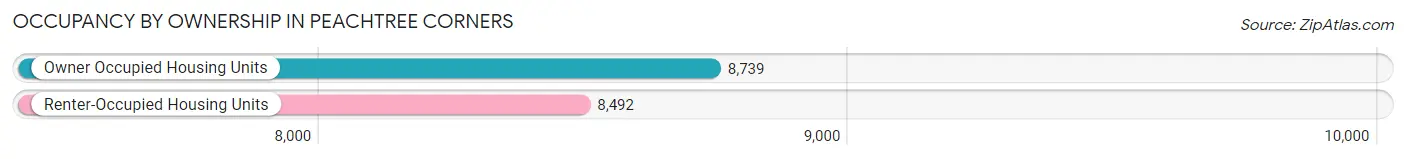
| Occupancy | # Housing Units | % Housing Units |
| Owner Occupied Housing Units | 8,739 | 50.7% |
| Renter-Occupied Housing Units | 8,492 | 49.3% |
| Total Occupied Housing Units | 17,231 | 100.0% |
Occupancy by Household Size in Peachtree Corners
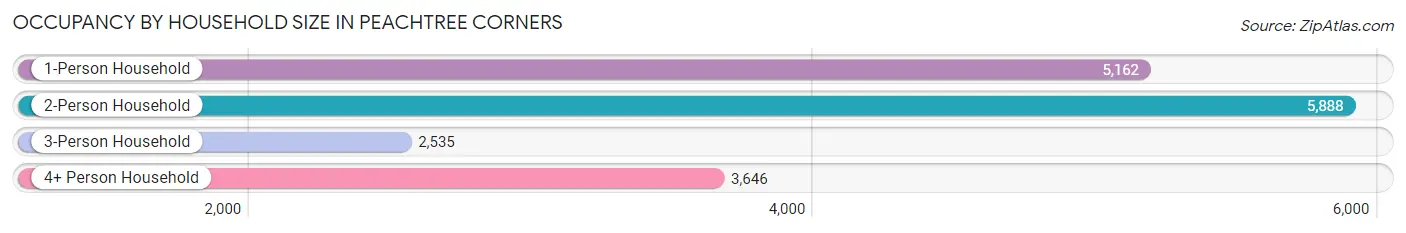
| Household Size | # Housing Units | % Housing Units |
| 1-Person Household | 5,162 | 30.0% |
| 2-Person Household | 5,888 | 34.2% |
| 3-Person Household | 2,535 | 14.7% |
| 4+ Person Household | 3,646 | 21.2% |
| Total Housing Units | 17,231 | 100.0% |
Occupancy by Ownership by Household Size in Peachtree Corners
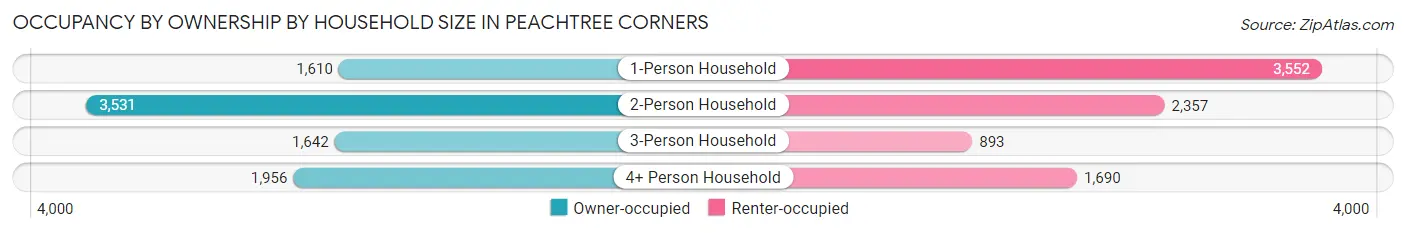
| Household Size | Owner-occupied | Renter-occupied |
| 1-Person Household | 1,610 (31.2%) | 3,552 (68.8%) |
| 2-Person Household | 3,531 (60.0%) | 2,357 (40.0%) |
| 3-Person Household | 1,642 (64.8%) | 893 (35.2%) |
| 4+ Person Household | 1,956 (53.6%) | 1,690 (46.4%) |
| Total Housing Units | 8,739 (50.7%) | 8,492 (49.3%) |
Occupancy by Educational Attainment in Peachtree Corners
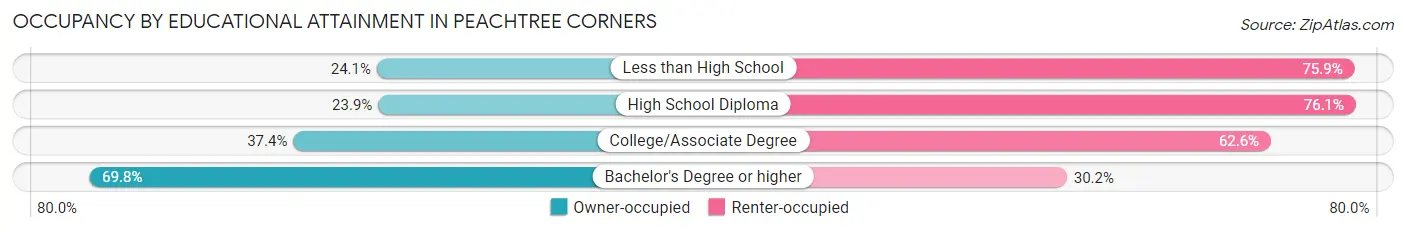
| Household Size | Owner-occupied | Renter-occupied |
| Less than High School | 254 (24.1%) | 798 (75.9%) |
| High School Diploma | 700 (23.9%) | 2,227 (76.1%) |
| College/Associate Degree | 1,686 (37.4%) | 2,823 (62.6%) |
| Bachelor's Degree or higher | 6,099 (69.8%) | 2,644 (30.2%) |
Occupancy by Age of Householder in Peachtree Corners
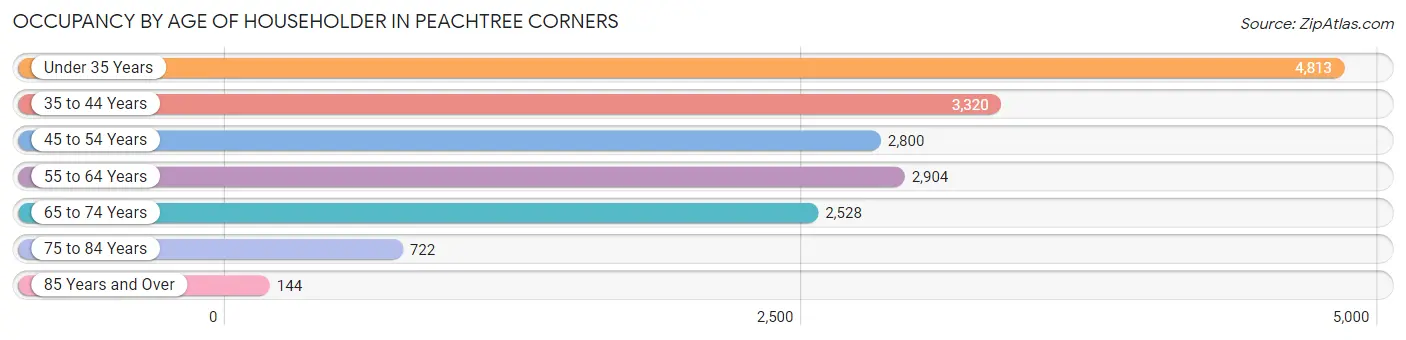
| Age Bracket | # Households | % Households |
| Under 35 Years | 4,813 | 27.9% |
| 35 to 44 Years | 3,320 | 19.3% |
| 45 to 54 Years | 2,800 | 16.3% |
| 55 to 64 Years | 2,904 | 16.9% |
| 65 to 74 Years | 2,528 | 14.7% |
| 75 to 84 Years | 722 | 4.2% |
| 85 Years and Over | 144 | 0.8% |
| Total | 17,231 | 100.0% |
Housing Finances in Peachtree Corners
Median Income by Occupancy in Peachtree Corners
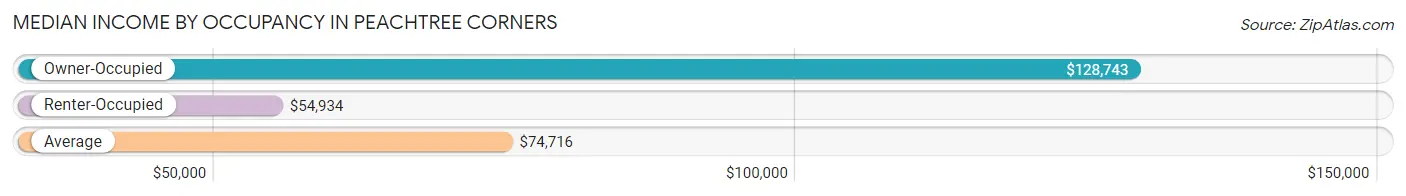
| Occupancy Type | # Households | Median Income |
| Owner-Occupied | 8,739 (50.7%) | $128,743 |
| Renter-Occupied | 8,492 (49.3%) | $54,934 |
| Average | 17,231 (100.0%) | $74,716 |
Occupancy by Householder Income Bracket in Peachtree Corners
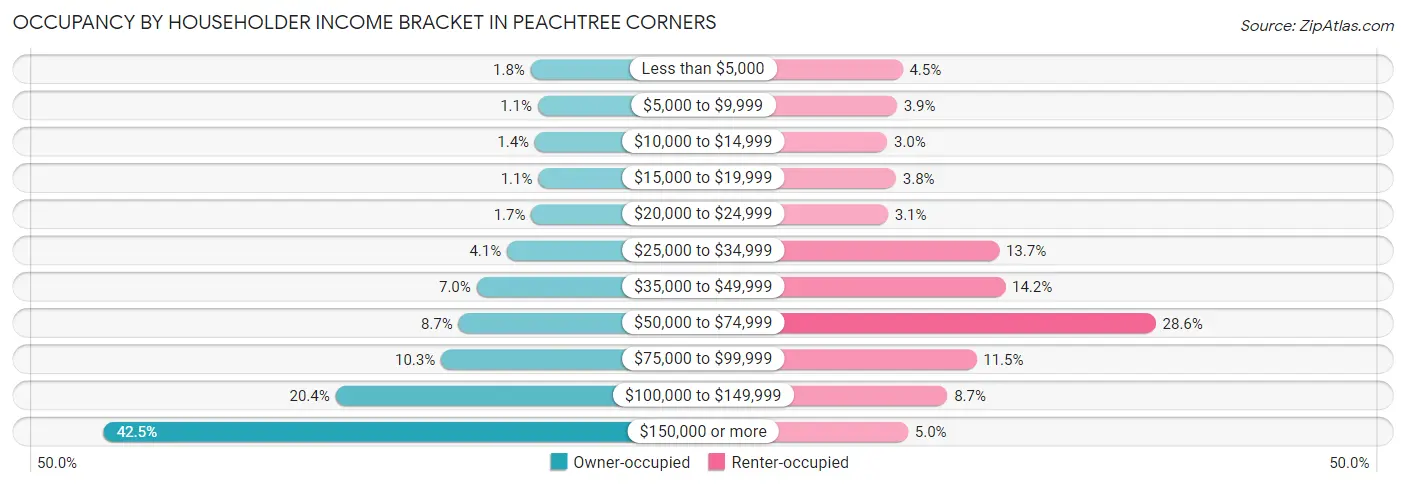
| Income Bracket | Owner-occupied | Renter-occupied |
| Less than $5,000 | 157 (1.8%) | 380 (4.5%) |
| $5,000 to $9,999 | 98 (1.1%) | 333 (3.9%) |
| $10,000 to $14,999 | 122 (1.4%) | 255 (3.0%) |
| $15,000 to $19,999 | 94 (1.1%) | 326 (3.8%) |
| $20,000 to $24,999 | 152 (1.7%) | 261 (3.1%) |
| $25,000 to $34,999 | 354 (4.1%) | 1,160 (13.7%) |
| $35,000 to $49,999 | 607 (7.0%) | 1,209 (14.2%) |
| $50,000 to $74,999 | 758 (8.7%) | 2,427 (28.6%) |
| $75,000 to $99,999 | 904 (10.3%) | 977 (11.5%) |
| $100,000 to $149,999 | 1,782 (20.4%) | 741 (8.7%) |
| $150,000 or more | 3,711 (42.5%) | 423 (5.0%) |
| Total | 8,739 (100.0%) | 8,492 (100.0%) |
Monthly Housing Cost Tiers in Peachtree Corners
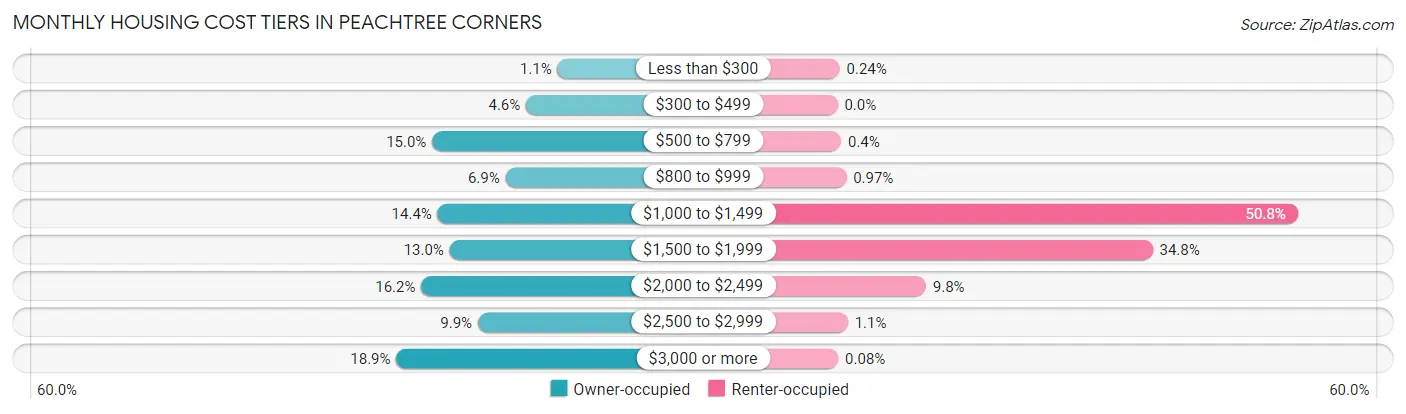
| Monthly Cost | Owner-occupied | Renter-occupied |
| Less than $300 | 98 (1.1%) | 20 (0.2%) |
| $300 to $499 | 402 (4.6%) | 0 (0.0%) |
| $500 to $799 | 1,308 (15.0%) | 34 (0.4%) |
| $800 to $999 | 600 (6.9%) | 82 (1.0%) |
| $1,000 to $1,499 | 1,256 (14.4%) | 4,317 (50.8%) |
| $1,500 to $1,999 | 1,140 (13.0%) | 2,956 (34.8%) |
| $2,000 to $2,499 | 1,414 (16.2%) | 830 (9.8%) |
| $2,500 to $2,999 | 867 (9.9%) | 97 (1.1%) |
| $3,000 or more | 1,654 (18.9%) | 7 (0.1%) |
| Total | 8,739 (100.0%) | 8,492 (100.0%) |
Physical Housing Characteristics in Peachtree Corners
Housing Structures in Peachtree Corners
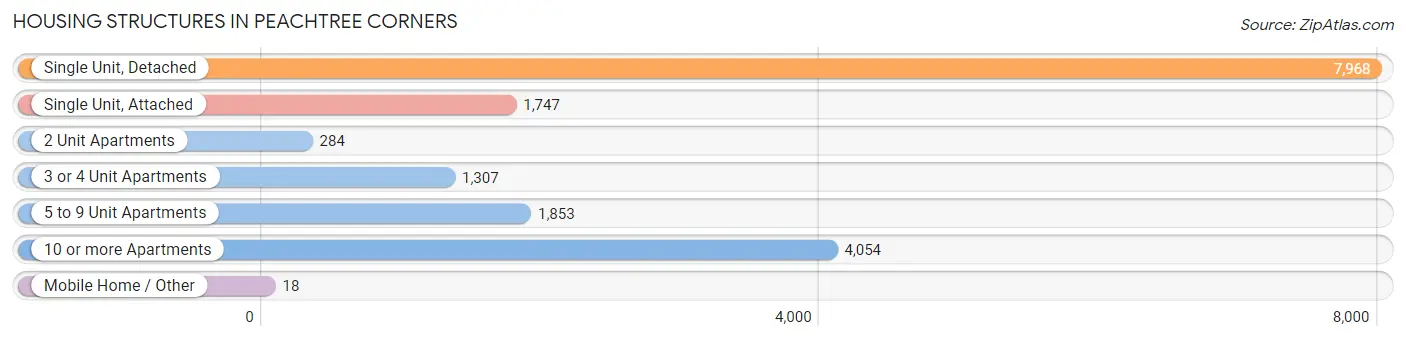
| Structure Type | # Housing Units | % Housing Units |
| Single Unit, Detached | 7,968 | 46.2% |
| Single Unit, Attached | 1,747 | 10.1% |
| 2 Unit Apartments | 284 | 1.7% |
| 3 or 4 Unit Apartments | 1,307 | 7.6% |
| 5 to 9 Unit Apartments | 1,853 | 10.7% |
| 10 or more Apartments | 4,054 | 23.5% |
| Mobile Home / Other | 18 | 0.1% |
| Total | 17,231 | 100.0% |
Housing Structures by Occupancy in Peachtree Corners
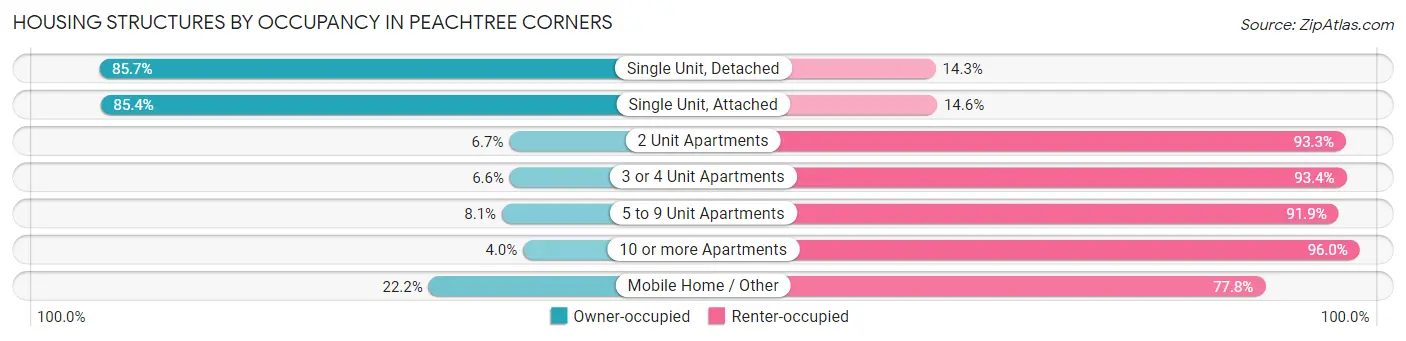
| Structure Type | Owner-occupied | Renter-occupied |
| Single Unit, Detached | 6,825 (85.7%) | 1,143 (14.3%) |
| Single Unit, Attached | 1,492 (85.4%) | 255 (14.6%) |
| 2 Unit Apartments | 19 (6.7%) | 265 (93.3%) |
| 3 or 4 Unit Apartments | 86 (6.6%) | 1,221 (93.4%) |
| 5 to 9 Unit Apartments | 150 (8.1%) | 1,703 (91.9%) |
| 10 or more Apartments | 163 (4.0%) | 3,891 (96.0%) |
| Mobile Home / Other | 4 (22.2%) | 14 (77.8%) |
| Total | 8,739 (50.7%) | 8,492 (49.3%) |
Housing Structures by Number of Rooms in Peachtree Corners
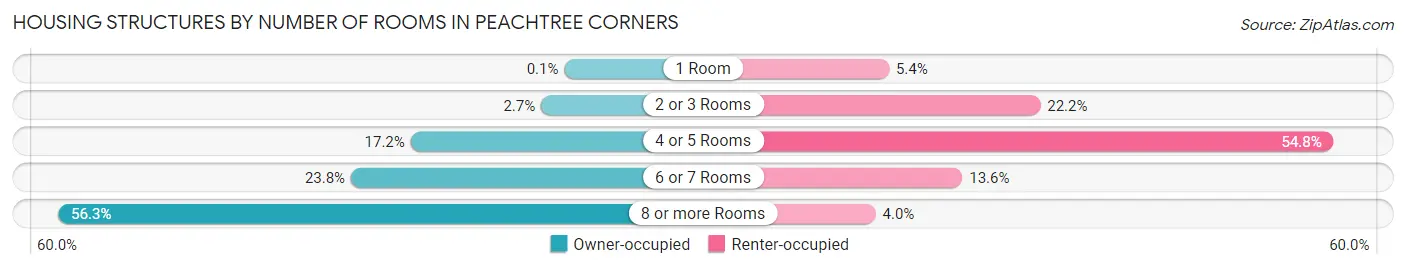
| Number of Rooms | Owner-occupied | Renter-occupied |
| 1 Room | 9 (0.1%) | 462 (5.4%) |
| 2 or 3 Rooms | 234 (2.7%) | 1,889 (22.2%) |
| 4 or 5 Rooms | 1,500 (17.2%) | 4,652 (54.8%) |
| 6 or 7 Rooms | 2,078 (23.8%) | 1,153 (13.6%) |
| 8 or more Rooms | 4,918 (56.3%) | 336 (4.0%) |
| Total | 8,739 (100.0%) | 8,492 (100.0%) |
Housing Structure by Heating Type in Peachtree Corners
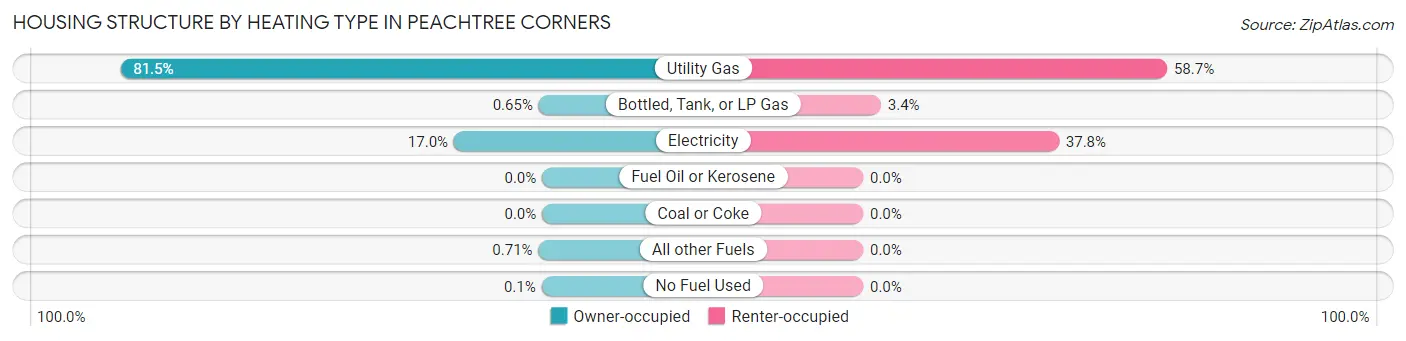
| Heating Type | Owner-occupied | Renter-occupied |
| Utility Gas | 7,122 (81.5%) | 4,987 (58.7%) |
| Bottled, Tank, or LP Gas | 57 (0.6%) | 292 (3.4%) |
| Electricity | 1,489 (17.0%) | 3,213 (37.8%) |
| Fuel Oil or Kerosene | 0 (0.0%) | 0 (0.0%) |
| Coal or Coke | 0 (0.0%) | 0 (0.0%) |
| All other Fuels | 62 (0.7%) | 0 (0.0%) |
| No Fuel Used | 9 (0.1%) | 0 (0.0%) |
| Total | 8,739 (100.0%) | 8,492 (100.0%) |
Household Vehicle Usage in Peachtree Corners
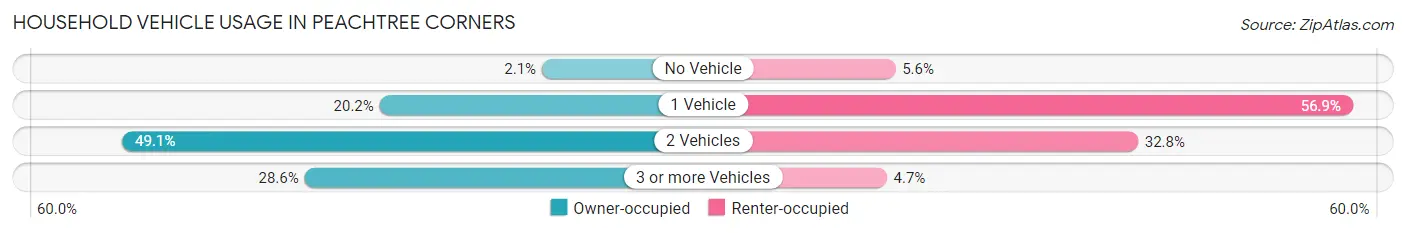
| Vehicles per Household | Owner-occupied | Renter-occupied |
| No Vehicle | 179 (2.1%) | 478 (5.6%) |
| 1 Vehicle | 1,768 (20.2%) | 4,831 (56.9%) |
| 2 Vehicles | 4,289 (49.1%) | 2,786 (32.8%) |
| 3 or more Vehicles | 2,503 (28.6%) | 397 (4.7%) |
| Total | 8,739 (100.0%) | 8,492 (100.0%) |
Real Estate & Mortgages in Peachtree Corners
Real Estate and Mortgage Overview in Peachtree Corners
| Characteristic | Without Mortgage | With Mortgage |
| Housing Units | 2,817 | 5,922 |
| Median Property Value | $434,900 | $448,100 |
| Median Household Income | $88,011 | $2,838 |
| Monthly Housing Costs | $710 | $1,654 |
| Real Estate Taxes | $2,802 | $38 |
Property Value by Mortgage Status in Peachtree Corners
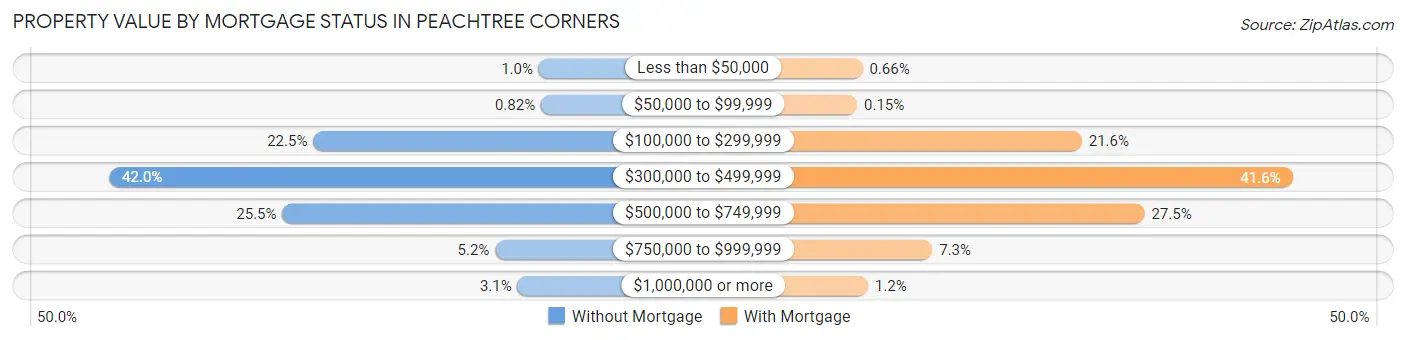
| Property Value | Without Mortgage | With Mortgage |
| Less than $50,000 | 29 (1.0%) | 39 (0.7%) |
| $50,000 to $99,999 | 23 (0.8%) | 9 (0.2%) |
| $100,000 to $299,999 | 634 (22.5%) | 1,276 (21.5%) |
| $300,000 to $499,999 | 1,182 (42.0%) | 2,465 (41.6%) |
| $500,000 to $749,999 | 717 (25.5%) | 1,630 (27.5%) |
| $750,000 to $999,999 | 146 (5.2%) | 433 (7.3%) |
| $1,000,000 or more | 86 (3.0%) | 70 (1.2%) |
| Total | 2,817 (100.0%) | 5,922 (100.0%) |
Household Income by Mortgage Status in Peachtree Corners
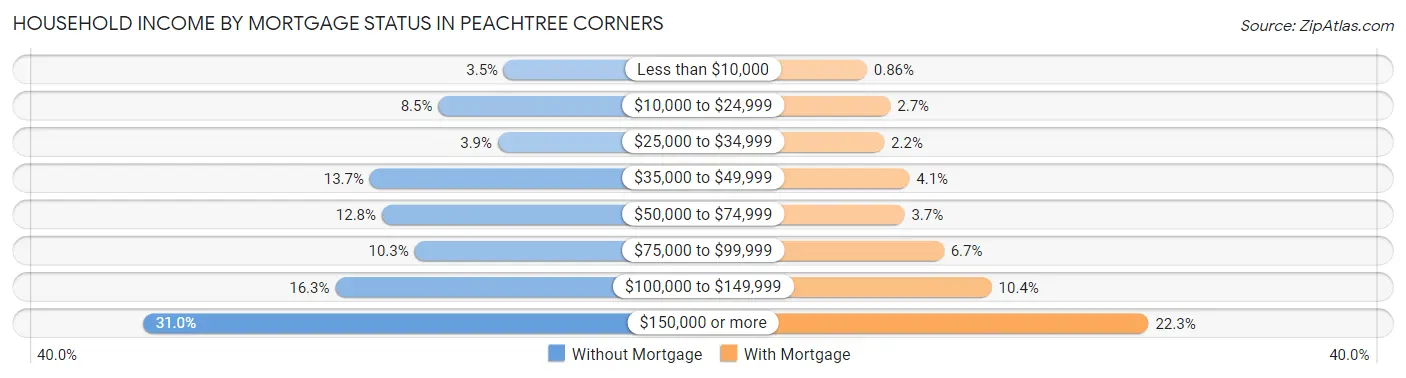
| Household Income | Without Mortgage | With Mortgage |
| Less than $10,000 | 98 (3.5%) | 51 (0.9%) |
| $10,000 to $24,999 | 239 (8.5%) | 157 (2.6%) |
| $25,000 to $34,999 | 111 (3.9%) | 129 (2.2%) |
| $35,000 to $49,999 | 386 (13.7%) | 243 (4.1%) |
| $50,000 to $74,999 | 360 (12.8%) | 221 (3.7%) |
| $75,000 to $99,999 | 290 (10.3%) | 398 (6.7%) |
| $100,000 to $149,999 | 460 (16.3%) | 614 (10.4%) |
| $150,000 or more | 873 (31.0%) | 1,322 (22.3%) |
| Total | 2,817 (100.0%) | 5,922 (100.0%) |
Property Value to Household Income Ratio in Peachtree Corners
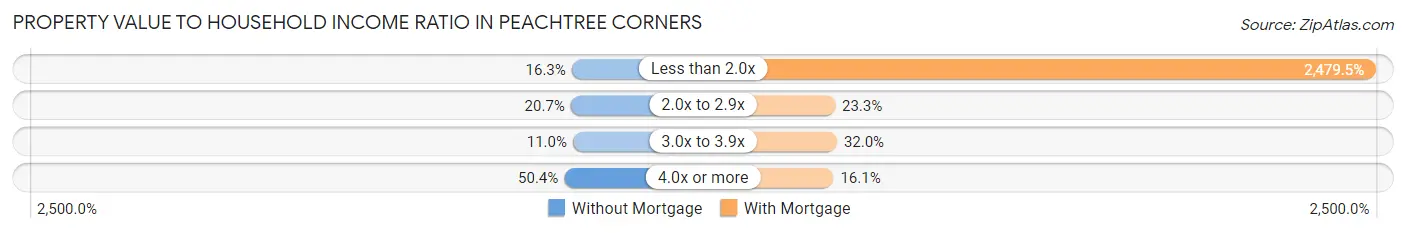
| Value-to-Income Ratio | Without Mortgage | With Mortgage |
| Less than 2.0x | 460 (16.3%) | 146,836 (2,479.5%) |
| 2.0x to 2.9x | 583 (20.7%) | 1,378 (23.3%) |
| 3.0x to 3.9x | 309 (11.0%) | 1,892 (32.0%) |
| 4.0x or more | 1,420 (50.4%) | 956 (16.1%) |
| Total | 2,817 (100.0%) | 5,922 (100.0%) |
Real Estate Taxes by Mortgage Status in Peachtree Corners
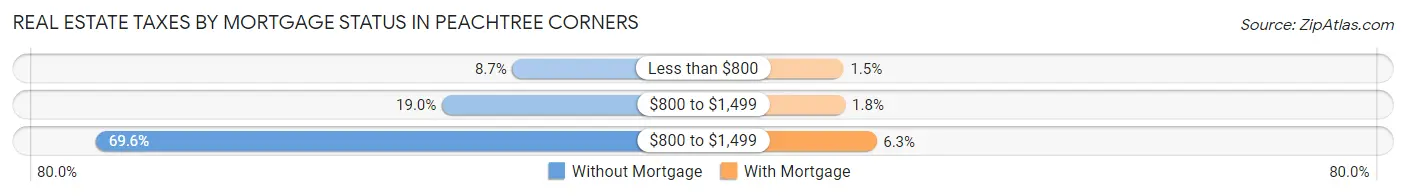
| Property Taxes | Without Mortgage | With Mortgage |
| Less than $800 | 245 (8.7%) | 90 (1.5%) |
| $800 to $1,499 | 535 (19.0%) | 105 (1.8%) |
| $800 to $1,499 | 1,960 (69.6%) | 374 (6.3%) |
| Total | 2,817 (100.0%) | 5,922 (100.0%) |
Health & Disability in Peachtree Corners
Health Insurance Coverage by Age in Peachtree Corners
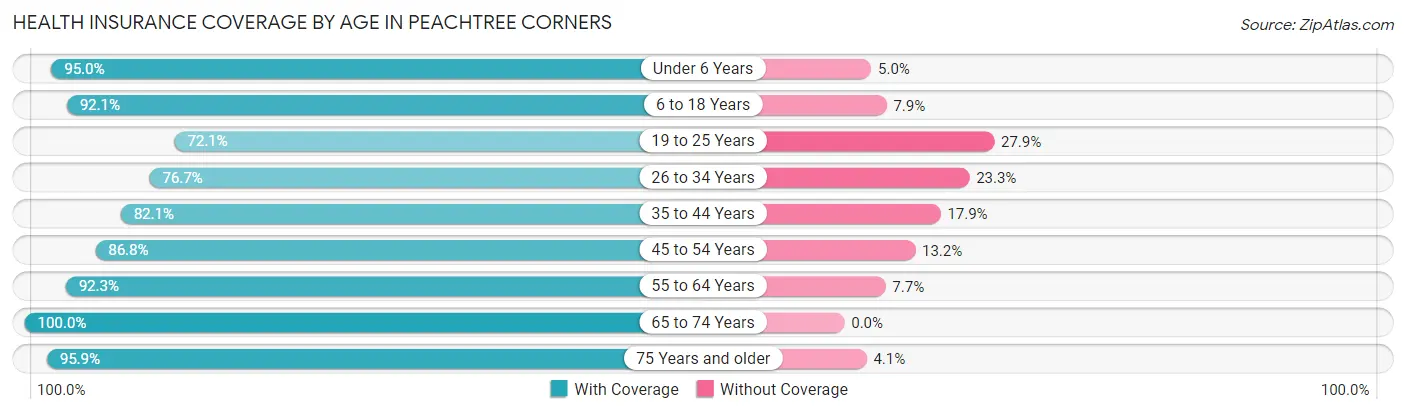
| Age Bracket | With Coverage | Without Coverage |
| Under 6 Years | 3,123 (95.0%) | 164 (5.0%) |
| 6 to 18 Years | 6,287 (92.1%) | 536 (7.9%) |
| 19 to 25 Years | 3,439 (72.1%) | 1,333 (27.9%) |
| 26 to 34 Years | 4,574 (76.7%) | 1,389 (23.3%) |
| 35 to 44 Years | 4,615 (82.1%) | 1,008 (17.9%) |
| 45 to 54 Years | 4,297 (86.8%) | 653 (13.2%) |
| 55 to 64 Years | 4,840 (92.3%) | 402 (7.7%) |
| 65 to 74 Years | 3,991 (100.0%) | 0 (0.0%) |
| 75 Years and older | 1,434 (95.9%) | 62 (4.1%) |
| Total | 36,600 (86.8%) | 5,547 (13.2%) |
Health Insurance Coverage by Citizenship Status in Peachtree Corners
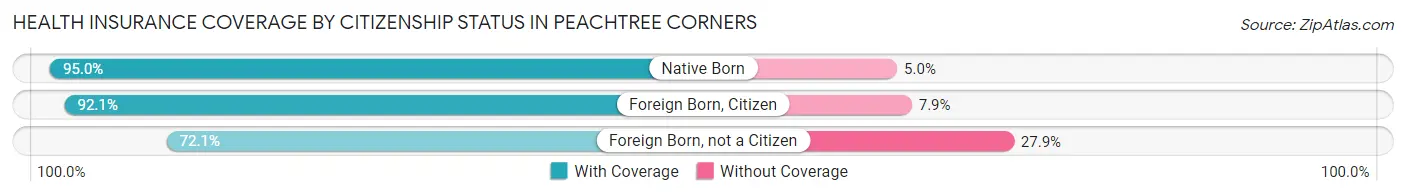
| Citizenship Status | With Coverage | Without Coverage |
| Native Born | 3,123 (95.0%) | 164 (5.0%) |
| Foreign Born, Citizen | 6,287 (92.1%) | 536 (7.9%) |
| Foreign Born, not a Citizen | 3,439 (72.1%) | 1,333 (27.9%) |
Health Insurance Coverage by Household Income in Peachtree Corners
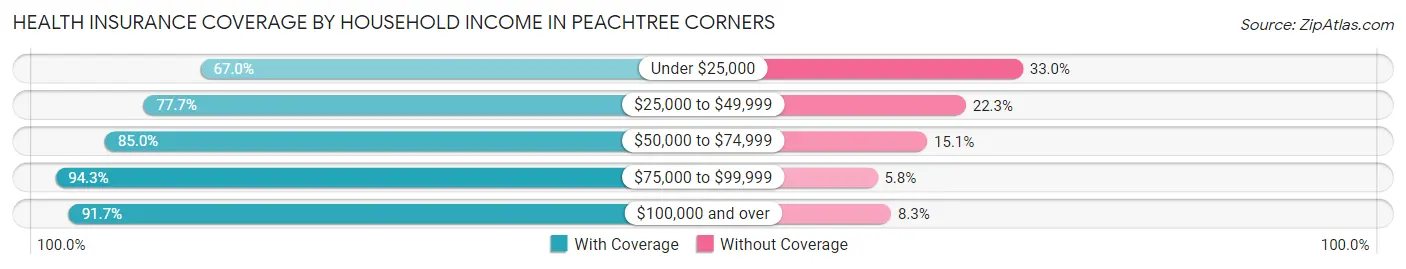
| Household Income | With Coverage | Without Coverage |
| Under $25,000 | 2,239 (67.0%) | 1,102 (33.0%) |
| $25,000 to $49,999 | 4,566 (77.7%) | 1,310 (22.3%) |
| $50,000 to $74,999 | 6,569 (85.0%) | 1,164 (15.0%) |
| $75,000 to $99,999 | 4,248 (94.3%) | 259 (5.8%) |
| $100,000 and over | 18,971 (91.7%) | 1,710 (8.3%) |
Public vs Private Health Insurance Coverage by Age in Peachtree Corners
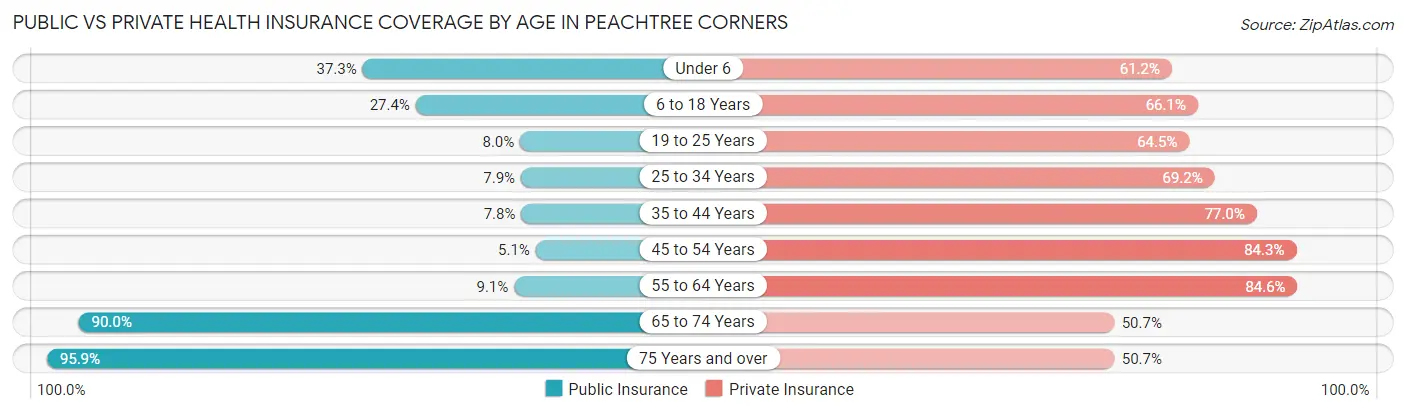
| Age Bracket | Public Insurance | Private Insurance |
| Under 6 | 1,225 (37.3%) | 2,013 (61.2%) |
| 6 to 18 Years | 1,870 (27.4%) | 4,507 (66.1%) |
| 19 to 25 Years | 383 (8.0%) | 3,077 (64.5%) |
| 25 to 34 Years | 470 (7.9%) | 4,126 (69.2%) |
| 35 to 44 Years | 439 (7.8%) | 4,330 (77.0%) |
| 45 to 54 Years | 254 (5.1%) | 4,175 (84.3%) |
| 55 to 64 Years | 479 (9.1%) | 4,433 (84.6%) |
| 65 to 74 Years | 3,591 (90.0%) | 2,022 (50.7%) |
| 75 Years and over | 1,434 (95.9%) | 758 (50.7%) |
| Total | 10,145 (24.1%) | 29,441 (69.9%) |
Disability Status by Sex by Age in Peachtree Corners
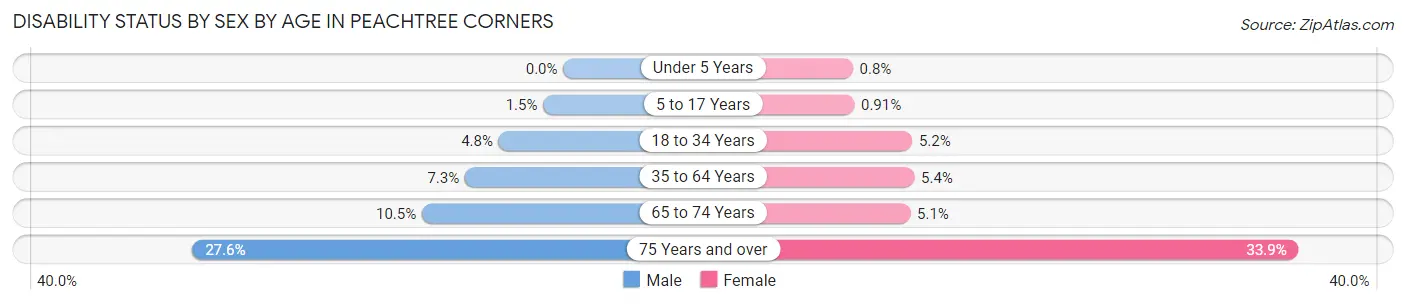
| Age Bracket | Male | Female |
| Under 5 Years | 0 (0.0%) | 12 (0.8%) |
| 5 to 17 Years | 52 (1.5%) | 31 (0.9%) |
| 18 to 34 Years | 268 (4.8%) | 293 (5.2%) |
| 35 to 64 Years | 578 (7.3%) | 424 (5.4%) |
| 65 to 74 Years | 166 (10.5%) | 122 (5.1%) |
| 75 Years and over | 205 (27.6%) | 255 (33.9%) |
Disability Class by Sex by Age in Peachtree Corners
Disability Class: Hearing Difficulty
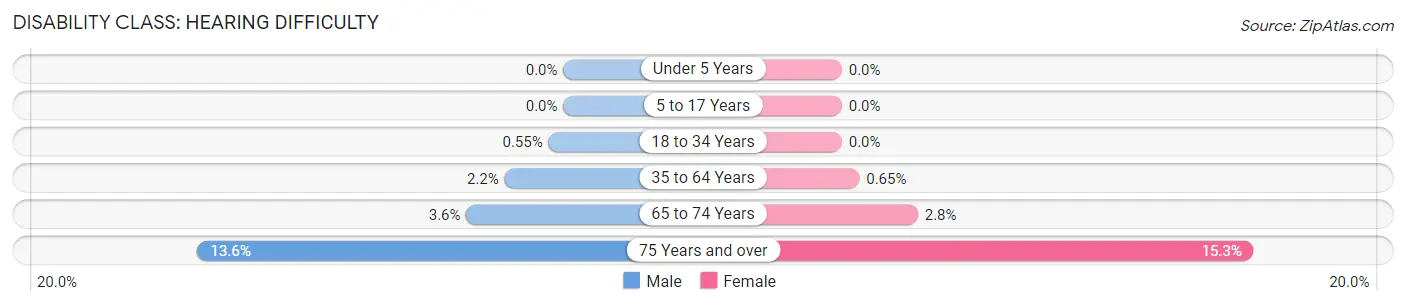
| Age Bracket | Male | Female |
| Under 5 Years | 0 (0.0%) | 0 (0.0%) |
| 5 to 17 Years | 0 (0.0%) | 0 (0.0%) |
| 18 to 34 Years | 31 (0.5%) | 0 (0.0%) |
| 35 to 64 Years | 173 (2.2%) | 51 (0.6%) |
| 65 to 74 Years | 57 (3.6%) | 68 (2.8%) |
| 75 Years and over | 101 (13.6%) | 115 (15.3%) |
Disability Class: Vision Difficulty
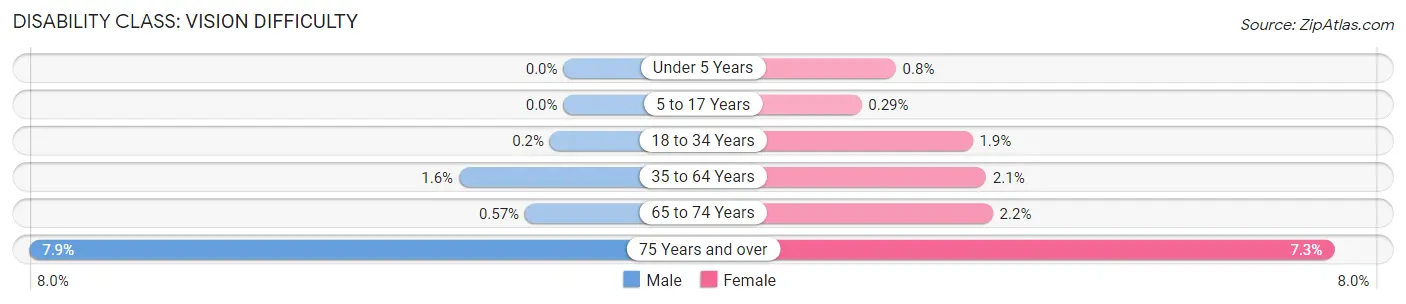
| Age Bracket | Male | Female |
| Under 5 Years | 0 (0.0%) | 12 (0.8%) |
| 5 to 17 Years | 0 (0.0%) | 10 (0.3%) |
| 18 to 34 Years | 11 (0.2%) | 109 (1.9%) |
| 35 to 64 Years | 123 (1.5%) | 169 (2.1%) |
| 65 to 74 Years | 9 (0.6%) | 54 (2.2%) |
| 75 Years and over | 59 (7.9%) | 55 (7.3%) |
Disability Class: Cognitive Difficulty
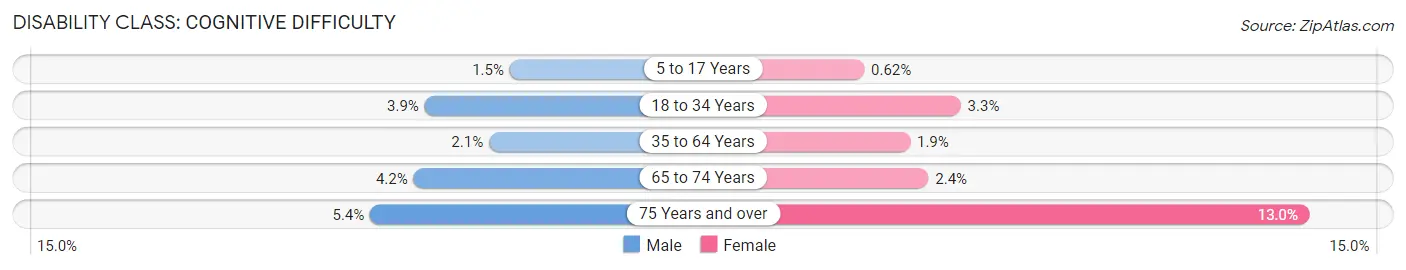
| Age Bracket | Male | Female |
| 5 to 17 Years | 52 (1.5%) | 21 (0.6%) |
| 18 to 34 Years | 216 (3.9%) | 186 (3.3%) |
| 35 to 64 Years | 164 (2.1%) | 150 (1.9%) |
| 65 to 74 Years | 66 (4.2%) | 58 (2.4%) |
| 75 Years and over | 40 (5.4%) | 98 (13.0%) |
Disability Class: Ambulatory Difficulty
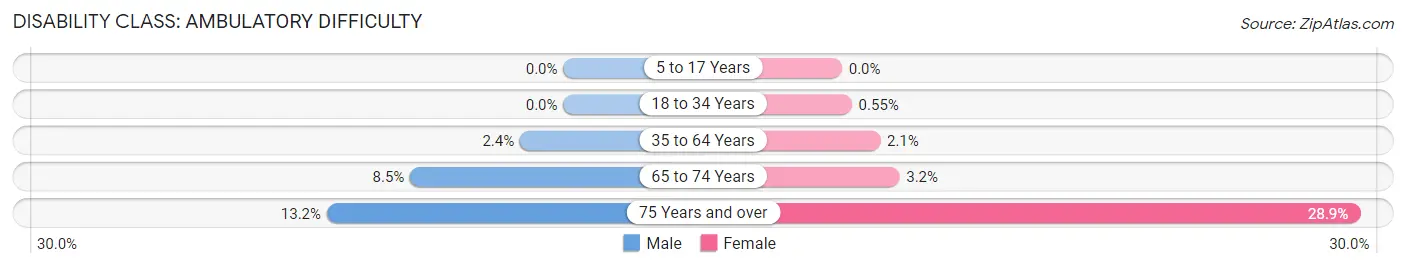
| Age Bracket | Male | Female |
| 5 to 17 Years | 0 (0.0%) | 0 (0.0%) |
| 18 to 34 Years | 0 (0.0%) | 31 (0.5%) |
| 35 to 64 Years | 191 (2.4%) | 168 (2.1%) |
| 65 to 74 Years | 135 (8.5%) | 77 (3.2%) |
| 75 Years and over | 98 (13.2%) | 217 (28.9%) |
Disability Class: Self-Care Difficulty
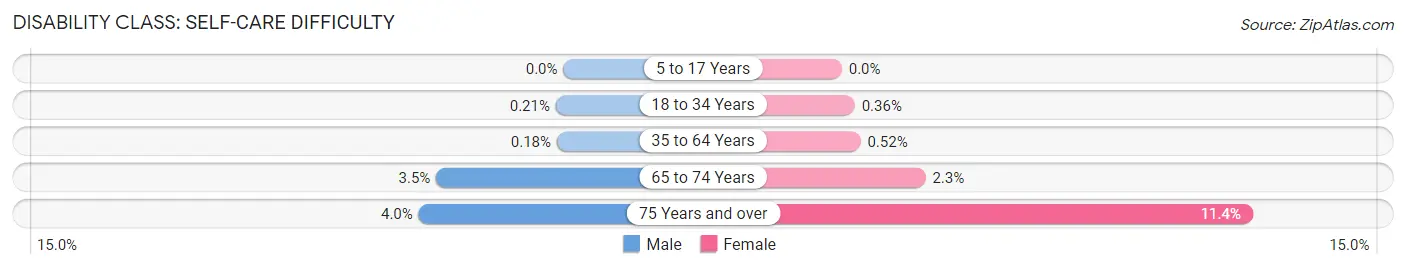
| Age Bracket | Male | Female |
| 5 to 17 Years | 0 (0.0%) | 0 (0.0%) |
| 18 to 34 Years | 12 (0.2%) | 20 (0.4%) |
| 35 to 64 Years | 14 (0.2%) | 41 (0.5%) |
| 65 to 74 Years | 56 (3.5%) | 56 (2.3%) |
| 75 Years and over | 30 (4.0%) | 86 (11.4%) |
Technology Access in Peachtree Corners
Computing Device Access in Peachtree Corners
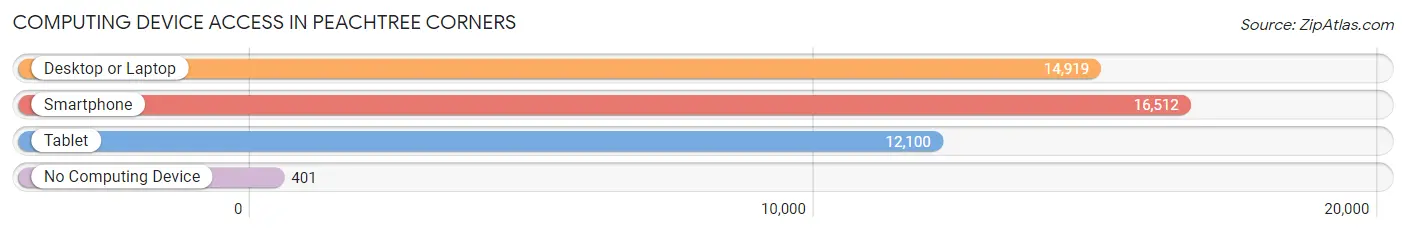
| Device Type | # Households | % Households |
| Desktop or Laptop | 14,919 | 86.6% |
| Smartphone | 16,512 | 95.8% |
| Tablet | 12,100 | 70.2% |
| No Computing Device | 401 | 2.3% |
| Total | 17,231 | 100.0% |
Internet Access in Peachtree Corners
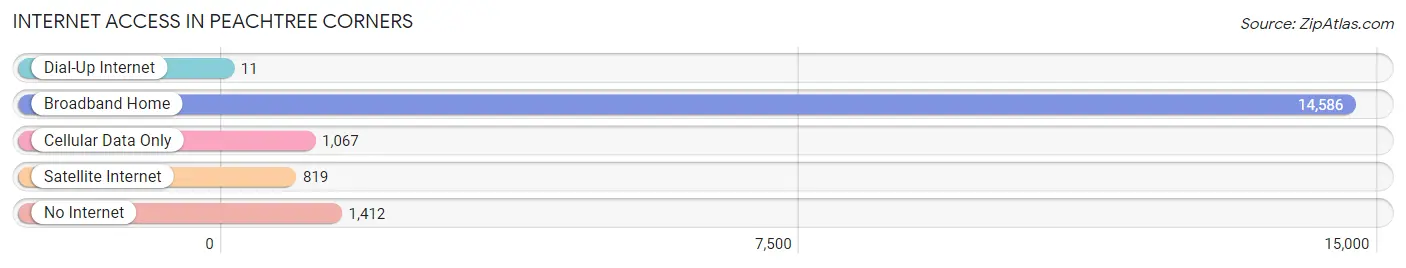
| Internet Type | # Households | % Households |
| Dial-Up Internet | 11 | 0.1% |
| Broadband Home | 14,586 | 84.7% |
| Cellular Data Only | 1,067 | 6.2% |
| Satellite Internet | 819 | 4.8% |
| No Internet | 1,412 | 8.2% |
| Total | 17,231 | 100.0% |
Peachtree Corners Summary
Peachtree Corners is a city located in the northern part of Gwinnett County, Georgia, United States. It is the largest city in Gwinnett County and the second largest city in the Atlanta metropolitan area. The city was incorporated in 2012 and is the first city in Gwinnett County to be incorporated since the late 1800s.
History
Peachtree Corners was originally part of the Creek Indian territory. The area was first settled in the early 1800s by European settlers. The area was known as Pinckneyville until the late 1800s when it was renamed Peachtree Corners. The name was chosen to reflect the abundance of peach trees in the area.
In the late 1800s, the area was developed as a farming community. The area was home to several large farms, including the Peachtree Corners Plantation. The plantation was owned by the family of William H. Felton, who served as a U.S. Congressman from Georgia from 1877 to 1881.
In the early 1900s, the area began to experience rapid growth as the city of Atlanta expanded. The area was annexed by the city of Atlanta in 1952. In the late 1950s, the area began to experience suburban growth as the city of Atlanta continued to expand.
In the late 1970s, the area was annexed by the city of Norcross. In the early 1980s, the area began to experience rapid growth as the city of Norcross continued to expand. In 2012, the area was incorporated as the city of Peachtree Corners.
Geography
Peachtree Corners is located in the northern part of Gwinnett County, Georgia. It is bordered by the cities of Norcross to the north, Duluth to the east, and Berkeley Lake to the south. The city is located approximately 25 miles northeast of downtown Atlanta.
The city has a total area of 11.2 square miles, of which 11.1 square miles is land and 0.1 square miles is water. The city is located in the Piedmont region of Georgia and is part of the Atlanta metropolitan area.
Economy
Peachtree Corners is home to a variety of businesses and industries. The city is home to several corporate headquarters, including NCR Corporation, Primerica, and Siemens. The city is also home to several technology companies, including AT&T, Cisco Systems, and Microsoft.
The city is home to several shopping centers, including The Forum at Peachtree Corners and The Collection at Peachtree Corners. The city is also home to several restaurants, including The Spotted Trotter, The Local, and The Optimist.
Demographics
As of the 2010 census, the city had a population of 40,059. The racial makeup of the city was 68.2% White, 16.3% African American, 0.3% Native American, 8.7% Asian, 0.1% Pacific Islander, 3.2% from other races, and 3.4% from two or more races. Hispanic or Latino of any race were 8.7% of the population.
The median income for a household in the city was $76,845 and the median income for a family was $86,845. The per capita income for the city was $37,845. About 4.2% of families and 5.3% of the population were below the poverty line, including 6.2% of those under age 18 and 4.2% of those age 65 or over.
Common Questions
What is Per Capita Income in Peachtree Corners?
Per Capita income in Peachtree Corners is $48,523.
What is the Median Family Income in Peachtree Corners?
Median Family Income in Peachtree Corners is $103,080.
What is the Median Household income in Peachtree Corners?
Median Household Income in Peachtree Corners is $74,716.
What is Income or Wage Gap in Peachtree Corners?
Income or Wage Gap in Peachtree Corners is 25.9%.
Women in Peachtree Corners earn 74.1 cents for every dollar earned by a man.
What is Family Income Deficit in Peachtree Corners?
Family Income Deficit in Peachtree Corners is $9,471.
Families that are below poverty line in Peachtree Corners earn $9,471 less on average than the poverty threshold level.
What is Inequality or Gini Index in Peachtree Corners?
Inequality or Gini Index in Peachtree Corners is 0.50.
What is the Total Population of Peachtree Corners?
Total Population of Peachtree Corners is 42,147.
What is the Total Male Population of Peachtree Corners?
Total Male Population of Peachtree Corners is 20,575.
What is the Total Female Population of Peachtree Corners?
Total Female Population of Peachtree Corners is 21,572.
What is the Ratio of Males per 100 Females in Peachtree Corners?
There are 95.38 Males per 100 Females in Peachtree Corners.
What is the Ratio of Females per 100 Males in Peachtree Corners?
There are 104.85 Females per 100 Males in Peachtree Corners.
What is the Median Population Age in Peachtree Corners?
Median Population Age in Peachtree Corners is 35.5 Years.
What is the Average Family Size in Peachtree Corners
Average Family Size in Peachtree Corners is 3.1 People.
What is the Average Household Size in Peachtree Corners
Average Household Size in Peachtree Corners is 2.5 People.
How Large is the Labor Force in Peachtree Corners?
There are 23,275 People in the Labor Forcein in Peachtree Corners.
What is the Percentage of People in the Labor Force in Peachtree Corners?
69.4% of People are in the Labor Force in Peachtree Corners.
What is the Unemployment Rate in Peachtree Corners?
Unemployment Rate in Peachtree Corners is 3.3%.