Talahi Island, GA Map & Demographics
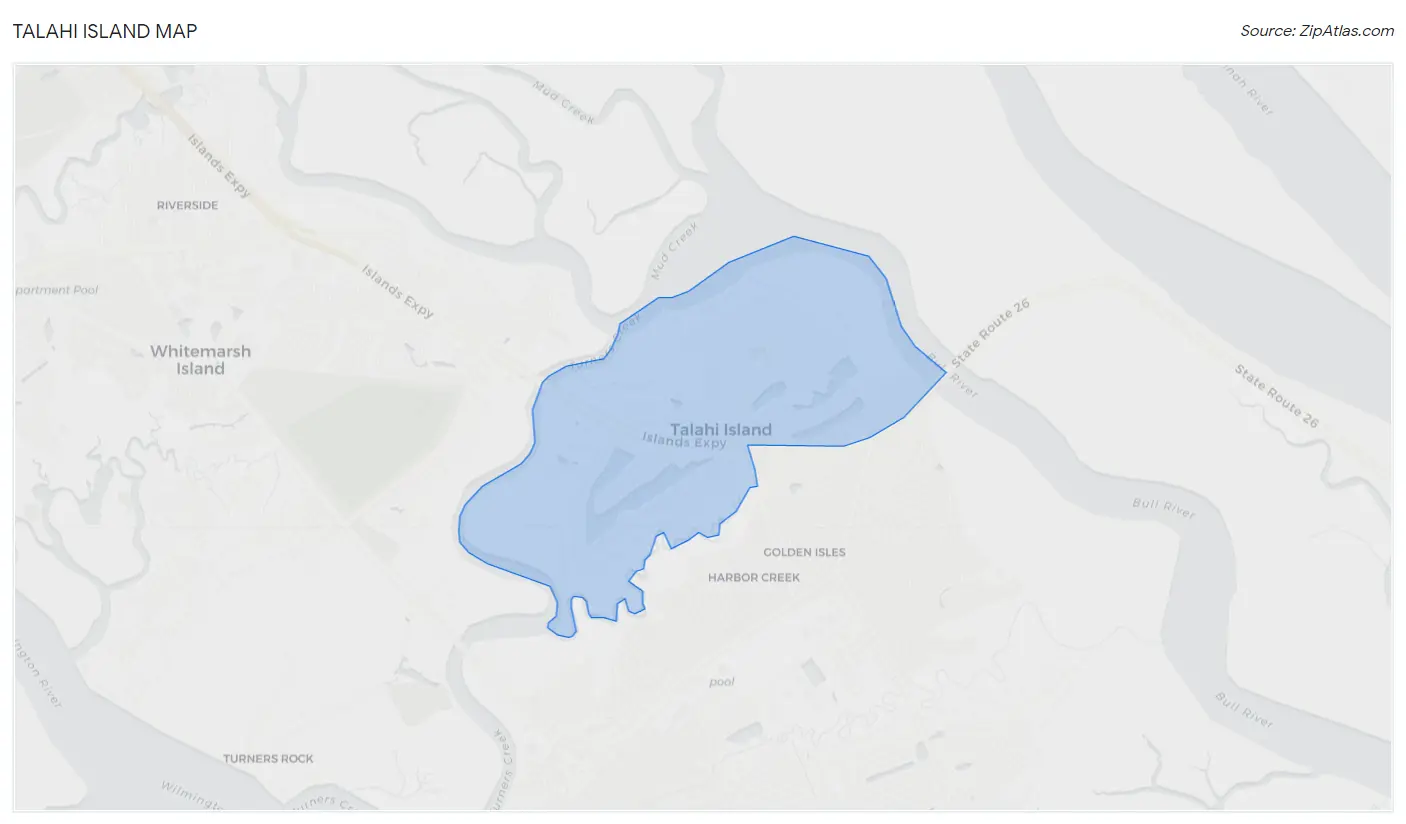
Talahi Island Map
Talahi Island Overview
$53,410
PER CAPITA INCOME
$89,028
AVG FAMILY INCOME
$104,625
AVG HOUSEHOLD INCOME
34.7%
WAGE / INCOME GAP [ % ]
65.3¢/ $1
WAGE / INCOME GAP [ $ ]
0.36
INEQUALITY / GINI INDEX
1,185
TOTAL POPULATION
469
MALE POPULATION
716
FEMALE POPULATION
65.50
MALES / 100 FEMALES
152.67
FEMALES / 100 MALES
51.6
MEDIAN AGE
2.5
AVG FAMILY SIZE
2.3
AVG HOUSEHOLD SIZE
704
LABOR FORCE [ PEOPLE ]
67.2%
PERCENT IN LABOR FORCE
Income in Talahi Island
Income Overview in Talahi Island
Per Capita Income in Talahi Island is $53,410, while median incomes of families and households are $89,028 and $104,625 respectively.
| Characteristic | Number | Measure |
| Per Capita Income | 1,185 | $53,410 |
| Median Family Income | 434 | $89,028 |
| Mean Family Income | 434 | $124,577 |
| Median Household Income | 507 | $104,625 |
| Mean Household Income | 507 | $123,910 |
| Income Deficit | 434 | $0 |
| Wage / Income Gap (%) | 1,185 | 34.72% |
| Wage / Income Gap ($) | 1,185 | 65.28¢ per $1 |
| Gini / Inequality Index | 1,185 | 0.36 |
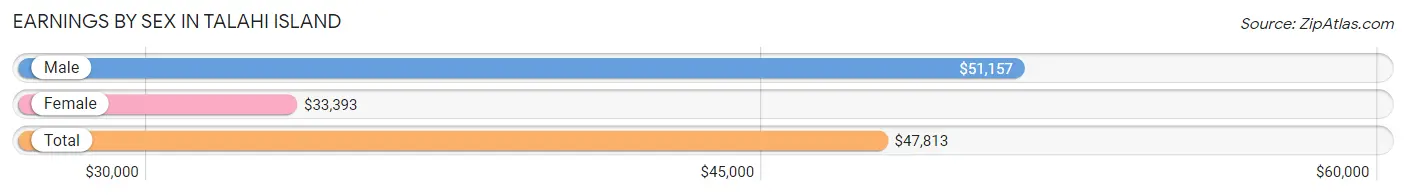
Earnings by Sex in Talahi Island
Average Earnings in Talahi Island are $47,813, $51,157 for men and $33,393 for women, a difference of 34.7%.
| Sex | Number | Average Earnings |
| Male | 310 (43.2%) | $51,157 |
| Female | 407 (56.8%) | $33,393 |
| Total | 717 (100.0%) | $47,813 |
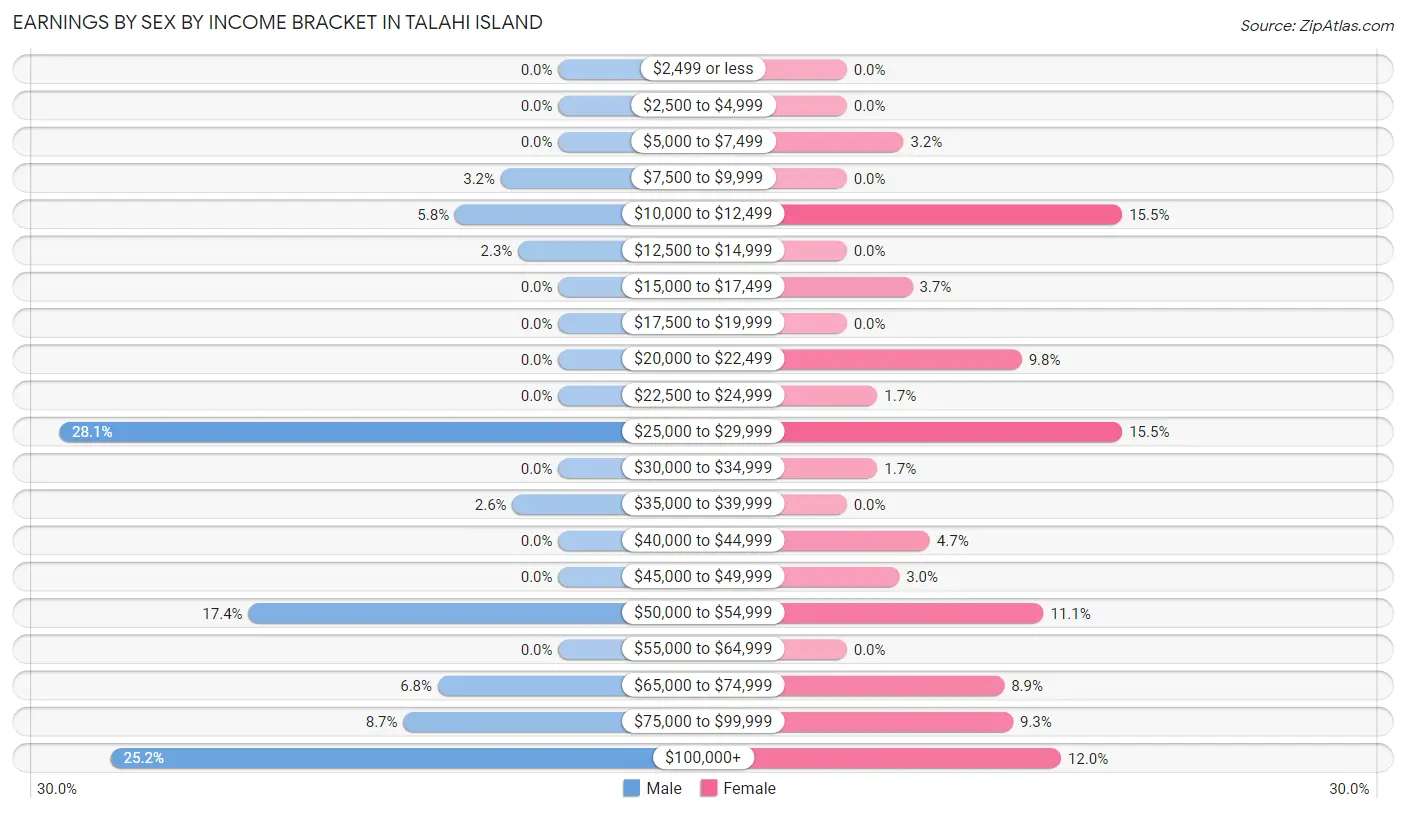
Earnings by Sex by Income Bracket in Talahi Island
The most common earnings brackets in Talahi Island are $25,000 to $29,999 for men (87 | 28.1%) and $10,000 to $12,499 for women (63 | 15.5%).
| Income | Male | Female |
| $2,499 or less | 0 (0.0%) | 0 (0.0%) |
| $2,500 to $4,999 | 0 (0.0%) | 0 (0.0%) |
| $5,000 to $7,499 | 0 (0.0%) | 13 (3.2%) |
| $7,500 to $9,999 | 10 (3.2%) | 0 (0.0%) |
| $10,000 to $12,499 | 18 (5.8%) | 63 (15.5%) |
| $12,500 to $14,999 | 7 (2.3%) | 0 (0.0%) |
| $15,000 to $17,499 | 0 (0.0%) | 15 (3.7%) |
| $17,500 to $19,999 | 0 (0.0%) | 0 (0.0%) |
| $20,000 to $22,499 | 0 (0.0%) | 40 (9.8%) |
| $22,500 to $24,999 | 0 (0.0%) | 7 (1.7%) |
| $25,000 to $29,999 | 87 (28.1%) | 63 (15.5%) |
| $30,000 to $34,999 | 0 (0.0%) | 7 (1.7%) |
| $35,000 to $39,999 | 8 (2.6%) | 0 (0.0%) |
| $40,000 to $44,999 | 0 (0.0%) | 19 (4.7%) |
| $45,000 to $49,999 | 0 (0.0%) | 12 (2.9%) |
| $50,000 to $54,999 | 54 (17.4%) | 45 (11.1%) |
| $55,000 to $64,999 | 0 (0.0%) | 0 (0.0%) |
| $65,000 to $74,999 | 21 (6.8%) | 36 (8.8%) |
| $75,000 to $99,999 | 27 (8.7%) | 38 (9.3%) |
| $100,000+ | 78 (25.2%) | 49 (12.0%) |
| Total | 310 (100.0%) | 407 (100.0%) |
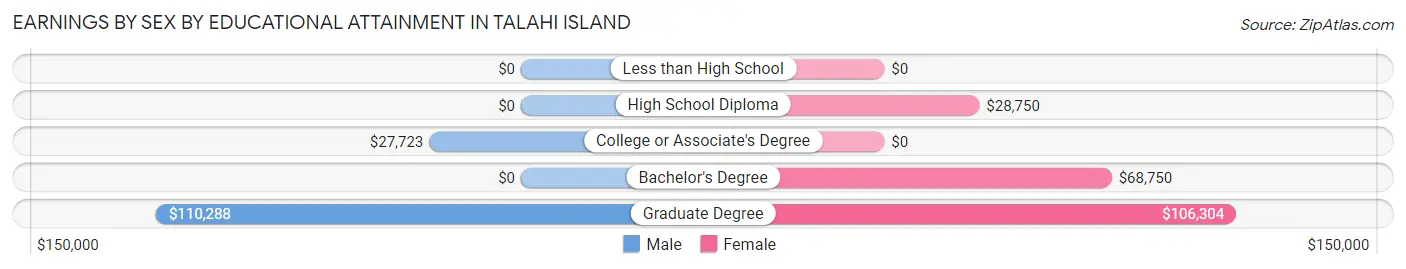
Earnings by Sex by Educational Attainment in Talahi Island
Average earnings in Talahi Island are $51,157 for men and $52,533 for women, a difference of 2.6%. Men with an educational attainment of graduate degree enjoy the highest average annual earnings of $110,288, while those with college or associate's degree education earn the least with $27,723. Women with an educational attainment of graduate degree earn the most with the average annual earnings of $106,304, while those with high school diploma education have the smallest earnings of $28,750.
| Educational Attainment | Male Income | Female Income |
| Less than High School | - | - |
| High School Diploma | - | - |
| College or Associate's Degree | $27,723 | $0 |
| Bachelor's Degree | - | - |
| Graduate Degree | $110,288 | $106,304 |
| Total | $51,157 | $52,533 |
Family Income in Talahi Island
Family Income Brackets in Talahi Island
According to the Talahi Island family income data, there are 96 families falling into the $50,000 to $74,999 income range, which is the most common income bracket and makes up 22.1% of all families.
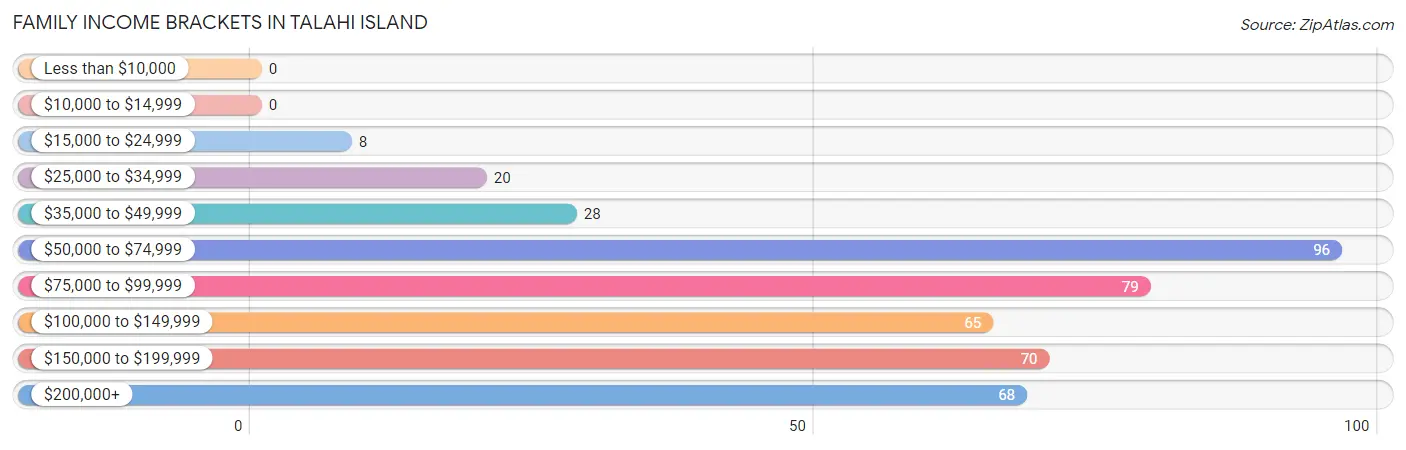
| Income Bracket | # Families | % Families |
| Less than $10,000 | 0 | 0.0% |
| $10,000 to $14,999 | 0 | 0.0% |
| $15,000 to $24,999 | 8 | 1.8% |
| $25,000 to $34,999 | 20 | 4.6% |
| $35,000 to $49,999 | 28 | 6.5% |
| $50,000 to $74,999 | 96 | 22.1% |
| $75,000 to $99,999 | 79 | 18.2% |
| $100,000 to $149,999 | 65 | 15.0% |
| $150,000 to $199,999 | 70 | 16.1% |
| $200,000+ | 68 | 15.7% |
Family Income by Famaliy Size in Talahi Island
4-person families (40 | 9.2%) account for the highest median family income in Talahi Island with $245,000 per family, while 4-person families (40 | 9.2%) have the highest median income of $61,250 per family member.
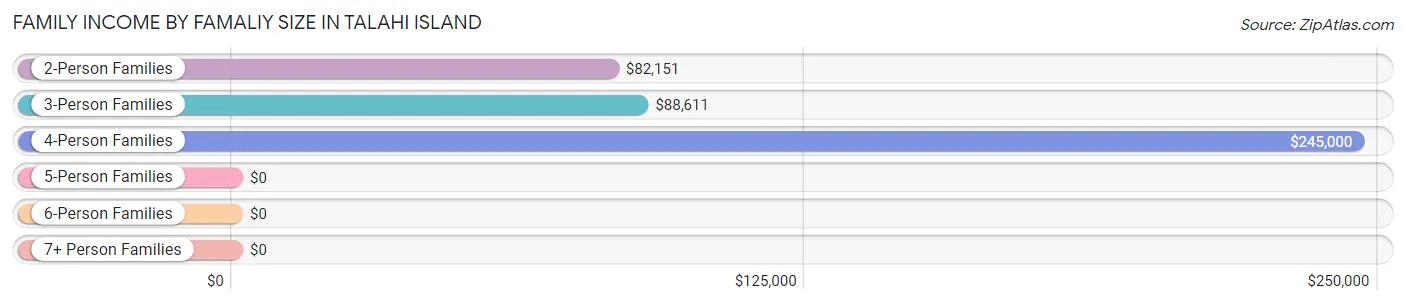
| Income Bracket | # Families | Median Income |
| 2-Person Families | 322 (74.2%) | $82,151 |
| 3-Person Families | 72 (16.6%) | $88,611 |
| 4-Person Families | 40 (9.2%) | $245,000 |
| 5-Person Families | 0 (0.0%) | $0 |
| 6-Person Families | 0 (0.0%) | $0 |
| 7+ Person Families | 0 (0.0%) | $0 |
| Total | 434 (100.0%) | $89,028 |
Family Income by Number of Earners in Talahi Island
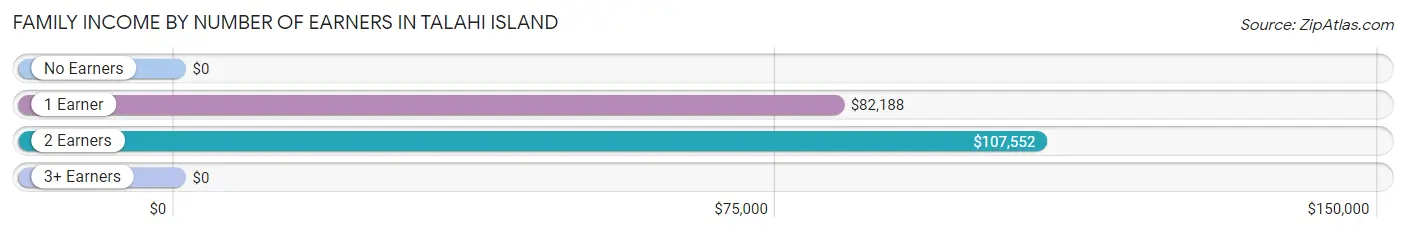
| Number of Earners | # Families | Median Income |
| No Earners | 106 (24.4%) | $0 |
| 1 Earner | 75 (17.3%) | $82,188 |
| 2 Earners | 253 (58.3%) | $107,552 |
| 3+ Earners | 0 (0.0%) | $0 |
| Total | 434 (100.0%) | $89,028 |
Household Income in Talahi Island
Household Income Brackets in Talahi Island
With 119 households falling in the category, the $50,000 to $74,999 income range is the most frequent in Talahi Island, accounting for 23.5% of all households.
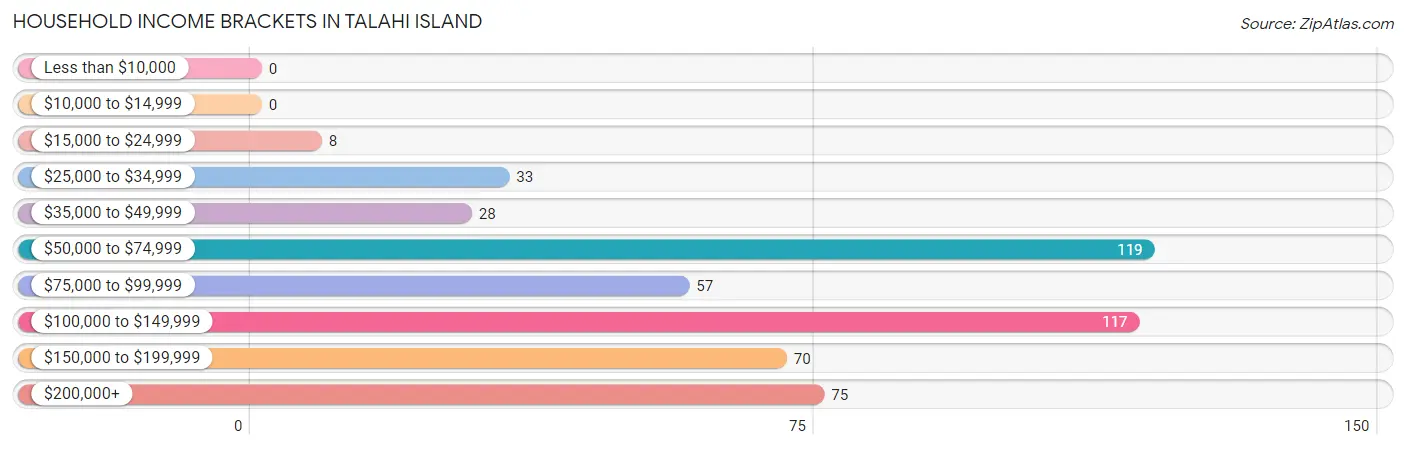
| Income Bracket | # Households | % Households |
| Less than $10,000 | 0 | 0.0% |
| $10,000 to $14,999 | 0 | 0.0% |
| $15,000 to $24,999 | 8 | 1.6% |
| $25,000 to $34,999 | 33 | 6.5% |
| $35,000 to $49,999 | 28 | 5.5% |
| $50,000 to $74,999 | 119 | 23.5% |
| $75,000 to $99,999 | 57 | 11.2% |
| $100,000 to $149,999 | 117 | 23.1% |
| $150,000 to $199,999 | 70 | 13.8% |
| $200,000+ | 75 | 14.8% |
Household Income by Householder Age in Talahi Island
The median household income in Talahi Island is $104,625, with the highest median household income of $117,125 found in the 45 to 64 years age bracket for the primary householder. A total of 231 households (45.6%) fall into this category.
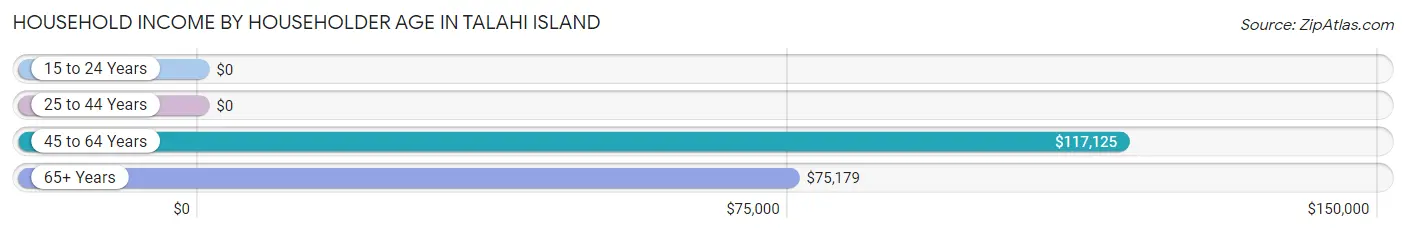
| Income Bracket | # Households | Median Income |
| 15 to 24 Years | 0 (0.0%) | $0 |
| 25 to 44 Years | 81 (16.0%) | $0 |
| 45 to 64 Years | 231 (45.6%) | $117,125 |
| 65+ Years | 195 (38.5%) | $75,179 |
| Total | 507 (100.0%) | $104,625 |
Poverty in Talahi Island
Income Below Poverty by Sex and Age in Talahi Island
With 3.0% poverty level for males and 2.1% for females among the residents of Talahi Island, 5 year old males and 6 to 11 year old females are the most vulnerable to poverty, with 7 males (43.8%) and 7 females (17.5%) in their respective age groups living below the poverty level.
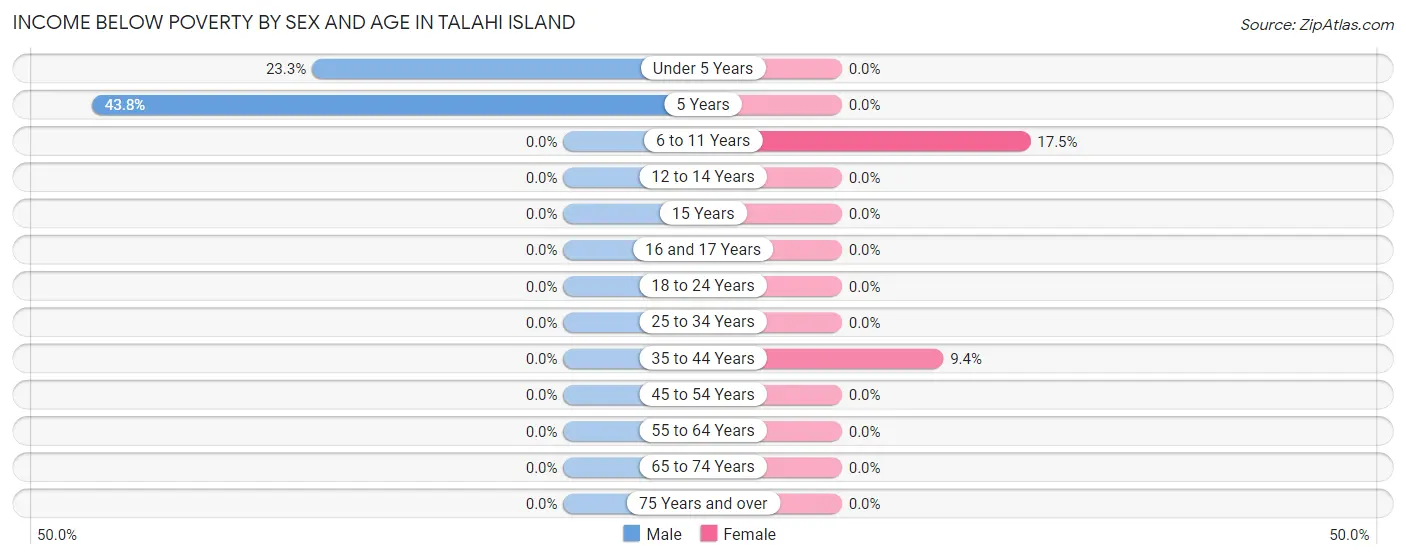
| Age Bracket | Male | Female |
| Under 5 Years | 7 (23.3%) | 0 (0.0%) |
| 5 Years | 7 (43.8%) | 0 (0.0%) |
| 6 to 11 Years | 0 (0.0%) | 7 (17.5%) |
| 12 to 14 Years | 0 (0.0%) | 0 (0.0%) |
| 15 Years | 0 (0.0%) | 0 (0.0%) |
| 16 and 17 Years | 0 (0.0%) | 0 (0.0%) |
| 18 to 24 Years | 0 (0.0%) | 0 (0.0%) |
| 25 to 34 Years | 0 (0.0%) | 0 (0.0%) |
| 35 to 44 Years | 0 (0.0%) | 8 (9.4%) |
| 45 to 54 Years | 0 (0.0%) | 0 (0.0%) |
| 55 to 64 Years | 0 (0.0%) | 0 (0.0%) |
| 65 to 74 Years | 0 (0.0%) | 0 (0.0%) |
| 75 Years and over | 0 (0.0%) | 0 (0.0%) |
| Total | 14 (3.0%) | 15 (2.1%) |
Income Above Poverty by Sex and Age in Talahi Island
According to the poverty statistics in Talahi Island, males aged 6 to 11 years and females aged under 5 years are the age groups that are most secure financially, with 100.0% of males and 100.0% of females in these age groups living above the poverty line.
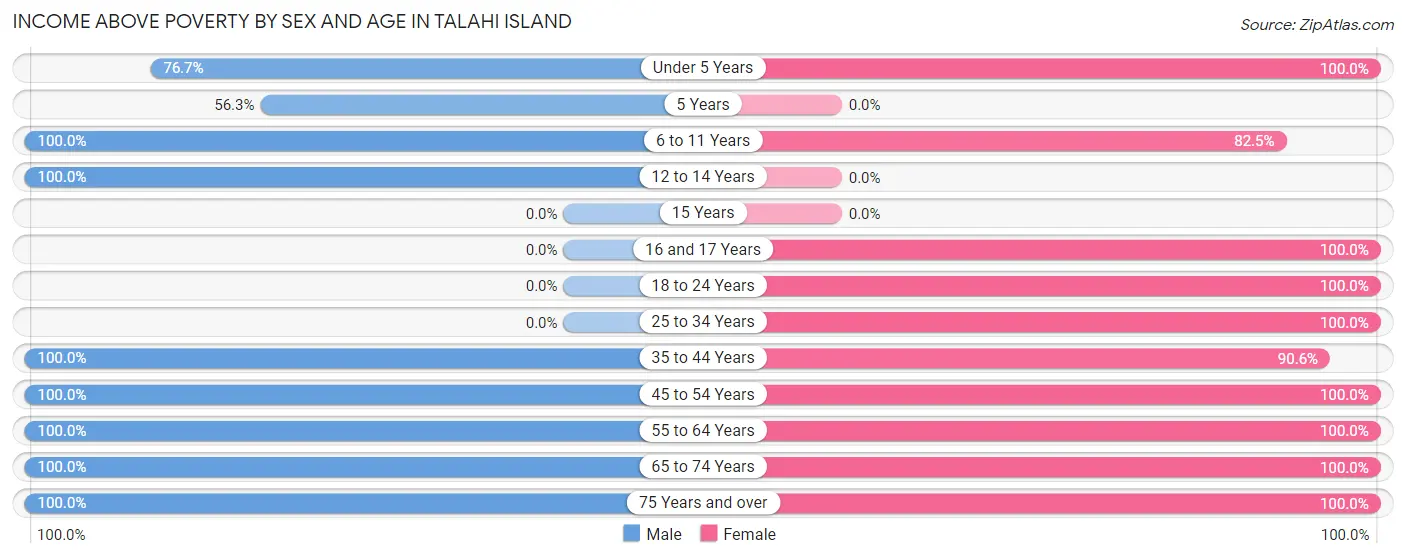
| Age Bracket | Male | Female |
| Under 5 Years | 23 (76.7%) | 26 (100.0%) |
| 5 Years | 9 (56.2%) | 0 (0.0%) |
| 6 to 11 Years | 14 (100.0%) | 33 (82.5%) |
| 12 to 14 Years | 11 (100.0%) | 0 (0.0%) |
| 15 Years | 0 (0.0%) | 0 (0.0%) |
| 16 and 17 Years | 0 (0.0%) | 45 (100.0%) |
| 18 to 24 Years | 0 (0.0%) | 86 (100.0%) |
| 25 to 34 Years | 0 (0.0%) | 46 (100.0%) |
| 35 to 44 Years | 65 (100.0%) | 77 (90.6%) |
| 45 to 54 Years | 36 (100.0%) | 151 (100.0%) |
| 55 to 64 Years | 149 (100.0%) | 54 (100.0%) |
| 65 to 74 Years | 48 (100.0%) | 108 (100.0%) |
| 75 Years and over | 100 (100.0%) | 75 (100.0%) |
| Total | 455 (97.0%) | 701 (97.9%) |
Income Below Poverty Among Married-Couple Families in Talahi Island
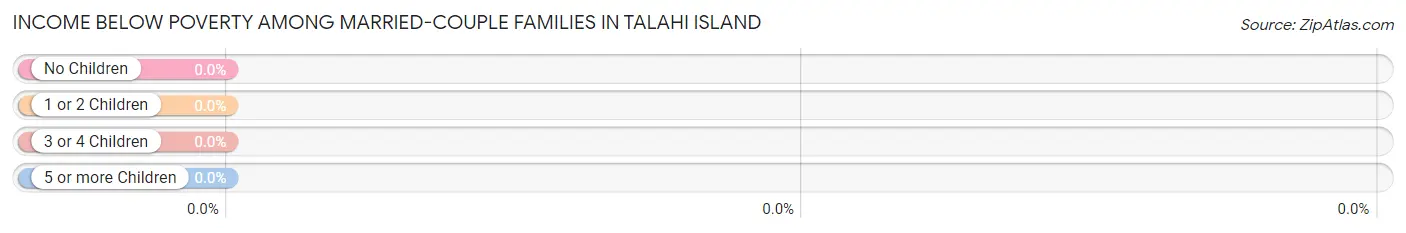
| Children | Above Poverty | Below Poverty |
| No Children | 248 (100.0%) | 0 (0.0%) |
| 1 or 2 Children | 61 (100.0%) | 0 (0.0%) |
| 3 or 4 Children | 0 (0.0%) | 0 (0.0%) |
| 5 or more Children | 0 (0.0%) | 0 (0.0%) |
| Total | 309 (100.0%) | 0 (0.0%) |
Income Below Poverty Among Single-Parent Households in Talahi Island
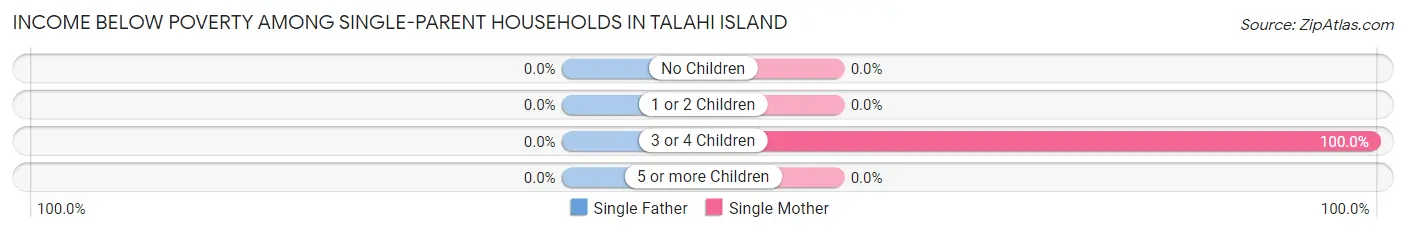
| Children | Single Father | Single Mother |
| No Children | 0 (0.0%) | 0 (0.0%) |
| 1 or 2 Children | 0 (0.0%) | 0 (0.0%) |
| 3 or 4 Children | 0 (0.0%) | 8 (100.0%) |
| 5 or more Children | 0 (0.0%) | 0 (0.0%) |
| Total | 0 (0.0%) | 8 (9.0%) |
Income Below Poverty Among Married-Couple vs Single-Parent Households in Talahi Island
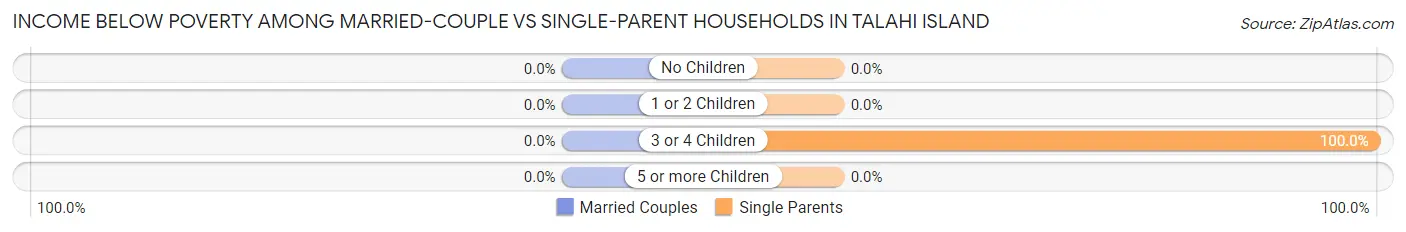
| Children | Married-Couple Families | Single-Parent Households |
| No Children | 0 (0.0%) | 0 (0.0%) |
| 1 or 2 Children | 0 (0.0%) | 0 (0.0%) |
| 3 or 4 Children | 0 (0.0%) | 8 (100.0%) |
| 5 or more Children | 0 (0.0%) | 0 (0.0%) |
| Total | 0 (0.0%) | 8 (6.4%) |
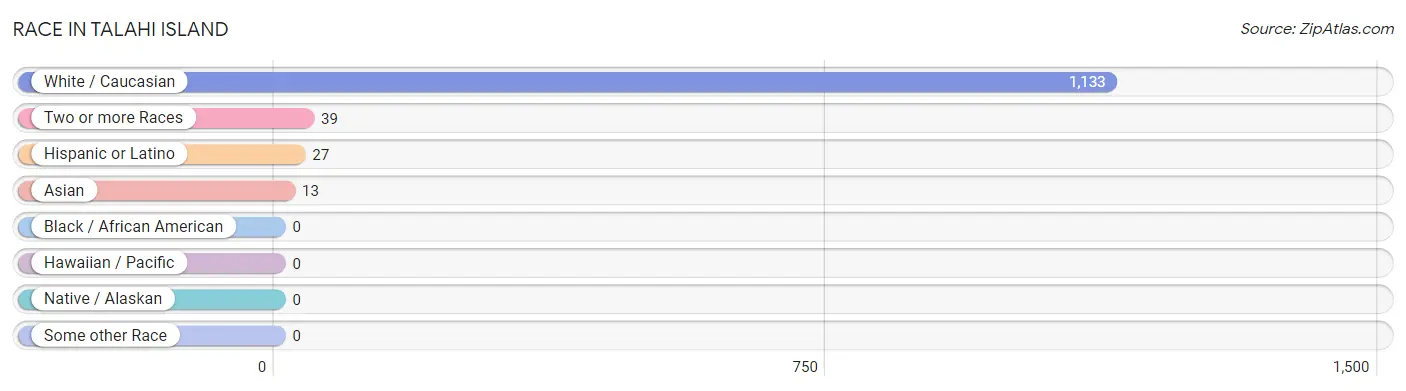
Race in Talahi Island
The most populous races in Talahi Island are White / Caucasian (1,133 | 95.6%), Two or more Races (39 | 3.3%), and Hispanic or Latino (27 | 2.3%).
| Race | # Population | % Population |
| Asian | 13 | 1.1% |
| Black / African American | 0 | 0.0% |
| Hawaiian / Pacific | 0 | 0.0% |
| Hispanic or Latino | 27 | 2.3% |
| Native / Alaskan | 0 | 0.0% |
| White / Caucasian | 1,133 | 95.6% |
| Two or more Races | 39 | 3.3% |
| Some other Race | 0 | 0.0% |
| Total | 1,185 | 100.0% |
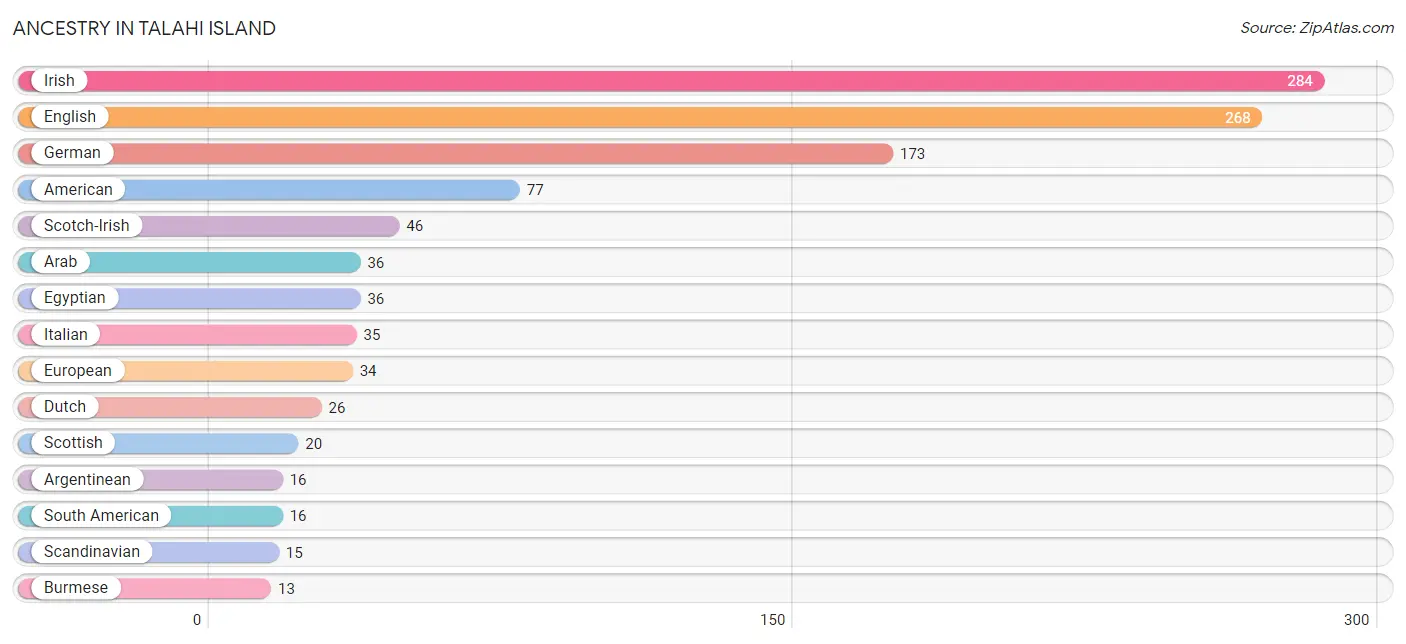
Ancestry in Talahi Island
The most populous ancestries reported in Talahi Island are Irish (284 | 24.0%), English (268 | 22.6%), German (173 | 14.6%), American (77 | 6.5%), and Scotch-Irish (46 | 3.9%), together accounting for 71.6% of all Talahi Island residents.
| Ancestry | # Population | % Population |
| American | 77 | 6.5% |
| Arab | 36 | 3.0% |
| Argentinean | 16 | 1.3% |
| Bhutanese | 1 | 0.1% |
| Burmese | 13 | 1.1% |
| Cherokee | 11 | 0.9% |
| Croatian | 8 | 0.7% |
| Dutch | 26 | 2.2% |
| Egyptian | 36 | 3.0% |
| English | 268 | 22.6% |
| European | 34 | 2.9% |
| German | 173 | 14.6% |
| Irish | 284 | 24.0% |
| Italian | 35 | 2.9% |
| Native Hawaiian | 1 | 0.1% |
| Scandinavian | 15 | 1.3% |
| Scotch-Irish | 46 | 3.9% |
| Scottish | 20 | 1.7% |
| Slavic | 7 | 0.6% |
| South American | 16 | 1.3% |
| Spaniard | 11 | 0.9% | View All 21 Rows |
Immigrants in Talahi Island
The most numerous immigrant groups reported in Talahi Island came from Argentina (16 | 1.3%), Latin America (16 | 1.3%), South America (16 | 1.3%), Asia (13 | 1.1%), and Eastern Asia (13 | 1.1%), together accounting for 6.2% of all Talahi Island residents.
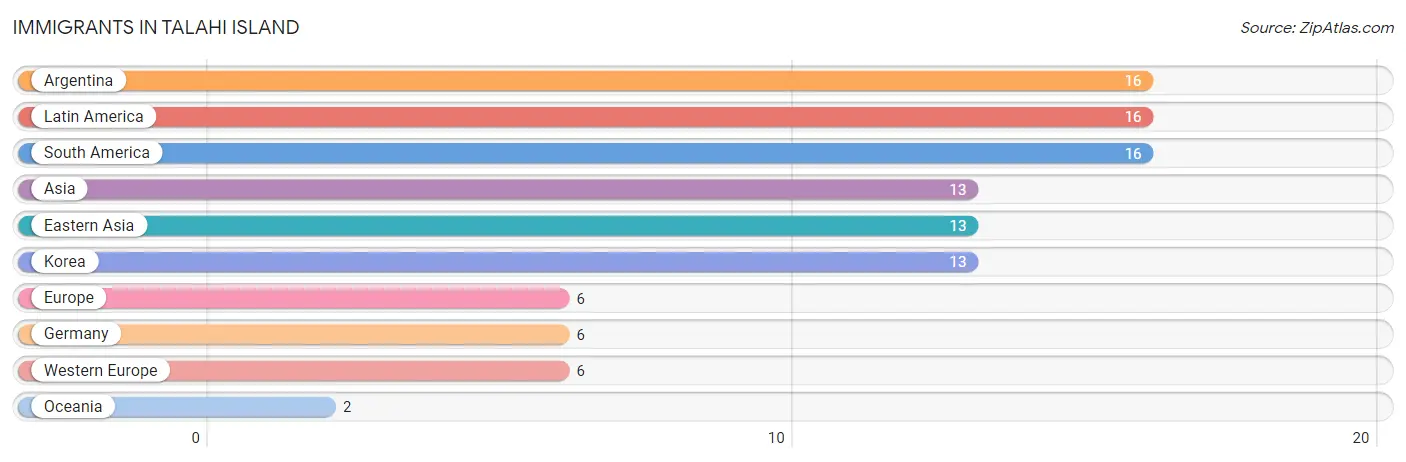
| Immigration Origin | # Population | % Population |
| Argentina | 16 | 1.3% |
| Asia | 13 | 1.1% |
| Eastern Asia | 13 | 1.1% |
| Europe | 6 | 0.5% |
| Germany | 6 | 0.5% |
| Korea | 13 | 1.1% |
| Latin America | 16 | 1.3% |
| Oceania | 2 | 0.2% |
| South America | 16 | 1.3% |
| Western Europe | 6 | 0.5% | View All 10 Rows |
Sex and Age in Talahi Island
Sex and Age in Talahi Island
The most populous age groups in Talahi Island are 55 to 59 Years (113 | 24.1%) for men and 50 to 54 Years (96 | 13.4%) for women.
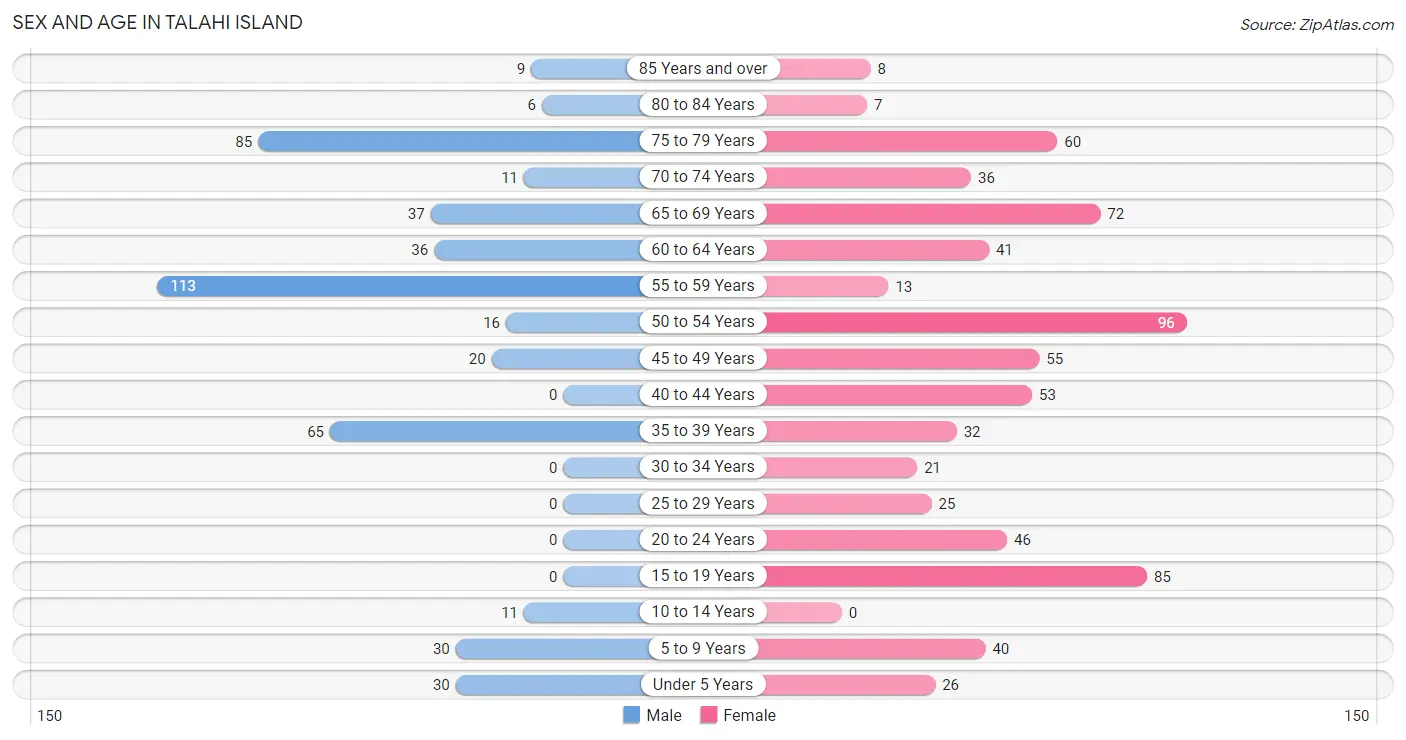
| Age Bracket | Male | Female |
| Under 5 Years | 30 (6.4%) | 26 (3.6%) |
| 5 to 9 Years | 30 (6.4%) | 40 (5.6%) |
| 10 to 14 Years | 11 (2.4%) | 0 (0.0%) |
| 15 to 19 Years | 0 (0.0%) | 85 (11.9%) |
| 20 to 24 Years | 0 (0.0%) | 46 (6.4%) |
| 25 to 29 Years | 0 (0.0%) | 25 (3.5%) |
| 30 to 34 Years | 0 (0.0%) | 21 (2.9%) |
| 35 to 39 Years | 65 (13.9%) | 32 (4.5%) |
| 40 to 44 Years | 0 (0.0%) | 53 (7.4%) |
| 45 to 49 Years | 20 (4.3%) | 55 (7.7%) |
| 50 to 54 Years | 16 (3.4%) | 96 (13.4%) |
| 55 to 59 Years | 113 (24.1%) | 13 (1.8%) |
| 60 to 64 Years | 36 (7.7%) | 41 (5.7%) |
| 65 to 69 Years | 37 (7.9%) | 72 (10.1%) |
| 70 to 74 Years | 11 (2.4%) | 36 (5.0%) |
| 75 to 79 Years | 85 (18.1%) | 60 (8.4%) |
| 80 to 84 Years | 6 (1.3%) | 7 (1.0%) |
| 85 Years and over | 9 (1.9%) | 8 (1.1%) |
| Total | 469 (100.0%) | 716 (100.0%) |
Families and Households in Talahi Island
Median Family Size in Talahi Island
The median family size in Talahi Island is 2.46 persons per family, with single male/father families (36 | 8.3%) accounting for the largest median family size of 3.36 persons per family. On the other hand, married-couple families (309 | 71.2%) represent the smallest median family size with 2.34 persons per family.
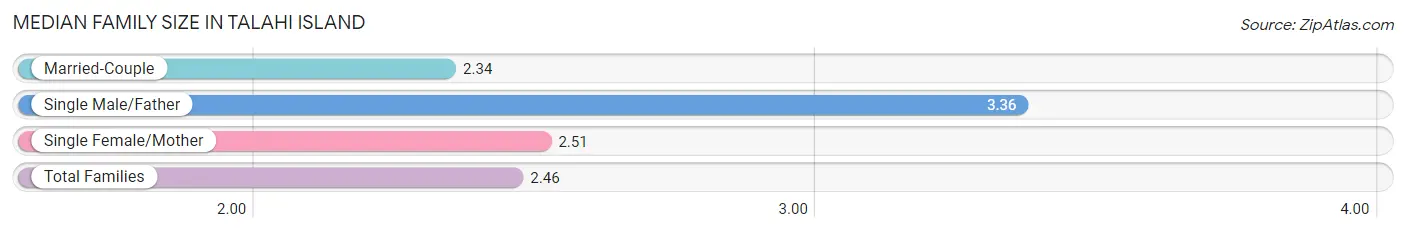
| Family Type | # Families | Family Size |
| Married-Couple | 309 (71.2%) | 2.34 |
| Single Male/Father | 36 (8.3%) | 3.36 |
| Single Female/Mother | 89 (20.5%) | 2.51 |
| Total Families | 434 (100.0%) | 2.46 |
Median Household Size in Talahi Island
The median household size in Talahi Island is 2.34 persons per household, with single male/father households (36 | 7.1%) accounting for the largest median household size of 4.42 persons per household. non-family households (73 | 14.4%) represent the smallest median household size with 1.11 persons per household.
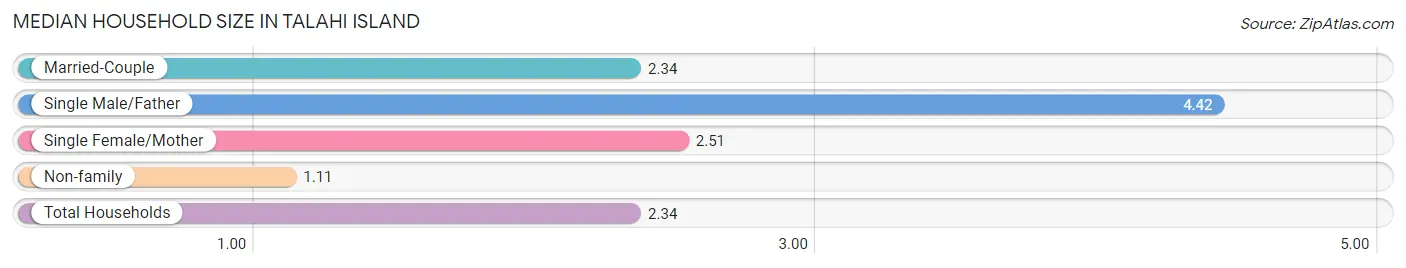
| Household Type | # Households | Household Size |
| Married-Couple | 309 (61.0%) | 2.34 |
| Single Male/Father | 36 (7.1%) | 4.42 |
| Single Female/Mother | 89 (17.5%) | 2.51 |
| Non-family | 73 (14.4%) | 1.11 |
| Total Households | 507 (100.0%) | 2.34 |
Household Size by Marriage Status in Talahi Island
Out of a total of 507 households in Talahi Island, 434 (85.6%) are family households, while 73 (14.4%) are nonfamily households. The most numerous type of family households are 2-person households, comprising 322, and the most common type of nonfamily households are 1-person households, comprising 66.
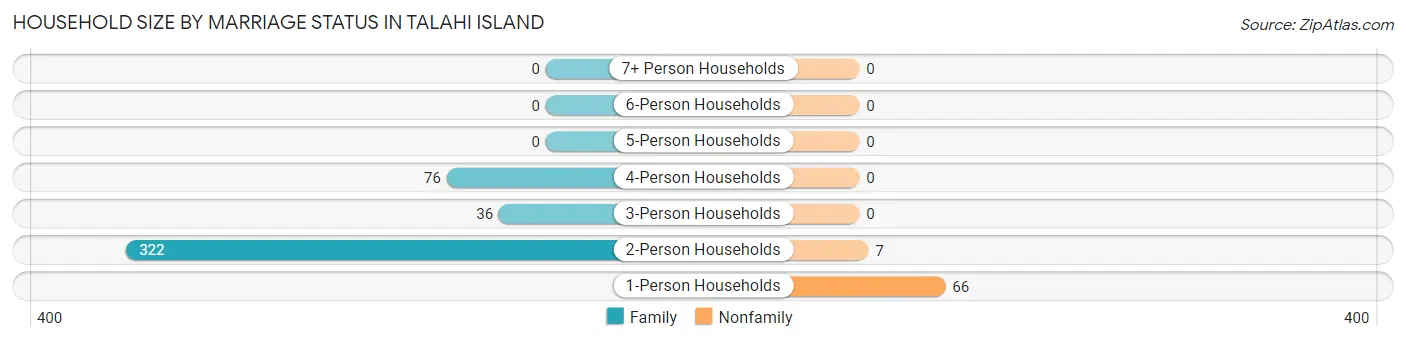
| Household Size | Family Households | Nonfamily Households |
| 1-Person Households | - | 66 (13.0%) |
| 2-Person Households | 322 (63.5%) | 7 (1.4%) |
| 3-Person Households | 36 (7.1%) | 0 (0.0%) |
| 4-Person Households | 76 (15.0%) | 0 (0.0%) |
| 5-Person Households | 0 (0.0%) | 0 (0.0%) |
| 6-Person Households | 0 (0.0%) | 0 (0.0%) |
| 7+ Person Households | 0 (0.0%) | 0 (0.0%) |
| Total | 434 (85.6%) | 73 (14.4%) |
Female Fertility in Talahi Island
Fertility by Age in Talahi Island
Average fertility rate in Talahi Island is 70.0 births per 1,000 women. Women in the age bracket of 35 to 50 years have the highest fertility rate with 153.0 births per 1,000 women. Women in the age bracket of 35 to 50 years acount for 100.0% of all women with births.
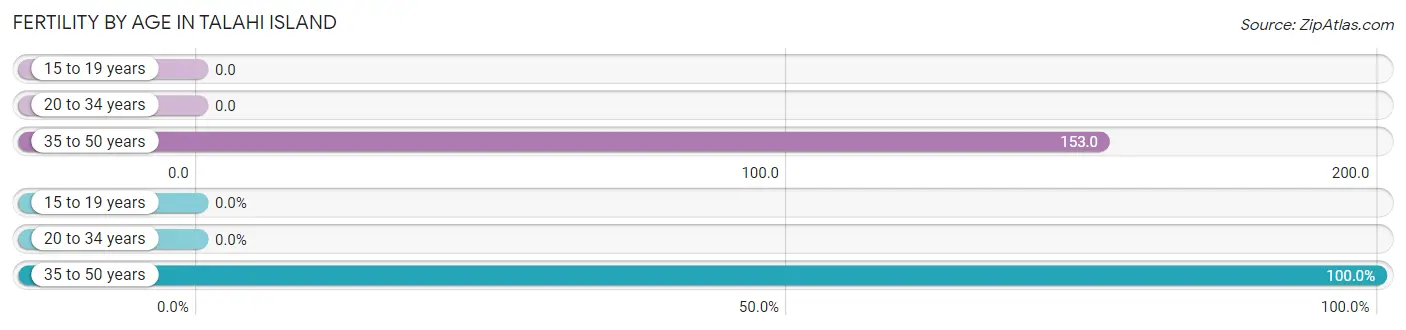
| Age Bracket | Women with Births | Births / 1,000 Women |
| 15 to 19 years | 0 (0.0%) | 0.0 |
| 20 to 34 years | 0 (0.0%) | 0.0 |
| 35 to 50 years | 23 (100.0%) | 153.0 |
| Total | 23 (100.0%) | 70.0 |
Fertility by Age by Marriage Status in Talahi Island
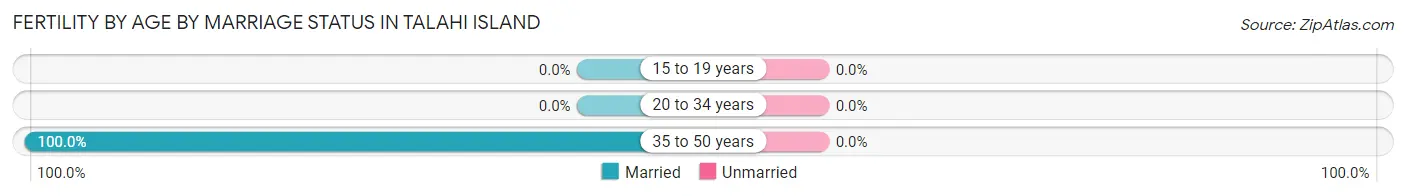
| Age Bracket | Married | Unmarried |
| 15 to 19 years | 0 (0.0%) | 0 (0.0%) |
| 20 to 34 years | 0 (0.0%) | 0 (0.0%) |
| 35 to 50 years | 23 (100.0%) | 0 (0.0%) |
| Total | 23 (100.0%) | 0 (0.0%) |
Fertility by Education in Talahi Island
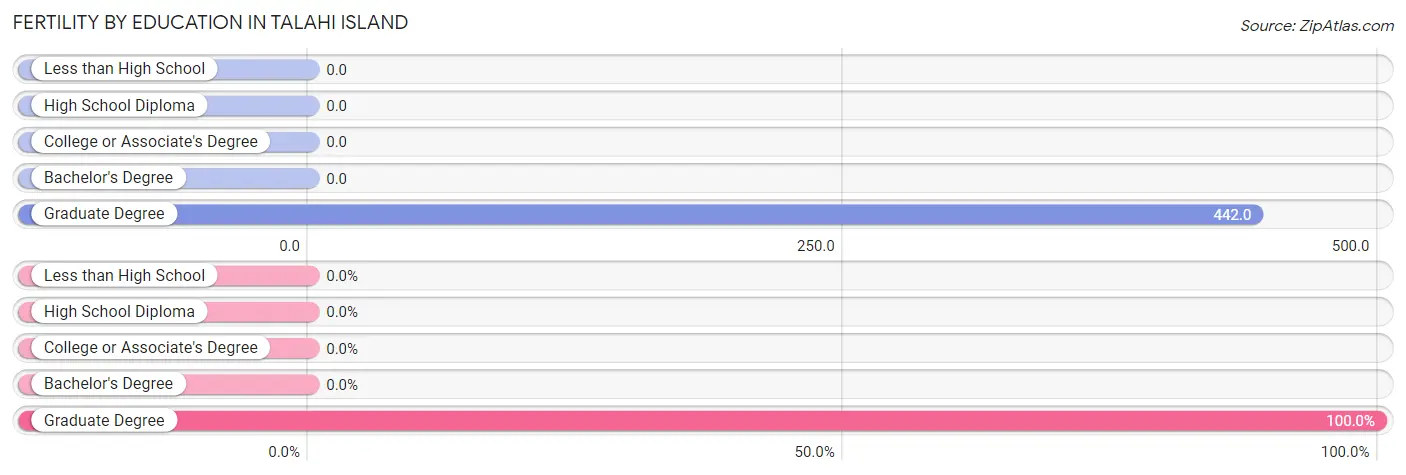
| Educational Attainment | Women with Births | Births / 1,000 Women |
| Less than High School | 0 (0.0%) | 0.0 |
| High School Diploma | 0 (0.0%) | 0.0 |
| College or Associate's Degree | 0 (0.0%) | 0.0 |
| Bachelor's Degree | 0 (0.0%) | 0.0 |
| Graduate Degree | 23 (100.0%) | 442.0 |
| Total | 23 (100.0%) | 70.0 |
Fertility by Education by Marriage Status in Talahi Island
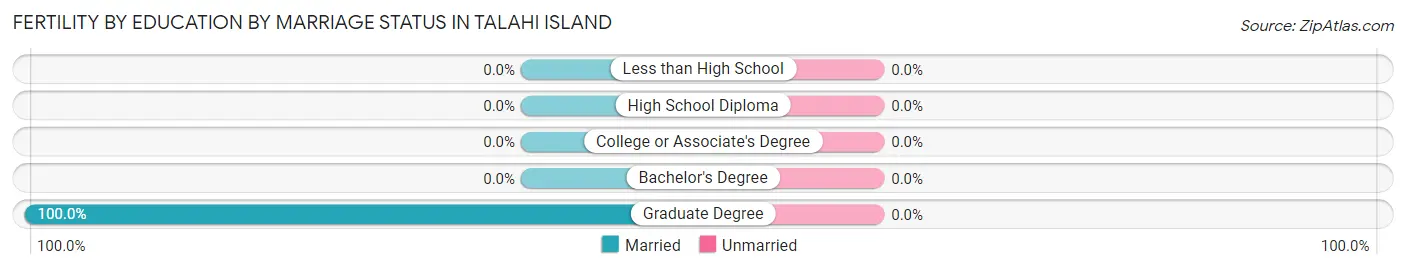
| Educational Attainment | Married | Unmarried |
| Less than High School | 0 (0.0%) | 0 (0.0%) |
| High School Diploma | 0 (0.0%) | 0 (0.0%) |
| College or Associate's Degree | 0 (0.0%) | 0 (0.0%) |
| Bachelor's Degree | 0 (0.0%) | 0 (0.0%) |
| Graduate Degree | 23 (100.0%) | 0 (0.0%) |
| Total | 23 (100.0%) | 0 (0.0%) |
Employment Characteristics in Talahi Island
Employment by Class of Employer in Talahi Island
Among the 686 employed individuals in Talahi Island, private company employees (455 | 66.3%), self-employed (incorporated) (127 | 18.5%), and local government employees (51 | 7.4%) make up the most common classes of employment.
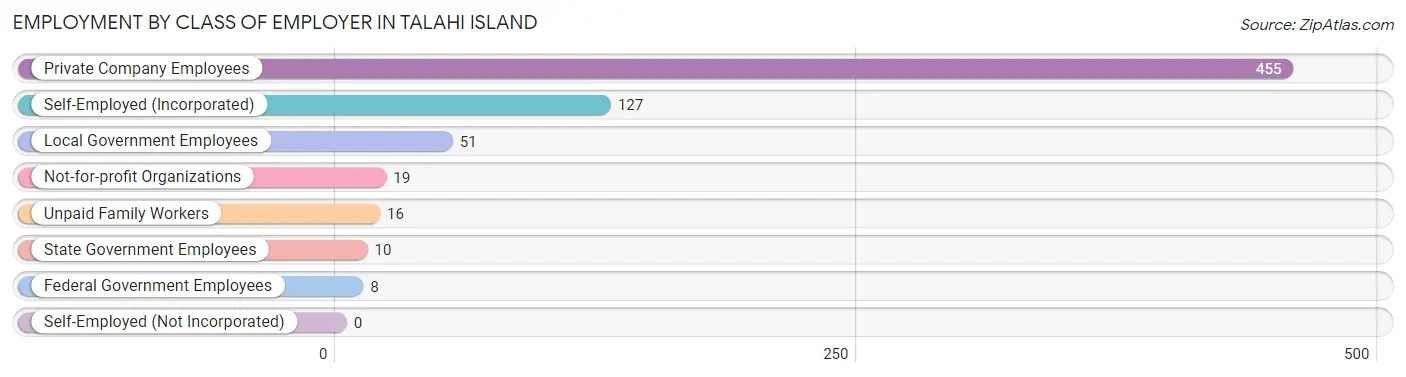
| Employer Class | # Employees | % Employees |
| Private Company Employees | 455 | 66.3% |
| Self-Employed (Incorporated) | 127 | 18.5% |
| Self-Employed (Not Incorporated) | 0 | 0.0% |
| Not-for-profit Organizations | 19 | 2.8% |
| Local Government Employees | 51 | 7.4% |
| State Government Employees | 10 | 1.5% |
| Federal Government Employees | 8 | 1.2% |
| Unpaid Family Workers | 16 | 2.3% |
| Total | 686 | 100.0% |
Employment Status by Age in Talahi Island
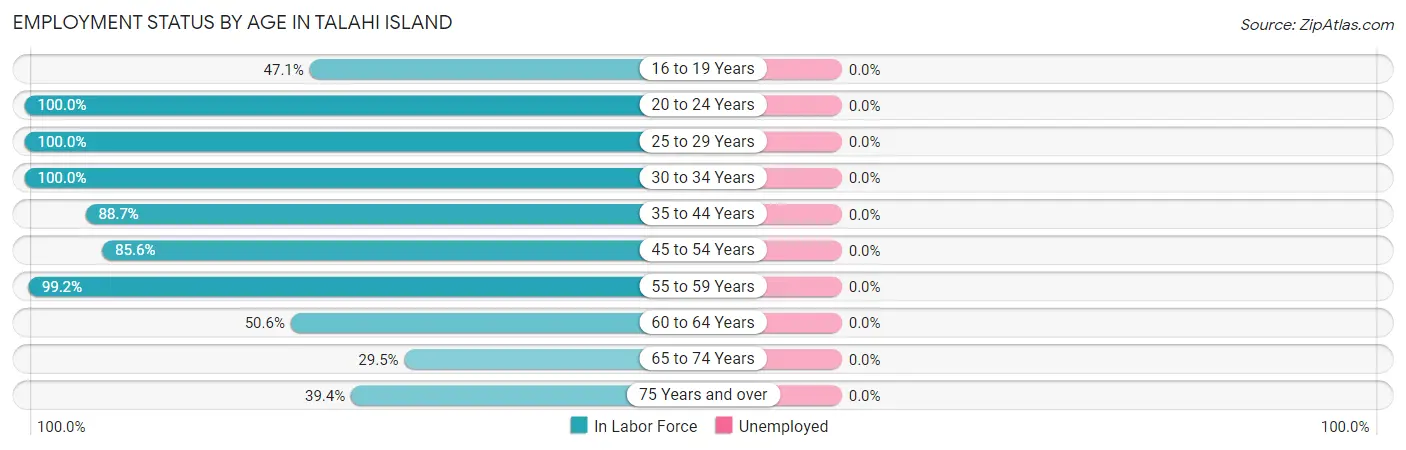
| Age Bracket | In Labor Force | Unemployed |
| 16 to 19 Years | 40 (47.1%) | 0 (0.0%) |
| 20 to 24 Years | 46 (100.0%) | 0 (0.0%) |
| 25 to 29 Years | 25 (100.0%) | 0 (0.0%) |
| 30 to 34 Years | 21 (100.0%) | 0 (0.0%) |
| 35 to 44 Years | 133 (88.7%) | 0 (0.0%) |
| 45 to 54 Years | 160 (85.6%) | 0 (0.0%) |
| 55 to 59 Years | 125 (99.2%) | 0 (0.0%) |
| 60 to 64 Years | 39 (50.6%) | 0 (0.0%) |
| 65 to 74 Years | 46 (29.5%) | 0 (0.0%) |
| 75 Years and over | 69 (39.4%) | 0 (0.0%) |
| Total | 704 (67.2%) | 0 (0.0%) |
Employment Status by Educational Attainment in Talahi Island
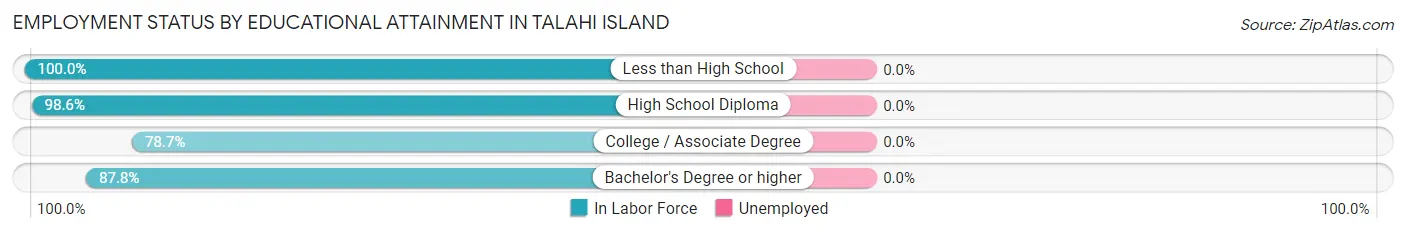
| Educational Attainment | In Labor Force | Unemployed |
| Less than High School | 8 (100.0%) | 0 (0.0%) |
| High School Diploma | 68 (98.6%) | 0 (0.0%) |
| College / Associate Degree | 174 (78.7%) | 0 (0.0%) |
| Bachelor's Degree or higher | 253 (87.8%) | 0 (0.0%) |
| Total | 503 (85.8%) | 0 (0.0%) |
Employment Occupations by Sex in Talahi Island
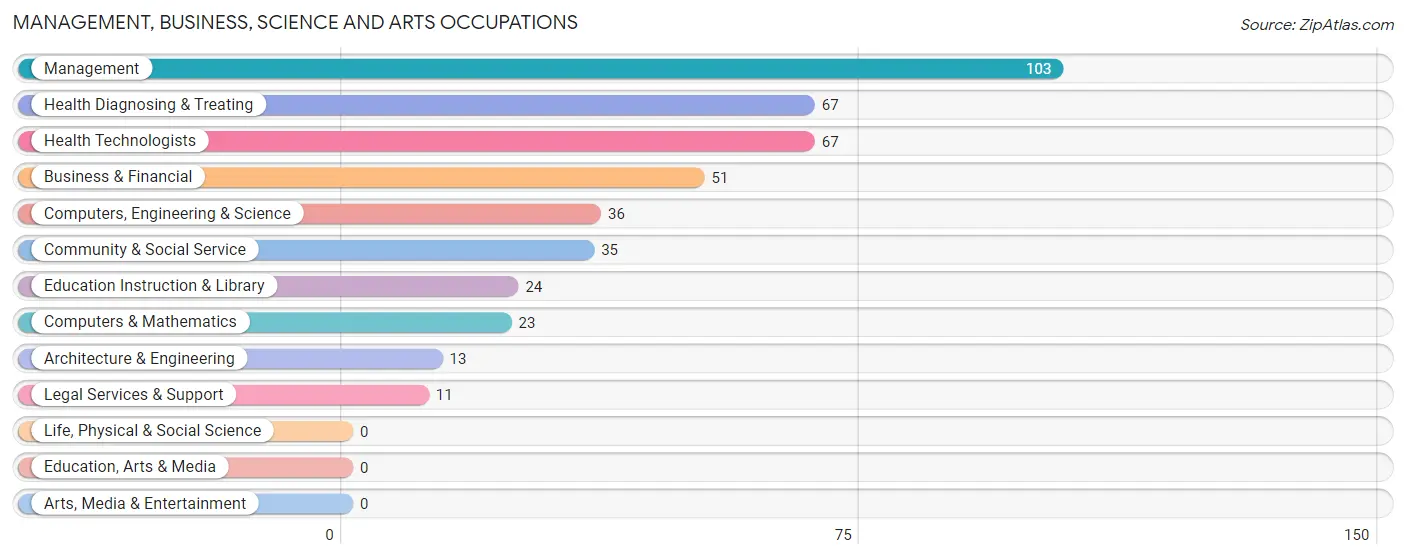
Management, Business, Science and Arts Occupations
The most common Management, Business, Science and Arts occupations in Talahi Island are Management (103 | 14.8%), Health Diagnosing & Treating (67 | 9.6%), Health Technologists (67 | 9.6%), Business & Financial (51 | 7.3%), and Computers, Engineering & Science (36 | 5.2%).
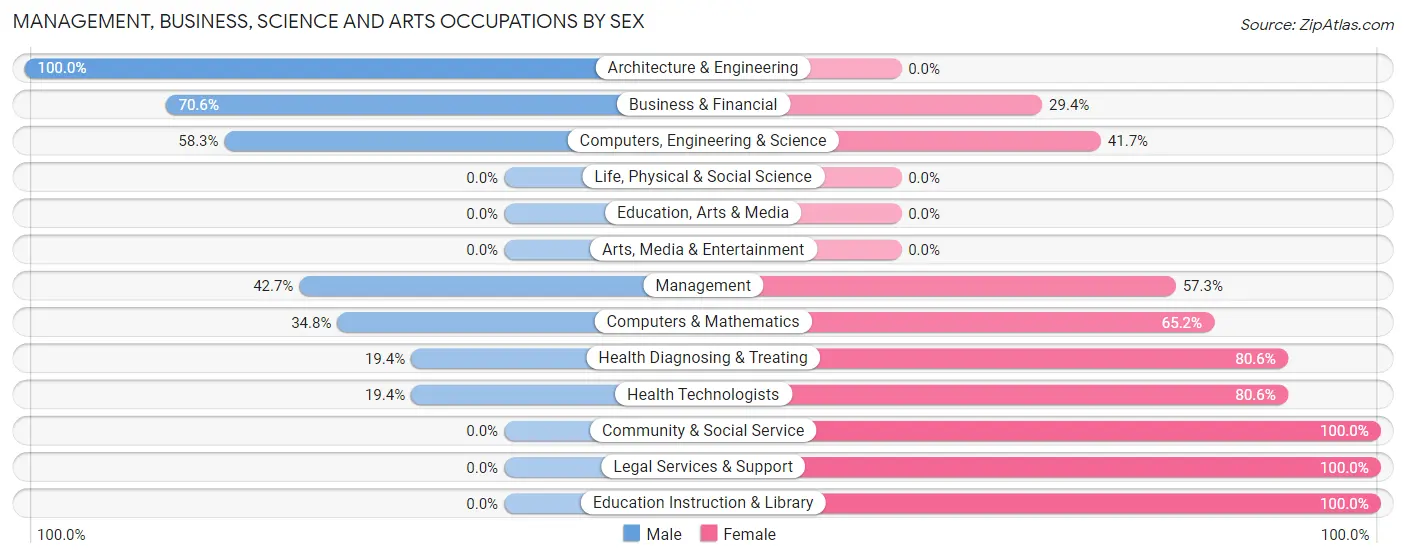
Management, Business, Science and Arts Occupations by Sex
Within the Management, Business, Science and Arts occupations in Talahi Island, the most male-oriented occupations are Architecture & Engineering (100.0%), Business & Financial (70.6%), and Computers, Engineering & Science (58.3%), while the most female-oriented occupations are Community & Social Service (100.0%), Legal Services & Support (100.0%), and Education Instruction & Library (100.0%).
| Occupation | Male | Female |
| Management | 44 (42.7%) | 59 (57.3%) |
| Business & Financial | 36 (70.6%) | 15 (29.4%) |
| Computers, Engineering & Science | 21 (58.3%) | 15 (41.7%) |
| Computers & Mathematics | 8 (34.8%) | 15 (65.2%) |
| Architecture & Engineering | 13 (100.0%) | 0 (0.0%) |
| Life, Physical & Social Science | 0 (0.0%) | 0 (0.0%) |
| Community & Social Service | 0 (0.0%) | 35 (100.0%) |
| Education, Arts & Media | 0 (0.0%) | 0 (0.0%) |
| Legal Services & Support | 0 (0.0%) | 11 (100.0%) |
| Education Instruction & Library | 0 (0.0%) | 24 (100.0%) |
| Arts, Media & Entertainment | 0 (0.0%) | 0 (0.0%) |
| Health Diagnosing & Treating | 13 (19.4%) | 54 (80.6%) |
| Health Technologists | 13 (19.4%) | 54 (80.6%) |
| Total (Category) | 114 (39.0%) | 178 (61.0%) |
| Total (Overall) | 302 (43.4%) | 394 (56.6%) |
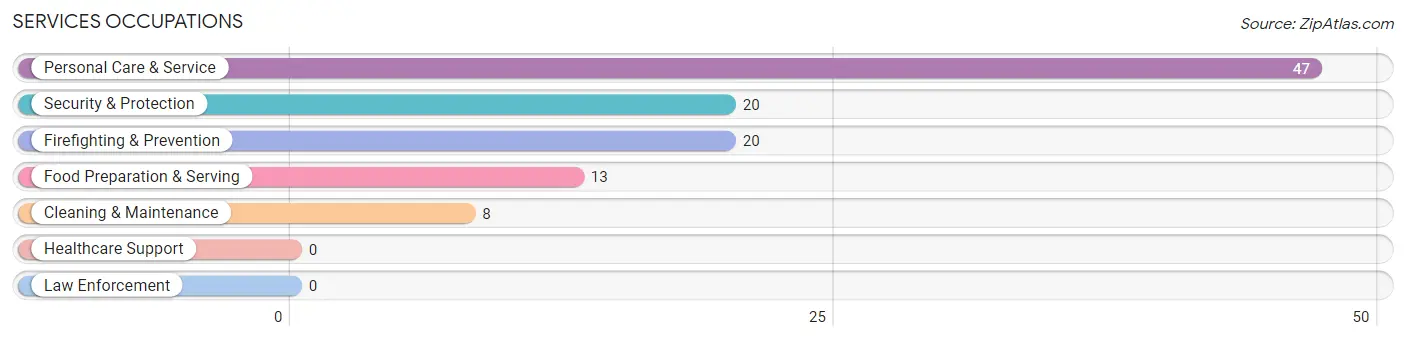
Services Occupations
The most common Services occupations in Talahi Island are Personal Care & Service (47 | 6.8%), Security & Protection (20 | 2.9%), Firefighting & Prevention (20 | 2.9%), Food Preparation & Serving (13 | 1.9%), and Cleaning & Maintenance (8 | 1.1%).
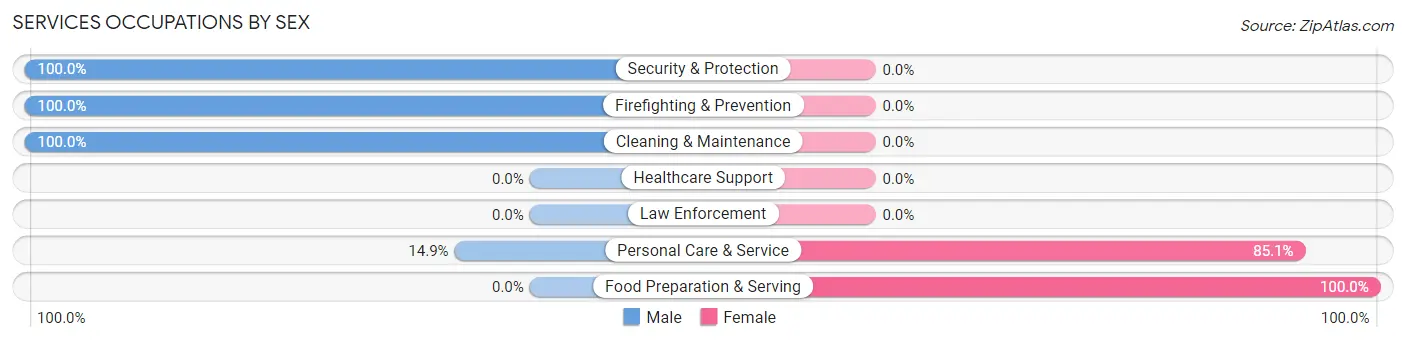
Services Occupations by Sex
Within the Services occupations in Talahi Island, the most male-oriented occupations are Security & Protection (100.0%), Firefighting & Prevention (100.0%), and Cleaning & Maintenance (100.0%), while the most female-oriented occupations are Food Preparation & Serving (100.0%), and Personal Care & Service (85.1%).
| Occupation | Male | Female |
| Healthcare Support | 0 (0.0%) | 0 (0.0%) |
| Security & Protection | 20 (100.0%) | 0 (0.0%) |
| Firefighting & Prevention | 20 (100.0%) | 0 (0.0%) |
| Law Enforcement | 0 (0.0%) | 0 (0.0%) |
| Food Preparation & Serving | 0 (0.0%) | 13 (100.0%) |
| Cleaning & Maintenance | 8 (100.0%) | 0 (0.0%) |
| Personal Care & Service | 7 (14.9%) | 40 (85.1%) |
| Total (Category) | 35 (39.8%) | 53 (60.2%) |
| Total (Overall) | 302 (43.4%) | 394 (56.6%) |
Sales and Office Occupations
The most common Sales and Office occupations in Talahi Island are Office & Administration (123 | 17.7%), and Sales & Related (45 | 6.5%).
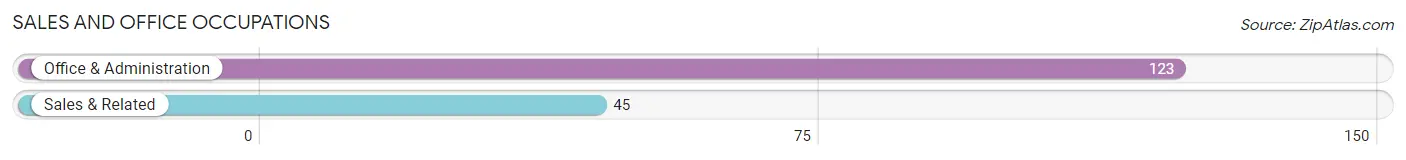
Sales and Office Occupations by Sex

| Occupation | Male | Female |
| Sales & Related | 28 (62.2%) | 17 (37.8%) |
| Office & Administration | 23 (18.7%) | 100 (81.3%) |
| Total (Category) | 51 (30.4%) | 117 (69.6%) |
| Total (Overall) | 302 (43.4%) | 394 (56.6%) |
Natural Resources, Construction and Maintenance Occupations
The most common Natural Resources, Construction and Maintenance occupations in Talahi Island are , and Construction & Extraction (7 | 1.0%).
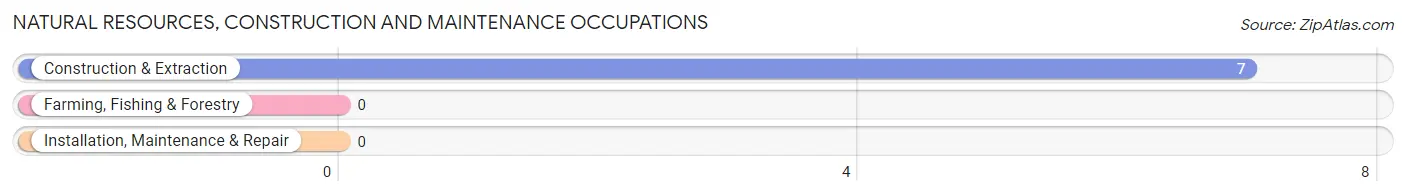
Natural Resources, Construction and Maintenance Occupations by Sex
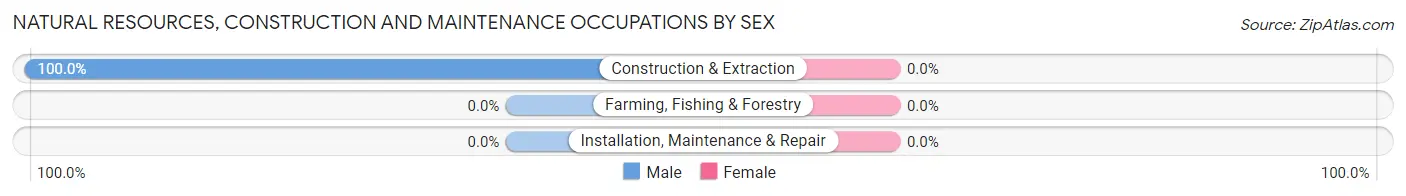
| Occupation | Male | Female |
| Farming, Fishing & Forestry | 0 (0.0%) | 0 (0.0%) |
| Construction & Extraction | 7 (100.0%) | 0 (0.0%) |
| Installation, Maintenance & Repair | 0 (0.0%) | 0 (0.0%) |
| Total (Category) | 7 (100.0%) | 0 (0.0%) |
| Total (Overall) | 302 (43.4%) | 394 (56.6%) |
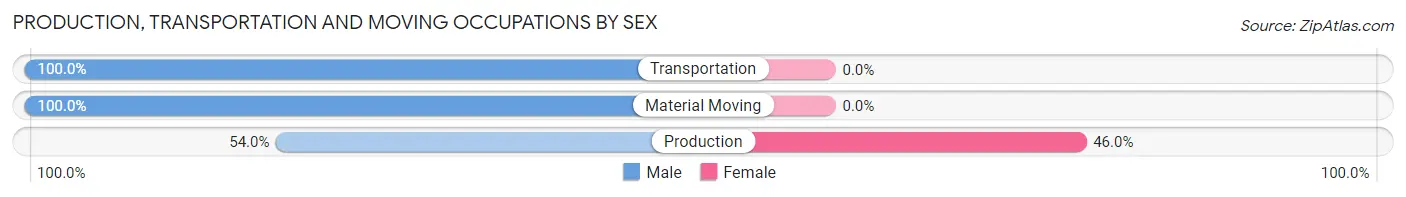
Production, Transportation and Moving Occupations
The most common Production, Transportation and Moving occupations in Talahi Island are Production (100 | 14.4%), Transportation (31 | 4.4%), and Material Moving (10 | 1.4%).
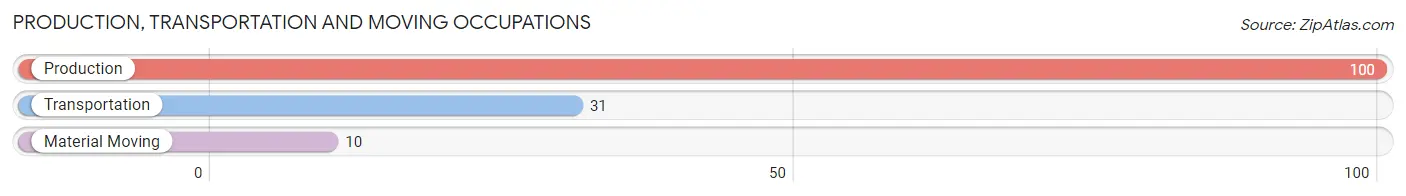
Production, Transportation and Moving Occupations by Sex
| Occupation | Male | Female |
| Production | 54 (54.0%) | 46 (46.0%) |
| Transportation | 31 (100.0%) | 0 (0.0%) |
| Material Moving | 10 (100.0%) | 0 (0.0%) |
| Total (Category) | 95 (67.4%) | 46 (32.6%) |
| Total (Overall) | 302 (43.4%) | 394 (56.6%) |
Employment Industries by Sex in Talahi Island
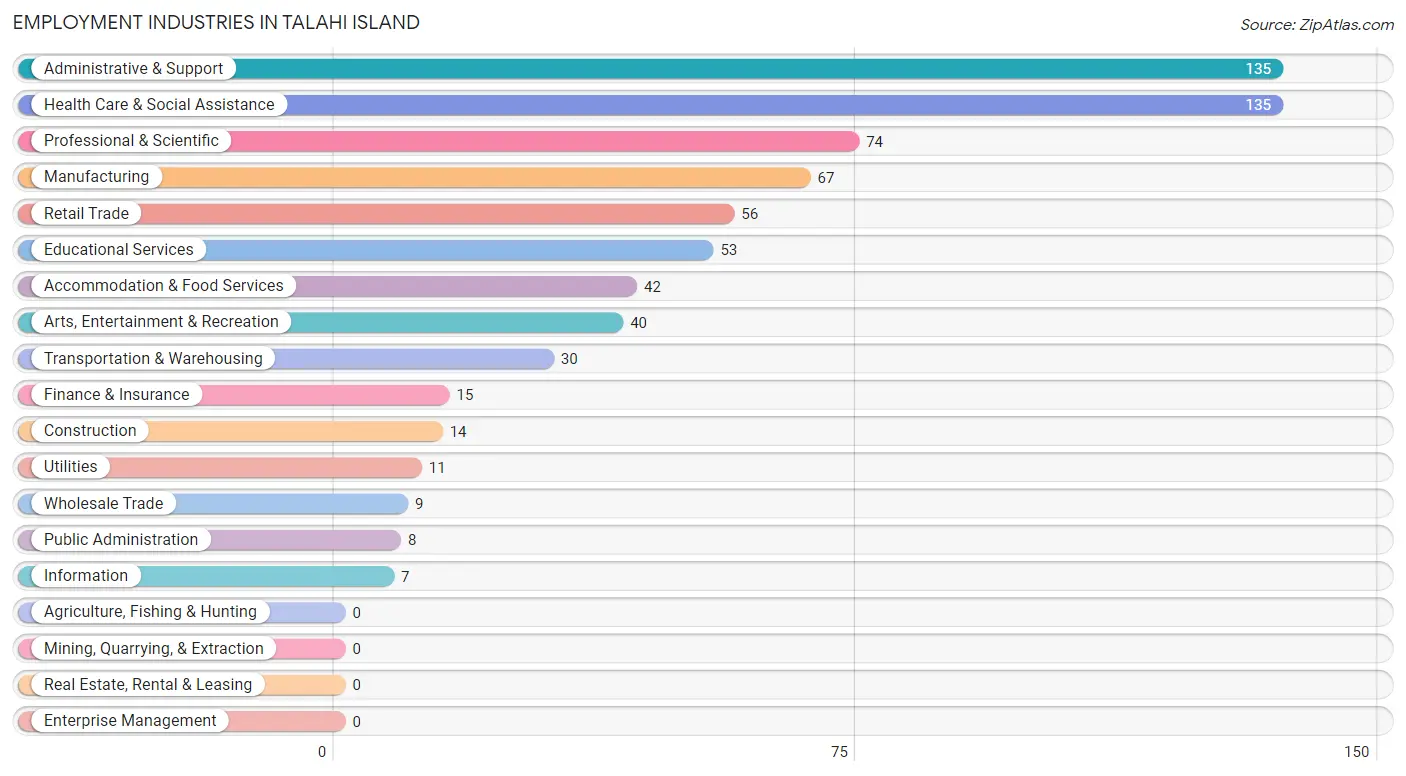
Employment Industries in Talahi Island
The major employment industries in Talahi Island include Administrative & Support (135 | 19.4%), Health Care & Social Assistance (135 | 19.4%), Professional & Scientific (74 | 10.6%), Manufacturing (67 | 9.6%), and Retail Trade (56 | 8.1%).
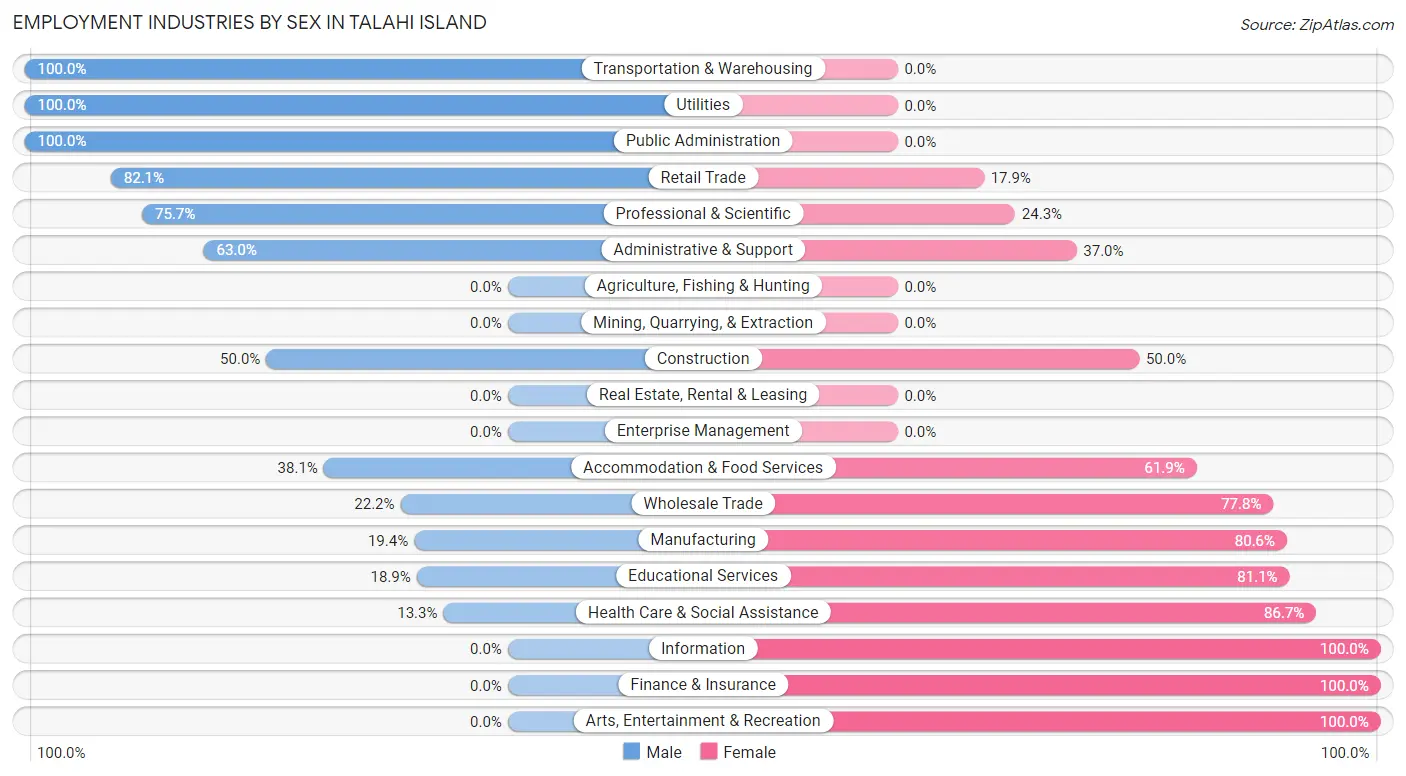
Employment Industries by Sex in Talahi Island
The Talahi Island industries that see more men than women are Transportation & Warehousing (100.0%), Utilities (100.0%), and Public Administration (100.0%), whereas the industries that tend to have a higher number of women are Information (100.0%), Finance & Insurance (100.0%), and Arts, Entertainment & Recreation (100.0%).
| Industry | Male | Female |
| Agriculture, Fishing & Hunting | 0 (0.0%) | 0 (0.0%) |
| Mining, Quarrying, & Extraction | 0 (0.0%) | 0 (0.0%) |
| Construction | 7 (50.0%) | 7 (50.0%) |
| Manufacturing | 13 (19.4%) | 54 (80.6%) |
| Wholesale Trade | 2 (22.2%) | 7 (77.8%) |
| Retail Trade | 46 (82.1%) | 10 (17.9%) |
| Transportation & Warehousing | 30 (100.0%) | 0 (0.0%) |
| Utilities | 11 (100.0%) | 0 (0.0%) |
| Information | 0 (0.0%) | 7 (100.0%) |
| Finance & Insurance | 0 (0.0%) | 15 (100.0%) |
| Real Estate, Rental & Leasing | 0 (0.0%) | 0 (0.0%) |
| Professional & Scientific | 56 (75.7%) | 18 (24.3%) |
| Enterprise Management | 0 (0.0%) | 0 (0.0%) |
| Administrative & Support | 85 (63.0%) | 50 (37.0%) |
| Educational Services | 10 (18.9%) | 43 (81.1%) |
| Health Care & Social Assistance | 18 (13.3%) | 117 (86.7%) |
| Arts, Entertainment & Recreation | 0 (0.0%) | 40 (100.0%) |
| Accommodation & Food Services | 16 (38.1%) | 26 (61.9%) |
| Public Administration | 8 (100.0%) | 0 (0.0%) |
| Total | 302 (43.4%) | 394 (56.6%) |
Education in Talahi Island
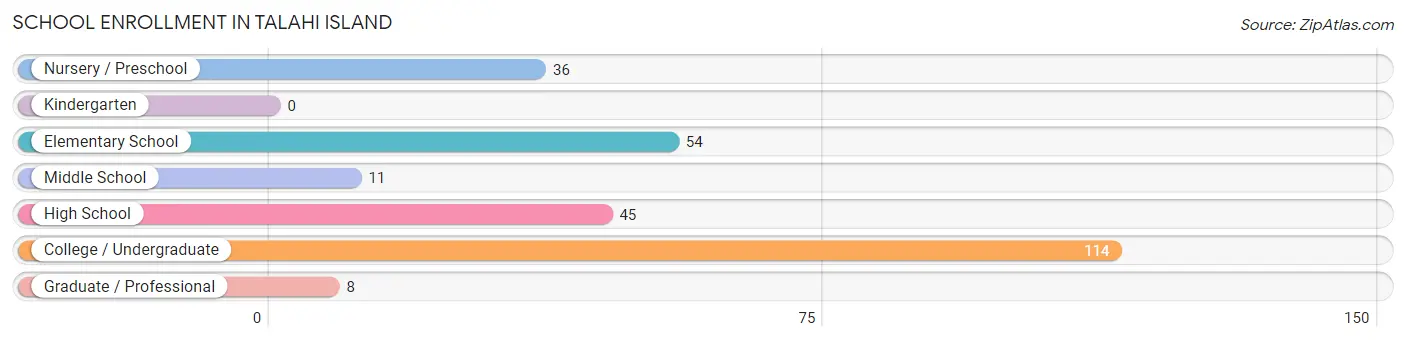
School Enrollment in Talahi Island
The most common levels of schooling among the 268 students in Talahi Island are college / undergraduate (114 | 42.5%), elementary school (54 | 20.2%), and high school (45 | 16.8%).
| School Level | # Students | % Students |
| Nursery / Preschool | 36 | 13.4% |
| Kindergarten | 0 | 0.0% |
| Elementary School | 54 | 20.2% |
| Middle School | 11 | 4.1% |
| High School | 45 | 16.8% |
| College / Undergraduate | 114 | 42.5% |
| Graduate / Professional | 8 | 3.0% |
| Total | 268 | 100.0% |
School Enrollment by Age by Funding Source in Talahi Island
Out of a total of 268 students who are enrolled in schools in Talahi Island, 143 (53.4%) attend a private institution, while the remaining 125 (46.6%) are enrolled in public schools. The age group of 3 to 4 year olds has the highest likelihood of being enrolled in private schools, with 20 (100.0% in the age bracket) enrolled. Conversely, the age group of 10 to 14 year olds has the lowest likelihood of being enrolled in a private school, with 11 (100.0% in the age bracket) attending a public institution.
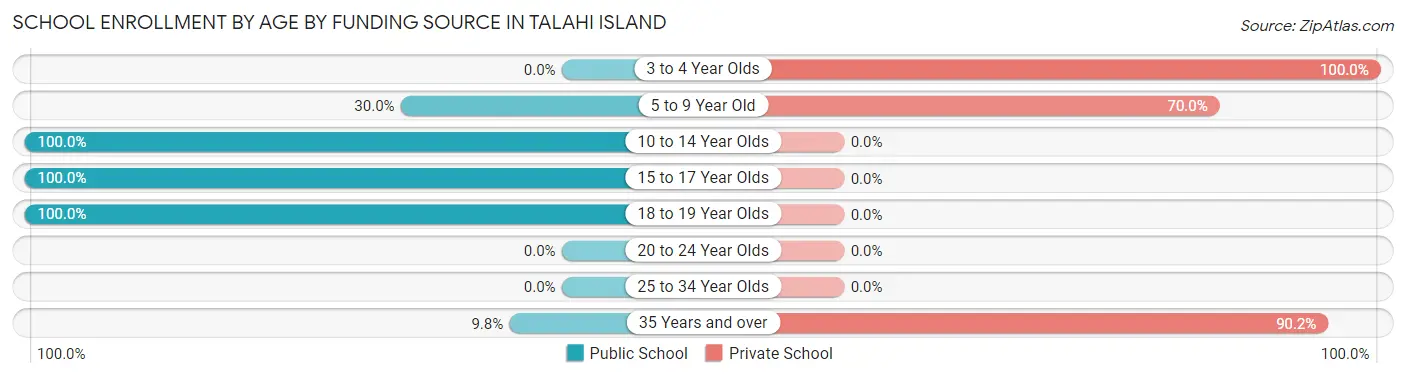
| Age Bracket | Public School | Private School |
| 3 to 4 Year Olds | 0 (0.0%) | 20 (100.0%) |
| 5 to 9 Year Old | 21 (30.0%) | 49 (70.0%) |
| 10 to 14 Year Olds | 11 (100.0%) | 0 (0.0%) |
| 15 to 17 Year Olds | 45 (100.0%) | 0 (0.0%) |
| 18 to 19 Year Olds | 40 (100.0%) | 0 (0.0%) |
| 20 to 24 Year Olds | 0 (0.0%) | 0 (0.0%) |
| 25 to 34 Year Olds | 0 (0.0%) | 0 (0.0%) |
| 35 Years and over | 8 (9.8%) | 74 (90.2%) |
| Total | 125 (46.6%) | 143 (53.4%) |
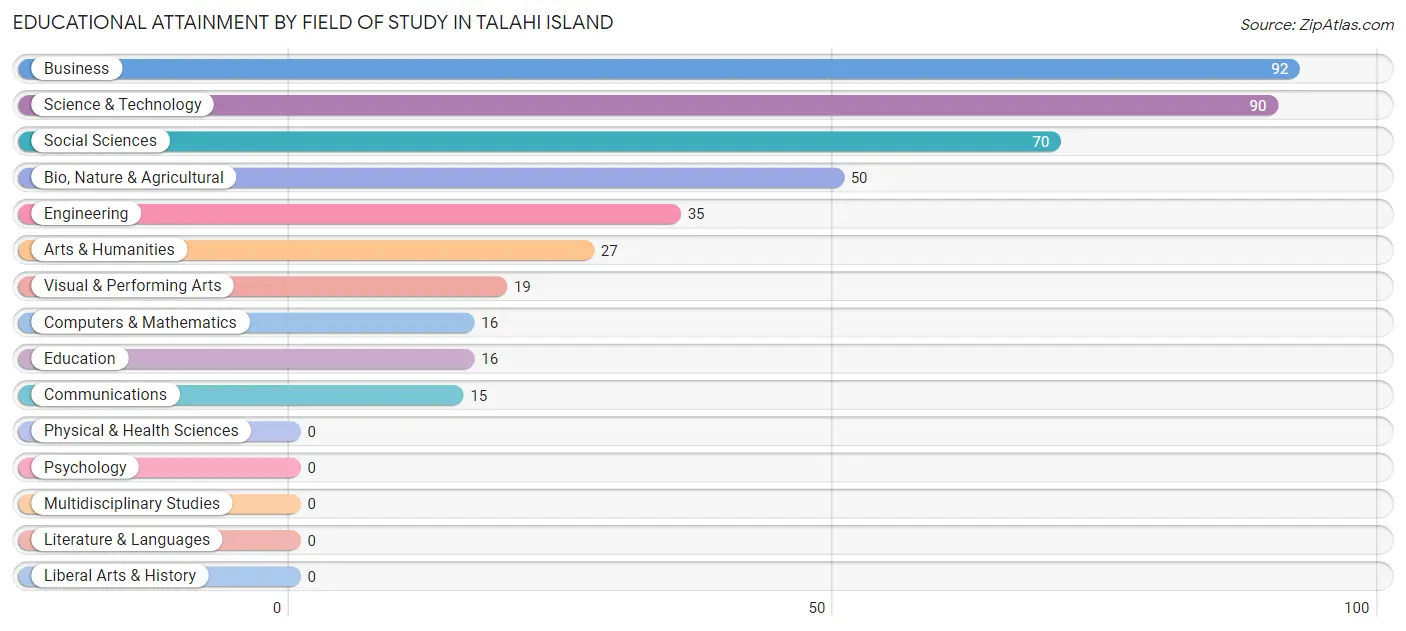
Educational Attainment by Field of Study in Talahi Island
Business (92 | 21.4%), science & technology (90 | 20.9%), social sciences (70 | 16.3%), bio, nature & agricultural (50 | 11.6%), and engineering (35 | 8.1%) are the most common fields of study among 430 individuals in Talahi Island who have obtained a bachelor's degree or higher.
| Field of Study | # Graduates | % Graduates |
| Computers & Mathematics | 16 | 3.7% |
| Bio, Nature & Agricultural | 50 | 11.6% |
| Physical & Health Sciences | 0 | 0.0% |
| Psychology | 0 | 0.0% |
| Social Sciences | 70 | 16.3% |
| Engineering | 35 | 8.1% |
| Multidisciplinary Studies | 0 | 0.0% |
| Science & Technology | 90 | 20.9% |
| Business | 92 | 21.4% |
| Education | 16 | 3.7% |
| Literature & Languages | 0 | 0.0% |
| Liberal Arts & History | 0 | 0.0% |
| Visual & Performing Arts | 19 | 4.4% |
| Communications | 15 | 3.5% |
| Arts & Humanities | 27 | 6.3% |
| Total | 430 | 100.0% |
Transportation & Commute in Talahi Island
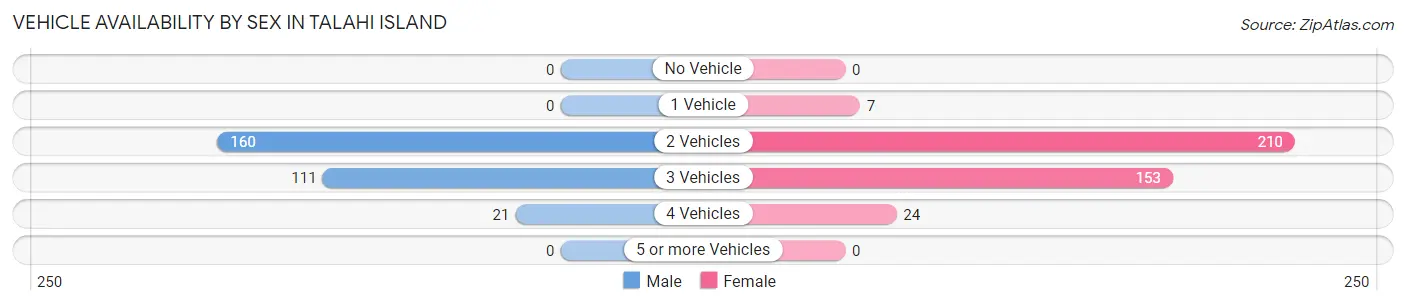
Vehicle Availability by Sex in Talahi Island
The most prevalent vehicle ownership categories in Talahi Island are males with 2 vehicles (160, accounting for 54.8%) and females with 2 vehicles (210, making up 40.6%).
| Vehicles Available | Male | Female |
| No Vehicle | 0 (0.0%) | 0 (0.0%) |
| 1 Vehicle | 0 (0.0%) | 7 (1.8%) |
| 2 Vehicles | 160 (54.8%) | 210 (53.3%) |
| 3 Vehicles | 111 (38.0%) | 153 (38.8%) |
| 4 Vehicles | 21 (7.2%) | 24 (6.1%) |
| 5 or more Vehicles | 0 (0.0%) | 0 (0.0%) |
| Total | 292 (100.0%) | 394 (100.0%) |
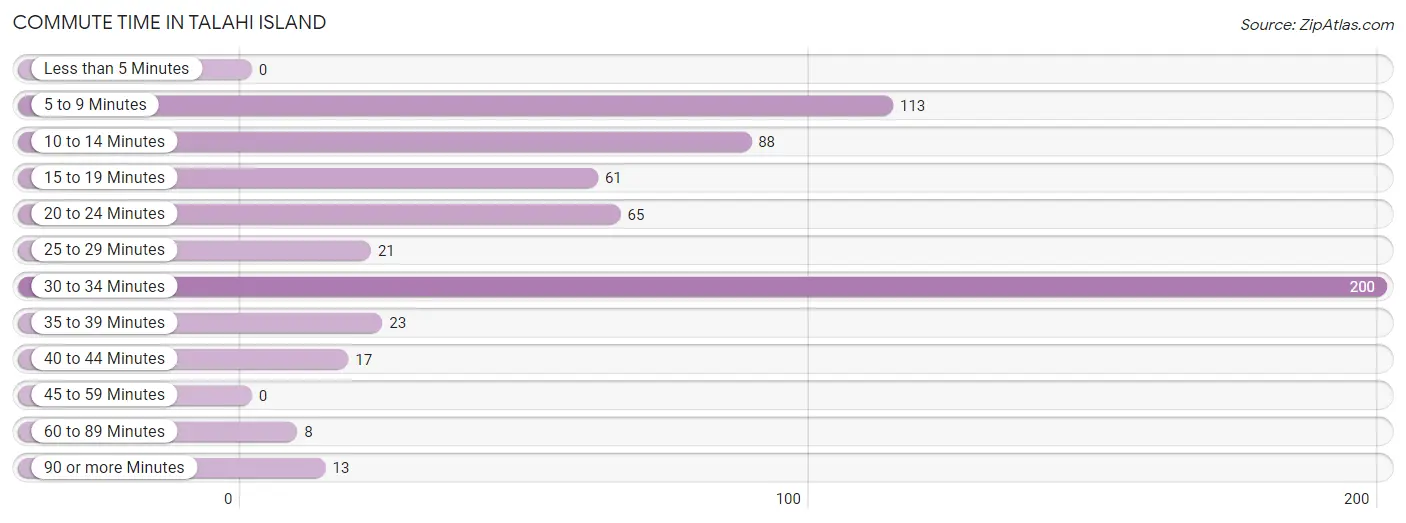
Commute Time in Talahi Island
The most frequently occuring commute durations in Talahi Island are 30 to 34 minutes (200 commuters, 32.8%), 5 to 9 minutes (113 commuters, 18.6%), and 10 to 14 minutes (88 commuters, 14.4%).
| Commute Time | # Commuters | % Commuters |
| Less than 5 Minutes | 0 | 0.0% |
| 5 to 9 Minutes | 113 | 18.6% |
| 10 to 14 Minutes | 88 | 14.4% |
| 15 to 19 Minutes | 61 | 10.0% |
| 20 to 24 Minutes | 65 | 10.7% |
| 25 to 29 Minutes | 21 | 3.5% |
| 30 to 34 Minutes | 200 | 32.8% |
| 35 to 39 Minutes | 23 | 3.8% |
| 40 to 44 Minutes | 17 | 2.8% |
| 45 to 59 Minutes | 0 | 0.0% |
| 60 to 89 Minutes | 8 | 1.3% |
| 90 or more Minutes | 13 | 2.1% |
Commute Time by Sex in Talahi Island
The most common commute times in Talahi Island are 30 to 34 minutes (121 commuters, 44.5%) for males and 5 to 9 minutes (85 commuters, 25.2%) for females.
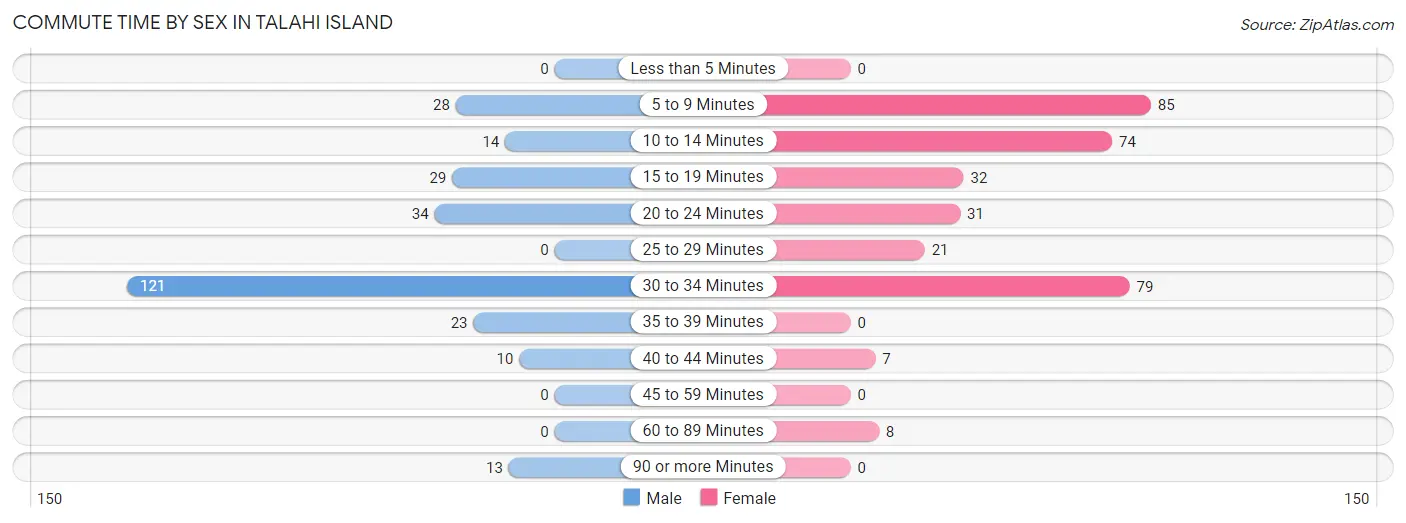
| Commute Time | Male | Female |
| Less than 5 Minutes | 0 (0.0%) | 0 (0.0%) |
| 5 to 9 Minutes | 28 (10.3%) | 85 (25.2%) |
| 10 to 14 Minutes | 14 (5.1%) | 74 (22.0%) |
| 15 to 19 Minutes | 29 (10.7%) | 32 (9.5%) |
| 20 to 24 Minutes | 34 (12.5%) | 31 (9.2%) |
| 25 to 29 Minutes | 0 (0.0%) | 21 (6.2%) |
| 30 to 34 Minutes | 121 (44.5%) | 79 (23.4%) |
| 35 to 39 Minutes | 23 (8.5%) | 0 (0.0%) |
| 40 to 44 Minutes | 10 (3.7%) | 7 (2.1%) |
| 45 to 59 Minutes | 0 (0.0%) | 0 (0.0%) |
| 60 to 89 Minutes | 0 (0.0%) | 8 (2.4%) |
| 90 or more Minutes | 13 (4.8%) | 0 (0.0%) |
Time of Departure to Work by Sex in Talahi Island
The most frequent times of departure to work in Talahi Island are 6:30 AM to 6:59 AM (108, 39.7%) for males and 10:00 AM to 10:59 AM (83, 24.6%) for females.
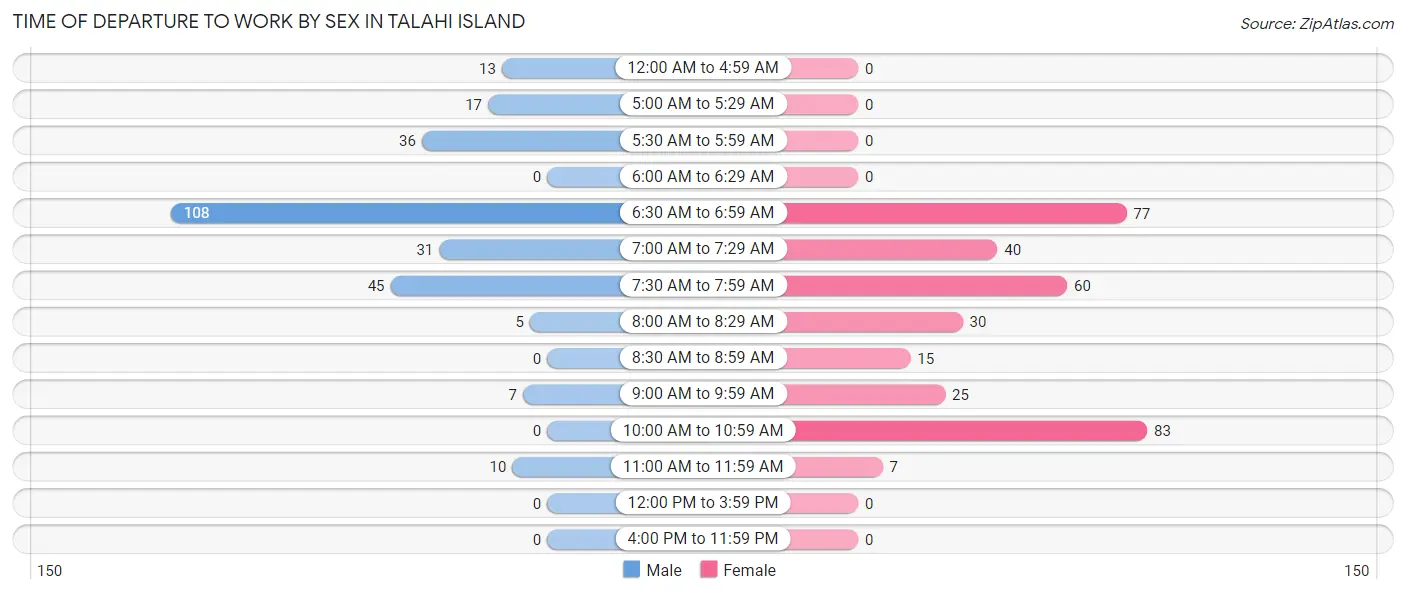
| Time of Departure | Male | Female |
| 12:00 AM to 4:59 AM | 13 (4.8%) | 0 (0.0%) |
| 5:00 AM to 5:29 AM | 17 (6.2%) | 0 (0.0%) |
| 5:30 AM to 5:59 AM | 36 (13.2%) | 0 (0.0%) |
| 6:00 AM to 6:29 AM | 0 (0.0%) | 0 (0.0%) |
| 6:30 AM to 6:59 AM | 108 (39.7%) | 77 (22.9%) |
| 7:00 AM to 7:29 AM | 31 (11.4%) | 40 (11.9%) |
| 7:30 AM to 7:59 AM | 45 (16.5%) | 60 (17.8%) |
| 8:00 AM to 8:29 AM | 5 (1.8%) | 30 (8.9%) |
| 8:30 AM to 8:59 AM | 0 (0.0%) | 15 (4.4%) |
| 9:00 AM to 9:59 AM | 7 (2.6%) | 25 (7.4%) |
| 10:00 AM to 10:59 AM | 0 (0.0%) | 83 (24.6%) |
| 11:00 AM to 11:59 AM | 10 (3.7%) | 7 (2.1%) |
| 12:00 PM to 3:59 PM | 0 (0.0%) | 0 (0.0%) |
| 4:00 PM to 11:59 PM | 0 (0.0%) | 0 (0.0%) |
| Total | 272 (100.0%) | 337 (100.0%) |
Housing Occupancy in Talahi Island
Occupancy by Ownership in Talahi Island
Of the total 507 dwellings in Talahi Island, owner-occupied units account for 492 (97.0%), while renter-occupied units make up 15 (3.0%).
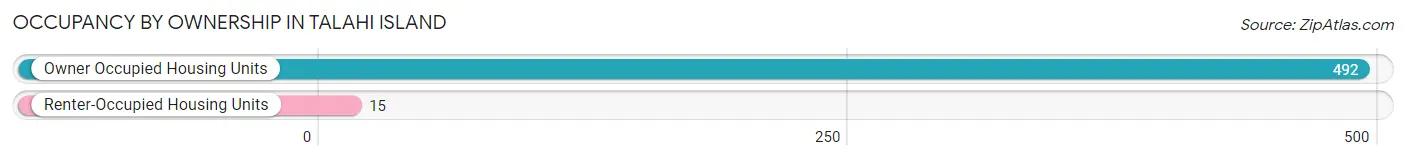
| Occupancy | # Housing Units | % Housing Units |
| Owner Occupied Housing Units | 492 | 97.0% |
| Renter-Occupied Housing Units | 15 | 3.0% |
| Total Occupied Housing Units | 507 | 100.0% |
Occupancy by Household Size in Talahi Island
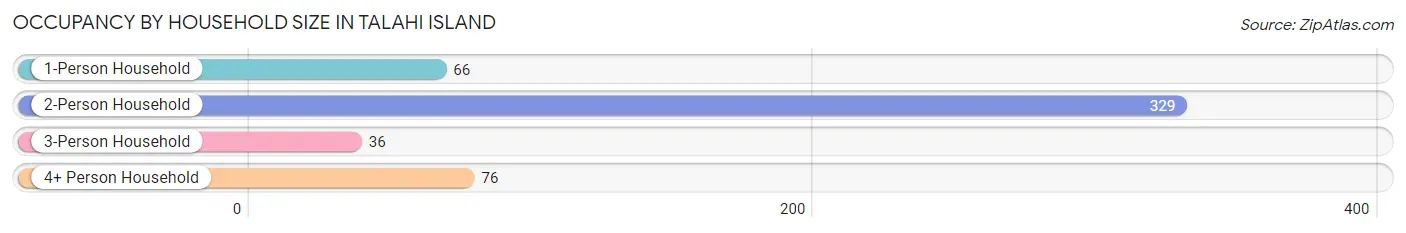
| Household Size | # Housing Units | % Housing Units |
| 1-Person Household | 66 | 13.0% |
| 2-Person Household | 329 | 64.9% |
| 3-Person Household | 36 | 7.1% |
| 4+ Person Household | 76 | 15.0% |
| Total Housing Units | 507 | 100.0% |
Occupancy by Ownership by Household Size in Talahi Island
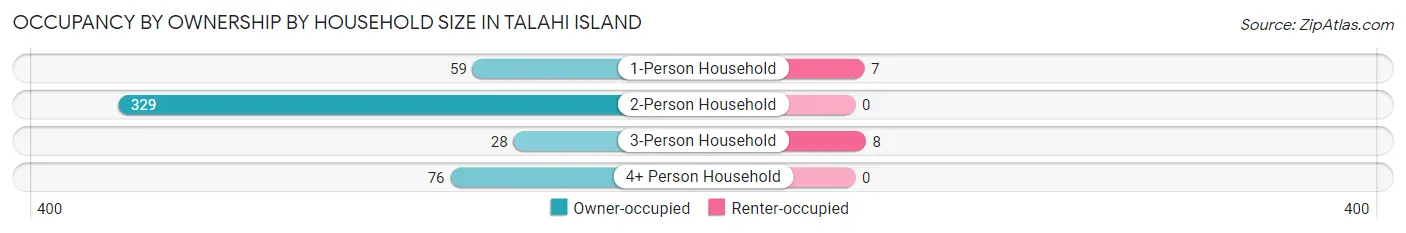
| Household Size | Owner-occupied | Renter-occupied |
| 1-Person Household | 59 (89.4%) | 7 (10.6%) |
| 2-Person Household | 329 (100.0%) | 0 (0.0%) |
| 3-Person Household | 28 (77.8%) | 8 (22.2%) |
| 4+ Person Household | 76 (100.0%) | 0 (0.0%) |
| Total Housing Units | 492 (97.0%) | 15 (3.0%) |
Occupancy by Educational Attainment in Talahi Island
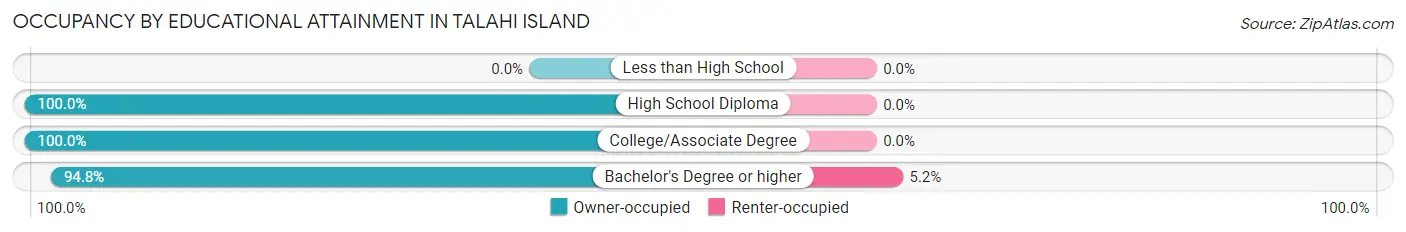
| Household Size | Owner-occupied | Renter-occupied |
| Less than High School | 0 (0.0%) | 0 (0.0%) |
| High School Diploma | 7 (100.0%) | 0 (0.0%) |
| College/Associate Degree | 213 (100.0%) | 0 (0.0%) |
| Bachelor's Degree or higher | 272 (94.8%) | 15 (5.2%) |
Occupancy by Age of Householder in Talahi Island
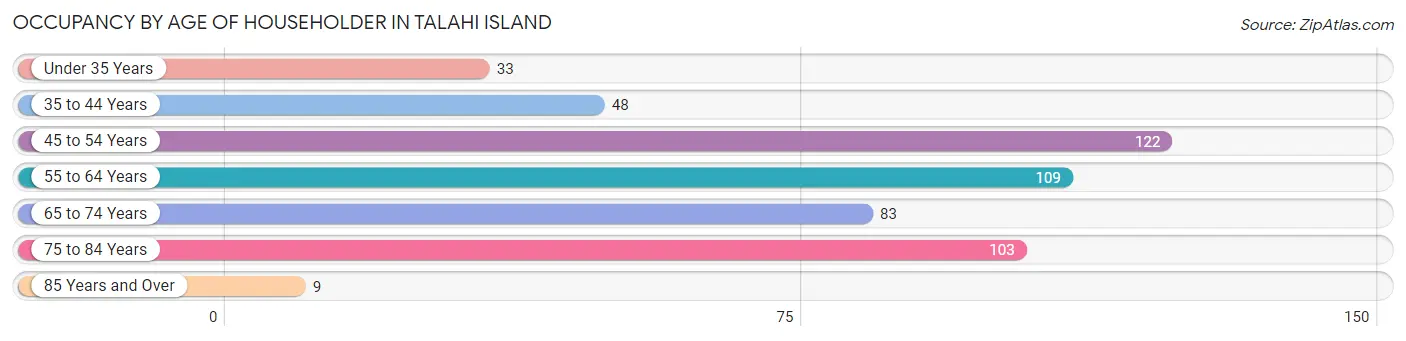
| Age Bracket | # Households | % Households |
| Under 35 Years | 33 | 6.5% |
| 35 to 44 Years | 48 | 9.5% |
| 45 to 54 Years | 122 | 24.1% |
| 55 to 64 Years | 109 | 21.5% |
| 65 to 74 Years | 83 | 16.4% |
| 75 to 84 Years | 103 | 20.3% |
| 85 Years and Over | 9 | 1.8% |
| Total | 507 | 100.0% |
Housing Finances in Talahi Island
Median Income by Occupancy in Talahi Island
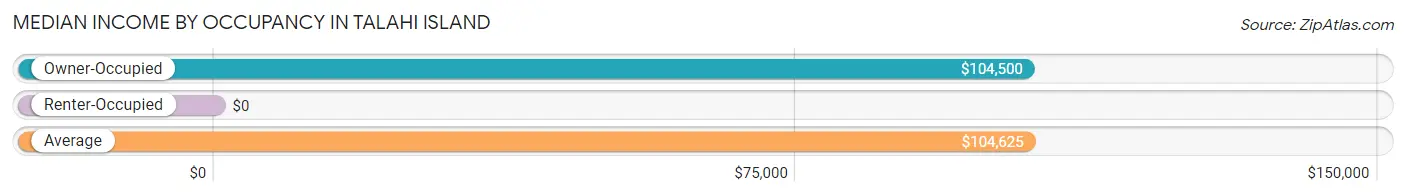
| Occupancy Type | # Households | Median Income |
| Owner-Occupied | 492 (97.0%) | $104,500 |
| Renter-Occupied | 15 (3.0%) | $0 |
| Average | 507 (100.0%) | $104,625 |
Occupancy by Householder Income Bracket in Talahi Island
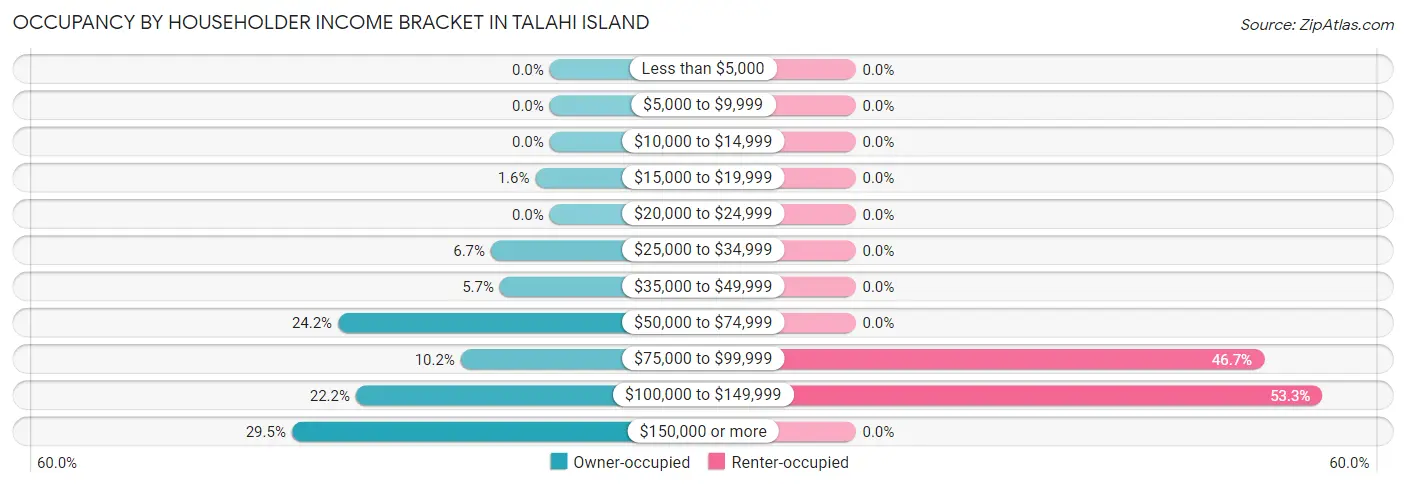
| Income Bracket | Owner-occupied | Renter-occupied |
| Less than $5,000 | 0 (0.0%) | 0 (0.0%) |
| $5,000 to $9,999 | 0 (0.0%) | 0 (0.0%) |
| $10,000 to $14,999 | 0 (0.0%) | 0 (0.0%) |
| $15,000 to $19,999 | 8 (1.6%) | 0 (0.0%) |
| $20,000 to $24,999 | 0 (0.0%) | 0 (0.0%) |
| $25,000 to $34,999 | 33 (6.7%) | 0 (0.0%) |
| $35,000 to $49,999 | 28 (5.7%) | 0 (0.0%) |
| $50,000 to $74,999 | 119 (24.2%) | 0 (0.0%) |
| $75,000 to $99,999 | 50 (10.2%) | 7 (46.7%) |
| $100,000 to $149,999 | 109 (22.2%) | 8 (53.3%) |
| $150,000 or more | 145 (29.5%) | 0 (0.0%) |
| Total | 492 (100.0%) | 15 (100.0%) |
Monthly Housing Cost Tiers in Talahi Island
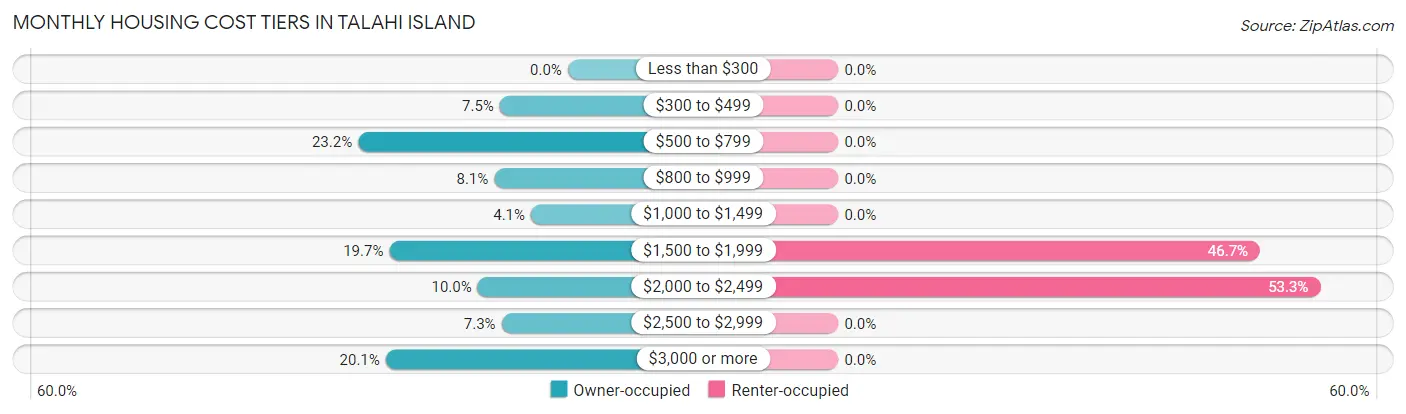
| Monthly Cost | Owner-occupied | Renter-occupied |
| Less than $300 | 0 (0.0%) | 0 (0.0%) |
| $300 to $499 | 37 (7.5%) | 0 (0.0%) |
| $500 to $799 | 114 (23.2%) | 0 (0.0%) |
| $800 to $999 | 40 (8.1%) | 0 (0.0%) |
| $1,000 to $1,499 | 20 (4.1%) | 0 (0.0%) |
| $1,500 to $1,999 | 97 (19.7%) | 7 (46.7%) |
| $2,000 to $2,499 | 49 (10.0%) | 8 (53.3%) |
| $2,500 to $2,999 | 36 (7.3%) | 0 (0.0%) |
| $3,000 or more | 99 (20.1%) | 0 (0.0%) |
| Total | 492 (100.0%) | 15 (100.0%) |
Physical Housing Characteristics in Talahi Island
Housing Structures in Talahi Island
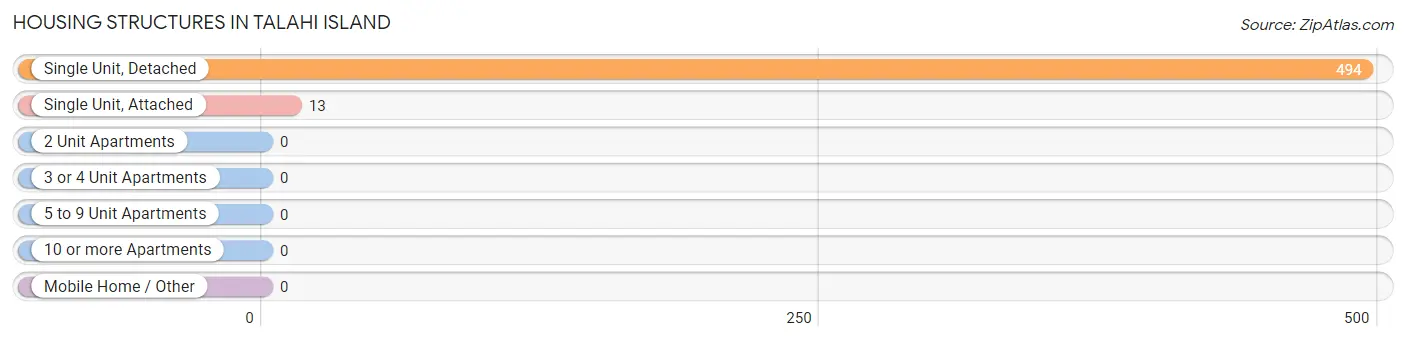
| Structure Type | # Housing Units | % Housing Units |
| Single Unit, Detached | 494 | 97.4% |
| Single Unit, Attached | 13 | 2.6% |
| 2 Unit Apartments | 0 | 0.0% |
| 3 or 4 Unit Apartments | 0 | 0.0% |
| 5 to 9 Unit Apartments | 0 | 0.0% |
| 10 or more Apartments | 0 | 0.0% |
| Mobile Home / Other | 0 | 0.0% |
| Total | 507 | 100.0% |
Housing Structures by Occupancy in Talahi Island
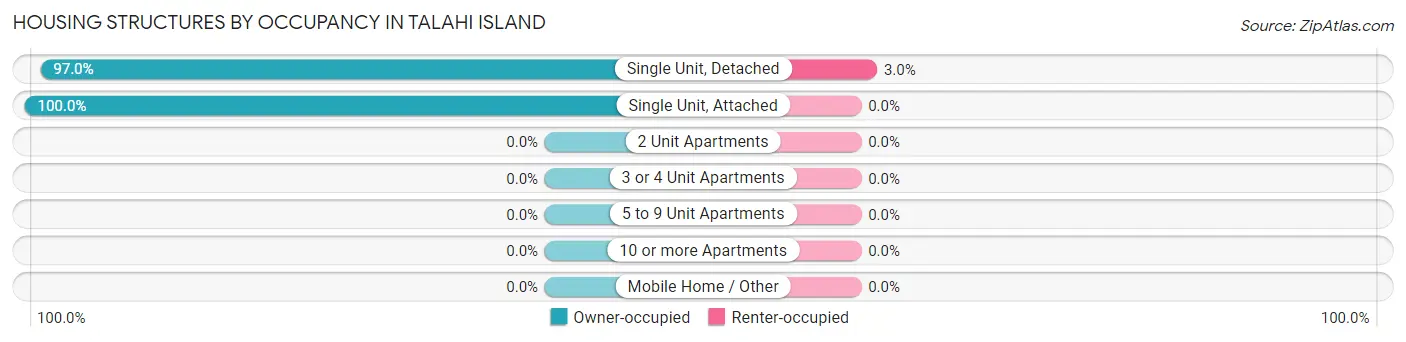
| Structure Type | Owner-occupied | Renter-occupied |
| Single Unit, Detached | 479 (97.0%) | 15 (3.0%) |
| Single Unit, Attached | 13 (100.0%) | 0 (0.0%) |
| 2 Unit Apartments | 0 (0.0%) | 0 (0.0%) |
| 3 or 4 Unit Apartments | 0 (0.0%) | 0 (0.0%) |
| 5 to 9 Unit Apartments | 0 (0.0%) | 0 (0.0%) |
| 10 or more Apartments | 0 (0.0%) | 0 (0.0%) |
| Mobile Home / Other | 0 (0.0%) | 0 (0.0%) |
| Total | 492 (97.0%) | 15 (3.0%) |
Housing Structures by Number of Rooms in Talahi Island
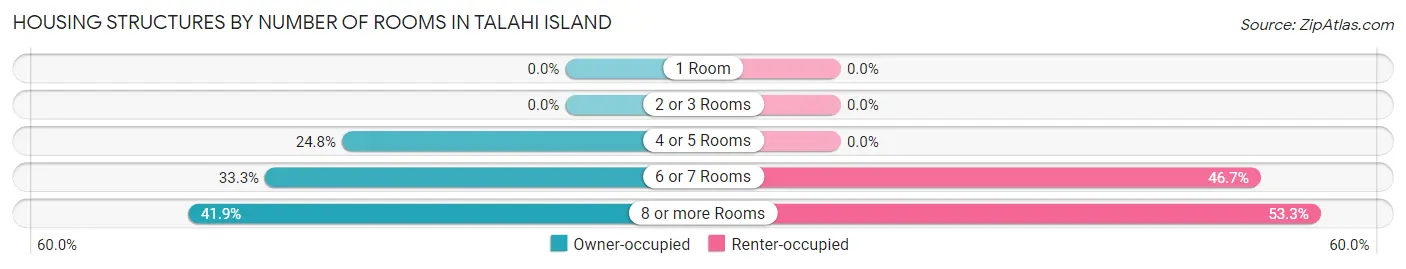
| Number of Rooms | Owner-occupied | Renter-occupied |
| 1 Room | 0 (0.0%) | 0 (0.0%) |
| 2 or 3 Rooms | 0 (0.0%) | 0 (0.0%) |
| 4 or 5 Rooms | 122 (24.8%) | 0 (0.0%) |
| 6 or 7 Rooms | 164 (33.3%) | 7 (46.7%) |
| 8 or more Rooms | 206 (41.9%) | 8 (53.3%) |
| Total | 492 (100.0%) | 15 (100.0%) |
Housing Structure by Heating Type in Talahi Island
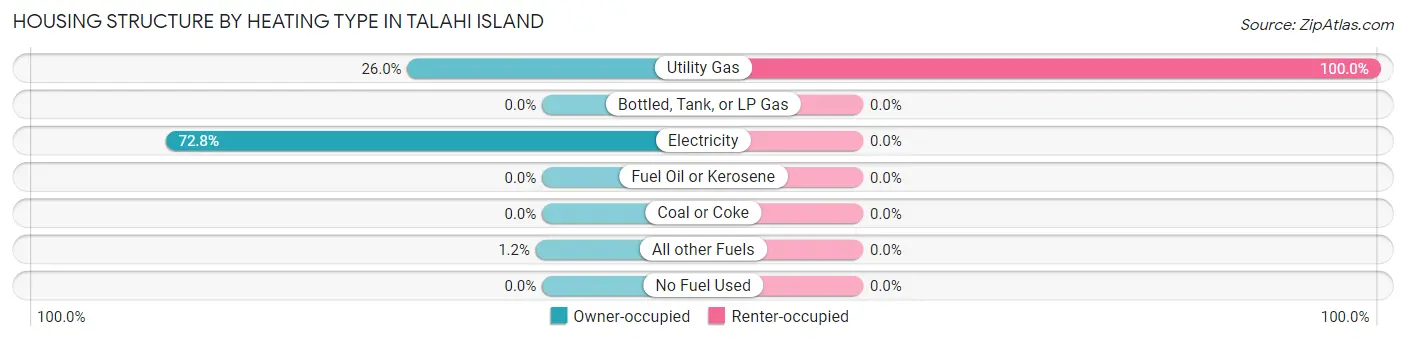
| Heating Type | Owner-occupied | Renter-occupied |
| Utility Gas | 128 (26.0%) | 15 (100.0%) |
| Bottled, Tank, or LP Gas | 0 (0.0%) | 0 (0.0%) |
| Electricity | 358 (72.8%) | 0 (0.0%) |
| Fuel Oil or Kerosene | 0 (0.0%) | 0 (0.0%) |
| Coal or Coke | 0 (0.0%) | 0 (0.0%) |
| All other Fuels | 6 (1.2%) | 0 (0.0%) |
| No Fuel Used | 0 (0.0%) | 0 (0.0%) |
| Total | 492 (100.0%) | 15 (100.0%) |
Household Vehicle Usage in Talahi Island
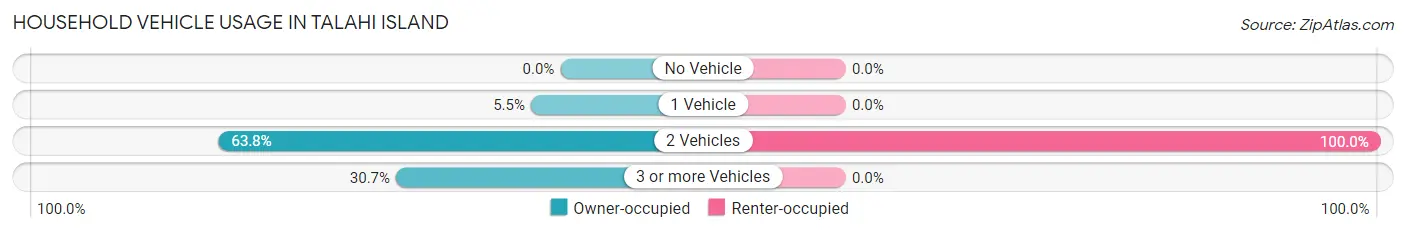
| Vehicles per Household | Owner-occupied | Renter-occupied |
| No Vehicle | 0 (0.0%) | 0 (0.0%) |
| 1 Vehicle | 27 (5.5%) | 0 (0.0%) |
| 2 Vehicles | 314 (63.8%) | 15 (100.0%) |
| 3 or more Vehicles | 151 (30.7%) | 0 (0.0%) |
| Total | 492 (100.0%) | 15 (100.0%) |
Real Estate & Mortgages in Talahi Island
Real Estate and Mortgage Overview in Talahi Island
| Characteristic | Without Mortgage | With Mortgage |
| Housing Units | 211 | 281 |
| Median Property Value | $372,800 | $470,000 |
| Median Household Income | $102,875 | $103 |
| Monthly Housing Costs | $674 | $99 |
| Real Estate Taxes | $3,231 | $8 |
Property Value by Mortgage Status in Talahi Island
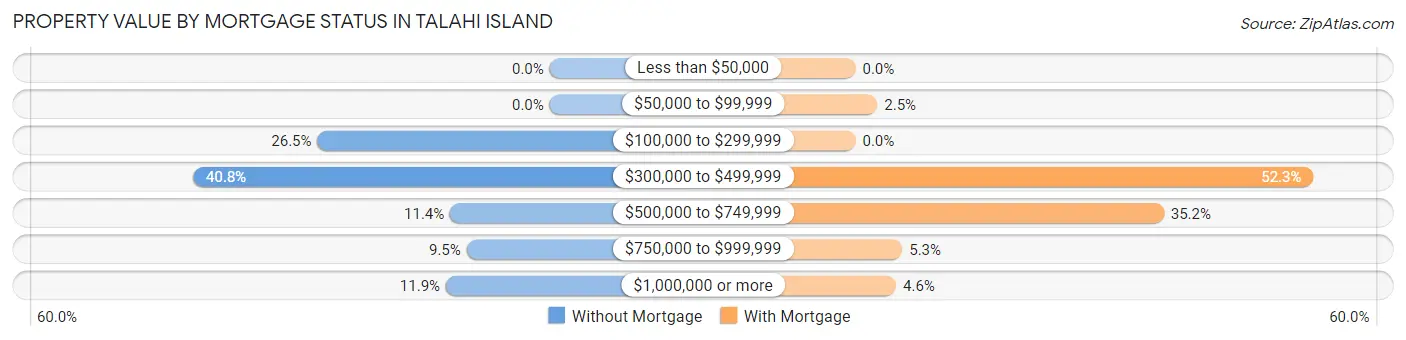
| Property Value | Without Mortgage | With Mortgage |
| Less than $50,000 | 0 (0.0%) | 0 (0.0%) |
| $50,000 to $99,999 | 0 (0.0%) | 7 (2.5%) |
| $100,000 to $299,999 | 56 (26.5%) | 0 (0.0%) |
| $300,000 to $499,999 | 86 (40.8%) | 147 (52.3%) |
| $500,000 to $749,999 | 24 (11.4%) | 99 (35.2%) |
| $750,000 to $999,999 | 20 (9.5%) | 15 (5.3%) |
| $1,000,000 or more | 25 (11.8%) | 13 (4.6%) |
| Total | 211 (100.0%) | 281 (100.0%) |
Household Income by Mortgage Status in Talahi Island
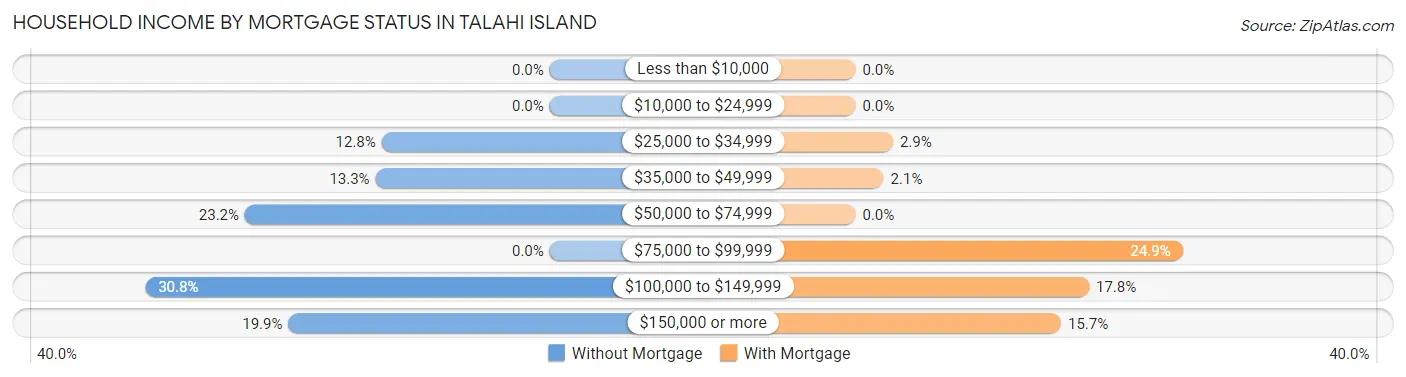
| Household Income | Without Mortgage | With Mortgage |
| Less than $10,000 | 0 (0.0%) | 0 (0.0%) |
| $10,000 to $24,999 | 0 (0.0%) | 0 (0.0%) |
| $25,000 to $34,999 | 27 (12.8%) | 8 (2.9%) |
| $35,000 to $49,999 | 28 (13.3%) | 6 (2.1%) |
| $50,000 to $74,999 | 49 (23.2%) | 0 (0.0%) |
| $75,000 to $99,999 | 0 (0.0%) | 70 (24.9%) |
| $100,000 to $149,999 | 65 (30.8%) | 50 (17.8%) |
| $150,000 or more | 42 (19.9%) | 44 (15.7%) |
| Total | 211 (100.0%) | 281 (100.0%) |
Property Value to Household Income Ratio in Talahi Island
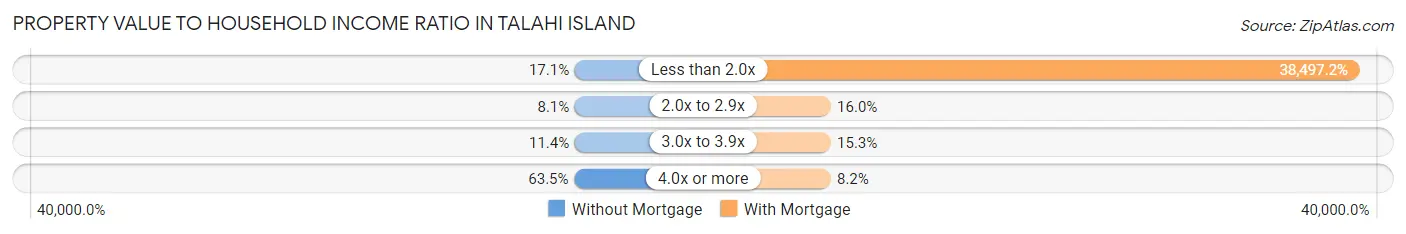
| Value-to-Income Ratio | Without Mortgage | With Mortgage |
| Less than 2.0x | 36 (17.1%) | 108,177 (38,497.1%) |
| 2.0x to 2.9x | 17 (8.1%) | 45 (16.0%) |
| 3.0x to 3.9x | 24 (11.4%) | 43 (15.3%) |
| 4.0x or more | 134 (63.5%) | 23 (8.2%) |
| Total | 211 (100.0%) | 281 (100.0%) |
Real Estate Taxes by Mortgage Status in Talahi Island
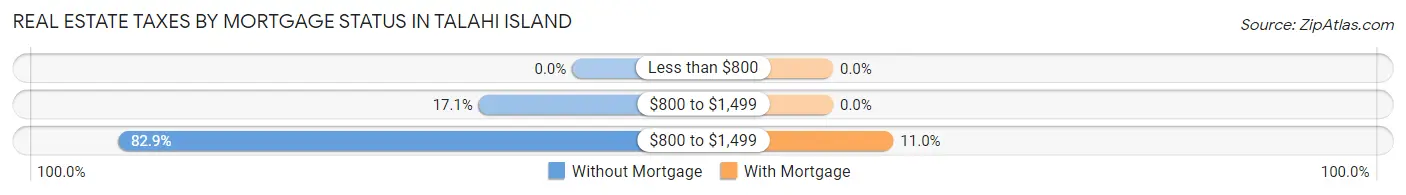
| Property Taxes | Without Mortgage | With Mortgage |
| Less than $800 | 0 (0.0%) | 0 (0.0%) |
| $800 to $1,499 | 36 (17.1%) | 0 (0.0%) |
| $800 to $1,499 | 175 (82.9%) | 31 (11.0%) |
| Total | 211 (100.0%) | 281 (100.0%) |
Health & Disability in Talahi Island
Health Insurance Coverage by Age in Talahi Island
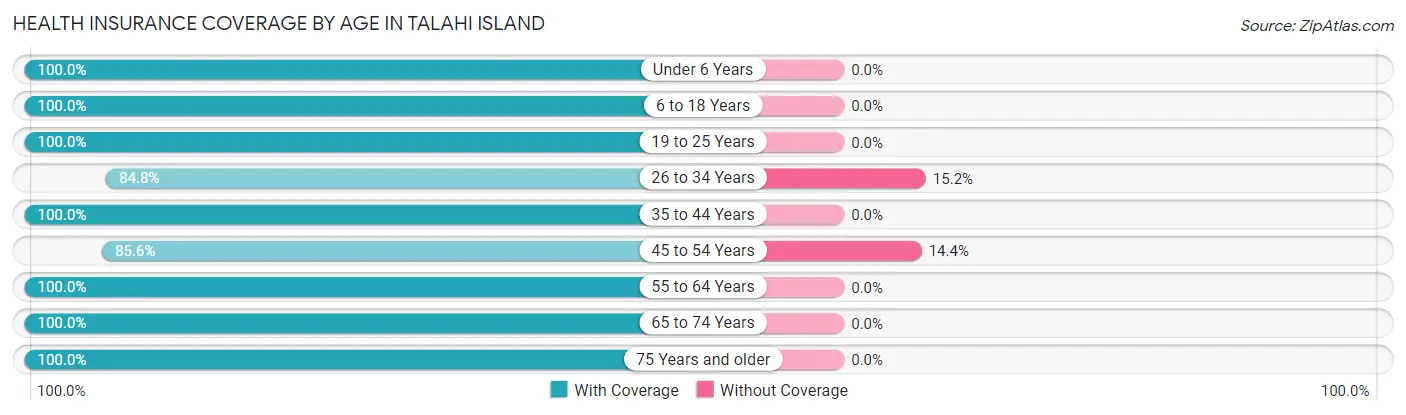
| Age Bracket | With Coverage | Without Coverage |
| Under 6 Years | 72 (100.0%) | 0 (0.0%) |
| 6 to 18 Years | 150 (100.0%) | 0 (0.0%) |
| 19 to 25 Years | 46 (100.0%) | 0 (0.0%) |
| 26 to 34 Years | 39 (84.8%) | 7 (15.2%) |
| 35 to 44 Years | 142 (100.0%) | 0 (0.0%) |
| 45 to 54 Years | 160 (85.6%) | 27 (14.4%) |
| 55 to 64 Years | 203 (100.0%) | 0 (0.0%) |
| 65 to 74 Years | 156 (100.0%) | 0 (0.0%) |
| 75 Years and older | 175 (100.0%) | 0 (0.0%) |
| Total | 1,143 (97.1%) | 34 (2.9%) |
Health Insurance Coverage by Citizenship Status in Talahi Island
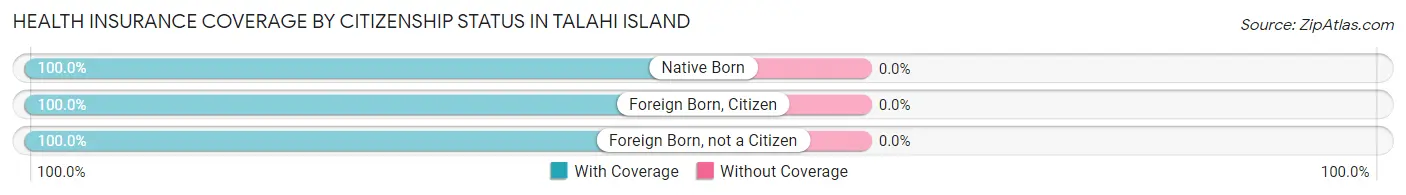
| Citizenship Status | With Coverage | Without Coverage |
| Native Born | 72 (100.0%) | 0 (0.0%) |
| Foreign Born, Citizen | 150 (100.0%) | 0 (0.0%) |
| Foreign Born, not a Citizen | 46 (100.0%) | 0 (0.0%) |
Health Insurance Coverage by Household Income in Talahi Island
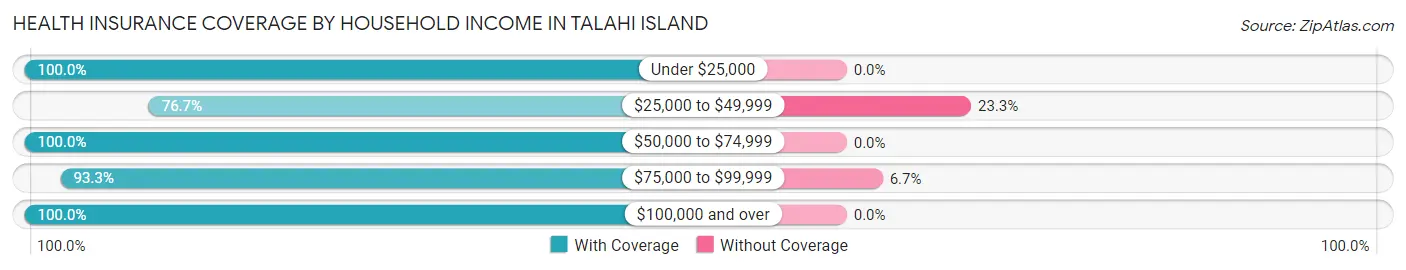
| Household Income | With Coverage | Without Coverage |
| Under $25,000 | 29 (100.0%) | 0 (0.0%) |
| $25,000 to $49,999 | 89 (76.7%) | 27 (23.3%) |
| $50,000 to $74,999 | 240 (100.0%) | 0 (0.0%) |
| $75,000 to $99,999 | 97 (93.3%) | 7 (6.7%) |
| $100,000 and over | 688 (100.0%) | 0 (0.0%) |
Public vs Private Health Insurance Coverage by Age in Talahi Island
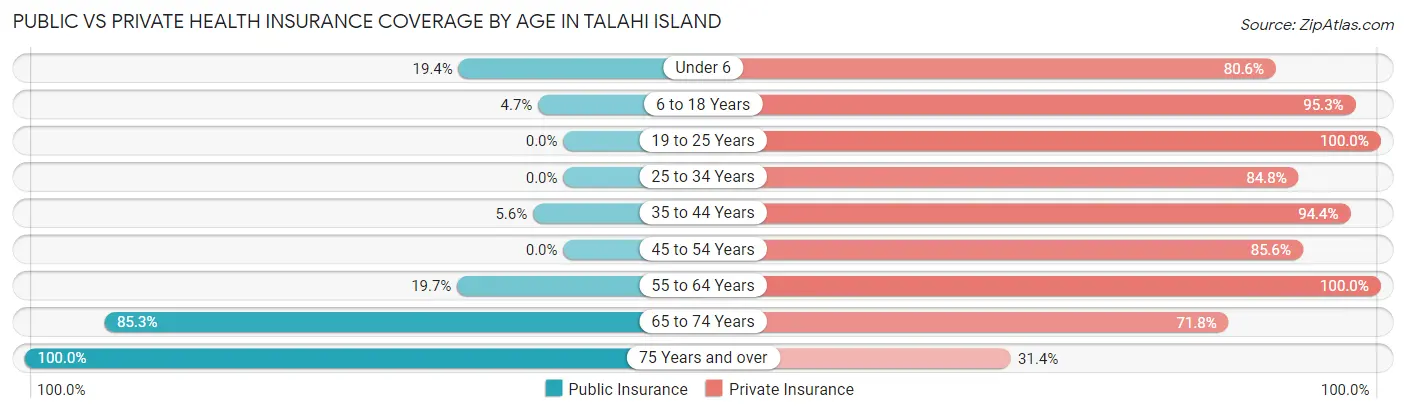
| Age Bracket | Public Insurance | Private Insurance |
| Under 6 | 14 (19.4%) | 58 (80.6%) |
| 6 to 18 Years | 7 (4.7%) | 143 (95.3%) |
| 19 to 25 Years | 0 (0.0%) | 46 (100.0%) |
| 25 to 34 Years | 0 (0.0%) | 39 (84.8%) |
| 35 to 44 Years | 8 (5.6%) | 134 (94.4%) |
| 45 to 54 Years | 0 (0.0%) | 160 (85.6%) |
| 55 to 64 Years | 40 (19.7%) | 203 (100.0%) |
| 65 to 74 Years | 133 (85.3%) | 112 (71.8%) |
| 75 Years and over | 175 (100.0%) | 55 (31.4%) |
| Total | 377 (32.0%) | 950 (80.7%) |
Disability Status by Sex by Age in Talahi Island
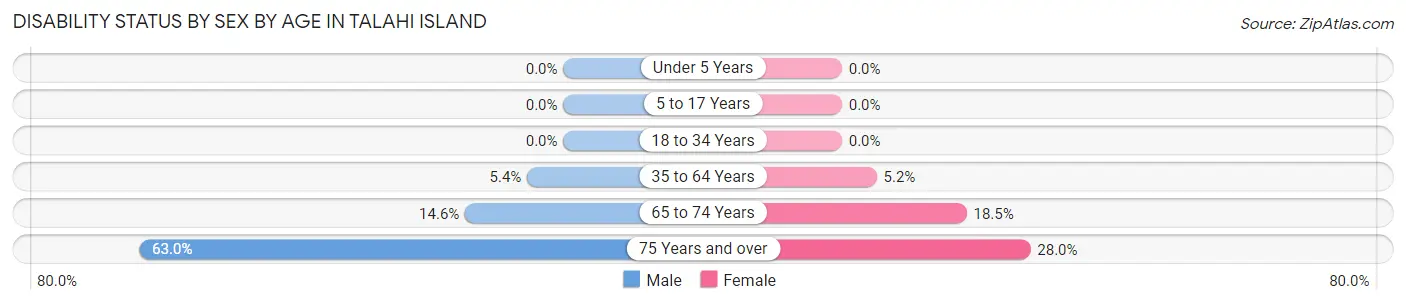
| Age Bracket | Male | Female |
| Under 5 Years | 0 (0.0%) | 0 (0.0%) |
| 5 to 17 Years | 0 (0.0%) | 0 (0.0%) |
| 18 to 34 Years | 0 (0.0%) | 0 (0.0%) |
| 35 to 64 Years | 13 (5.4%) | 15 (5.2%) |
| 65 to 74 Years | 7 (14.6%) | 20 (18.5%) |
| 75 Years and over | 63 (63.0%) | 21 (28.0%) |
Disability Class by Sex by Age in Talahi Island
Disability Class: Hearing Difficulty
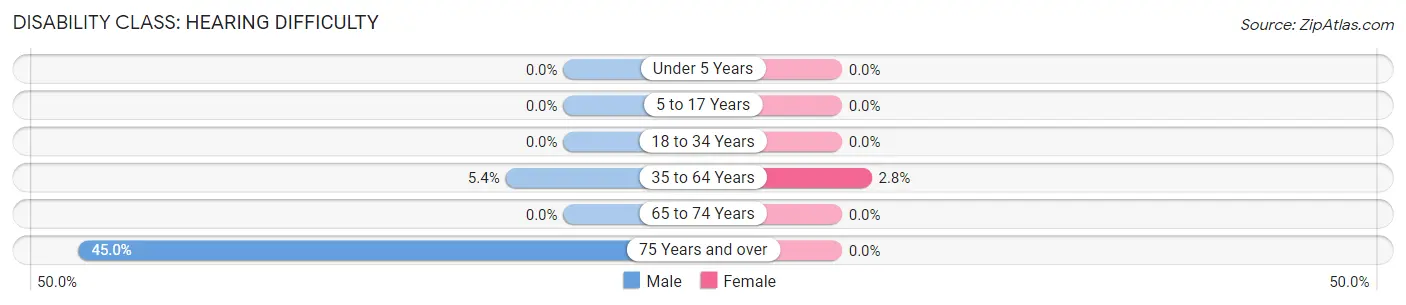
| Age Bracket | Male | Female |
| Under 5 Years | 0 (0.0%) | 0 (0.0%) |
| 5 to 17 Years | 0 (0.0%) | 0 (0.0%) |
| 18 to 34 Years | 0 (0.0%) | 0 (0.0%) |
| 35 to 64 Years | 13 (5.4%) | 8 (2.8%) |
| 65 to 74 Years | 0 (0.0%) | 0 (0.0%) |
| 75 Years and over | 45 (45.0%) | 0 (0.0%) |
Disability Class: Vision Difficulty
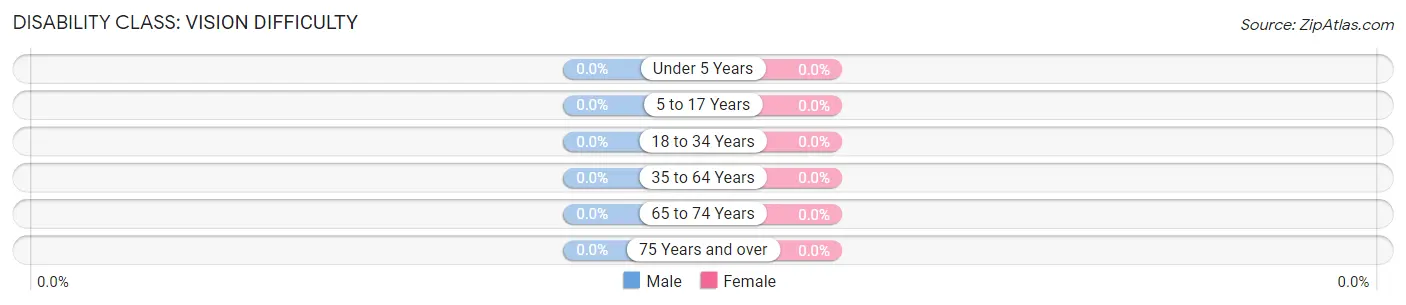
| Age Bracket | Male | Female |
| Under 5 Years | 0 (0.0%) | 0 (0.0%) |
| 5 to 17 Years | 0 (0.0%) | 0 (0.0%) |
| 18 to 34 Years | 0 (0.0%) | 0 (0.0%) |
| 35 to 64 Years | 0 (0.0%) | 0 (0.0%) |
| 65 to 74 Years | 0 (0.0%) | 0 (0.0%) |
| 75 Years and over | 0 (0.0%) | 0 (0.0%) |
Disability Class: Cognitive Difficulty
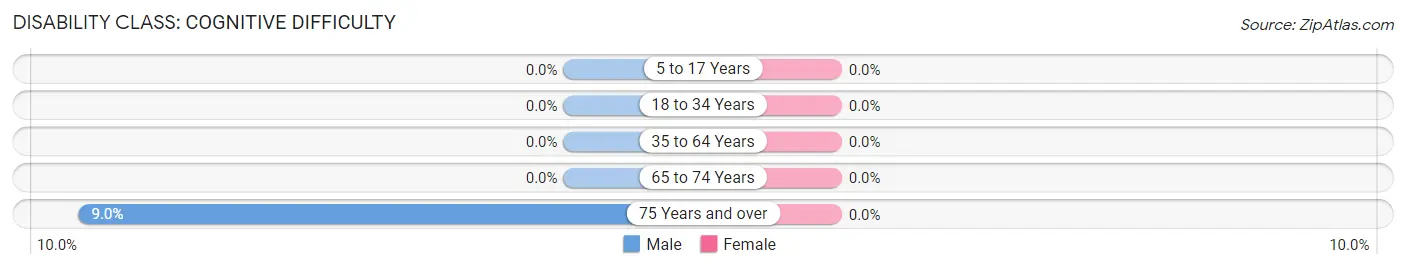
| Age Bracket | Male | Female |
| 5 to 17 Years | 0 (0.0%) | 0 (0.0%) |
| 18 to 34 Years | 0 (0.0%) | 0 (0.0%) |
| 35 to 64 Years | 0 (0.0%) | 0 (0.0%) |
| 65 to 74 Years | 0 (0.0%) | 0 (0.0%) |
| 75 Years and over | 9 (9.0%) | 0 (0.0%) |
Disability Class: Ambulatory Difficulty
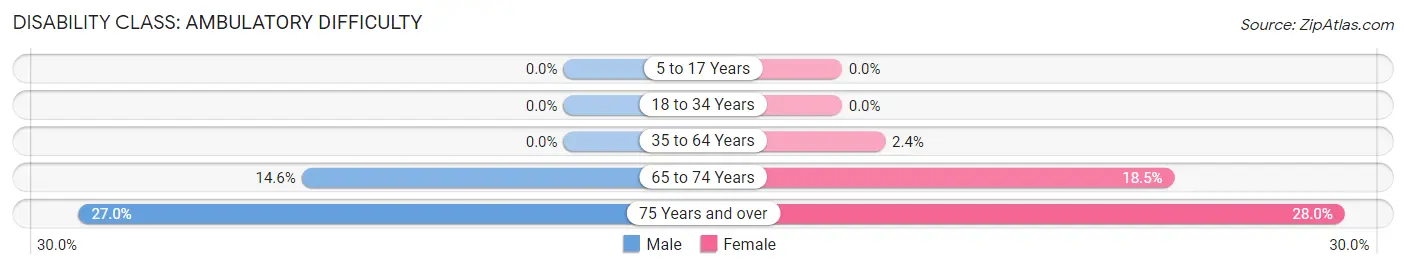
| Age Bracket | Male | Female |
| 5 to 17 Years | 0 (0.0%) | 0 (0.0%) |
| 18 to 34 Years | 0 (0.0%) | 0 (0.0%) |
| 35 to 64 Years | 0 (0.0%) | 7 (2.4%) |
| 65 to 74 Years | 7 (14.6%) | 20 (18.5%) |
| 75 Years and over | 27 (27.0%) | 21 (28.0%) |
Disability Class: Self-Care Difficulty
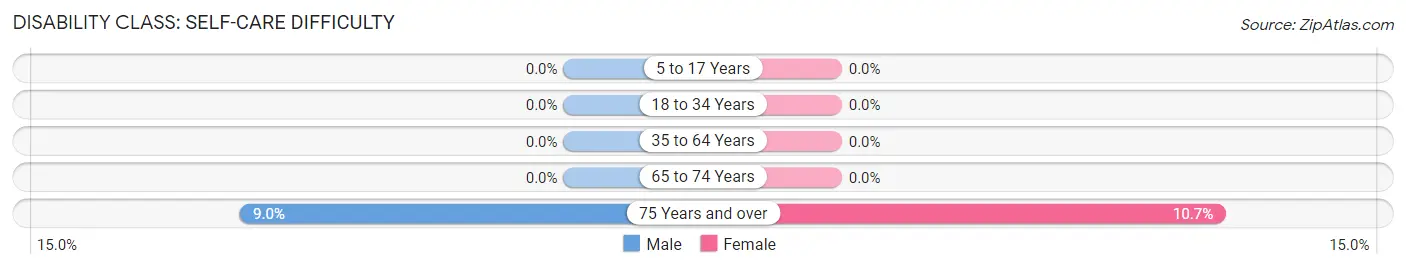
| Age Bracket | Male | Female |
| 5 to 17 Years | 0 (0.0%) | 0 (0.0%) |
| 18 to 34 Years | 0 (0.0%) | 0 (0.0%) |
| 35 to 64 Years | 0 (0.0%) | 0 (0.0%) |
| 65 to 74 Years | 0 (0.0%) | 0 (0.0%) |
| 75 Years and over | 9 (9.0%) | 8 (10.7%) |
Technology Access in Talahi Island
Computing Device Access in Talahi Island
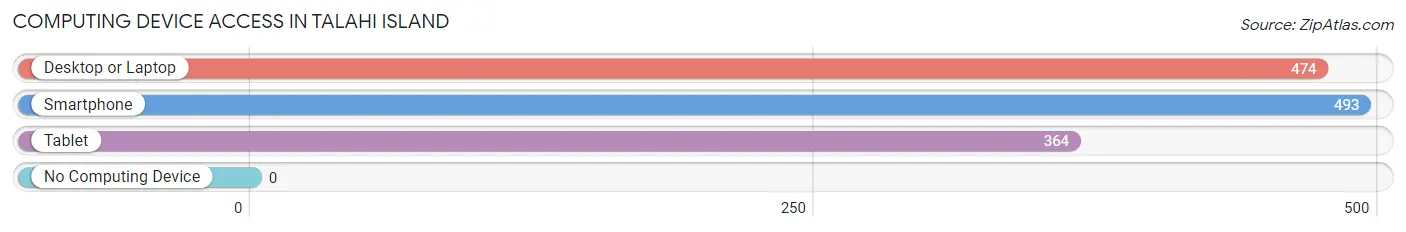
| Device Type | # Households | % Households |
| Desktop or Laptop | 474 | 93.5% |
| Smartphone | 493 | 97.2% |
| Tablet | 364 | 71.8% |
| No Computing Device | 0 | 0.0% |
| Total | 507 | 100.0% |
Internet Access in Talahi Island
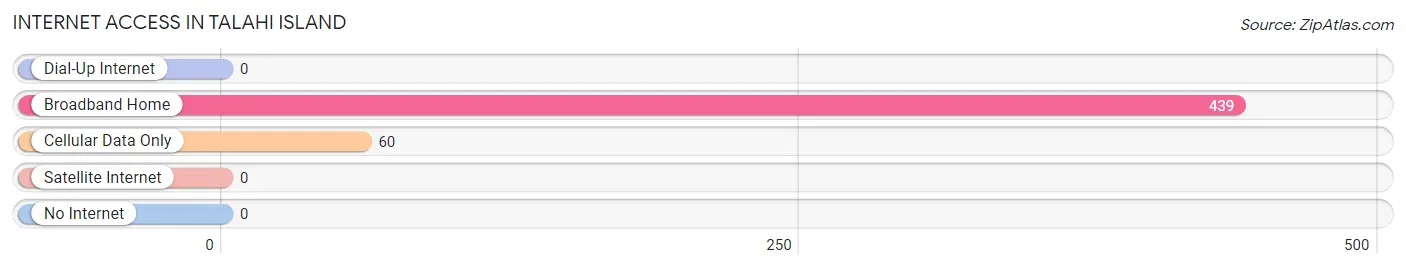
| Internet Type | # Households | % Households |
| Dial-Up Internet | 0 | 0.0% |
| Broadband Home | 439 | 86.6% |
| Cellular Data Only | 60 | 11.8% |
| Satellite Internet | 0 | 0.0% |
| No Internet | 0 | 0.0% |
| Total | 507 | 100.0% |
Talahi Island Summary
Talahi Island is a small island located off the coast of Georgia in the United States. It is part of Chatham County and is located just south of the city of Savannah. The island is approximately 1.5 miles long and 0.5 miles wide, and is home to a population of just over 1,000 people.
Geography
Talahi Island is located off the coast of Georgia in the United States. It is part of Chatham County and is located just south of the city of Savannah. The island is approximately 1.5 miles long and 0.5 miles wide, and is home to a population of just over 1,000 people. The island is surrounded by the Atlantic Ocean to the east, the Wilmington River to the north, and the Moon River to the south. The island is mostly flat, with the highest point being just over 20 feet above sea level. The island is mostly covered in marshland, with some areas of dense vegetation.
History
The history of Talahi Island dates back to the early 1700s, when it was inhabited by Native Americans. The island was used as a fishing and hunting ground by the Native Americans, and was also used as a trading post. In 1733, the island was granted to a group of settlers from England, who established a small settlement on the island. The settlement was abandoned in 1741, and the island was largely uninhabited until the late 1800s.
In the late 1800s, the island was purchased by a group of investors from Savannah, who developed the island into a resort destination. The island was home to several hotels, a golf course, and a casino. The island was also home to a large number of wealthy vacationers, who would come to the island to enjoy the luxurious amenities.
In the early 1900s, the island was sold to a group of developers from Savannah, who developed the island into a residential community. The island was home to a number of wealthy families, who built large homes on the island. The island was also home to a number of small businesses, including a grocery store, a post office, and a few restaurants.
Economy
The economy of Talahi Island is largely based on tourism and real estate. The island is home to a number of luxury resorts, hotels, and vacation homes, which attract a large number of tourists each year. The island is also home to a number of small businesses, including restaurants, grocery stores, and other retail establishments. The island is also home to a number of marinas, which provide services to boaters and fishermen.
Demographics
As of the 2010 census, the population of Talahi Island was 1,072. The population is largely white (90.2%), with a small percentage of African Americans (7.2%) and Hispanics (2.6%). The median household income is $50,000, and the median age is 44. The island is home to a number of wealthy families, and the average home value is $400,000. The island is also home to a number of small businesses, including restaurants, grocery stores, and other retail establishments.
Common Questions
What is Per Capita Income in Talahi Island?
Per Capita income in Talahi Island is $53,410.
What is the Median Family Income in Talahi Island?
Median Family Income in Talahi Island is $89,028.
What is the Median Household income in Talahi Island?
Median Household Income in Talahi Island is $104,625.
What is Income or Wage Gap in Talahi Island?
Income or Wage Gap in Talahi Island is 34.7%.
Women in Talahi Island earn 65.3 cents for every dollar earned by a man.
What is Inequality or Gini Index in Talahi Island?
Inequality or Gini Index in Talahi Island is 0.36.
What is the Total Population of Talahi Island?
Total Population of Talahi Island is 1,185.
What is the Total Male Population of Talahi Island?
Total Male Population of Talahi Island is 469.
What is the Total Female Population of Talahi Island?
Total Female Population of Talahi Island is 716.
What is the Ratio of Males per 100 Females in Talahi Island?
There are 65.50 Males per 100 Females in Talahi Island.
What is the Ratio of Females per 100 Males in Talahi Island?
There are 152.67 Females per 100 Males in Talahi Island.
What is the Median Population Age in Talahi Island?
Median Population Age in Talahi Island is 51.6 Years.
What is the Average Family Size in Talahi Island
Average Family Size in Talahi Island is 2.5 People.
What is the Average Household Size in Talahi Island
Average Household Size in Talahi Island is 2.3 People.
How Large is the Labor Force in Talahi Island?
There are 704 People in the Labor Forcein in Talahi Island.
What is the Percentage of People in the Labor Force in Talahi Island?
67.2% of People are in the Labor Force in Talahi Island.