Woolsey, GA Map & Demographics
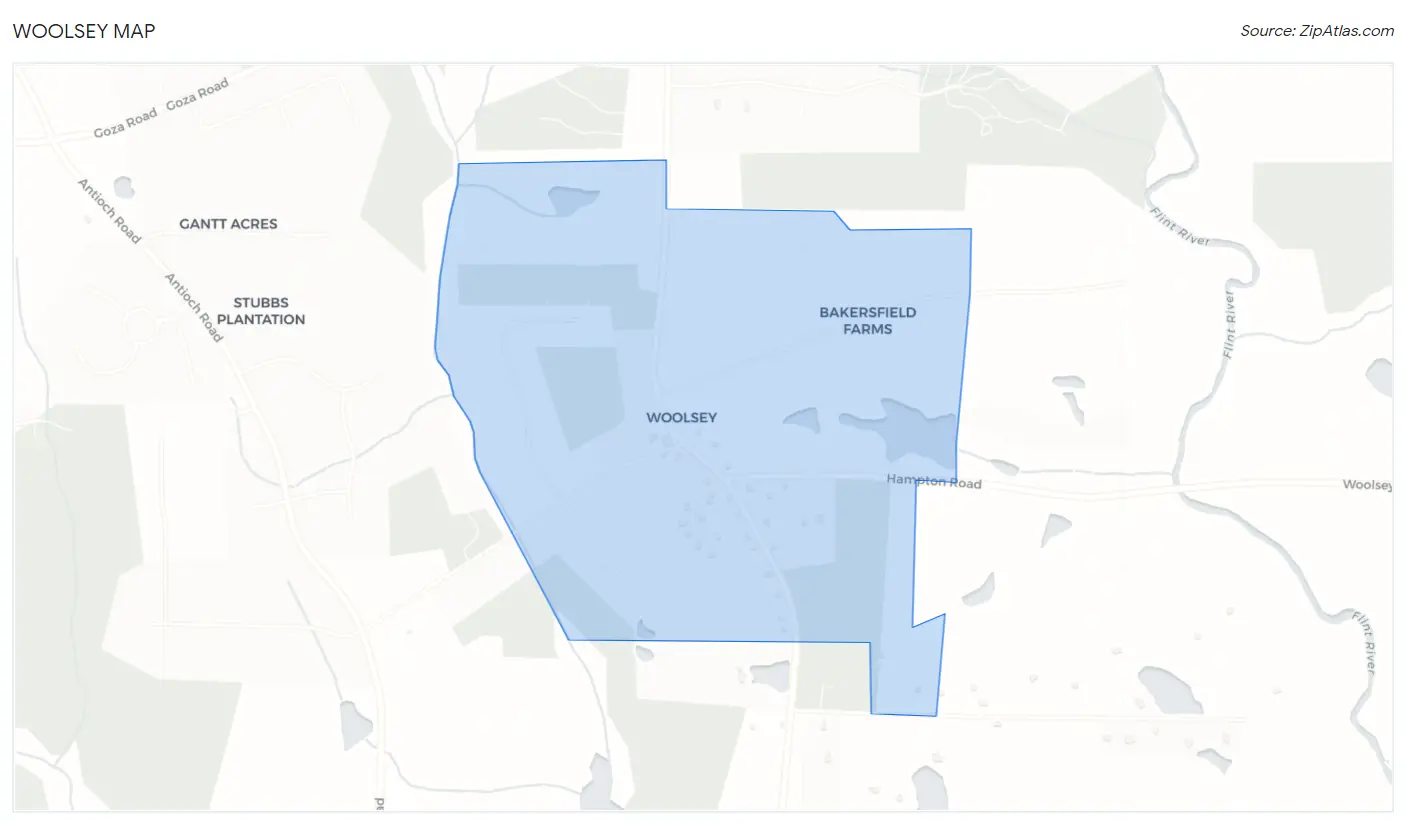
Woolsey Map
Woolsey Overview
$55,241
PER CAPITA INCOME
$112,500
AVG FAMILY INCOME
$105,625
AVG HOUSEHOLD INCOME
76.2%
WAGE / INCOME GAP [ % ]
23.8¢/ $1
WAGE / INCOME GAP [ $ ]
0.47
INEQUALITY / GINI INDEX
231
TOTAL POPULATION
102
MALE POPULATION
129
FEMALE POPULATION
79.07
MALES / 100 FEMALES
126.47
FEMALES / 100 MALES
36.6
MEDIAN AGE
3.2
AVG FAMILY SIZE
3.0
AVG HOUSEHOLD SIZE
103
LABOR FORCE [ PEOPLE ]
61.3%
PERCENT IN LABOR FORCE
2.0%
UNEMPLOYMENT RATE
Income in Woolsey
Income Overview in Woolsey
Per Capita Income in Woolsey is $55,241, while median incomes of families and households are $112,500 and $105,625 respectively.
| Characteristic | Number | Measure |
| Per Capita Income | 231 | $55,241 |
| Median Family Income | 64 | $112,500 |
| Mean Family Income | 64 | $185,359 |
| Median Household Income | 77 | $105,625 |
| Mean Household Income | 77 | $175,645 |
| Income Deficit | 64 | $0 |
| Wage / Income Gap (%) | 231 | 76.23% |
| Wage / Income Gap ($) | 231 | 23.77¢ per $1 |
| Gini / Inequality Index | 231 | 0.47 |
Earnings by Sex in Woolsey
Average Earnings in Woolsey are $62,500, $95,833 for men and $22,778 for women, a difference of 76.2%.
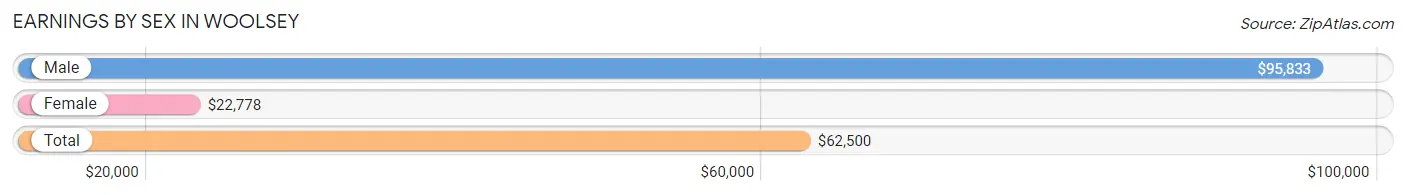
| Sex | Number | Average Earnings |
| Male | 56 (50.9%) | $95,833 |
| Female | 54 (49.1%) | $22,778 |
| Total | 110 (100.0%) | $62,500 |
Earnings by Sex by Income Bracket in Woolsey
The most common earnings brackets in Woolsey are $100,000+ for men (25 | 44.6%) and $22,500 to $24,999 for women (9 | 16.7%).
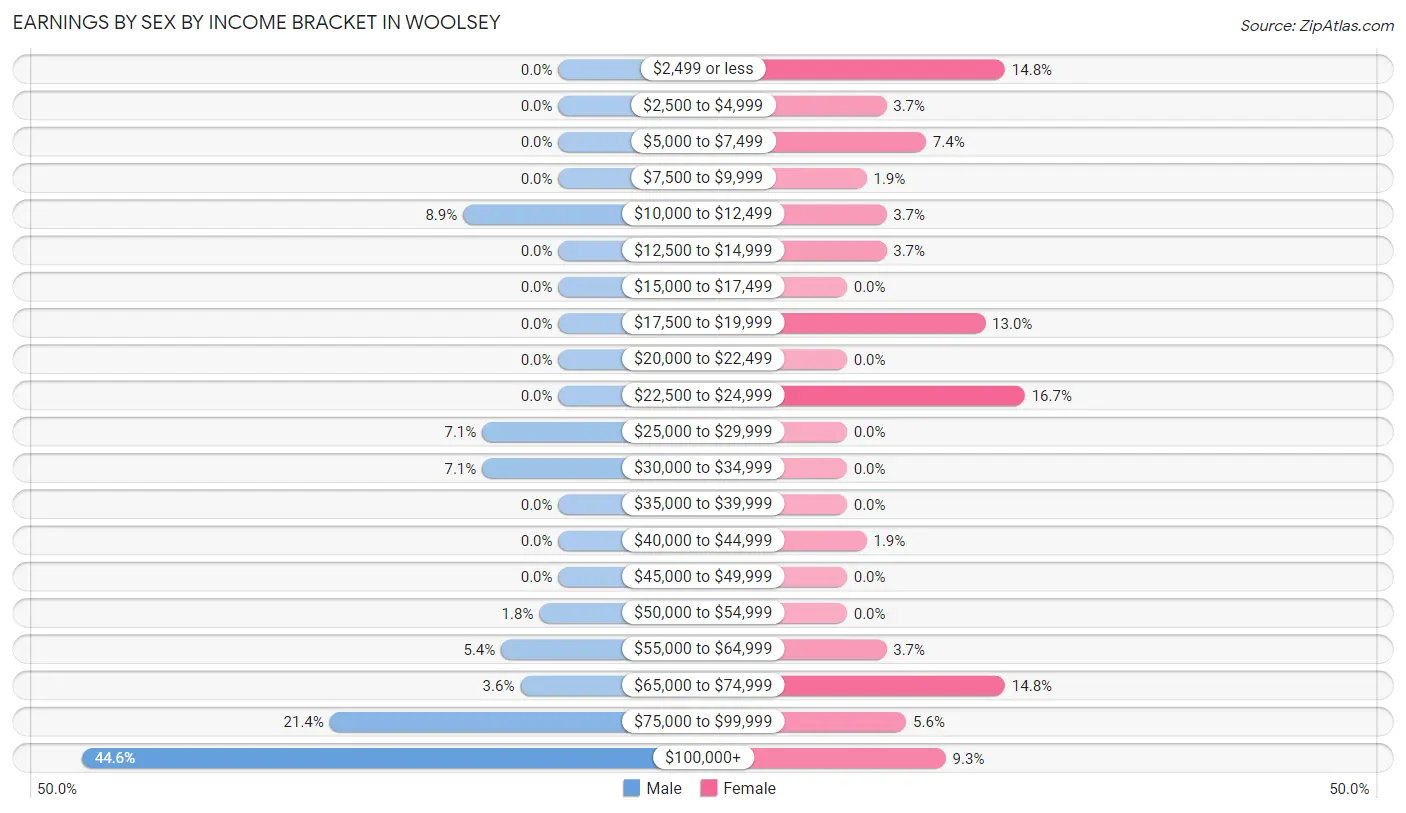
| Income | Male | Female |
| $2,499 or less | 0 (0.0%) | 8 (14.8%) |
| $2,500 to $4,999 | 0 (0.0%) | 2 (3.7%) |
| $5,000 to $7,499 | 0 (0.0%) | 4 (7.4%) |
| $7,500 to $9,999 | 0 (0.0%) | 1 (1.8%) |
| $10,000 to $12,499 | 5 (8.9%) | 2 (3.7%) |
| $12,500 to $14,999 | 0 (0.0%) | 2 (3.7%) |
| $15,000 to $17,499 | 0 (0.0%) | 0 (0.0%) |
| $17,500 to $19,999 | 0 (0.0%) | 7 (13.0%) |
| $20,000 to $22,499 | 0 (0.0%) | 0 (0.0%) |
| $22,500 to $24,999 | 0 (0.0%) | 9 (16.7%) |
| $25,000 to $29,999 | 4 (7.1%) | 0 (0.0%) |
| $30,000 to $34,999 | 4 (7.1%) | 0 (0.0%) |
| $35,000 to $39,999 | 0 (0.0%) | 0 (0.0%) |
| $40,000 to $44,999 | 0 (0.0%) | 1 (1.8%) |
| $45,000 to $49,999 | 0 (0.0%) | 0 (0.0%) |
| $50,000 to $54,999 | 1 (1.8%) | 0 (0.0%) |
| $55,000 to $64,999 | 3 (5.4%) | 2 (3.7%) |
| $65,000 to $74,999 | 2 (3.6%) | 8 (14.8%) |
| $75,000 to $99,999 | 12 (21.4%) | 3 (5.6%) |
| $100,000+ | 25 (44.6%) | 5 (9.3%) |
| Total | 56 (100.0%) | 54 (100.0%) |
Earnings by Sex by Educational Attainment in Woolsey
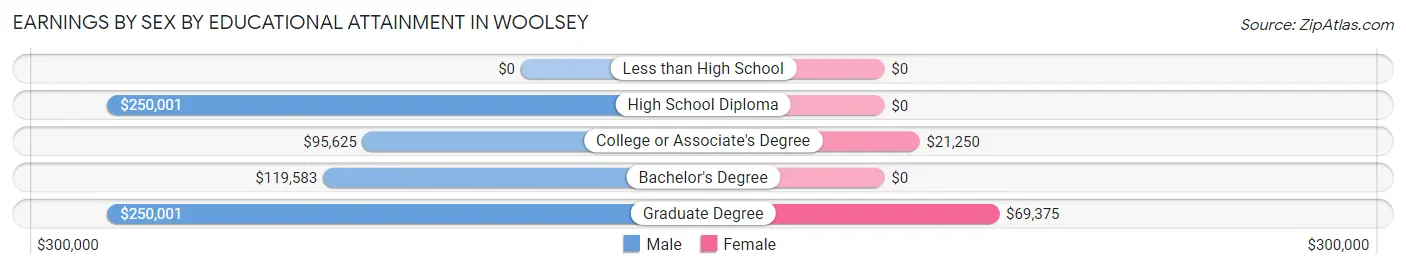
| Educational Attainment | Male Income | Female Income |
| Less than High School | - | - |
| High School Diploma | $250,001 | $0 |
| College or Associate's Degree | $95,625 | $21,250 |
| Bachelor's Degree | $119,583 | $0 |
| Graduate Degree | $250,001 | $69,375 |
| Total | $117,500 | $0 |
Family Income in Woolsey
Family Income Brackets in Woolsey
According to the Woolsey family income data, there are 16 families falling into the $200,000+ income range, which is the most common income bracket and makes up 25.0% of all families.
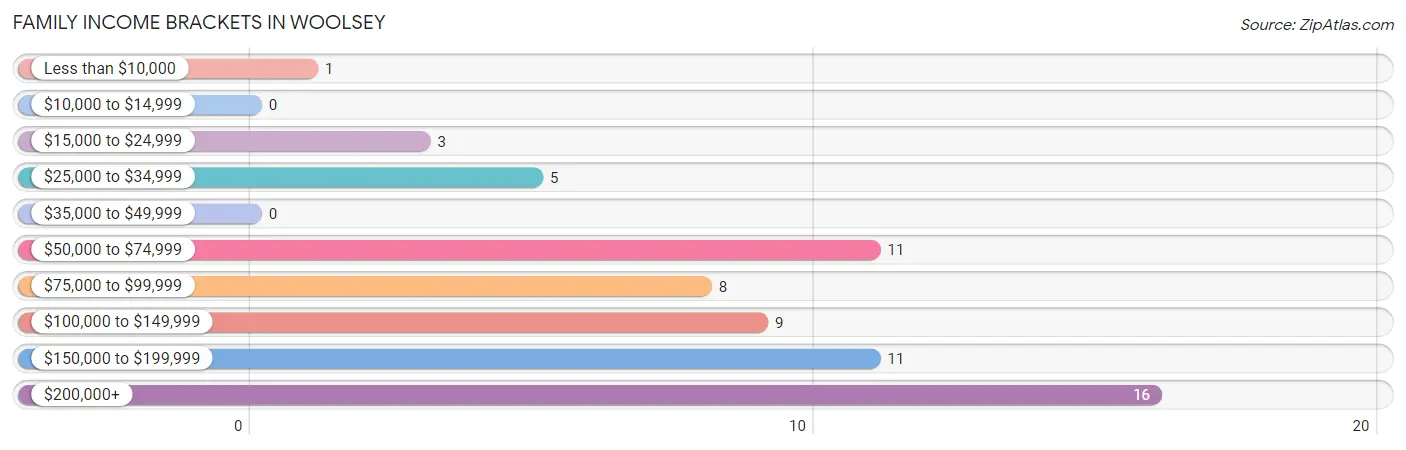
| Income Bracket | # Families | % Families |
| Less than $10,000 | 1 | 1.6% |
| $10,000 to $14,999 | 0 | 0.0% |
| $15,000 to $24,999 | 3 | 4.7% |
| $25,000 to $34,999 | 5 | 7.8% |
| $35,000 to $49,999 | 0 | 0.0% |
| $50,000 to $74,999 | 11 | 17.2% |
| $75,000 to $99,999 | 8 | 12.5% |
| $100,000 to $149,999 | 9 | 14.1% |
| $150,000 to $199,999 | 11 | 17.2% |
| $200,000+ | 16 | 25.0% |
Family Income by Famaliy Size in Woolsey
4-person families (9 | 14.1%) account for the highest median family income in Woolsey with $234,375 per family, while 4-person families (9 | 14.1%) have the highest median income of $58,594 per family member.
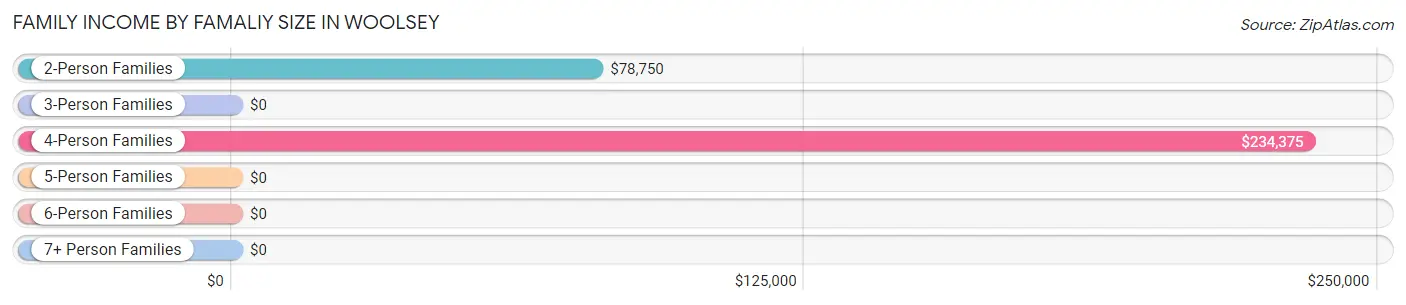
| Income Bracket | # Families | Median Income |
| 2-Person Families | 24 (37.5%) | $78,750 |
| 3-Person Families | 21 (32.8%) | $0 |
| 4-Person Families | 9 (14.1%) | $234,375 |
| 5-Person Families | 4 (6.2%) | $0 |
| 6-Person Families | 6 (9.4%) | $0 |
| 7+ Person Families | 0 (0.0%) | $0 |
| Total | 64 (100.0%) | $112,500 |
Family Income by Number of Earners in Woolsey
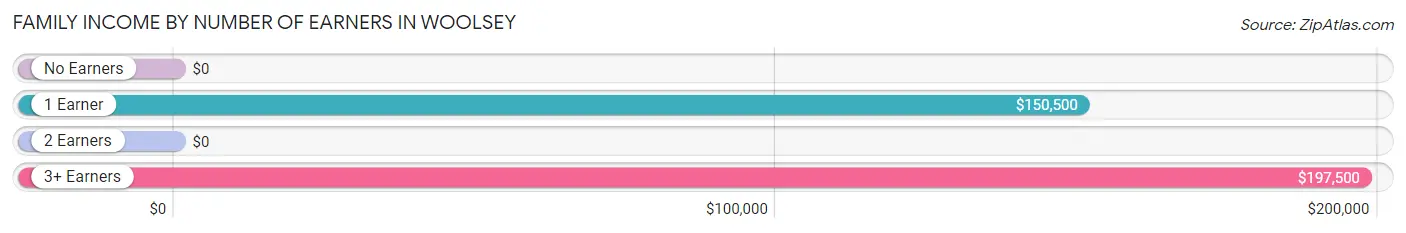
| Number of Earners | # Families | Median Income |
| No Earners | 9 (14.1%) | $0 |
| 1 Earner | 26 (40.6%) | $150,500 |
| 2 Earners | 23 (35.9%) | $0 |
| 3+ Earners | 6 (9.4%) | $197,500 |
| Total | 64 (100.0%) | $112,500 |
Household Income in Woolsey
Household Income Brackets in Woolsey
With 21 households falling in the category, the $200,000+ income range is the most frequent in Woolsey, accounting for 27.3% of all households.
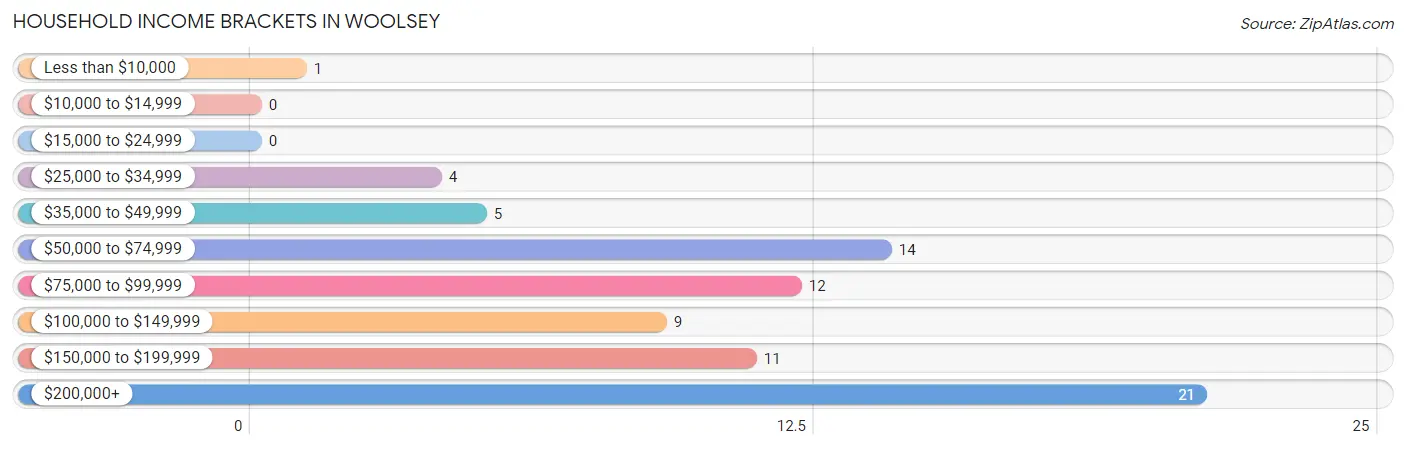
| Income Bracket | # Households | % Households |
| Less than $10,000 | 1 | 1.3% |
| $10,000 to $14,999 | 0 | 0.0% |
| $15,000 to $24,999 | 0 | 0.0% |
| $25,000 to $34,999 | 4 | 5.2% |
| $35,000 to $49,999 | 5 | 6.5% |
| $50,000 to $74,999 | 14 | 18.2% |
| $75,000 to $99,999 | 12 | 15.6% |
| $100,000 to $149,999 | 9 | 11.7% |
| $150,000 to $199,999 | 11 | 14.3% |
| $200,000+ | 21 | 27.3% |
Household Income by Householder Age in Woolsey
The median household income in Woolsey is $105,625, with the highest median household income of $203,250 found in the 45 to 64 years age bracket for the primary householder. A total of 31 households (40.3%) fall into this category. Meanwhile, the 15 to 24 years age bracket for the primary householder has the lowest median household income of $0, with 3 households (3.9%) in this group.
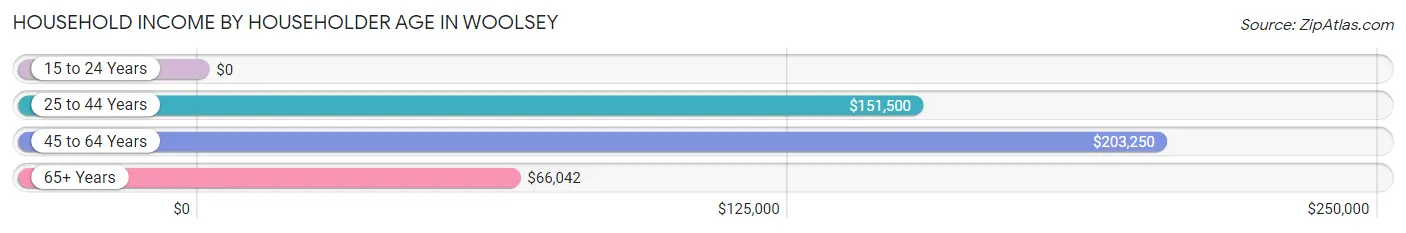
| Income Bracket | # Households | Median Income |
| 15 to 24 Years | 3 (3.9%) | $0 |
| 25 to 44 Years | 18 (23.4%) | $151,500 |
| 45 to 64 Years | 31 (40.3%) | $203,250 |
| 65+ Years | 25 (32.5%) | $66,042 |
| Total | 77 (100.0%) | $105,625 |
Poverty in Woolsey
Income Below Poverty by Sex and Age in Woolsey
With 1.0% poverty level for males and 6.2% for females among the residents of Woolsey, 65 to 74 year old males and under 5 year old females are the most vulnerable to poverty, with 1 males (5.9%) and 4 females (57.1%) in their respective age groups living below the poverty level.
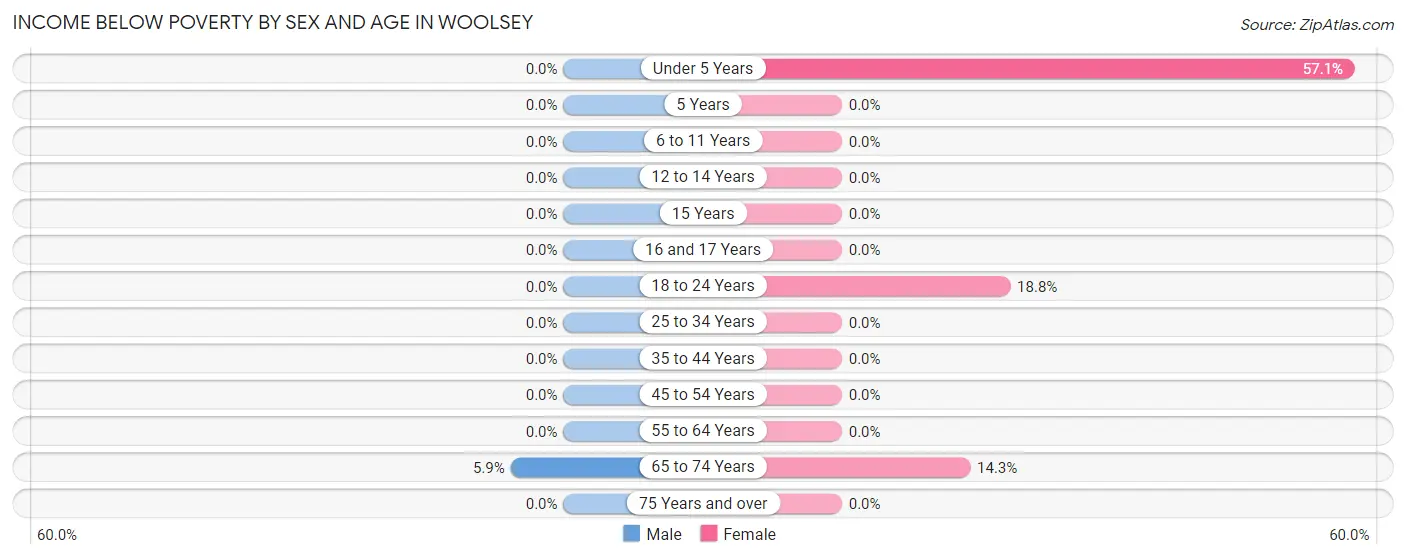
| Age Bracket | Male | Female |
| Under 5 Years | 0 (0.0%) | 4 (57.1%) |
| 5 Years | 0 (0.0%) | 0 (0.0%) |
| 6 to 11 Years | 0 (0.0%) | 0 (0.0%) |
| 12 to 14 Years | 0 (0.0%) | 0 (0.0%) |
| 15 Years | 0 (0.0%) | 0 (0.0%) |
| 16 and 17 Years | 0 (0.0%) | 0 (0.0%) |
| 18 to 24 Years | 0 (0.0%) | 3 (18.8%) |
| 25 to 34 Years | 0 (0.0%) | 0 (0.0%) |
| 35 to 44 Years | 0 (0.0%) | 0 (0.0%) |
| 45 to 54 Years | 0 (0.0%) | 0 (0.0%) |
| 55 to 64 Years | 0 (0.0%) | 0 (0.0%) |
| 65 to 74 Years | 1 (5.9%) | 1 (14.3%) |
| 75 Years and over | 0 (0.0%) | 0 (0.0%) |
| Total | 1 (1.0%) | 8 (6.2%) |
Income Above Poverty by Sex and Age in Woolsey
According to the poverty statistics in Woolsey, males aged under 5 years and females aged 6 to 11 years are the age groups that are most secure financially, with 100.0% of males and 100.0% of females in these age groups living above the poverty line.
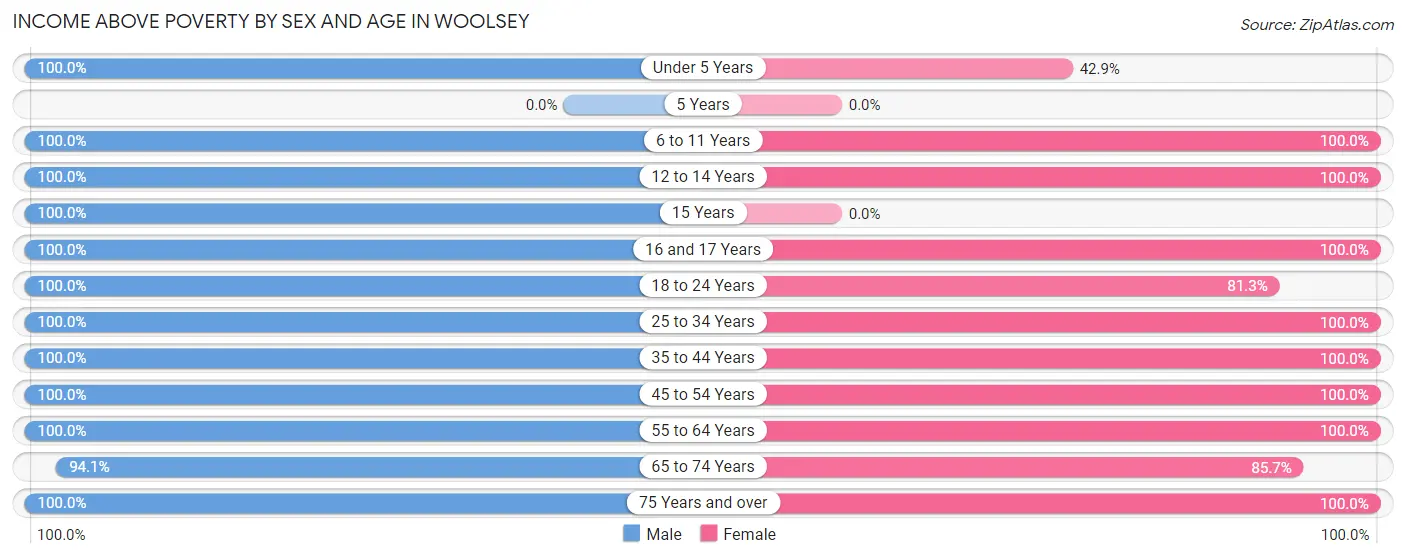
| Age Bracket | Male | Female |
| Under 5 Years | 11 (100.0%) | 3 (42.9%) |
| 5 Years | 0 (0.0%) | 0 (0.0%) |
| 6 to 11 Years | 11 (100.0%) | 25 (100.0%) |
| 12 to 14 Years | 1 (100.0%) | 4 (100.0%) |
| 15 Years | 3 (100.0%) | 0 (0.0%) |
| 16 and 17 Years | 1 (100.0%) | 2 (100.0%) |
| 18 to 24 Years | 11 (100.0%) | 13 (81.2%) |
| 25 to 34 Years | 3 (100.0%) | 6 (100.0%) |
| 35 to 44 Years | 14 (100.0%) | 17 (100.0%) |
| 45 to 54 Years | 13 (100.0%) | 20 (100.0%) |
| 55 to 64 Years | 14 (100.0%) | 19 (100.0%) |
| 65 to 74 Years | 16 (94.1%) | 6 (85.7%) |
| 75 Years and over | 3 (100.0%) | 5 (100.0%) |
| Total | 101 (99.0%) | 120 (93.8%) |
Income Below Poverty Among Married-Couple Families in Woolsey
The poverty statistics for married-couple families in Woolsey show that 1.8% or 1 of the total 57 families live below the poverty line. Families with no children have the highest poverty rate of 3.6%, comprising of 1 families. On the other hand, families with 1 or 2 children have the lowest poverty rate of 0.0%, which includes 0 families.
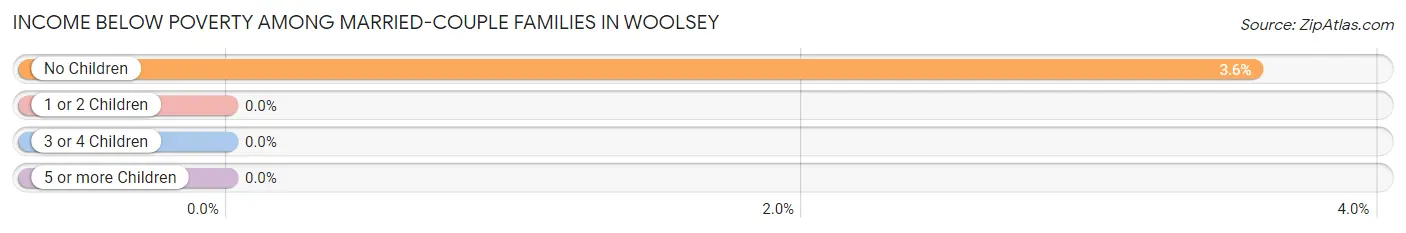
| Children | Above Poverty | Below Poverty |
| No Children | 27 (96.4%) | 1 (3.6%) |
| 1 or 2 Children | 22 (100.0%) | 0 (0.0%) |
| 3 or 4 Children | 7 (100.0%) | 0 (0.0%) |
| 5 or more Children | 0 (0.0%) | 0 (0.0%) |
| Total | 56 (98.3%) | 1 (1.8%) |
Income Below Poverty Among Single-Parent Households in Woolsey
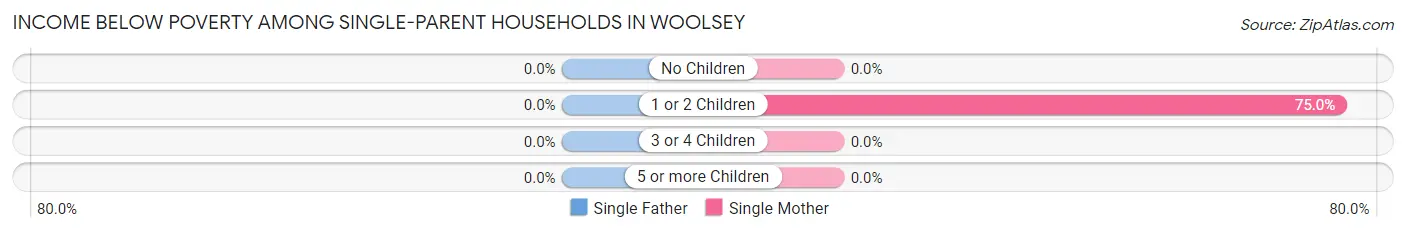
| Children | Single Father | Single Mother |
| No Children | 0 (0.0%) | 0 (0.0%) |
| 1 or 2 Children | 0 (0.0%) | 3 (75.0%) |
| 3 or 4 Children | 0 (0.0%) | 0 (0.0%) |
| 5 or more Children | 0 (0.0%) | 0 (0.0%) |
| Total | 0 (0.0%) | 3 (50.0%) |
Income Below Poverty Among Married-Couple vs Single-Parent Households in Woolsey
The poverty data for Woolsey shows that 1 of the married-couple family households (1.8%) and 3 of the single-parent households (42.9%) are living below the poverty level. Within the married-couple family households, those with no children have the highest poverty rate, with 1 households (3.6%) falling below the poverty line. Among the single-parent households, those with 1 or 2 children have the highest poverty rate, with 3 household (60.0%) living below poverty.
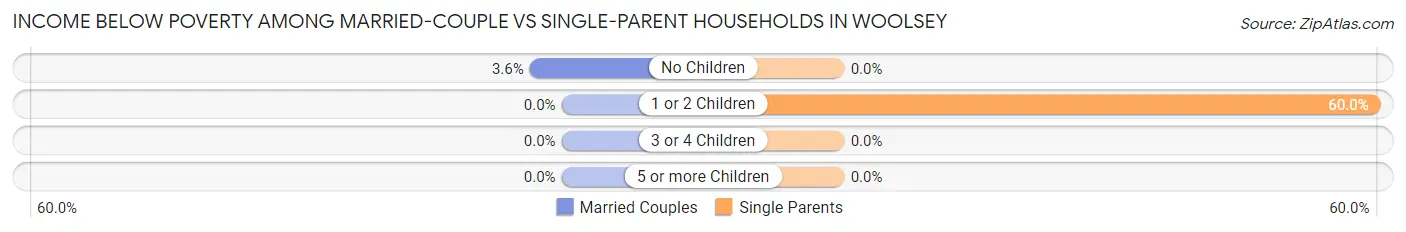
| Children | Married-Couple Families | Single-Parent Households |
| No Children | 1 (3.6%) | 0 (0.0%) |
| 1 or 2 Children | 0 (0.0%) | 3 (60.0%) |
| 3 or 4 Children | 0 (0.0%) | 0 (0.0%) |
| 5 or more Children | 0 (0.0%) | 0 (0.0%) |
| Total | 1 (1.8%) | 3 (42.9%) |
Race in Woolsey
The most populous races in Woolsey are White / Caucasian (199 | 86.2%), Hispanic or Latino (15 | 6.5%), and Two or more Races (15 | 6.5%).
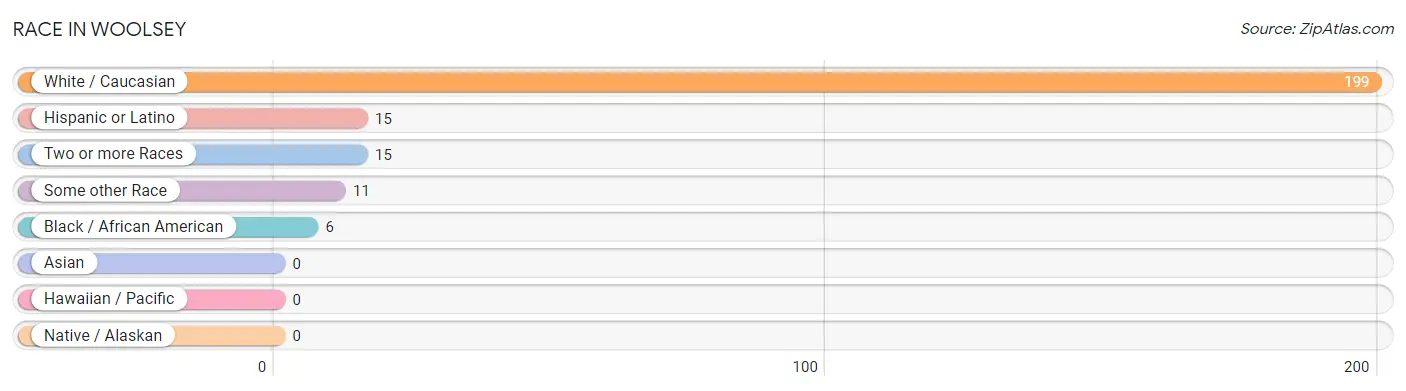
| Race | # Population | % Population |
| Asian | 0 | 0.0% |
| Black / African American | 6 | 2.6% |
| Hawaiian / Pacific | 0 | 0.0% |
| Hispanic or Latino | 15 | 6.5% |
| Native / Alaskan | 0 | 0.0% |
| White / Caucasian | 199 | 86.2% |
| Two or more Races | 15 | 6.5% |
| Some other Race | 11 | 4.8% |
| Total | 231 | 100.0% |
Ancestry in Woolsey
The most populous ancestries reported in Woolsey are American (63 | 27.3%), English (38 | 16.5%), Scotch-Irish (14 | 6.1%), German (13 | 5.6%), and Welsh (12 | 5.2%), together accounting for 60.6% of all Woolsey residents.
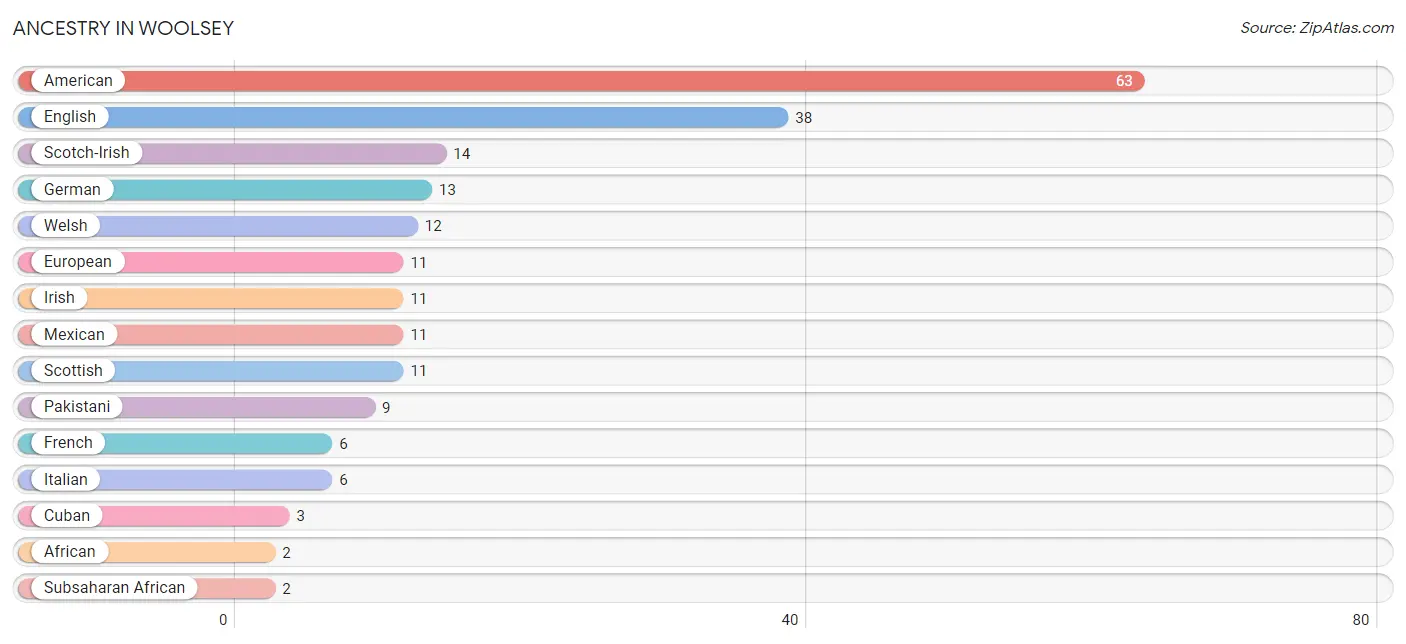
| Ancestry | # Population | % Population |
| African | 2 | 0.9% |
| American | 63 | 27.3% |
| Cuban | 3 | 1.3% |
| English | 38 | 16.5% |
| European | 11 | 4.8% |
| French | 6 | 2.6% |
| German | 13 | 5.6% |
| Irish | 11 | 4.8% |
| Italian | 6 | 2.6% |
| Mexican | 11 | 4.8% |
| Pakistani | 9 | 3.9% |
| Scotch-Irish | 14 | 6.1% |
| Scottish | 11 | 4.8% |
| Subsaharan African | 2 | 0.9% |
| Thai | 1 | 0.4% |
| Welsh | 12 | 5.2% | View All 16 Rows |
Immigrants in Woolsey
The most numerous immigrant groups reported in Woolsey came from Australia (1 | 0.4%), and Oceania (1 | 0.4%), together accounting for 0.9% of all Woolsey residents.
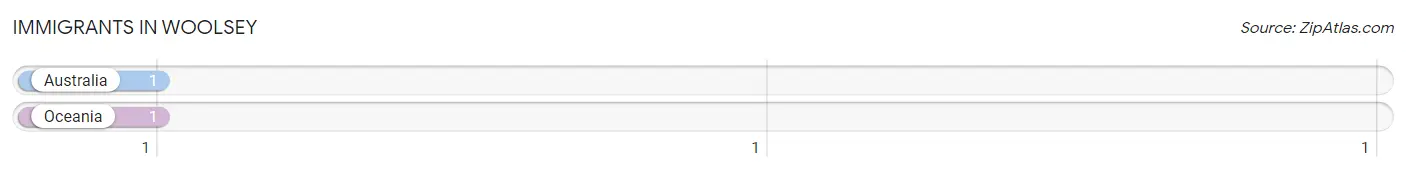
| Immigration Origin | # Population | % Population |
| Australia | 1 | 0.4% |
| Oceania | 1 | 0.4% | View All 2 Rows |
Sex and Age in Woolsey
Sex and Age in Woolsey
The most populous age groups in Woolsey are Under 5 Years (11 | 10.8%) for men and 5 to 9 Years (17 | 13.2%) for women.
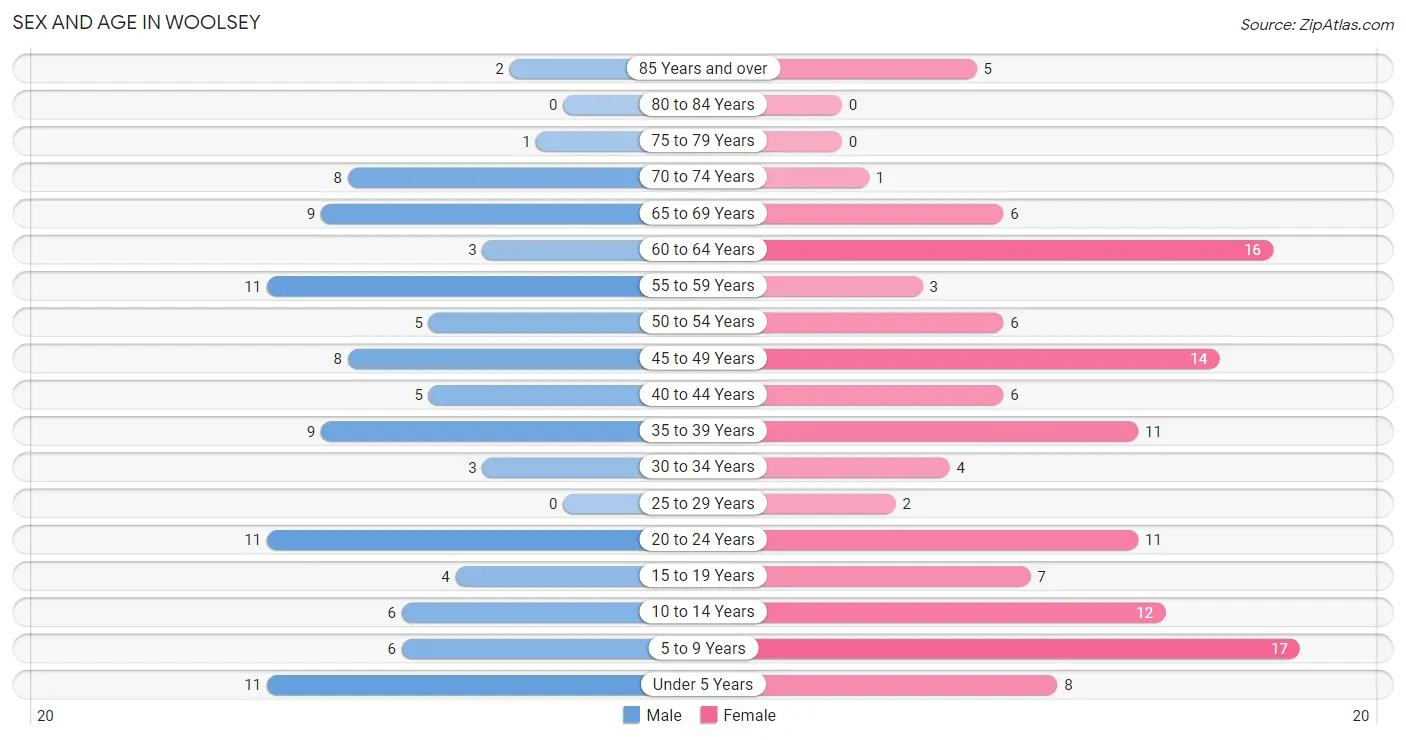
| Age Bracket | Male | Female |
| Under 5 Years | 11 (10.8%) | 8 (6.2%) |
| 5 to 9 Years | 6 (5.9%) | 17 (13.2%) |
| 10 to 14 Years | 6 (5.9%) | 12 (9.3%) |
| 15 to 19 Years | 4 (3.9%) | 7 (5.4%) |
| 20 to 24 Years | 11 (10.8%) | 11 (8.5%) |
| 25 to 29 Years | 0 (0.0%) | 2 (1.5%) |
| 30 to 34 Years | 3 (2.9%) | 4 (3.1%) |
| 35 to 39 Years | 9 (8.8%) | 11 (8.5%) |
| 40 to 44 Years | 5 (4.9%) | 6 (4.6%) |
| 45 to 49 Years | 8 (7.8%) | 14 (10.8%) |
| 50 to 54 Years | 5 (4.9%) | 6 (4.6%) |
| 55 to 59 Years | 11 (10.8%) | 3 (2.3%) |
| 60 to 64 Years | 3 (2.9%) | 16 (12.4%) |
| 65 to 69 Years | 9 (8.8%) | 6 (4.6%) |
| 70 to 74 Years | 8 (7.8%) | 1 (0.8%) |
| 75 to 79 Years | 1 (1.0%) | 0 (0.0%) |
| 80 to 84 Years | 0 (0.0%) | 0 (0.0%) |
| 85 Years and over | 2 (2.0%) | 5 (3.9%) |
| Total | 102 (100.0%) | 129 (100.0%) |
Families and Households in Woolsey
Median Family Size in Woolsey
The median family size in Woolsey is 3.22 persons per family, with married-couple families (57 | 89.1%) accounting for the largest median family size of 3.3 persons per family. On the other hand, single female/mother families (6 | 9.4%) represent the smallest median family size with 2.50 persons per family.
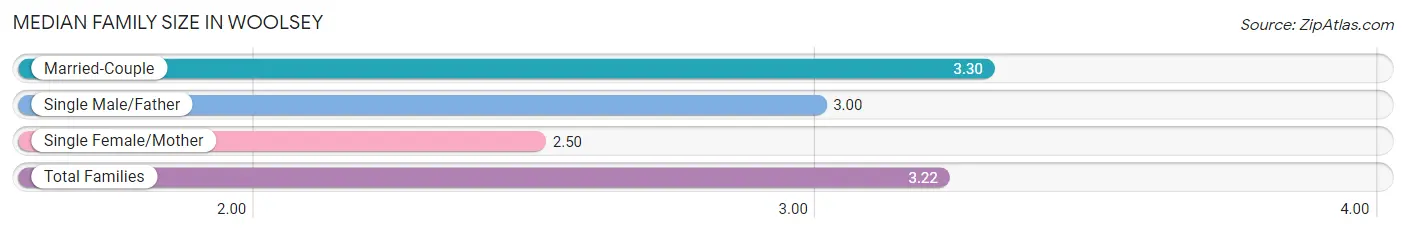
| Family Type | # Families | Family Size |
| Married-Couple | 57 (89.1%) | 3.30 |
| Single Male/Father | 1 (1.6%) | 3.00 |
| Single Female/Mother | 6 (9.4%) | 2.50 |
| Total Families | 64 (100.0%) | 3.22 |
Median Household Size in Woolsey
The median household size in Woolsey is 3.00 persons per household, with married-couple households (57 | 74.0%) accounting for the largest median household size of 3.35 persons per household. non-family households (13 | 16.9%) represent the smallest median household size with 1.31 persons per household.
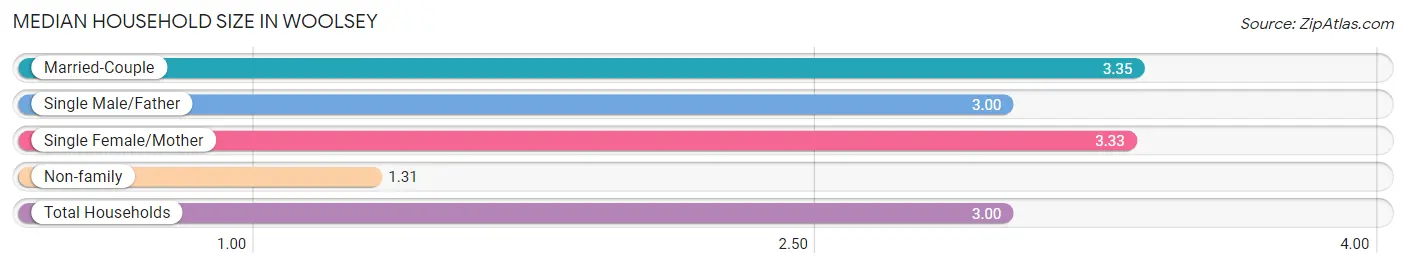
| Household Type | # Households | Household Size |
| Married-Couple | 57 (74.0%) | 3.35 |
| Single Male/Father | 1 (1.3%) | 3.00 |
| Single Female/Mother | 6 (7.8%) | 3.33 |
| Non-family | 13 (16.9%) | 1.31 |
| Total Households | 77 (100.0%) | 3.00 |
Household Size by Marriage Status in Woolsey
Out of a total of 77 households in Woolsey, 64 (83.1%) are family households, while 13 (16.9%) are nonfamily households. The most numerous type of family households are 3-person households, comprising 24, and the most common type of nonfamily households are 1-person households, comprising 8.
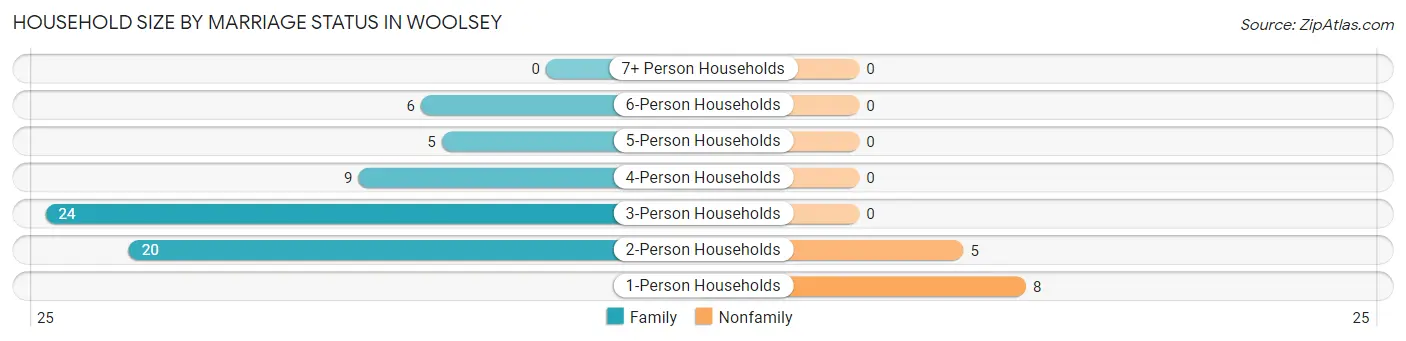
| Household Size | Family Households | Nonfamily Households |
| 1-Person Households | - | 8 (10.4%) |
| 2-Person Households | 20 (26.0%) | 5 (6.5%) |
| 3-Person Households | 24 (31.2%) | 0 (0.0%) |
| 4-Person Households | 9 (11.7%) | 0 (0.0%) |
| 5-Person Households | 5 (6.5%) | 0 (0.0%) |
| 6-Person Households | 6 (7.8%) | 0 (0.0%) |
| 7+ Person Households | 0 (0.0%) | 0 (0.0%) |
| Total | 64 (83.1%) | 13 (16.9%) |
Female Fertility in Woolsey
Fertility by Age in Woolsey
Average fertility rate in Woolsey is 91.0 births per 1,000 women. Women in the age bracket of 15 to 19 years have the highest fertility rate with 429.0 births per 1,000 women. Women in the age bracket of 15 to 19 years acount for 60.0% of all women with births.
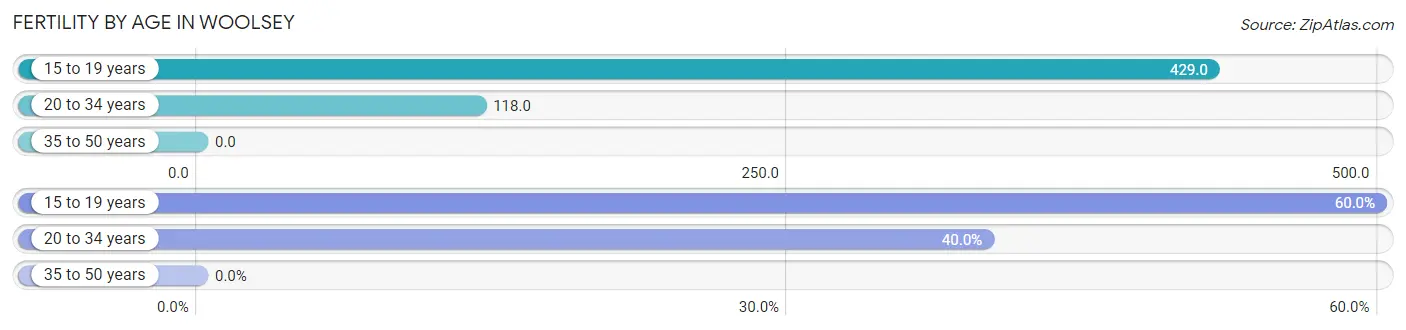
| Age Bracket | Women with Births | Births / 1,000 Women |
| 15 to 19 years | 3 (60.0%) | 429.0 |
| 20 to 34 years | 2 (40.0%) | 118.0 |
| 35 to 50 years | 0 (0.0%) | 0.0 |
| Total | 5 (100.0%) | 91.0 |
Fertility by Age by Marriage Status in Woolsey
40.0% of women with births (5) in Woolsey are married. The highest percentage of unmarried women with births falls into 15 to 19 years age bracket with 100.0% of them unmarried at the time of birth, while the lowest percentage of unmarried women with births belong to 20 to 34 years age bracket with 0.0% of them unmarried.
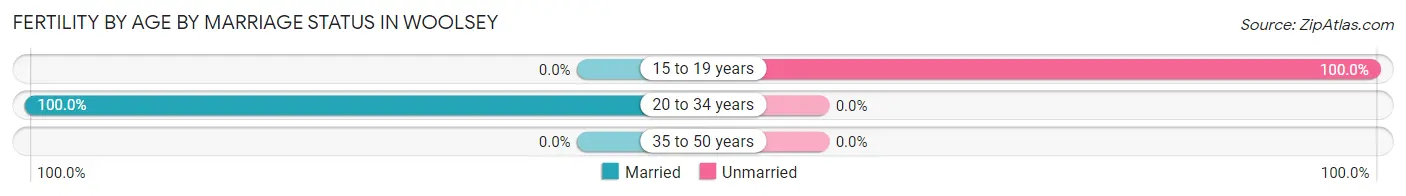
| Age Bracket | Married | Unmarried |
| 15 to 19 years | 0 (0.0%) | 3 (100.0%) |
| 20 to 34 years | 2 (100.0%) | 0 (0.0%) |
| 35 to 50 years | 0 (0.0%) | 0 (0.0%) |
| Total | 2 (40.0%) | 3 (60.0%) |
Fertility by Education in Woolsey
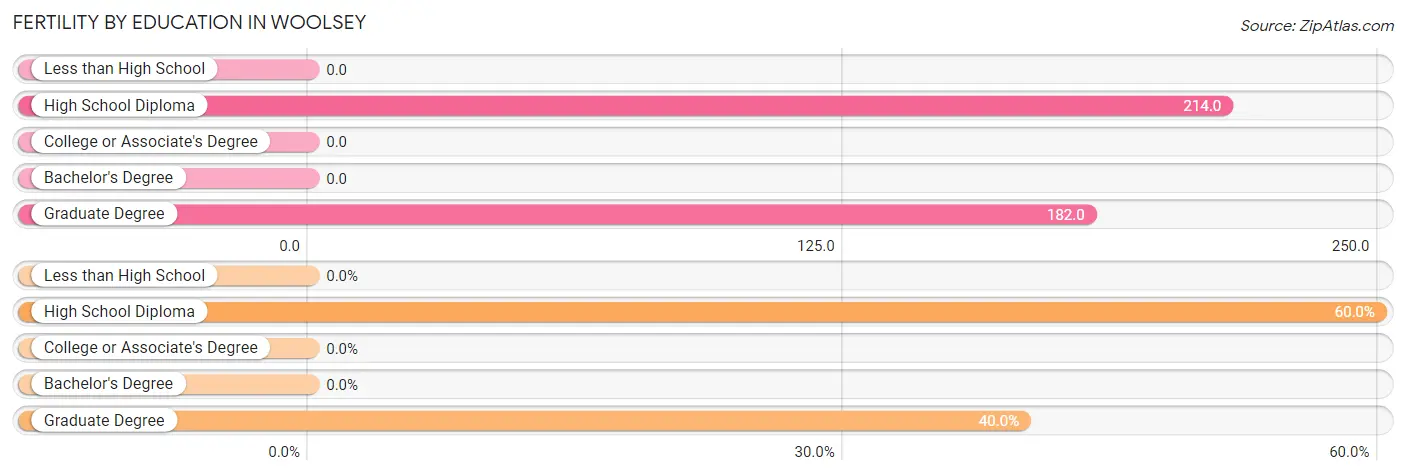
| Educational Attainment | Women with Births | Births / 1,000 Women |
| Less than High School | 0 (0.0%) | 0.0 |
| High School Diploma | 3 (60.0%) | 214.0 |
| College or Associate's Degree | 0 (0.0%) | 0.0 |
| Bachelor's Degree | 0 (0.0%) | 0.0 |
| Graduate Degree | 2 (40.0%) | 182.0 |
| Total | 5 (100.0%) | 91.0 |
Fertility by Education by Marriage Status in Woolsey
60.0% of women with births in Woolsey are unmarried. Women with the educational attainment of graduate degree are most likely to be married with 100.0% of them married at childbirth, while women with the educational attainment of high school diploma are least likely to be married with 100.0% of them unmarried at childbirth.
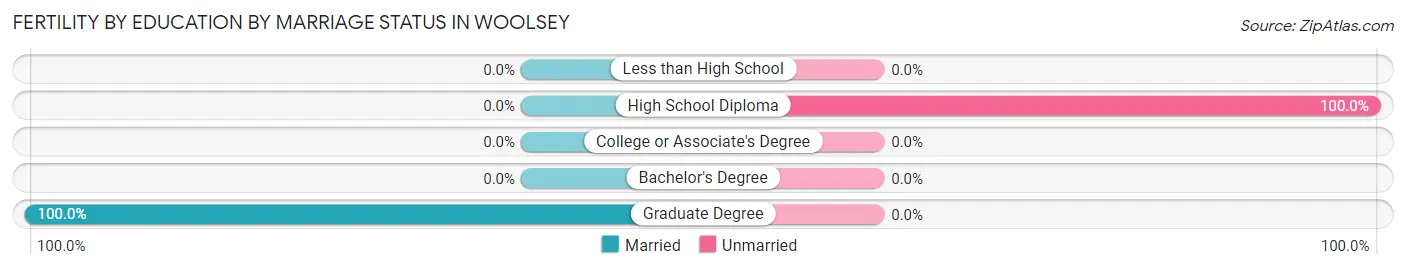
| Educational Attainment | Married | Unmarried |
| Less than High School | 0 (0.0%) | 0 (0.0%) |
| High School Diploma | 0 (0.0%) | 3 (100.0%) |
| College or Associate's Degree | 0 (0.0%) | 0 (0.0%) |
| Bachelor's Degree | 0 (0.0%) | 0 (0.0%) |
| Graduate Degree | 2 (100.0%) | 0 (0.0%) |
| Total | 2 (40.0%) | 3 (60.0%) |
Employment Characteristics in Woolsey
Employment by Class of Employer in Woolsey
Among the 95 employed individuals in Woolsey, private company employees (54 | 56.8%), federal government employees (13 | 13.7%), and not-for-profit organizations (11 | 11.6%) make up the most common classes of employment.
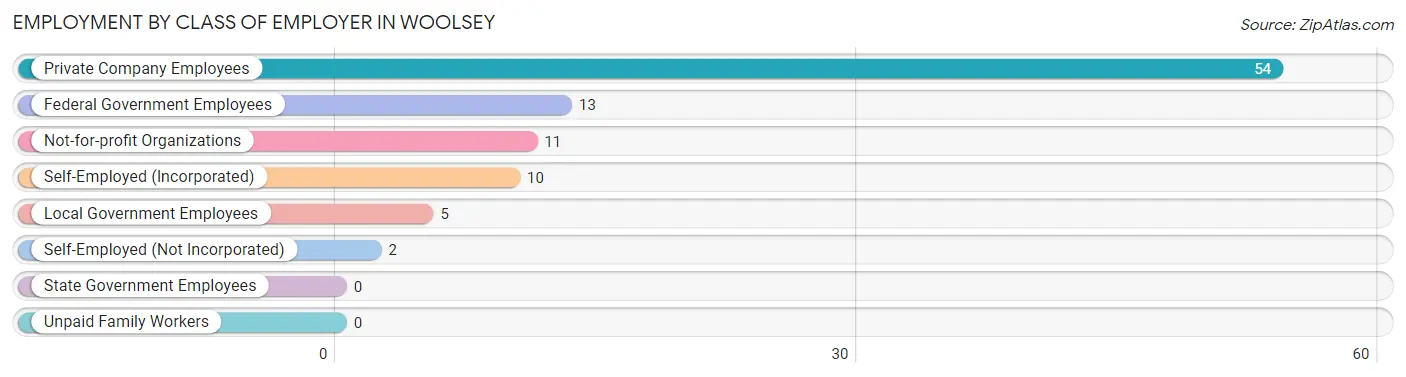
| Employer Class | # Employees | % Employees |
| Private Company Employees | 54 | 56.8% |
| Self-Employed (Incorporated) | 10 | 10.5% |
| Self-Employed (Not Incorporated) | 2 | 2.1% |
| Not-for-profit Organizations | 11 | 11.6% |
| Local Government Employees | 5 | 5.3% |
| State Government Employees | 0 | 0.0% |
| Federal Government Employees | 13 | 13.7% |
| Unpaid Family Workers | 0 | 0.0% |
| Total | 95 | 100.0% |
Employment Status by Age in Woolsey
According to the labor force statistics for Woolsey, out of the total population over 16 years of age (168), 61.3% or 103 individuals are in the labor force, with 2.0% or 2 of them unemployed. The age group with the highest labor force participation rate is 16 to 19 years, with 87.5% or 7 individuals in the labor force. Within the labor force, the 55 to 59 years age range has the highest percentage of unemployed individuals, with 9.1% or 1 of them being unemployed.
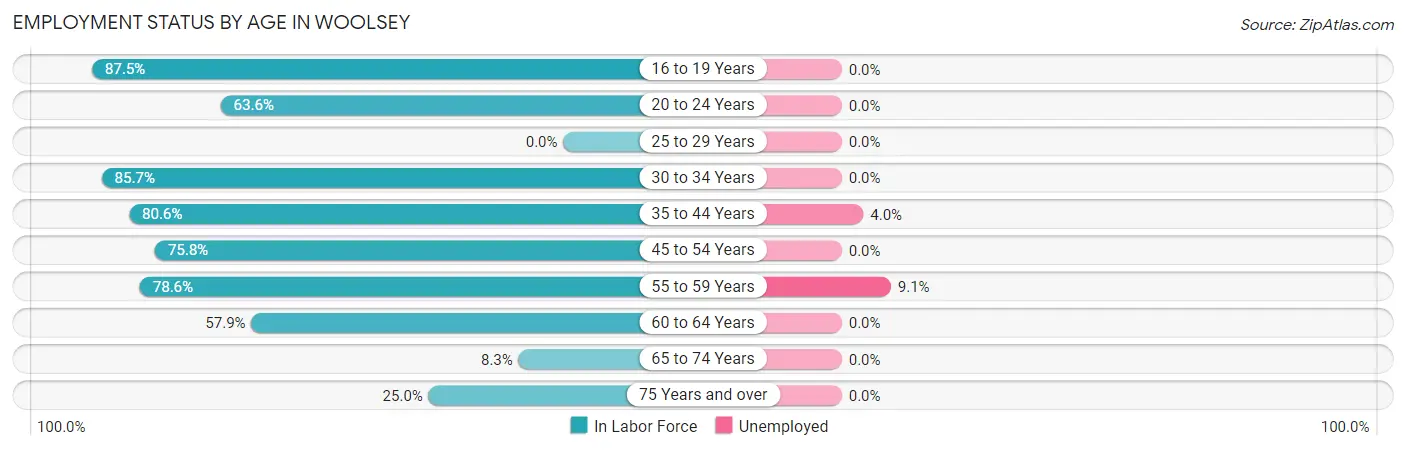
| Age Bracket | In Labor Force | Unemployed |
| 16 to 19 Years | 7 (87.5%) | 0 (0.0%) |
| 20 to 24 Years | 14 (63.6%) | 0 (0.0%) |
| 25 to 29 Years | 0 (0.0%) | 0 (0.0%) |
| 30 to 34 Years | 6 (85.7%) | 0 (0.0%) |
| 35 to 44 Years | 25 (80.6%) | 1 (4.0%) |
| 45 to 54 Years | 25 (75.8%) | 0 (0.0%) |
| 55 to 59 Years | 11 (78.6%) | 1 (9.1%) |
| 60 to 64 Years | 11 (57.9%) | 0 (0.0%) |
| 65 to 74 Years | 2 (8.3%) | 0 (0.0%) |
| 75 Years and over | 2 (25.0%) | 0 (0.0%) |
| Total | 103 (61.3%) | 2 (2.0%) |
Employment Status by Educational Attainment in Woolsey
According to labor force statistics for Woolsey, 73.6% of individuals (78) out of the total population between 25 and 64 years of age (106) are in the labor force, with 2.6% or 2 of them being unemployed. The group with the highest labor force participation rate are those with the educational attainment of bachelor's degree or higher, with 84.3% or 43 individuals in the labor force. Within the labor force, individuals with college / associate degree education have the highest percentage of unemployment, with 4.8% or 1 of them being unemployed.
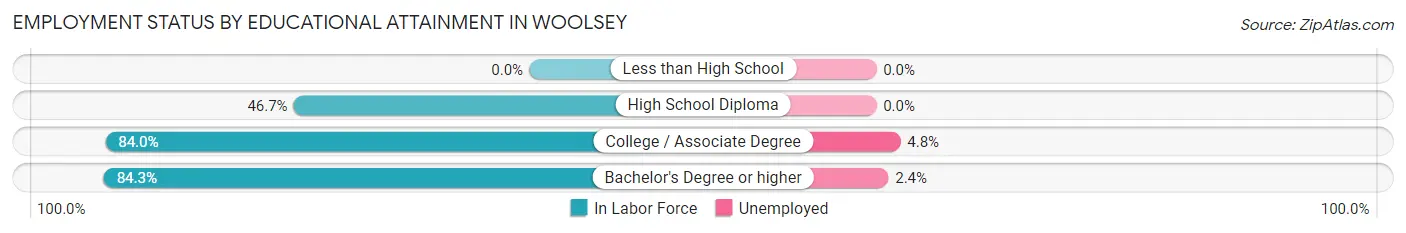
| Educational Attainment | In Labor Force | Unemployed |
| Less than High School | 0 (0.0%) | 0 (0.0%) |
| High School Diploma | 14 (46.7%) | 0 (0.0%) |
| College / Associate Degree | 21 (84.0%) | 1 (4.8%) |
| Bachelor's Degree or higher | 43 (84.3%) | 1 (2.4%) |
| Total | 78 (73.6%) | 3 (2.6%) |
Employment Occupations by Sex in Woolsey
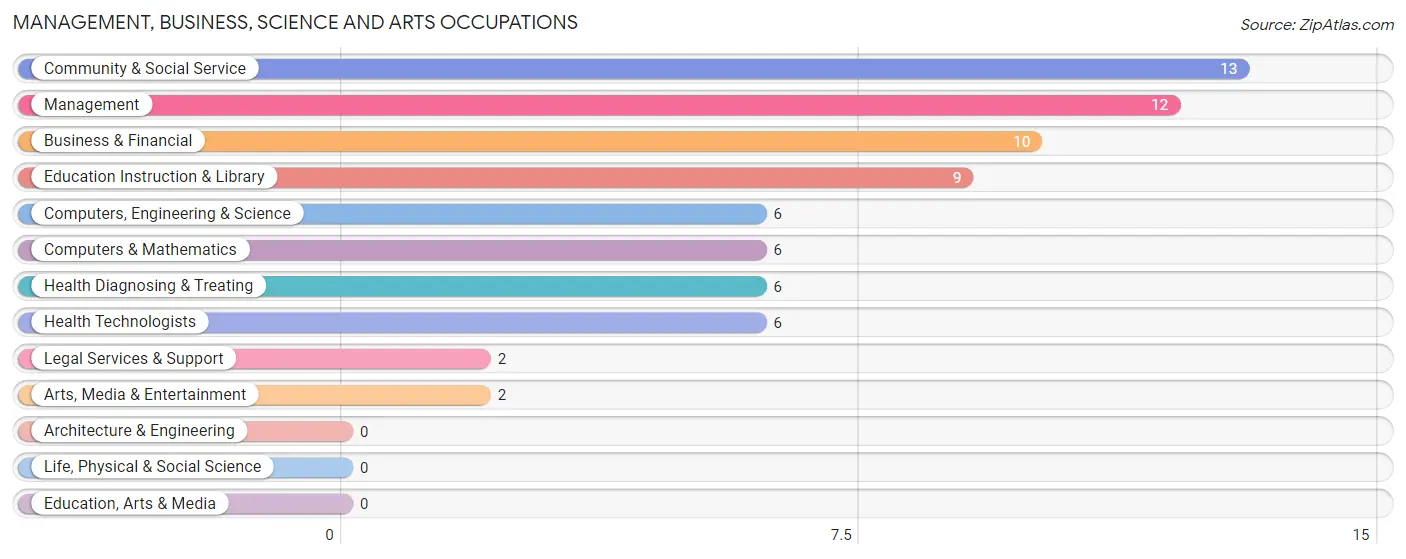
Management, Business, Science and Arts Occupations
The most common Management, Business, Science and Arts occupations in Woolsey are Community & Social Service (13 | 13.1%), Management (12 | 12.1%), Business & Financial (10 | 10.1%), Education Instruction & Library (9 | 9.1%), and Computers, Engineering & Science (6 | 6.1%).
Management, Business, Science and Arts Occupations by Sex
Within the Management, Business, Science and Arts occupations in Woolsey, the most male-oriented occupations are Computers, Engineering & Science (100.0%), Computers & Mathematics (100.0%), and Legal Services & Support (100.0%), while the most female-oriented occupations are Education Instruction & Library (100.0%), Arts, Media & Entertainment (100.0%), and Health Diagnosing & Treating (100.0%).
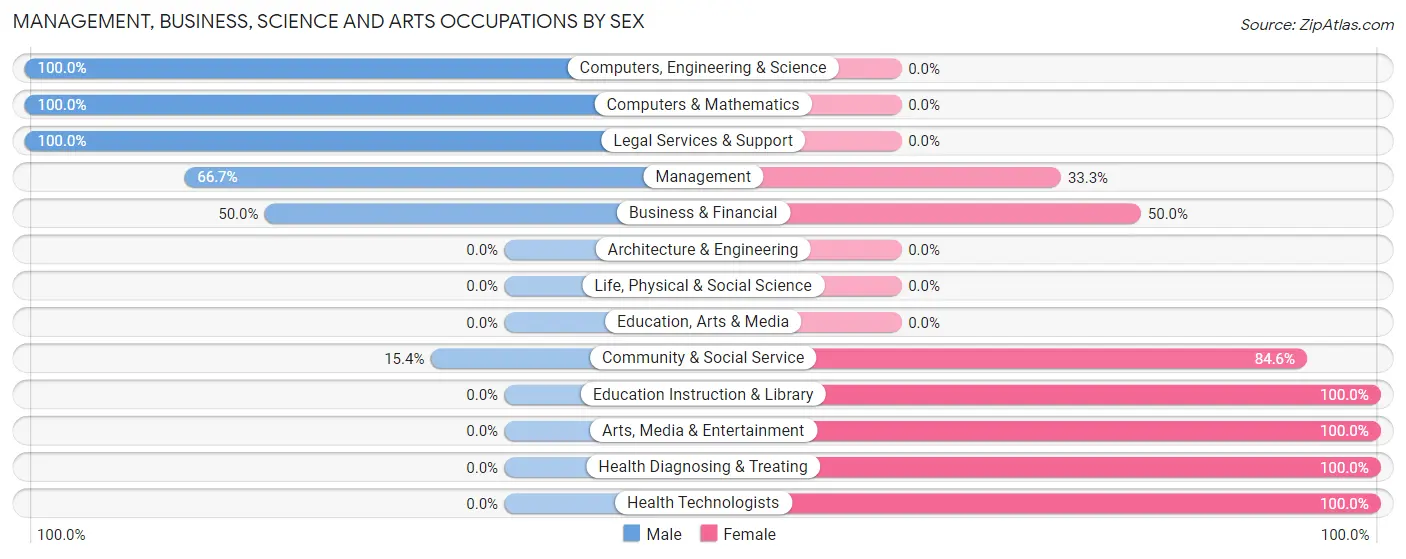
| Occupation | Male | Female |
| Management | 8 (66.7%) | 4 (33.3%) |
| Business & Financial | 5 (50.0%) | 5 (50.0%) |
| Computers, Engineering & Science | 6 (100.0%) | 0 (0.0%) |
| Computers & Mathematics | 6 (100.0%) | 0 (0.0%) |
| Architecture & Engineering | 0 (0.0%) | 0 (0.0%) |
| Life, Physical & Social Science | 0 (0.0%) | 0 (0.0%) |
| Community & Social Service | 2 (15.4%) | 11 (84.6%) |
| Education, Arts & Media | 0 (0.0%) | 0 (0.0%) |
| Legal Services & Support | 2 (100.0%) | 0 (0.0%) |
| Education Instruction & Library | 0 (0.0%) | 9 (100.0%) |
| Arts, Media & Entertainment | 0 (0.0%) | 2 (100.0%) |
| Health Diagnosing & Treating | 0 (0.0%) | 6 (100.0%) |
| Health Technologists | 0 (0.0%) | 6 (100.0%) |
| Total (Category) | 21 (44.7%) | 26 (55.3%) |
| Total (Overall) | 53 (53.5%) | 46 (46.5%) |
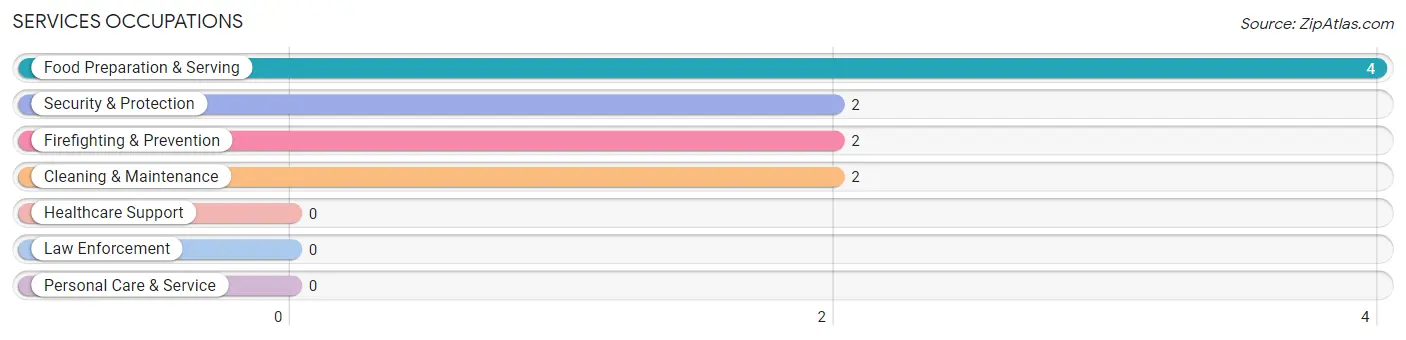
Services Occupations
The most common Services occupations in Woolsey are Food Preparation & Serving (4 | 4.0%), Security & Protection (2 | 2.0%), Firefighting & Prevention (2 | 2.0%), and Cleaning & Maintenance (2 | 2.0%).
Services Occupations by Sex
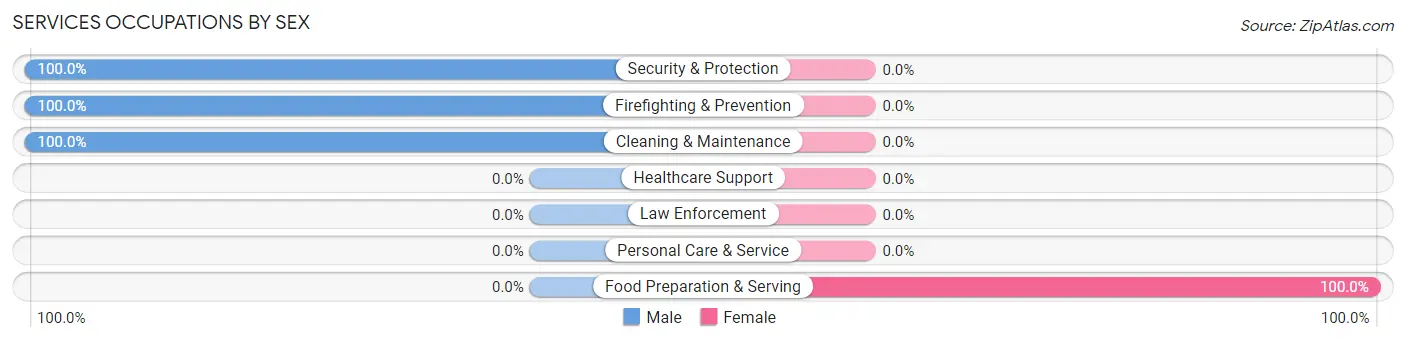
| Occupation | Male | Female |
| Healthcare Support | 0 (0.0%) | 0 (0.0%) |
| Security & Protection | 2 (100.0%) | 0 (0.0%) |
| Firefighting & Prevention | 2 (100.0%) | 0 (0.0%) |
| Law Enforcement | 0 (0.0%) | 0 (0.0%) |
| Food Preparation & Serving | 0 (0.0%) | 4 (100.0%) |
| Cleaning & Maintenance | 2 (100.0%) | 0 (0.0%) |
| Personal Care & Service | 0 (0.0%) | 0 (0.0%) |
| Total (Category) | 4 (50.0%) | 4 (50.0%) |
| Total (Overall) | 53 (53.5%) | 46 (46.5%) |
Sales and Office Occupations
The most common Sales and Office occupations in Woolsey are Office & Administration (7 | 7.1%), and Sales & Related (6 | 6.1%).
Sales and Office Occupations by Sex
| Occupation | Male | Female |
| Sales & Related | 1 (16.7%) | 5 (83.3%) |
| Office & Administration | 0 (0.0%) | 7 (100.0%) |
| Total (Category) | 1 (7.7%) | 12 (92.3%) |
| Total (Overall) | 53 (53.5%) | 46 (46.5%) |
Natural Resources, Construction and Maintenance Occupations
The most common Natural Resources, Construction and Maintenance occupations in Woolsey are Construction & Extraction (11 | 11.1%), Installation, Maintenance & Repair (6 | 6.1%), and Farming, Fishing & Forestry (2 | 2.0%).
Natural Resources, Construction and Maintenance Occupations by Sex
| Occupation | Male | Female |
| Farming, Fishing & Forestry | 0 (0.0%) | 2 (100.0%) |
| Construction & Extraction | 11 (100.0%) | 0 (0.0%) |
| Installation, Maintenance & Repair | 6 (100.0%) | 0 (0.0%) |
| Total (Category) | 17 (89.5%) | 2 (10.5%) |
| Total (Overall) | 53 (53.5%) | 46 (46.5%) |
Production, Transportation and Moving Occupations
The most common Production, Transportation and Moving occupations in Woolsey are Transportation (7 | 7.1%), Production (3 | 3.0%), and Material Moving (2 | 2.0%).
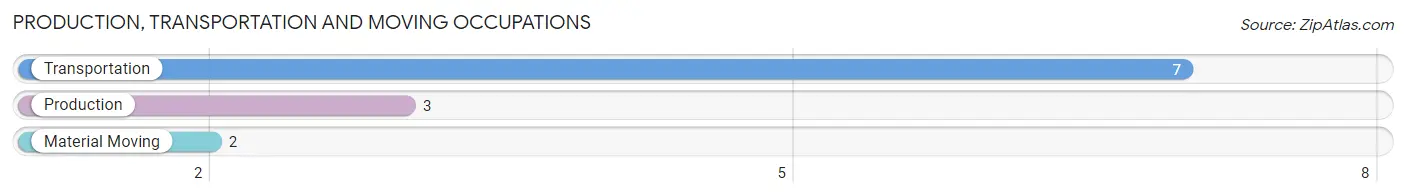
Production, Transportation and Moving Occupations by Sex
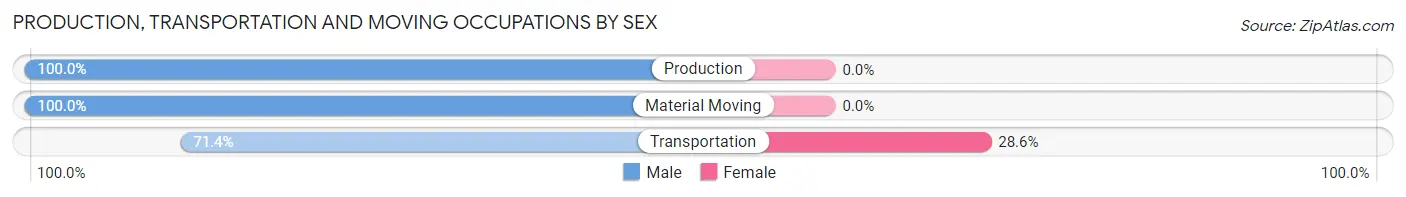
| Occupation | Male | Female |
| Production | 3 (100.0%) | 0 (0.0%) |
| Transportation | 5 (71.4%) | 2 (28.6%) |
| Material Moving | 2 (100.0%) | 0 (0.0%) |
| Total (Category) | 10 (83.3%) | 2 (16.7%) |
| Total (Overall) | 53 (53.5%) | 46 (46.5%) |
Employment Industries by Sex in Woolsey
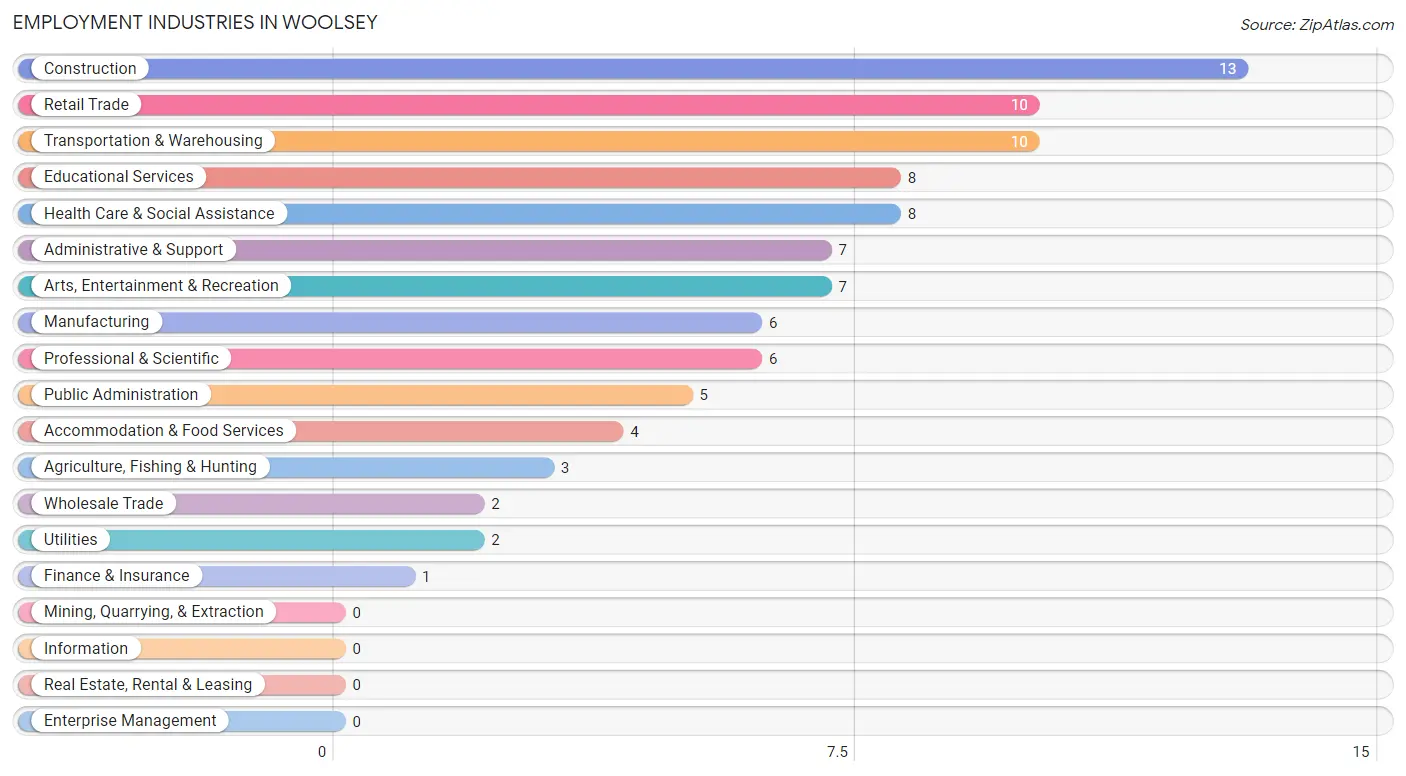
Employment Industries in Woolsey
The major employment industries in Woolsey include Construction (13 | 13.1%), Retail Trade (10 | 10.1%), Transportation & Warehousing (10 | 10.1%), Educational Services (8 | 8.1%), and Health Care & Social Assistance (8 | 8.1%).
Employment Industries by Sex in Woolsey
The Woolsey industries that see more men than women are Manufacturing (100.0%), Wholesale Trade (100.0%), and Utilities (100.0%), whereas the industries that tend to have a higher number of women are Finance & Insurance (100.0%), Educational Services (100.0%), and Arts, Entertainment & Recreation (100.0%).
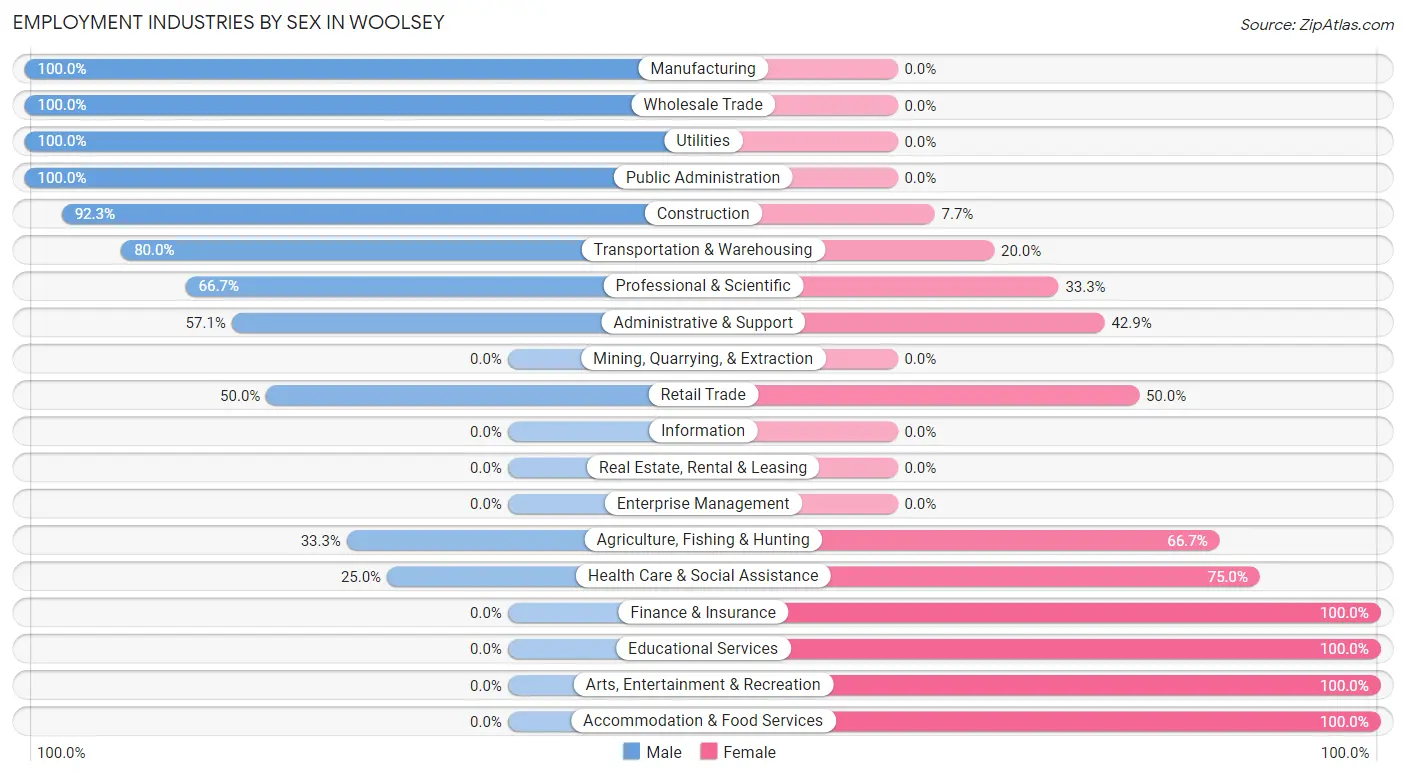
| Industry | Male | Female |
| Agriculture, Fishing & Hunting | 1 (33.3%) | 2 (66.7%) |
| Mining, Quarrying, & Extraction | 0 (0.0%) | 0 (0.0%) |
| Construction | 12 (92.3%) | 1 (7.7%) |
| Manufacturing | 6 (100.0%) | 0 (0.0%) |
| Wholesale Trade | 2 (100.0%) | 0 (0.0%) |
| Retail Trade | 5 (50.0%) | 5 (50.0%) |
| Transportation & Warehousing | 8 (80.0%) | 2 (20.0%) |
| Utilities | 2 (100.0%) | 0 (0.0%) |
| Information | 0 (0.0%) | 0 (0.0%) |
| Finance & Insurance | 0 (0.0%) | 1 (100.0%) |
| Real Estate, Rental & Leasing | 0 (0.0%) | 0 (0.0%) |
| Professional & Scientific | 4 (66.7%) | 2 (33.3%) |
| Enterprise Management | 0 (0.0%) | 0 (0.0%) |
| Administrative & Support | 4 (57.1%) | 3 (42.9%) |
| Educational Services | 0 (0.0%) | 8 (100.0%) |
| Health Care & Social Assistance | 2 (25.0%) | 6 (75.0%) |
| Arts, Entertainment & Recreation | 0 (0.0%) | 7 (100.0%) |
| Accommodation & Food Services | 0 (0.0%) | 4 (100.0%) |
| Public Administration | 5 (100.0%) | 0 (0.0%) |
| Total | 53 (53.5%) | 46 (46.5%) |
Education in Woolsey
School Enrollment in Woolsey
The most common levels of schooling among the 67 students in Woolsey are elementary school (24 | 35.8%), middle school (17 | 25.4%), and college / undergraduate (14 | 20.9%).
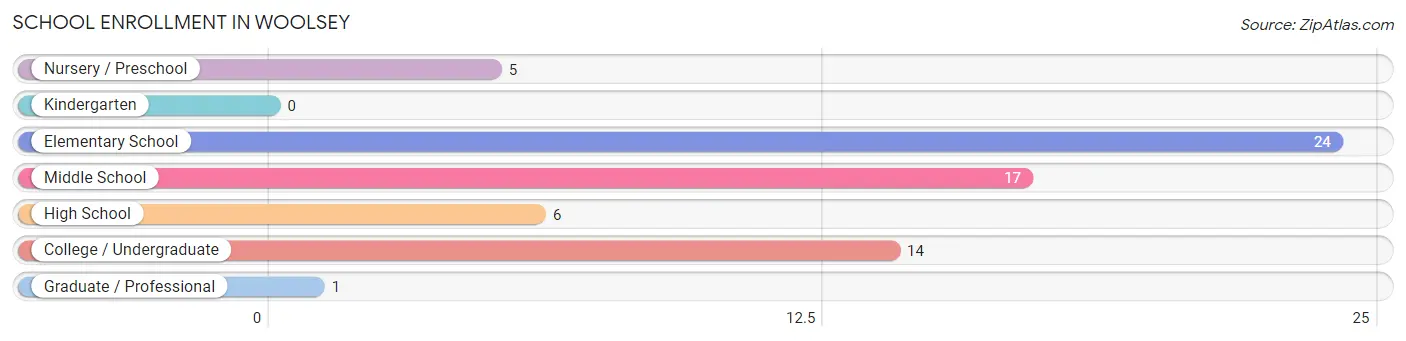
| School Level | # Students | % Students |
| Nursery / Preschool | 5 | 7.5% |
| Kindergarten | 0 | 0.0% |
| Elementary School | 24 | 35.8% |
| Middle School | 17 | 25.4% |
| High School | 6 | 9.0% |
| College / Undergraduate | 14 | 20.9% |
| Graduate / Professional | 1 | 1.5% |
| Total | 67 | 100.0% |
School Enrollment by Age by Funding Source in Woolsey
Out of a total of 67 students who are enrolled in schools in Woolsey, 21 (31.3%) attend a private institution, while the remaining 46 (68.7%) are enrolled in public schools. The age group of 3 to 4 year olds has the highest likelihood of being enrolled in private schools, with 5 (100.0% in the age bracket) enrolled. Conversely, the age group of 15 to 17 year olds has the lowest likelihood of being enrolled in a private school, with 6 (100.0% in the age bracket) attending a public institution.
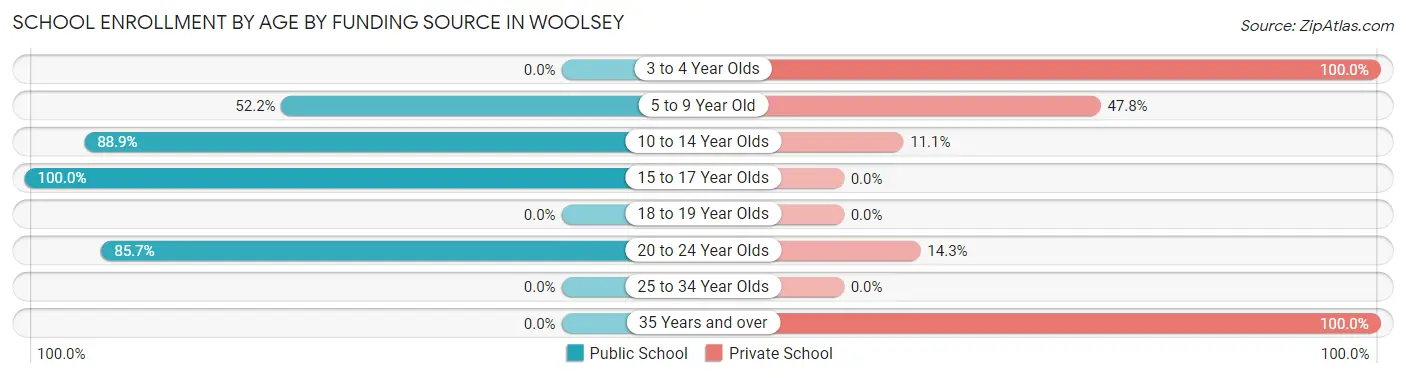
| Age Bracket | Public School | Private School |
| 3 to 4 Year Olds | 0 (0.0%) | 5 (100.0%) |
| 5 to 9 Year Old | 12 (52.2%) | 11 (47.8%) |
| 10 to 14 Year Olds | 16 (88.9%) | 2 (11.1%) |
| 15 to 17 Year Olds | 6 (100.0%) | 0 (0.0%) |
| 18 to 19 Year Olds | 0 (0.0%) | 0 (0.0%) |
| 20 to 24 Year Olds | 12 (85.7%) | 2 (14.3%) |
| 25 to 34 Year Olds | 0 (0.0%) | 0 (0.0%) |
| 35 Years and over | 0 (0.0%) | 1 (100.0%) |
| Total | 46 (68.7%) | 21 (31.3%) |
Educational Attainment by Field of Study in Woolsey
Business (13 | 22.8%), science & technology (10 | 17.5%), engineering (7 | 12.3%), physical & health sciences (5 | 8.8%), and social sciences (5 | 8.8%) are the most common fields of study among 57 individuals in Woolsey who have obtained a bachelor's degree or higher.
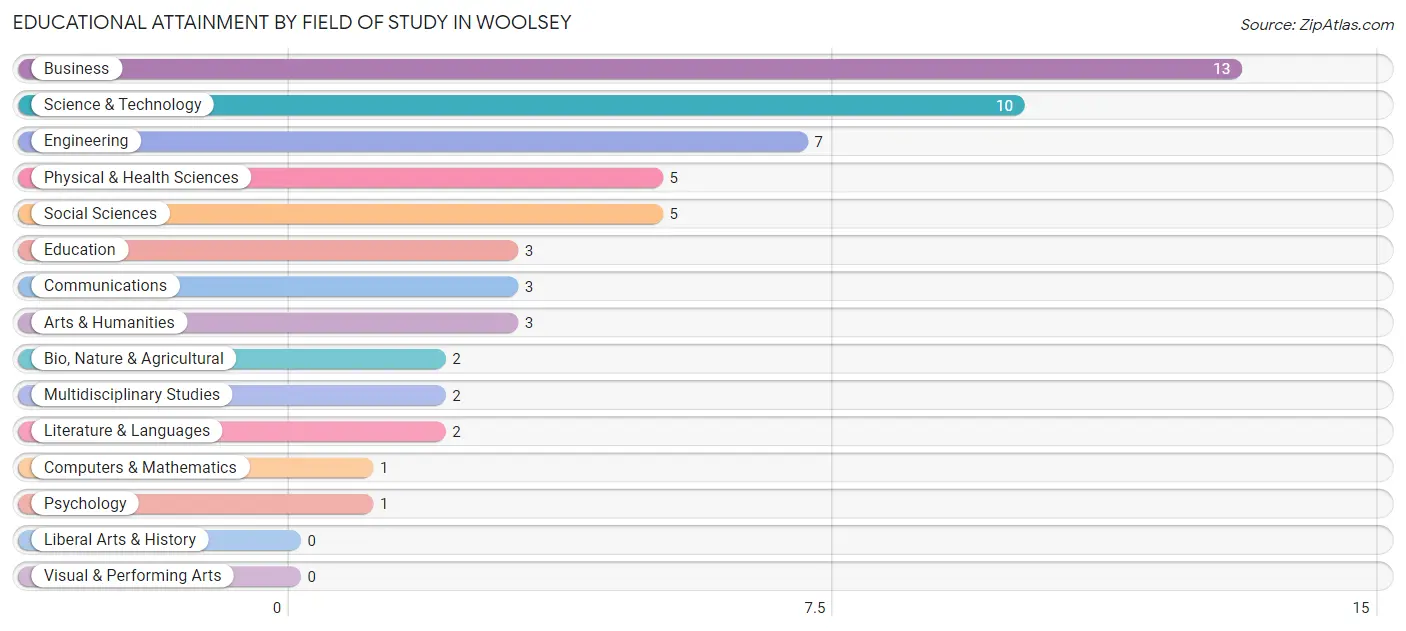
| Field of Study | # Graduates | % Graduates |
| Computers & Mathematics | 1 | 1.8% |
| Bio, Nature & Agricultural | 2 | 3.5% |
| Physical & Health Sciences | 5 | 8.8% |
| Psychology | 1 | 1.8% |
| Social Sciences | 5 | 8.8% |
| Engineering | 7 | 12.3% |
| Multidisciplinary Studies | 2 | 3.5% |
| Science & Technology | 10 | 17.5% |
| Business | 13 | 22.8% |
| Education | 3 | 5.3% |
| Literature & Languages | 2 | 3.5% |
| Liberal Arts & History | 0 | 0.0% |
| Visual & Performing Arts | 0 | 0.0% |
| Communications | 3 | 5.3% |
| Arts & Humanities | 3 | 5.3% |
| Total | 57 | 100.0% |
Transportation & Commute in Woolsey
Vehicle Availability by Sex in Woolsey
The most prevalent vehicle ownership categories in Woolsey are males with 2 vehicles (21, accounting for 38.2%) and females with 2 vehicles (10, making up 52.5%).
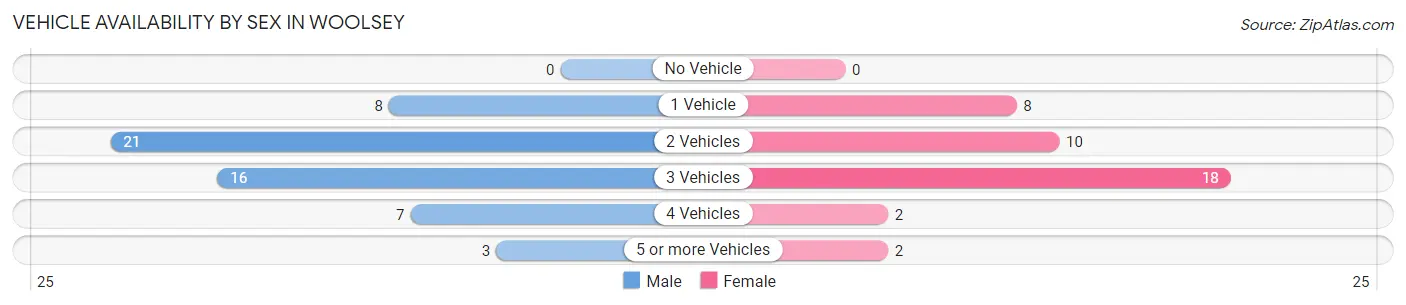
| Vehicles Available | Male | Female |
| No Vehicle | 0 (0.0%) | 0 (0.0%) |
| 1 Vehicle | 8 (14.5%) | 8 (20.0%) |
| 2 Vehicles | 21 (38.2%) | 10 (25.0%) |
| 3 Vehicles | 16 (29.1%) | 18 (45.0%) |
| 4 Vehicles | 7 (12.7%) | 2 (5.0%) |
| 5 or more Vehicles | 3 (5.4%) | 2 (5.0%) |
| Total | 55 (100.0%) | 40 (100.0%) |
Commute Time in Woolsey
The most frequently occuring commute durations in Woolsey are 60 to 89 minutes (13 commuters, 18.6%), 35 to 39 minutes (11 commuters, 15.7%), and 5 to 9 minutes (7 commuters, 10.0%).
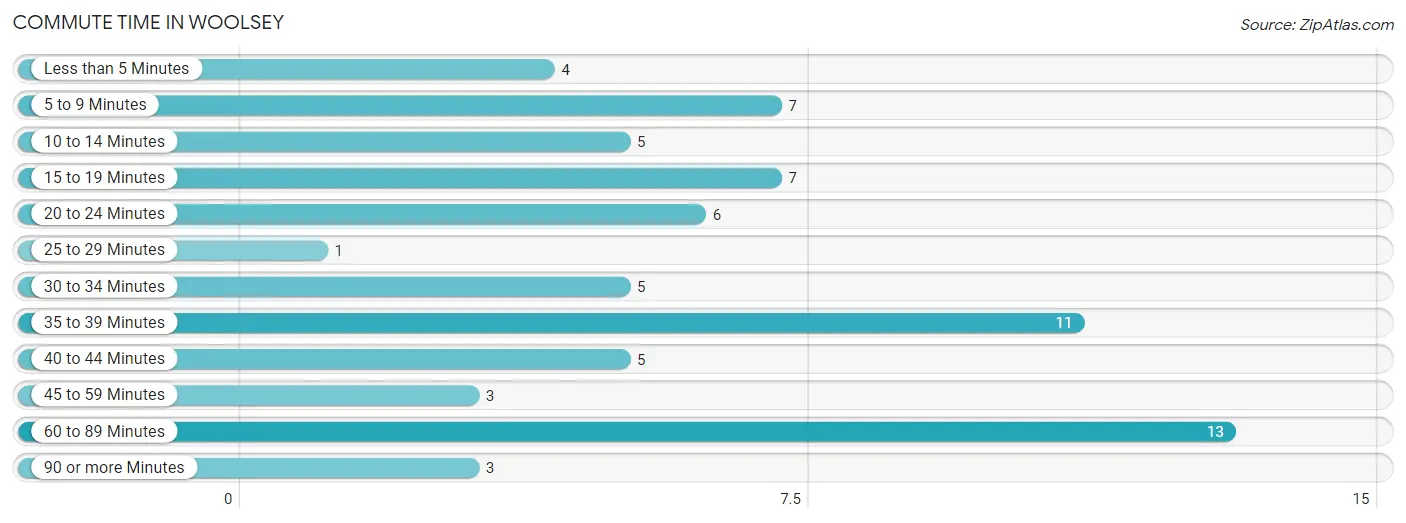
| Commute Time | # Commuters | % Commuters |
| Less than 5 Minutes | 4 | 5.7% |
| 5 to 9 Minutes | 7 | 10.0% |
| 10 to 14 Minutes | 5 | 7.1% |
| 15 to 19 Minutes | 7 | 10.0% |
| 20 to 24 Minutes | 6 | 8.6% |
| 25 to 29 Minutes | 1 | 1.4% |
| 30 to 34 Minutes | 5 | 7.1% |
| 35 to 39 Minutes | 11 | 15.7% |
| 40 to 44 Minutes | 5 | 7.1% |
| 45 to 59 Minutes | 3 | 4.3% |
| 60 to 89 Minutes | 13 | 18.6% |
| 90 or more Minutes | 3 | 4.3% |
Commute Time by Sex in Woolsey
The most common commute times in Woolsey are 60 to 89 minutes (13 commuters, 28.3%) for males and 15 to 19 minutes (6 commuters, 25.0%) for females.
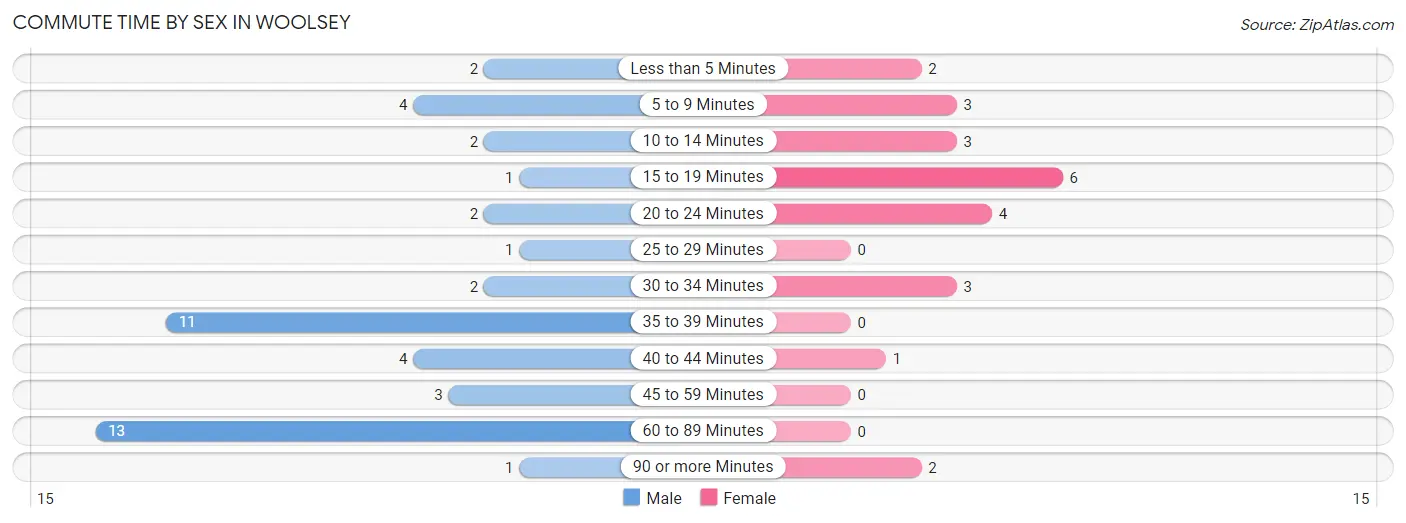
| Commute Time | Male | Female |
| Less than 5 Minutes | 2 (4.3%) | 2 (8.3%) |
| 5 to 9 Minutes | 4 (8.7%) | 3 (12.5%) |
| 10 to 14 Minutes | 2 (4.3%) | 3 (12.5%) |
| 15 to 19 Minutes | 1 (2.2%) | 6 (25.0%) |
| 20 to 24 Minutes | 2 (4.3%) | 4 (16.7%) |
| 25 to 29 Minutes | 1 (2.2%) | 0 (0.0%) |
| 30 to 34 Minutes | 2 (4.3%) | 3 (12.5%) |
| 35 to 39 Minutes | 11 (23.9%) | 0 (0.0%) |
| 40 to 44 Minutes | 4 (8.7%) | 1 (4.2%) |
| 45 to 59 Minutes | 3 (6.5%) | 0 (0.0%) |
| 60 to 89 Minutes | 13 (28.3%) | 0 (0.0%) |
| 90 or more Minutes | 1 (2.2%) | 2 (8.3%) |
Time of Departure to Work by Sex in Woolsey
The most frequent times of departure to work in Woolsey are 6:30 AM to 6:59 AM (13, 28.3%) for males and 4:00 PM to 11:59 PM (6, 25.0%) for females.
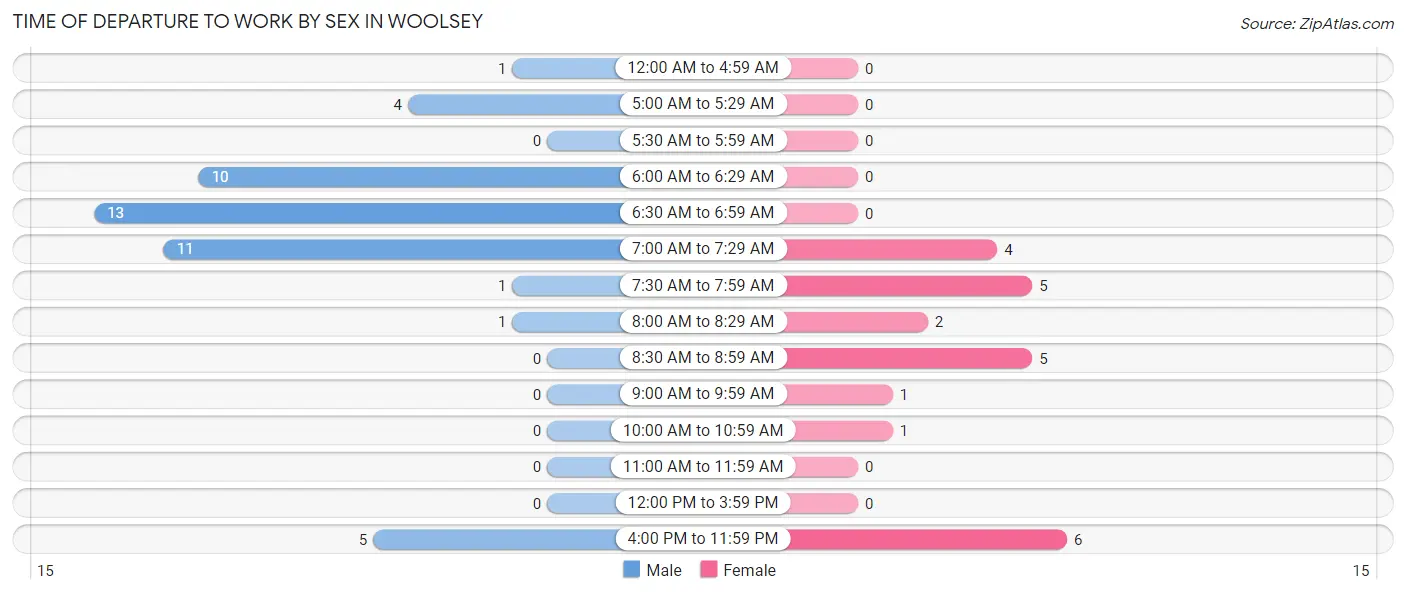
| Time of Departure | Male | Female |
| 12:00 AM to 4:59 AM | 1 (2.2%) | 0 (0.0%) |
| 5:00 AM to 5:29 AM | 4 (8.7%) | 0 (0.0%) |
| 5:30 AM to 5:59 AM | 0 (0.0%) | 0 (0.0%) |
| 6:00 AM to 6:29 AM | 10 (21.7%) | 0 (0.0%) |
| 6:30 AM to 6:59 AM | 13 (28.3%) | 0 (0.0%) |
| 7:00 AM to 7:29 AM | 11 (23.9%) | 4 (16.7%) |
| 7:30 AM to 7:59 AM | 1 (2.2%) | 5 (20.8%) |
| 8:00 AM to 8:29 AM | 1 (2.2%) | 2 (8.3%) |
| 8:30 AM to 8:59 AM | 0 (0.0%) | 5 (20.8%) |
| 9:00 AM to 9:59 AM | 0 (0.0%) | 1 (4.2%) |
| 10:00 AM to 10:59 AM | 0 (0.0%) | 1 (4.2%) |
| 11:00 AM to 11:59 AM | 0 (0.0%) | 0 (0.0%) |
| 12:00 PM to 3:59 PM | 0 (0.0%) | 0 (0.0%) |
| 4:00 PM to 11:59 PM | 5 (10.9%) | 6 (25.0%) |
| Total | 46 (100.0%) | 24 (100.0%) |
Housing Occupancy in Woolsey
Occupancy by Ownership in Woolsey
Of the total 77 dwellings in Woolsey, owner-occupied units account for 73 (94.8%), while renter-occupied units make up 4 (5.2%).
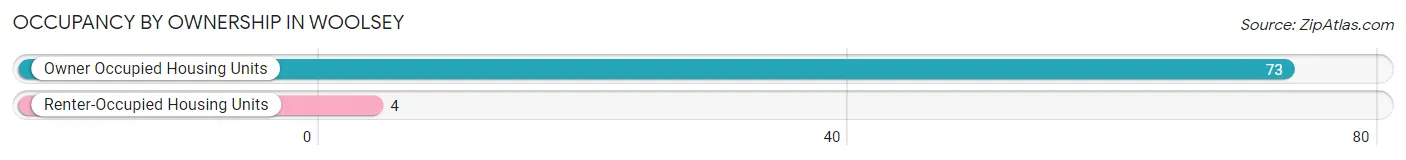
| Occupancy | # Housing Units | % Housing Units |
| Owner Occupied Housing Units | 73 | 94.8% |
| Renter-Occupied Housing Units | 4 | 5.2% |
| Total Occupied Housing Units | 77 | 100.0% |
Occupancy by Household Size in Woolsey
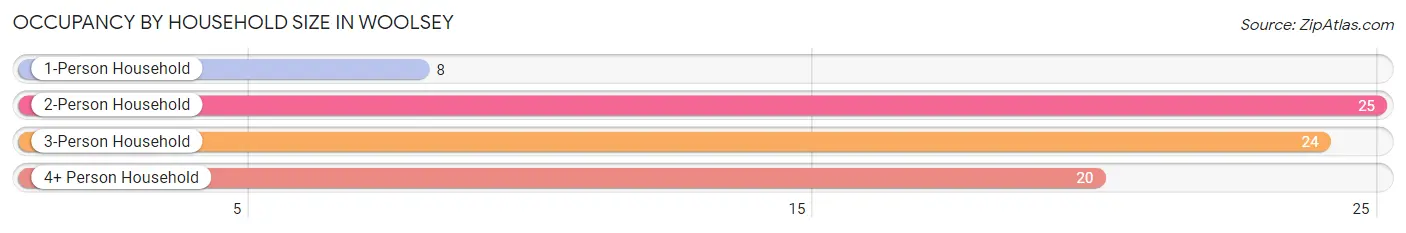
| Household Size | # Housing Units | % Housing Units |
| 1-Person Household | 8 | 10.4% |
| 2-Person Household | 25 | 32.5% |
| 3-Person Household | 24 | 31.2% |
| 4+ Person Household | 20 | 26.0% |
| Total Housing Units | 77 | 100.0% |
Occupancy by Ownership by Household Size in Woolsey
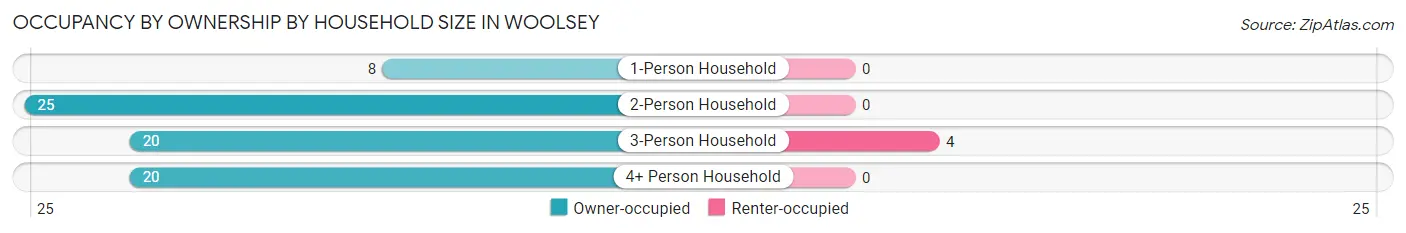
| Household Size | Owner-occupied | Renter-occupied |
| 1-Person Household | 8 (100.0%) | 0 (0.0%) |
| 2-Person Household | 25 (100.0%) | 0 (0.0%) |
| 3-Person Household | 20 (83.3%) | 4 (16.7%) |
| 4+ Person Household | 20 (100.0%) | 0 (0.0%) |
| Total Housing Units | 73 (94.8%) | 4 (5.2%) |
Occupancy by Educational Attainment in Woolsey
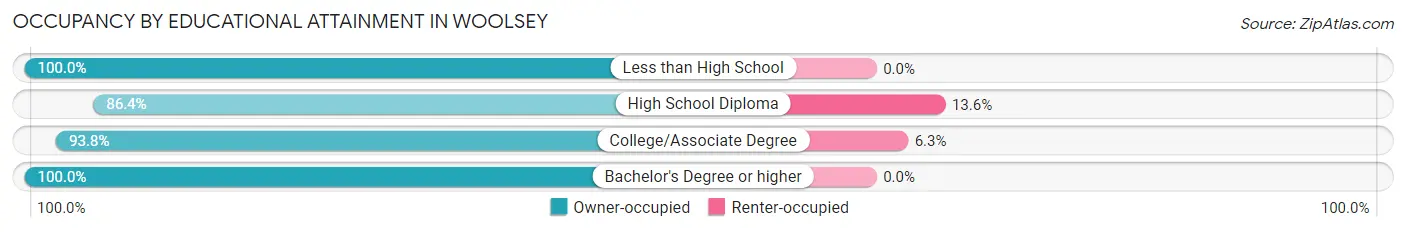
| Household Size | Owner-occupied | Renter-occupied |
| Less than High School | 3 (100.0%) | 0 (0.0%) |
| High School Diploma | 19 (86.4%) | 3 (13.6%) |
| College/Associate Degree | 15 (93.8%) | 1 (6.2%) |
| Bachelor's Degree or higher | 36 (100.0%) | 0 (0.0%) |
Occupancy by Age of Householder in Woolsey
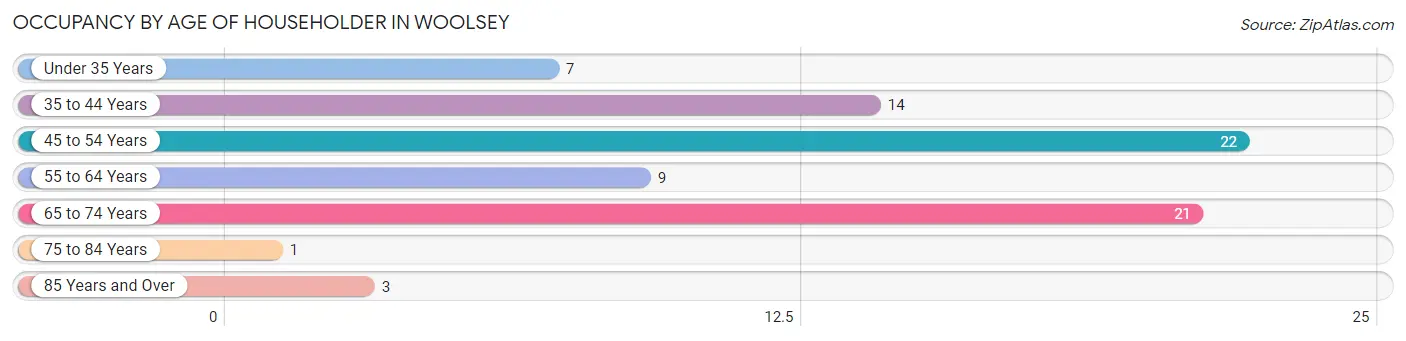
| Age Bracket | # Households | % Households |
| Under 35 Years | 7 | 9.1% |
| 35 to 44 Years | 14 | 18.2% |
| 45 to 54 Years | 22 | 28.6% |
| 55 to 64 Years | 9 | 11.7% |
| 65 to 74 Years | 21 | 27.3% |
| 75 to 84 Years | 1 | 1.3% |
| 85 Years and Over | 3 | 3.9% |
| Total | 77 | 100.0% |
Housing Finances in Woolsey
Median Income by Occupancy in Woolsey
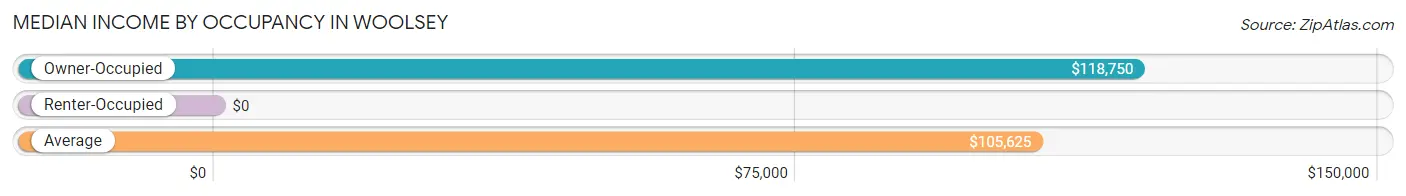
| Occupancy Type | # Households | Median Income |
| Owner-Occupied | 73 (94.8%) | $118,750 |
| Renter-Occupied | 4 (5.2%) | $0 |
| Average | 77 (100.0%) | $105,625 |
Occupancy by Householder Income Bracket in Woolsey
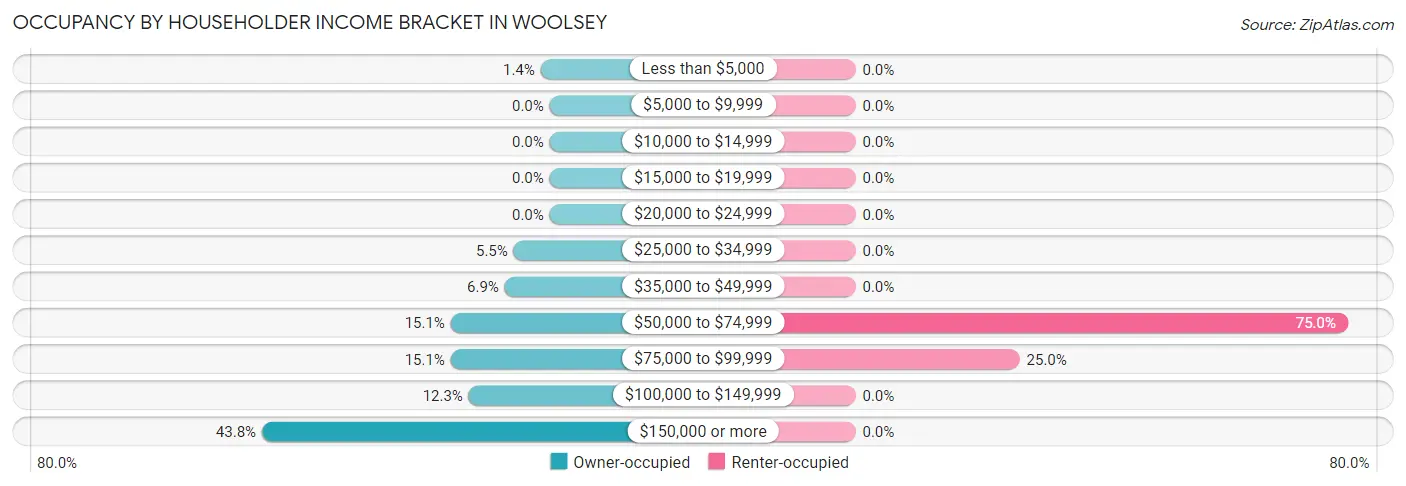
| Income Bracket | Owner-occupied | Renter-occupied |
| Less than $5,000 | 1 (1.4%) | 0 (0.0%) |
| $5,000 to $9,999 | 0 (0.0%) | 0 (0.0%) |
| $10,000 to $14,999 | 0 (0.0%) | 0 (0.0%) |
| $15,000 to $19,999 | 0 (0.0%) | 0 (0.0%) |
| $20,000 to $24,999 | 0 (0.0%) | 0 (0.0%) |
| $25,000 to $34,999 | 4 (5.5%) | 0 (0.0%) |
| $35,000 to $49,999 | 5 (6.9%) | 0 (0.0%) |
| $50,000 to $74,999 | 11 (15.1%) | 3 (75.0%) |
| $75,000 to $99,999 | 11 (15.1%) | 1 (25.0%) |
| $100,000 to $149,999 | 9 (12.3%) | 0 (0.0%) |
| $150,000 or more | 32 (43.8%) | 0 (0.0%) |
| Total | 73 (100.0%) | 4 (100.0%) |
Monthly Housing Cost Tiers in Woolsey
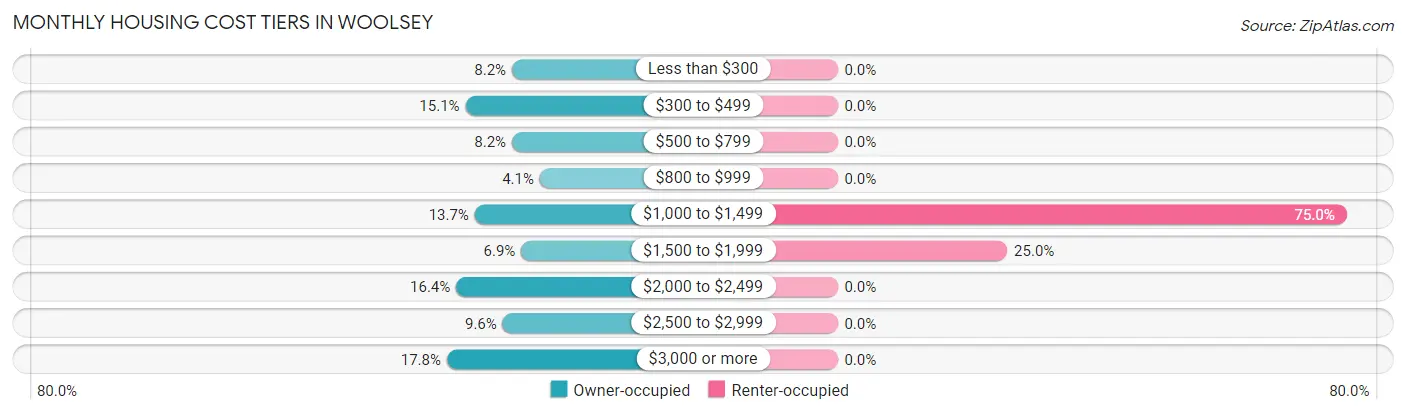
| Monthly Cost | Owner-occupied | Renter-occupied |
| Less than $300 | 6 (8.2%) | 0 (0.0%) |
| $300 to $499 | 11 (15.1%) | 0 (0.0%) |
| $500 to $799 | 6 (8.2%) | 0 (0.0%) |
| $800 to $999 | 3 (4.1%) | 0 (0.0%) |
| $1,000 to $1,499 | 10 (13.7%) | 3 (75.0%) |
| $1,500 to $1,999 | 5 (6.9%) | 1 (25.0%) |
| $2,000 to $2,499 | 12 (16.4%) | 0 (0.0%) |
| $2,500 to $2,999 | 7 (9.6%) | 0 (0.0%) |
| $3,000 or more | 13 (17.8%) | 0 (0.0%) |
| Total | 73 (100.0%) | 4 (100.0%) |
Physical Housing Characteristics in Woolsey
Housing Structures in Woolsey
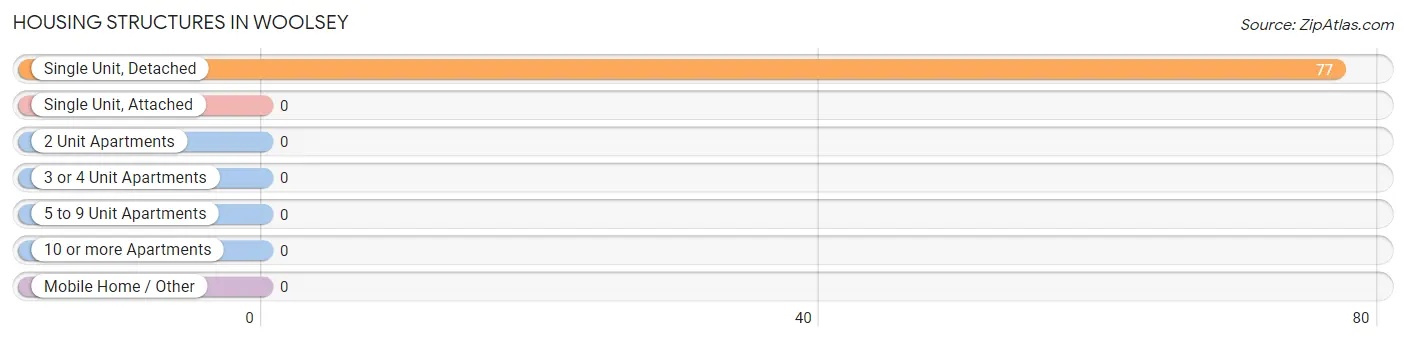
| Structure Type | # Housing Units | % Housing Units |
| Single Unit, Detached | 77 | 100.0% |
| Single Unit, Attached | 0 | 0.0% |
| 2 Unit Apartments | 0 | 0.0% |
| 3 or 4 Unit Apartments | 0 | 0.0% |
| 5 to 9 Unit Apartments | 0 | 0.0% |
| 10 or more Apartments | 0 | 0.0% |
| Mobile Home / Other | 0 | 0.0% |
| Total | 77 | 100.0% |
Housing Structures by Occupancy in Woolsey
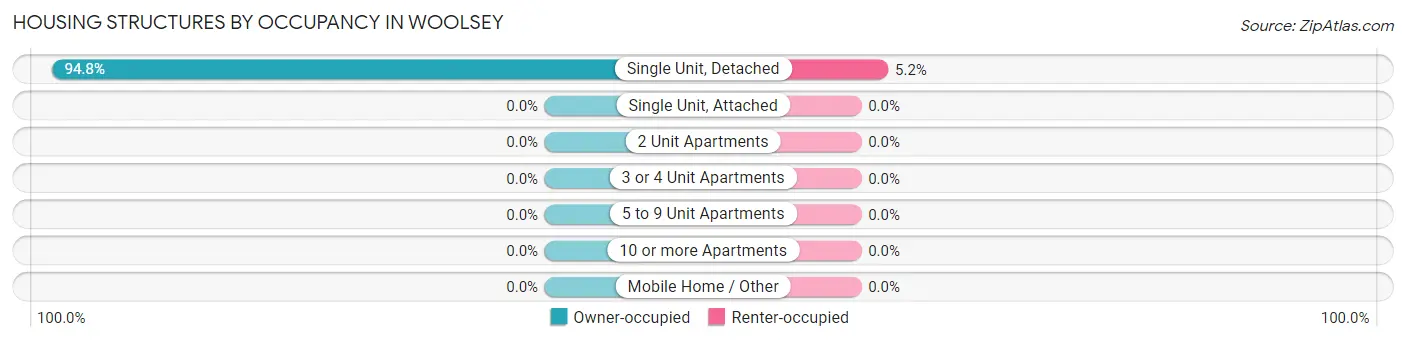
| Structure Type | Owner-occupied | Renter-occupied |
| Single Unit, Detached | 73 (94.8%) | 4 (5.2%) |
| Single Unit, Attached | 0 (0.0%) | 0 (0.0%) |
| 2 Unit Apartments | 0 (0.0%) | 0 (0.0%) |
| 3 or 4 Unit Apartments | 0 (0.0%) | 0 (0.0%) |
| 5 to 9 Unit Apartments | 0 (0.0%) | 0 (0.0%) |
| 10 or more Apartments | 0 (0.0%) | 0 (0.0%) |
| Mobile Home / Other | 0 (0.0%) | 0 (0.0%) |
| Total | 73 (94.8%) | 4 (5.2%) |
Housing Structures by Number of Rooms in Woolsey
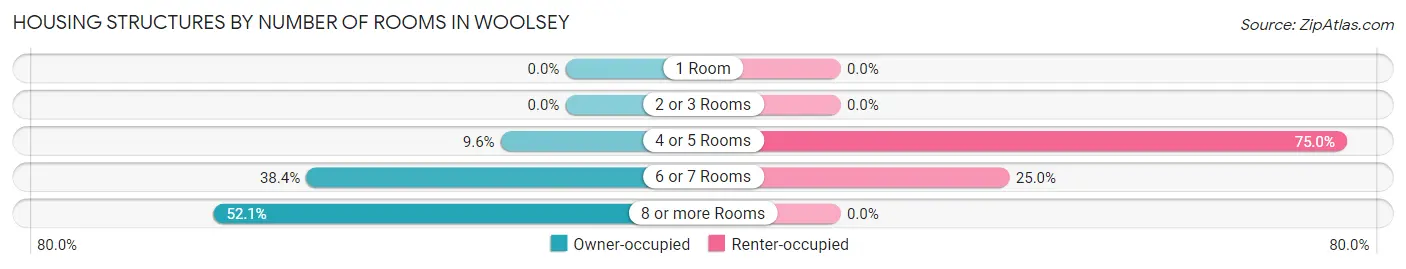
| Number of Rooms | Owner-occupied | Renter-occupied |
| 1 Room | 0 (0.0%) | 0 (0.0%) |
| 2 or 3 Rooms | 0 (0.0%) | 0 (0.0%) |
| 4 or 5 Rooms | 7 (9.6%) | 3 (75.0%) |
| 6 or 7 Rooms | 28 (38.4%) | 1 (25.0%) |
| 8 or more Rooms | 38 (52.0%) | 0 (0.0%) |
| Total | 73 (100.0%) | 4 (100.0%) |
Housing Structure by Heating Type in Woolsey
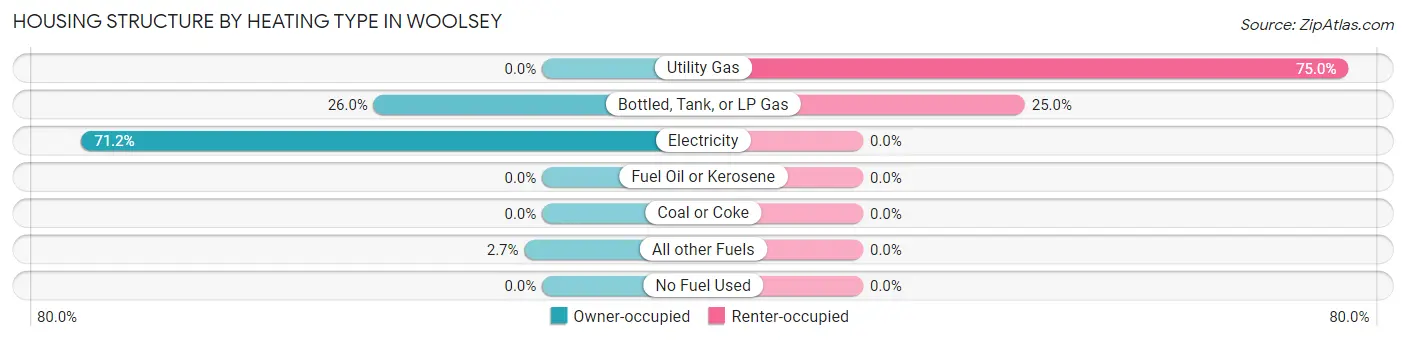
| Heating Type | Owner-occupied | Renter-occupied |
| Utility Gas | 0 (0.0%) | 3 (75.0%) |
| Bottled, Tank, or LP Gas | 19 (26.0%) | 1 (25.0%) |
| Electricity | 52 (71.2%) | 0 (0.0%) |
| Fuel Oil or Kerosene | 0 (0.0%) | 0 (0.0%) |
| Coal or Coke | 0 (0.0%) | 0 (0.0%) |
| All other Fuels | 2 (2.7%) | 0 (0.0%) |
| No Fuel Used | 0 (0.0%) | 0 (0.0%) |
| Total | 73 (100.0%) | 4 (100.0%) |
Household Vehicle Usage in Woolsey
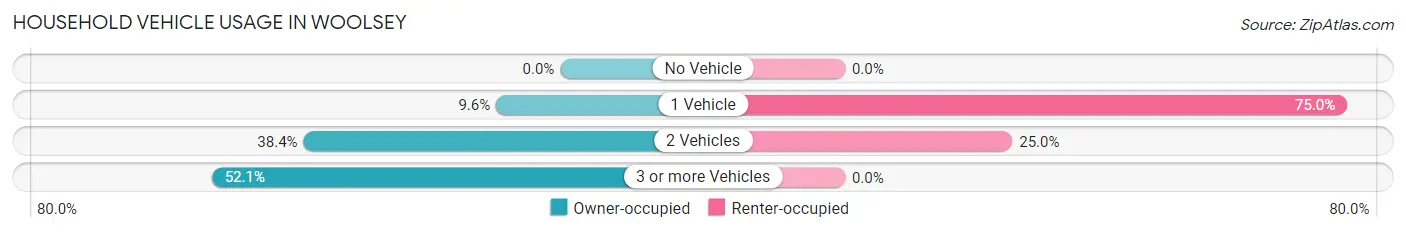
| Vehicles per Household | Owner-occupied | Renter-occupied |
| No Vehicle | 0 (0.0%) | 0 (0.0%) |
| 1 Vehicle | 7 (9.6%) | 3 (75.0%) |
| 2 Vehicles | 28 (38.4%) | 1 (25.0%) |
| 3 or more Vehicles | 38 (52.0%) | 0 (0.0%) |
| Total | 73 (100.0%) | 4 (100.0%) |
Real Estate & Mortgages in Woolsey
Real Estate and Mortgage Overview in Woolsey
| Characteristic | Without Mortgage | With Mortgage |
| Housing Units | 31 | 42 |
| Median Property Value | $321,400 | $541,700 |
| Median Household Income | $66,875 | $26 |
| Monthly Housing Costs | - | - |
| Real Estate Taxes | - | - |
Property Value by Mortgage Status in Woolsey
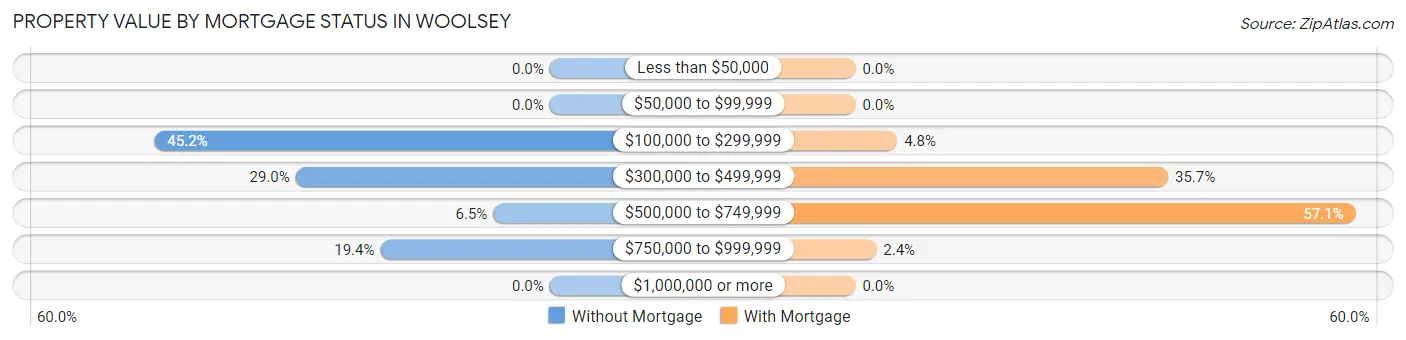
| Property Value | Without Mortgage | With Mortgage |
| Less than $50,000 | 0 (0.0%) | 0 (0.0%) |
| $50,000 to $99,999 | 0 (0.0%) | 0 (0.0%) |
| $100,000 to $299,999 | 14 (45.2%) | 2 (4.8%) |
| $300,000 to $499,999 | 9 (29.0%) | 15 (35.7%) |
| $500,000 to $749,999 | 2 (6.5%) | 24 (57.1%) |
| $750,000 to $999,999 | 6 (19.4%) | 1 (2.4%) |
| $1,000,000 or more | 0 (0.0%) | 0 (0.0%) |
| Total | 31 (100.0%) | 42 (100.0%) |
Household Income by Mortgage Status in Woolsey
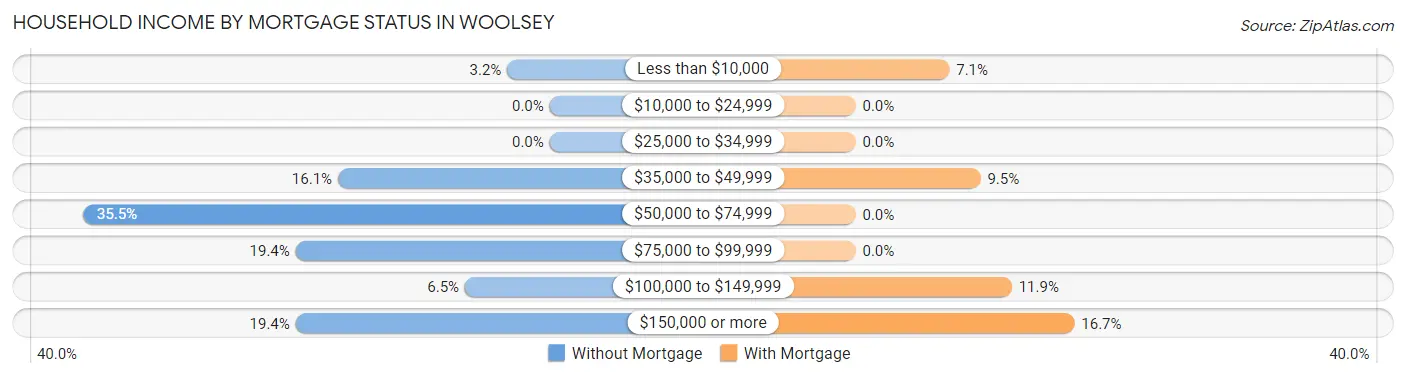
| Household Income | Without Mortgage | With Mortgage |
| Less than $10,000 | 1 (3.2%) | 3 (7.1%) |
| $10,000 to $24,999 | 0 (0.0%) | 0 (0.0%) |
| $25,000 to $34,999 | 0 (0.0%) | 0 (0.0%) |
| $35,000 to $49,999 | 5 (16.1%) | 4 (9.5%) |
| $50,000 to $74,999 | 11 (35.5%) | 0 (0.0%) |
| $75,000 to $99,999 | 6 (19.4%) | 0 (0.0%) |
| $100,000 to $149,999 | 2 (6.5%) | 5 (11.9%) |
| $150,000 or more | 6 (19.4%) | 7 (16.7%) |
| Total | 31 (100.0%) | 42 (100.0%) |
Property Value to Household Income Ratio in Woolsey
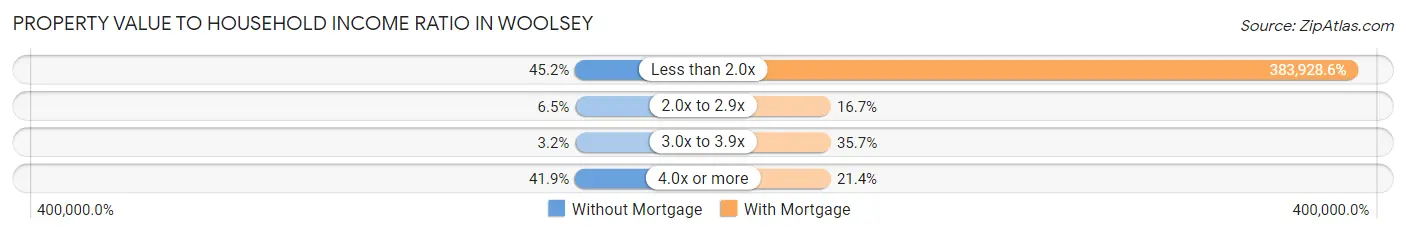
| Value-to-Income Ratio | Without Mortgage | With Mortgage |
| Less than 2.0x | 14 (45.2%) | 161,250 (383,928.6%) |
| 2.0x to 2.9x | 2 (6.5%) | 7 (16.7%) |
| 3.0x to 3.9x | 1 (3.2%) | 15 (35.7%) |
| 4.0x or more | 13 (41.9%) | 9 (21.4%) |
| Total | 31 (100.0%) | 42 (100.0%) |
Real Estate Taxes by Mortgage Status in Woolsey
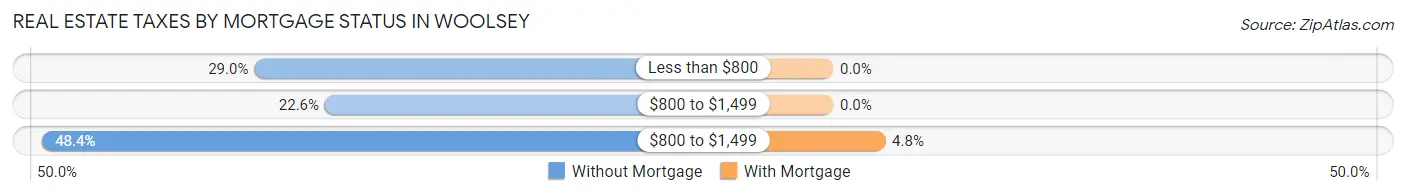
| Property Taxes | Without Mortgage | With Mortgage |
| Less than $800 | 9 (29.0%) | 0 (0.0%) |
| $800 to $1,499 | 7 (22.6%) | 0 (0.0%) |
| $800 to $1,499 | 15 (48.4%) | 2 (4.8%) |
| Total | 31 (100.0%) | 42 (100.0%) |
Health & Disability in Woolsey
Health Insurance Coverage by Age in Woolsey
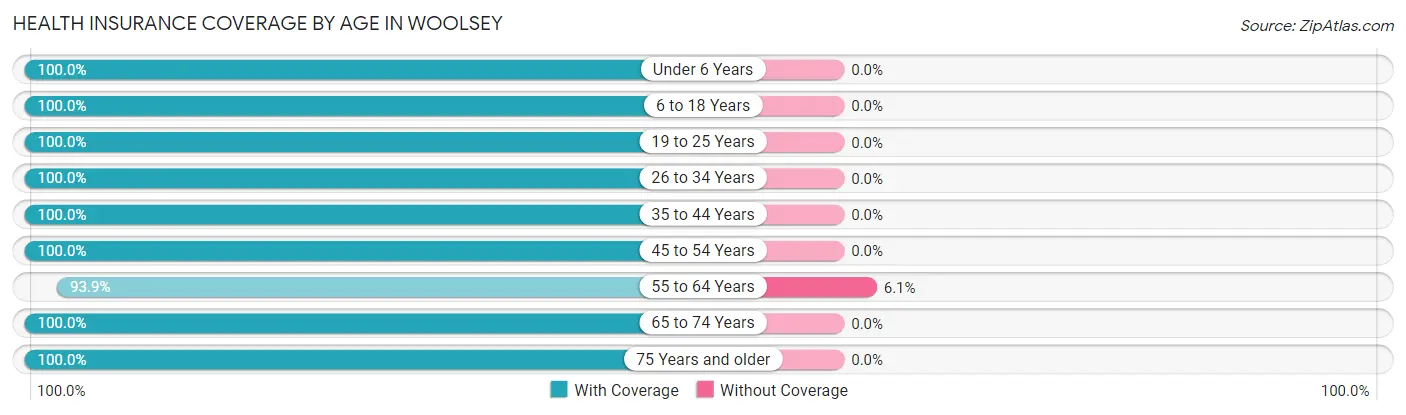
| Age Bracket | With Coverage | Without Coverage |
| Under 6 Years | 19 (100.0%) | 0 (0.0%) |
| 6 to 18 Years | 47 (100.0%) | 0 (0.0%) |
| 19 to 25 Years | 29 (100.0%) | 0 (0.0%) |
| 26 to 34 Years | 5 (100.0%) | 0 (0.0%) |
| 35 to 44 Years | 31 (100.0%) | 0 (0.0%) |
| 45 to 54 Years | 33 (100.0%) | 0 (0.0%) |
| 55 to 64 Years | 31 (93.9%) | 2 (6.1%) |
| 65 to 74 Years | 24 (100.0%) | 0 (0.0%) |
| 75 Years and older | 8 (100.0%) | 0 (0.0%) |
| Total | 227 (99.1%) | 2 (0.9%) |
Health Insurance Coverage by Citizenship Status in Woolsey
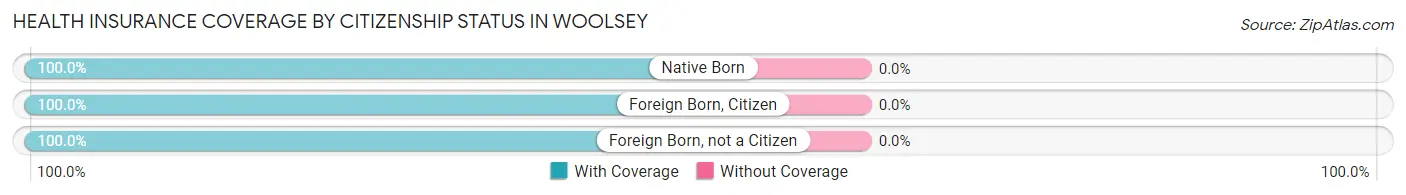
| Citizenship Status | With Coverage | Without Coverage |
| Native Born | 19 (100.0%) | 0 (0.0%) |
| Foreign Born, Citizen | 47 (100.0%) | 0 (0.0%) |
| Foreign Born, not a Citizen | 29 (100.0%) | 0 (0.0%) |
Health Insurance Coverage by Household Income in Woolsey
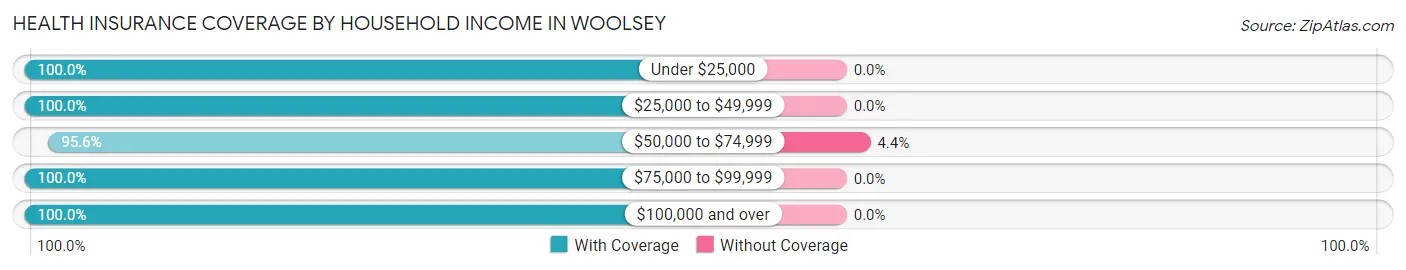
| Household Income | With Coverage | Without Coverage |
| Under $25,000 | 2 (100.0%) | 0 (0.0%) |
| $25,000 to $49,999 | 11 (100.0%) | 0 (0.0%) |
| $50,000 to $74,999 | 43 (95.6%) | 2 (4.4%) |
| $75,000 to $99,999 | 24 (100.0%) | 0 (0.0%) |
| $100,000 and over | 147 (100.0%) | 0 (0.0%) |
Public vs Private Health Insurance Coverage by Age in Woolsey
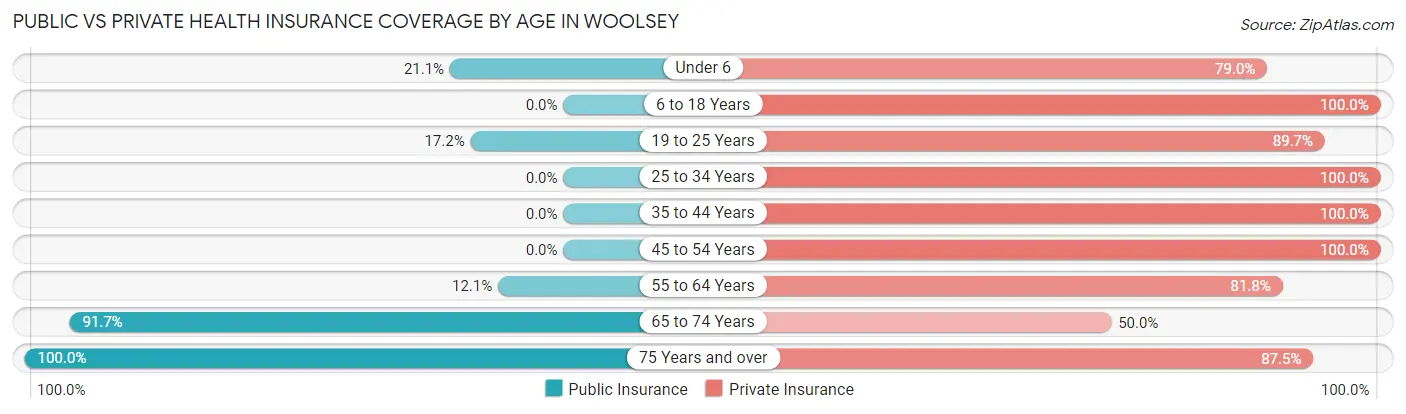
| Age Bracket | Public Insurance | Private Insurance |
| Under 6 | 4 (21.0%) | 15 (78.9%) |
| 6 to 18 Years | 0 (0.0%) | 47 (100.0%) |
| 19 to 25 Years | 5 (17.2%) | 26 (89.7%) |
| 25 to 34 Years | 0 (0.0%) | 5 (100.0%) |
| 35 to 44 Years | 0 (0.0%) | 31 (100.0%) |
| 45 to 54 Years | 0 (0.0%) | 33 (100.0%) |
| 55 to 64 Years | 4 (12.1%) | 27 (81.8%) |
| 65 to 74 Years | 22 (91.7%) | 12 (50.0%) |
| 75 Years and over | 8 (100.0%) | 7 (87.5%) |
| Total | 43 (18.8%) | 203 (88.6%) |
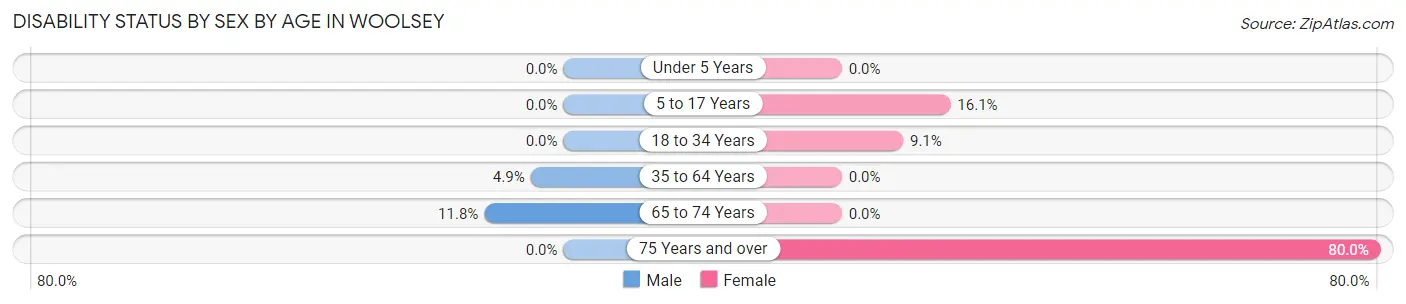
Disability Status by Sex by Age in Woolsey
| Age Bracket | Male | Female |
| Under 5 Years | 0 (0.0%) | 0 (0.0%) |
| 5 to 17 Years | 0 (0.0%) | 5 (16.1%) |
| 18 to 34 Years | 0 (0.0%) | 2 (9.1%) |
| 35 to 64 Years | 2 (4.9%) | 0 (0.0%) |
| 65 to 74 Years | 2 (11.8%) | 0 (0.0%) |
| 75 Years and over | 0 (0.0%) | 4 (80.0%) |
Disability Class by Sex by Age in Woolsey
Disability Class: Hearing Difficulty
| Age Bracket | Male | Female |
| Under 5 Years | 0 (0.0%) | 0 (0.0%) |
| 5 to 17 Years | 0 (0.0%) | 0 (0.0%) |
| 18 to 34 Years | 0 (0.0%) | 0 (0.0%) |
| 35 to 64 Years | 0 (0.0%) | 0 (0.0%) |
| 65 to 74 Years | 0 (0.0%) | 0 (0.0%) |
| 75 Years and over | 0 (0.0%) | 0 (0.0%) |
Disability Class: Vision Difficulty
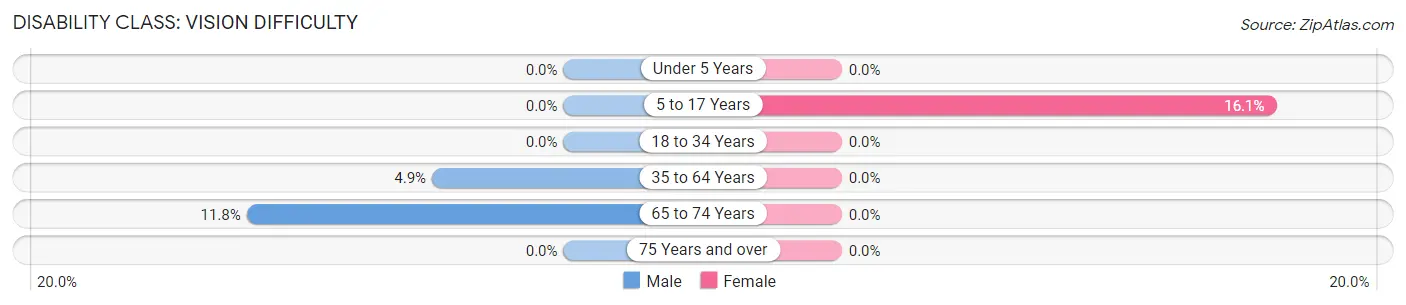
| Age Bracket | Male | Female |
| Under 5 Years | 0 (0.0%) | 0 (0.0%) |
| 5 to 17 Years | 0 (0.0%) | 5 (16.1%) |
| 18 to 34 Years | 0 (0.0%) | 0 (0.0%) |
| 35 to 64 Years | 2 (4.9%) | 0 (0.0%) |
| 65 to 74 Years | 2 (11.8%) | 0 (0.0%) |
| 75 Years and over | 0 (0.0%) | 0 (0.0%) |
Disability Class: Cognitive Difficulty
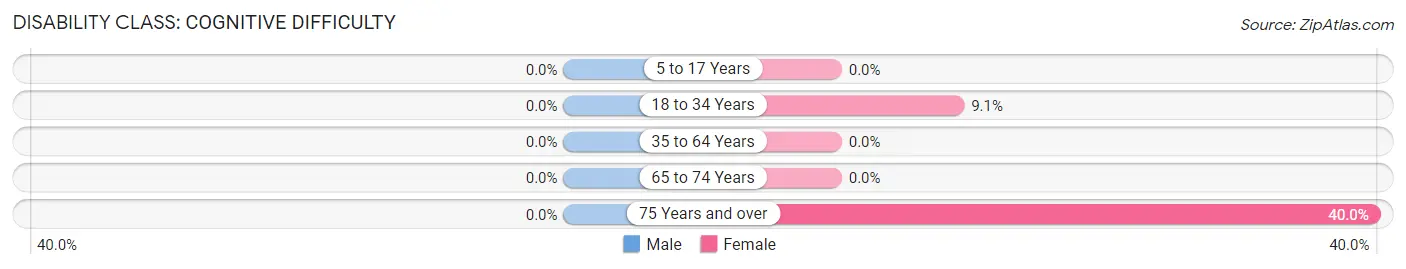
| Age Bracket | Male | Female |
| 5 to 17 Years | 0 (0.0%) | 0 (0.0%) |
| 18 to 34 Years | 0 (0.0%) | 2 (9.1%) |
| 35 to 64 Years | 0 (0.0%) | 0 (0.0%) |
| 65 to 74 Years | 0 (0.0%) | 0 (0.0%) |
| 75 Years and over | 0 (0.0%) | 2 (40.0%) |
Disability Class: Ambulatory Difficulty
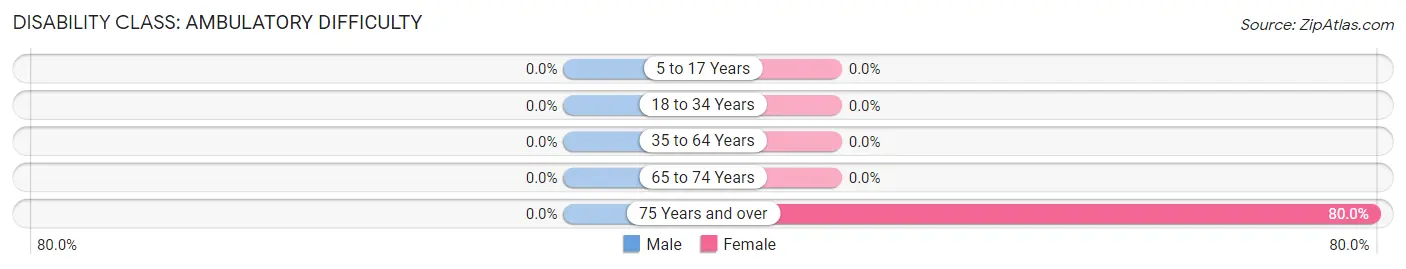
| Age Bracket | Male | Female |
| 5 to 17 Years | 0 (0.0%) | 0 (0.0%) |
| 18 to 34 Years | 0 (0.0%) | 0 (0.0%) |
| 35 to 64 Years | 0 (0.0%) | 0 (0.0%) |
| 65 to 74 Years | 0 (0.0%) | 0 (0.0%) |
| 75 Years and over | 0 (0.0%) | 4 (80.0%) |
Disability Class: Self-Care Difficulty
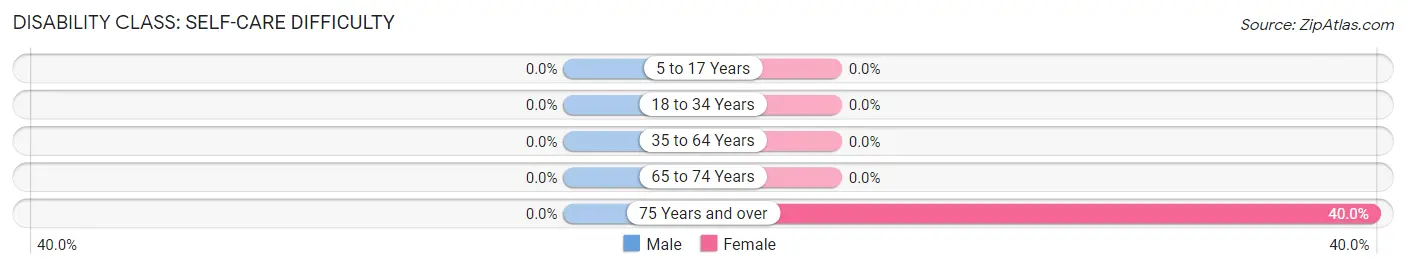
| Age Bracket | Male | Female |
| 5 to 17 Years | 0 (0.0%) | 0 (0.0%) |
| 18 to 34 Years | 0 (0.0%) | 0 (0.0%) |
| 35 to 64 Years | 0 (0.0%) | 0 (0.0%) |
| 65 to 74 Years | 0 (0.0%) | 0 (0.0%) |
| 75 Years and over | 0 (0.0%) | 2 (40.0%) |
Technology Access in Woolsey
Computing Device Access in Woolsey
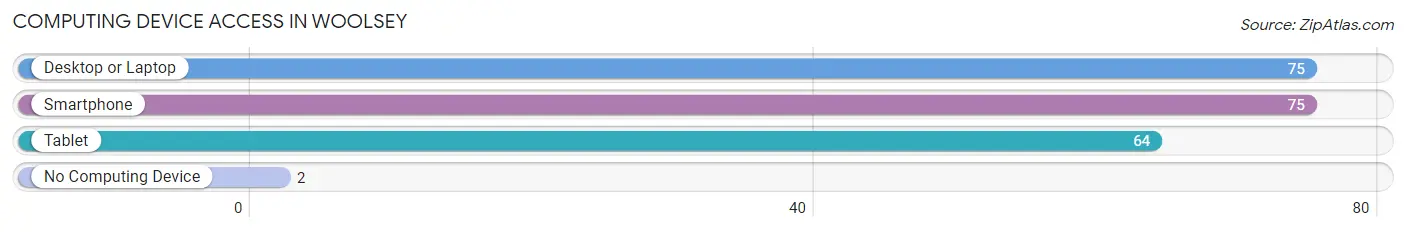
| Device Type | # Households | % Households |
| Desktop or Laptop | 75 | 97.4% |
| Smartphone | 75 | 97.4% |
| Tablet | 64 | 83.1% |
| No Computing Device | 2 | 2.6% |
| Total | 77 | 100.0% |
Internet Access in Woolsey
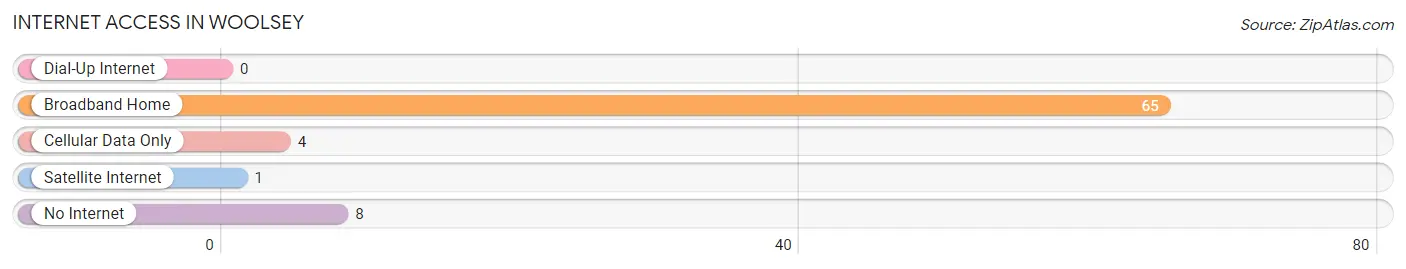
| Internet Type | # Households | % Households |
| Dial-Up Internet | 0 | 0.0% |
| Broadband Home | 65 | 84.4% |
| Cellular Data Only | 4 | 5.2% |
| Satellite Internet | 1 | 1.3% |
| No Internet | 8 | 10.4% |
| Total | 77 | 100.0% |
Woolsey Summary
Woolsey is a small town located in Fayette County, Georgia, United States. It is situated about 25 miles south of Atlanta and is part of the Atlanta metropolitan area. The population of Woolsey was 1,845 at the 2010 census.
History
Woolsey was founded in 1871 by the Reverend William Woolsey, a Methodist minister. He named the town after himself and it was incorporated in 1872. The town was originally a farming community, but it soon developed into a small industrial center. The town was home to several cotton mills, a grist mill, and a sawmill.
In the early 1900s, Woolsey was a popular tourist destination. It was known for its mineral springs, which were believed to have healing properties. The town also had a number of hotels and resorts, as well as a racetrack.
In the 1950s, Woolsey began to decline as the cotton mills closed and the tourist industry moved elsewhere. The town was hit hard by the Great Recession of 2008 and many of its businesses closed.
Geography
Woolsey is located in Fayette County, Georgia, at 33.5°N 84.3°W. It is situated about 25 miles south of Atlanta and is part of the Atlanta metropolitan area. The town is located in the Piedmont region of Georgia and is surrounded by rolling hills and forests.
The town is bisected by the Chattahoochee River, which forms the border between Fayette and Coweta counties. The town is also located near the Fayette-Coweta County line.
Economy
Woolsey’s economy is largely based on agriculture and manufacturing. The town is home to several small businesses, including a feed store, a hardware store, and a lumber yard.
The town is also home to several industrial parks, which are home to a variety of businesses, including a plastics manufacturer, a printing company, and a food processing plant.
Demographics
As of the 2010 census, the population of Woolsey was 1,845. The racial makeup of the town was 79.3% White, 15.2% African American, 0.7% Native American, 0.5% Asian, 0.1% Pacific Islander, and 4.2% from other races. Hispanic or Latino of any race were 3.2% of the population.
The median income for a household in Woolsey was $41,250, and the median income for a family was $50,000. The per capita income for the town was $20,845. About 11.2% of families and 14.2% of the population were below the poverty line, including 18.2% of those under age 18 and 8.3% of those age 65 or over.
Conclusion
Woolsey is a small town located in Fayette County, Georgia, United States. It is situated about 25 miles south of Atlanta and is part of the Atlanta metropolitan area. The town was founded in 1871 and was originally a farming community. It later developed into a small industrial center and was a popular tourist destination in the early 1900s. The town has since declined, but it is still home to several small businesses and industrial parks. The population of Woolsey was 1,845 at the 2010 census. The town’s economy is largely based on agriculture and manufacturing, and the median income for a household in Woolsey was $41,250.
Common Questions
What is Per Capita Income in Woolsey?
Per Capita income in Woolsey is $55,241.
What is the Median Family Income in Woolsey?
Median Family Income in Woolsey is $112,500.
What is the Median Household income in Woolsey?
Median Household Income in Woolsey is $105,625.
What is Income or Wage Gap in Woolsey?
Income or Wage Gap in Woolsey is 76.2%.
Women in Woolsey earn 23.8 cents for every dollar earned by a man.
What is Inequality or Gini Index in Woolsey?
Inequality or Gini Index in Woolsey is 0.47.
What is the Total Population of Woolsey?
Total Population of Woolsey is 231.
What is the Total Male Population of Woolsey?
Total Male Population of Woolsey is 102.
What is the Total Female Population of Woolsey?
Total Female Population of Woolsey is 129.
What is the Ratio of Males per 100 Females in Woolsey?
There are 79.07 Males per 100 Females in Woolsey.
What is the Ratio of Females per 100 Males in Woolsey?
There are 126.47 Females per 100 Males in Woolsey.
What is the Median Population Age in Woolsey?
Median Population Age in Woolsey is 36.6 Years.
What is the Average Family Size in Woolsey
Average Family Size in Woolsey is 3.2 People.
What is the Average Household Size in Woolsey
Average Household Size in Woolsey is 3.0 People.
How Large is the Labor Force in Woolsey?
There are 103 People in the Labor Forcein in Woolsey.
What is the Percentage of People in the Labor Force in Woolsey?
61.3% of People are in the Labor Force in Woolsey.
What is the Unemployment Rate in Woolsey?
Unemployment Rate in Woolsey is 2.0%.