Zip Codes with the Highest Percentage of Population Employed in Legal Services & Support in Snellville, GA
RELATED REPORTS & OPTIONS
Legal Services & Support
Snellville
Compare Zip Codes
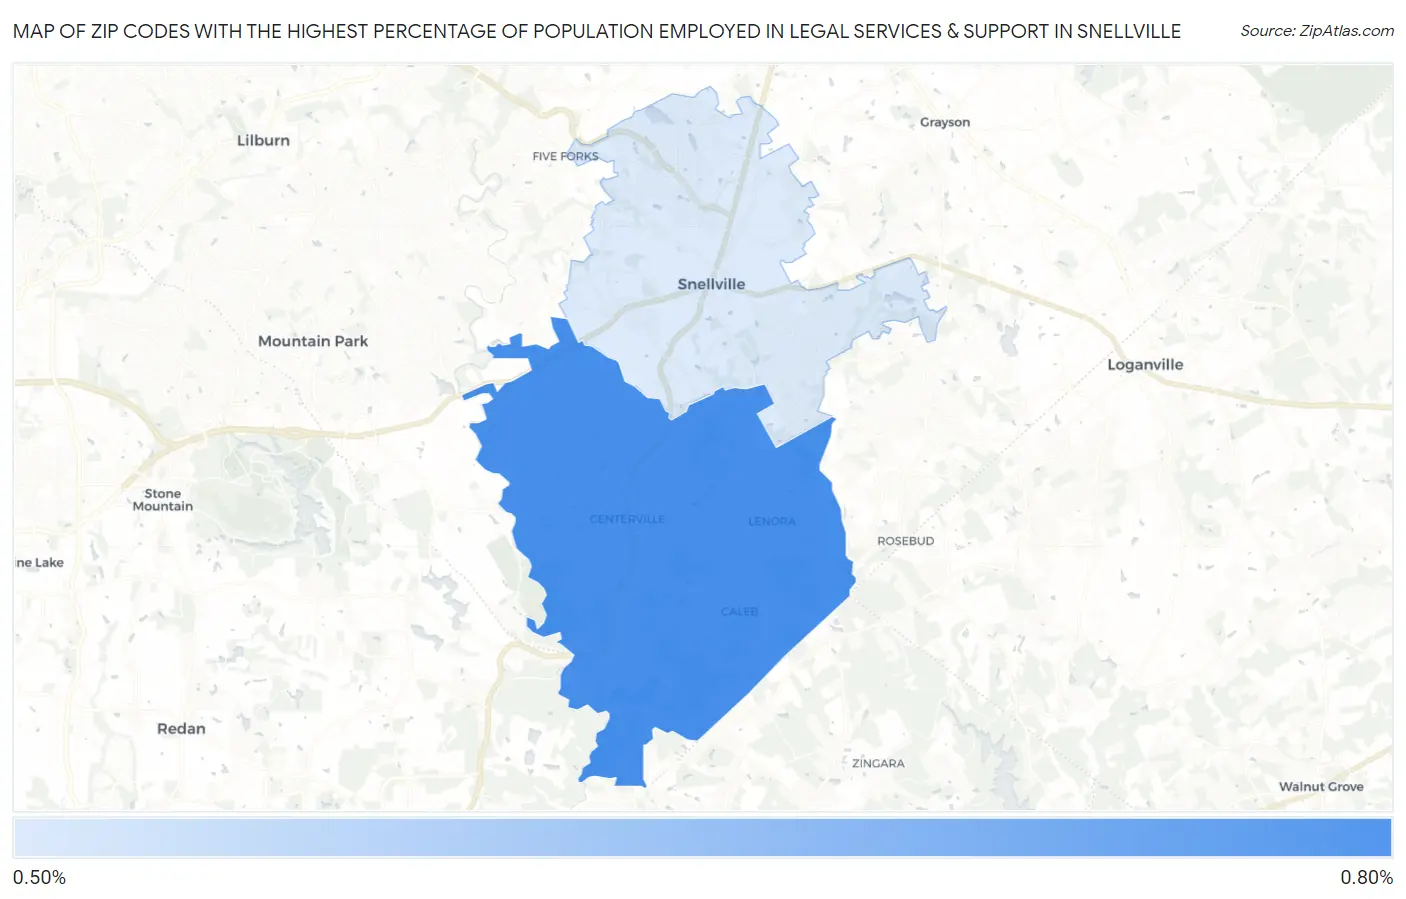
Map of Zip Codes with the Highest Percentage of Population Employed in Legal Services & Support in Snellville
0.55%
0.65%
Zip Codes with the Highest Percentage of Population Employed in Legal Services & Support in Snellville, GA
| Zip Code | % Employed | vs State | vs National | |
| 1. | 30039 | 0.65% | 1.1%(-0.453)#263 | 1.2%(-0.533)#10,935 |
| 2. | 30078 | 0.55% | 1.1%(-0.551)#299 | 1.2%(-0.631)#12,026 |
1
Common Questions
What are the Top Zip Codes with the Highest Percentage of Population Employed in Legal Services & Support in Snellville, GA?
Top Zip Codes with the Highest Percentage of Population Employed in Legal Services & Support in Snellville, GA are:
What zip code has the Highest Percentage of Population Employed in Legal Services & Support in Snellville, GA?
30039 has the Highest Percentage of Population Employed in Legal Services & Support in Snellville, GA with 0.65%.
What is the Percentage of Population Employed in Legal Services & Support in Snellville, GA?
Percentage of Population Employed in Legal Services & Support in Snellville is 0.72%.
What is the Percentage of Population Employed in Legal Services & Support in Georgia?
Percentage of Population Employed in Legal Services & Support in Georgia is 1.1%.
What is the Percentage of Population Employed in Legal Services & Support in the United States?
Percentage of Population Employed in Legal Services & Support in the United States is 1.2%.