Brookhaven, GA Map & Demographics
Brookhaven Map
Brookhaven Overview
$74,964
PER CAPITA INCOME
$188,477
AVG FAMILY INCOME
$114,570
AVG HOUSEHOLD INCOME
19.5%
WAGE / INCOME GAP [ % ]
80.5¢/ $1
WAGE / INCOME GAP [ $ ]
0.49
INEQUALITY / GINI INDEX
56,848
TOTAL POPULATION
27,208
MALE POPULATION
29,640
FEMALE POPULATION
91.79
MALES / 100 FEMALES
108.94
FEMALES / 100 MALES
34.6
MEDIAN AGE
3.2
AVG FAMILY SIZE
2.3
AVG HOUSEHOLD SIZE
34,876
LABOR FORCE [ PEOPLE ]
77.4%
PERCENT IN LABOR FORCE
3.0%
UNEMPLOYMENT RATE
Income in Brookhaven
Income Overview in Brookhaven
Per Capita Income in Brookhaven is $74,964, while median incomes of families and households are $188,477 and $114,570 respectively.
| Characteristic | Number | Measure |
| Per Capita Income | 56,848 | $74,964 |
| Median Family Income | 12,147 | $188,477 |
| Mean Family Income | 12,147 | $232,302 |
| Median Household Income | 24,369 | $114,570 |
| Mean Household Income | 24,369 | $171,389 |
| Income Deficit | 12,147 | $0 |
| Wage / Income Gap (%) | 56,848 | 19.46% |
| Wage / Income Gap ($) | 56,848 | 80.54¢ per $1 |
| Gini / Inequality Index | 56,848 | 0.49 |
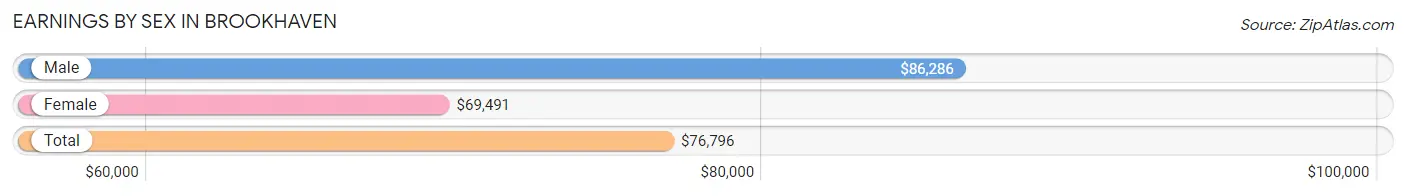
Earnings by Sex in Brookhaven
Average Earnings in Brookhaven are $76,796, $86,286 for men and $69,491 for women, a difference of 19.5%.
| Sex | Number | Average Earnings |
| Male | 18,274 (51.1%) | $86,286 |
| Female | 17,451 (48.8%) | $69,491 |
| Total | 35,725 (100.0%) | $76,796 |
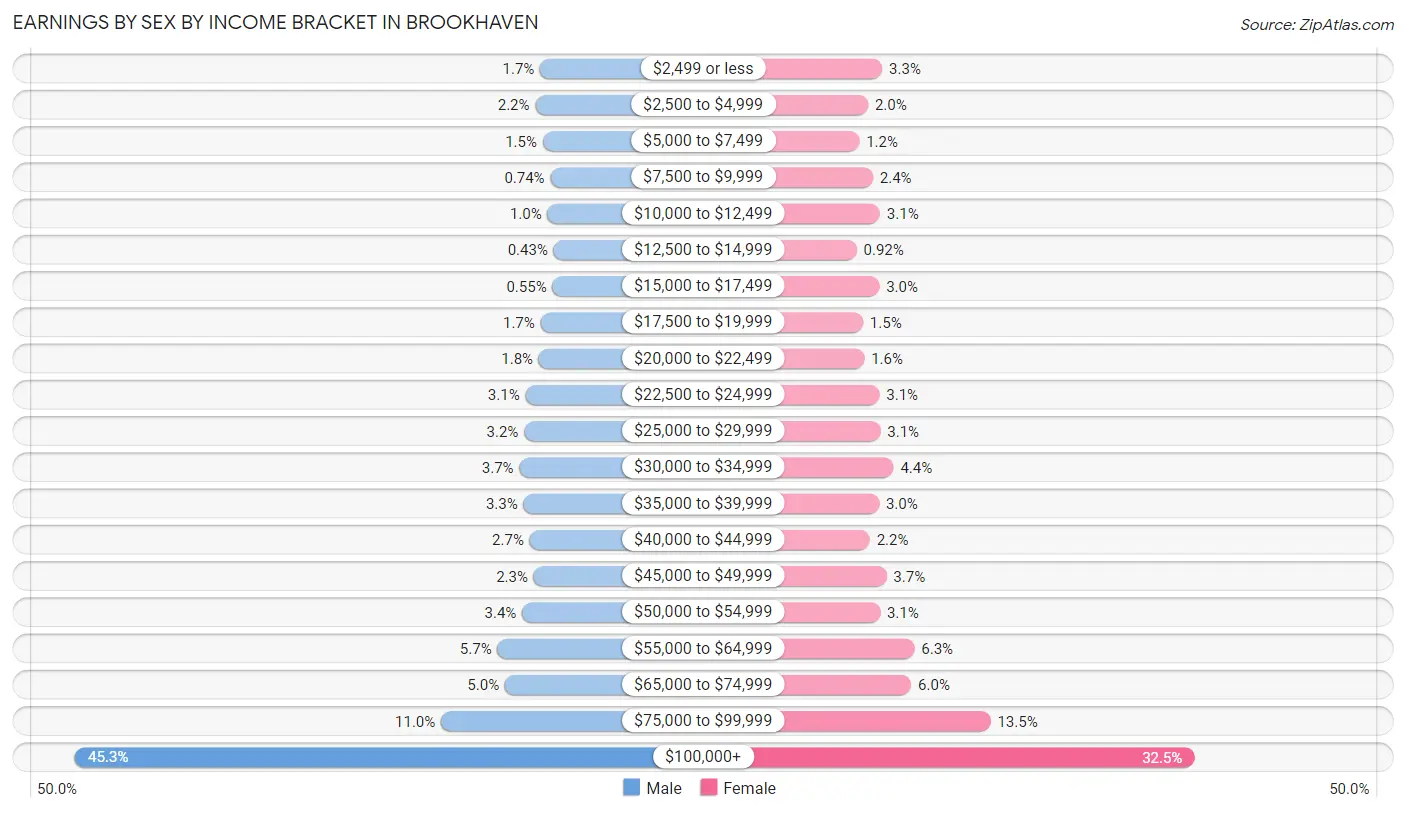
Earnings by Sex by Income Bracket in Brookhaven
The most common earnings brackets in Brookhaven are $100,000+ for men (8,272 | 45.3%) and $100,000+ for women (5,678 | 32.5%).
| Income | Male | Female |
| $2,499 or less | 311 (1.7%) | 578 (3.3%) |
| $2,500 to $4,999 | 392 (2.1%) | 346 (2.0%) |
| $5,000 to $7,499 | 267 (1.5%) | 202 (1.2%) |
| $7,500 to $9,999 | 135 (0.7%) | 426 (2.4%) |
| $10,000 to $12,499 | 184 (1.0%) | 541 (3.1%) |
| $12,500 to $14,999 | 78 (0.4%) | 161 (0.9%) |
| $15,000 to $17,499 | 100 (0.5%) | 531 (3.0%) |
| $17,500 to $19,999 | 303 (1.7%) | 264 (1.5%) |
| $20,000 to $22,499 | 332 (1.8%) | 284 (1.6%) |
| $22,500 to $24,999 | 562 (3.1%) | 533 (3.0%) |
| $25,000 to $29,999 | 585 (3.2%) | 548 (3.1%) |
| $30,000 to $34,999 | 667 (3.6%) | 763 (4.4%) |
| $35,000 to $39,999 | 595 (3.3%) | 525 (3.0%) |
| $40,000 to $44,999 | 490 (2.7%) | 375 (2.1%) |
| $45,000 to $49,999 | 420 (2.3%) | 647 (3.7%) |
| $50,000 to $54,999 | 620 (3.4%) | 542 (3.1%) |
| $55,000 to $64,999 | 1,042 (5.7%) | 1,105 (6.3%) |
| $65,000 to $74,999 | 913 (5.0%) | 1,053 (6.0%) |
| $75,000 to $99,999 | 2,006 (11.0%) | 2,349 (13.5%) |
| $100,000+ | 8,272 (45.3%) | 5,678 (32.5%) |
| Total | 18,274 (100.0%) | 17,451 (100.0%) |
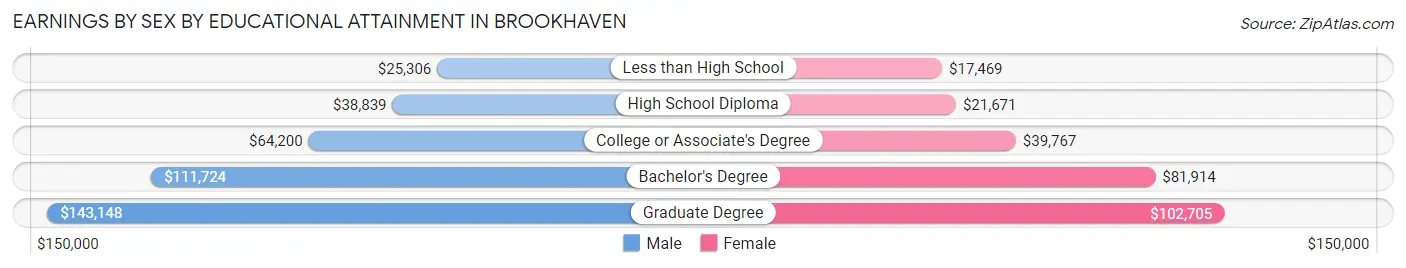
Earnings by Sex by Educational Attainment in Brookhaven
Average earnings in Brookhaven are $98,542 for men and $78,750 for women, a difference of 20.1%. Men with an educational attainment of graduate degree enjoy the highest average annual earnings of $143,148, while those with less than high school education earn the least with $25,306. Women with an educational attainment of graduate degree earn the most with the average annual earnings of $102,705, while those with less than high school education have the smallest earnings of $17,469.
| Educational Attainment | Male Income | Female Income |
| Less than High School | $25,306 | $17,469 |
| High School Diploma | $38,839 | $21,671 |
| College or Associate's Degree | $64,200 | $39,767 |
| Bachelor's Degree | $111,724 | $81,914 |
| Graduate Degree | $143,148 | $102,705 |
| Total | $98,542 | $78,750 |
Family Income in Brookhaven
Family Income Brackets in Brookhaven
According to the Brookhaven family income data, there are 5,818 families falling into the $200,000+ income range, which is the most common income bracket and makes up 47.9% of all families. Conversely, the less than $10,000 income bracket is the least frequent group with only 279 families (2.3%) belonging to this category.
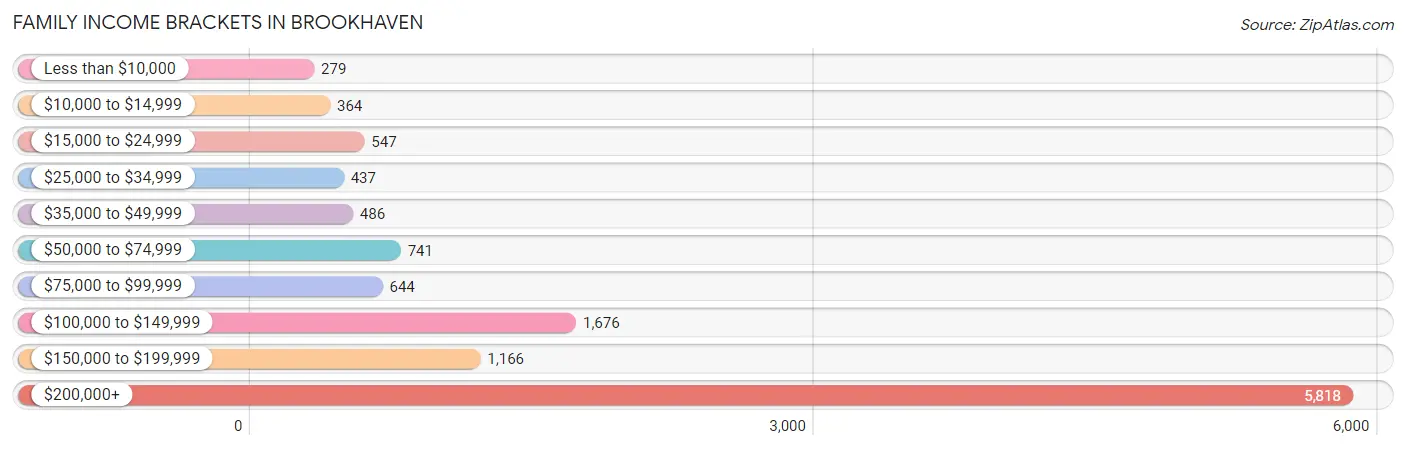
| Income Bracket | # Families | % Families |
| Less than $10,000 | 279 | 2.3% |
| $10,000 to $14,999 | 364 | 3.0% |
| $15,000 to $24,999 | 547 | 4.5% |
| $25,000 to $34,999 | 437 | 3.6% |
| $35,000 to $49,999 | 486 | 4.0% |
| $50,000 to $74,999 | 741 | 6.1% |
| $75,000 to $99,999 | 644 | 5.3% |
| $100,000 to $149,999 | 1,676 | 13.8% |
| $150,000 to $199,999 | 1,166 | 9.6% |
| $200,000+ | 5,818 | 47.9% |
Family Income by Famaliy Size in Brookhaven
4-person families (2,662 | 21.9%) account for the highest median family income in Brookhaven with $250,001 per family, while 3-person families (2,778 | 22.9%) have the highest median income of $73,980 per family member.
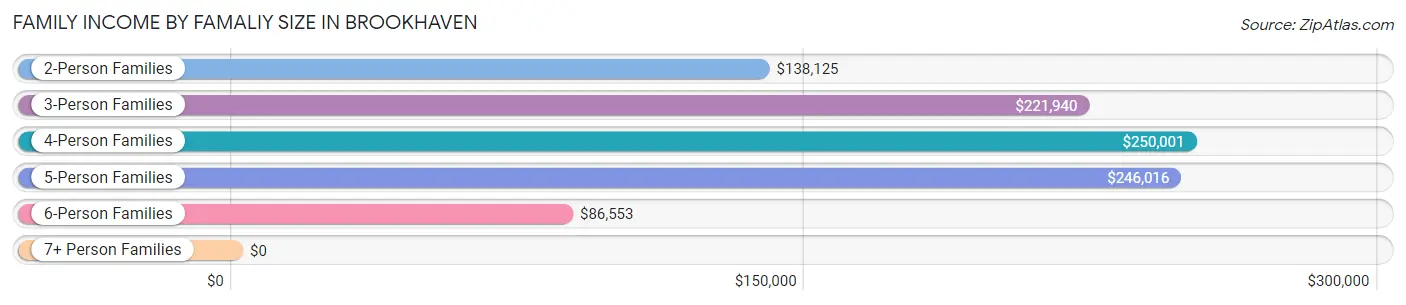
| Income Bracket | # Families | Median Income |
| 2-Person Families | 5,862 (48.3%) | $138,125 |
| 3-Person Families | 2,778 (22.9%) | $221,940 |
| 4-Person Families | 2,662 (21.9%) | $250,001 |
| 5-Person Families | 511 (4.2%) | $246,016 |
| 6-Person Families | 229 (1.9%) | $86,553 |
| 7+ Person Families | 105 (0.9%) | $0 |
| Total | 12,147 (100.0%) | $188,477 |
Family Income by Number of Earners in Brookhaven
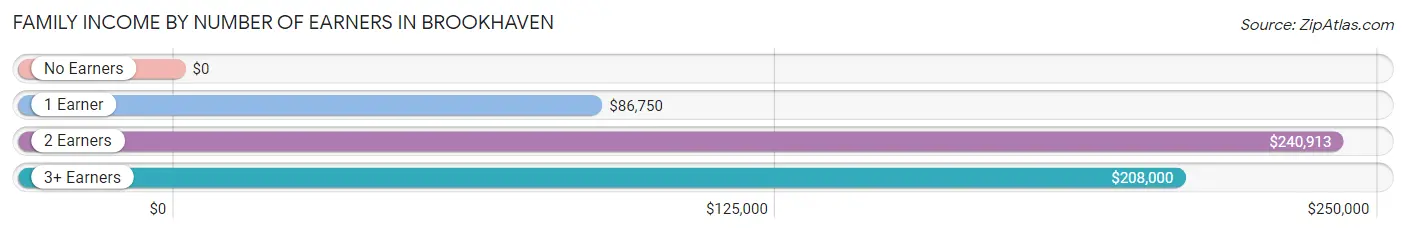
| Number of Earners | # Families | Median Income |
| No Earners | 1,043 (8.6%) | $0 |
| 1 Earner | 2,854 (23.5%) | $86,750 |
| 2 Earners | 7,466 (61.5%) | $240,913 |
| 3+ Earners | 784 (6.5%) | $208,000 |
| Total | 12,147 (100.0%) | $188,477 |
Household Income in Brookhaven
Household Income Brackets in Brookhaven
With 7,213 households falling in the category, the $200,000+ income range is the most frequent in Brookhaven, accounting for 29.6% of all households. In contrast, only 536 households (2.2%) fall into the $10,000 to $14,999 income bracket, making it the least populous group.
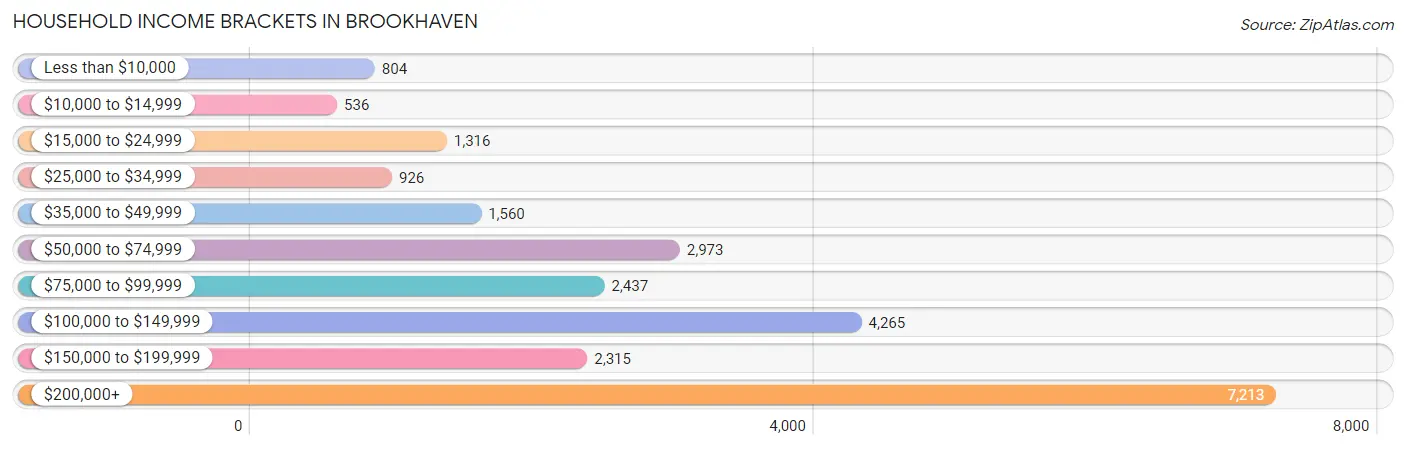
| Income Bracket | # Households | % Households |
| Less than $10,000 | 804 | 3.3% |
| $10,000 to $14,999 | 536 | 2.2% |
| $15,000 to $24,999 | 1,316 | 5.4% |
| $25,000 to $34,999 | 926 | 3.8% |
| $35,000 to $49,999 | 1,560 | 6.4% |
| $50,000 to $74,999 | 2,973 | 12.2% |
| $75,000 to $99,999 | 2,437 | 10.0% |
| $100,000 to $149,999 | 4,265 | 17.5% |
| $150,000 to $199,999 | 2,315 | 9.5% |
| $200,000+ | 7,213 | 29.6% |
Household Income by Householder Age in Brookhaven
The median household income in Brookhaven is $114,570, with the highest median household income of $152,159 found in the 45 to 64 years age bracket for the primary householder. A total of 7,565 households (31.0%) fall into this category. Meanwhile, the 15 to 24 years age bracket for the primary householder has the lowest median household income of $40,872, with 1,418 households (5.8%) in this group.
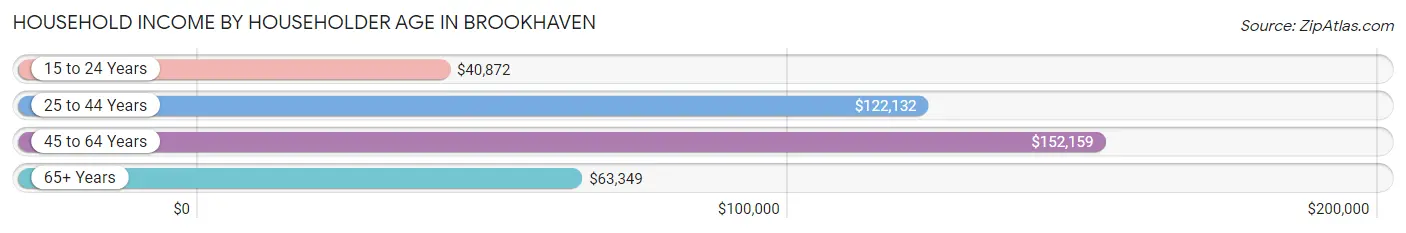
| Income Bracket | # Households | Median Income |
| 15 to 24 Years | 1,418 (5.8%) | $40,872 |
| 25 to 44 Years | 11,886 (48.8%) | $122,132 |
| 45 to 64 Years | 7,565 (31.0%) | $152,159 |
| 65+ Years | 3,500 (14.4%) | $63,349 |
| Total | 24,369 (100.0%) | $114,570 |
Poverty in Brookhaven
Income Below Poverty by Sex and Age in Brookhaven
With 8.1% poverty level for males and 13.0% for females among the residents of Brookhaven, 5 year old males and 5 year old females are the most vulnerable to poverty, with 181 males (31.5%) and 131 females (34.3%) in their respective age groups living below the poverty level.
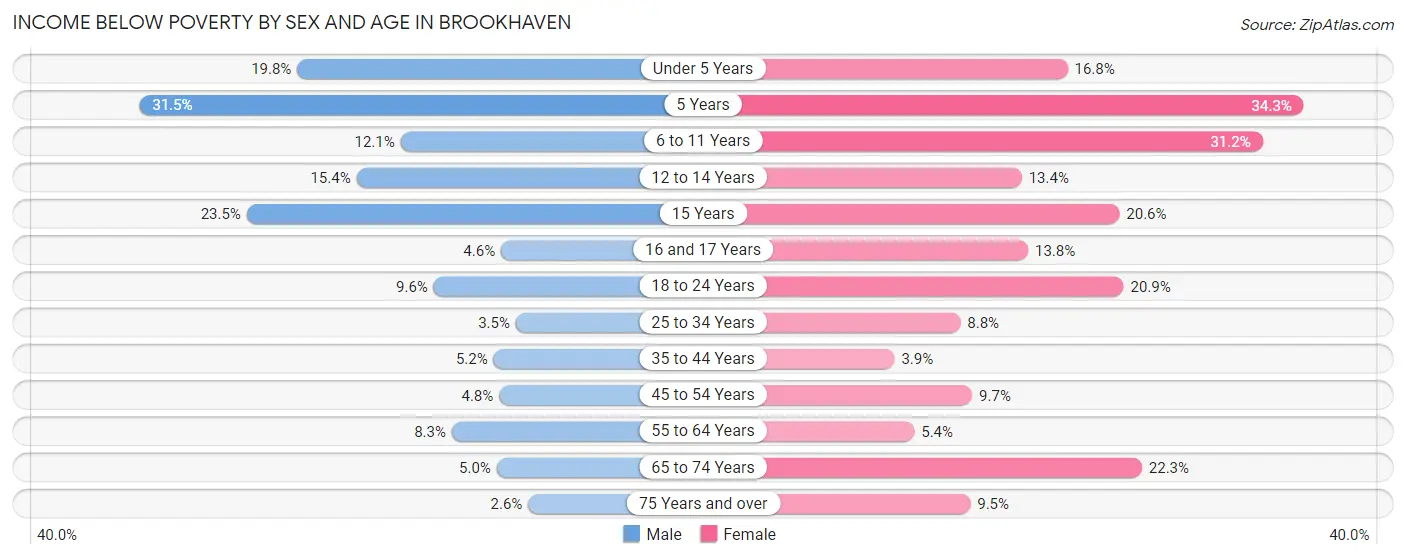
| Age Bracket | Male | Female |
| Under 5 Years | 491 (19.8%) | 392 (16.8%) |
| 5 Years | 181 (31.5%) | 131 (34.3%) |
| 6 to 11 Years | 175 (12.1%) | 787 (31.2%) |
| 12 to 14 Years | 98 (15.4%) | 97 (13.4%) |
| 15 Years | 87 (23.5%) | 27 (20.6%) |
| 16 and 17 Years | 21 (4.6%) | 48 (13.8%) |
| 18 to 24 Years | 150 (9.6%) | 531 (20.9%) |
| 25 to 34 Years | 186 (3.5%) | 568 (8.8%) |
| 35 to 44 Years | 253 (5.2%) | 172 (3.9%) |
| 45 to 54 Years | 165 (4.8%) | 270 (9.7%) |
| 55 to 64 Years | 278 (8.3%) | 172 (5.4%) |
| 65 to 74 Years | 69 (5.0%) | 474 (22.3%) |
| 75 Years and over | 26 (2.6%) | 109 (9.5%) |
| Total | 2,180 (8.1%) | 3,778 (13.0%) |
Income Above Poverty by Sex and Age in Brookhaven
According to the poverty statistics in Brookhaven, males aged 75 years and over and females aged 35 to 44 years are the age groups that are most secure financially, with 97.4% of males and 96.1% of females in these age groups living above the poverty line.
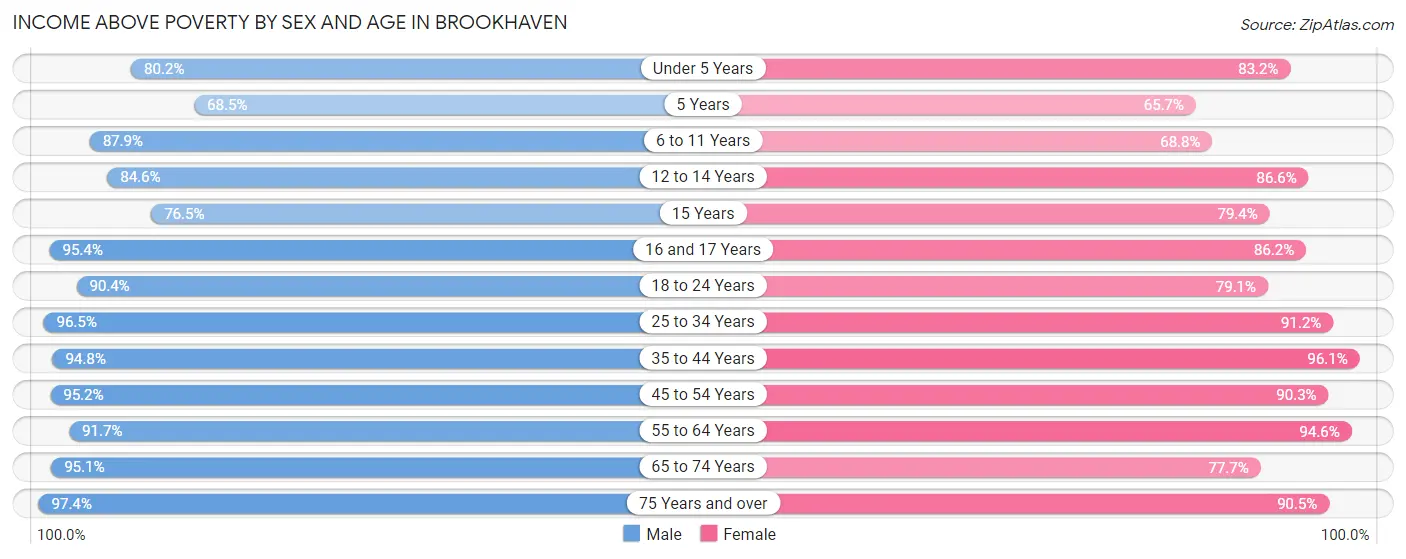
| Age Bracket | Male | Female |
| Under 5 Years | 1,994 (80.2%) | 1,947 (83.2%) |
| 5 Years | 394 (68.5%) | 251 (65.7%) |
| 6 to 11 Years | 1,272 (87.9%) | 1,733 (68.8%) |
| 12 to 14 Years | 540 (84.6%) | 629 (86.6%) |
| 15 Years | 283 (76.5%) | 104 (79.4%) |
| 16 and 17 Years | 433 (95.4%) | 299 (86.2%) |
| 18 to 24 Years | 1,408 (90.4%) | 2,007 (79.1%) |
| 25 to 34 Years | 5,088 (96.5%) | 5,888 (91.2%) |
| 35 to 44 Years | 4,627 (94.8%) | 4,226 (96.1%) |
| 45 to 54 Years | 3,295 (95.2%) | 2,520 (90.3%) |
| 55 to 64 Years | 3,079 (91.7%) | 3,026 (94.6%) |
| 65 to 74 Years | 1,324 (95.1%) | 1,653 (77.7%) |
| 75 Years and over | 969 (97.4%) | 1,034 (90.5%) |
| Total | 24,706 (91.9%) | 25,317 (87.0%) |
Income Below Poverty Among Married-Couple Families in Brookhaven
The poverty statistics for married-couple families in Brookhaven show that 3.0% or 292 of the total 9,634 families live below the poverty line. Families with 3 or 4 children have the highest poverty rate of 7.5%, comprising of 29 families. On the other hand, families with 5 or more children have the lowest poverty rate of 0.0%, which includes 0 families.
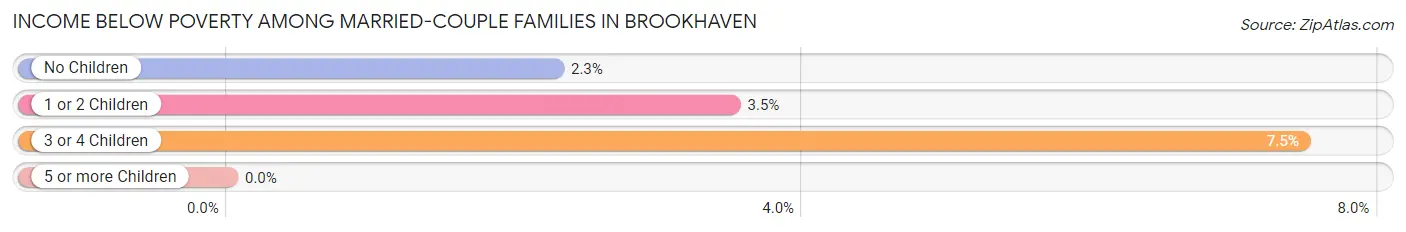
| Children | Above Poverty | Below Poverty |
| No Children | 4,726 (97.7%) | 110 (2.3%) |
| 1 or 2 Children | 4,214 (96.5%) | 153 (3.5%) |
| 3 or 4 Children | 359 (92.5%) | 29 (7.5%) |
| 5 or more Children | 43 (100.0%) | 0 (0.0%) |
| Total | 9,342 (97.0%) | 292 (3.0%) |
Income Below Poverty Among Single-Parent Households in Brookhaven
According to the poverty data in Brookhaven, 1.9% or 14 single-father households and 41.6% or 741 single-mother households are living below the poverty line. Among single-father households, those with 1 or 2 children have the highest poverty rate, with 14 households (4.7%) experiencing poverty. Likewise, among single-mother households, those with 5 or more children have the highest poverty rate, with 98 households (100.0%) falling below the poverty line.
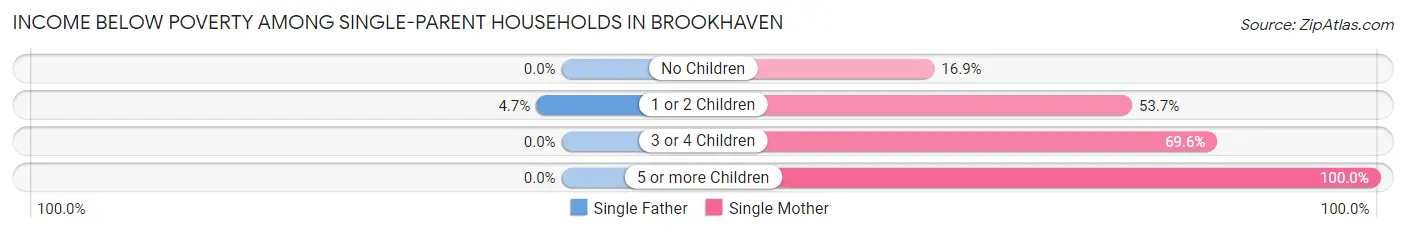
| Children | Single Father | Single Mother |
| No Children | 0 (0.0%) | 122 (16.9%) |
| 1 or 2 Children | 14 (4.7%) | 505 (53.7%) |
| 3 or 4 Children | 0 (0.0%) | 16 (69.6%) |
| 5 or more Children | 0 (0.0%) | 98 (100.0%) |
| Total | 14 (1.9%) | 741 (41.6%) |
Income Below Poverty Among Married-Couple vs Single-Parent Households in Brookhaven
The poverty data for Brookhaven shows that 292 of the married-couple family households (3.0%) and 755 of the single-parent households (30.0%) are living below the poverty level. Within the married-couple family households, those with 3 or 4 children have the highest poverty rate, with 29 households (7.5%) falling below the poverty line. Among the single-parent households, those with 5 or more children have the highest poverty rate, with 98 household (100.0%) living below poverty.
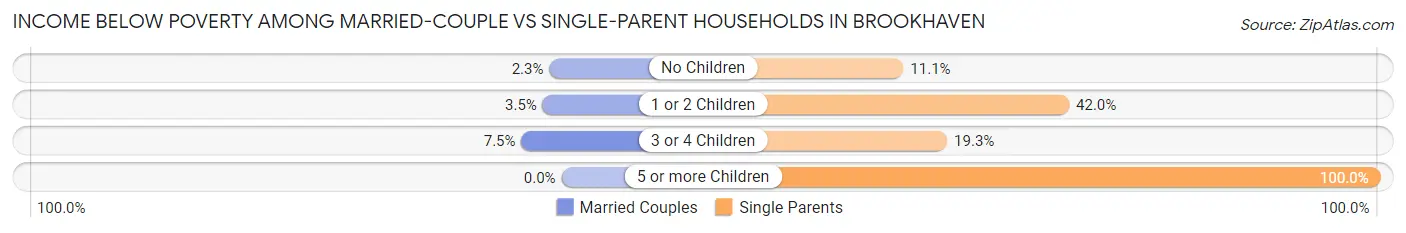
| Children | Married-Couple Families | Single-Parent Households |
| No Children | 110 (2.3%) | 122 (11.1%) |
| 1 or 2 Children | 153 (3.5%) | 519 (42.0%) |
| 3 or 4 Children | 29 (7.5%) | 16 (19.3%) |
| 5 or more Children | 0 (0.0%) | 98 (100.0%) |
| Total | 292 (3.0%) | 755 (30.0%) |
Race in Brookhaven
The most populous races in Brookhaven are White / Caucasian (37,096 | 65.2%), Hispanic or Latino (10,014 | 17.6%), and Black / African American (6,923 | 12.2%).
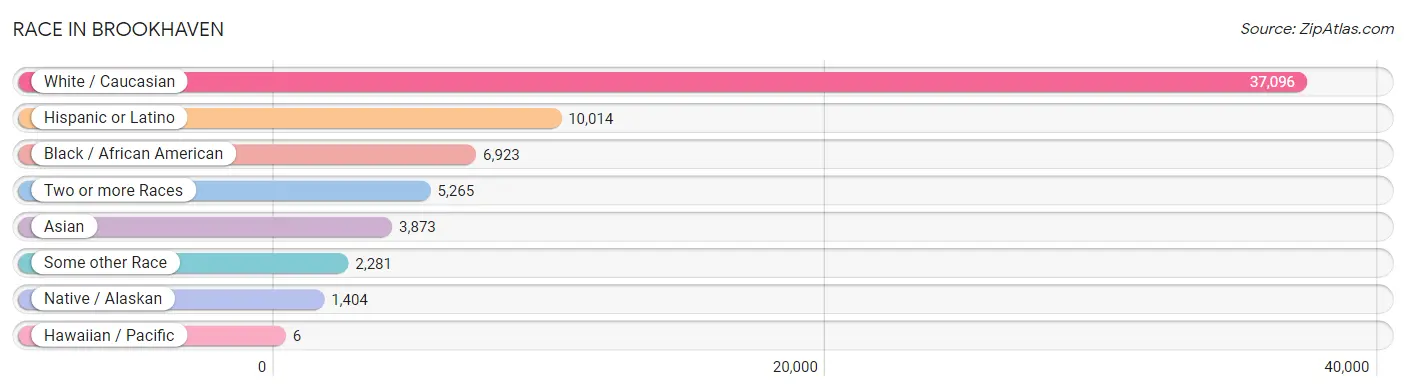
| Race | # Population | % Population |
| Asian | 3,873 | 6.8% |
| Black / African American | 6,923 | 12.2% |
| Hawaiian / Pacific | 6 | 0.0% |
| Hispanic or Latino | 10,014 | 17.6% |
| Native / Alaskan | 1,404 | 2.5% |
| White / Caucasian | 37,096 | 65.2% |
| Two or more Races | 5,265 | 9.3% |
| Some other Race | 2,281 | 4.0% |
| Total | 56,848 | 100.0% |
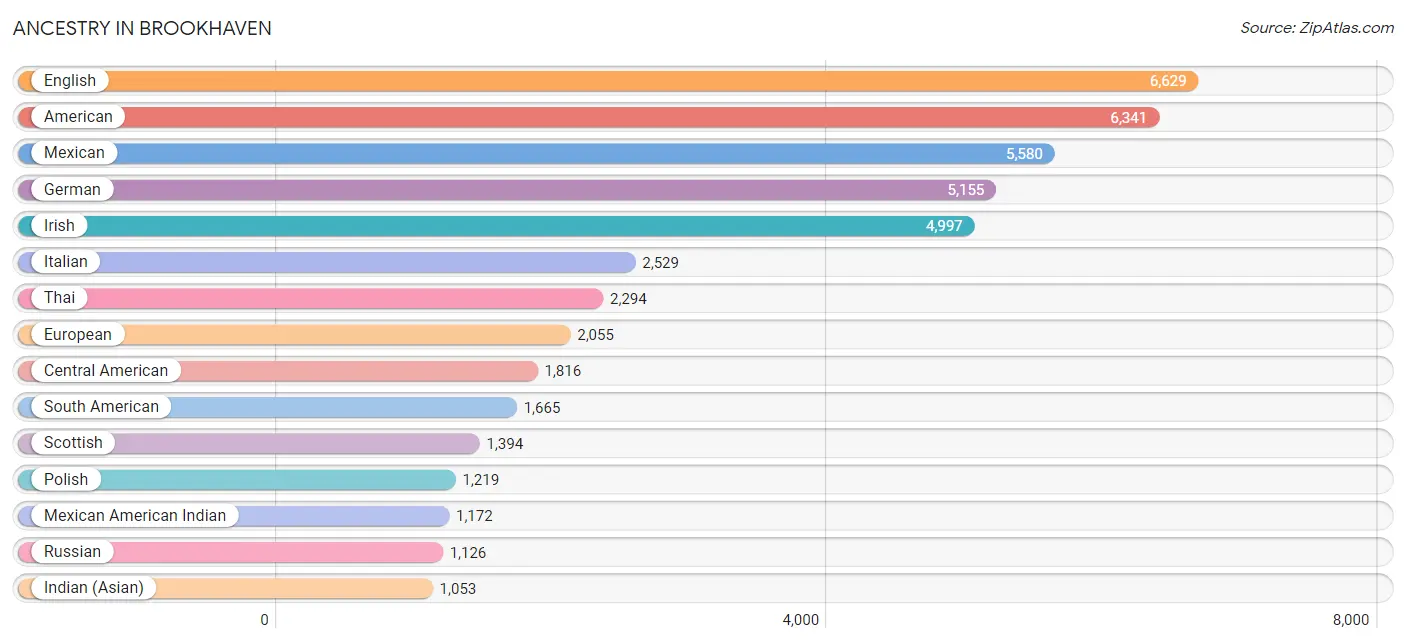
Ancestry in Brookhaven
The most populous ancestries reported in Brookhaven are English (6,629 | 11.7%), American (6,341 | 11.2%), Mexican (5,580 | 9.8%), German (5,155 | 9.1%), and Irish (4,997 | 8.8%), together accounting for 50.5% of all Brookhaven residents.
| Ancestry | # Population | % Population |
| African | 137 | 0.2% |
| Albanian | 39 | 0.1% |
| American | 6,341 | 11.2% |
| Apache | 51 | 0.1% |
| Arab | 537 | 0.9% |
| Argentinean | 188 | 0.3% |
| Armenian | 31 | 0.1% |
| Australian | 161 | 0.3% |
| Austrian | 142 | 0.3% |
| Bahamian | 11 | 0.0% |
| Belgian | 14 | 0.0% |
| Belizean | 10 | 0.0% |
| Bhutanese | 314 | 0.5% |
| Bolivian | 19 | 0.0% |
| British | 757 | 1.3% |
| Bulgarian | 18 | 0.0% |
| Burmese | 618 | 1.1% |
| Canadian | 32 | 0.1% |
| Carpatho Rusyn | 17 | 0.0% |
| Celtic | 21 | 0.0% |
| Central American | 1,816 | 3.2% |
| Central American Indian | 85 | 0.2% |
| Cherokee | 99 | 0.2% |
| Chickasaw | 7 | 0.0% |
| Chilean | 173 | 0.3% |
| Colombian | 283 | 0.5% |
| Costa Rican | 23 | 0.0% |
| Creek | 28 | 0.1% |
| Croatian | 55 | 0.1% |
| Cuban | 99 | 0.2% |
| Czech | 91 | 0.2% |
| Danish | 239 | 0.4% |
| Dominican | 114 | 0.2% |
| Dutch | 463 | 0.8% |
| Eastern European | 398 | 0.7% |
| Ecuadorian | 14 | 0.0% |
| Egyptian | 76 | 0.1% |
| English | 6,629 | 11.7% |
| Ethiopian | 226 | 0.4% |
| European | 2,055 | 3.6% |
| Filipino | 5 | 0.0% |
| Finnish | 48 | 0.1% |
| French | 1,003 | 1.8% |
| French Canadian | 138 | 0.2% |
| German | 5,155 | 9.1% |
| Greek | 285 | 0.5% |
| Guamanian / Chamorro | 17 | 0.0% |
| Guatemalan | 574 | 1.0% |
| Guyanese | 7 | 0.0% |
| Honduran | 839 | 1.5% |
| Hungarian | 285 | 0.5% |
| Indian (Asian) | 1,053 | 1.8% |
| Indonesian | 12 | 0.0% |
| Iranian | 125 | 0.2% |
| Irish | 4,997 | 8.8% |
| Israeli | 4 | 0.0% |
| Italian | 2,529 | 4.4% |
| Jamaican | 369 | 0.6% |
| Japanese | 18 | 0.0% |
| Kenyan | 10 | 0.0% |
| Korean | 345 | 0.6% |
| Laotian | 8 | 0.0% |
| Latvian | 8 | 0.0% |
| Lebanese | 125 | 0.2% |
| Lithuanian | 38 | 0.1% |
| Lumbee | 21 | 0.0% |
| Mexican | 5,580 | 9.8% |
| Mexican American Indian | 1,172 | 2.1% |
| Mongolian | 11 | 0.0% |
| Moroccan | 21 | 0.0% |
| New Zealander | 11 | 0.0% |
| Nicaraguan | 87 | 0.2% |
| Nigerian | 233 | 0.4% |
| Northern European | 41 | 0.1% |
| Norwegian | 259 | 0.5% |
| Pakistani | 9 | 0.0% |
| Palestinian | 16 | 0.0% |
| Panamanian | 11 | 0.0% |
| Peruvian | 236 | 0.4% |
| Polish | 1,219 | 2.1% |
| Portuguese | 48 | 0.1% |
| Pueblo | 27 | 0.1% |
| Puerto Rican | 389 | 0.7% |
| Romanian | 50 | 0.1% |
| Russian | 1,126 | 2.0% |
| Salvadoran | 282 | 0.5% |
| Samoan | 11 | 0.0% |
| Scandinavian | 174 | 0.3% |
| Scotch-Irish | 880 | 1.5% |
| Scottish | 1,394 | 2.5% |
| Senegalese | 34 | 0.1% |
| Serbian | 12 | 0.0% |
| Slovak | 60 | 0.1% |
| Slovene | 85 | 0.2% |
| South African | 11 | 0.0% |
| South American | 1,665 | 2.9% |
| Spaniard | 87 | 0.2% |
| Spanish | 86 | 0.2% |
| Spanish American | 14 | 0.0% |
| Sri Lankan | 231 | 0.4% |
| Subsaharan African | 706 | 1.2% |
| Swedish | 393 | 0.7% |
| Swiss | 50 | 0.1% |
| Syrian | 115 | 0.2% |
| Thai | 2,294 | 4.0% |
| Trinidadian and Tobagonian | 98 | 0.2% |
| Turkish | 8 | 0.0% |
| U.S. Virgin Islander | 29 | 0.1% |
| Ukrainian | 218 | 0.4% |
| Uruguayan | 34 | 0.1% |
| Venezuelan | 718 | 1.3% |
| Vietnamese | 138 | 0.2% |
| Welsh | 428 | 0.7% |
| West Indian | 16 | 0.0% |
| Yugoslavian | 21 | 0.0% | View All 115 Rows |
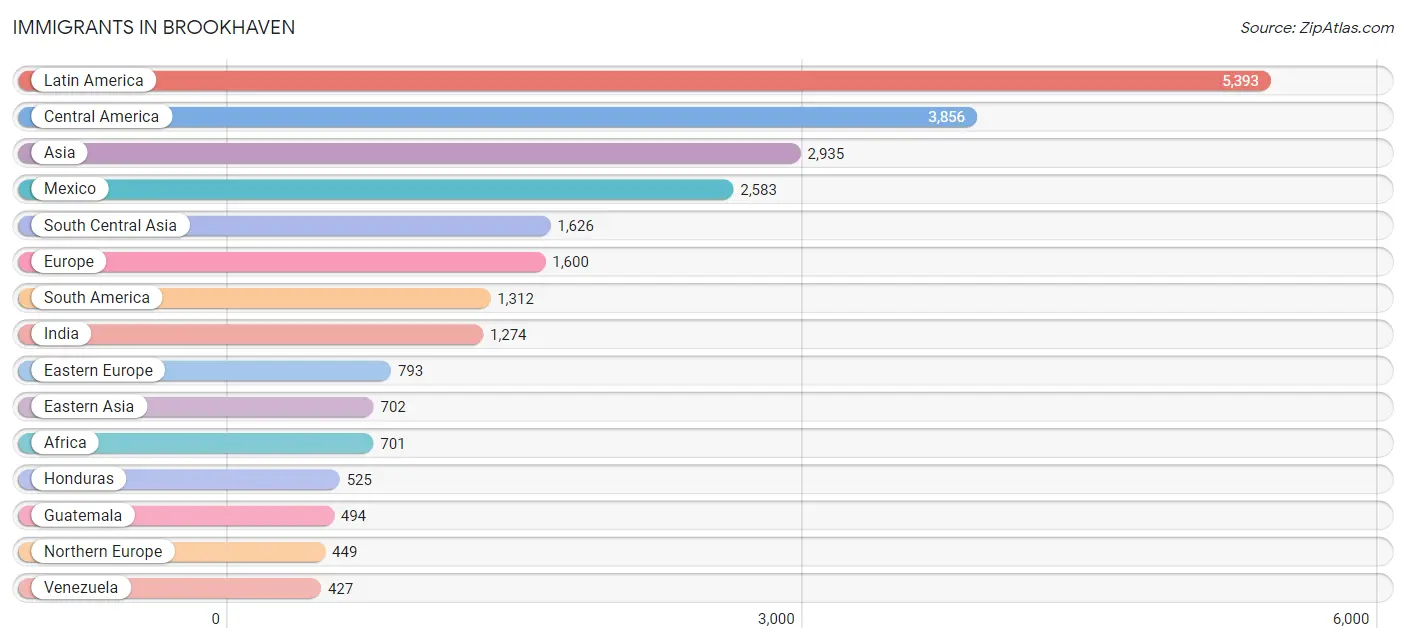
Immigrants in Brookhaven
The most numerous immigrant groups reported in Brookhaven came from Latin America (5,393 | 9.5%), Central America (3,856 | 6.8%), Asia (2,935 | 5.2%), Mexico (2,583 | 4.5%), and South Central Asia (1,626 | 2.9%), together accounting for 28.8% of all Brookhaven residents.
| Immigration Origin | # Population | % Population |
| Africa | 701 | 1.2% |
| Albania | 39 | 0.1% |
| Argentina | 140 | 0.3% |
| Asia | 2,935 | 5.2% |
| Australia | 27 | 0.1% |
| Austria | 32 | 0.1% |
| Bangladesh | 230 | 0.4% |
| Belarus | 63 | 0.1% |
| Belgium | 15 | 0.0% |
| Belize | 29 | 0.1% |
| Bolivia | 10 | 0.0% |
| Brazil | 142 | 0.3% |
| Bulgaria | 18 | 0.0% |
| Cambodia | 18 | 0.0% |
| Canada | 119 | 0.2% |
| Caribbean | 225 | 0.4% |
| Central America | 3,856 | 6.8% |
| Chile | 78 | 0.1% |
| China | 388 | 0.7% |
| Colombia | 175 | 0.3% |
| Costa Rica | 23 | 0.0% |
| Cuba | 19 | 0.0% |
| Dominican Republic | 25 | 0.0% |
| Eastern Africa | 229 | 0.4% |
| Eastern Asia | 702 | 1.2% |
| Eastern Europe | 793 | 1.4% |
| Ecuador | 9 | 0.0% |
| Egypt | 182 | 0.3% |
| El Salvador | 132 | 0.2% |
| England | 215 | 0.4% |
| Ethiopia | 178 | 0.3% |
| Europe | 1,600 | 2.8% |
| France | 136 | 0.2% |
| Germany | 63 | 0.1% |
| Guatemala | 494 | 0.9% |
| Guyana | 53 | 0.1% |
| Honduras | 525 | 0.9% |
| Hong Kong | 14 | 0.0% |
| India | 1,274 | 2.2% |
| Indonesia | 30 | 0.1% |
| Iran | 84 | 0.2% |
| Iraq | 42 | 0.1% |
| Ireland | 33 | 0.1% |
| Israel | 16 | 0.0% |
| Italy | 35 | 0.1% |
| Jamaica | 130 | 0.2% |
| Japan | 188 | 0.3% |
| Kenya | 42 | 0.1% |
| Korea | 126 | 0.2% |
| Kuwait | 6 | 0.0% |
| Latin America | 5,393 | 9.5% |
| Lebanon | 40 | 0.1% |
| Malaysia | 11 | 0.0% |
| Mexico | 2,583 | 4.5% |
| Middle Africa | 40 | 0.1% |
| Netherlands | 77 | 0.1% |
| Nicaragua | 59 | 0.1% |
| Nigeria | 45 | 0.1% |
| Northern Africa | 233 | 0.4% |
| Northern Europe | 449 | 0.8% |
| Oceania | 38 | 0.1% |
| Panama | 11 | 0.0% |
| Peru | 244 | 0.4% |
| Philippines | 81 | 0.1% |
| Poland | 135 | 0.2% |
| Romania | 55 | 0.1% |
| Russia | 406 | 0.7% |
| Senegal | 34 | 0.1% |
| Singapore | 12 | 0.0% |
| South Africa | 21 | 0.0% |
| South America | 1,312 | 2.3% |
| South Central Asia | 1,626 | 2.9% |
| South Eastern Asia | 292 | 0.5% |
| Southern Europe | 35 | 0.1% |
| Sweden | 16 | 0.0% |
| Syria | 115 | 0.2% |
| Taiwan | 32 | 0.1% |
| Thailand | 9 | 0.0% |
| Trinidad and Tobago | 51 | 0.1% |
| Ukraine | 69 | 0.1% |
| Uruguay | 34 | 0.1% |
| Uzbekistan | 38 | 0.1% |
| Venezuela | 427 | 0.7% |
| Vietnam | 131 | 0.2% |
| Western Africa | 178 | 0.3% |
| Western Asia | 307 | 0.5% |
| Western Europe | 323 | 0.6% |
| Zaire | 40 | 0.1% | View All 88 Rows |
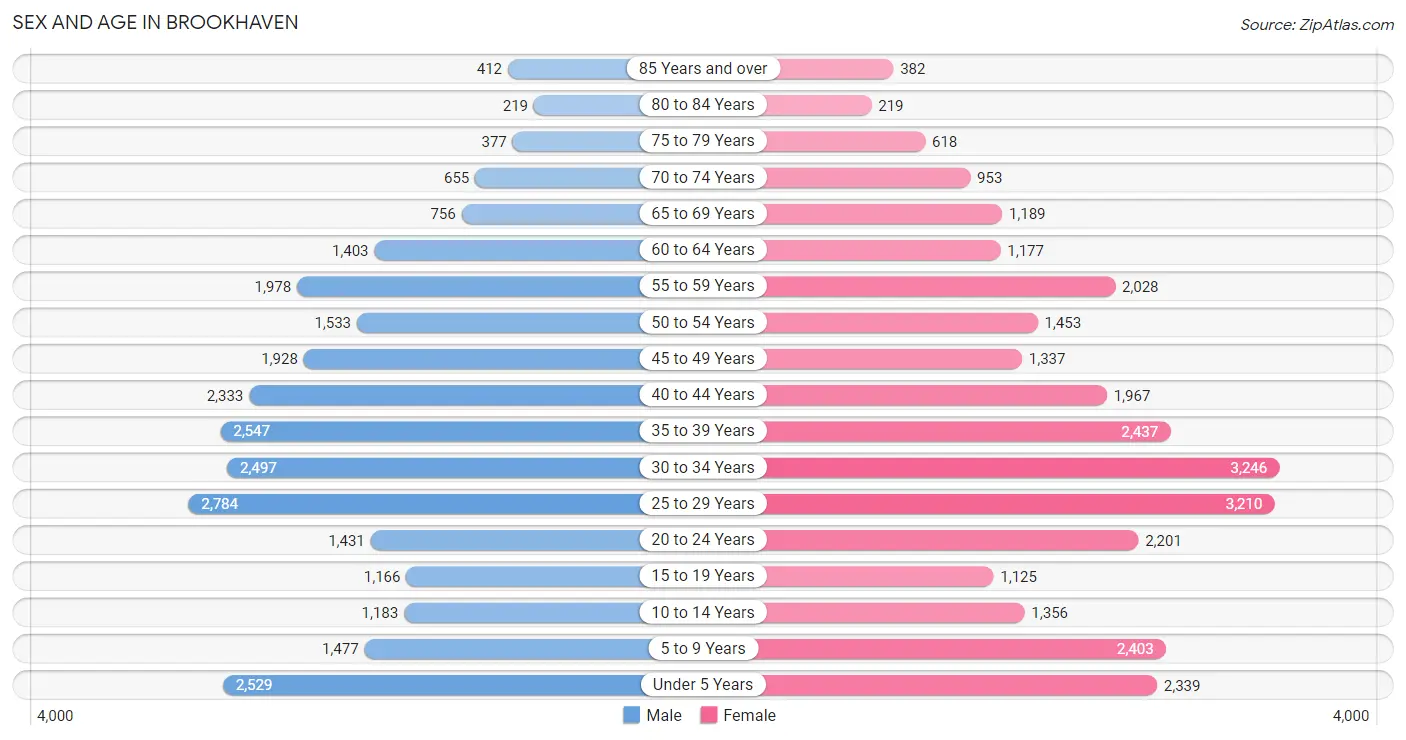
Sex and Age in Brookhaven
Sex and Age in Brookhaven
The most populous age groups in Brookhaven are 25 to 29 Years (2,784 | 10.2%) for men and 30 to 34 Years (3,246 | 11.0%) for women.
| Age Bracket | Male | Female |
| Under 5 Years | 2,529 (9.3%) | 2,339 (7.9%) |
| 5 to 9 Years | 1,477 (5.4%) | 2,403 (8.1%) |
| 10 to 14 Years | 1,183 (4.3%) | 1,356 (4.6%) |
| 15 to 19 Years | 1,166 (4.3%) | 1,125 (3.8%) |
| 20 to 24 Years | 1,431 (5.3%) | 2,201 (7.4%) |
| 25 to 29 Years | 2,784 (10.2%) | 3,210 (10.8%) |
| 30 to 34 Years | 2,497 (9.2%) | 3,246 (11.0%) |
| 35 to 39 Years | 2,547 (9.4%) | 2,437 (8.2%) |
| 40 to 44 Years | 2,333 (8.6%) | 1,967 (6.6%) |
| 45 to 49 Years | 1,928 (7.1%) | 1,337 (4.5%) |
| 50 to 54 Years | 1,533 (5.6%) | 1,453 (4.9%) |
| 55 to 59 Years | 1,978 (7.3%) | 2,028 (6.8%) |
| 60 to 64 Years | 1,403 (5.2%) | 1,177 (4.0%) |
| 65 to 69 Years | 756 (2.8%) | 1,189 (4.0%) |
| 70 to 74 Years | 655 (2.4%) | 953 (3.2%) |
| 75 to 79 Years | 377 (1.4%) | 618 (2.1%) |
| 80 to 84 Years | 219 (0.8%) | 219 (0.7%) |
| 85 Years and over | 412 (1.5%) | 382 (1.3%) |
| Total | 27,208 (100.0%) | 29,640 (100.0%) |
Families and Households in Brookhaven
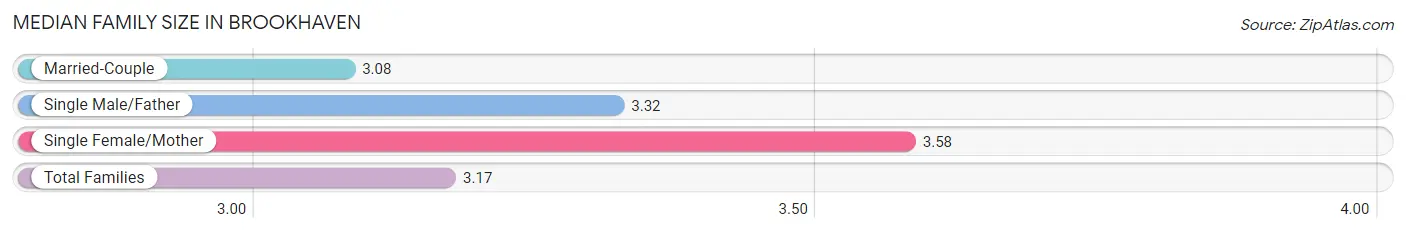
Median Family Size in Brookhaven
The median family size in Brookhaven is 3.17 persons per family, with single female/mother families (1,783 | 14.7%) accounting for the largest median family size of 3.58 persons per family. On the other hand, married-couple families (9,634 | 79.3%) represent the smallest median family size with 3.08 persons per family.
| Family Type | # Families | Family Size |
| Married-Couple | 9,634 (79.3%) | 3.08 |
| Single Male/Father | 730 (6.0%) | 3.32 |
| Single Female/Mother | 1,783 (14.7%) | 3.58 |
| Total Families | 12,147 (100.0%) | 3.17 |
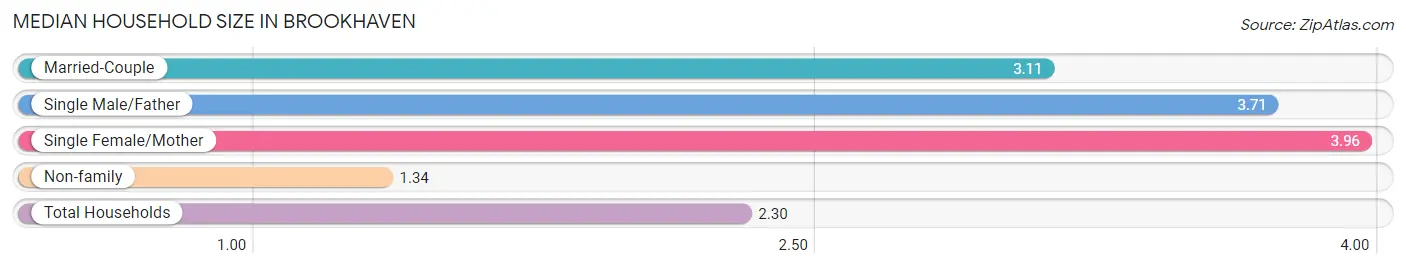
Median Household Size in Brookhaven
The median household size in Brookhaven is 2.30 persons per household, with single female/mother households (1,783 | 7.3%) accounting for the largest median household size of 3.96 persons per household. non-family households (12,222 | 50.1%) represent the smallest median household size with 1.34 persons per household.
| Household Type | # Households | Household Size |
| Married-Couple | 9,634 (39.5%) | 3.11 |
| Single Male/Father | 730 (3.0%) | 3.71 |
| Single Female/Mother | 1,783 (7.3%) | 3.96 |
| Non-family | 12,222 (50.1%) | 1.34 |
| Total Households | 24,369 (100.0%) | 2.30 |
Household Size by Marriage Status in Brookhaven
Out of a total of 24,369 households in Brookhaven, 12,147 (49.8%) are family households, while 12,222 (50.1%) are nonfamily households. The most numerous type of family households are 2-person households, comprising 5,555, and the most common type of nonfamily households are 1-person households, comprising 9,453.
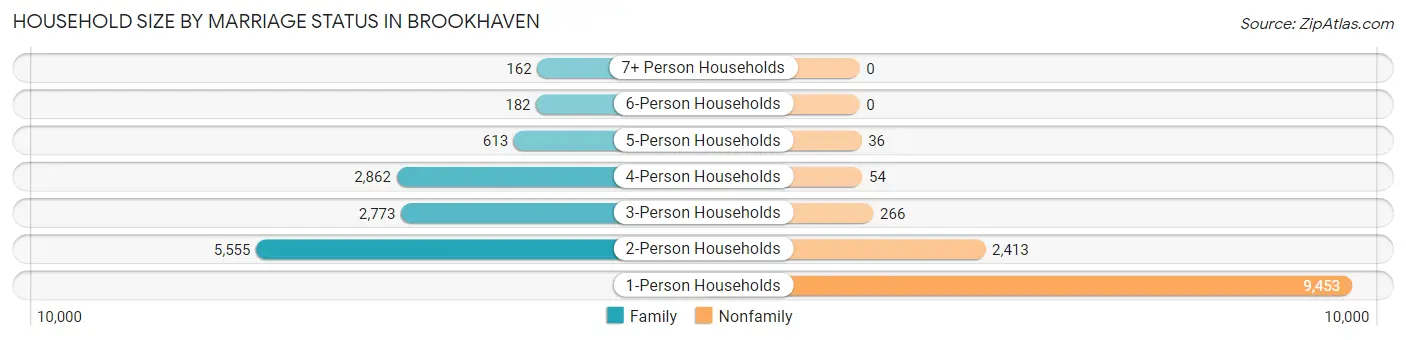
| Household Size | Family Households | Nonfamily Households |
| 1-Person Households | - | 9,453 (38.8%) |
| 2-Person Households | 5,555 (22.8%) | 2,413 (9.9%) |
| 3-Person Households | 2,773 (11.4%) | 266 (1.1%) |
| 4-Person Households | 2,862 (11.7%) | 54 (0.2%) |
| 5-Person Households | 613 (2.5%) | 36 (0.2%) |
| 6-Person Households | 182 (0.7%) | 0 (0.0%) |
| 7+ Person Households | 162 (0.7%) | 0 (0.0%) |
| Total | 12,147 (49.8%) | 12,222 (50.1%) |
Female Fertility in Brookhaven
Fertility by Age in Brookhaven
Average fertility rate in Brookhaven is 61.0 births per 1,000 women. Women in the age bracket of 20 to 34 years have the highest fertility rate with 82.0 births per 1,000 women. Women in the age bracket of 20 to 34 years acount for 73.5% of all women with births.
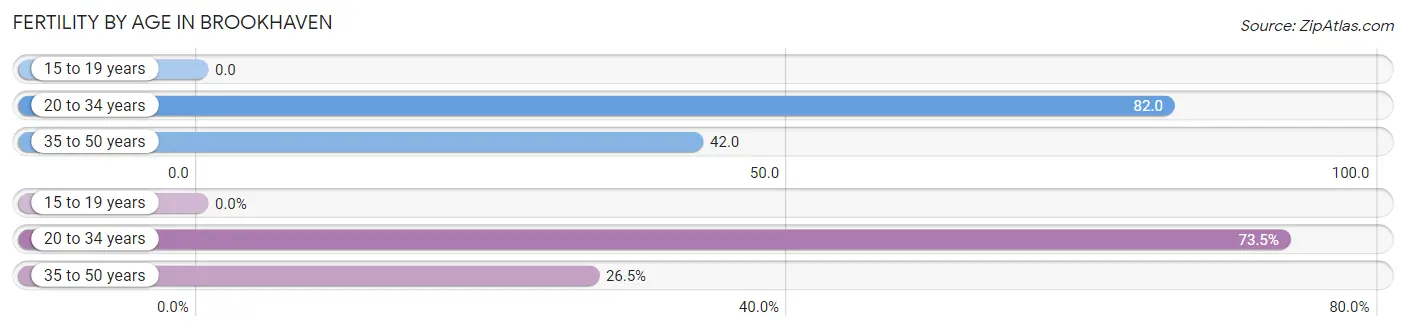
| Age Bracket | Women with Births | Births / 1,000 Women |
| 15 to 19 years | 0 (0.0%) | 0.0 |
| 20 to 34 years | 709 (73.5%) | 82.0 |
| 35 to 50 years | 256 (26.5%) | 42.0 |
| Total | 965 (100.0%) | 61.0 |
Fertility by Age by Marriage Status in Brookhaven
76.7% of women with births (965) in Brookhaven are married. The highest percentage of unmarried women with births falls into 20 to 34 years age bracket with 28.1% of them unmarried at the time of birth, while the lowest percentage of unmarried women with births belong to 35 to 50 years age bracket with 10.2% of them unmarried.
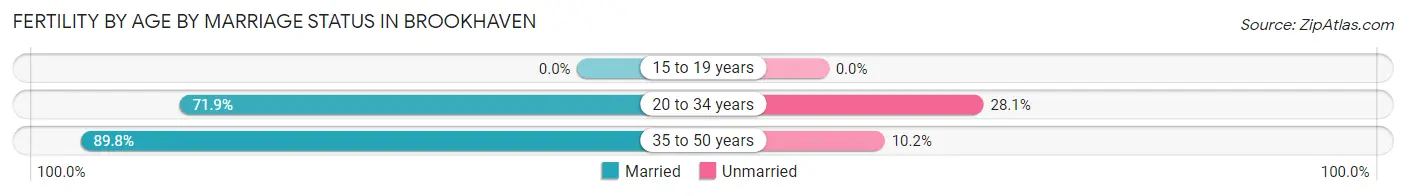
| Age Bracket | Married | Unmarried |
| 15 to 19 years | 0 (0.0%) | 0 (0.0%) |
| 20 to 34 years | 510 (71.9%) | 199 (28.1%) |
| 35 to 50 years | 230 (89.8%) | 26 (10.2%) |
| Total | 740 (76.7%) | 225 (23.3%) |
Fertility by Education in Brookhaven
Average fertility rate in Brookhaven is 61.0 births per 1,000 women. Women with the education attainment of high school diploma have the highest fertility rate of 78.0 births per 1,000 women, while women with the education attainment of bachelor's degree have the lowest fertility at 45.0 births per 1,000 women. Women with the education attainment of graduate degree represent 40.0% of all women with births.
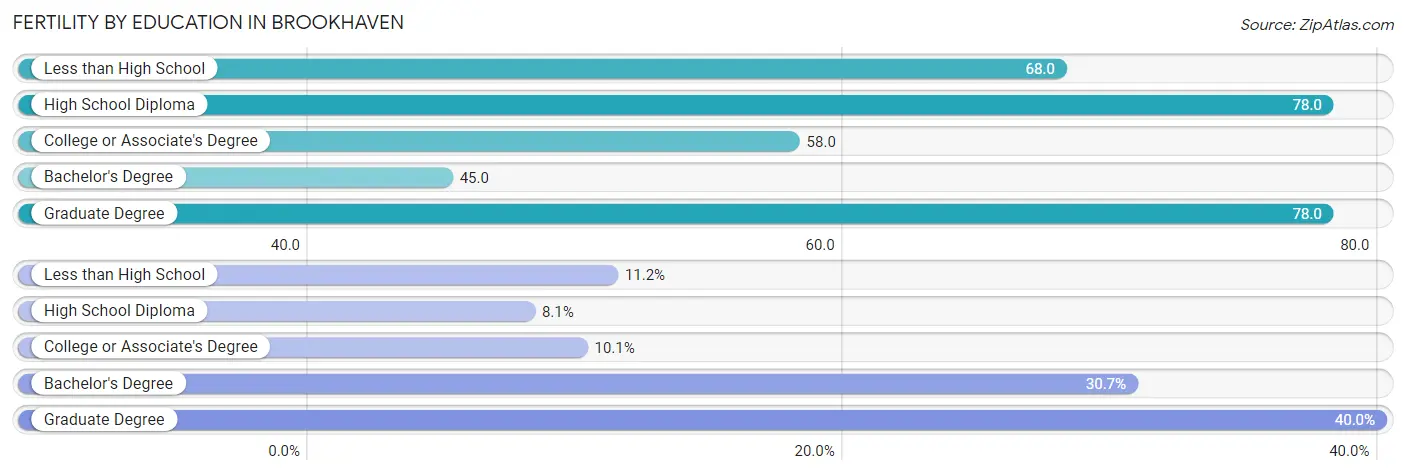
| Educational Attainment | Women with Births | Births / 1,000 Women |
| Less than High School | 108 (11.2%) | 68.0 |
| High School Diploma | 78 (8.1%) | 78.0 |
| College or Associate's Degree | 97 (10.1%) | 58.0 |
| Bachelor's Degree | 296 (30.7%) | 45.0 |
| Graduate Degree | 386 (40.0%) | 78.0 |
| Total | 965 (100.0%) | 61.0 |
Fertility by Education by Marriage Status in Brookhaven
23.3% of women with births in Brookhaven are unmarried. Women with the educational attainment of bachelor's degree are most likely to be married with 96.0% of them married at childbirth, while women with the educational attainment of less than high school are least likely to be married with 100.0% of them unmarried at childbirth.
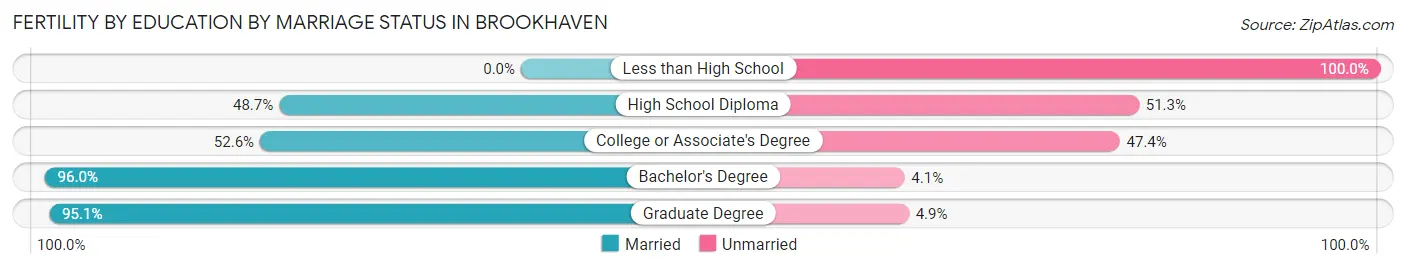
| Educational Attainment | Married | Unmarried |
| Less than High School | 0 (0.0%) | 108 (100.0%) |
| High School Diploma | 38 (48.7%) | 40 (51.3%) |
| College or Associate's Degree | 51 (52.6%) | 46 (47.4%) |
| Bachelor's Degree | 284 (96.0%) | 12 (4.1%) |
| Graduate Degree | 367 (95.1%) | 19 (4.9%) |
| Total | 740 (76.7%) | 225 (23.3%) |
Employment Characteristics in Brookhaven
Employment by Class of Employer in Brookhaven
Among the 33,207 employed individuals in Brookhaven, private company employees (24,455 | 73.6%), not-for-profit organizations (2,422 | 7.3%), and self-employed (incorporated) (2,088 | 6.3%) make up the most common classes of employment.
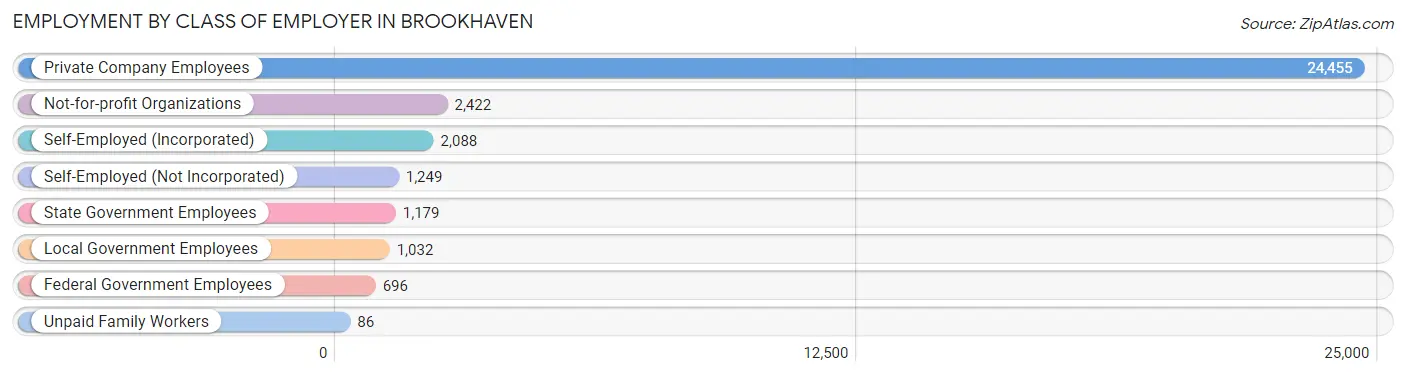
| Employer Class | # Employees | % Employees |
| Private Company Employees | 24,455 | 73.6% |
| Self-Employed (Incorporated) | 2,088 | 6.3% |
| Self-Employed (Not Incorporated) | 1,249 | 3.8% |
| Not-for-profit Organizations | 2,422 | 7.3% |
| Local Government Employees | 1,032 | 3.1% |
| State Government Employees | 1,179 | 3.5% |
| Federal Government Employees | 696 | 2.1% |
| Unpaid Family Workers | 86 | 0.3% |
| Total | 33,207 | 100.0% |
Employment Status by Age in Brookhaven
According to the labor force statistics for Brookhaven, out of the total population over 16 years of age (45,060), 77.4% or 34,876 individuals are in the labor force, with 3.0% or 1,046 of them unemployed. The age group with the highest labor force participation rate is 30 to 34 years, with 92.5% or 5,312 individuals in the labor force. Within the labor force, the 16 to 19 years age range has the highest percentage of unemployed individuals, with 32.1% or 193 of them being unemployed.
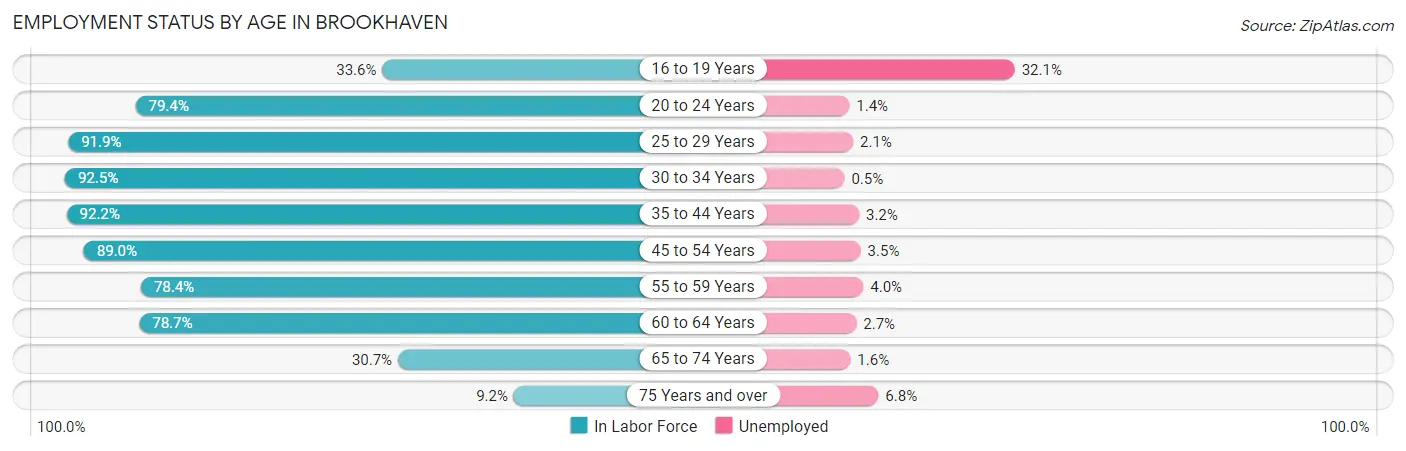
| Age Bracket | In Labor Force | Unemployed |
| 16 to 19 Years | 601 (33.6%) | 193 (32.1%) |
| 20 to 24 Years | 2,884 (79.4%) | 40 (1.4%) |
| 25 to 29 Years | 5,508 (91.9%) | 116 (2.1%) |
| 30 to 34 Years | 5,312 (92.5%) | 27 (0.5%) |
| 35 to 44 Years | 8,560 (92.2%) | 274 (3.2%) |
| 45 to 54 Years | 5,563 (89.0%) | 195 (3.5%) |
| 55 to 59 Years | 3,141 (78.4%) | 126 (4.0%) |
| 60 to 64 Years | 2,030 (78.7%) | 55 (2.7%) |
| 65 to 74 Years | 1,091 (30.7%) | 17 (1.6%) |
| 75 Years and over | 205 (9.2%) | 14 (6.8%) |
| Total | 34,876 (77.4%) | 1,046 (3.0%) |
Employment Status by Educational Attainment in Brookhaven
According to labor force statistics for Brookhaven, 89.0% of individuals (30,134) out of the total population between 25 and 64 years of age (33,858) are in the labor force, with 2.6% or 783 of them being unemployed. The group with the highest labor force participation rate are those with the educational attainment of bachelor's degree or higher, with 92.2% or 23,913 individuals in the labor force. Within the labor force, individuals with college / associate degree education have the highest percentage of unemployment, with 7.6% or 231 of them being unemployed.
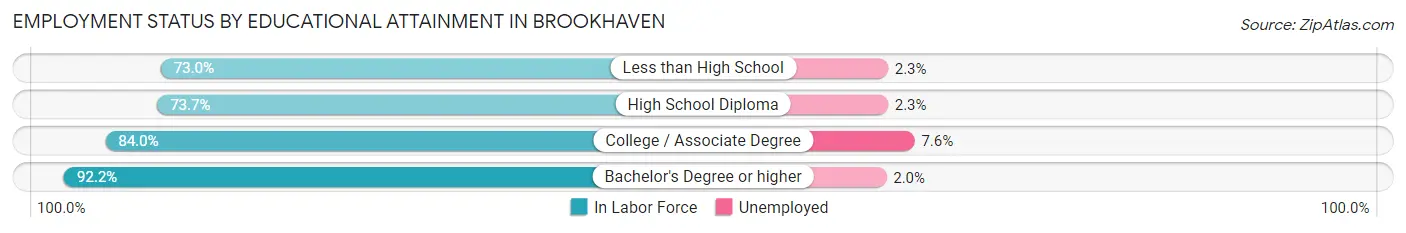
| Educational Attainment | In Labor Force | Unemployed |
| Less than High School | 1,623 (73.0%) | 51 (2.3%) |
| High School Diploma | 1,533 (73.7%) | 48 (2.3%) |
| College / Associate Degree | 3,040 (84.0%) | 275 (7.6%) |
| Bachelor's Degree or higher | 23,913 (92.2%) | 519 (2.0%) |
| Total | 30,134 (89.0%) | 880 (2.6%) |
Employment Occupations by Sex in Brookhaven
Management, Business, Science and Arts Occupations
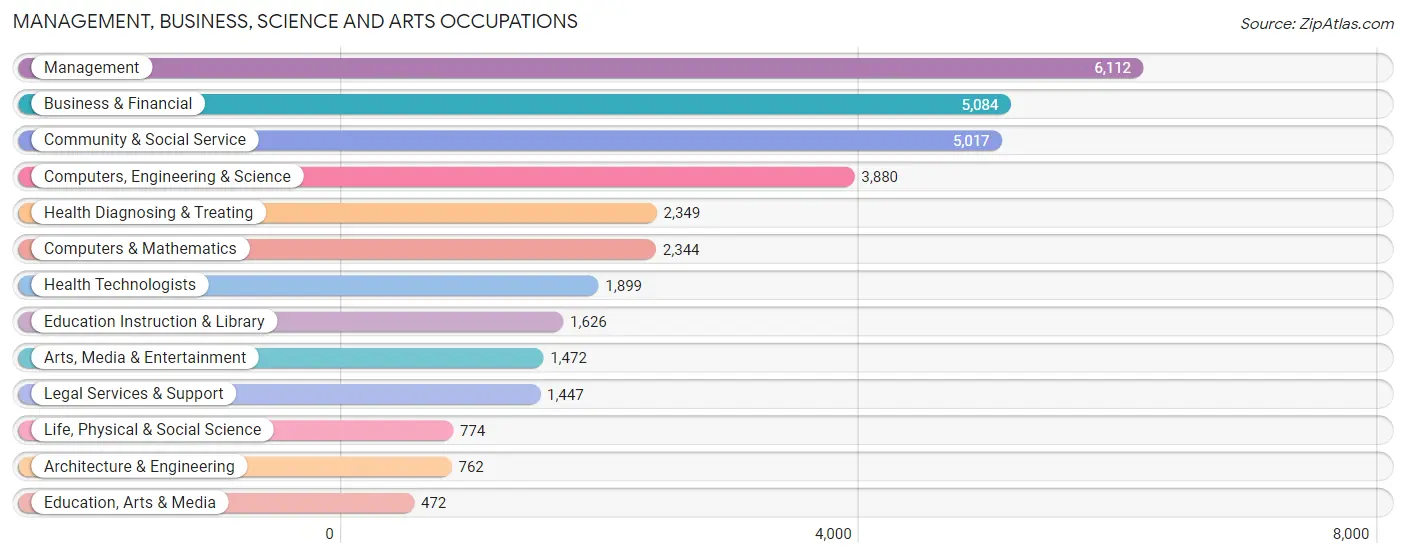
The most common Management, Business, Science and Arts occupations in Brookhaven are Management (6,112 | 18.1%), Business & Financial (5,084 | 15.0%), Community & Social Service (5,017 | 14.8%), Computers, Engineering & Science (3,880 | 11.5%), and Health Diagnosing & Treating (2,349 | 6.9%).
Management, Business, Science and Arts Occupations by Sex
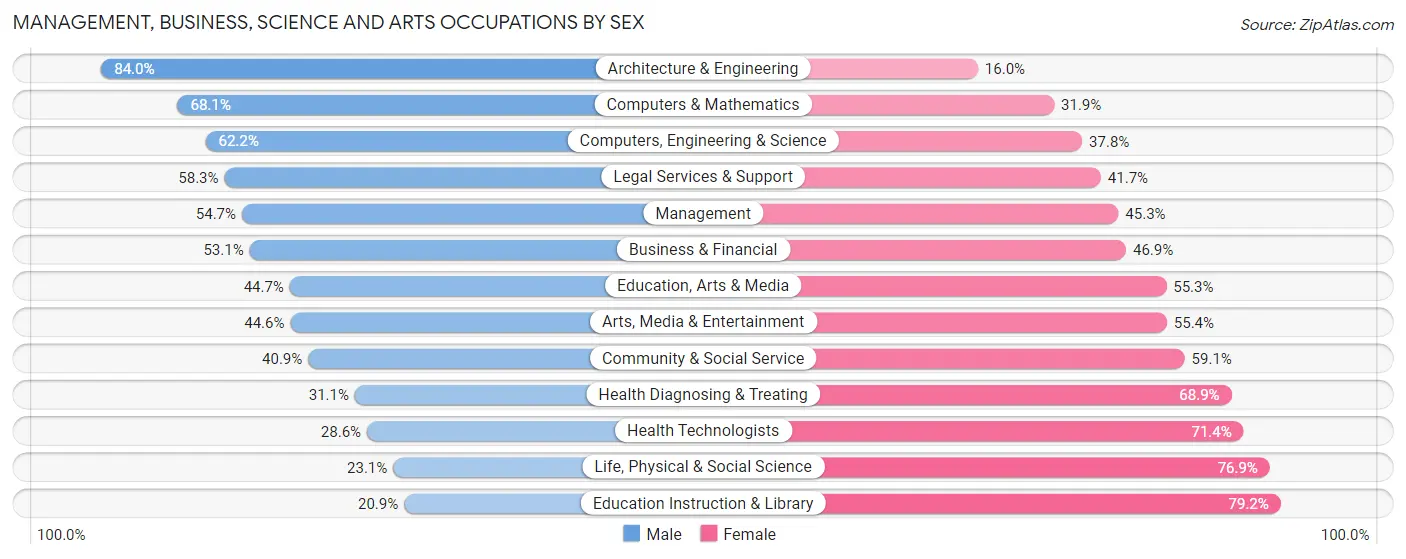
Within the Management, Business, Science and Arts occupations in Brookhaven, the most male-oriented occupations are Architecture & Engineering (84.0%), Computers & Mathematics (68.1%), and Computers, Engineering & Science (62.2%), while the most female-oriented occupations are Education Instruction & Library (79.1%), Life, Physical & Social Science (76.9%), and Health Technologists (71.4%).
| Occupation | Male | Female |
| Management | 3,342 (54.7%) | 2,770 (45.3%) |
| Business & Financial | 2,699 (53.1%) | 2,385 (46.9%) |
| Computers, Engineering & Science | 2,415 (62.2%) | 1,465 (37.8%) |
| Computers & Mathematics | 1,596 (68.1%) | 748 (31.9%) |
| Architecture & Engineering | 640 (84.0%) | 122 (16.0%) |
| Life, Physical & Social Science | 179 (23.1%) | 595 (76.9%) |
| Community & Social Service | 2,050 (40.9%) | 2,967 (59.1%) |
| Education, Arts & Media | 211 (44.7%) | 261 (55.3%) |
| Legal Services & Support | 844 (58.3%) | 603 (41.7%) |
| Education Instruction & Library | 339 (20.8%) | 1,287 (79.1%) |
| Arts, Media & Entertainment | 656 (44.6%) | 816 (55.4%) |
| Health Diagnosing & Treating | 731 (31.1%) | 1,618 (68.9%) |
| Health Technologists | 543 (28.6%) | 1,356 (71.4%) |
| Total (Category) | 11,237 (50.1%) | 11,205 (49.9%) |
| Total (Overall) | 17,471 (51.6%) | 16,361 (48.4%) |
Services Occupations
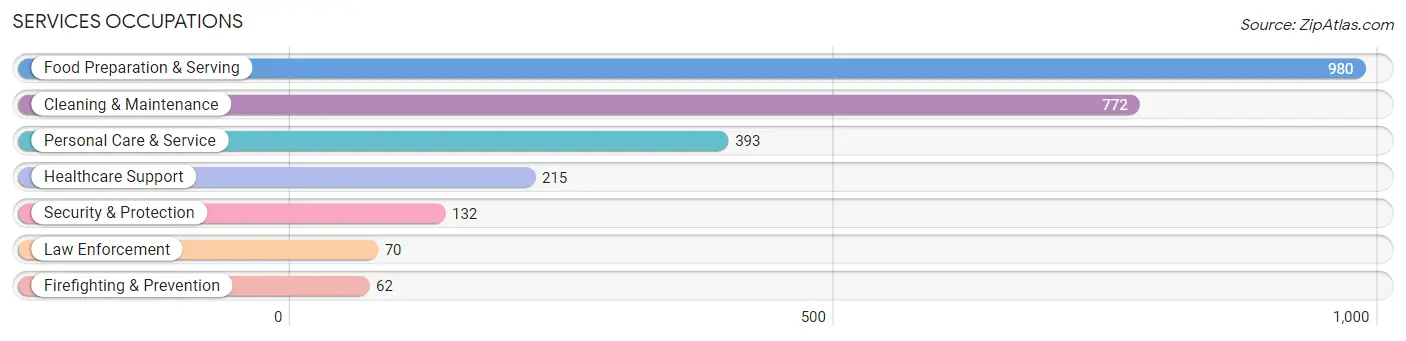
The most common Services occupations in Brookhaven are Food Preparation & Serving (980 | 2.9%), Cleaning & Maintenance (772 | 2.3%), Personal Care & Service (393 | 1.2%), Healthcare Support (215 | 0.6%), and Security & Protection (132 | 0.4%).
Services Occupations by Sex
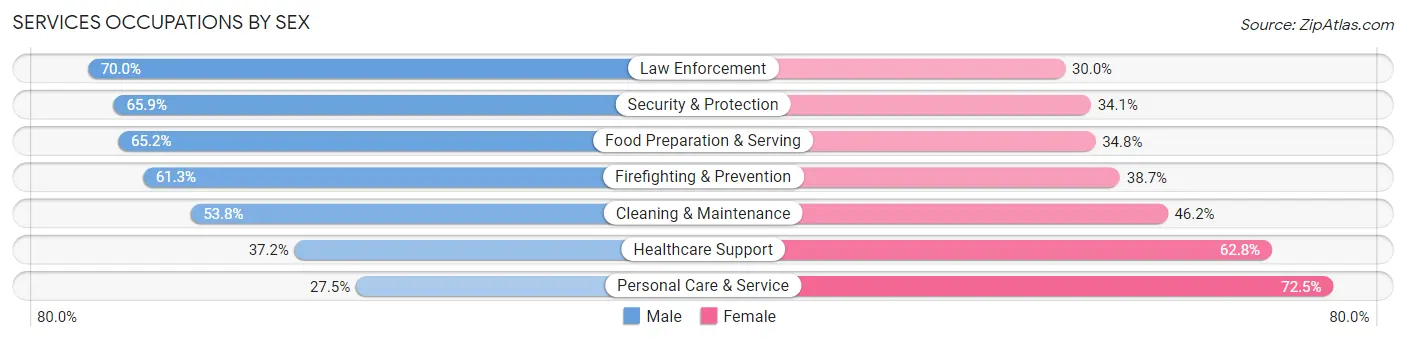
Within the Services occupations in Brookhaven, the most male-oriented occupations are Law Enforcement (70.0%), Security & Protection (65.9%), and Food Preparation & Serving (65.2%), while the most female-oriented occupations are Personal Care & Service (72.5%), Healthcare Support (62.8%), and Cleaning & Maintenance (46.2%).
| Occupation | Male | Female |
| Healthcare Support | 80 (37.2%) | 135 (62.8%) |
| Security & Protection | 87 (65.9%) | 45 (34.1%) |
| Firefighting & Prevention | 38 (61.3%) | 24 (38.7%) |
| Law Enforcement | 49 (70.0%) | 21 (30.0%) |
| Food Preparation & Serving | 639 (65.2%) | 341 (34.8%) |
| Cleaning & Maintenance | 415 (53.8%) | 357 (46.2%) |
| Personal Care & Service | 108 (27.5%) | 285 (72.5%) |
| Total (Category) | 1,329 (53.3%) | 1,163 (46.7%) |
| Total (Overall) | 17,471 (51.6%) | 16,361 (48.4%) |
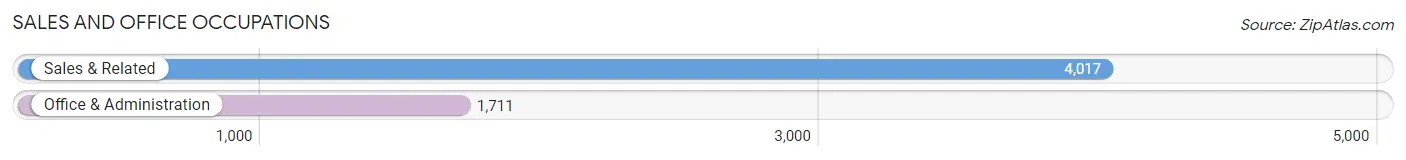
Sales and Office Occupations
The most common Sales and Office occupations in Brookhaven are Sales & Related (4,017 | 11.9%), and Office & Administration (1,711 | 5.1%).
Sales and Office Occupations by Sex
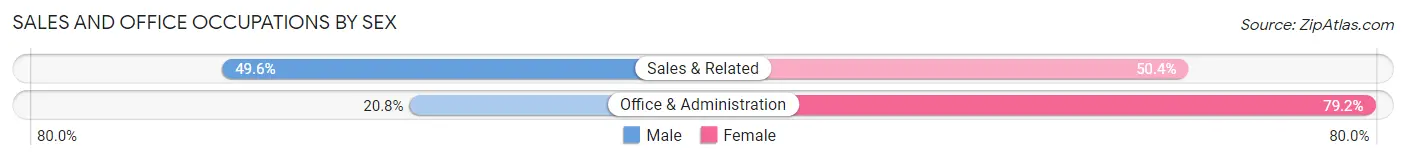
| Occupation | Male | Female |
| Sales & Related | 1,992 (49.6%) | 2,025 (50.4%) |
| Office & Administration | 356 (20.8%) | 1,355 (79.2%) |
| Total (Category) | 2,348 (41.0%) | 3,380 (59.0%) |
| Total (Overall) | 17,471 (51.6%) | 16,361 (48.4%) |
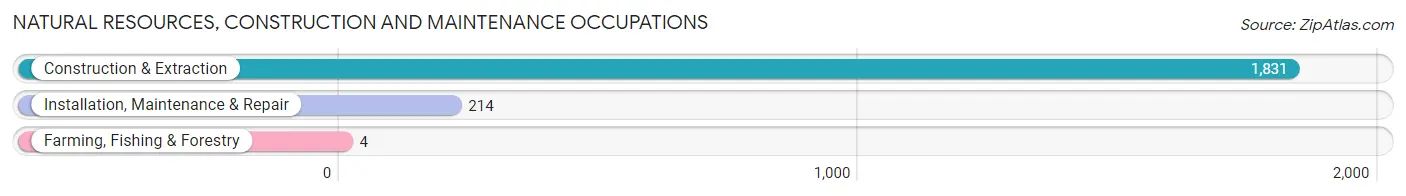
Natural Resources, Construction and Maintenance Occupations
The most common Natural Resources, Construction and Maintenance occupations in Brookhaven are Construction & Extraction (1,831 | 5.4%), Installation, Maintenance & Repair (214 | 0.6%), and Farming, Fishing & Forestry (4 | 0.0%).
Natural Resources, Construction and Maintenance Occupations by Sex
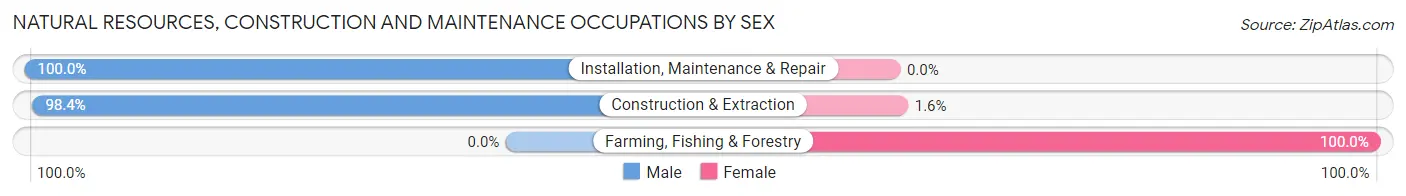
| Occupation | Male | Female |
| Farming, Fishing & Forestry | 0 (0.0%) | 4 (100.0%) |
| Construction & Extraction | 1,801 (98.4%) | 30 (1.6%) |
| Installation, Maintenance & Repair | 214 (100.0%) | 0 (0.0%) |
| Total (Category) | 2,015 (98.3%) | 34 (1.7%) |
| Total (Overall) | 17,471 (51.6%) | 16,361 (48.4%) |
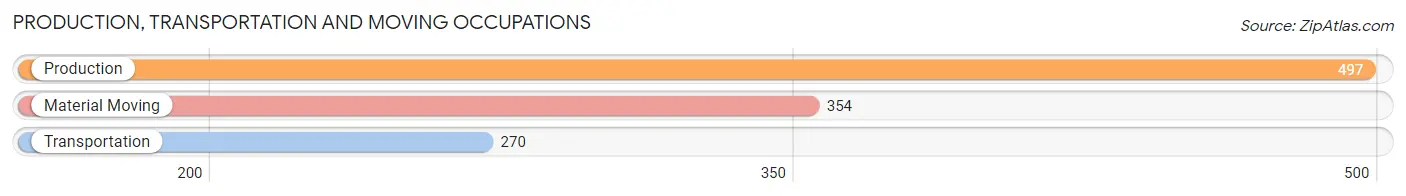
Production, Transportation and Moving Occupations
The most common Production, Transportation and Moving occupations in Brookhaven are Production (497 | 1.5%), Material Moving (354 | 1.1%), and Transportation (270 | 0.8%).
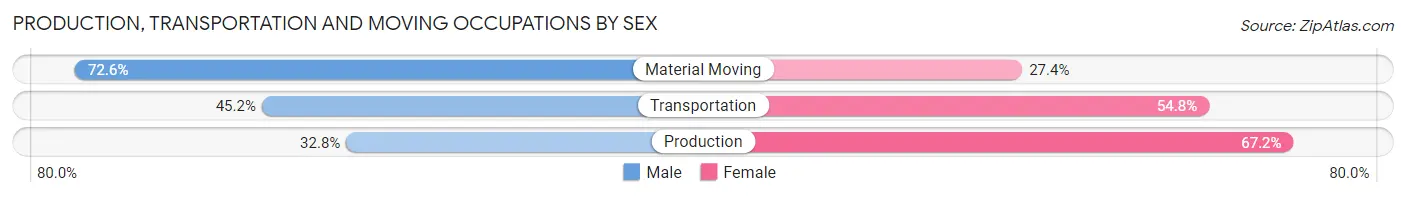
Production, Transportation and Moving Occupations by Sex
| Occupation | Male | Female |
| Production | 163 (32.8%) | 334 (67.2%) |
| Transportation | 122 (45.2%) | 148 (54.8%) |
| Material Moving | 257 (72.6%) | 97 (27.4%) |
| Total (Category) | 542 (48.3%) | 579 (51.6%) |
| Total (Overall) | 17,471 (51.6%) | 16,361 (48.4%) |
Employment Industries by Sex in Brookhaven
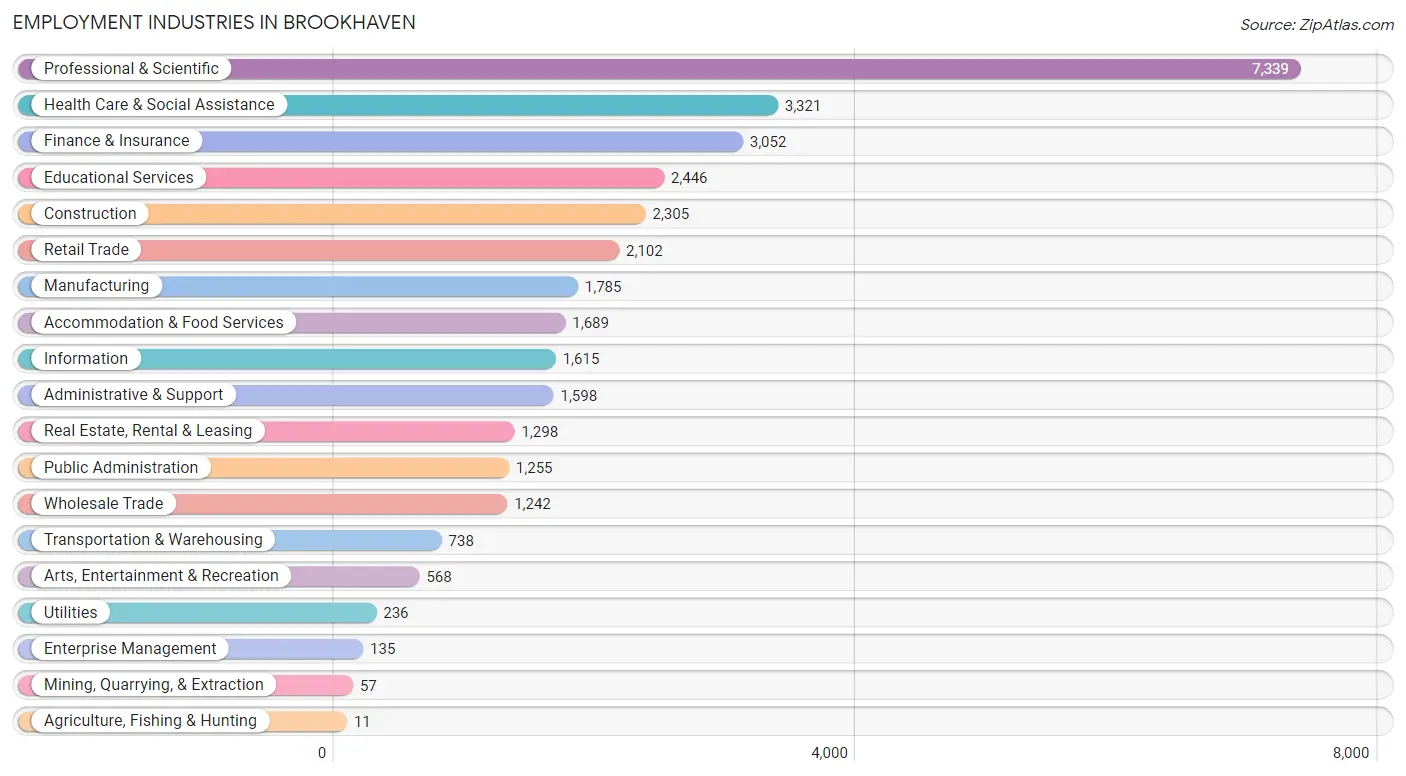
Employment Industries in Brookhaven
The major employment industries in Brookhaven include Professional & Scientific (7,339 | 21.7%), Health Care & Social Assistance (3,321 | 9.8%), Finance & Insurance (3,052 | 9.0%), Educational Services (2,446 | 7.2%), and Construction (2,305 | 6.8%).
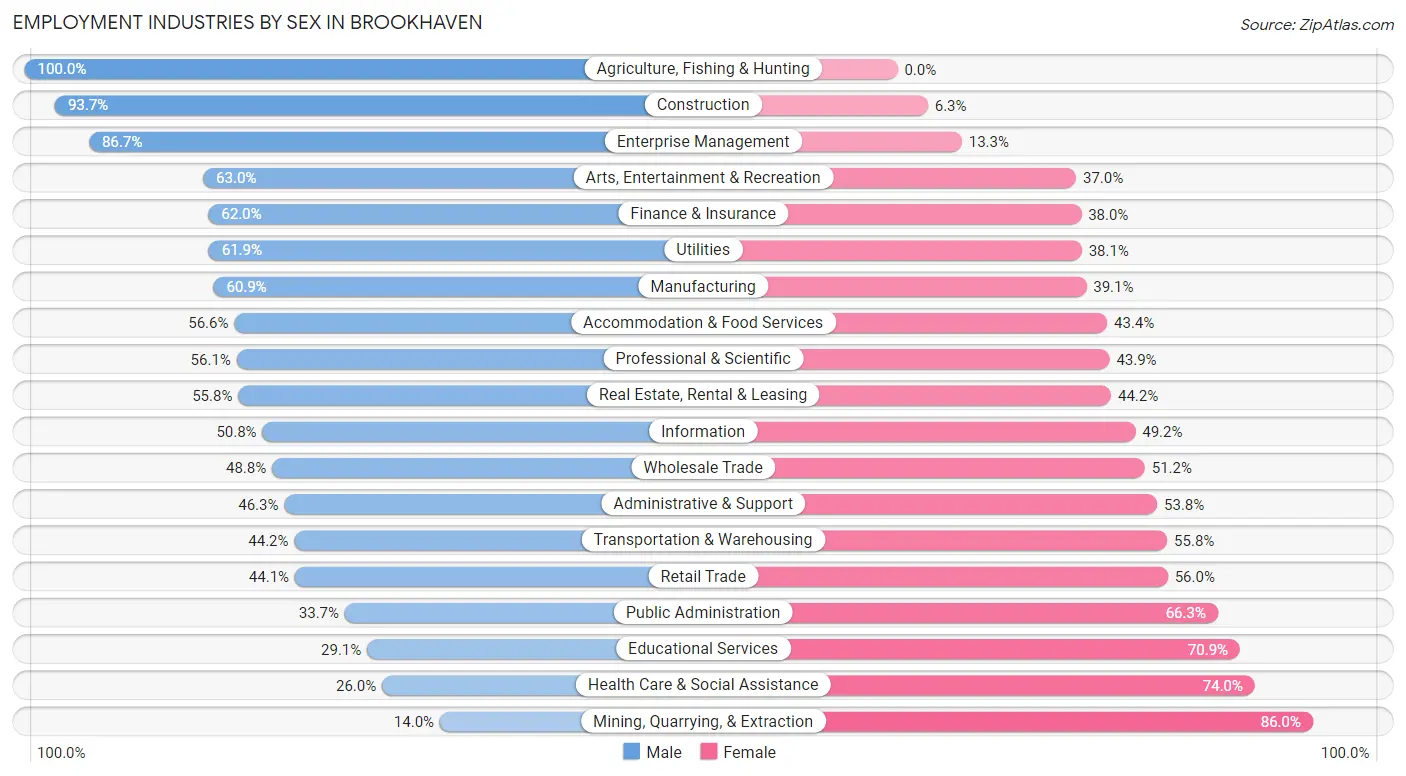
Employment Industries by Sex in Brookhaven
The Brookhaven industries that see more men than women are Agriculture, Fishing & Hunting (100.0%), Construction (93.7%), and Enterprise Management (86.7%), whereas the industries that tend to have a higher number of women are Mining, Quarrying, & Extraction (86.0%), Health Care & Social Assistance (74.0%), and Educational Services (70.9%).
| Industry | Male | Female |
| Agriculture, Fishing & Hunting | 11 (100.0%) | 0 (0.0%) |
| Mining, Quarrying, & Extraction | 8 (14.0%) | 49 (86.0%) |
| Construction | 2,160 (93.7%) | 145 (6.3%) |
| Manufacturing | 1,087 (60.9%) | 698 (39.1%) |
| Wholesale Trade | 606 (48.8%) | 636 (51.2%) |
| Retail Trade | 926 (44.1%) | 1,176 (55.9%) |
| Transportation & Warehousing | 326 (44.2%) | 412 (55.8%) |
| Utilities | 146 (61.9%) | 90 (38.1%) |
| Information | 820 (50.8%) | 795 (49.2%) |
| Finance & Insurance | 1,891 (62.0%) | 1,161 (38.0%) |
| Real Estate, Rental & Leasing | 724 (55.8%) | 574 (44.2%) |
| Professional & Scientific | 4,118 (56.1%) | 3,221 (43.9%) |
| Enterprise Management | 117 (86.7%) | 18 (13.3%) |
| Administrative & Support | 739 (46.3%) | 859 (53.7%) |
| Educational Services | 712 (29.1%) | 1,734 (70.9%) |
| Health Care & Social Assistance | 864 (26.0%) | 2,457 (74.0%) |
| Arts, Entertainment & Recreation | 358 (63.0%) | 210 (37.0%) |
| Accommodation & Food Services | 956 (56.6%) | 733 (43.4%) |
| Public Administration | 423 (33.7%) | 832 (66.3%) |
| Total | 17,471 (51.6%) | 16,361 (48.4%) |
Education in Brookhaven
School Enrollment in Brookhaven
The most common levels of schooling among the 12,063 students in Brookhaven are elementary school (2,514 | 20.8%), middle school (2,101 | 17.4%), and college / undergraduate (1,824 | 15.1%).
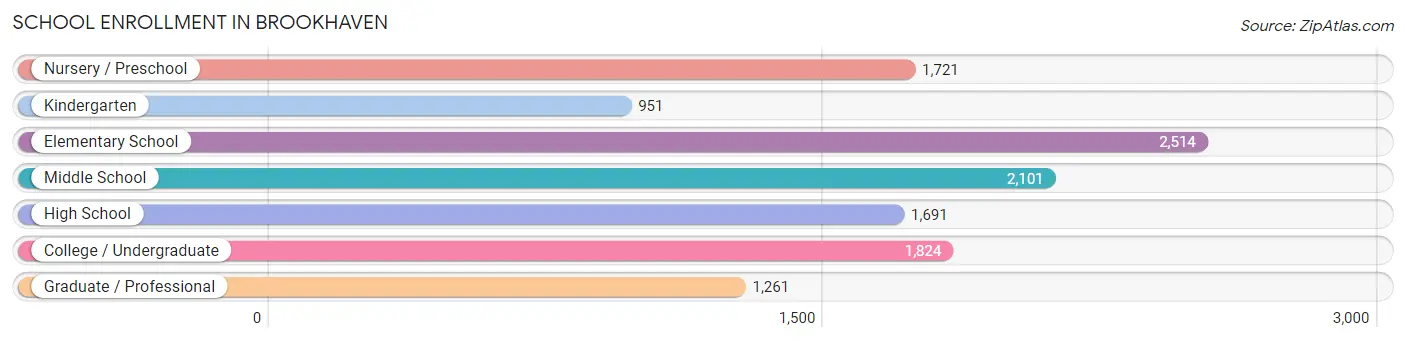
| School Level | # Students | % Students |
| Nursery / Preschool | 1,721 | 14.3% |
| Kindergarten | 951 | 7.9% |
| Elementary School | 2,514 | 20.8% |
| Middle School | 2,101 | 17.4% |
| High School | 1,691 | 14.0% |
| College / Undergraduate | 1,824 | 15.1% |
| Graduate / Professional | 1,261 | 10.4% |
| Total | 12,063 | 100.0% |
School Enrollment by Age by Funding Source in Brookhaven
Out of a total of 12,063 students who are enrolled in schools in Brookhaven, 4,861 (40.3%) attend a private institution, while the remaining 7,202 (59.7%) are enrolled in public schools. The age group of 3 to 4 year olds has the highest likelihood of being enrolled in private schools, with 976 (72.4% in the age bracket) enrolled. Conversely, the age group of 20 to 24 year olds has the lowest likelihood of being enrolled in a private school, with 927 (77.5% in the age bracket) attending a public institution.
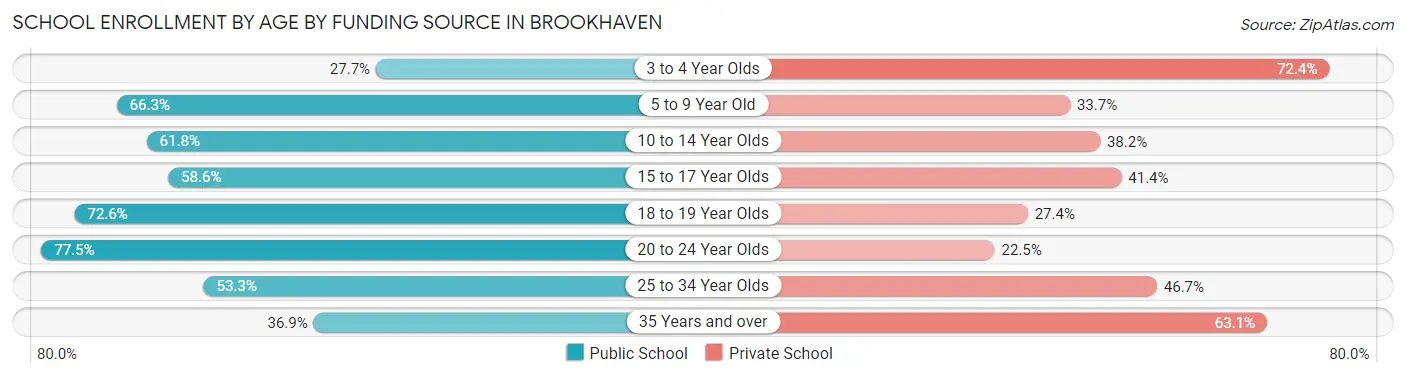
| Age Bracket | Public School | Private School |
| 3 to 4 Year Olds | 373 (27.7%) | 976 (72.4%) |
| 5 to 9 Year Old | 2,349 (66.3%) | 1,195 (33.7%) |
| 10 to 14 Year Olds | 1,547 (61.8%) | 956 (38.2%) |
| 15 to 17 Year Olds | 745 (58.6%) | 526 (41.4%) |
| 18 to 19 Year Olds | 598 (72.6%) | 226 (27.4%) |
| 20 to 24 Year Olds | 927 (77.5%) | 269 (22.5%) |
| 25 to 34 Year Olds | 497 (53.3%) | 435 (46.7%) |
| 35 Years and over | 164 (36.9%) | 280 (63.1%) |
| Total | 7,202 (59.7%) | 4,861 (40.3%) |
Educational Attainment by Field of Study in Brookhaven
Business (9,090 | 29.1%), social sciences (2,999 | 9.6%), engineering (2,770 | 8.9%), science & technology (2,076 | 6.6%), and bio, nature & agricultural (1,999 | 6.4%) are the most common fields of study among 31,281 individuals in Brookhaven who have obtained a bachelor's degree or higher.
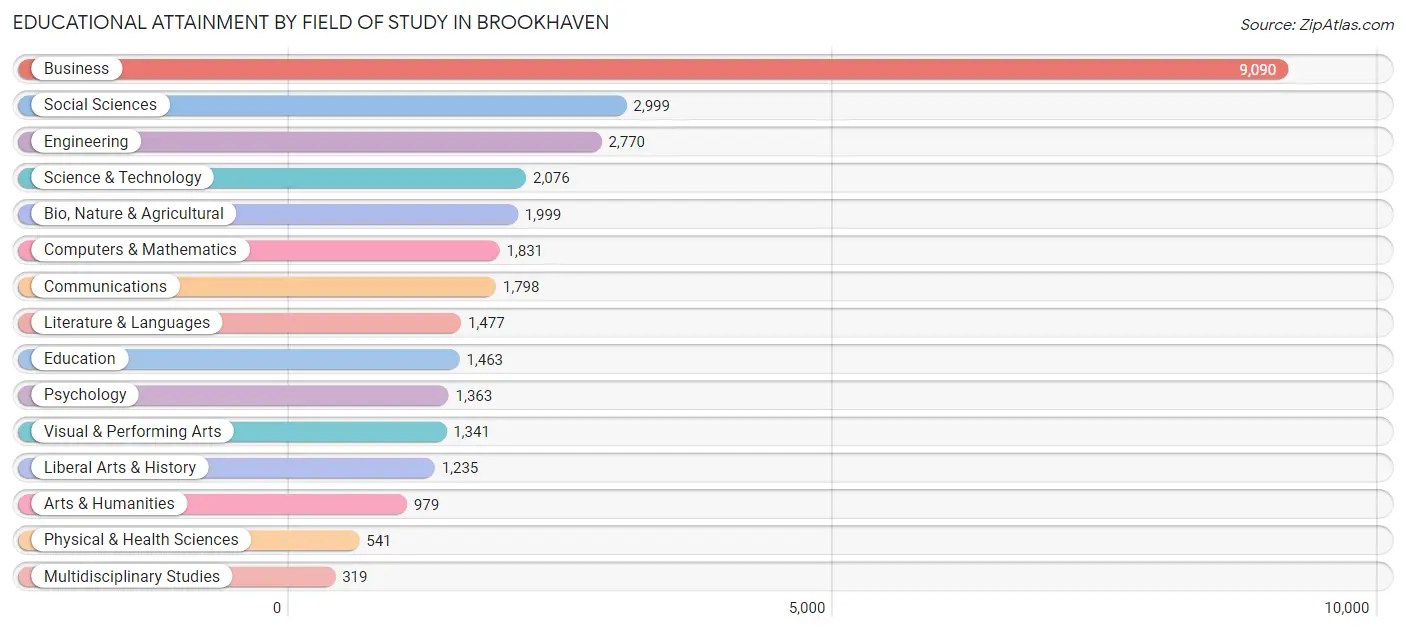
| Field of Study | # Graduates | % Graduates |
| Computers & Mathematics | 1,831 | 5.9% |
| Bio, Nature & Agricultural | 1,999 | 6.4% |
| Physical & Health Sciences | 541 | 1.7% |
| Psychology | 1,363 | 4.4% |
| Social Sciences | 2,999 | 9.6% |
| Engineering | 2,770 | 8.9% |
| Multidisciplinary Studies | 319 | 1.0% |
| Science & Technology | 2,076 | 6.6% |
| Business | 9,090 | 29.1% |
| Education | 1,463 | 4.7% |
| Literature & Languages | 1,477 | 4.7% |
| Liberal Arts & History | 1,235 | 4.0% |
| Visual & Performing Arts | 1,341 | 4.3% |
| Communications | 1,798 | 5.8% |
| Arts & Humanities | 979 | 3.1% |
| Total | 31,281 | 100.0% |
Transportation & Commute in Brookhaven
Vehicle Availability by Sex in Brookhaven
The most prevalent vehicle ownership categories in Brookhaven are males with 2 vehicles (8,403, accounting for 49.1%) and females with 2 vehicles (7,768, making up 52.5%).
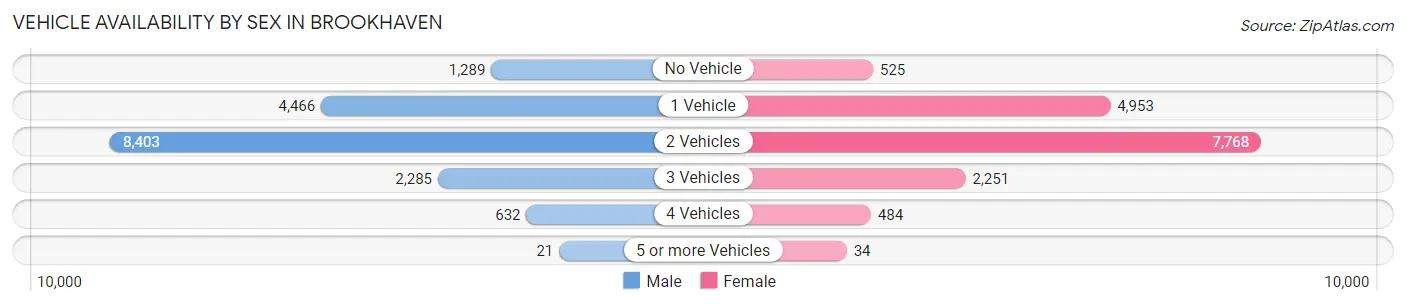
| Vehicles Available | Male | Female |
| No Vehicle | 1,289 (7.5%) | 525 (3.3%) |
| 1 Vehicle | 4,466 (26.1%) | 4,953 (30.9%) |
| 2 Vehicles | 8,403 (49.1%) | 7,768 (48.5%) |
| 3 Vehicles | 2,285 (13.4%) | 2,251 (14.1%) |
| 4 Vehicles | 632 (3.7%) | 484 (3.0%) |
| 5 or more Vehicles | 21 (0.1%) | 34 (0.2%) |
| Total | 17,096 (100.0%) | 16,015 (100.0%) |
Commute Time in Brookhaven
The most frequently occuring commute durations in Brookhaven are 15 to 19 minutes (4,750 commuters, 19.3%), 20 to 24 minutes (4,672 commuters, 18.9%), and 30 to 34 minutes (4,282 commuters, 17.4%).
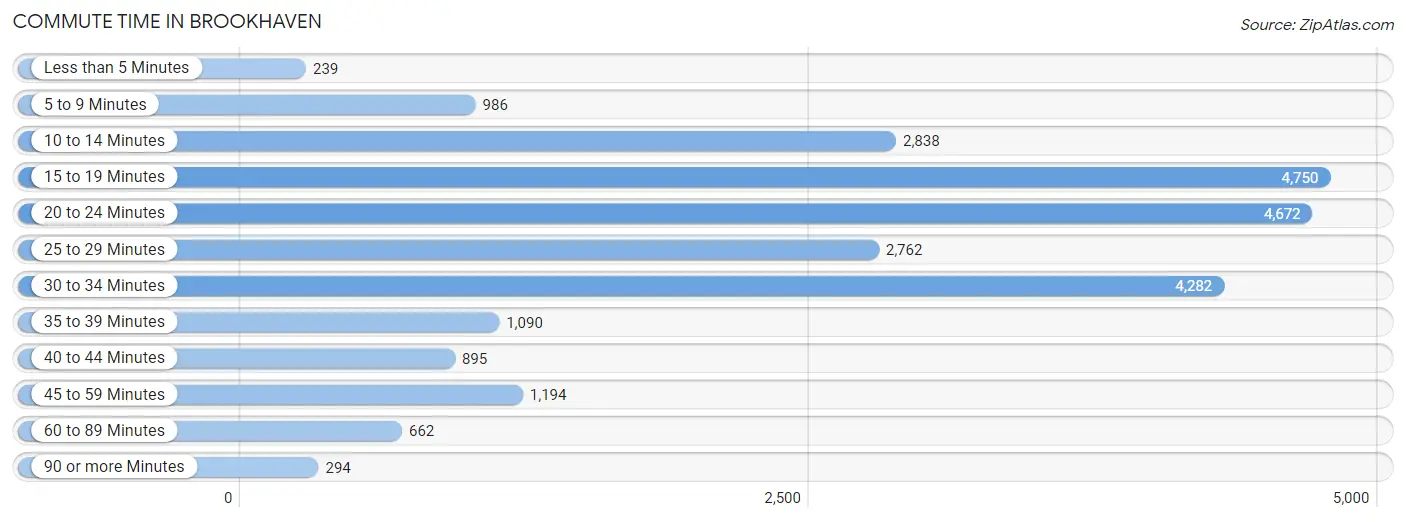
| Commute Time | # Commuters | % Commuters |
| Less than 5 Minutes | 239 | 1.0% |
| 5 to 9 Minutes | 986 | 4.0% |
| 10 to 14 Minutes | 2,838 | 11.5% |
| 15 to 19 Minutes | 4,750 | 19.3% |
| 20 to 24 Minutes | 4,672 | 18.9% |
| 25 to 29 Minutes | 2,762 | 11.2% |
| 30 to 34 Minutes | 4,282 | 17.4% |
| 35 to 39 Minutes | 1,090 | 4.4% |
| 40 to 44 Minutes | 895 | 3.6% |
| 45 to 59 Minutes | 1,194 | 4.8% |
| 60 to 89 Minutes | 662 | 2.7% |
| 90 or more Minutes | 294 | 1.2% |
Commute Time by Sex in Brookhaven
The most common commute times in Brookhaven are 20 to 24 minutes (2,926 commuters, 22.4%) for males and 15 to 19 minutes (2,528 commuters, 21.8%) for females.
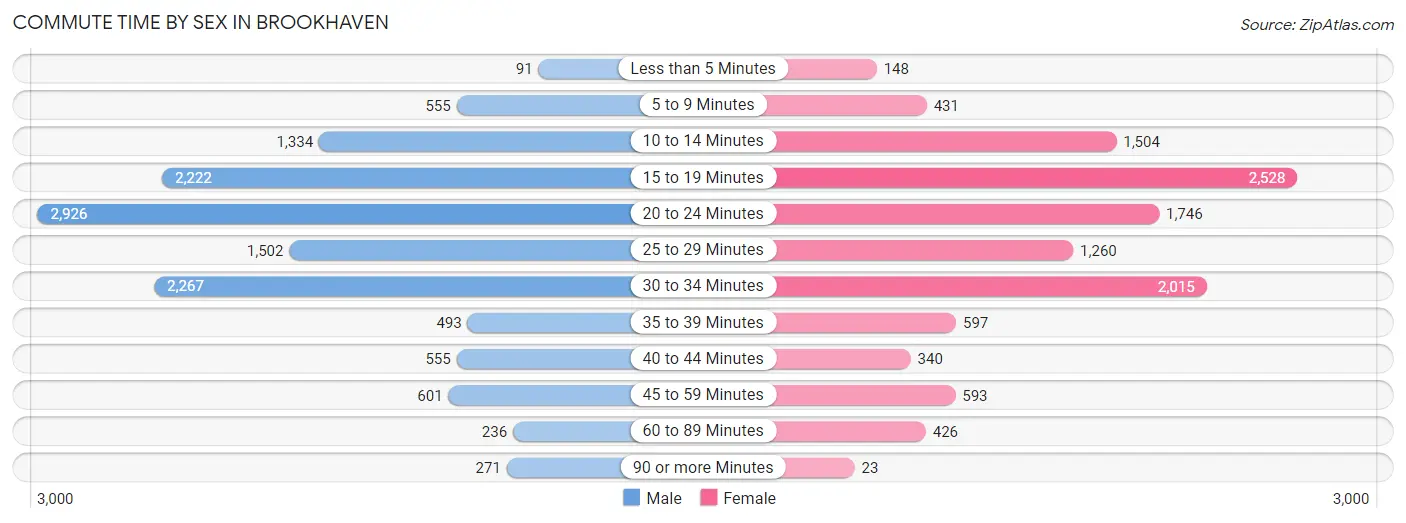
| Commute Time | Male | Female |
| Less than 5 Minutes | 91 (0.7%) | 148 (1.3%) |
| 5 to 9 Minutes | 555 (4.3%) | 431 (3.7%) |
| 10 to 14 Minutes | 1,334 (10.2%) | 1,504 (13.0%) |
| 15 to 19 Minutes | 2,222 (17.0%) | 2,528 (21.8%) |
| 20 to 24 Minutes | 2,926 (22.4%) | 1,746 (15.0%) |
| 25 to 29 Minutes | 1,502 (11.5%) | 1,260 (10.8%) |
| 30 to 34 Minutes | 2,267 (17.4%) | 2,015 (17.3%) |
| 35 to 39 Minutes | 493 (3.8%) | 597 (5.1%) |
| 40 to 44 Minutes | 555 (4.3%) | 340 (2.9%) |
| 45 to 59 Minutes | 601 (4.6%) | 593 (5.1%) |
| 60 to 89 Minutes | 236 (1.8%) | 426 (3.7%) |
| 90 or more Minutes | 271 (2.1%) | 23 (0.2%) |
Time of Departure to Work by Sex in Brookhaven
The most frequent times of departure to work in Brookhaven are 8:00 AM to 8:29 AM (2,844, 21.8%) for males and 8:00 AM to 8:29 AM (2,487, 21.4%) for females.
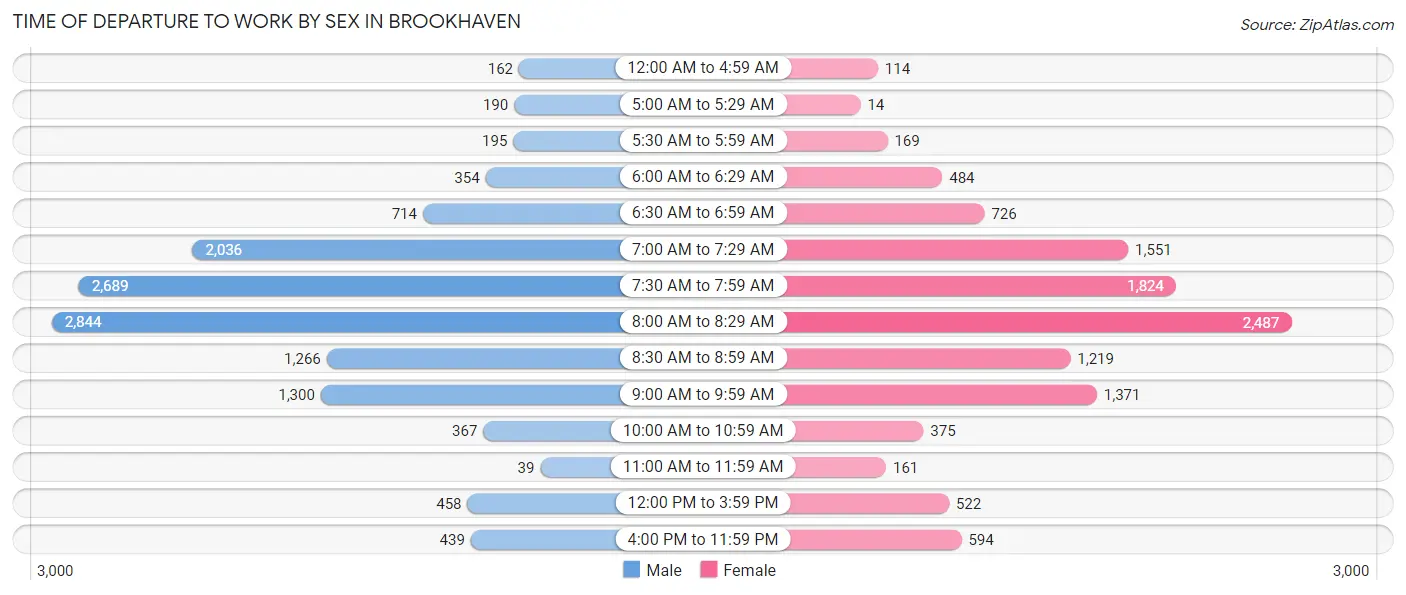
| Time of Departure | Male | Female |
| 12:00 AM to 4:59 AM | 162 (1.2%) | 114 (1.0%) |
| 5:00 AM to 5:29 AM | 190 (1.5%) | 14 (0.1%) |
| 5:30 AM to 5:59 AM | 195 (1.5%) | 169 (1.5%) |
| 6:00 AM to 6:29 AM | 354 (2.7%) | 484 (4.2%) |
| 6:30 AM to 6:59 AM | 714 (5.5%) | 726 (6.2%) |
| 7:00 AM to 7:29 AM | 2,036 (15.6%) | 1,551 (13.4%) |
| 7:30 AM to 7:59 AM | 2,689 (20.6%) | 1,824 (15.7%) |
| 8:00 AM to 8:29 AM | 2,844 (21.8%) | 2,487 (21.4%) |
| 8:30 AM to 8:59 AM | 1,266 (9.7%) | 1,219 (10.5%) |
| 9:00 AM to 9:59 AM | 1,300 (10.0%) | 1,371 (11.8%) |
| 10:00 AM to 10:59 AM | 367 (2.8%) | 375 (3.2%) |
| 11:00 AM to 11:59 AM | 39 (0.3%) | 161 (1.4%) |
| 12:00 PM to 3:59 PM | 458 (3.5%) | 522 (4.5%) |
| 4:00 PM to 11:59 PM | 439 (3.4%) | 594 (5.1%) |
| Total | 13,053 (100.0%) | 11,611 (100.0%) |
Housing Occupancy in Brookhaven
Occupancy by Ownership in Brookhaven
Of the total 24,369 dwellings in Brookhaven, owner-occupied units account for 13,301 (54.6%), while renter-occupied units make up 11,068 (45.4%).
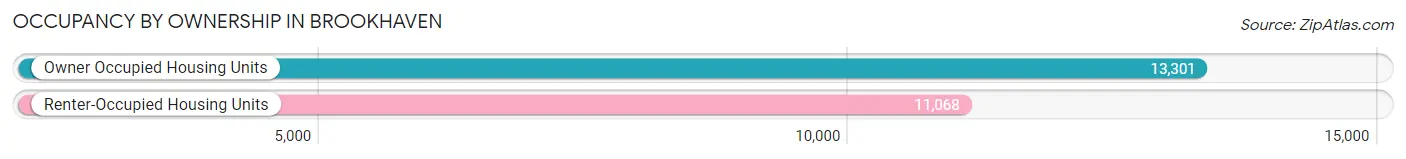
| Occupancy | # Housing Units | % Housing Units |
| Owner Occupied Housing Units | 13,301 | 54.6% |
| Renter-Occupied Housing Units | 11,068 | 45.4% |
| Total Occupied Housing Units | 24,369 | 100.0% |
Occupancy by Household Size in Brookhaven
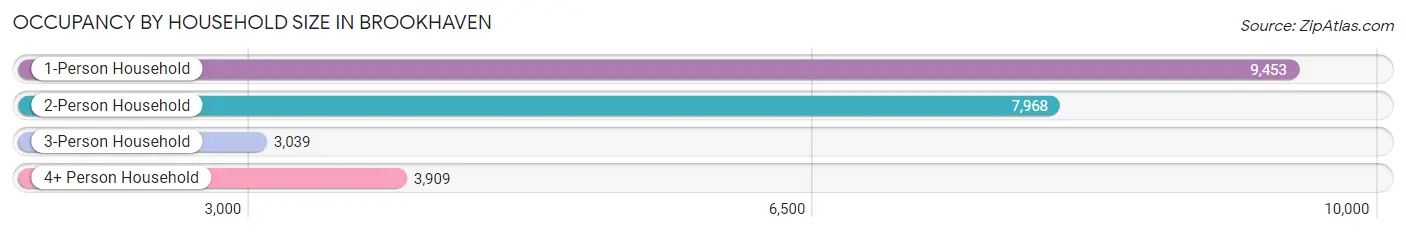
| Household Size | # Housing Units | % Housing Units |
| 1-Person Household | 9,453 | 38.8% |
| 2-Person Household | 7,968 | 32.7% |
| 3-Person Household | 3,039 | 12.5% |
| 4+ Person Household | 3,909 | 16.0% |
| Total Housing Units | 24,369 | 100.0% |
Occupancy by Ownership by Household Size in Brookhaven
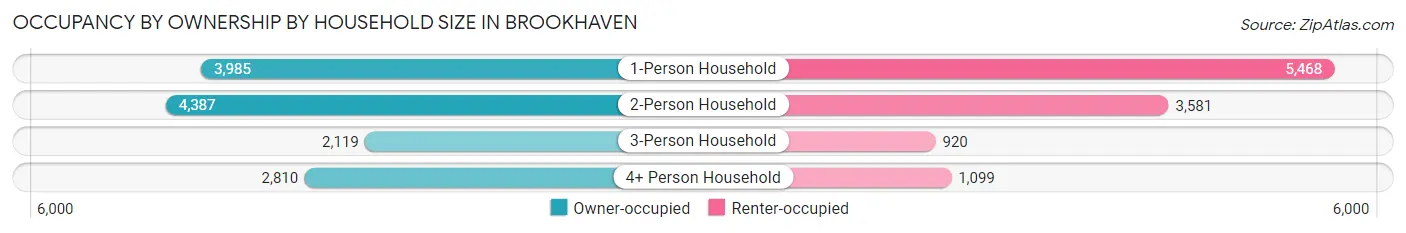
| Household Size | Owner-occupied | Renter-occupied |
| 1-Person Household | 3,985 (42.2%) | 5,468 (57.8%) |
| 2-Person Household | 4,387 (55.1%) | 3,581 (44.9%) |
| 3-Person Household | 2,119 (69.7%) | 920 (30.3%) |
| 4+ Person Household | 2,810 (71.9%) | 1,099 (28.1%) |
| Total Housing Units | 13,301 (54.6%) | 11,068 (45.4%) |
Occupancy by Educational Attainment in Brookhaven
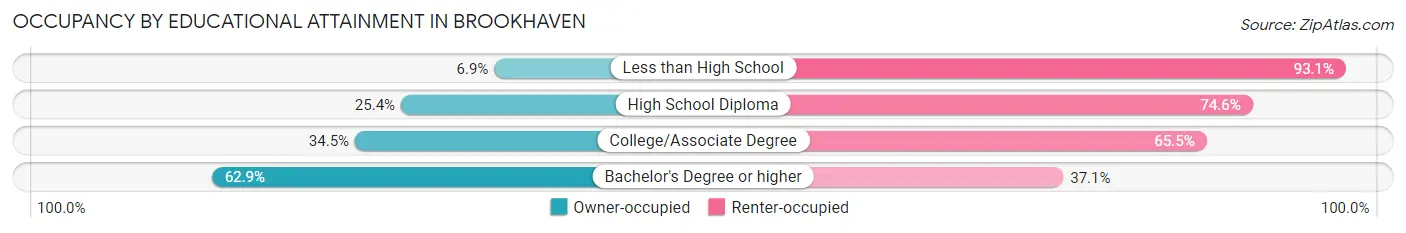
| Household Size | Owner-occupied | Renter-occupied |
| Less than High School | 80 (6.9%) | 1,080 (93.1%) |
| High School Diploma | 469 (25.4%) | 1,378 (74.6%) |
| College/Associate Degree | 833 (34.5%) | 1,581 (65.5%) |
| Bachelor's Degree or higher | 11,919 (62.9%) | 7,029 (37.1%) |
Occupancy by Age of Householder in Brookhaven
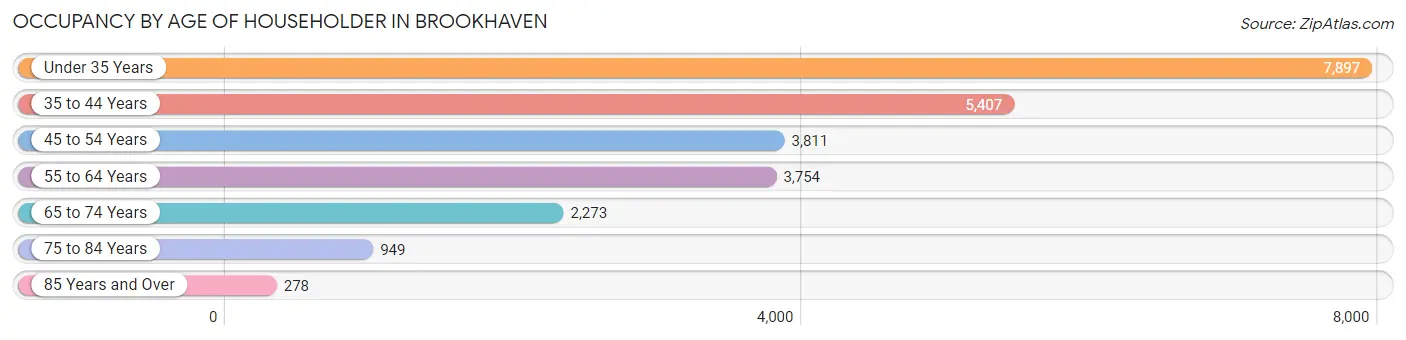
| Age Bracket | # Households | % Households |
| Under 35 Years | 7,897 | 32.4% |
| 35 to 44 Years | 5,407 | 22.2% |
| 45 to 54 Years | 3,811 | 15.6% |
| 55 to 64 Years | 3,754 | 15.4% |
| 65 to 74 Years | 2,273 | 9.3% |
| 75 to 84 Years | 949 | 3.9% |
| 85 Years and Over | 278 | 1.1% |
| Total | 24,369 | 100.0% |
Housing Finances in Brookhaven
Median Income by Occupancy in Brookhaven
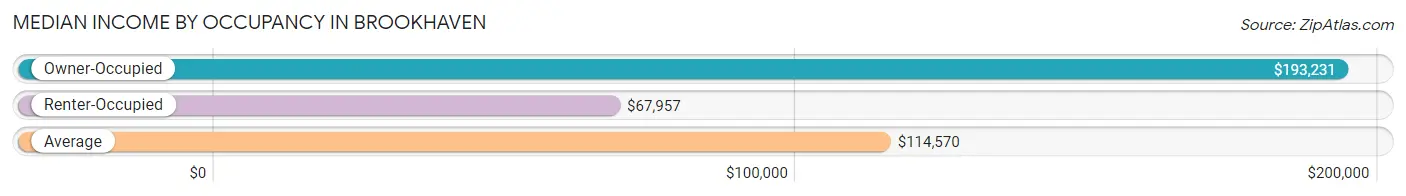
| Occupancy Type | # Households | Median Income |
| Owner-Occupied | 13,301 (54.6%) | $193,231 |
| Renter-Occupied | 11,068 (45.4%) | $67,957 |
| Average | 24,369 (100.0%) | $114,570 |
Occupancy by Householder Income Bracket in Brookhaven
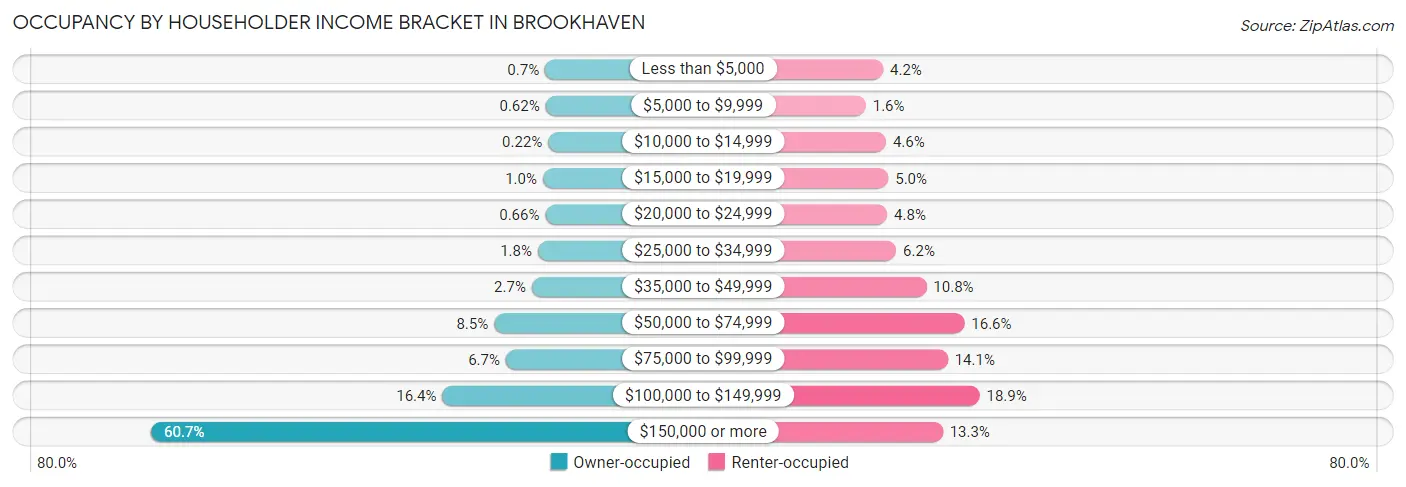
| Income Bracket | Owner-occupied | Renter-occupied |
| Less than $5,000 | 93 (0.7%) | 465 (4.2%) |
| $5,000 to $9,999 | 82 (0.6%) | 173 (1.6%) |
| $10,000 to $14,999 | 29 (0.2%) | 514 (4.6%) |
| $15,000 to $19,999 | 138 (1.0%) | 552 (5.0%) |
| $20,000 to $24,999 | 88 (0.7%) | 533 (4.8%) |
| $25,000 to $34,999 | 240 (1.8%) | 685 (6.2%) |
| $35,000 to $49,999 | 362 (2.7%) | 1,195 (10.8%) |
| $50,000 to $74,999 | 1,127 (8.5%) | 1,835 (16.6%) |
| $75,000 to $99,999 | 889 (6.7%) | 1,555 (14.1%) |
| $100,000 to $149,999 | 2,175 (16.4%) | 2,091 (18.9%) |
| $150,000 or more | 8,078 (60.7%) | 1,470 (13.3%) |
| Total | 13,301 (100.0%) | 11,068 (100.0%) |
Monthly Housing Cost Tiers in Brookhaven

| Monthly Cost | Owner-occupied | Renter-occupied |
| Less than $300 | 79 (0.6%) | 345 (3.1%) |
| $300 to $499 | 520 (3.9%) | 181 (1.6%) |
| $500 to $799 | 656 (4.9%) | 131 (1.2%) |
| $800 to $999 | 944 (7.1%) | 83 (0.7%) |
| $1,000 to $1,499 | 1,527 (11.5%) | 2,611 (23.6%) |
| $1,500 to $1,999 | 1,183 (8.9%) | 5,040 (45.5%) |
| $2,000 to $2,499 | 1,768 (13.3%) | 1,655 (14.9%) |
| $2,500 to $2,999 | 1,690 (12.7%) | 436 (3.9%) |
| $3,000 or more | 4,934 (37.1%) | 469 (4.2%) |
| Total | 13,301 (100.0%) | 11,068 (100.0%) |
Physical Housing Characteristics in Brookhaven
Housing Structures in Brookhaven
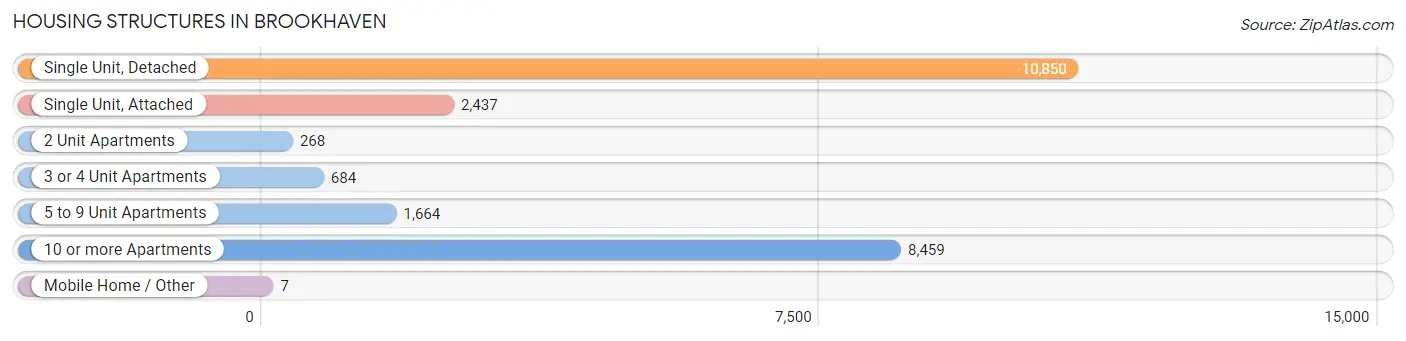
| Structure Type | # Housing Units | % Housing Units |
| Single Unit, Detached | 10,850 | 44.5% |
| Single Unit, Attached | 2,437 | 10.0% |
| 2 Unit Apartments | 268 | 1.1% |
| 3 or 4 Unit Apartments | 684 | 2.8% |
| 5 to 9 Unit Apartments | 1,664 | 6.8% |
| 10 or more Apartments | 8,459 | 34.7% |
| Mobile Home / Other | 7 | 0.0% |
| Total | 24,369 | 100.0% |
Housing Structures by Occupancy in Brookhaven
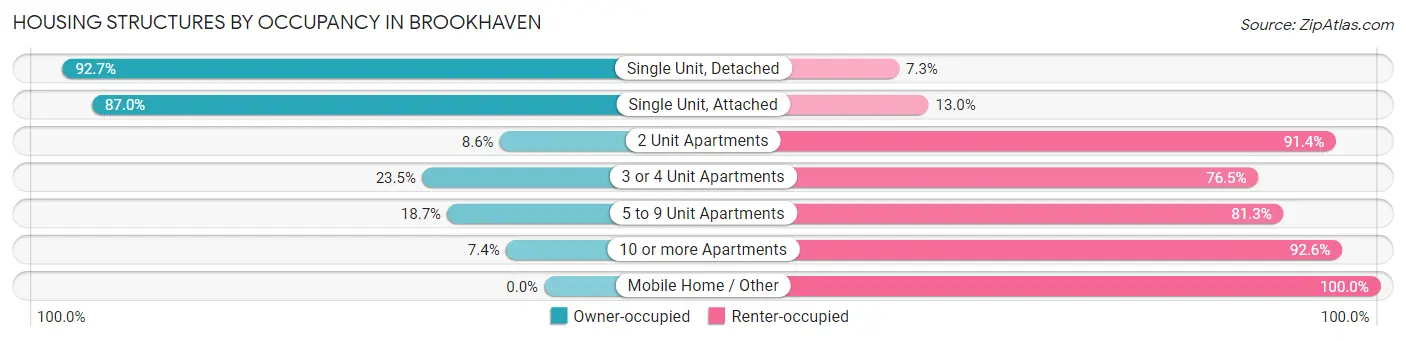
| Structure Type | Owner-occupied | Renter-occupied |
| Single Unit, Detached | 10,058 (92.7%) | 792 (7.3%) |
| Single Unit, Attached | 2,121 (87.0%) | 316 (13.0%) |
| 2 Unit Apartments | 23 (8.6%) | 245 (91.4%) |
| 3 or 4 Unit Apartments | 161 (23.5%) | 523 (76.5%) |
| 5 to 9 Unit Apartments | 311 (18.7%) | 1,353 (81.3%) |
| 10 or more Apartments | 627 (7.4%) | 7,832 (92.6%) |
| Mobile Home / Other | 0 (0.0%) | 7 (100.0%) |
| Total | 13,301 (54.6%) | 11,068 (45.4%) |
Housing Structures by Number of Rooms in Brookhaven
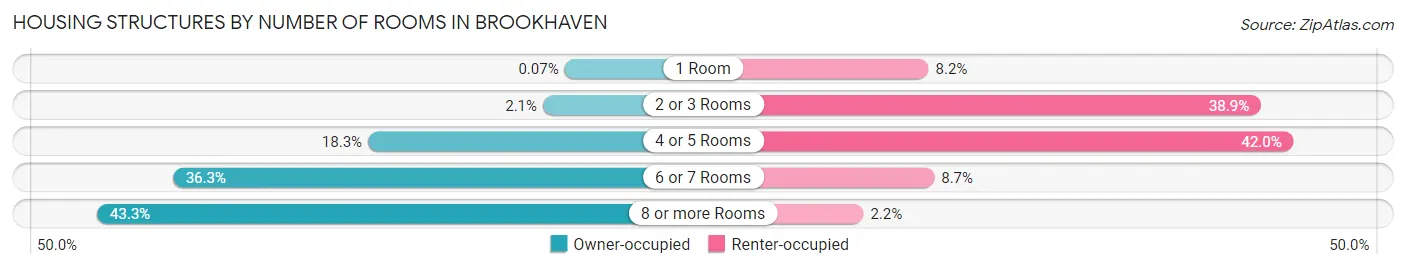
| Number of Rooms | Owner-occupied | Renter-occupied |
| 1 Room | 9 (0.1%) | 908 (8.2%) |
| 2 or 3 Rooms | 275 (2.1%) | 4,310 (38.9%) |
| 4 or 5 Rooms | 2,428 (18.2%) | 4,643 (41.9%) |
| 6 or 7 Rooms | 4,828 (36.3%) | 966 (8.7%) |
| 8 or more Rooms | 5,761 (43.3%) | 241 (2.2%) |
| Total | 13,301 (100.0%) | 11,068 (100.0%) |
Housing Structure by Heating Type in Brookhaven
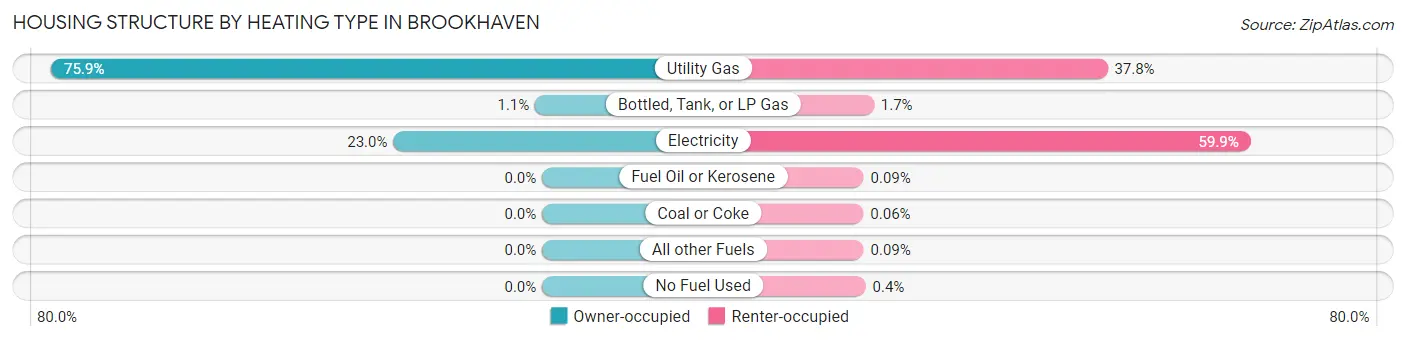
| Heating Type | Owner-occupied | Renter-occupied |
| Utility Gas | 10,097 (75.9%) | 4,181 (37.8%) |
| Bottled, Tank, or LP Gas | 144 (1.1%) | 185 (1.7%) |
| Electricity | 3,060 (23.0%) | 6,631 (59.9%) |
| Fuel Oil or Kerosene | 0 (0.0%) | 10 (0.1%) |
| Coal or Coke | 0 (0.0%) | 7 (0.1%) |
| All other Fuels | 0 (0.0%) | 10 (0.1%) |
| No Fuel Used | 0 (0.0%) | 44 (0.4%) |
| Total | 13,301 (100.0%) | 11,068 (100.0%) |
Household Vehicle Usage in Brookhaven
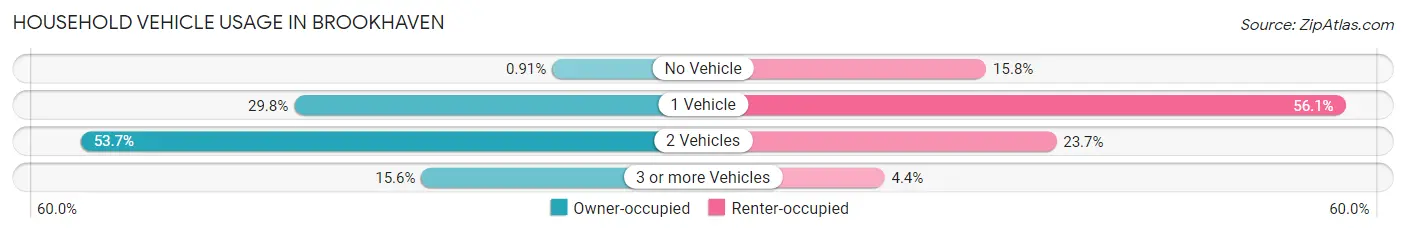
| Vehicles per Household | Owner-occupied | Renter-occupied |
| No Vehicle | 121 (0.9%) | 1,751 (15.8%) |
| 1 Vehicle | 3,967 (29.8%) | 6,205 (56.1%) |
| 2 Vehicles | 7,144 (53.7%) | 2,621 (23.7%) |
| 3 or more Vehicles | 2,069 (15.6%) | 491 (4.4%) |
| Total | 13,301 (100.0%) | 11,068 (100.0%) |
Real Estate & Mortgages in Brookhaven
Real Estate and Mortgage Overview in Brookhaven
| Characteristic | Without Mortgage | With Mortgage |
| Housing Units | 3,362 | 9,939 |
| Median Property Value | $584,300 | $639,400 |
| Median Household Income | $127,770 | $6,681 |
| Monthly Housing Costs | $935 | $4,934 |
| Real Estate Taxes | $5,564 | $83 |
Property Value by Mortgage Status in Brookhaven
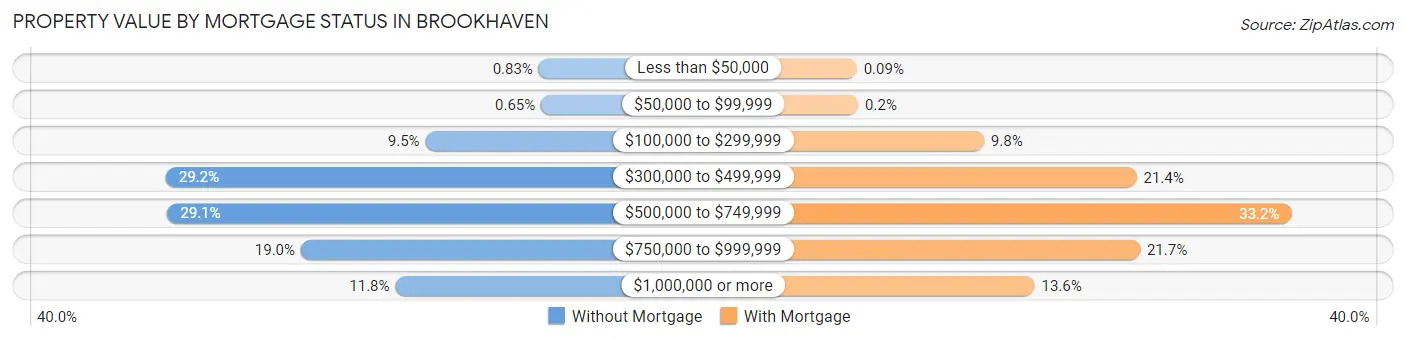
| Property Value | Without Mortgage | With Mortgage |
| Less than $50,000 | 28 (0.8%) | 9 (0.1%) |
| $50,000 to $99,999 | 22 (0.6%) | 20 (0.2%) |
| $100,000 to $299,999 | 318 (9.5%) | 972 (9.8%) |
| $300,000 to $499,999 | 983 (29.2%) | 2,128 (21.4%) |
| $500,000 to $749,999 | 979 (29.1%) | 3,300 (33.2%) |
| $750,000 to $999,999 | 637 (19.0%) | 2,154 (21.7%) |
| $1,000,000 or more | 395 (11.7%) | 1,356 (13.6%) |
| Total | 3,362 (100.0%) | 9,939 (100.0%) |
Household Income by Mortgage Status in Brookhaven
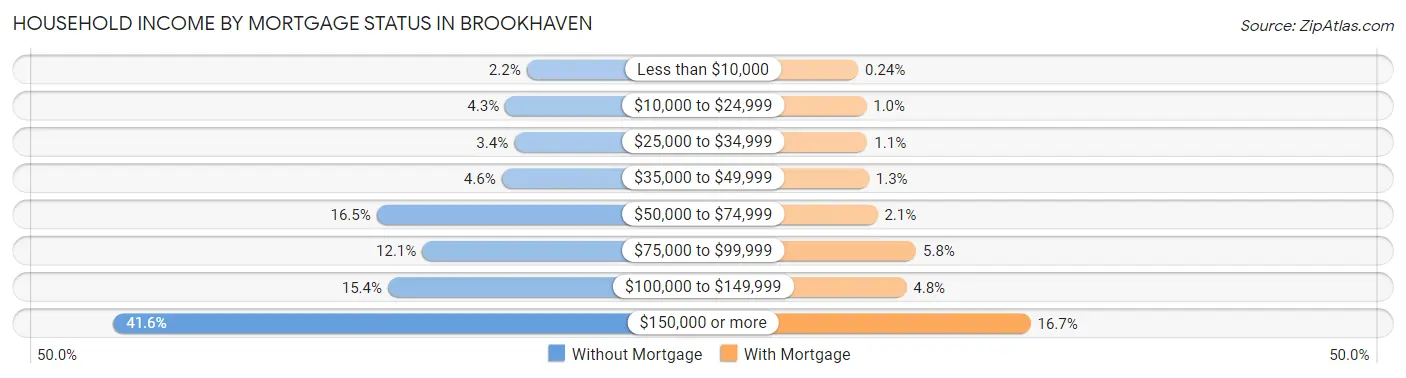
| Household Income | Without Mortgage | With Mortgage |
| Less than $10,000 | 74 (2.2%) | 24 (0.2%) |
| $10,000 to $24,999 | 143 (4.3%) | 101 (1.0%) |
| $25,000 to $34,999 | 114 (3.4%) | 112 (1.1%) |
| $35,000 to $49,999 | 154 (4.6%) | 126 (1.3%) |
| $50,000 to $74,999 | 554 (16.5%) | 208 (2.1%) |
| $75,000 to $99,999 | 408 (12.1%) | 573 (5.8%) |
| $100,000 to $149,999 | 518 (15.4%) | 481 (4.8%) |
| $150,000 or more | 1,397 (41.5%) | 1,657 (16.7%) |
| Total | 3,362 (100.0%) | 9,939 (100.0%) |
Property Value to Household Income Ratio in Brookhaven
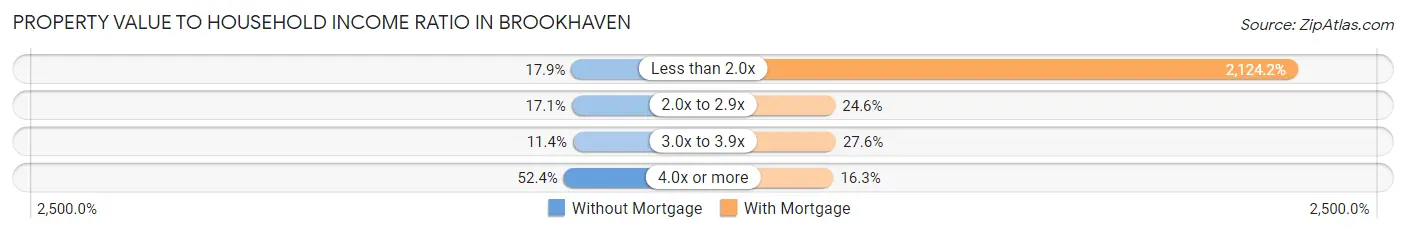
| Value-to-Income Ratio | Without Mortgage | With Mortgage |
| Less than 2.0x | 602 (17.9%) | 211,124 (2,124.2%) |
| 2.0x to 2.9x | 575 (17.1%) | 2,442 (24.6%) |
| 3.0x to 3.9x | 382 (11.4%) | 2,740 (27.6%) |
| 4.0x or more | 1,763 (52.4%) | 1,619 (16.3%) |
| Total | 3,362 (100.0%) | 9,939 (100.0%) |
Real Estate Taxes by Mortgage Status in Brookhaven
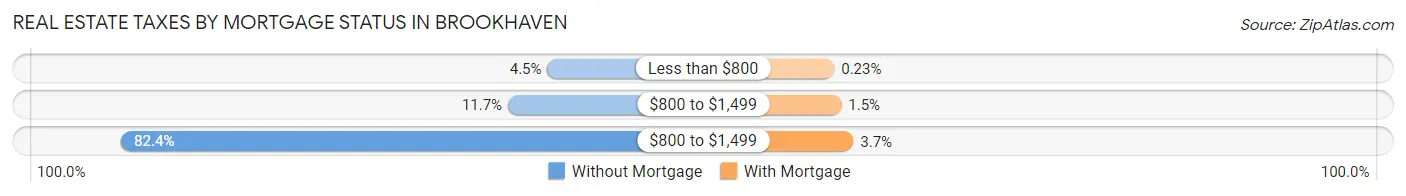
| Property Taxes | Without Mortgage | With Mortgage |
| Less than $800 | 152 (4.5%) | 23 (0.2%) |
| $800 to $1,499 | 394 (11.7%) | 151 (1.5%) |
| $800 to $1,499 | 2,769 (82.4%) | 369 (3.7%) |
| Total | 3,362 (100.0%) | 9,939 (100.0%) |
Health & Disability in Brookhaven
Health Insurance Coverage by Age in Brookhaven
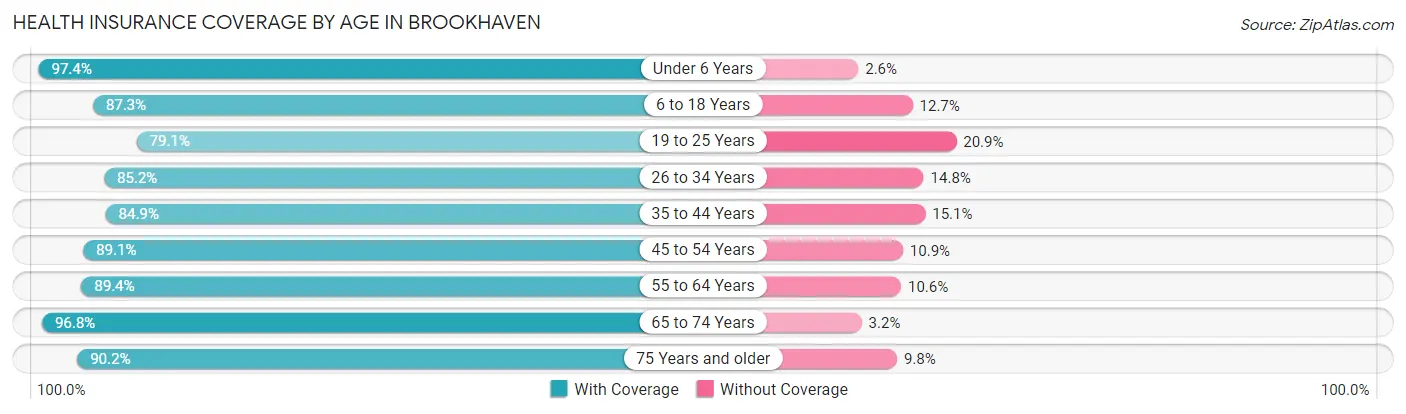
| Age Bracket | With Coverage | Without Coverage |
| Under 6 Years | 5,673 (97.4%) | 152 (2.6%) |
| 6 to 18 Years | 6,367 (87.3%) | 930 (12.7%) |
| 19 to 25 Years | 4,204 (79.1%) | 1,110 (20.9%) |
| 26 to 34 Years | 8,954 (85.2%) | 1,556 (14.8%) |
| 35 to 44 Years | 7,867 (84.9%) | 1,400 (15.1%) |
| 45 to 54 Years | 5,567 (89.1%) | 683 (10.9%) |
| 55 to 64 Years | 5,861 (89.4%) | 694 (10.6%) |
| 65 to 74 Years | 3,406 (96.8%) | 114 (3.2%) |
| 75 Years and older | 1,928 (90.2%) | 210 (9.8%) |
| Total | 49,827 (87.9%) | 6,849 (12.1%) |
Health Insurance Coverage by Citizenship Status in Brookhaven
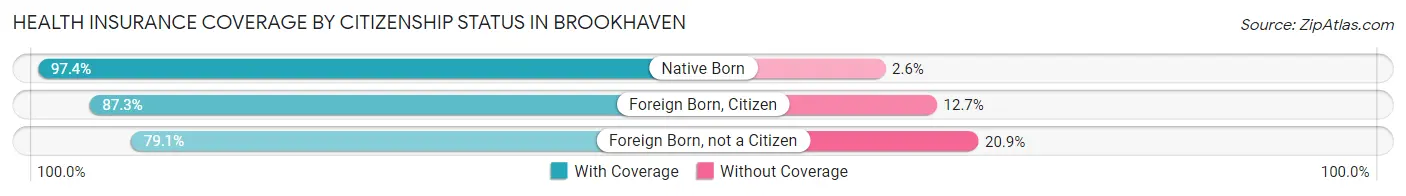
| Citizenship Status | With Coverage | Without Coverage |
| Native Born | 5,673 (97.4%) | 152 (2.6%) |
| Foreign Born, Citizen | 6,367 (87.3%) | 930 (12.7%) |
| Foreign Born, not a Citizen | 4,204 (79.1%) | 1,110 (20.9%) |
Health Insurance Coverage by Household Income in Brookhaven
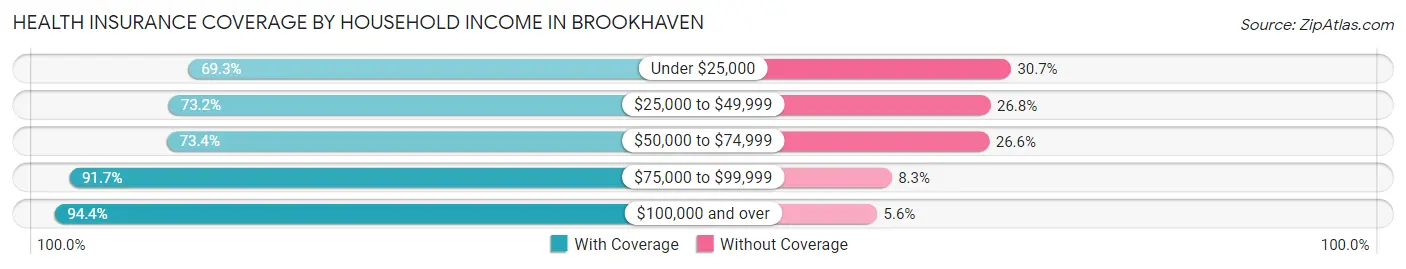
| Household Income | With Coverage | Without Coverage |
| Under $25,000 | 3,917 (69.3%) | 1,732 (30.7%) |
| $25,000 to $49,999 | 3,617 (73.2%) | 1,326 (26.8%) |
| $50,000 to $74,999 | 3,888 (73.4%) | 1,410 (26.6%) |
| $75,000 to $99,999 | 3,835 (91.7%) | 348 (8.3%) |
| $100,000 and over | 34,020 (94.4%) | 2,011 (5.6%) |
Public vs Private Health Insurance Coverage by Age in Brookhaven
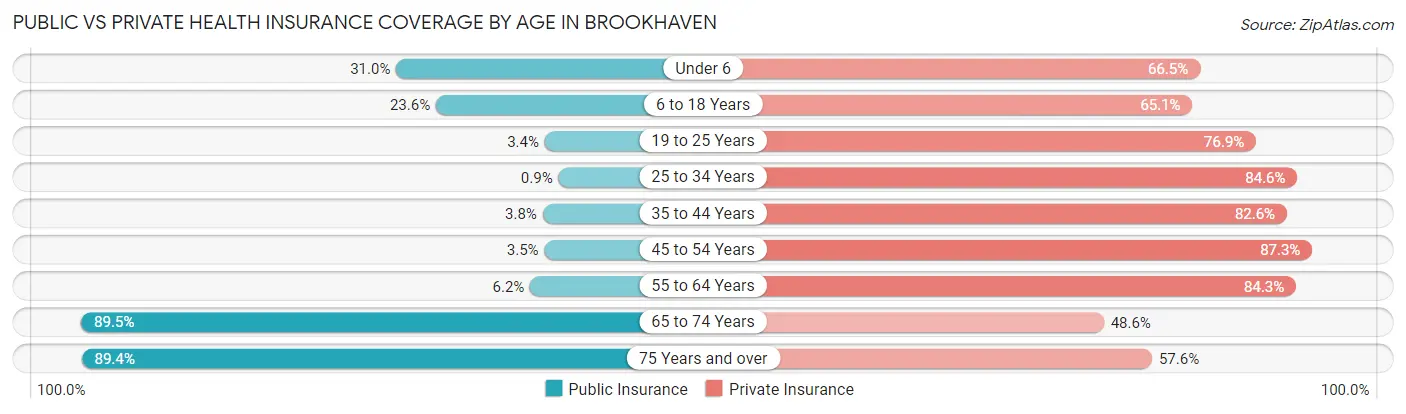
| Age Bracket | Public Insurance | Private Insurance |
| Under 6 | 1,807 (31.0%) | 3,873 (66.5%) |
| 6 to 18 Years | 1,725 (23.6%) | 4,749 (65.1%) |
| 19 to 25 Years | 183 (3.4%) | 4,087 (76.9%) |
| 25 to 34 Years | 95 (0.9%) | 8,886 (84.6%) |
| 35 to 44 Years | 355 (3.8%) | 7,656 (82.6%) |
| 45 to 54 Years | 220 (3.5%) | 5,457 (87.3%) |
| 55 to 64 Years | 404 (6.2%) | 5,527 (84.3%) |
| 65 to 74 Years | 3,151 (89.5%) | 1,711 (48.6%) |
| 75 Years and over | 1,912 (89.4%) | 1,231 (57.6%) |
| Total | 9,852 (17.4%) | 43,177 (76.2%) |
Disability Status by Sex by Age in Brookhaven
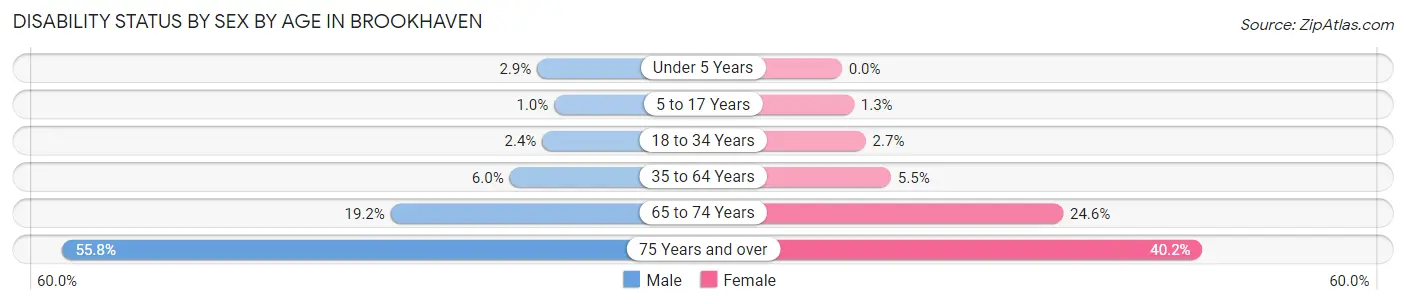
| Age Bracket | Male | Female |
| Under 5 Years | 74 (2.9%) | 0 (0.0%) |
| 5 to 17 Years | 36 (1.0%) | 57 (1.3%) |
| 18 to 34 Years | 166 (2.4%) | 247 (2.7%) |
| 35 to 64 Years | 702 (6.0%) | 567 (5.5%) |
| 65 to 74 Years | 268 (19.2%) | 524 (24.6%) |
| 75 Years and over | 555 (55.8%) | 459 (40.2%) |
Disability Class by Sex by Age in Brookhaven
Disability Class: Hearing Difficulty
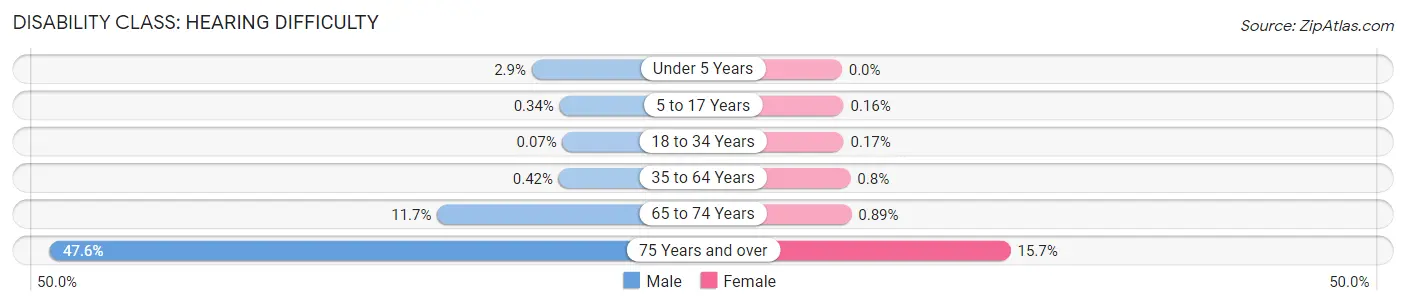
| Age Bracket | Male | Female |
| Under 5 Years | 74 (2.9%) | 0 (0.0%) |
| 5 to 17 Years | 12 (0.3%) | 7 (0.2%) |
| 18 to 34 Years | 5 (0.1%) | 16 (0.2%) |
| 35 to 64 Years | 49 (0.4%) | 83 (0.8%) |
| 65 to 74 Years | 163 (11.7%) | 19 (0.9%) |
| 75 Years and over | 474 (47.6%) | 179 (15.7%) |
Disability Class: Vision Difficulty
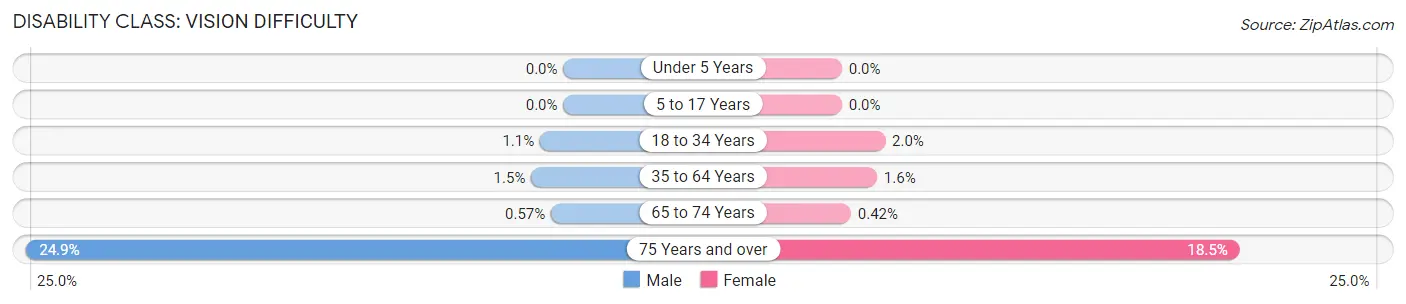
| Age Bracket | Male | Female |
| Under 5 Years | 0 (0.0%) | 0 (0.0%) |
| 5 to 17 Years | 0 (0.0%) | 0 (0.0%) |
| 18 to 34 Years | 76 (1.1%) | 187 (2.0%) |
| 35 to 64 Years | 174 (1.5%) | 169 (1.6%) |
| 65 to 74 Years | 8 (0.6%) | 9 (0.4%) |
| 75 Years and over | 248 (24.9%) | 211 (18.5%) |
Disability Class: Cognitive Difficulty
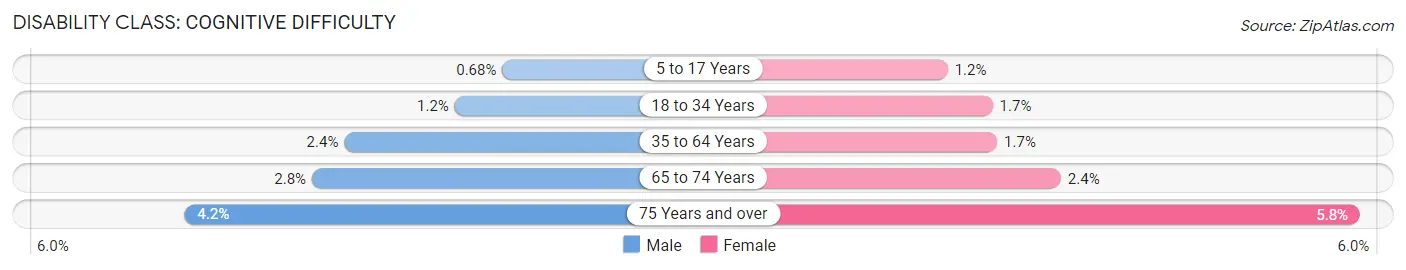
| Age Bracket | Male | Female |
| 5 to 17 Years | 24 (0.7%) | 50 (1.2%) |
| 18 to 34 Years | 85 (1.2%) | 156 (1.7%) |
| 35 to 64 Years | 285 (2.4%) | 180 (1.7%) |
| 65 to 74 Years | 39 (2.8%) | 52 (2.4%) |
| 75 Years and over | 42 (4.2%) | 66 (5.8%) |
Disability Class: Ambulatory Difficulty
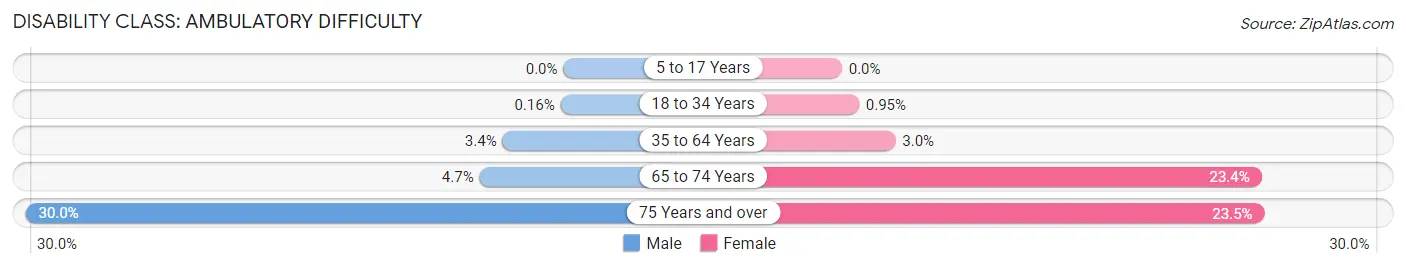
| Age Bracket | Male | Female |
| 5 to 17 Years | 0 (0.0%) | 0 (0.0%) |
| 18 to 34 Years | 11 (0.2%) | 88 (0.9%) |
| 35 to 64 Years | 396 (3.4%) | 309 (3.0%) |
| 65 to 74 Years | 65 (4.7%) | 497 (23.4%) |
| 75 Years and over | 298 (29.9%) | 269 (23.5%) |
Disability Class: Self-Care Difficulty
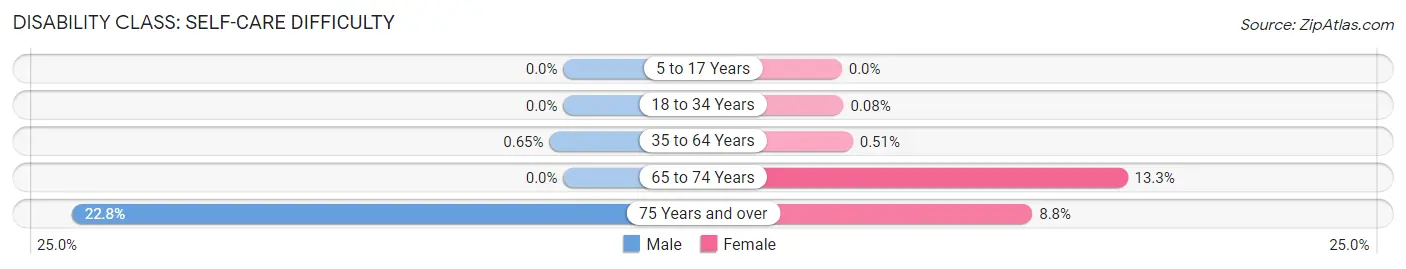
| Age Bracket | Male | Female |
| 5 to 17 Years | 0 (0.0%) | 0 (0.0%) |
| 18 to 34 Years | 0 (0.0%) | 7 (0.1%) |
| 35 to 64 Years | 76 (0.6%) | 53 (0.5%) |
| 65 to 74 Years | 0 (0.0%) | 282 (13.3%) |
| 75 Years and over | 227 (22.8%) | 101 (8.8%) |
Technology Access in Brookhaven
Computing Device Access in Brookhaven
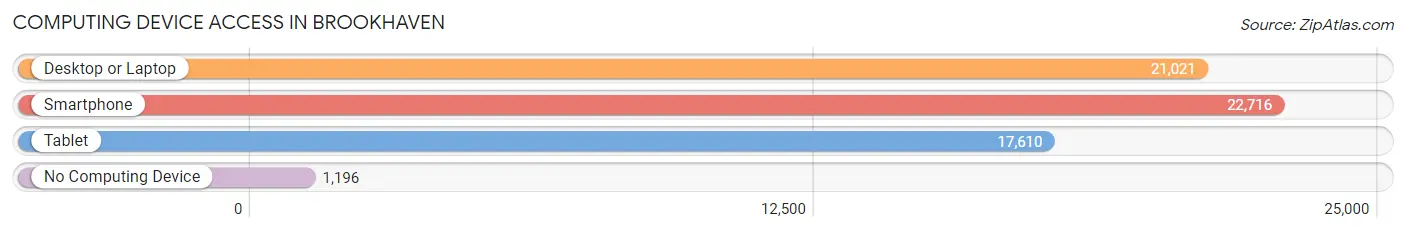
| Device Type | # Households | % Households |
| Desktop or Laptop | 21,021 | 86.3% |
| Smartphone | 22,716 | 93.2% |
| Tablet | 17,610 | 72.3% |
| No Computing Device | 1,196 | 4.9% |
| Total | 24,369 | 100.0% |
Internet Access in Brookhaven
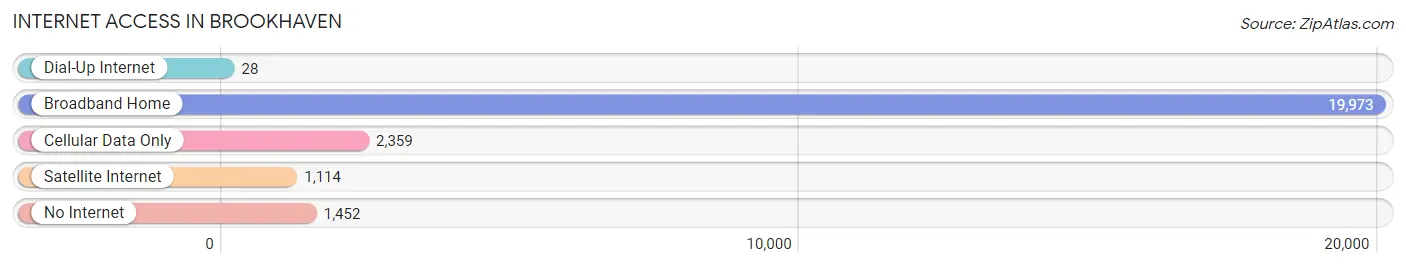
| Internet Type | # Households | % Households |
| Dial-Up Internet | 28 | 0.1% |
| Broadband Home | 19,973 | 82.0% |
| Cellular Data Only | 2,359 | 9.7% |
| Satellite Internet | 1,114 | 4.6% |
| No Internet | 1,452 | 6.0% |
| Total | 24,369 | 100.0% |
Brookhaven Summary
History
The city of Brookhaven, Georgia is located in the northern suburbs of Atlanta and is part of DeKalb County. The city was incorporated in December 2012, making it the newest city in the state of Georgia. Prior to its incorporation, the area was part of unincorporated DeKalb County.
The area that is now Brookhaven was originally inhabited by the Creek Indians. In the early 1800s, the area was settled by European-American settlers, who named the area Cross Keys after a local tavern. The area was later renamed to Brookhaven after the Revolutionary War hero, General John B. Brook.
In the late 1800s, the area began to develop as a residential suburb of Atlanta. The area was served by the Atlanta and Charlotte Air Line Railroad, which connected the area to Atlanta. The railroad was later replaced by the Atlanta and Richmond Air Line Railroad, which ran through the area until the 1950s.
In the early 1900s, the area began to develop as an affluent residential suburb of Atlanta. The area was home to many wealthy families, including the Candler family, who owned the Coca-Cola Company. The area was also home to many prominent businesses, including the Georgia Power Company and the Georgia Railroad and Banking Company.
In the 1950s, the area began to experience rapid growth as the city of Atlanta expanded. The area was annexed by the city of Atlanta in 1952, and the area was later incorporated as the city of Brookhaven in 2012.
Geography
Brookhaven is located in the northern suburbs of Atlanta, in DeKalb County. The city is bordered by the cities of Sandy Springs to the north, Dunwoody to the east, and Chamblee to the south. The city is located in the Piedmont region of Georgia, and is situated on the eastern edge of the Atlanta metropolitan area.
The city covers an area of approximately 12.5 square miles, and is located at an elevation of 1,000 feet above sea level. The city is located in the Chattahoochee River watershed, and is home to several creeks and streams, including Nancy Creek, Peachtree Creek, and South Fork Peachtree Creek.
The city is located in a humid subtropical climate zone, and experiences hot, humid summers and mild winters. The average annual temperature is 61 degrees Fahrenheit, and the average annual precipitation is 48 inches.
Economy
The economy of Brookhaven is largely driven by the city’s proximity to Atlanta. The city is home to several major employers, including Emory University, Children’s Healthcare of Atlanta, and the Centers for Disease Control and Prevention. The city is also home to several corporate headquarters, including UPS, Delta Air Lines, and The Home Depot.
The city is also home to several shopping centers and retail outlets, including the Town Brookhaven Shopping Center, the Perimeter Mall, and the Lenox Square Mall. The city is also home to several restaurants, bars, and entertainment venues, including the Brookhaven Beer Garden, the Brookhaven Bowl, and the Brookhaven Amphitheater.
Demographics
As of the 2010 census, the population of Brookhaven was 40,456. The racial makeup of the city was 73.3% White, 15.2% African American, 0.3% Native American, 5.7% Asian, 0.1% Pacific Islander, and 4.4% from other races. The median household income was $76,817, and the median family income was $90,945.
The city is home to a diverse population, with a large Hispanic population, as well as a growing Asian population. The city is also home to a large Jewish population, with approximately 10% of the population identifying as Jewish. The city is also home to a large LGBT population, with approximately 8% of the population identifying as LGBT.
Common Questions
What is Per Capita Income in Brookhaven?
Per Capita income in Brookhaven is $74,964.
What is the Median Family Income in Brookhaven?
Median Family Income in Brookhaven is $188,477.
What is the Median Household income in Brookhaven?
Median Household Income in Brookhaven is $114,570.
What is Income or Wage Gap in Brookhaven?
Income or Wage Gap in Brookhaven is 19.5%.
Women in Brookhaven earn 80.5 cents for every dollar earned by a man.
What is Inequality or Gini Index in Brookhaven?
Inequality or Gini Index in Brookhaven is 0.49.
What is the Total Population of Brookhaven?
Total Population of Brookhaven is 56,848.
What is the Total Male Population of Brookhaven?
Total Male Population of Brookhaven is 27,208.
What is the Total Female Population of Brookhaven?
Total Female Population of Brookhaven is 29,640.
What is the Ratio of Males per 100 Females in Brookhaven?
There are 91.79 Males per 100 Females in Brookhaven.
What is the Ratio of Females per 100 Males in Brookhaven?
There are 108.94 Females per 100 Males in Brookhaven.
What is the Median Population Age in Brookhaven?
Median Population Age in Brookhaven is 34.6 Years.
What is the Average Family Size in Brookhaven
Average Family Size in Brookhaven is 3.2 People.
What is the Average Household Size in Brookhaven
Average Household Size in Brookhaven is 2.3 People.
How Large is the Labor Force in Brookhaven?
There are 34,876 People in the Labor Forcein in Brookhaven.
What is the Percentage of People in the Labor Force in Brookhaven?
77.4% of People are in the Labor Force in Brookhaven.
What is the Unemployment Rate in Brookhaven?
Unemployment Rate in Brookhaven is 3.0%.