Lovejoy, GA Map & Demographics
Lovejoy Map
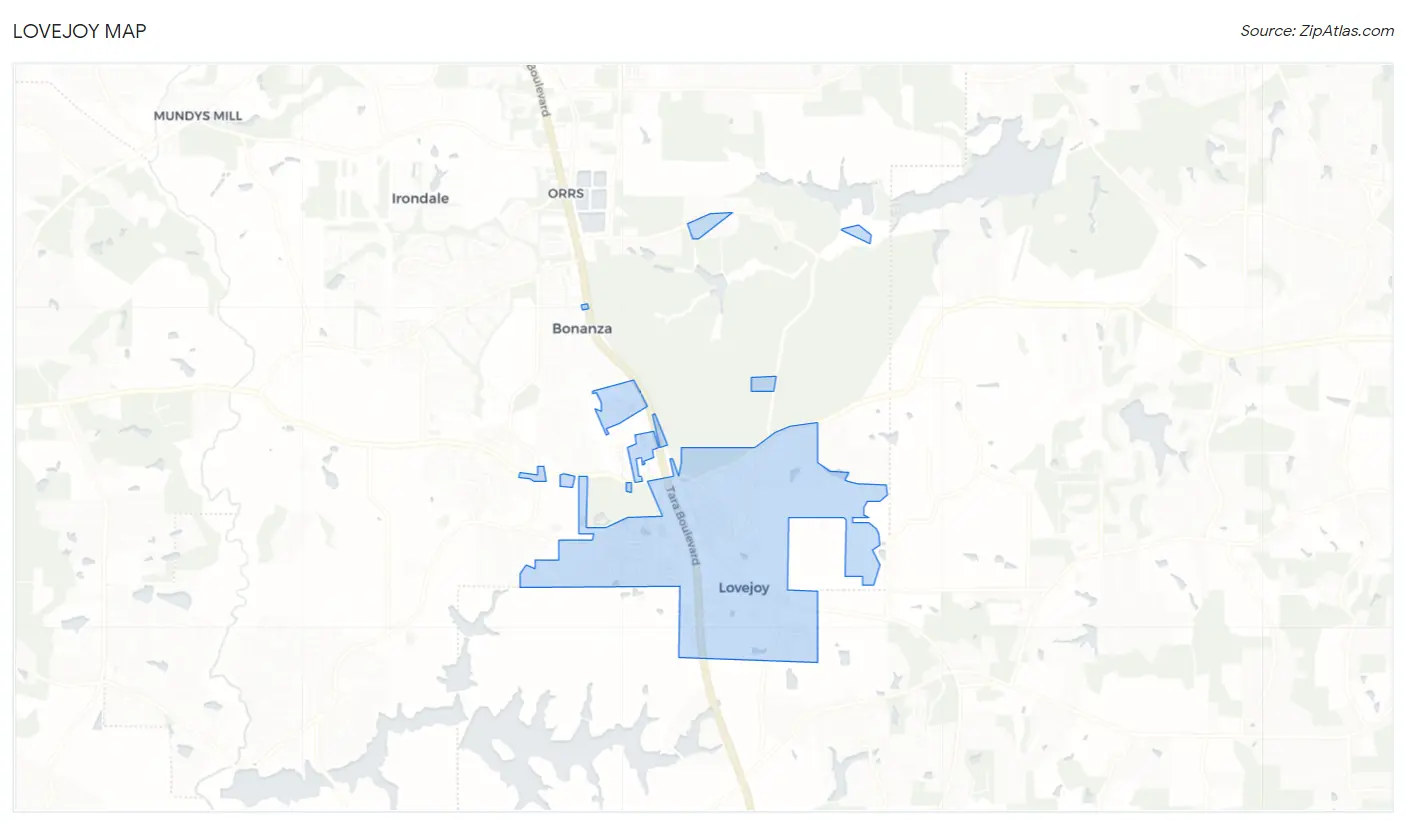
Lovejoy Overview
$21,789
PER CAPITA INCOME
$58,923
AVG FAMILY INCOME
$59,184
AVG HOUSEHOLD INCOME
46.0%
WAGE / INCOME GAP [ % ]
54.0¢/ $1
WAGE / INCOME GAP [ $ ]
0.40
INEQUALITY / GINI INDEX
10,429
TOTAL POPULATION
4,584
MALE POPULATION
5,845
FEMALE POPULATION
78.43
MALES / 100 FEMALES
127.51
FEMALES / 100 MALES
26.5
MEDIAN AGE
3.6
AVG FAMILY SIZE
3.2
AVG HOUSEHOLD SIZE
4,106
LABOR FORCE [ PEOPLE ]
63.6%
PERCENT IN LABOR FORCE
6.6%
UNEMPLOYMENT RATE
Lovejoy Zip Codes
Lovejoy Area Codes
Income in Lovejoy
Income Overview in Lovejoy
Per Capita Income in Lovejoy is $21,789, while median incomes of families and households are $58,923 and $59,184 respectively.
| Characteristic | Number | Measure |
| Per Capita Income | 10,429 | $21,789 |
| Median Family Income | 2,427 | $58,923 |
| Mean Family Income | 2,427 | $68,966 |
| Median Household Income | 3,053 | $59,184 |
| Mean Household Income | 3,053 | $71,182 |
| Income Deficit | 2,427 | $0 |
| Wage / Income Gap (%) | 10,429 | 45.96% |
| Wage / Income Gap ($) | 10,429 | 54.04¢ per $1 |
| Gini / Inequality Index | 10,429 | 0.40 |
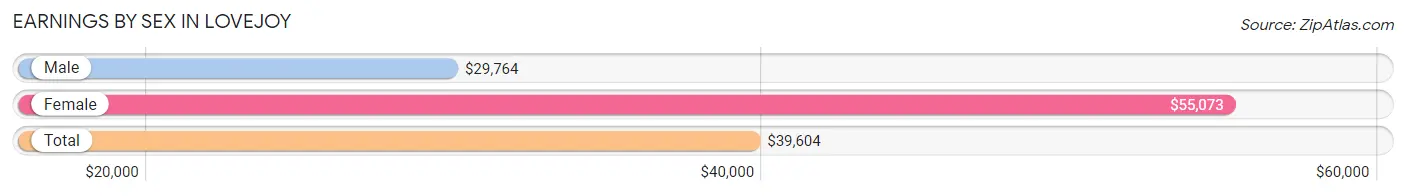
Earnings by Sex in Lovejoy
Average Earnings in Lovejoy are $39,604, $29,764 for men and $55,073 for women, a difference of 46.0%.
| Sex | Number | Average Earnings |
| Male | 1,980 (44.8%) | $29,764 |
| Female | 2,437 (55.2%) | $55,073 |
| Total | 4,417 (100.0%) | $39,604 |
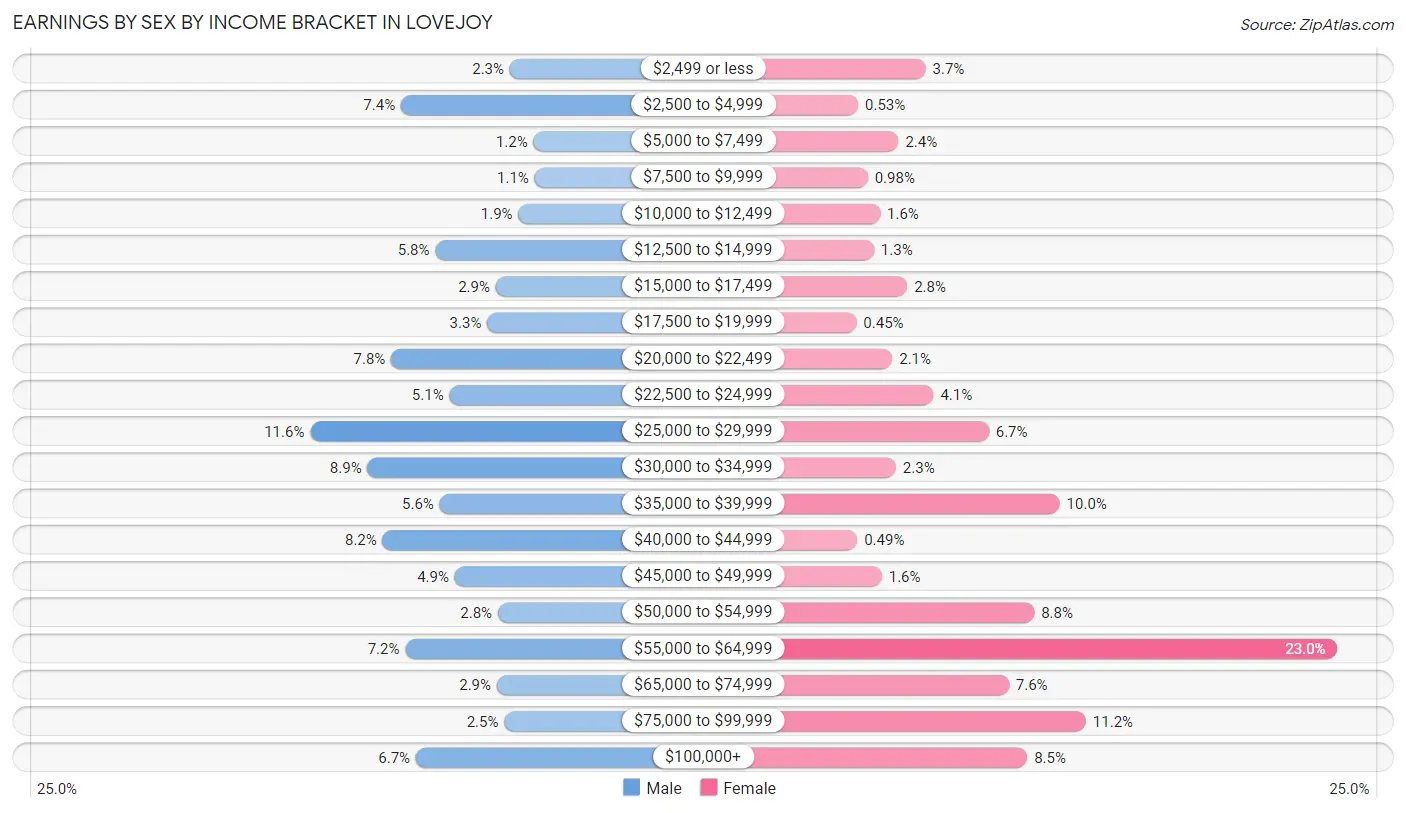
Earnings by Sex by Income Bracket in Lovejoy
The most common earnings brackets in Lovejoy are $25,000 to $29,999 for men (230 | 11.6%) and $55,000 to $64,999 for women (560 | 23.0%).
| Income | Male | Female |
| $2,499 or less | 45 (2.3%) | 90 (3.7%) |
| $2,500 to $4,999 | 146 (7.4%) | 13 (0.5%) |
| $5,000 to $7,499 | 23 (1.2%) | 59 (2.4%) |
| $7,500 to $9,999 | 22 (1.1%) | 24 (1.0%) |
| $10,000 to $12,499 | 37 (1.9%) | 38 (1.6%) |
| $12,500 to $14,999 | 114 (5.8%) | 31 (1.3%) |
| $15,000 to $17,499 | 58 (2.9%) | 69 (2.8%) |
| $17,500 to $19,999 | 66 (3.3%) | 11 (0.4%) |
| $20,000 to $22,499 | 155 (7.8%) | 52 (2.1%) |
| $22,500 to $24,999 | 101 (5.1%) | 99 (4.1%) |
| $25,000 to $29,999 | 230 (11.6%) | 162 (6.7%) |
| $30,000 to $34,999 | 177 (8.9%) | 56 (2.3%) |
| $35,000 to $39,999 | 110 (5.6%) | 243 (10.0%) |
| $40,000 to $44,999 | 163 (8.2%) | 12 (0.5%) |
| $45,000 to $49,999 | 96 (4.9%) | 40 (1.6%) |
| $50,000 to $54,999 | 56 (2.8%) | 214 (8.8%) |
| $55,000 to $64,999 | 142 (7.2%) | 560 (23.0%) |
| $65,000 to $74,999 | 57 (2.9%) | 185 (7.6%) |
| $75,000 to $99,999 | 50 (2.5%) | 273 (11.2%) |
| $100,000+ | 132 (6.7%) | 206 (8.5%) |
| Total | 1,980 (100.0%) | 2,437 (100.0%) |
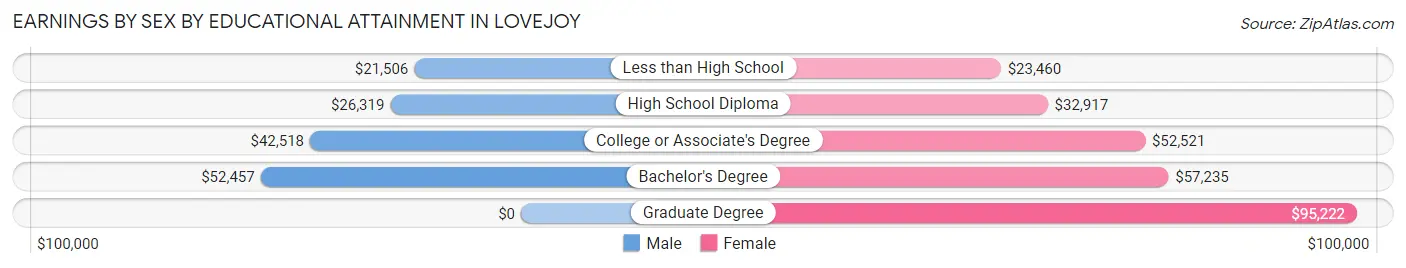
Earnings by Sex by Educational Attainment in Lovejoy
Average earnings in Lovejoy are $34,091 for men and $55,661 for women, a difference of 38.8%. Men with an educational attainment of bachelor's degree enjoy the highest average annual earnings of $52,457, while those with less than high school education earn the least with $21,506. Women with an educational attainment of graduate degree earn the most with the average annual earnings of $95,222, while those with less than high school education have the smallest earnings of $23,460.
| Educational Attainment | Male Income | Female Income |
| Less than High School | $21,506 | $23,460 |
| High School Diploma | $26,319 | $32,917 |
| College or Associate's Degree | $42,518 | $52,521 |
| Bachelor's Degree | $52,457 | $57,235 |
| Graduate Degree | - | - |
| Total | $34,091 | $55,661 |
Family Income in Lovejoy
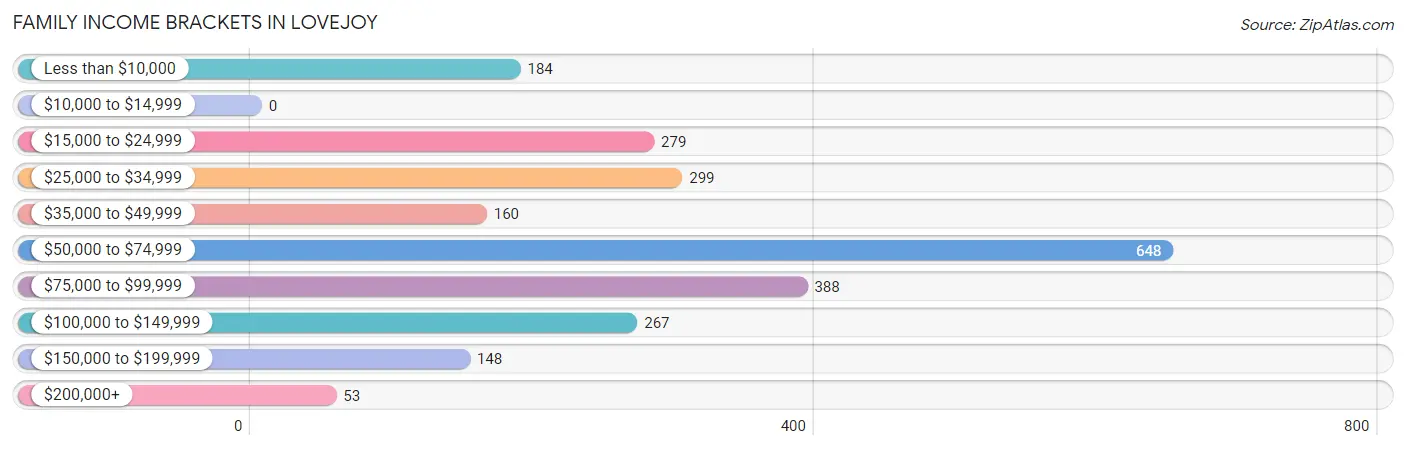
Family Income Brackets in Lovejoy
According to the Lovejoy family income data, there are 648 families falling into the $50,000 to $74,999 income range, which is the most common income bracket and makes up 26.7% of all families.
| Income Bracket | # Families | % Families |
| Less than $10,000 | 184 | 7.6% |
| $10,000 to $14,999 | 0 | 0.0% |
| $15,000 to $24,999 | 279 | 11.5% |
| $25,000 to $34,999 | 299 | 12.3% |
| $35,000 to $49,999 | 160 | 6.6% |
| $50,000 to $74,999 | 648 | 26.7% |
| $75,000 to $99,999 | 388 | 16.0% |
| $100,000 to $149,999 | 267 | 11.0% |
| $150,000 to $199,999 | 148 | 6.1% |
| $200,000+ | 53 | 2.2% |
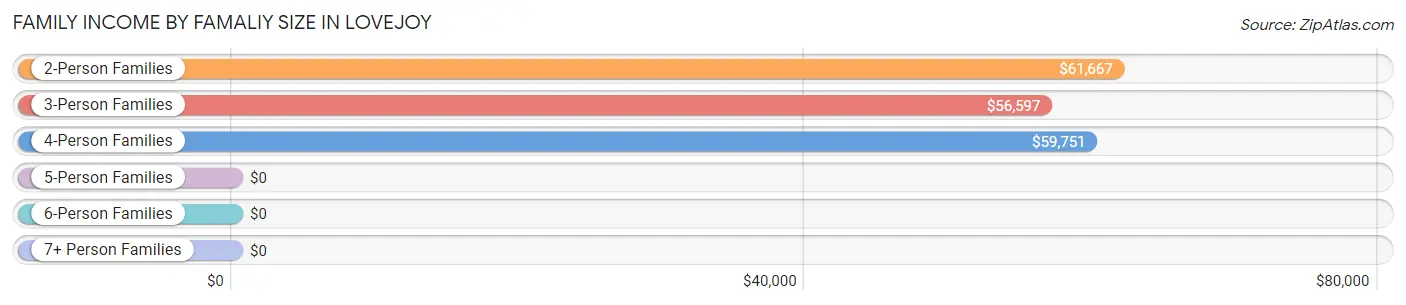
Family Income by Famaliy Size in Lovejoy
2-person families (814 | 33.5%) account for the highest median family income in Lovejoy with $61,667 per family, while 2-person families (814 | 33.5%) have the highest median income of $30,834 per family member.
| Income Bracket | # Families | Median Income |
| 2-Person Families | 814 (33.5%) | $61,667 |
| 3-Person Families | 658 (27.1%) | $56,597 |
| 4-Person Families | 526 (21.7%) | $59,751 |
| 5-Person Families | 372 (15.3%) | $0 |
| 6-Person Families | 36 (1.5%) | $0 |
| 7+ Person Families | 21 (0.9%) | $0 |
| Total | 2,427 (100.0%) | $58,923 |
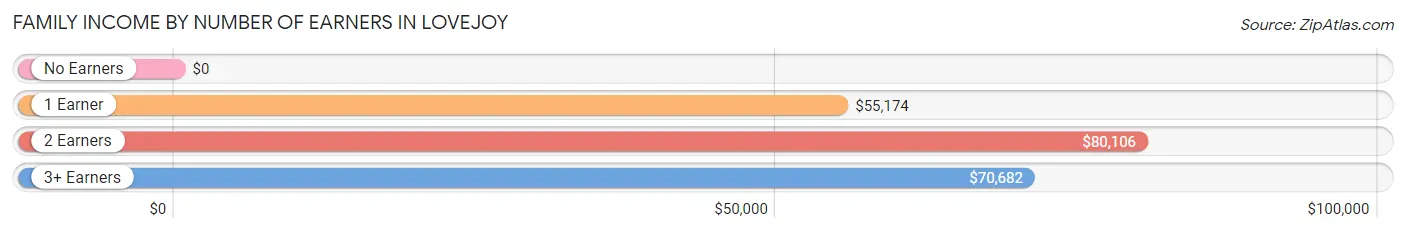
Family Income by Number of Earners in Lovejoy
| Number of Earners | # Families | Median Income |
| No Earners | 319 (13.1%) | $0 |
| 1 Earner | 1,122 (46.2%) | $55,174 |
| 2 Earners | 950 (39.1%) | $80,106 |
| 3+ Earners | 36 (1.5%) | $70,682 |
| Total | 2,427 (100.0%) | $58,923 |
Household Income in Lovejoy
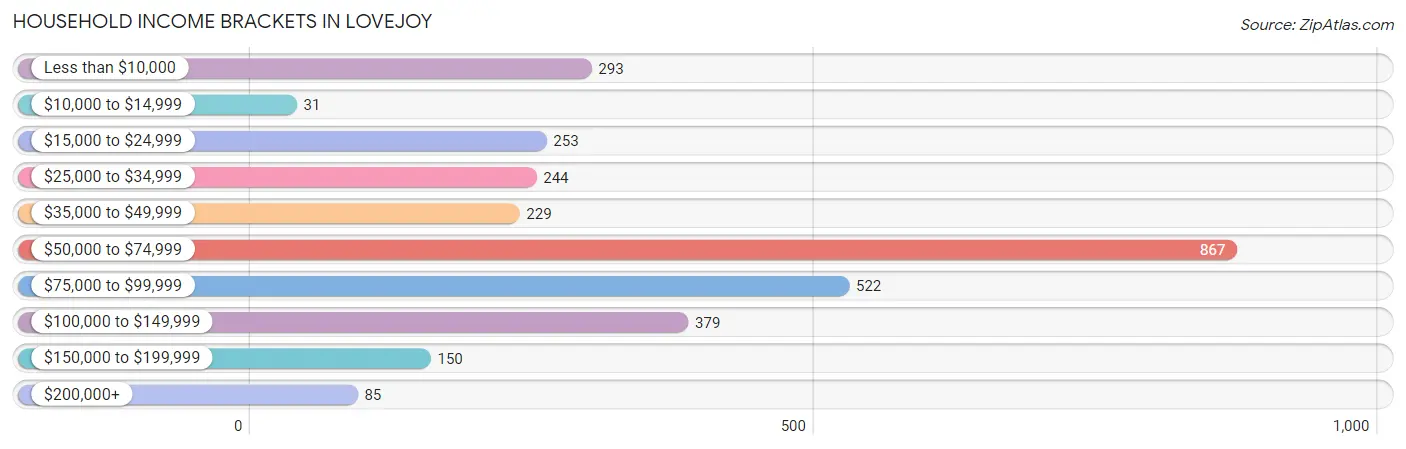
Household Income Brackets in Lovejoy
With 867 households falling in the category, the $50,000 to $74,999 income range is the most frequent in Lovejoy, accounting for 28.4% of all households. In contrast, only 31 households (1.0%) fall into the $10,000 to $14,999 income bracket, making it the least populous group.
| Income Bracket | # Households | % Households |
| Less than $10,000 | 293 | 9.6% |
| $10,000 to $14,999 | 31 | 1.0% |
| $15,000 to $24,999 | 253 | 8.3% |
| $25,000 to $34,999 | 244 | 8.0% |
| $35,000 to $49,999 | 229 | 7.5% |
| $50,000 to $74,999 | 867 | 28.4% |
| $75,000 to $99,999 | 522 | 17.1% |
| $100,000 to $149,999 | 379 | 12.4% |
| $150,000 to $199,999 | 150 | 4.9% |
| $200,000+ | 85 | 2.8% |
Household Income by Householder Age in Lovejoy
The median household income in Lovejoy is $59,184, with the highest median household income of $70,032 found in the 25 to 44 years age bracket for the primary householder. A total of 1,798 households (58.9%) fall into this category. Meanwhile, the 15 to 24 years age bracket for the primary householder has the lowest median household income of $0, with 20 households (0.7%) in this group.
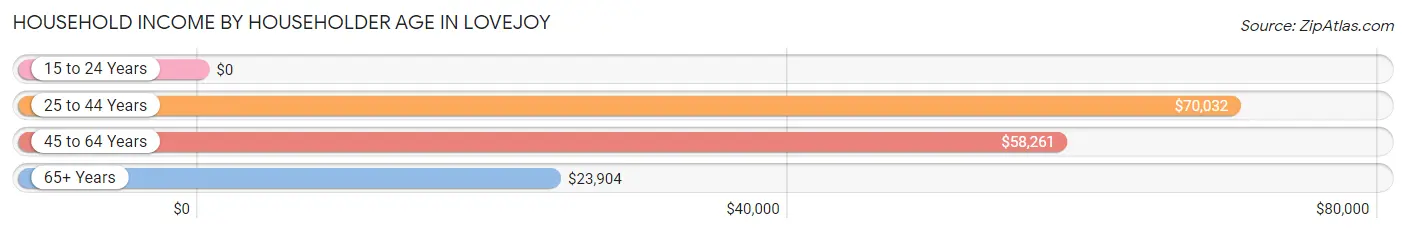
| Income Bracket | # Households | Median Income |
| 15 to 24 Years | 20 (0.7%) | $0 |
| 25 to 44 Years | 1,798 (58.9%) | $70,032 |
| 45 to 64 Years | 878 (28.8%) | $58,261 |
| 65+ Years | 357 (11.7%) | $23,904 |
| Total | 3,053 (100.0%) | $59,184 |
Poverty in Lovejoy
Income Below Poverty by Sex and Age in Lovejoy
With 16.1% poverty level for males and 20.9% for females among the residents of Lovejoy, 75 year old and over males and 65 to 74 year old females are the most vulnerable to poverty, with 31 males (73.8%) and 166 females (63.6%) in their respective age groups living below the poverty level.
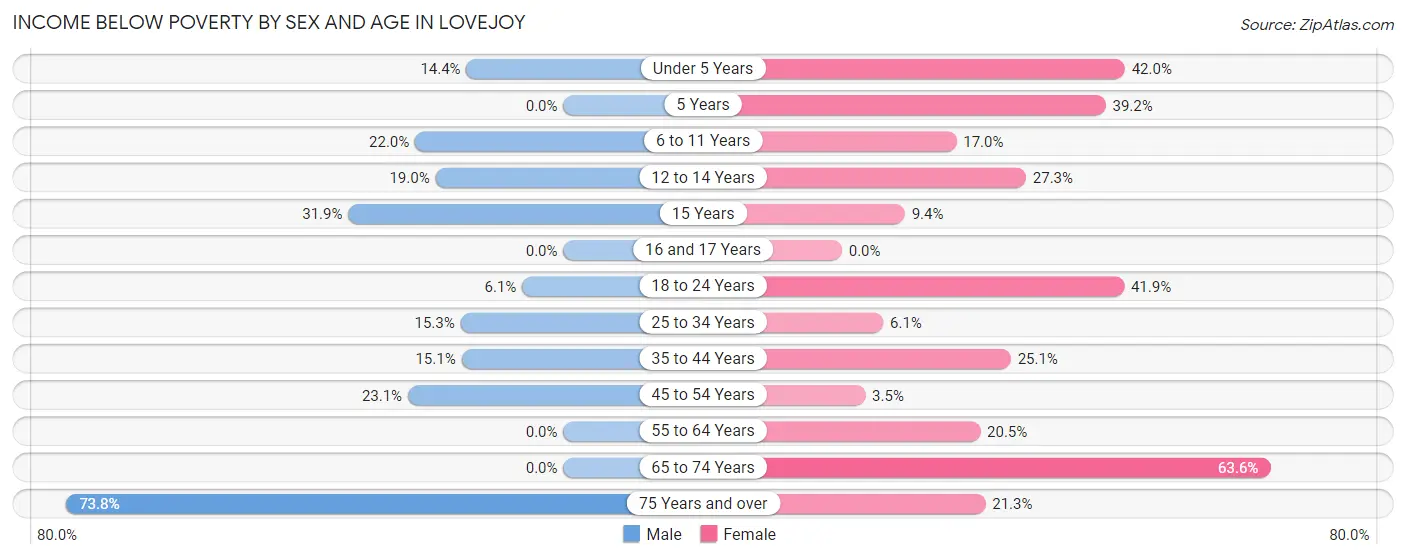
| Age Bracket | Male | Female |
| Under 5 Years | 60 (14.4%) | 155 (42.0%) |
| 5 Years | 0 (0.0%) | 47 (39.2%) |
| 6 to 11 Years | 114 (22.0%) | 178 (17.0%) |
| 12 to 14 Years | 68 (19.0%) | 126 (27.3%) |
| 15 Years | 114 (31.9%) | 10 (9.3%) |
| 16 and 17 Years | 0 (0.0%) | 0 (0.0%) |
| 18 to 24 Years | 31 (6.1%) | 106 (41.9%) |
| 25 to 34 Years | 89 (15.3%) | 62 (6.1%) |
| 35 to 44 Years | 105 (15.1%) | 227 (25.1%) |
| 45 to 54 Years | 48 (23.1%) | 14 (3.5%) |
| 55 to 64 Years | 0 (0.0%) | 107 (20.5%) |
| 65 to 74 Years | 0 (0.0%) | 166 (63.6%) |
| 75 Years and over | 31 (73.8%) | 13 (21.3%) |
| Total | 660 (16.1%) | 1,211 (20.9%) |
Income Above Poverty by Sex and Age in Lovejoy
According to the poverty statistics in Lovejoy, males aged 5 years and females aged 16 and 17 years are the age groups that are most secure financially, with 100.0% of males and 100.0% of females in these age groups living above the poverty line.
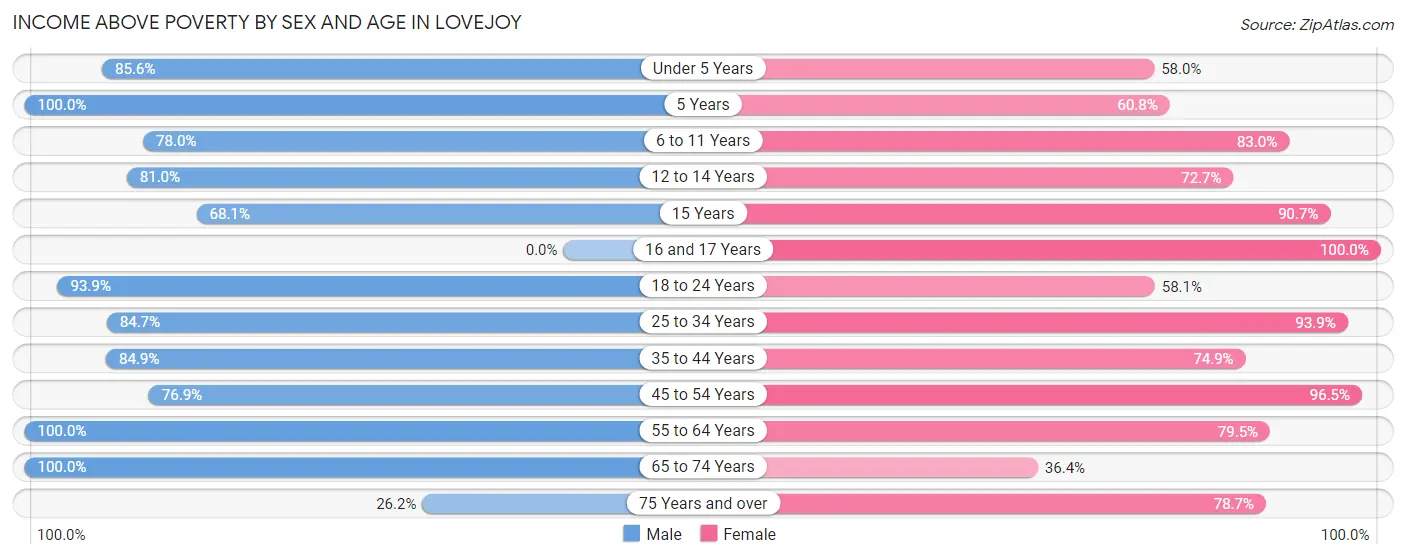
| Age Bracket | Male | Female |
| Under 5 Years | 357 (85.6%) | 214 (58.0%) |
| 5 Years | 208 (100.0%) | 73 (60.8%) |
| 6 to 11 Years | 404 (78.0%) | 869 (83.0%) |
| 12 to 14 Years | 290 (81.0%) | 335 (72.7%) |
| 15 Years | 243 (68.1%) | 97 (90.6%) |
| 16 and 17 Years | 0 (0.0%) | 263 (100.0%) |
| 18 to 24 Years | 476 (93.9%) | 147 (58.1%) |
| 25 to 34 Years | 494 (84.7%) | 949 (93.9%) |
| 35 to 44 Years | 589 (84.9%) | 678 (74.9%) |
| 45 to 54 Years | 160 (76.9%) | 390 (96.5%) |
| 55 to 64 Years | 125 (100.0%) | 414 (79.5%) |
| 65 to 74 Years | 81 (100.0%) | 95 (36.4%) |
| 75 Years and over | 11 (26.2%) | 48 (78.7%) |
| Total | 3,438 (83.9%) | 4,572 (79.1%) |
Income Below Poverty Among Married-Couple Families in Lovejoy
The poverty statistics for married-couple families in Lovejoy show that 11.8% or 76 of the total 644 families live below the poverty line. Families with 3 or 4 children have the highest poverty rate of 53.1%, comprising of 76 families. On the other hand, families with no children have the lowest poverty rate of 0.0%, which includes 0 families.
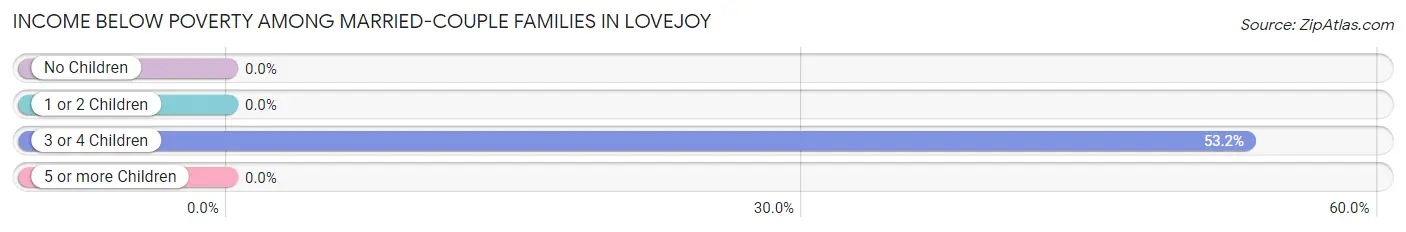
| Children | Above Poverty | Below Poverty |
| No Children | 286 (100.0%) | 0 (0.0%) |
| 1 or 2 Children | 215 (100.0%) | 0 (0.0%) |
| 3 or 4 Children | 67 (46.9%) | 76 (53.1%) |
| 5 or more Children | 0 (0.0%) | 0 (0.0%) |
| Total | 568 (88.2%) | 76 (11.8%) |
Income Below Poverty Among Single-Parent Households in Lovejoy
According to the poverty data in Lovejoy, 30.8% or 114 single-father households and 16.6% or 235 single-mother households are living below the poverty line. Among single-father households, those with 3 or 4 children have the highest poverty rate, with 48 households (100.0%) experiencing poverty. Likewise, among single-mother households, those with no children have the highest poverty rate, with 111 households (29.7%) falling below the poverty line.
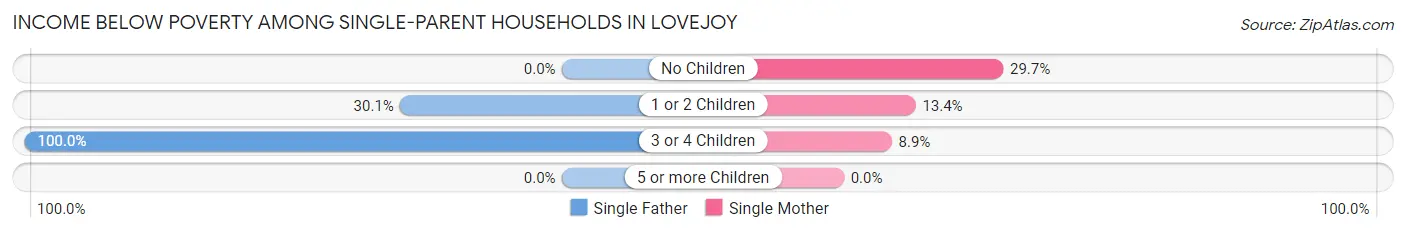
| Children | Single Father | Single Mother |
| No Children | 0 (0.0%) | 111 (29.7%) |
| 1 or 2 Children | 66 (30.1%) | 94 (13.4%) |
| 3 or 4 Children | 48 (100.0%) | 30 (8.9%) |
| 5 or more Children | 0 (0.0%) | 0 (0.0%) |
| Total | 114 (30.8%) | 235 (16.6%) |
Income Below Poverty Among Married-Couple vs Single-Parent Households in Lovejoy
The poverty data for Lovejoy shows that 76 of the married-couple family households (11.8%) and 349 of the single-parent households (19.6%) are living below the poverty level. Within the married-couple family households, those with 3 or 4 children have the highest poverty rate, with 76 households (53.1%) falling below the poverty line. Among the single-parent households, those with no children have the highest poverty rate, with 111 household (23.3%) living below poverty.
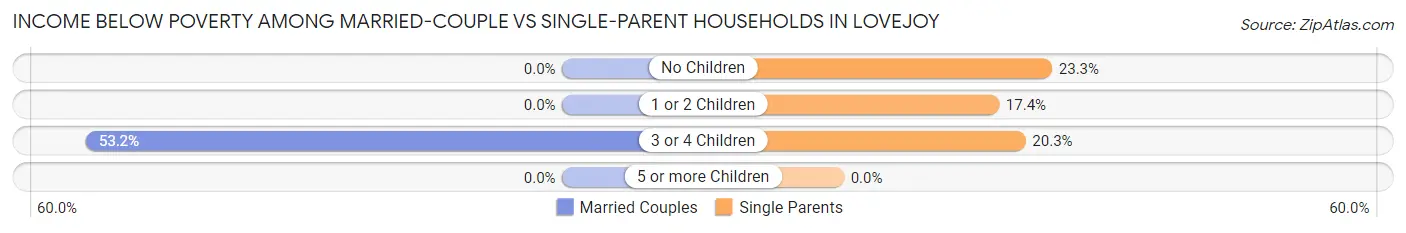
| Children | Married-Couple Families | Single-Parent Households |
| No Children | 0 (0.0%) | 111 (23.3%) |
| 1 or 2 Children | 0 (0.0%) | 160 (17.3%) |
| 3 or 4 Children | 76 (53.1%) | 78 (20.3%) |
| 5 or more Children | 0 (0.0%) | 0 (0.0%) |
| Total | 76 (11.8%) | 349 (19.6%) |
Race in Lovejoy
The most populous races in Lovejoy are Black / African American (8,119 | 77.8%), White / Caucasian (1,583 | 15.2%), and Hispanic or Latino (1,128 | 10.8%).
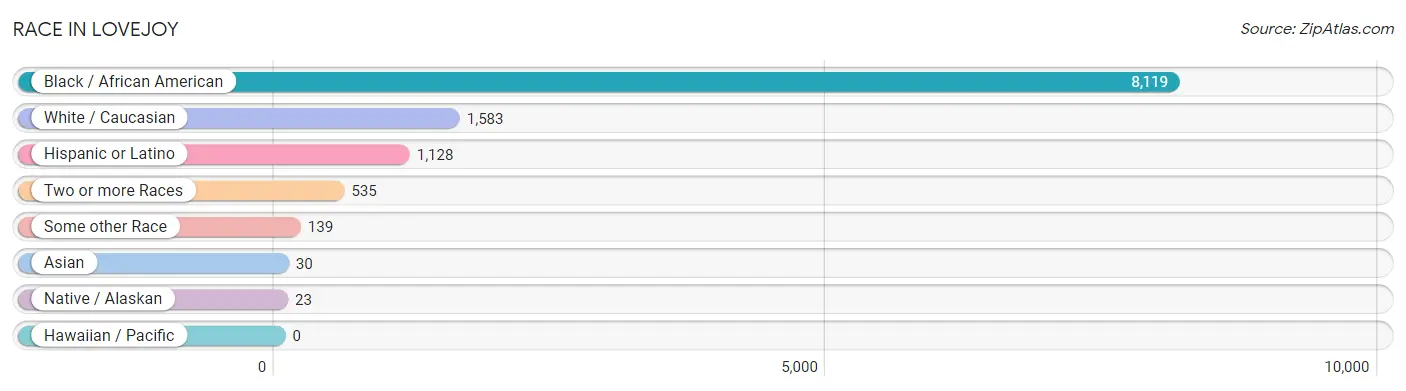
| Race | # Population | % Population |
| Asian | 30 | 0.3% |
| Black / African American | 8,119 | 77.8% |
| Hawaiian / Pacific | 0 | 0.0% |
| Hispanic or Latino | 1,128 | 10.8% |
| Native / Alaskan | 23 | 0.2% |
| White / Caucasian | 1,583 | 15.2% |
| Two or more Races | 535 | 5.1% |
| Some other Race | 139 | 1.3% |
| Total | 10,429 | 100.0% |
Ancestry in Lovejoy
The most populous ancestries reported in Lovejoy are American (1,287 | 12.3%), Mexican (822 | 7.9%), Subsaharan African (371 | 3.6%), Jamaican (291 | 2.8%), and Arab (270 | 2.6%), together accounting for 29.2% of all Lovejoy residents.
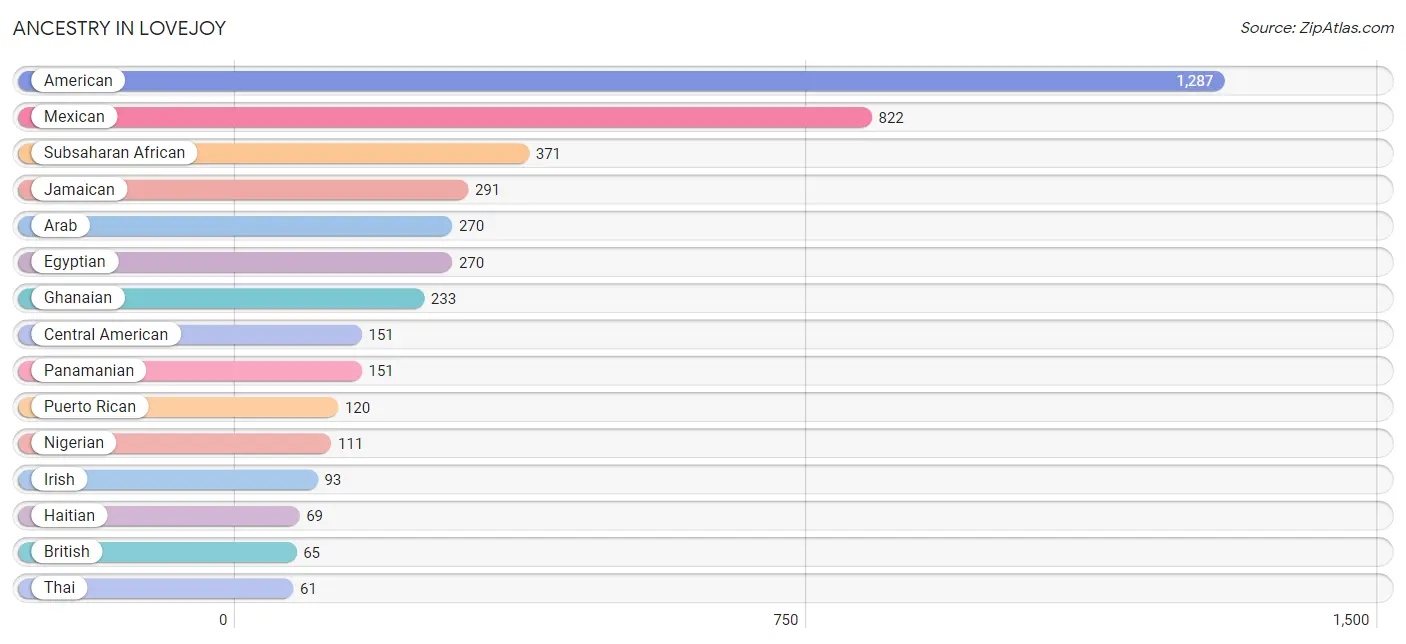
| Ancestry | # Population | % Population |
| African | 22 | 0.2% |
| American | 1,287 | 12.3% |
| Arab | 270 | 2.6% |
| Bahamian | 11 | 0.1% |
| Blackfeet | 45 | 0.4% |
| British | 65 | 0.6% |
| Cape Verdean | 5 | 0.1% |
| Central American | 151 | 1.5% |
| Central American Indian | 23 | 0.2% |
| Cherokee | 29 | 0.3% |
| Colombian | 24 | 0.2% |
| Ecuadorian | 11 | 0.1% |
| Egyptian | 270 | 2.6% |
| English | 24 | 0.2% |
| European | 45 | 0.4% |
| French | 23 | 0.2% |
| German | 52 | 0.5% |
| Ghanaian | 233 | 2.2% |
| Guyanese | 12 | 0.1% |
| Haitian | 69 | 0.7% |
| Indian (Asian) | 10 | 0.1% |
| Irish | 93 | 0.9% |
| Jamaican | 291 | 2.8% |
| Korean | 30 | 0.3% |
| Mexican | 822 | 7.9% |
| Nigerian | 111 | 1.1% |
| Panamanian | 151 | 1.5% |
| Portuguese | 9 | 0.1% |
| Puerto Rican | 120 | 1.1% |
| South American | 35 | 0.3% |
| Subsaharan African | 371 | 3.6% |
| Thai | 61 | 0.6% |
| West Indian | 23 | 0.2% | View All 33 Rows |
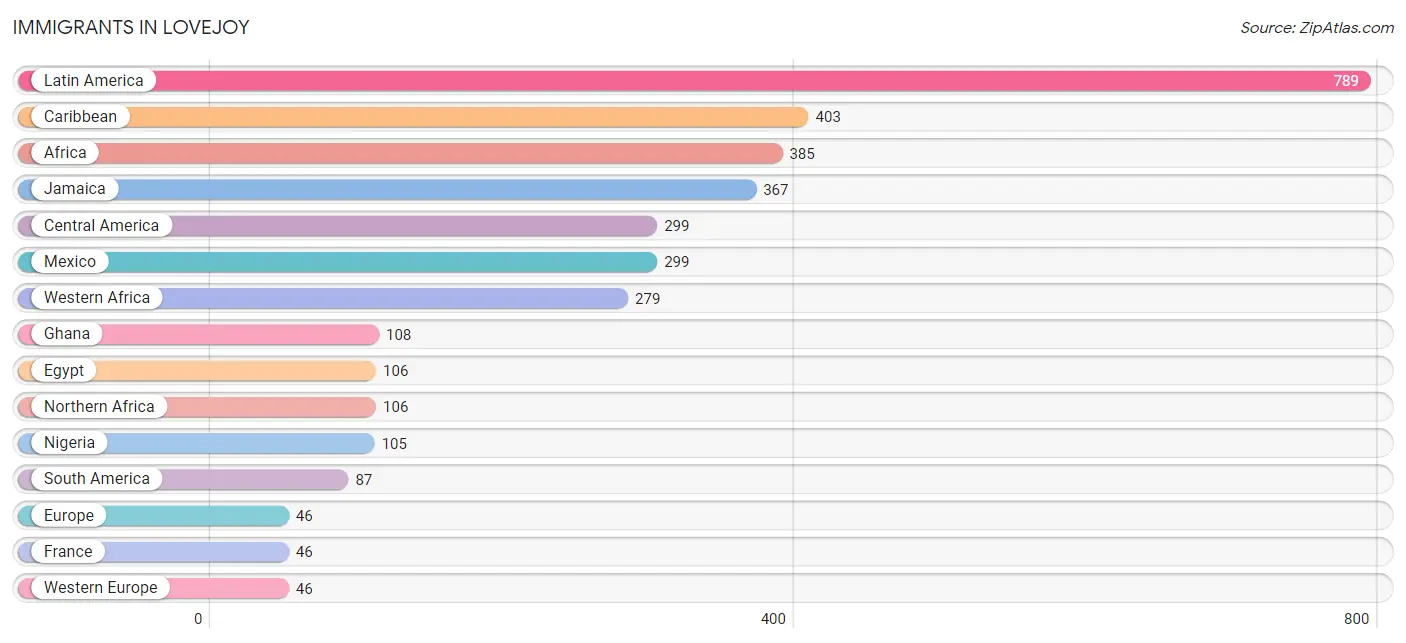
Immigrants in Lovejoy
The most numerous immigrant groups reported in Lovejoy came from Latin America (789 | 7.6%), Caribbean (403 | 3.9%), Africa (385 | 3.7%), Jamaica (367 | 3.5%), and Central America (299 | 2.9%), together accounting for 21.5% of all Lovejoy residents.
| Immigration Origin | # Population | % Population |
| Africa | 385 | 3.7% |
| Asia | 45 | 0.4% |
| Caribbean | 403 | 3.9% |
| Central America | 299 | 2.9% |
| China | 10 | 0.1% |
| Colombia | 24 | 0.2% |
| Eastern Asia | 10 | 0.1% |
| Ecuador | 11 | 0.1% |
| Egypt | 106 | 1.0% |
| Europe | 46 | 0.4% |
| France | 46 | 0.4% |
| Ghana | 108 | 1.0% |
| Guyana | 40 | 0.4% |
| Haiti | 23 | 0.2% |
| India | 5 | 0.1% |
| Jamaica | 367 | 3.5% |
| Latin America | 789 | 7.6% |
| Mexico | 299 | 2.9% |
| Nigeria | 105 | 1.0% |
| Northern Africa | 106 | 1.0% |
| Philippines | 30 | 0.3% |
| South America | 87 | 0.8% |
| South Central Asia | 5 | 0.1% |
| South Eastern Asia | 30 | 0.3% |
| Western Africa | 279 | 2.7% |
| Western Europe | 46 | 0.4% | View All 26 Rows |
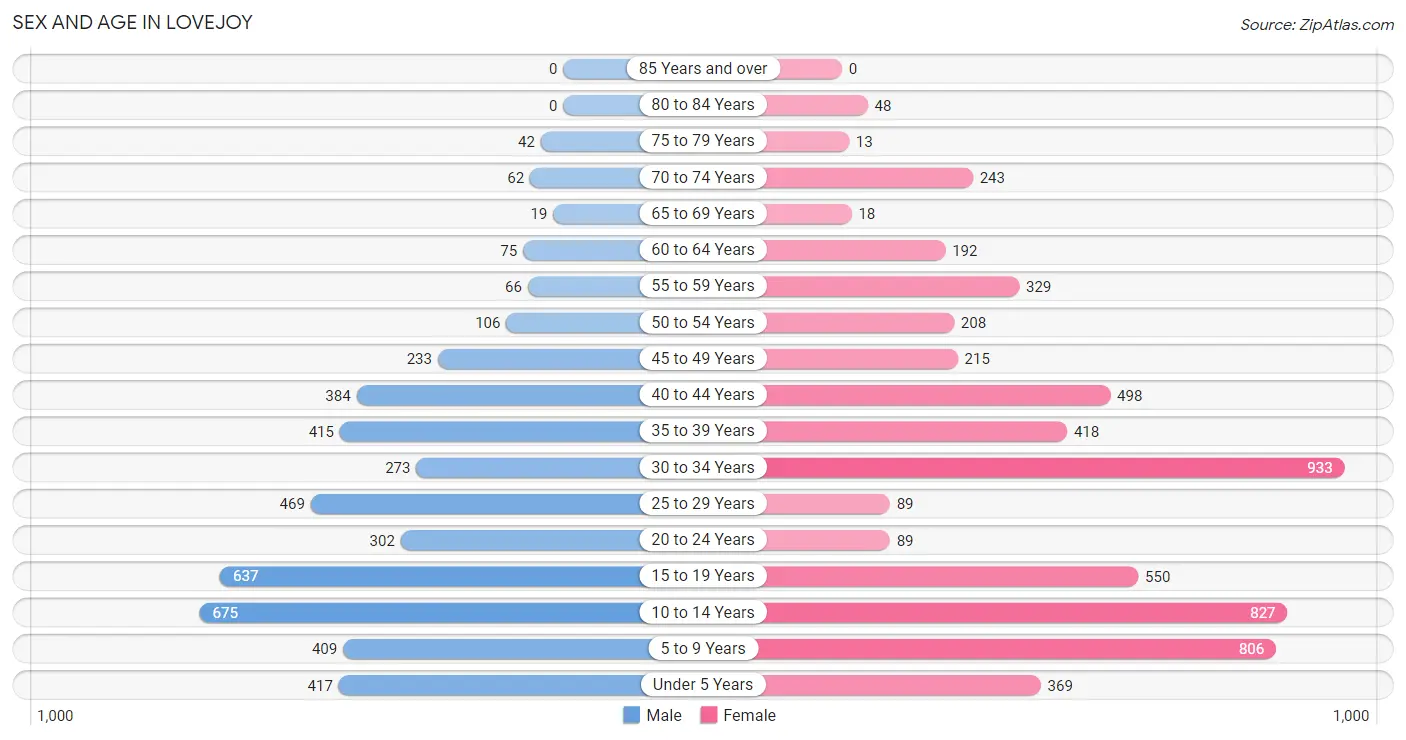
Sex and Age in Lovejoy
Sex and Age in Lovejoy
The most populous age groups in Lovejoy are 10 to 14 Years (675 | 14.7%) for men and 30 to 34 Years (933 | 16.0%) for women.
| Age Bracket | Male | Female |
| Under 5 Years | 417 (9.1%) | 369 (6.3%) |
| 5 to 9 Years | 409 (8.9%) | 806 (13.8%) |
| 10 to 14 Years | 675 (14.7%) | 827 (14.1%) |
| 15 to 19 Years | 637 (13.9%) | 550 (9.4%) |
| 20 to 24 Years | 302 (6.6%) | 89 (1.5%) |
| 25 to 29 Years | 469 (10.2%) | 89 (1.5%) |
| 30 to 34 Years | 273 (6.0%) | 933 (16.0%) |
| 35 to 39 Years | 415 (9.0%) | 418 (7.1%) |
| 40 to 44 Years | 384 (8.4%) | 498 (8.5%) |
| 45 to 49 Years | 233 (5.1%) | 215 (3.7%) |
| 50 to 54 Years | 106 (2.3%) | 208 (3.6%) |
| 55 to 59 Years | 66 (1.4%) | 329 (5.6%) |
| 60 to 64 Years | 75 (1.6%) | 192 (3.3%) |
| 65 to 69 Years | 19 (0.4%) | 18 (0.3%) |
| 70 to 74 Years | 62 (1.3%) | 243 (4.2%) |
| 75 to 79 Years | 42 (0.9%) | 13 (0.2%) |
| 80 to 84 Years | 0 (0.0%) | 48 (0.8%) |
| 85 Years and over | 0 (0.0%) | 0 (0.0%) |
| Total | 4,584 (100.0%) | 5,845 (100.0%) |
Families and Households in Lovejoy
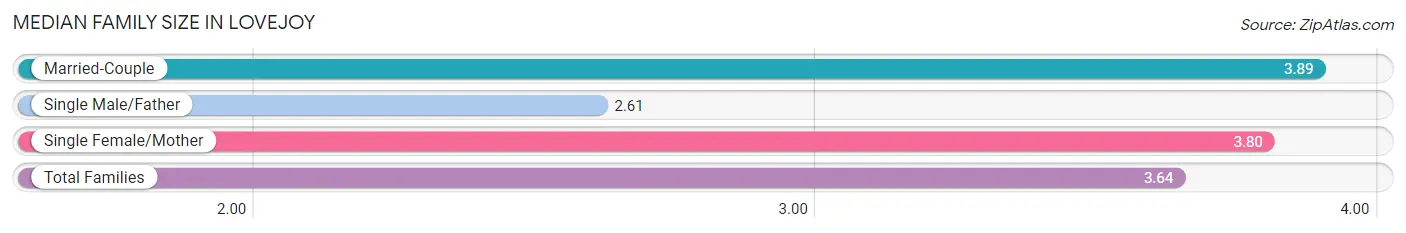
Median Family Size in Lovejoy
The median family size in Lovejoy is 3.64 persons per family, with married-couple families (644 | 26.5%) accounting for the largest median family size of 3.89 persons per family. On the other hand, single male/father families (370 | 15.2%) represent the smallest median family size with 2.61 persons per family.
| Family Type | # Families | Family Size |
| Married-Couple | 644 (26.5%) | 3.89 |
| Single Male/Father | 370 (15.2%) | 2.61 |
| Single Female/Mother | 1,413 (58.2%) | 3.80 |
| Total Families | 2,427 (100.0%) | 3.64 |
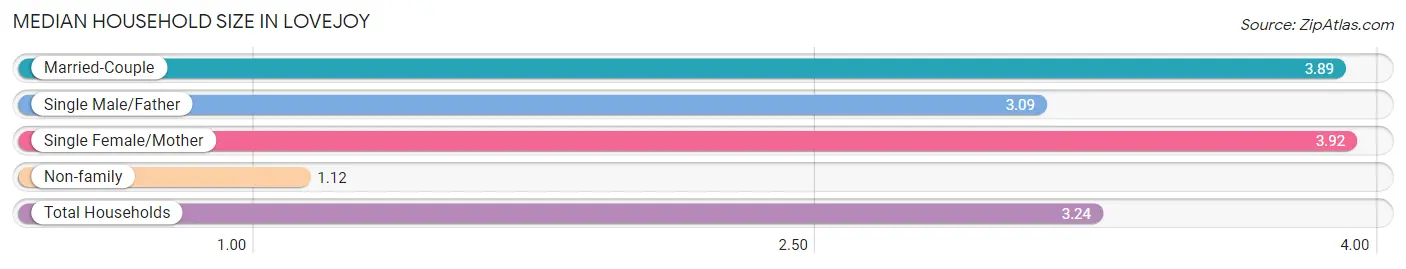
Median Household Size in Lovejoy
The median household size in Lovejoy is 3.24 persons per household, with single female/mother households (1,413 | 46.3%) accounting for the largest median household size of 3.92 persons per household. non-family households (626 | 20.5%) represent the smallest median household size with 1.12 persons per household.
| Household Type | # Households | Household Size |
| Married-Couple | 644 (21.1%) | 3.89 |
| Single Male/Father | 370 (12.1%) | 3.09 |
| Single Female/Mother | 1,413 (46.3%) | 3.92 |
| Non-family | 626 (20.5%) | 1.12 |
| Total Households | 3,053 (100.0%) | 3.24 |
Household Size by Marriage Status in Lovejoy
Out of a total of 3,053 households in Lovejoy, 2,427 (79.5%) are family households, while 626 (20.5%) are nonfamily households. The most numerous type of family households are 2-person households, comprising 754, and the most common type of nonfamily households are 1-person households, comprising 569.
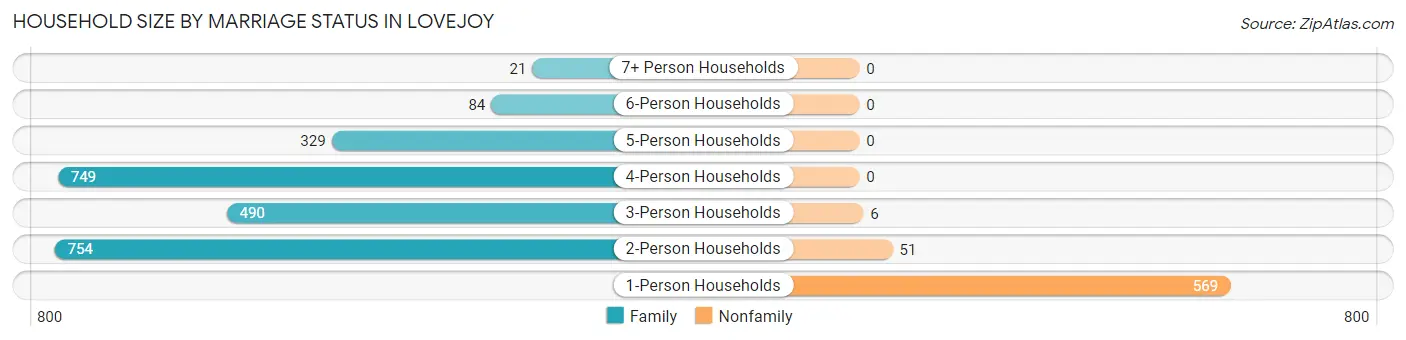
| Household Size | Family Households | Nonfamily Households |
| 1-Person Households | - | 569 (18.6%) |
| 2-Person Households | 754 (24.7%) | 51 (1.7%) |
| 3-Person Households | 490 (16.1%) | 6 (0.2%) |
| 4-Person Households | 749 (24.5%) | 0 (0.0%) |
| 5-Person Households | 329 (10.8%) | 0 (0.0%) |
| 6-Person Households | 84 (2.8%) | 0 (0.0%) |
| 7+ Person Households | 21 (0.7%) | 0 (0.0%) |
| Total | 2,427 (79.5%) | 626 (20.5%) |
Female Fertility in Lovejoy
Fertility by Age in Lovejoy
Average fertility rate in Lovejoy is 29.0 births per 1,000 women. Women in the age bracket of 20 to 34 years have the highest fertility rate with 69.0 births per 1,000 women. Women in the age bracket of 20 to 34 years acount for 93.9% of all women with births.
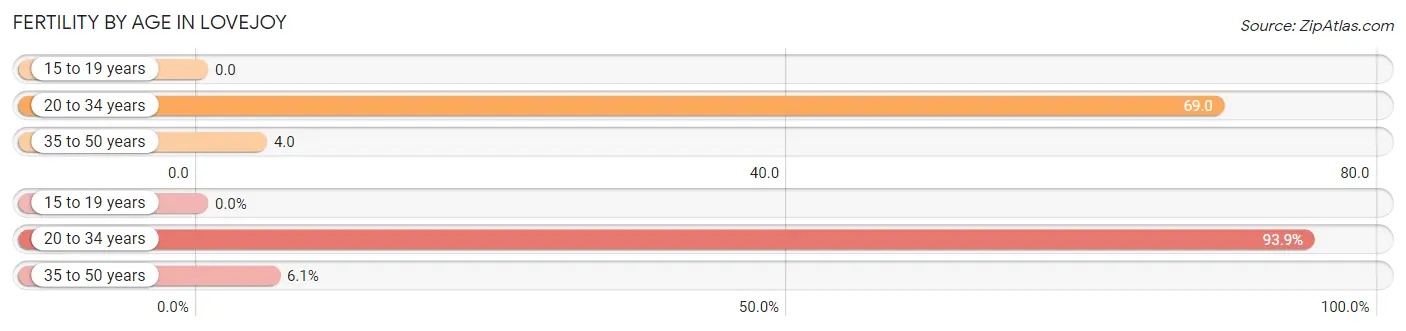
| Age Bracket | Women with Births | Births / 1,000 Women |
| 15 to 19 years | 0 (0.0%) | 0.0 |
| 20 to 34 years | 77 (93.9%) | 69.0 |
| 35 to 50 years | 5 (6.1%) | 4.0 |
| Total | 82 (100.0%) | 29.0 |
Fertility by Age by Marriage Status in Lovejoy
85.4% of women with births (82) in Lovejoy are married. The highest percentage of unmarried women with births falls into 20 to 34 years age bracket with 15.6% of them unmarried at the time of birth, while the lowest percentage of unmarried women with births belong to 35 to 50 years age bracket with 0.0% of them unmarried.
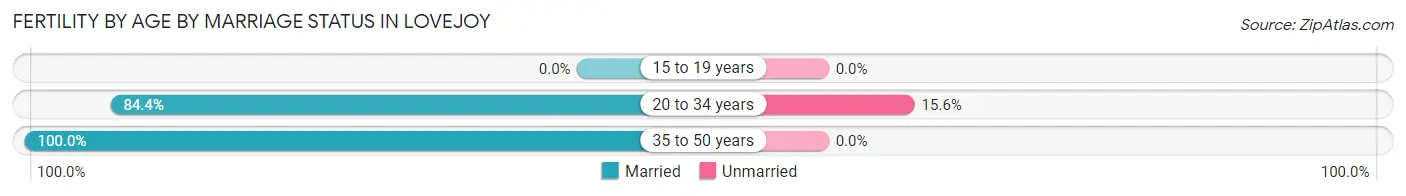
| Age Bracket | Married | Unmarried |
| 15 to 19 years | 0 (0.0%) | 0 (0.0%) |
| 20 to 34 years | 65 (84.4%) | 12 (15.6%) |
| 35 to 50 years | 5 (100.0%) | 0 (0.0%) |
| Total | 70 (85.4%) | 12 (14.6%) |
Fertility by Education in Lovejoy
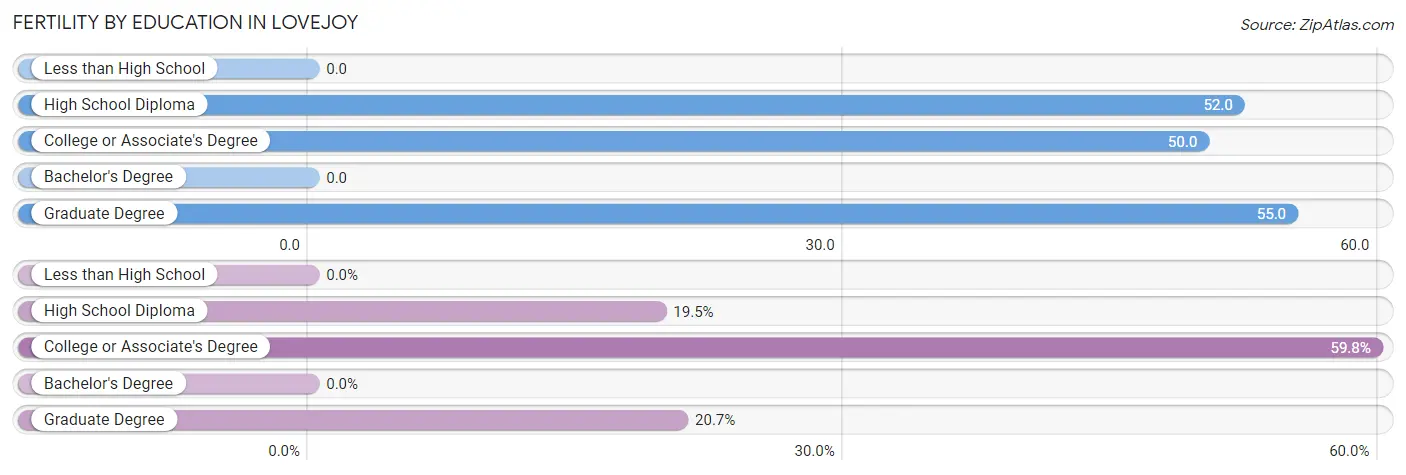
| Educational Attainment | Women with Births | Births / 1,000 Women |
| Less than High School | 0 (0.0%) | 0.0 |
| High School Diploma | 16 (19.5%) | 52.0 |
| College or Associate's Degree | 49 (59.8%) | 50.0 |
| Bachelor's Degree | 0 (0.0%) | 0.0 |
| Graduate Degree | 17 (20.7%) | 55.0 |
| Total | 82 (100.0%) | 29.0 |
Fertility by Education by Marriage Status in Lovejoy
14.6% of women with births in Lovejoy are unmarried. Women with the educational attainment of high school diploma are most likely to be married with 100.0% of them married at childbirth, while women with the educational attainment of graduate degree are least likely to be married with 70.6% of them unmarried at childbirth.
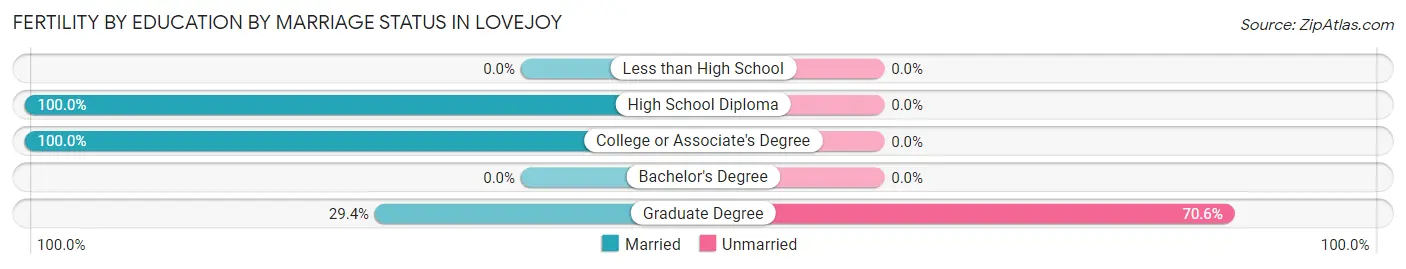
| Educational Attainment | Married | Unmarried |
| Less than High School | 0 (0.0%) | 0 (0.0%) |
| High School Diploma | 16 (100.0%) | 0 (0.0%) |
| College or Associate's Degree | 49 (100.0%) | 0 (0.0%) |
| Bachelor's Degree | 0 (0.0%) | 0 (0.0%) |
| Graduate Degree | 5 (29.4%) | 12 (70.6%) |
| Total | 70 (85.4%) | 12 (14.6%) |
Employment Characteristics in Lovejoy
Employment by Class of Employer in Lovejoy
Among the 3,810 employed individuals in Lovejoy, private company employees (2,638 | 69.2%), local government employees (559 | 14.7%), and not-for-profit organizations (261 | 6.9%) make up the most common classes of employment.
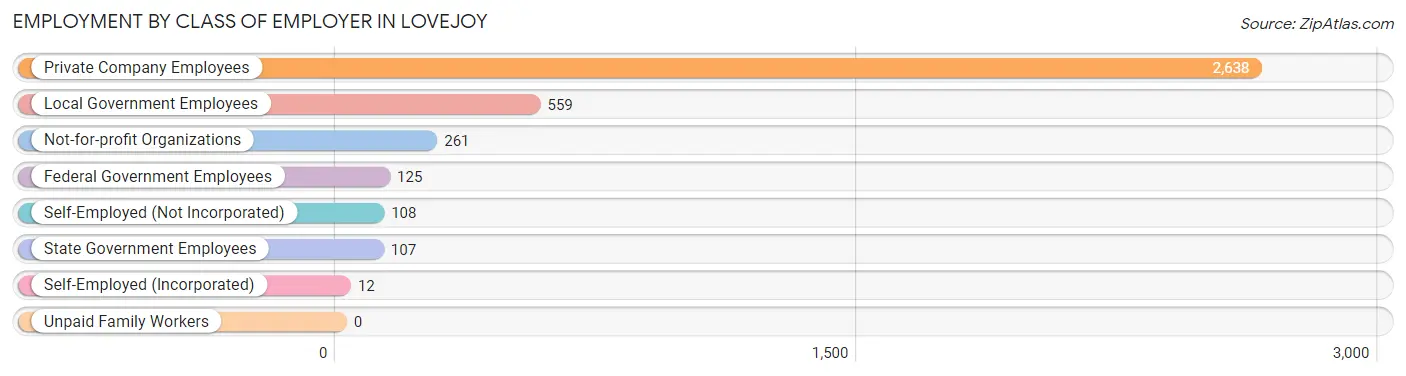
| Employer Class | # Employees | % Employees |
| Private Company Employees | 2,638 | 69.2% |
| Self-Employed (Incorporated) | 12 | 0.3% |
| Self-Employed (Not Incorporated) | 108 | 2.8% |
| Not-for-profit Organizations | 261 | 6.9% |
| Local Government Employees | 559 | 14.7% |
| State Government Employees | 107 | 2.8% |
| Federal Government Employees | 125 | 3.3% |
| Unpaid Family Workers | 0 | 0.0% |
| Total | 3,810 | 100.0% |
Employment Status by Age in Lovejoy
According to the labor force statistics for Lovejoy, out of the total population over 16 years of age (6,456), 63.6% or 4,106 individuals are in the labor force, with 6.6% or 271 of them unemployed. The age group with the highest labor force participation rate is 30 to 34 years, with 80.6% or 972 individuals in the labor force. Within the labor force, the 20 to 24 years age range has the highest percentage of unemployed individuals, with 34.1% or 61 of them being unemployed.
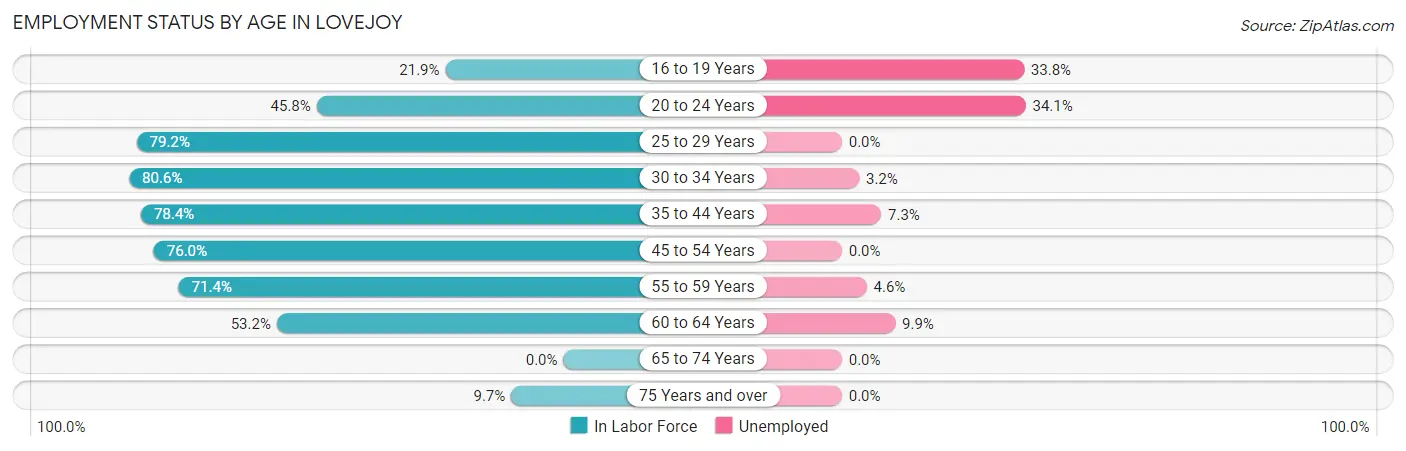
| Age Bracket | In Labor Force | Unemployed |
| 16 to 19 Years | 157 (21.9%) | 53 (33.8%) |
| 20 to 24 Years | 179 (45.8%) | 61 (34.1%) |
| 25 to 29 Years | 442 (79.2%) | 0 (0.0%) |
| 30 to 34 Years | 972 (80.6%) | 31 (3.2%) |
| 35 to 44 Years | 1,345 (78.4%) | 98 (7.3%) |
| 45 to 54 Years | 579 (76.0%) | 0 (0.0%) |
| 55 to 59 Years | 282 (71.4%) | 13 (4.6%) |
| 60 to 64 Years | 142 (53.2%) | 14 (9.9%) |
| 65 to 74 Years | 0 (0.0%) | 0 (0.0%) |
| 75 Years and over | 10 (9.7%) | 0 (0.0%) |
| Total | 4,106 (63.6%) | 271 (6.6%) |
Employment Status by Educational Attainment in Lovejoy
According to labor force statistics for Lovejoy, 76.7% of individuals (3,761) out of the total population between 25 and 64 years of age (4,903) are in the labor force, with 4.1% or 154 of them being unemployed. The group with the highest labor force participation rate are those with the educational attainment of bachelor's degree or higher, with 91.2% or 1,202 individuals in the labor force. Within the labor force, individuals with less than high school education have the highest percentage of unemployment, with 7.3% or 13 of them being unemployed.
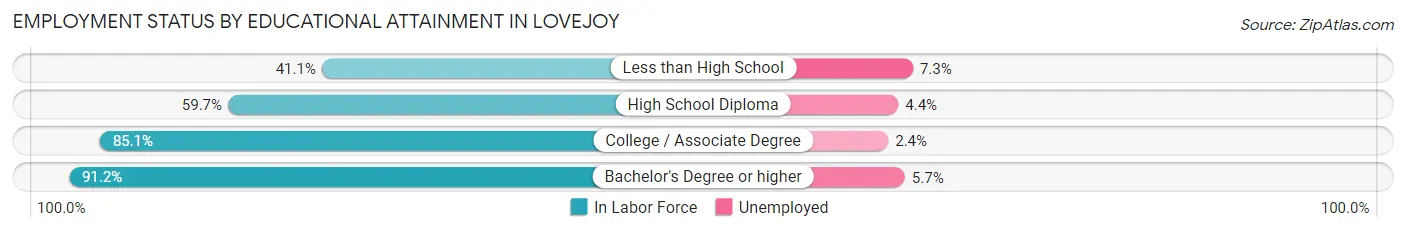
| Educational Attainment | In Labor Force | Unemployed |
| Less than High School | 179 (41.1%) | 32 (7.3%) |
| High School Diploma | 701 (59.7%) | 52 (4.4%) |
| College / Associate Degree | 1,681 (85.1%) | 47 (2.4%) |
| Bachelor's Degree or higher | 1,202 (91.2%) | 75 (5.7%) |
| Total | 3,761 (76.7%) | 201 (4.1%) |
Employment Occupations by Sex in Lovejoy
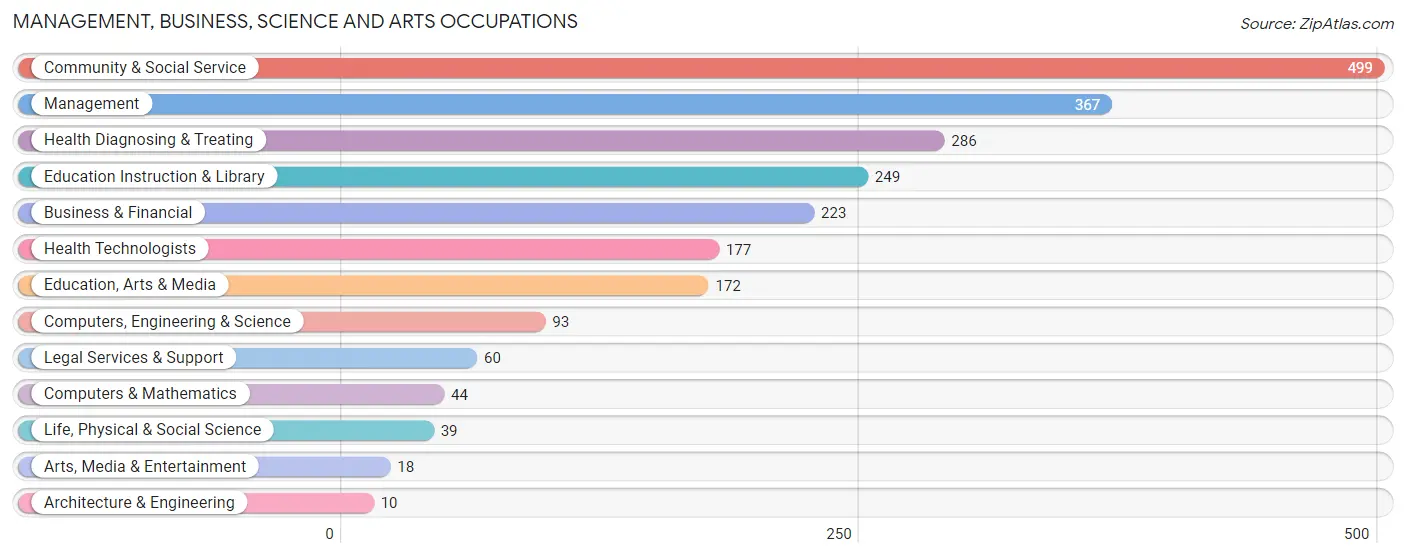
Management, Business, Science and Arts Occupations
The most common Management, Business, Science and Arts occupations in Lovejoy are Community & Social Service (499 | 13.2%), Management (367 | 9.7%), Health Diagnosing & Treating (286 | 7.6%), Education Instruction & Library (249 | 6.6%), and Business & Financial (223 | 5.9%).
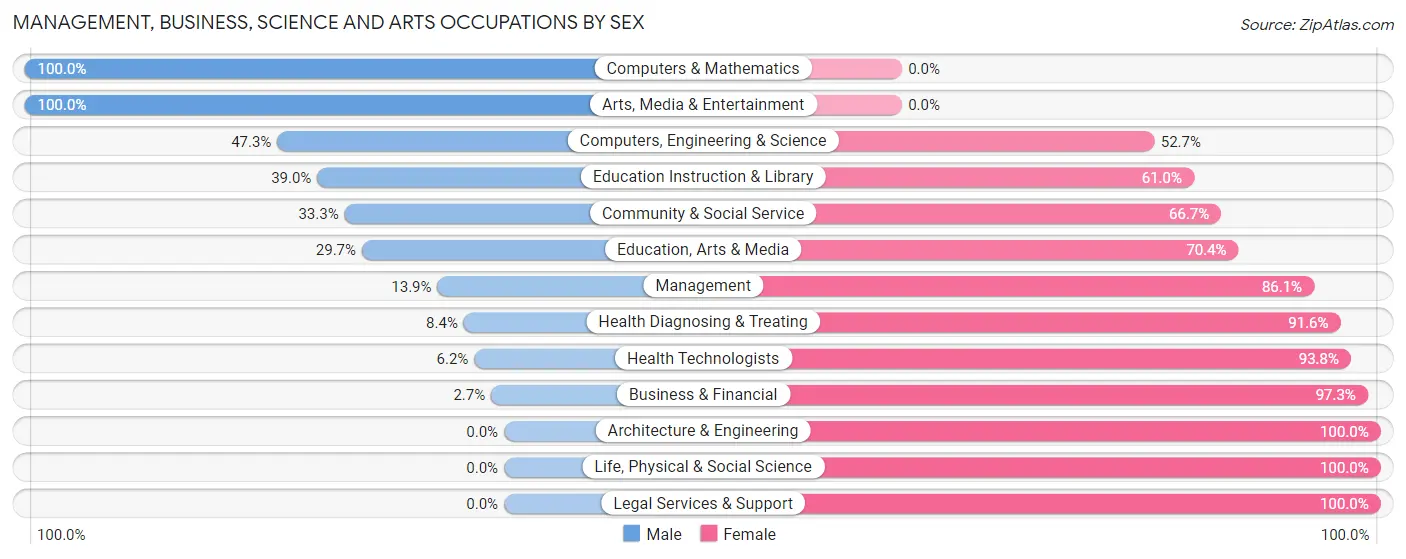
Management, Business, Science and Arts Occupations by Sex
Within the Management, Business, Science and Arts occupations in Lovejoy, the most male-oriented occupations are Computers & Mathematics (100.0%), Arts, Media & Entertainment (100.0%), and Computers, Engineering & Science (47.3%), while the most female-oriented occupations are Architecture & Engineering (100.0%), Life, Physical & Social Science (100.0%), and Legal Services & Support (100.0%).
| Occupation | Male | Female |
| Management | 51 (13.9%) | 316 (86.1%) |
| Business & Financial | 6 (2.7%) | 217 (97.3%) |
| Computers, Engineering & Science | 44 (47.3%) | 49 (52.7%) |
| Computers & Mathematics | 44 (100.0%) | 0 (0.0%) |
| Architecture & Engineering | 0 (0.0%) | 10 (100.0%) |
| Life, Physical & Social Science | 0 (0.0%) | 39 (100.0%) |
| Community & Social Service | 166 (33.3%) | 333 (66.7%) |
| Education, Arts & Media | 51 (29.6%) | 121 (70.4%) |
| Legal Services & Support | 0 (0.0%) | 60 (100.0%) |
| Education Instruction & Library | 97 (39.0%) | 152 (61.0%) |
| Arts, Media & Entertainment | 18 (100.0%) | 0 (0.0%) |
| Health Diagnosing & Treating | 24 (8.4%) | 262 (91.6%) |
| Health Technologists | 11 (6.2%) | 166 (93.8%) |
| Total (Category) | 291 (19.8%) | 1,177 (80.2%) |
| Total (Overall) | 1,540 (40.7%) | 2,239 (59.3%) |
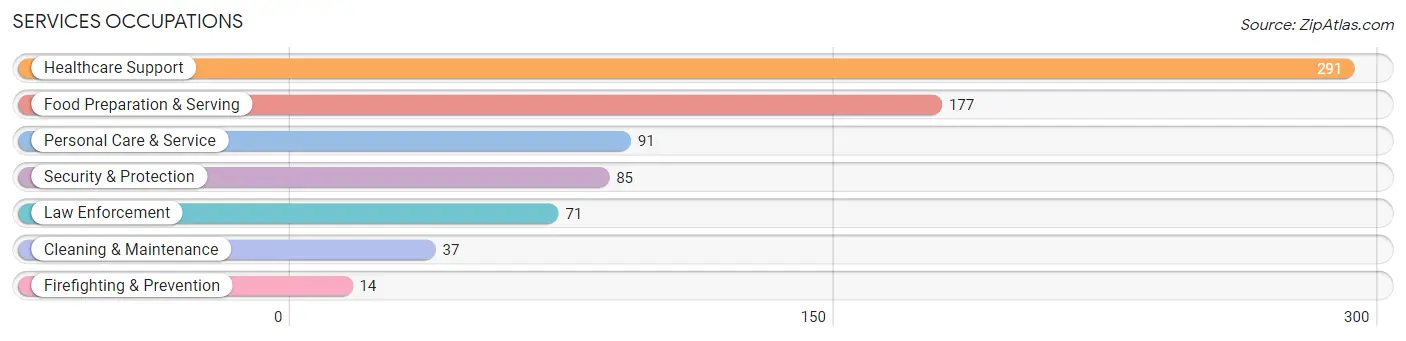
Services Occupations
The most common Services occupations in Lovejoy are Healthcare Support (291 | 7.7%), Food Preparation & Serving (177 | 4.7%), Personal Care & Service (91 | 2.4%), Security & Protection (85 | 2.2%), and Law Enforcement (71 | 1.9%).
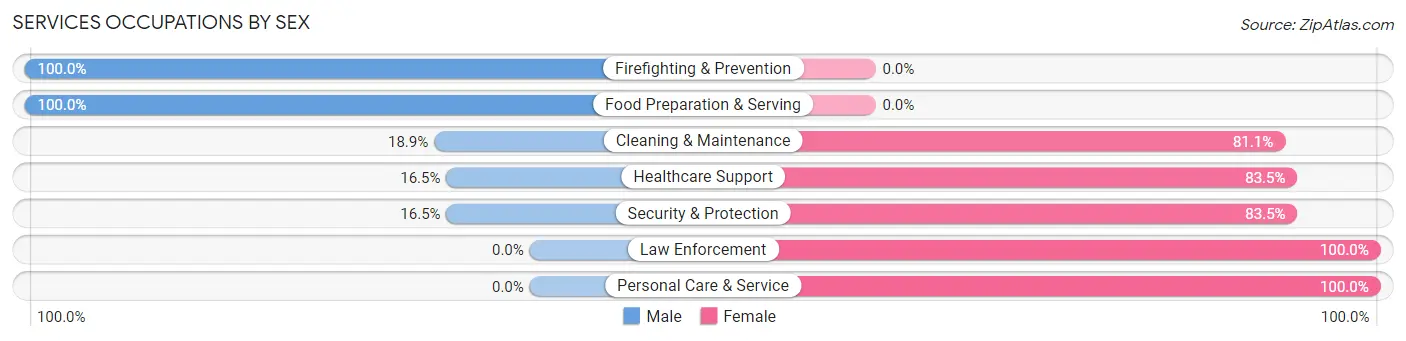
Services Occupations by Sex
Within the Services occupations in Lovejoy, the most male-oriented occupations are Firefighting & Prevention (100.0%), Food Preparation & Serving (100.0%), and Cleaning & Maintenance (18.9%), while the most female-oriented occupations are Law Enforcement (100.0%), Personal Care & Service (100.0%), and Security & Protection (83.5%).
| Occupation | Male | Female |
| Healthcare Support | 48 (16.5%) | 243 (83.5%) |
| Security & Protection | 14 (16.5%) | 71 (83.5%) |
| Firefighting & Prevention | 14 (100.0%) | 0 (0.0%) |
| Law Enforcement | 0 (0.0%) | 71 (100.0%) |
| Food Preparation & Serving | 177 (100.0%) | 0 (0.0%) |
| Cleaning & Maintenance | 7 (18.9%) | 30 (81.1%) |
| Personal Care & Service | 0 (0.0%) | 91 (100.0%) |
| Total (Category) | 246 (36.1%) | 435 (63.9%) |
| Total (Overall) | 1,540 (40.7%) | 2,239 (59.3%) |
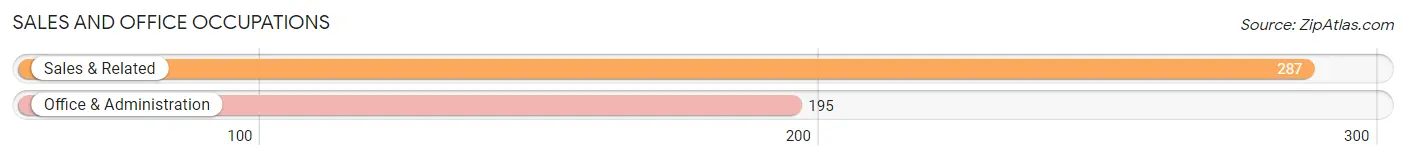
Sales and Office Occupations
The most common Sales and Office occupations in Lovejoy are Sales & Related (287 | 7.6%), and Office & Administration (195 | 5.2%).
Sales and Office Occupations by Sex
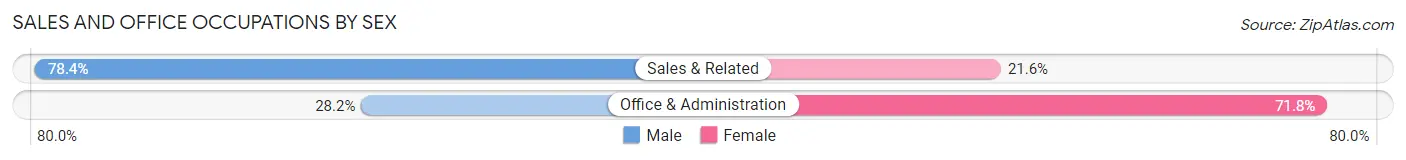
| Occupation | Male | Female |
| Sales & Related | 225 (78.4%) | 62 (21.6%) |
| Office & Administration | 55 (28.2%) | 140 (71.8%) |
| Total (Category) | 280 (58.1%) | 202 (41.9%) |
| Total (Overall) | 1,540 (40.7%) | 2,239 (59.3%) |
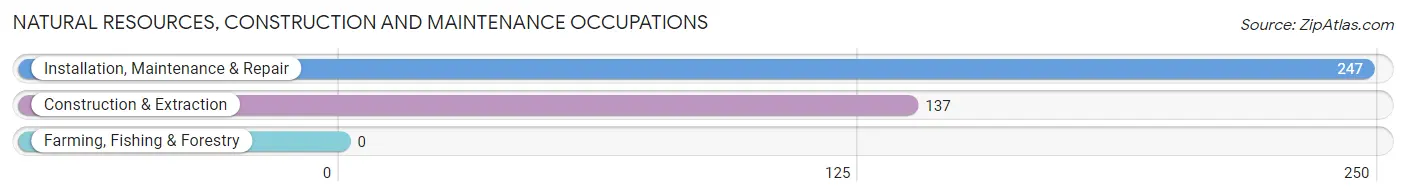
Natural Resources, Construction and Maintenance Occupations
The most common Natural Resources, Construction and Maintenance occupations in Lovejoy are Installation, Maintenance & Repair (247 | 6.5%), and Construction & Extraction (137 | 3.6%).
Natural Resources, Construction and Maintenance Occupations by Sex
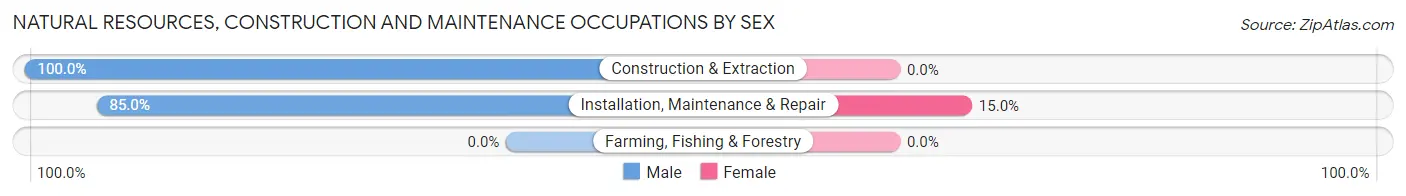
| Occupation | Male | Female |
| Farming, Fishing & Forestry | 0 (0.0%) | 0 (0.0%) |
| Construction & Extraction | 137 (100.0%) | 0 (0.0%) |
| Installation, Maintenance & Repair | 210 (85.0%) | 37 (15.0%) |
| Total (Category) | 347 (90.4%) | 37 (9.6%) |
| Total (Overall) | 1,540 (40.7%) | 2,239 (59.3%) |
Production, Transportation and Moving Occupations
The most common Production, Transportation and Moving occupations in Lovejoy are Transportation (434 | 11.5%), Material Moving (176 | 4.7%), and Production (154 | 4.1%).
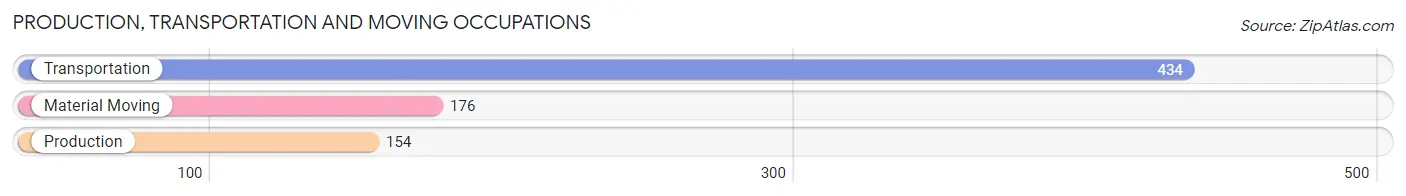
Production, Transportation and Moving Occupations by Sex
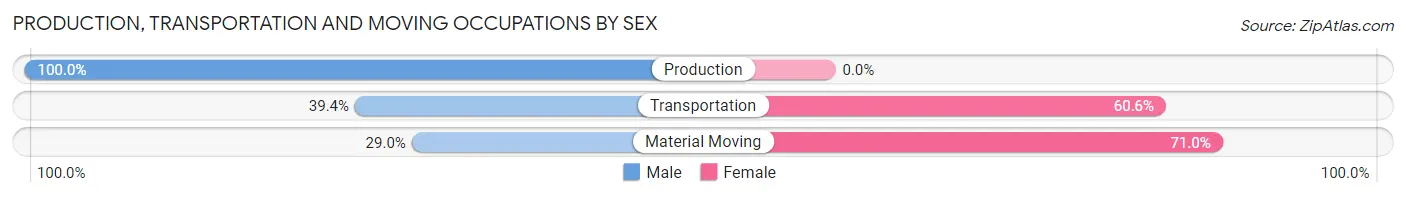
| Occupation | Male | Female |
| Production | 154 (100.0%) | 0 (0.0%) |
| Transportation | 171 (39.4%) | 263 (60.6%) |
| Material Moving | 51 (29.0%) | 125 (71.0%) |
| Total (Category) | 376 (49.2%) | 388 (50.8%) |
| Total (Overall) | 1,540 (40.7%) | 2,239 (59.3%) |
Employment Industries by Sex in Lovejoy
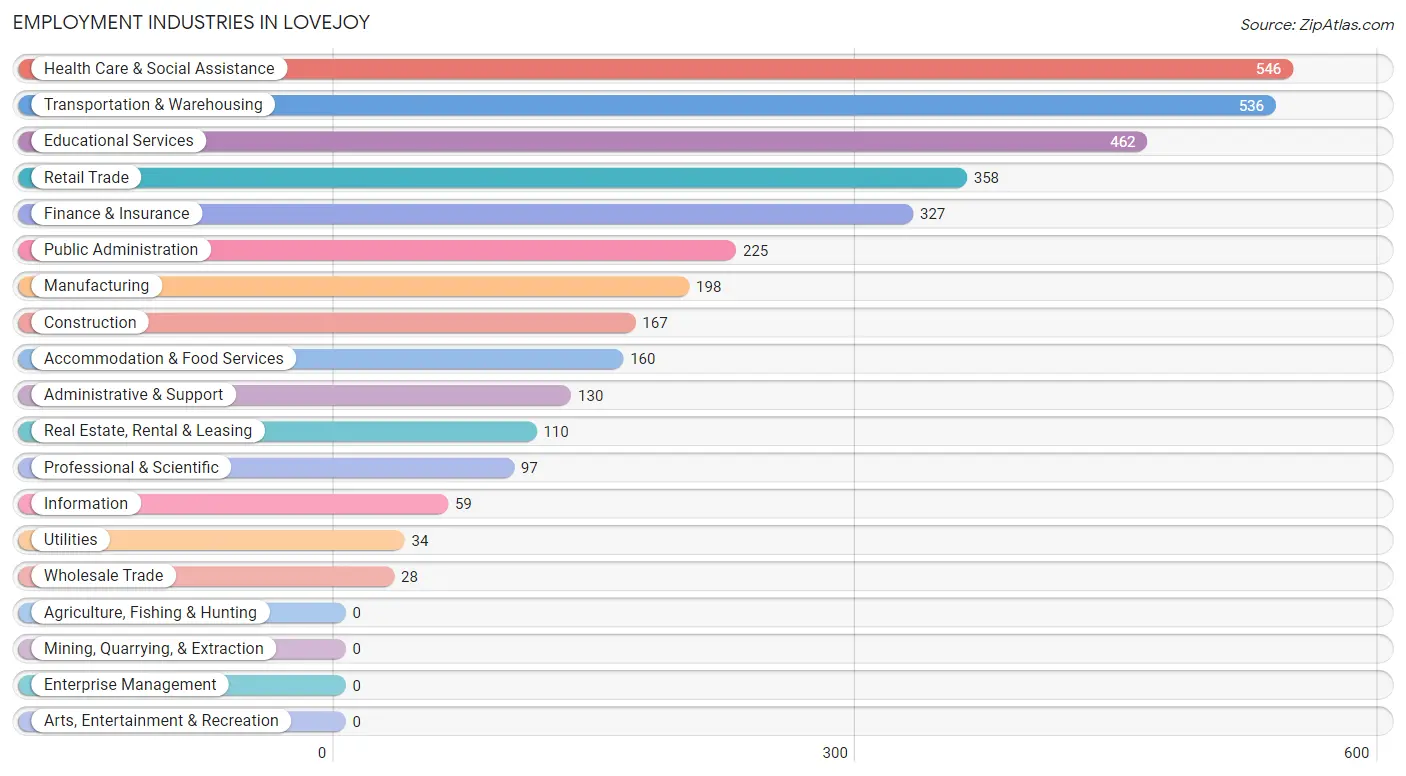
Employment Industries in Lovejoy
The major employment industries in Lovejoy include Health Care & Social Assistance (546 | 14.4%), Transportation & Warehousing (536 | 14.2%), Educational Services (462 | 12.2%), Retail Trade (358 | 9.5%), and Finance & Insurance (327 | 8.6%).
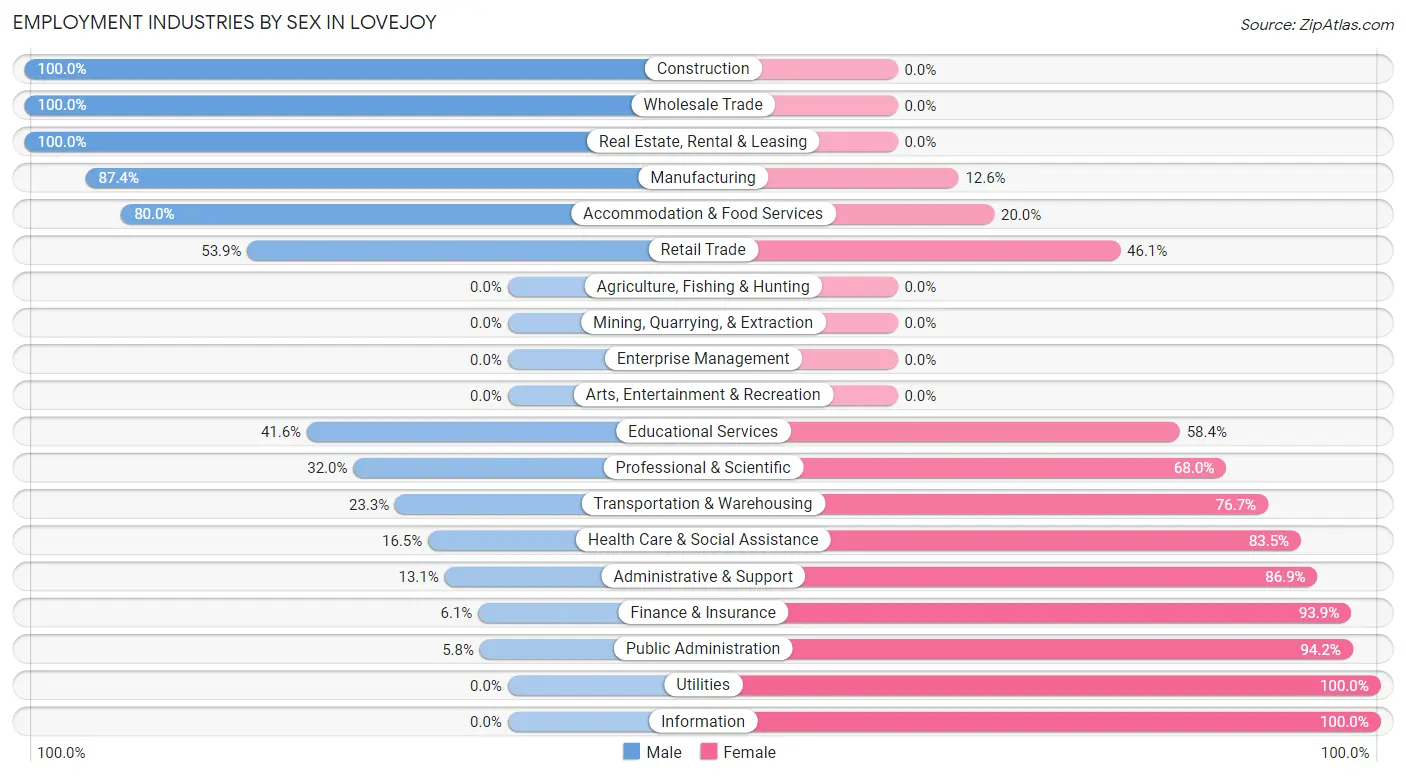
Employment Industries by Sex in Lovejoy
The Lovejoy industries that see more men than women are Construction (100.0%), Wholesale Trade (100.0%), and Real Estate, Rental & Leasing (100.0%), whereas the industries that tend to have a higher number of women are Utilities (100.0%), Information (100.0%), and Public Administration (94.2%).
| Industry | Male | Female |
| Agriculture, Fishing & Hunting | 0 (0.0%) | 0 (0.0%) |
| Mining, Quarrying, & Extraction | 0 (0.0%) | 0 (0.0%) |
| Construction | 167 (100.0%) | 0 (0.0%) |
| Manufacturing | 173 (87.4%) | 25 (12.6%) |
| Wholesale Trade | 28 (100.0%) | 0 (0.0%) |
| Retail Trade | 193 (53.9%) | 165 (46.1%) |
| Transportation & Warehousing | 125 (23.3%) | 411 (76.7%) |
| Utilities | 0 (0.0%) | 34 (100.0%) |
| Information | 0 (0.0%) | 59 (100.0%) |
| Finance & Insurance | 20 (6.1%) | 307 (93.9%) |
| Real Estate, Rental & Leasing | 110 (100.0%) | 0 (0.0%) |
| Professional & Scientific | 31 (32.0%) | 66 (68.0%) |
| Enterprise Management | 0 (0.0%) | 0 (0.0%) |
| Administrative & Support | 17 (13.1%) | 113 (86.9%) |
| Educational Services | 192 (41.6%) | 270 (58.4%) |
| Health Care & Social Assistance | 90 (16.5%) | 456 (83.5%) |
| Arts, Entertainment & Recreation | 0 (0.0%) | 0 (0.0%) |
| Accommodation & Food Services | 128 (80.0%) | 32 (20.0%) |
| Public Administration | 13 (5.8%) | 212 (94.2%) |
| Total | 1,540 (40.7%) | 2,239 (59.3%) |
Education in Lovejoy
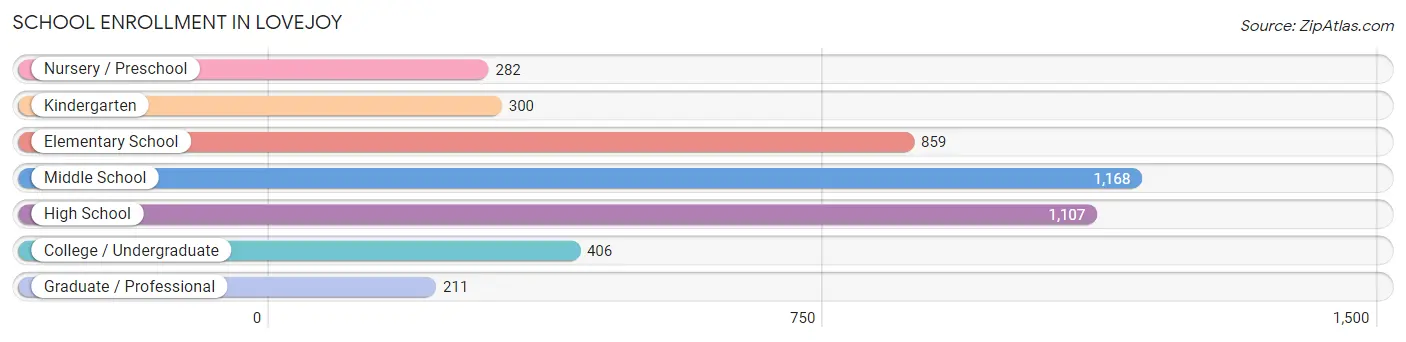
School Enrollment in Lovejoy
The most common levels of schooling among the 4,333 students in Lovejoy are middle school (1,168 | 27.0%), high school (1,107 | 25.6%), and elementary school (859 | 19.8%).
| School Level | # Students | % Students |
| Nursery / Preschool | 282 | 6.5% |
| Kindergarten | 300 | 6.9% |
| Elementary School | 859 | 19.8% |
| Middle School | 1,168 | 27.0% |
| High School | 1,107 | 25.6% |
| College / Undergraduate | 406 | 9.4% |
| Graduate / Professional | 211 | 4.9% |
| Total | 4,333 | 100.0% |
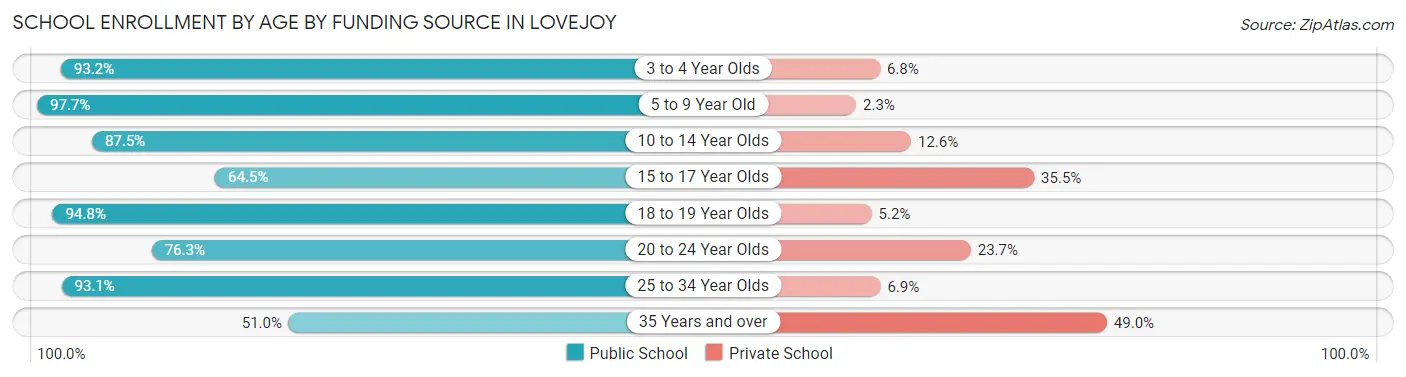
School Enrollment by Age by Funding Source in Lovejoy
Out of a total of 4,333 students who are enrolled in schools in Lovejoy, 633 (14.6%) attend a private institution, while the remaining 3,700 (85.4%) are enrolled in public schools. The age group of 35 years and over has the highest likelihood of being enrolled in private schools, with 101 (49.0% in the age bracket) enrolled. Conversely, the age group of 5 to 9 year old has the lowest likelihood of being enrolled in a private school, with 1,139 (97.7% in the age bracket) attending a public institution.
| Age Bracket | Public School | Private School |
| 3 to 4 Year Olds | 207 (93.2%) | 15 (6.8%) |
| 5 to 9 Year Old | 1,139 (97.7%) | 27 (2.3%) |
| 10 to 14 Year Olds | 1,261 (87.5%) | 181 (12.6%) |
| 15 to 17 Year Olds | 480 (64.5%) | 264 (35.5%) |
| 18 to 19 Year Olds | 328 (94.8%) | 18 (5.2%) |
| 20 to 24 Year Olds | 58 (76.3%) | 18 (23.7%) |
| 25 to 34 Year Olds | 122 (93.1%) | 9 (6.9%) |
| 35 Years and over | 105 (51.0%) | 101 (49.0%) |
| Total | 3,700 (85.4%) | 633 (14.6%) |
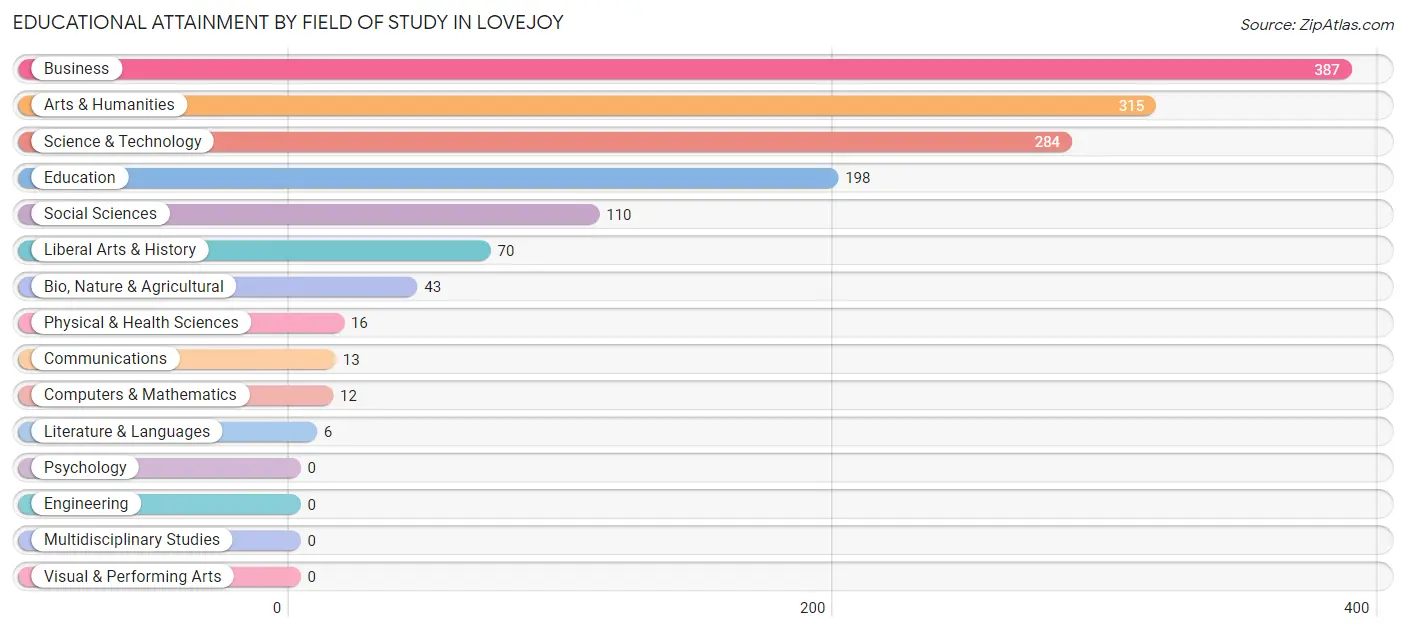
Educational Attainment by Field of Study in Lovejoy
Business (387 | 26.6%), arts & humanities (315 | 21.7%), science & technology (284 | 19.5%), education (198 | 13.6%), and social sciences (110 | 7.6%) are the most common fields of study among 1,454 individuals in Lovejoy who have obtained a bachelor's degree or higher.
| Field of Study | # Graduates | % Graduates |
| Computers & Mathematics | 12 | 0.8% |
| Bio, Nature & Agricultural | 43 | 3.0% |
| Physical & Health Sciences | 16 | 1.1% |
| Psychology | 0 | 0.0% |
| Social Sciences | 110 | 7.6% |
| Engineering | 0 | 0.0% |
| Multidisciplinary Studies | 0 | 0.0% |
| Science & Technology | 284 | 19.5% |
| Business | 387 | 26.6% |
| Education | 198 | 13.6% |
| Literature & Languages | 6 | 0.4% |
| Liberal Arts & History | 70 | 4.8% |
| Visual & Performing Arts | 0 | 0.0% |
| Communications | 13 | 0.9% |
| Arts & Humanities | 315 | 21.7% |
| Total | 1,454 | 100.0% |
Transportation & Commute in Lovejoy
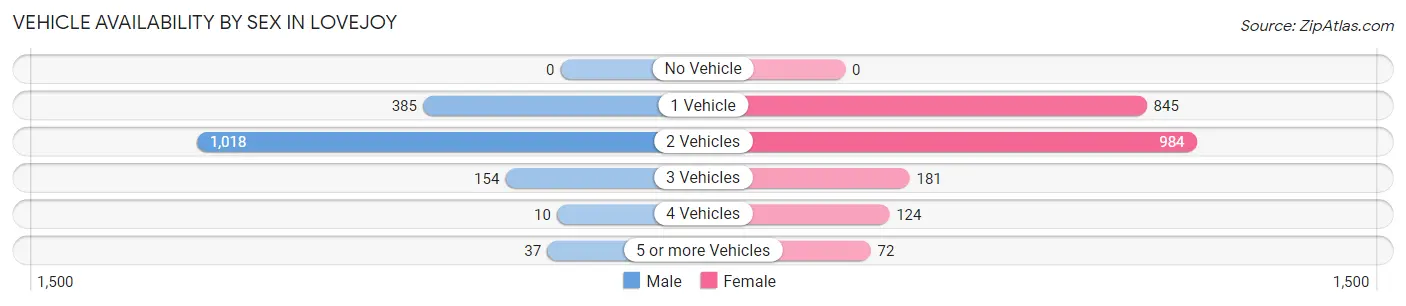
Vehicle Availability by Sex in Lovejoy
The most prevalent vehicle ownership categories in Lovejoy are males with 2 vehicles (1,018, accounting for 63.5%) and females with 2 vehicles (984, making up 46.2%).
| Vehicles Available | Male | Female |
| No Vehicle | 0 (0.0%) | 0 (0.0%) |
| 1 Vehicle | 385 (24.0%) | 845 (38.3%) |
| 2 Vehicles | 1,018 (63.5%) | 984 (44.6%) |
| 3 Vehicles | 154 (9.6%) | 181 (8.2%) |
| 4 Vehicles | 10 (0.6%) | 124 (5.6%) |
| 5 or more Vehicles | 37 (2.3%) | 72 (3.3%) |
| Total | 1,604 (100.0%) | 2,206 (100.0%) |
Commute Time in Lovejoy
The most frequently occuring commute durations in Lovejoy are 30 to 34 minutes (597 commuters, 17.8%), 60 to 89 minutes (538 commuters, 16.1%), and 45 to 59 minutes (521 commuters, 15.5%).
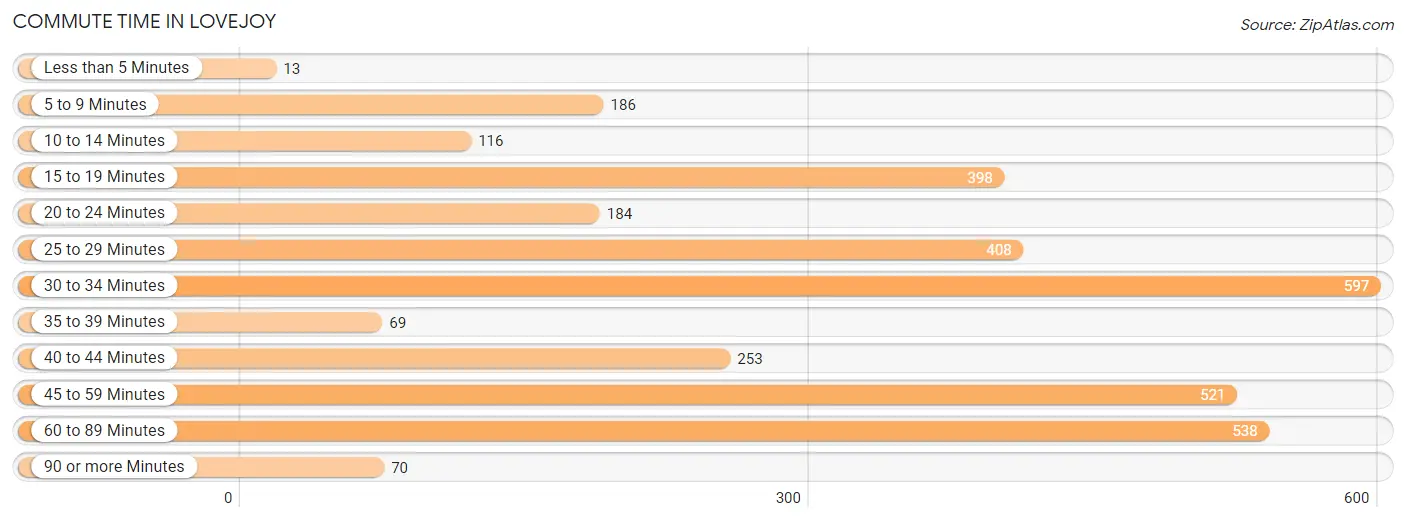
| Commute Time | # Commuters | % Commuters |
| Less than 5 Minutes | 13 | 0.4% |
| 5 to 9 Minutes | 186 | 5.6% |
| 10 to 14 Minutes | 116 | 3.5% |
| 15 to 19 Minutes | 398 | 11.9% |
| 20 to 24 Minutes | 184 | 5.5% |
| 25 to 29 Minutes | 408 | 12.2% |
| 30 to 34 Minutes | 597 | 17.8% |
| 35 to 39 Minutes | 69 | 2.1% |
| 40 to 44 Minutes | 253 | 7.5% |
| 45 to 59 Minutes | 521 | 15.5% |
| 60 to 89 Minutes | 538 | 16.1% |
| 90 or more Minutes | 70 | 2.1% |
Commute Time by Sex in Lovejoy
The most common commute times in Lovejoy are 60 to 89 minutes (373 commuters, 25.4%) for males and 30 to 34 minutes (503 commuters, 26.7%) for females.
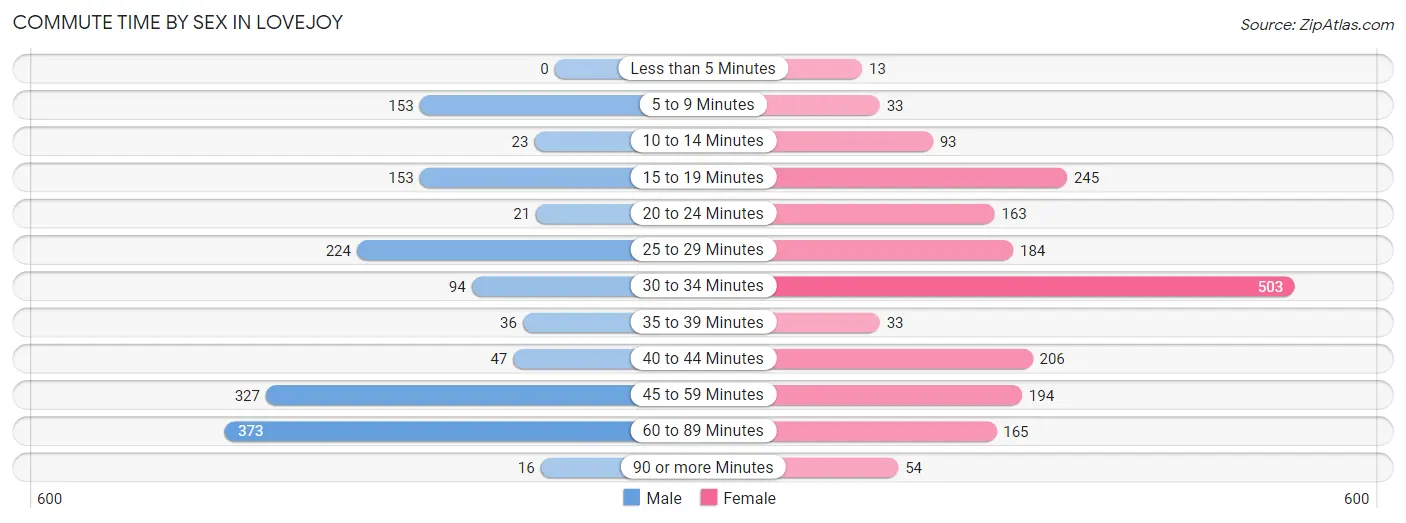
| Commute Time | Male | Female |
| Less than 5 Minutes | 0 (0.0%) | 13 (0.7%) |
| 5 to 9 Minutes | 153 (10.4%) | 33 (1.8%) |
| 10 to 14 Minutes | 23 (1.6%) | 93 (4.9%) |
| 15 to 19 Minutes | 153 (10.4%) | 245 (13.0%) |
| 20 to 24 Minutes | 21 (1.4%) | 163 (8.6%) |
| 25 to 29 Minutes | 224 (15.3%) | 184 (9.8%) |
| 30 to 34 Minutes | 94 (6.4%) | 503 (26.7%) |
| 35 to 39 Minutes | 36 (2.5%) | 33 (1.8%) |
| 40 to 44 Minutes | 47 (3.2%) | 206 (10.9%) |
| 45 to 59 Minutes | 327 (22.3%) | 194 (10.3%) |
| 60 to 89 Minutes | 373 (25.4%) | 165 (8.7%) |
| 90 or more Minutes | 16 (1.1%) | 54 (2.9%) |
Time of Departure to Work by Sex in Lovejoy
The most frequent times of departure to work in Lovejoy are 12:00 AM to 4:59 AM (369, 25.2%) for males and 9:00 AM to 9:59 AM (317, 16.8%) for females.
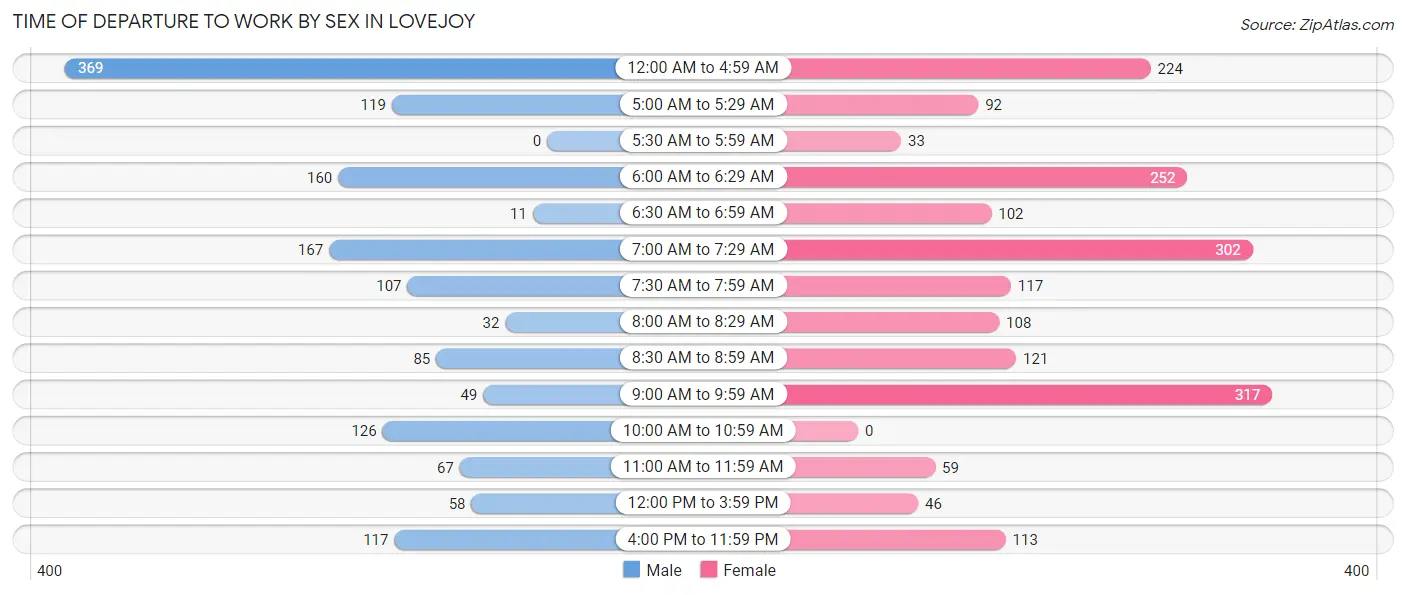
| Time of Departure | Male | Female |
| 12:00 AM to 4:59 AM | 369 (25.2%) | 224 (11.9%) |
| 5:00 AM to 5:29 AM | 119 (8.1%) | 92 (4.9%) |
| 5:30 AM to 5:59 AM | 0 (0.0%) | 33 (1.8%) |
| 6:00 AM to 6:29 AM | 160 (10.9%) | 252 (13.4%) |
| 6:30 AM to 6:59 AM | 11 (0.7%) | 102 (5.4%) |
| 7:00 AM to 7:29 AM | 167 (11.4%) | 302 (16.0%) |
| 7:30 AM to 7:59 AM | 107 (7.3%) | 117 (6.2%) |
| 8:00 AM to 8:29 AM | 32 (2.2%) | 108 (5.7%) |
| 8:30 AM to 8:59 AM | 85 (5.8%) | 121 (6.4%) |
| 9:00 AM to 9:59 AM | 49 (3.3%) | 317 (16.8%) |
| 10:00 AM to 10:59 AM | 126 (8.6%) | 0 (0.0%) |
| 11:00 AM to 11:59 AM | 67 (4.6%) | 59 (3.1%) |
| 12:00 PM to 3:59 PM | 58 (4.0%) | 46 (2.4%) |
| 4:00 PM to 11:59 PM | 117 (8.0%) | 113 (6.0%) |
| Total | 1,467 (100.0%) | 1,886 (100.0%) |
Housing Occupancy in Lovejoy
Occupancy by Ownership in Lovejoy
Of the total 3,053 dwellings in Lovejoy, owner-occupied units account for 1,931 (63.2%), while renter-occupied units make up 1,122 (36.7%).
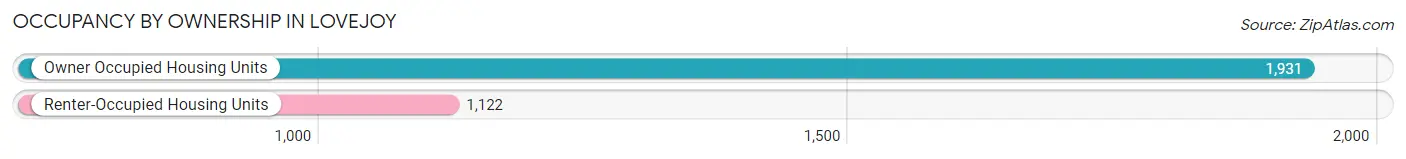
| Occupancy | # Housing Units | % Housing Units |
| Owner Occupied Housing Units | 1,931 | 63.2% |
| Renter-Occupied Housing Units | 1,122 | 36.7% |
| Total Occupied Housing Units | 3,053 | 100.0% |
Occupancy by Household Size in Lovejoy
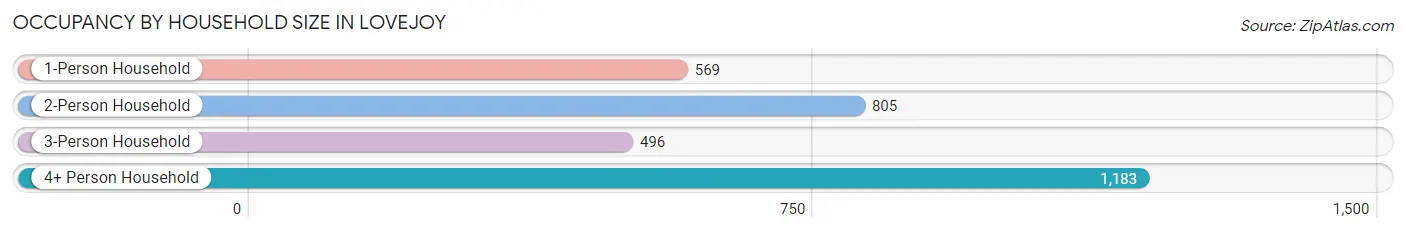
| Household Size | # Housing Units | % Housing Units |
| 1-Person Household | 569 | 18.6% |
| 2-Person Household | 805 | 26.4% |
| 3-Person Household | 496 | 16.3% |
| 4+ Person Household | 1,183 | 38.8% |
| Total Housing Units | 3,053 | 100.0% |
Occupancy by Ownership by Household Size in Lovejoy
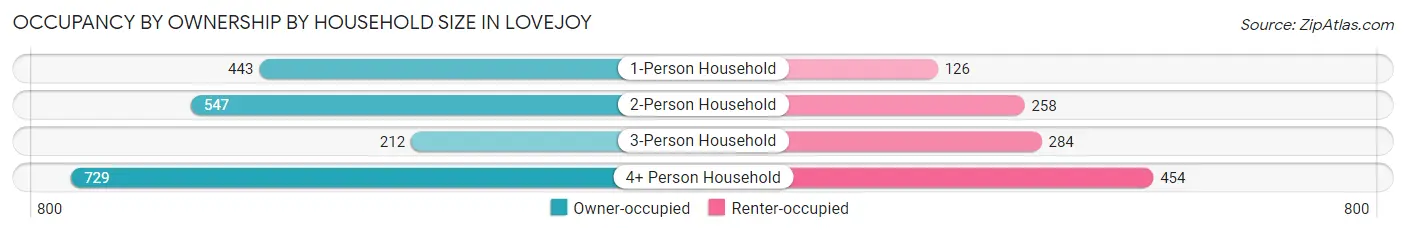
| Household Size | Owner-occupied | Renter-occupied |
| 1-Person Household | 443 (77.9%) | 126 (22.1%) |
| 2-Person Household | 547 (67.9%) | 258 (32.1%) |
| 3-Person Household | 212 (42.7%) | 284 (57.3%) |
| 4+ Person Household | 729 (61.6%) | 454 (38.4%) |
| Total Housing Units | 1,931 (63.2%) | 1,122 (36.7%) |
Occupancy by Educational Attainment in Lovejoy
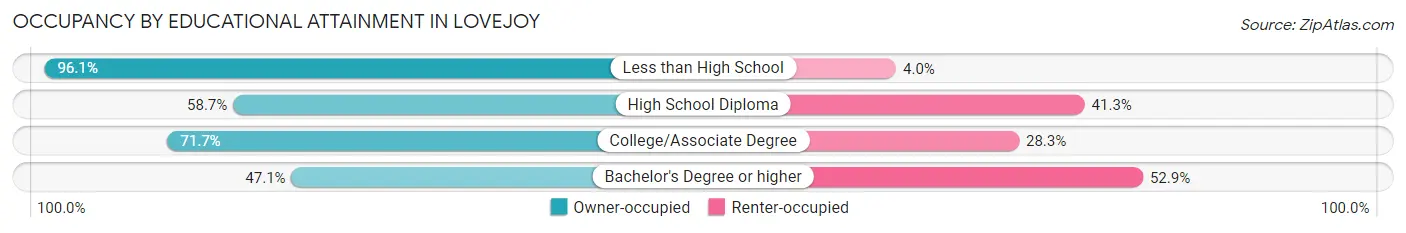
| Household Size | Owner-occupied | Renter-occupied |
| Less than High School | 219 (96.1%) | 9 (4.0%) |
| High School Diploma | 359 (58.7%) | 253 (41.3%) |
| College/Associate Degree | 906 (71.7%) | 358 (28.3%) |
| Bachelor's Degree or higher | 447 (47.1%) | 502 (52.9%) |
Occupancy by Age of Householder in Lovejoy
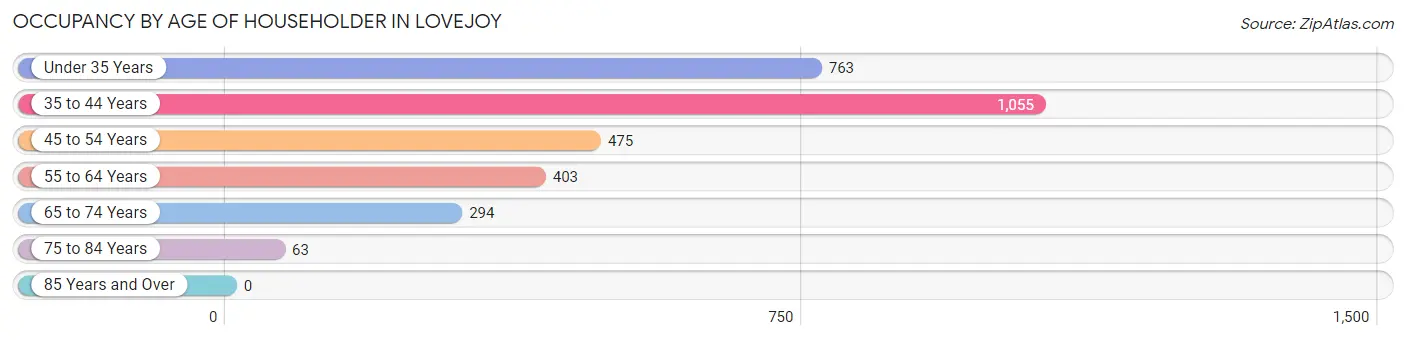
| Age Bracket | # Households | % Households |
| Under 35 Years | 763 | 25.0% |
| 35 to 44 Years | 1,055 | 34.6% |
| 45 to 54 Years | 475 | 15.6% |
| 55 to 64 Years | 403 | 13.2% |
| 65 to 74 Years | 294 | 9.6% |
| 75 to 84 Years | 63 | 2.1% |
| 85 Years and Over | 0 | 0.0% |
| Total | 3,053 | 100.0% |
Housing Finances in Lovejoy
Median Income by Occupancy in Lovejoy
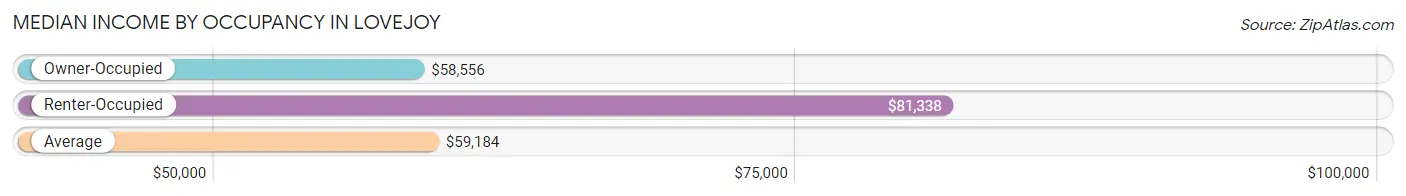
| Occupancy Type | # Households | Median Income |
| Owner-Occupied | 1,931 (63.2%) | $58,556 |
| Renter-Occupied | 1,122 (36.7%) | $81,338 |
| Average | 3,053 (100.0%) | $59,184 |
Occupancy by Householder Income Bracket in Lovejoy
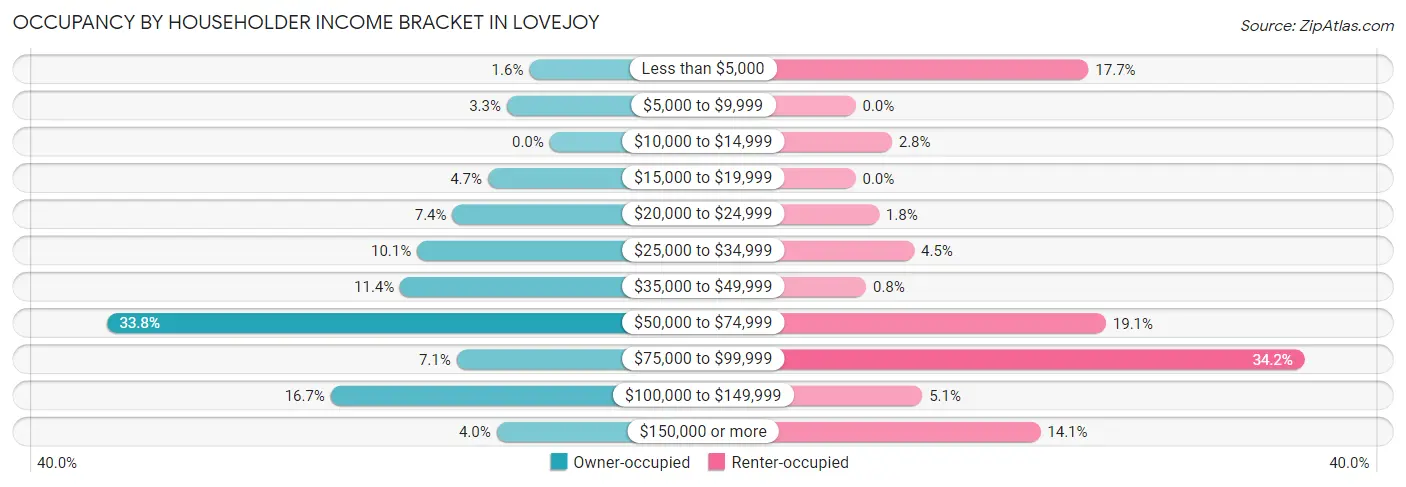
| Income Bracket | Owner-occupied | Renter-occupied |
| Less than $5,000 | 30 (1.5%) | 199 (17.7%) |
| $5,000 to $9,999 | 63 (3.3%) | 0 (0.0%) |
| $10,000 to $14,999 | 0 (0.0%) | 31 (2.8%) |
| $15,000 to $19,999 | 91 (4.7%) | 0 (0.0%) |
| $20,000 to $24,999 | 143 (7.4%) | 20 (1.8%) |
| $25,000 to $34,999 | 195 (10.1%) | 50 (4.5%) |
| $35,000 to $49,999 | 220 (11.4%) | 9 (0.8%) |
| $50,000 to $74,999 | 652 (33.8%) | 214 (19.1%) |
| $75,000 to $99,999 | 137 (7.1%) | 384 (34.2%) |
| $100,000 to $149,999 | 322 (16.7%) | 57 (5.1%) |
| $150,000 or more | 78 (4.0%) | 158 (14.1%) |
| Total | 1,931 (100.0%) | 1,122 (100.0%) |
Monthly Housing Cost Tiers in Lovejoy
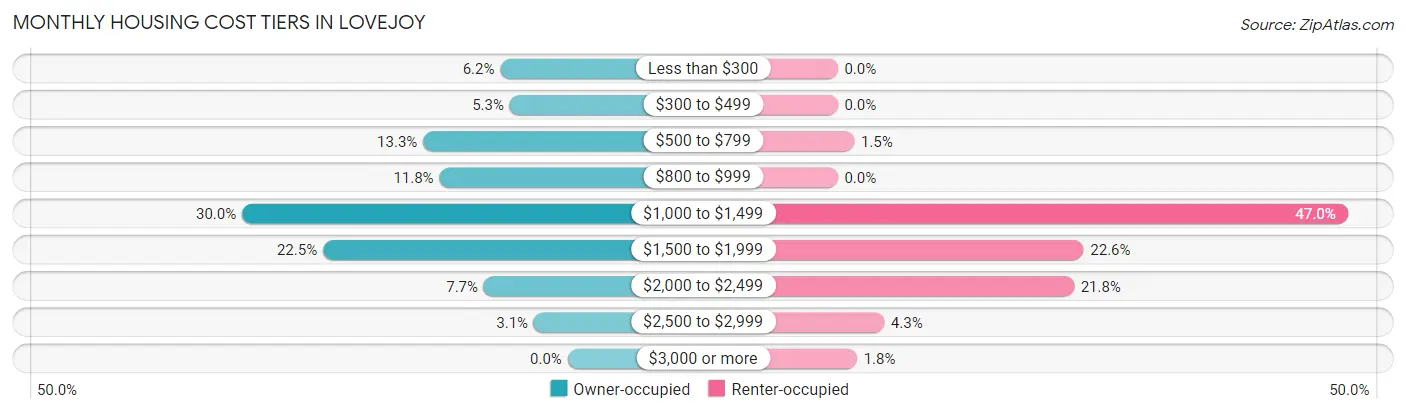
| Monthly Cost | Owner-occupied | Renter-occupied |
| Less than $300 | 120 (6.2%) | 0 (0.0%) |
| $300 to $499 | 103 (5.3%) | 0 (0.0%) |
| $500 to $799 | 257 (13.3%) | 17 (1.5%) |
| $800 to $999 | 228 (11.8%) | 0 (0.0%) |
| $1,000 to $1,499 | 579 (30.0%) | 527 (47.0%) |
| $1,500 to $1,999 | 435 (22.5%) | 254 (22.6%) |
| $2,000 to $2,499 | 149 (7.7%) | 244 (21.7%) |
| $2,500 to $2,999 | 60 (3.1%) | 48 (4.3%) |
| $3,000 or more | 0 (0.0%) | 20 (1.8%) |
| Total | 1,931 (100.0%) | 1,122 (100.0%) |
Physical Housing Characteristics in Lovejoy
Housing Structures in Lovejoy
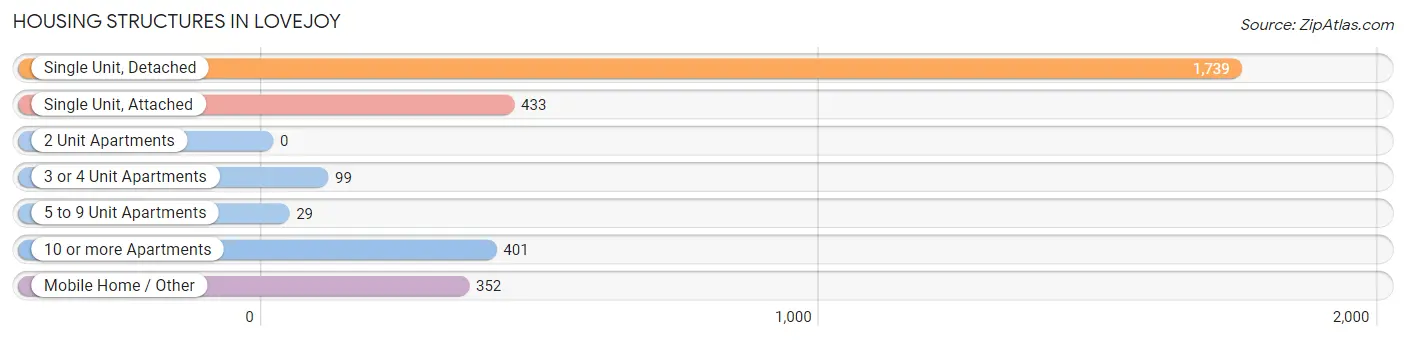
| Structure Type | # Housing Units | % Housing Units |
| Single Unit, Detached | 1,739 | 57.0% |
| Single Unit, Attached | 433 | 14.2% |
| 2 Unit Apartments | 0 | 0.0% |
| 3 or 4 Unit Apartments | 99 | 3.2% |
| 5 to 9 Unit Apartments | 29 | 0.9% |
| 10 or more Apartments | 401 | 13.1% |
| Mobile Home / Other | 352 | 11.5% |
| Total | 3,053 | 100.0% |
Housing Structures by Occupancy in Lovejoy
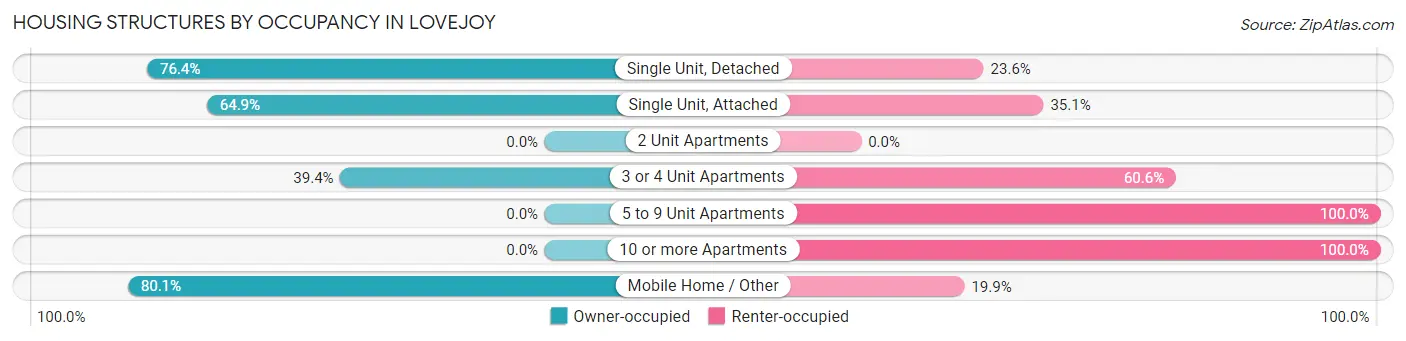
| Structure Type | Owner-occupied | Renter-occupied |
| Single Unit, Detached | 1,329 (76.4%) | 410 (23.6%) |
| Single Unit, Attached | 281 (64.9%) | 152 (35.1%) |
| 2 Unit Apartments | 0 (0.0%) | 0 (0.0%) |
| 3 or 4 Unit Apartments | 39 (39.4%) | 60 (60.6%) |
| 5 to 9 Unit Apartments | 0 (0.0%) | 29 (100.0%) |
| 10 or more Apartments | 0 (0.0%) | 401 (100.0%) |
| Mobile Home / Other | 282 (80.1%) | 70 (19.9%) |
| Total | 1,931 (63.2%) | 1,122 (36.7%) |
Housing Structures by Number of Rooms in Lovejoy
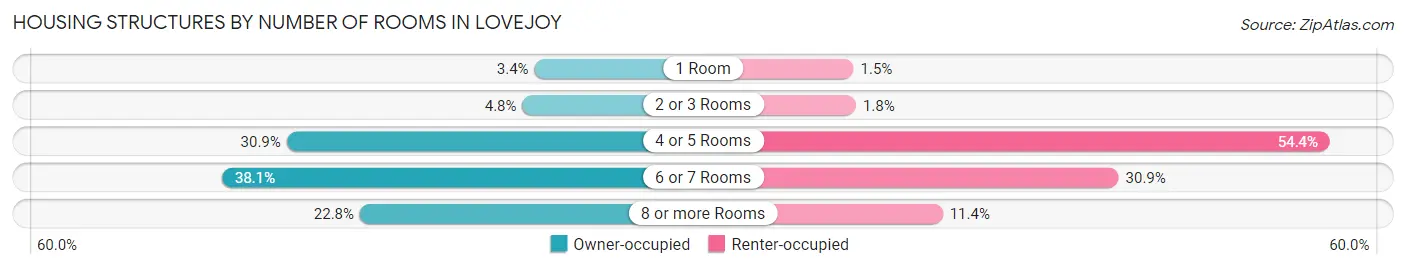
| Number of Rooms | Owner-occupied | Renter-occupied |
| 1 Room | 66 (3.4%) | 17 (1.5%) |
| 2 or 3 Rooms | 92 (4.8%) | 20 (1.8%) |
| 4 or 5 Rooms | 597 (30.9%) | 610 (54.4%) |
| 6 or 7 Rooms | 736 (38.1%) | 347 (30.9%) |
| 8 or more Rooms | 440 (22.8%) | 128 (11.4%) |
| Total | 1,931 (100.0%) | 1,122 (100.0%) |
Housing Structure by Heating Type in Lovejoy
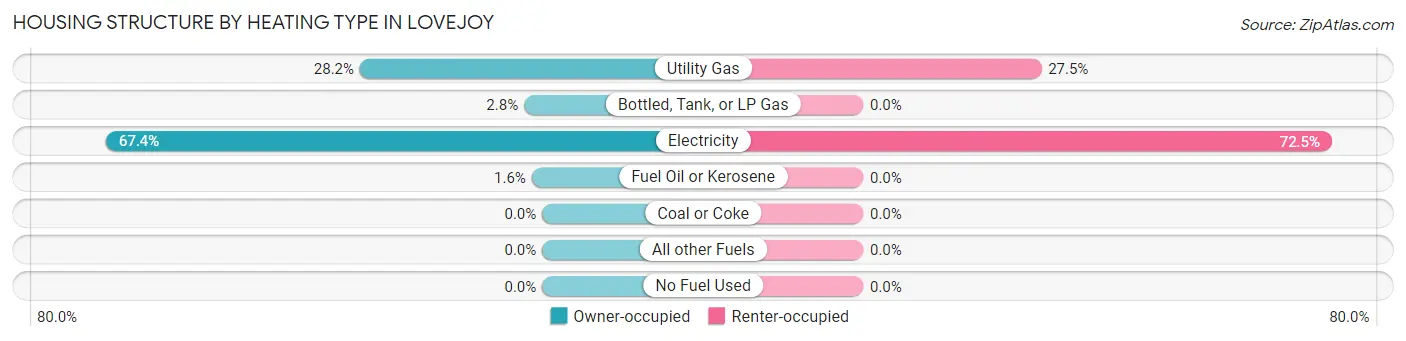
| Heating Type | Owner-occupied | Renter-occupied |
| Utility Gas | 544 (28.2%) | 309 (27.5%) |
| Bottled, Tank, or LP Gas | 54 (2.8%) | 0 (0.0%) |
| Electricity | 1,302 (67.4%) | 813 (72.5%) |
| Fuel Oil or Kerosene | 31 (1.6%) | 0 (0.0%) |
| Coal or Coke | 0 (0.0%) | 0 (0.0%) |
| All other Fuels | 0 (0.0%) | 0 (0.0%) |
| No Fuel Used | 0 (0.0%) | 0 (0.0%) |
| Total | 1,931 (100.0%) | 1,122 (100.0%) |
Household Vehicle Usage in Lovejoy
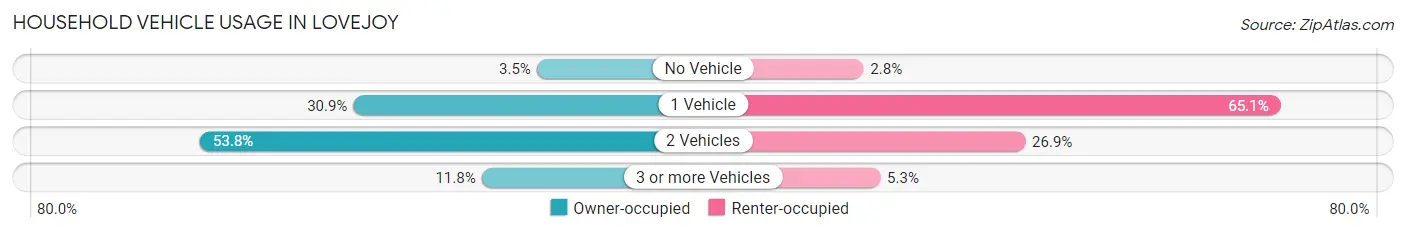
| Vehicles per Household | Owner-occupied | Renter-occupied |
| No Vehicle | 68 (3.5%) | 31 (2.8%) |
| 1 Vehicle | 597 (30.9%) | 730 (65.1%) |
| 2 Vehicles | 1,039 (53.8%) | 302 (26.9%) |
| 3 or more Vehicles | 227 (11.8%) | 59 (5.3%) |
| Total | 1,931 (100.0%) | 1,122 (100.0%) |
Real Estate & Mortgages in Lovejoy
Real Estate and Mortgage Overview in Lovejoy
| Characteristic | Without Mortgage | With Mortgage |
| Housing Units | 484 | 1,447 |
| Median Property Value | $107,900 | $206,300 |
| Median Household Income | $37,927 | $78 |
| Monthly Housing Costs | $717 | $0 |
| Real Estate Taxes | - | - |
Property Value by Mortgage Status in Lovejoy
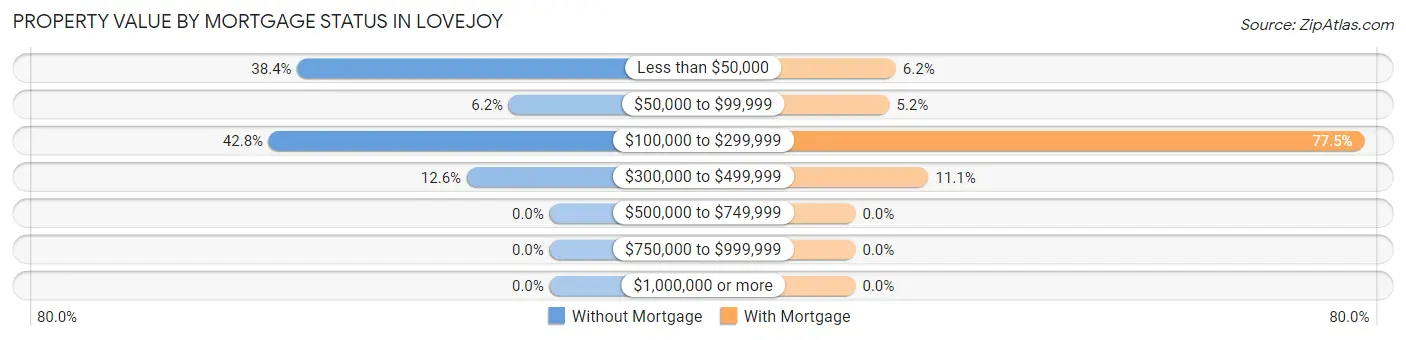
| Property Value | Without Mortgage | With Mortgage |
| Less than $50,000 | 186 (38.4%) | 89 (6.1%) |
| $50,000 to $99,999 | 30 (6.2%) | 75 (5.2%) |
| $100,000 to $299,999 | 207 (42.8%) | 1,122 (77.5%) |
| $300,000 to $499,999 | 61 (12.6%) | 161 (11.1%) |
| $500,000 to $749,999 | 0 (0.0%) | 0 (0.0%) |
| $750,000 to $999,999 | 0 (0.0%) | 0 (0.0%) |
| $1,000,000 or more | 0 (0.0%) | 0 (0.0%) |
| Total | 484 (100.0%) | 1,447 (100.0%) |
Household Income by Mortgage Status in Lovejoy
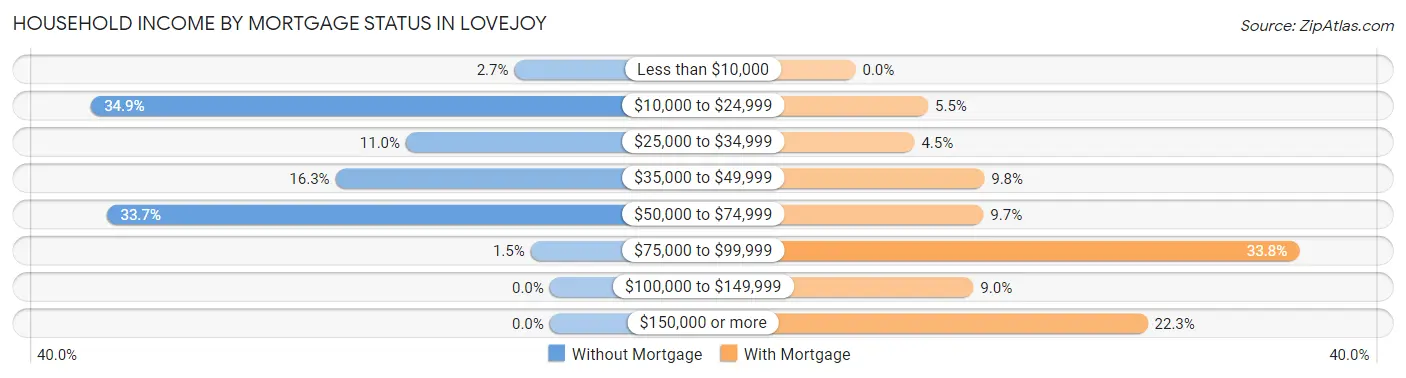
| Household Income | Without Mortgage | With Mortgage |
| Less than $10,000 | 13 (2.7%) | 0 (0.0%) |
| $10,000 to $24,999 | 169 (34.9%) | 80 (5.5%) |
| $25,000 to $34,999 | 53 (11.0%) | 65 (4.5%) |
| $35,000 to $49,999 | 79 (16.3%) | 142 (9.8%) |
| $50,000 to $74,999 | 163 (33.7%) | 141 (9.7%) |
| $75,000 to $99,999 | 7 (1.5%) | 489 (33.8%) |
| $100,000 to $149,999 | 0 (0.0%) | 130 (9.0%) |
| $150,000 or more | 0 (0.0%) | 322 (22.3%) |
| Total | 484 (100.0%) | 1,447 (100.0%) |
Property Value to Household Income Ratio in Lovejoy
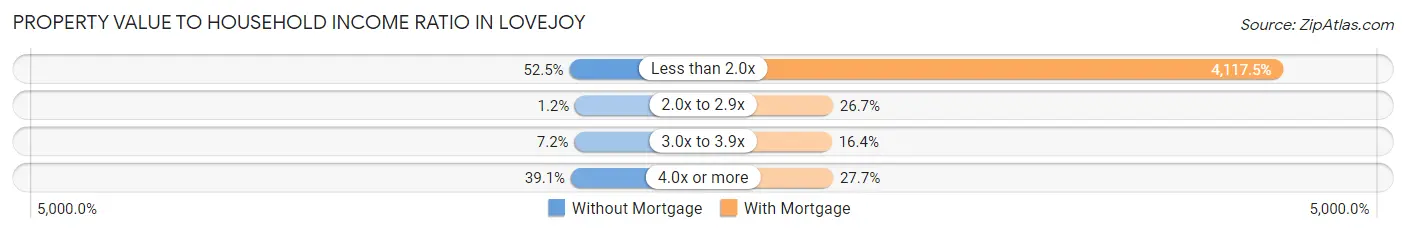
| Value-to-Income Ratio | Without Mortgage | With Mortgage |
| Less than 2.0x | 254 (52.5%) | 59,580 (4,117.5%) |
| 2.0x to 2.9x | 6 (1.2%) | 387 (26.7%) |
| 3.0x to 3.9x | 35 (7.2%) | 237 (16.4%) |
| 4.0x or more | 189 (39.1%) | 401 (27.7%) |
| Total | 484 (100.0%) | 1,447 (100.0%) |
Real Estate Taxes by Mortgage Status in Lovejoy
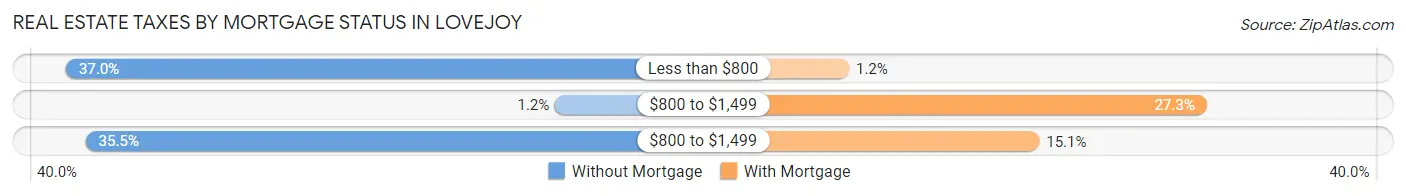
| Property Taxes | Without Mortgage | With Mortgage |
| Less than $800 | 179 (37.0%) | 17 (1.2%) |
| $800 to $1,499 | 6 (1.2%) | 395 (27.3%) |
| $800 to $1,499 | 172 (35.5%) | 218 (15.1%) |
| Total | 484 (100.0%) | 1,447 (100.0%) |
Health & Disability in Lovejoy
Health Insurance Coverage by Age in Lovejoy
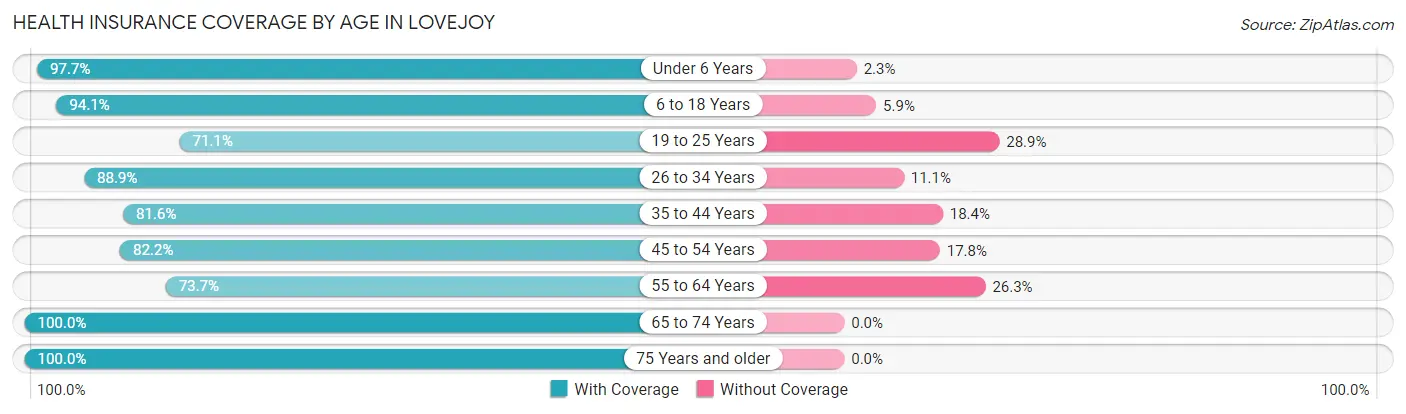
| Age Bracket | With Coverage | Without Coverage |
| Under 6 Years | 1,093 (97.7%) | 26 (2.3%) |
| 6 to 18 Years | 3,309 (94.1%) | 209 (5.9%) |
| 19 to 25 Years | 251 (71.1%) | 102 (28.9%) |
| 26 to 34 Years | 1,417 (88.9%) | 177 (11.1%) |
| 35 to 44 Years | 1,253 (81.6%) | 282 (18.4%) |
| 45 to 54 Years | 503 (82.2%) | 109 (17.8%) |
| 55 to 64 Years | 476 (73.7%) | 170 (26.3%) |
| 65 to 74 Years | 342 (100.0%) | 0 (0.0%) |
| 75 Years and older | 103 (100.0%) | 0 (0.0%) |
| Total | 8,747 (89.1%) | 1,075 (10.9%) |
Health Insurance Coverage by Citizenship Status in Lovejoy
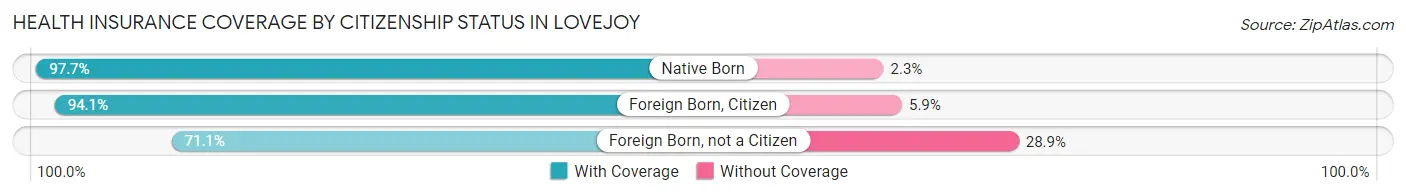
| Citizenship Status | With Coverage | Without Coverage |
| Native Born | 1,093 (97.7%) | 26 (2.3%) |
| Foreign Born, Citizen | 3,309 (94.1%) | 209 (5.9%) |
| Foreign Born, not a Citizen | 251 (71.1%) | 102 (28.9%) |
Health Insurance Coverage by Household Income in Lovejoy
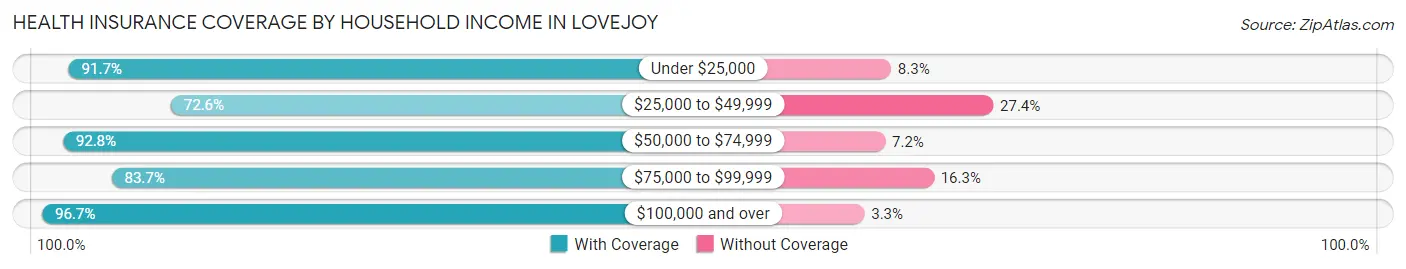
| Household Income | With Coverage | Without Coverage |
| Under $25,000 | 1,655 (91.7%) | 149 (8.3%) |
| $25,000 to $49,999 | 964 (72.6%) | 364 (27.4%) |
| $50,000 to $74,999 | 2,704 (92.8%) | 209 (7.2%) |
| $75,000 to $99,999 | 1,475 (83.7%) | 287 (16.3%) |
| $100,000 and over | 1,949 (96.7%) | 66 (3.3%) |
Public vs Private Health Insurance Coverage by Age in Lovejoy
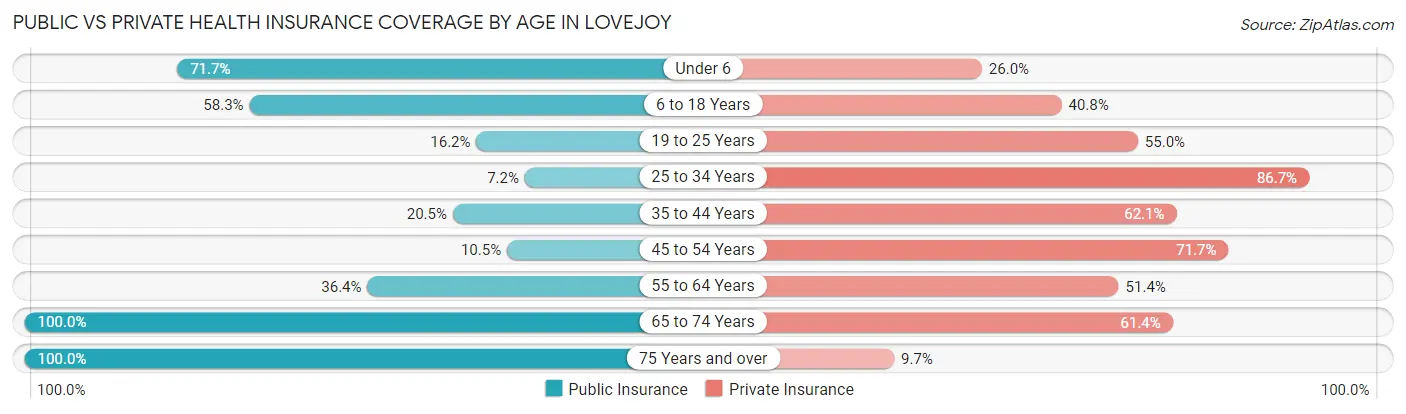
| Age Bracket | Public Insurance | Private Insurance |
| Under 6 | 802 (71.7%) | 291 (26.0%) |
| 6 to 18 Years | 2,050 (58.3%) | 1,435 (40.8%) |
| 19 to 25 Years | 57 (16.2%) | 194 (55.0%) |
| 25 to 34 Years | 114 (7.1%) | 1,382 (86.7%) |
| 35 to 44 Years | 315 (20.5%) | 953 (62.1%) |
| 45 to 54 Years | 64 (10.5%) | 439 (71.7%) |
| 55 to 64 Years | 235 (36.4%) | 332 (51.4%) |
| 65 to 74 Years | 342 (100.0%) | 210 (61.4%) |
| 75 Years and over | 103 (100.0%) | 10 (9.7%) |
| Total | 4,082 (41.6%) | 5,246 (53.4%) |
Disability Status by Sex by Age in Lovejoy
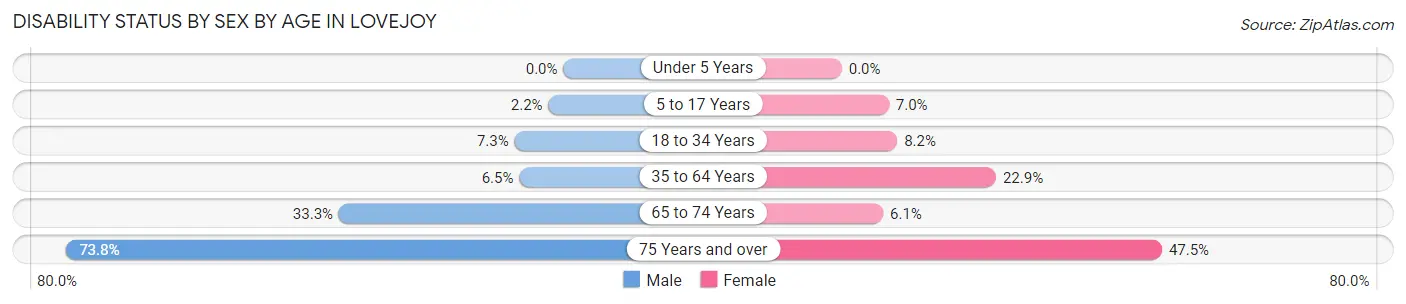
| Age Bracket | Male | Female |
| Under 5 Years | 0 (0.0%) | 0 (0.0%) |
| 5 to 17 Years | 32 (2.2%) | 140 (7.0%) |
| 18 to 34 Years | 79 (7.2%) | 104 (8.2%) |
| 35 to 64 Years | 63 (6.5%) | 419 (22.9%) |
| 65 to 74 Years | 27 (33.3%) | 16 (6.1%) |
| 75 Years and over | 31 (73.8%) | 29 (47.5%) |
Disability Class by Sex by Age in Lovejoy
Disability Class: Hearing Difficulty
| Age Bracket | Male | Female |
| Under 5 Years | 0 (0.0%) | 0 (0.0%) |
| 5 to 17 Years | 0 (0.0%) | 0 (0.0%) |
| 18 to 34 Years | 0 (0.0%) | 0 (0.0%) |
| 35 to 64 Years | 0 (0.0%) | 0 (0.0%) |
| 65 to 74 Years | 0 (0.0%) | 0 (0.0%) |
| 75 Years and over | 0 (0.0%) | 0 (0.0%) |
Disability Class: Vision Difficulty
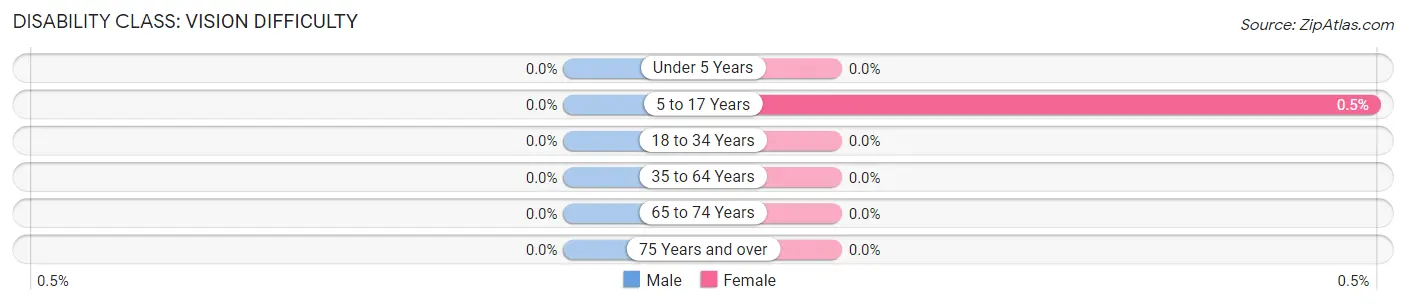
| Age Bracket | Male | Female |
| Under 5 Years | 0 (0.0%) | 0 (0.0%) |
| 5 to 17 Years | 0 (0.0%) | 10 (0.5%) |
| 18 to 34 Years | 0 (0.0%) | 0 (0.0%) |
| 35 to 64 Years | 0 (0.0%) | 0 (0.0%) |
| 65 to 74 Years | 0 (0.0%) | 0 (0.0%) |
| 75 Years and over | 0 (0.0%) | 0 (0.0%) |
Disability Class: Cognitive Difficulty
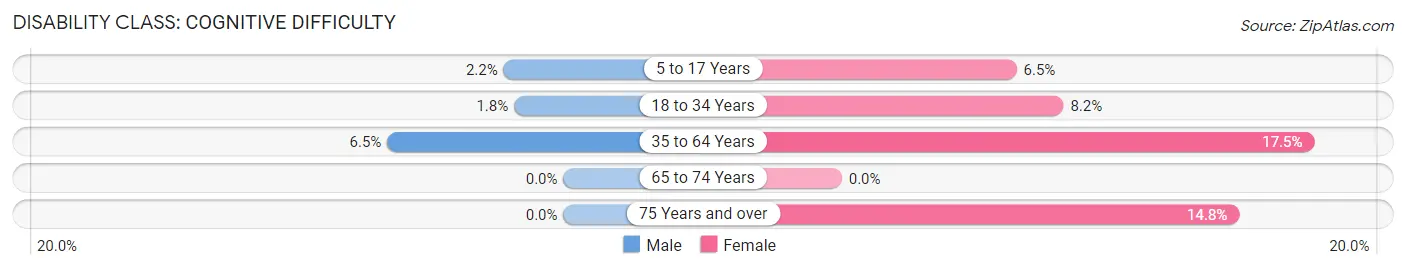
| Age Bracket | Male | Female |
| 5 to 17 Years | 32 (2.2%) | 130 (6.5%) |
| 18 to 34 Years | 20 (1.8%) | 104 (8.2%) |
| 35 to 64 Years | 63 (6.5%) | 321 (17.5%) |
| 65 to 74 Years | 0 (0.0%) | 0 (0.0%) |
| 75 Years and over | 0 (0.0%) | 9 (14.7%) |
Disability Class: Ambulatory Difficulty
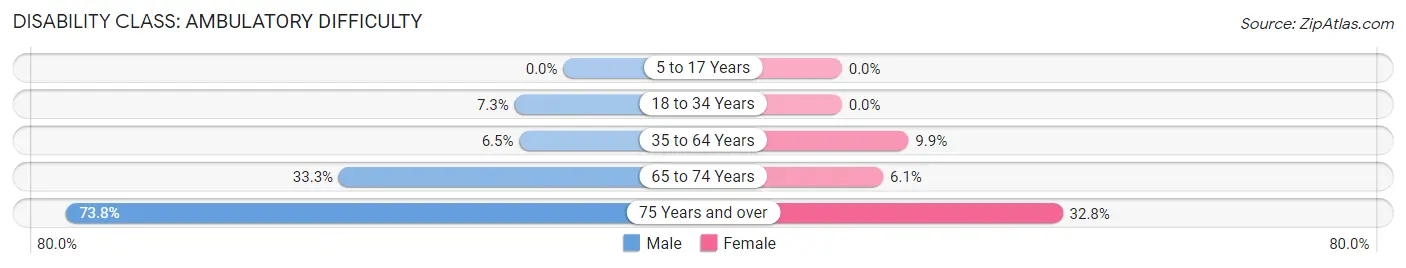
| Age Bracket | Male | Female |
| 5 to 17 Years | 0 (0.0%) | 0 (0.0%) |
| 18 to 34 Years | 79 (7.2%) | 0 (0.0%) |
| 35 to 64 Years | 63 (6.5%) | 181 (9.9%) |
| 65 to 74 Years | 27 (33.3%) | 16 (6.1%) |
| 75 Years and over | 31 (73.8%) | 20 (32.8%) |
Disability Class: Self-Care Difficulty
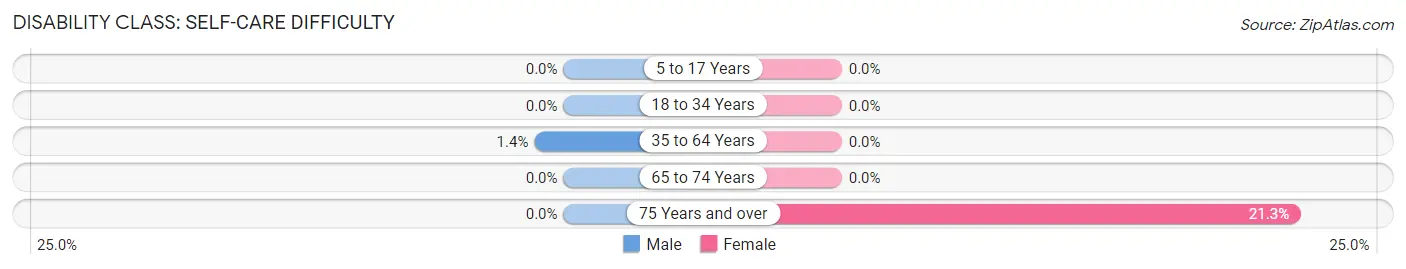
| Age Bracket | Male | Female |
| 5 to 17 Years | 0 (0.0%) | 0 (0.0%) |
| 18 to 34 Years | 0 (0.0%) | 0 (0.0%) |
| 35 to 64 Years | 13 (1.3%) | 0 (0.0%) |
| 65 to 74 Years | 0 (0.0%) | 0 (0.0%) |
| 75 Years and over | 0 (0.0%) | 13 (21.3%) |
Technology Access in Lovejoy
Computing Device Access in Lovejoy
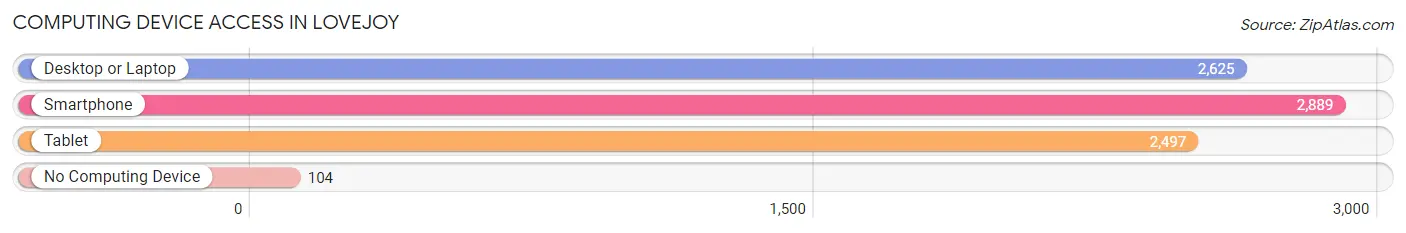
| Device Type | # Households | % Households |
| Desktop or Laptop | 2,625 | 86.0% |
| Smartphone | 2,889 | 94.6% |
| Tablet | 2,497 | 81.8% |
| No Computing Device | 104 | 3.4% |
| Total | 3,053 | 100.0% |
Internet Access in Lovejoy
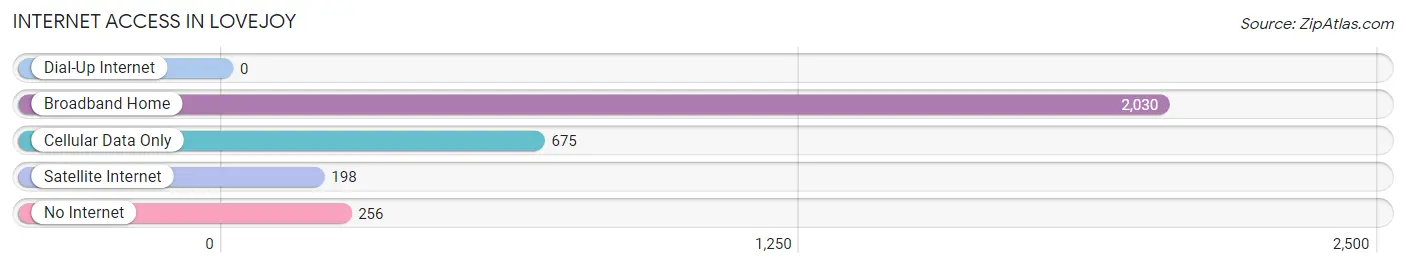
| Internet Type | # Households | % Households |
| Dial-Up Internet | 0 | 0.0% |
| Broadband Home | 2,030 | 66.5% |
| Cellular Data Only | 675 | 22.1% |
| Satellite Internet | 198 | 6.5% |
| No Internet | 256 | 8.4% |
| Total | 3,053 | 100.0% |
Lovejoy Summary
Introduction
Lovejoy is a small city located in Clayton County, Georgia, United States. It is part of the Atlanta metropolitan area and is located about 20 miles south of downtown Atlanta. The city has a population of about 5,000 people and is known for its small-town charm and friendly atmosphere.
History
Lovejoy was founded in 1873 by a group of settlers from the nearby town of Jonesboro. The town was named after a local doctor, Dr. Lovejoy, who had a large influence on the area. The town grew slowly but steadily over the years, and by the early 1900s, it had become a thriving community.
In the 1950s, Lovejoy began to experience rapid growth due to the expansion of the Atlanta metropolitan area. The city was incorporated in 1959 and has since become a popular suburb of Atlanta.
Geography
Lovejoy is located in the southern part of Clayton County, Georgia. It is situated on the banks of the Flint River and is surrounded by rolling hills and forests. The city is located about 20 miles south of downtown Atlanta and is easily accessible via Interstate 75.
The city has a total area of 4.2 square miles, all of which is land. The average elevation is about 830 feet above sea level.
Economy
Lovejoy’s economy is largely based on the service industry. The city is home to several small businesses, including restaurants, retail stores, and professional services. The city also has a few manufacturing plants, including a paper mill and a plastics factory.
The city is also home to several large employers, including the Clayton County Public Schools, the Clayton County Sheriff’s Office, and the Clayton County Water Authority.
Demographics
As of the 2010 census, Lovejoy had a population of 5,000 people. The racial makeup of the city was 57.3% White, 33.3% African American, 0.3% Native American, 0.7% Asian, 0.1% Pacific Islander, and 8.3% from other races. Hispanic or Latino of any race were 3.3% of the population.
The median income for a household in Lovejoy was $45,000, and the median income for a family was $50,000. The per capita income for the city was $20,000. About 15.3% of the population was below the poverty line.
Conclusion
Lovejoy is a small city located in Clayton County, Georgia. It is part of the Atlanta metropolitan area and is known for its small-town charm and friendly atmosphere. The city has a population of about 5,000 people and is largely based on the service industry. The city is home to several small businesses, including restaurants, retail stores, and professional services. The median income for a household in Lovejoy was $45,000, and the median income for a family was $50,000. Lovejoy is a great place to live and work, and it is a great example of a small city with a big heart.
Common Questions
What is Per Capita Income in Lovejoy?
Per Capita income in Lovejoy is $21,789.
What is the Median Family Income in Lovejoy?
Median Family Income in Lovejoy is $58,923.
What is the Median Household income in Lovejoy?
Median Household Income in Lovejoy is $59,184.
What is Income or Wage Gap in Lovejoy?
Income or Wage Gap in Lovejoy is 46.0%.
Women in Lovejoy earn 54.0 cents for every dollar earned by a man.
What is Inequality or Gini Index in Lovejoy?
Inequality or Gini Index in Lovejoy is 0.40.
What is the Total Population of Lovejoy?
Total Population of Lovejoy is 10,429.
What is the Total Male Population of Lovejoy?
Total Male Population of Lovejoy is 4,584.
What is the Total Female Population of Lovejoy?
Total Female Population of Lovejoy is 5,845.
What is the Ratio of Males per 100 Females in Lovejoy?
There are 78.43 Males per 100 Females in Lovejoy.
What is the Ratio of Females per 100 Males in Lovejoy?
There are 127.51 Females per 100 Males in Lovejoy.
What is the Median Population Age in Lovejoy?
Median Population Age in Lovejoy is 26.5 Years.
What is the Average Family Size in Lovejoy
Average Family Size in Lovejoy is 3.6 People.
What is the Average Household Size in Lovejoy
Average Household Size in Lovejoy is 3.2 People.
How Large is the Labor Force in Lovejoy?
There are 4,106 People in the Labor Forcein in Lovejoy.
What is the Percentage of People in the Labor Force in Lovejoy?
63.6% of People are in the Labor Force in Lovejoy.
What is the Unemployment Rate in Lovejoy?
Unemployment Rate in Lovejoy is 6.6%.