Sopchoppy, FL Map & Demographics
Sopchoppy Map
Sopchoppy Overview
$29,378
PER CAPITA INCOME
$71,683
AVG FAMILY INCOME
$67,031
AVG HOUSEHOLD INCOME
28.8%
WAGE / INCOME GAP [ % ]
71.2¢/ $1
WAGE / INCOME GAP [ $ ]
0.33
INEQUALITY / GINI INDEX
426
TOTAL POPULATION
224
MALE POPULATION
202
FEMALE POPULATION
110.89
MALES / 100 FEMALES
90.18
FEMALES / 100 MALES
50.8
MEDIAN AGE
3.1
AVG FAMILY SIZE
2.4
AVG HOUSEHOLD SIZE
174
LABOR FORCE [ PEOPLE ]
47.7%
PERCENT IN LABOR FORCE
2.9%
UNEMPLOYMENT RATE
Sopchoppy Zip Codes
Sopchoppy Area Codes
Income in Sopchoppy
Income Overview in Sopchoppy
Per Capita Income in Sopchoppy is $29,378, while median incomes of families and households are $71,683 and $67,031 respectively.
| Characteristic | Number | Measure |
| Per Capita Income | 426 | $29,378 |
| Median Family Income | 109 | $71,683 |
| Mean Family Income | 109 | $82,507 |
| Median Household Income | 177 | $67,031 |
| Mean Household Income | 177 | $64,961 |
| Income Deficit | 109 | $0 |
| Wage / Income Gap (%) | 426 | 28.84% |
| Wage / Income Gap ($) | 426 | 71.16¢ per $1 |
| Gini / Inequality Index | 426 | 0.33 |
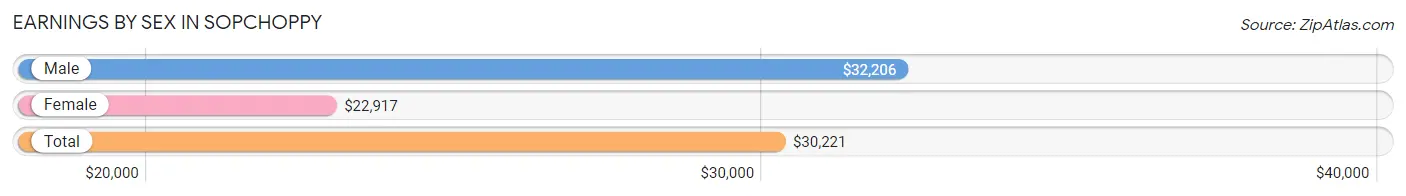
Earnings by Sex in Sopchoppy
Average Earnings in Sopchoppy are $30,221, $32,206 for men and $22,917 for women, a difference of 28.8%.
| Sex | Number | Average Earnings |
| Male | 114 (57.9%) | $32,206 |
| Female | 83 (42.1%) | $22,917 |
| Total | 197 (100.0%) | $30,221 |
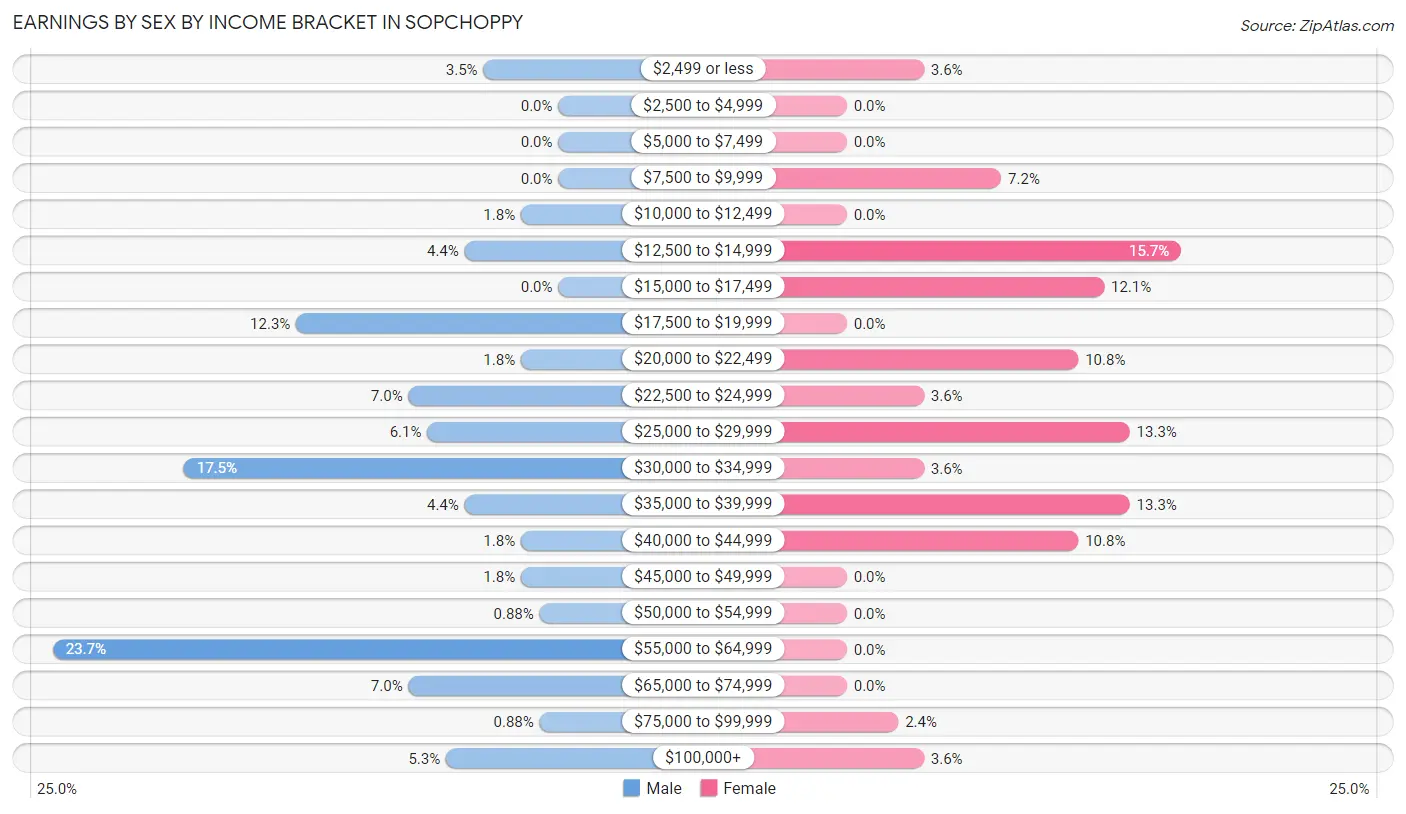
Earnings by Sex by Income Bracket in Sopchoppy
The most common earnings brackets in Sopchoppy are $55,000 to $64,999 for men (27 | 23.7%) and $12,500 to $14,999 for women (13 | 15.7%).
| Income | Male | Female |
| $2,499 or less | 4 (3.5%) | 3 (3.6%) |
| $2,500 to $4,999 | 0 (0.0%) | 0 (0.0%) |
| $5,000 to $7,499 | 0 (0.0%) | 0 (0.0%) |
| $7,500 to $9,999 | 0 (0.0%) | 6 (7.2%) |
| $10,000 to $12,499 | 2 (1.8%) | 0 (0.0%) |
| $12,500 to $14,999 | 5 (4.4%) | 13 (15.7%) |
| $15,000 to $17,499 | 0 (0.0%) | 10 (12.0%) |
| $17,500 to $19,999 | 14 (12.3%) | 0 (0.0%) |
| $20,000 to $22,499 | 2 (1.8%) | 9 (10.8%) |
| $22,500 to $24,999 | 8 (7.0%) | 3 (3.6%) |
| $25,000 to $29,999 | 7 (6.1%) | 11 (13.3%) |
| $30,000 to $34,999 | 20 (17.5%) | 3 (3.6%) |
| $35,000 to $39,999 | 5 (4.4%) | 11 (13.3%) |
| $40,000 to $44,999 | 2 (1.8%) | 9 (10.8%) |
| $45,000 to $49,999 | 2 (1.8%) | 0 (0.0%) |
| $50,000 to $54,999 | 1 (0.9%) | 0 (0.0%) |
| $55,000 to $64,999 | 27 (23.7%) | 0 (0.0%) |
| $65,000 to $74,999 | 8 (7.0%) | 0 (0.0%) |
| $75,000 to $99,999 | 1 (0.9%) | 2 (2.4%) |
| $100,000+ | 6 (5.3%) | 3 (3.6%) |
| Total | 114 (100.0%) | 83 (100.0%) |
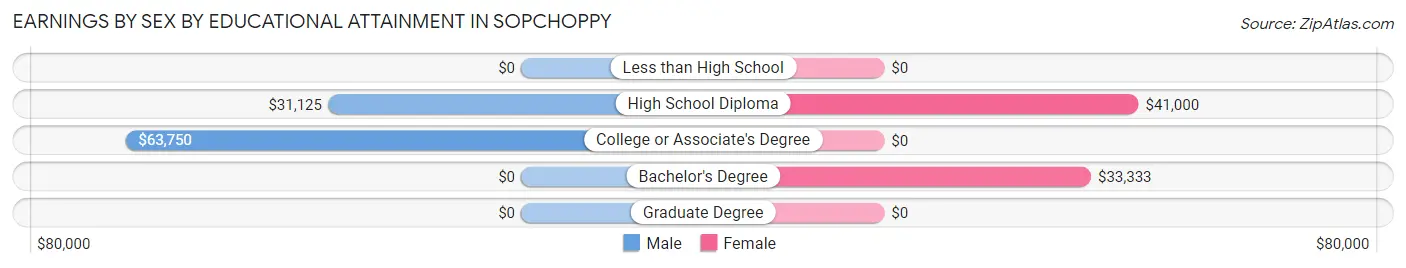
Earnings by Sex by Educational Attainment in Sopchoppy
Average earnings in Sopchoppy are $33,333 for men and $29,091 for women, a difference of 12.7%. Men with an educational attainment of college or associate's degree enjoy the highest average annual earnings of $63,750, while those with high school diploma education earn the least with $31,125. Women with an educational attainment of high school diploma earn the most with the average annual earnings of $41,000, while those with bachelor's degree education have the smallest earnings of $33,333.
| Educational Attainment | Male Income | Female Income |
| Less than High School | - | - |
| High School Diploma | $31,125 | $41,000 |
| College or Associate's Degree | $63,750 | $0 |
| Bachelor's Degree | - | - |
| Graduate Degree | - | - |
| Total | $33,333 | $29,091 |
Family Income in Sopchoppy
Family Income Brackets in Sopchoppy
According to the Sopchoppy family income data, there are 42 families falling into the $50,000 to $74,999 income range, which is the most common income bracket and makes up 38.5% of all families.
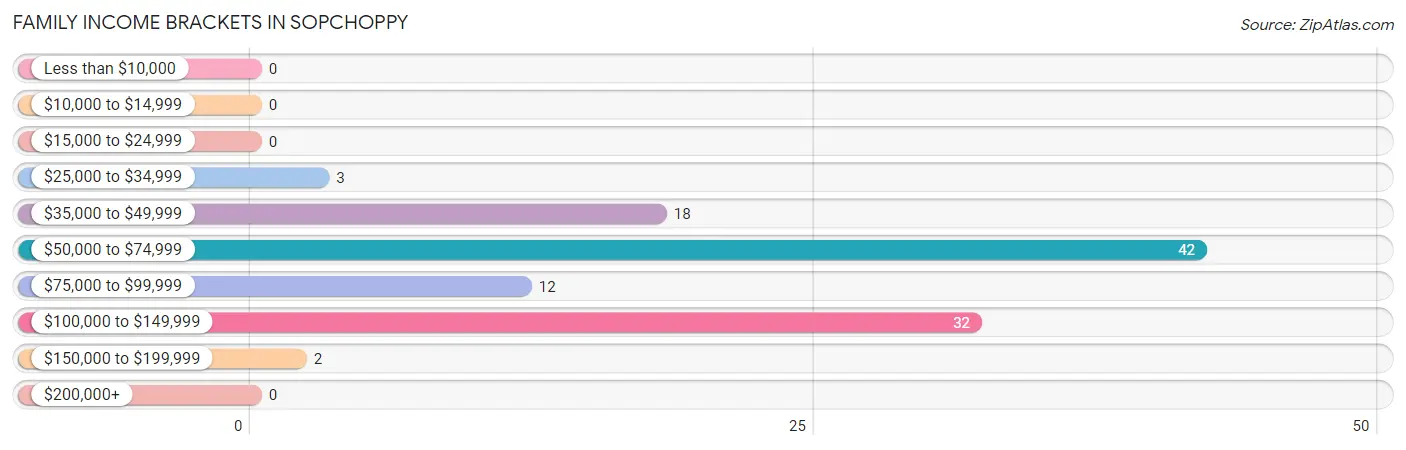
| Income Bracket | # Families | % Families |
| Less than $10,000 | 0 | 0.0% |
| $10,000 to $14,999 | 0 | 0.0% |
| $15,000 to $24,999 | 0 | 0.0% |
| $25,000 to $34,999 | 3 | 2.8% |
| $35,000 to $49,999 | 18 | 16.5% |
| $50,000 to $74,999 | 42 | 38.5% |
| $75,000 to $99,999 | 12 | 11.0% |
| $100,000 to $149,999 | 32 | 29.4% |
| $150,000 to $199,999 | 2 | 1.8% |
| $200,000+ | 0 | 0.0% |
Family Income by Famaliy Size in Sopchoppy
2-person families (69 | 63.3%) account for the highest median family income in Sopchoppy with $83,750 per family, while 2-person families (69 | 63.3%) have the highest median income of $41,875 per family member.
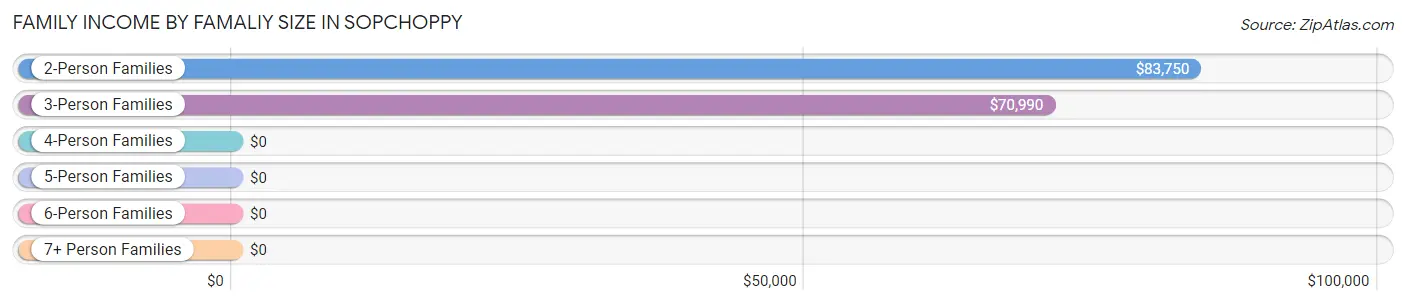
| Income Bracket | # Families | Median Income |
| 2-Person Families | 69 (63.3%) | $83,750 |
| 3-Person Families | 35 (32.1%) | $70,990 |
| 4-Person Families | 0 (0.0%) | $0 |
| 5-Person Families | 0 (0.0%) | $0 |
| 6-Person Families | 5 (4.6%) | $0 |
| 7+ Person Families | 0 (0.0%) | $0 |
| Total | 109 (100.0%) | $71,683 |
Family Income by Number of Earners in Sopchoppy
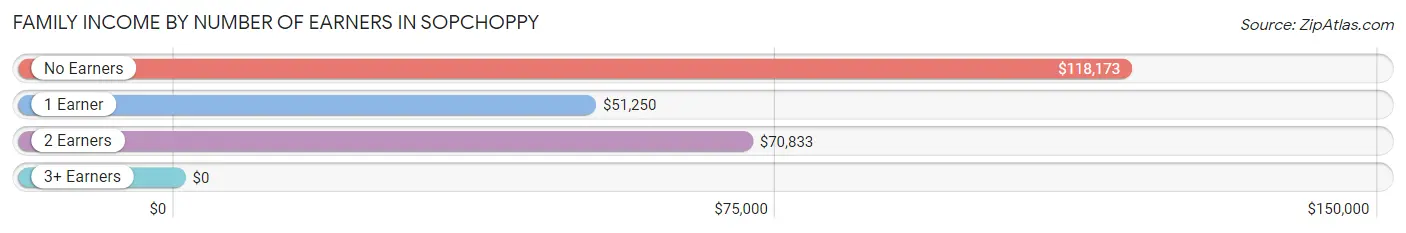
| Number of Earners | # Families | Median Income |
| No Earners | 38 (34.9%) | $118,173 |
| 1 Earner | 22 (20.2%) | $51,250 |
| 2 Earners | 46 (42.2%) | $70,833 |
| 3+ Earners | 3 (2.8%) | $0 |
| Total | 109 (100.0%) | $71,683 |
Household Income in Sopchoppy
Household Income Brackets in Sopchoppy
With 51 households falling in the category, the $50,000 to $74,999 income range is the most frequent in Sopchoppy, accounting for 28.8% of all households.
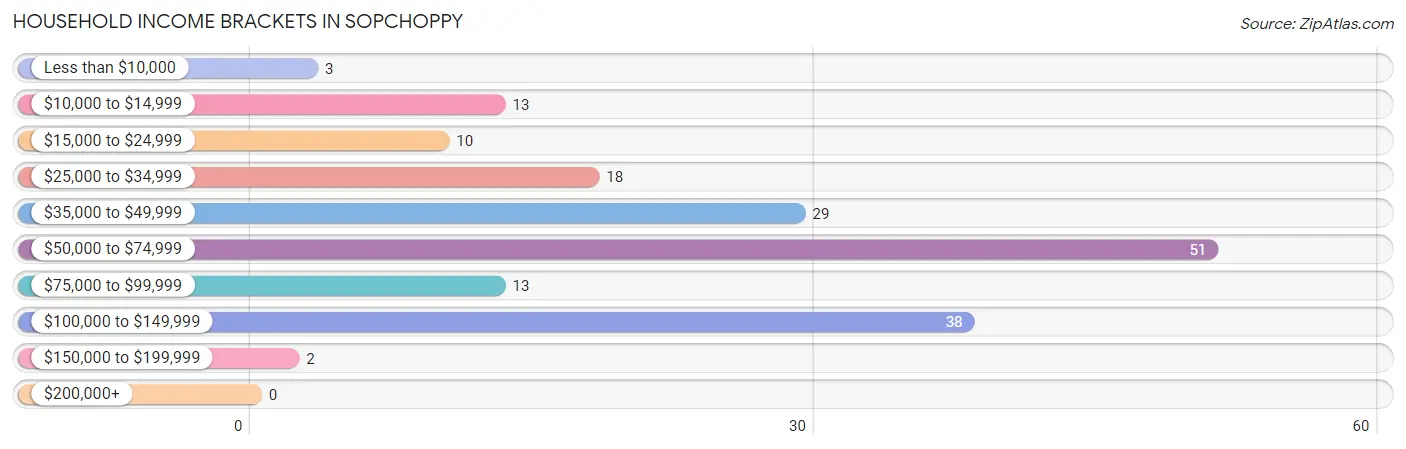
| Income Bracket | # Households | % Households |
| Less than $10,000 | 3 | 1.7% |
| $10,000 to $14,999 | 13 | 7.3% |
| $15,000 to $24,999 | 10 | 5.6% |
| $25,000 to $34,999 | 18 | 10.2% |
| $35,000 to $49,999 | 29 | 16.4% |
| $50,000 to $74,999 | 51 | 28.8% |
| $75,000 to $99,999 | 13 | 7.3% |
| $100,000 to $149,999 | 38 | 21.5% |
| $150,000 to $199,999 | 2 | 1.1% |
| $200,000+ | 0 | 0.0% |
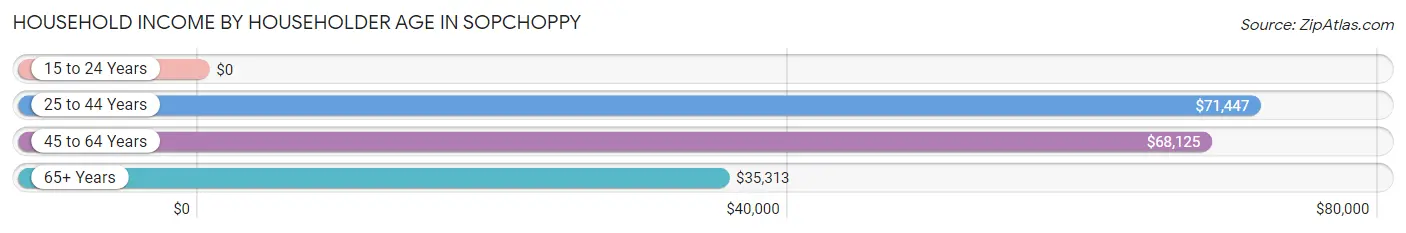
Household Income by Householder Age in Sopchoppy
The median household income in Sopchoppy is $67,031, with the highest median household income of $71,447 found in the 25 to 44 years age bracket for the primary householder. A total of 32 households (18.1%) fall into this category. Meanwhile, the 15 to 24 years age bracket for the primary householder has the lowest median household income of $0, with 6 households (3.4%) in this group.
| Income Bracket | # Households | Median Income |
| 15 to 24 Years | 6 (3.4%) | $0 |
| 25 to 44 Years | 32 (18.1%) | $71,447 |
| 45 to 64 Years | 90 (50.8%) | $68,125 |
| 65+ Years | 49 (27.7%) | $35,313 |
| Total | 177 (100.0%) | $67,031 |
Poverty in Sopchoppy
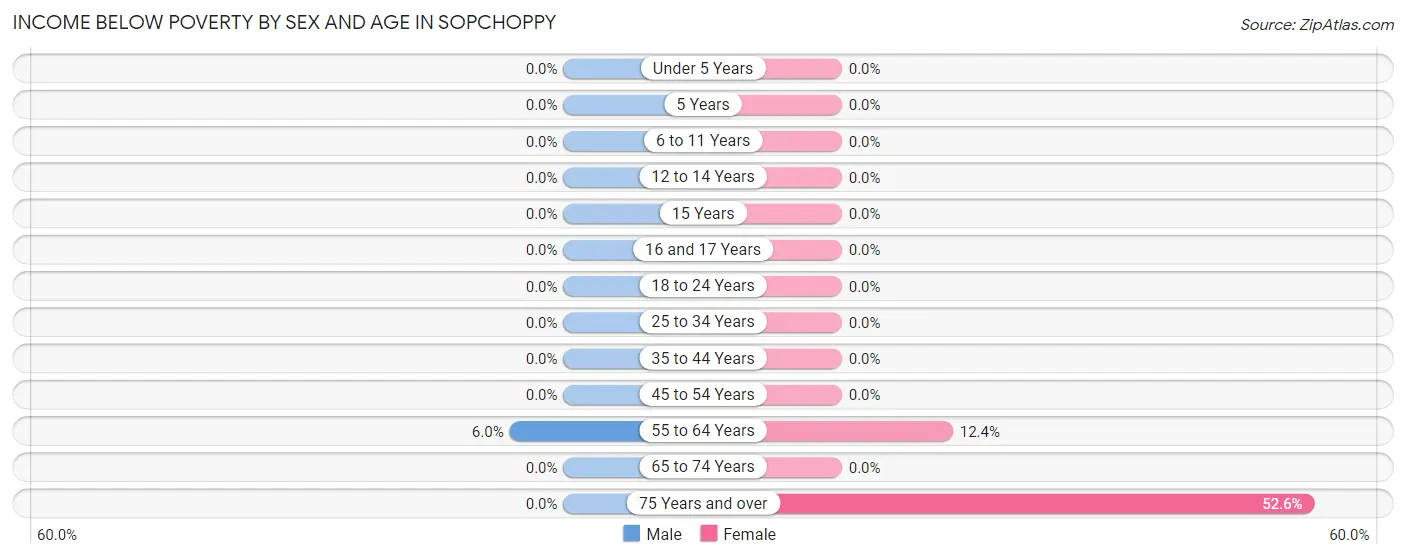
Income Below Poverty by Sex and Age in Sopchoppy
With 1.3% poverty level for males and 10.4% for females among the residents of Sopchoppy, 55 to 64 year old males and 75 year old and over females are the most vulnerable to poverty, with 3 males (6.0%) and 10 females (52.6%) in their respective age groups living below the poverty level.
| Age Bracket | Male | Female |
| Under 5 Years | 0 (0.0%) | 0 (0.0%) |
| 5 Years | 0 (0.0%) | 0 (0.0%) |
| 6 to 11 Years | 0 (0.0%) | 0 (0.0%) |
| 12 to 14 Years | 0 (0.0%) | 0 (0.0%) |
| 15 Years | 0 (0.0%) | 0 (0.0%) |
| 16 and 17 Years | 0 (0.0%) | 0 (0.0%) |
| 18 to 24 Years | 0 (0.0%) | 0 (0.0%) |
| 25 to 34 Years | 0 (0.0%) | 0 (0.0%) |
| 35 to 44 Years | 0 (0.0%) | 0 (0.0%) |
| 45 to 54 Years | 0 (0.0%) | 0 (0.0%) |
| 55 to 64 Years | 3 (6.0%) | 11 (12.4%) |
| 65 to 74 Years | 0 (0.0%) | 0 (0.0%) |
| 75 Years and over | 0 (0.0%) | 10 (52.6%) |
| Total | 3 (1.3%) | 21 (10.4%) |
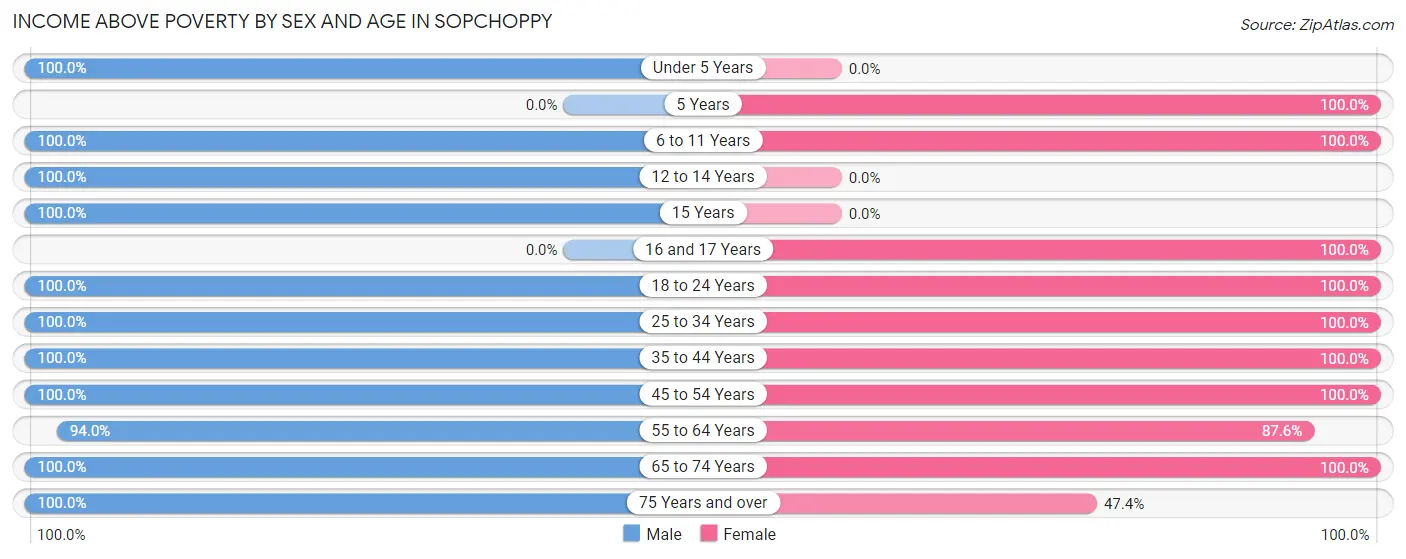
Income Above Poverty by Sex and Age in Sopchoppy
According to the poverty statistics in Sopchoppy, males aged under 5 years and females aged 5 years are the age groups that are most secure financially, with 100.0% of males and 100.0% of females in these age groups living above the poverty line.
| Age Bracket | Male | Female |
| Under 5 Years | 36 (100.0%) | 0 (0.0%) |
| 5 Years | 0 (0.0%) | 2 (100.0%) |
| 6 to 11 Years | 11 (100.0%) | 6 (100.0%) |
| 12 to 14 Years | 2 (100.0%) | 0 (0.0%) |
| 15 Years | 4 (100.0%) | 0 (0.0%) |
| 16 and 17 Years | 0 (0.0%) | 10 (100.0%) |
| 18 to 24 Years | 8 (100.0%) | 19 (100.0%) |
| 25 to 34 Years | 33 (100.0%) | 23 (100.0%) |
| 35 to 44 Years | 34 (100.0%) | 6 (100.0%) |
| 45 to 54 Years | 13 (100.0%) | 18 (100.0%) |
| 55 to 64 Years | 47 (94.0%) | 78 (87.6%) |
| 65 to 74 Years | 28 (100.0%) | 10 (100.0%) |
| 75 Years and over | 5 (100.0%) | 9 (47.4%) |
| Total | 221 (98.7%) | 181 (89.6%) |
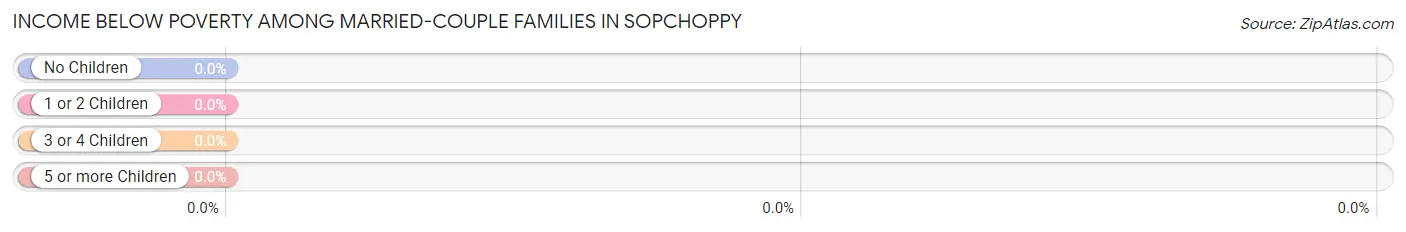
Income Below Poverty Among Married-Couple Families in Sopchoppy
| Children | Above Poverty | Below Poverty |
| No Children | 58 (100.0%) | 0 (0.0%) |
| 1 or 2 Children | 27 (100.0%) | 0 (0.0%) |
| 3 or 4 Children | 2 (100.0%) | 0 (0.0%) |
| 5 or more Children | 0 (0.0%) | 0 (0.0%) |
| Total | 87 (100.0%) | 0 (0.0%) |
Income Below Poverty Among Single-Parent Households in Sopchoppy
| Children | Single Father | Single Mother |
| No Children | 0 (0.0%) | 0 (0.0%) |
| 1 or 2 Children | 0 (0.0%) | 0 (0.0%) |
| 3 or 4 Children | 0 (0.0%) | 0 (0.0%) |
| 5 or more Children | 0 (0.0%) | 0 (0.0%) |
| Total | 0 (0.0%) | 0 (0.0%) |
Income Below Poverty Among Married-Couple vs Single-Parent Households in Sopchoppy
| Children | Married-Couple Families | Single-Parent Households |
| No Children | 0 (0.0%) | 0 (0.0%) |
| 1 or 2 Children | 0 (0.0%) | 0 (0.0%) |
| 3 or 4 Children | 0 (0.0%) | 0 (0.0%) |
| 5 or more Children | 0 (0.0%) | 0 (0.0%) |
| Total | 0 (0.0%) | 0 (0.0%) |
Race in Sopchoppy
The most populous races in Sopchoppy are White / Caucasian (357 | 83.8%), Black / African American (60 | 14.1%), and Two or more Races (6 | 1.4%).
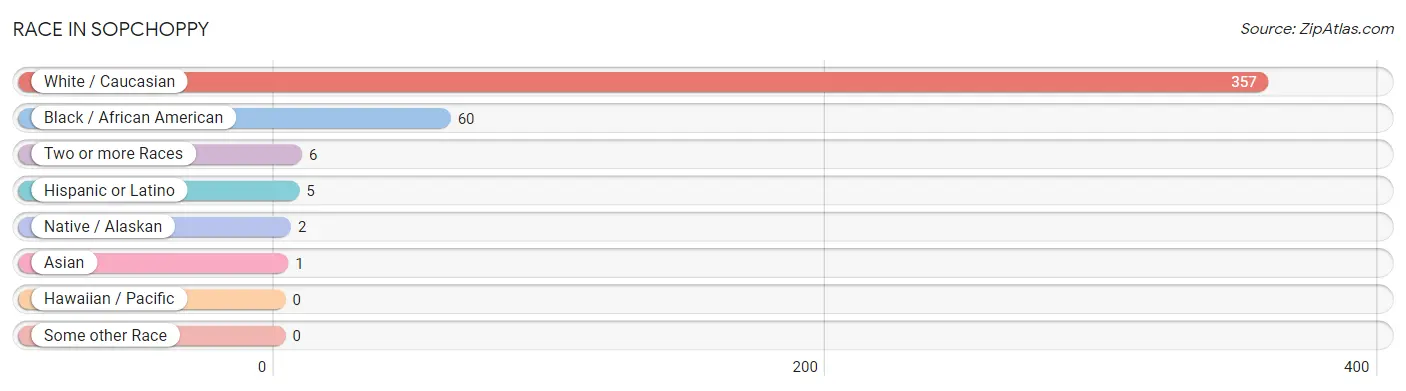
| Race | # Population | % Population |
| Asian | 1 | 0.2% |
| Black / African American | 60 | 14.1% |
| Hawaiian / Pacific | 0 | 0.0% |
| Hispanic or Latino | 5 | 1.2% |
| Native / Alaskan | 2 | 0.5% |
| White / Caucasian | 357 | 83.8% |
| Two or more Races | 6 | 1.4% |
| Some other Race | 0 | 0.0% |
| Total | 426 | 100.0% |
Ancestry in Sopchoppy
The most populous ancestries reported in Sopchoppy are Irish (73 | 17.1%), English (65 | 15.3%), German (59 | 13.9%), Romanian (50 | 11.7%), and American (44 | 10.3%), together accounting for 68.3% of all Sopchoppy residents.
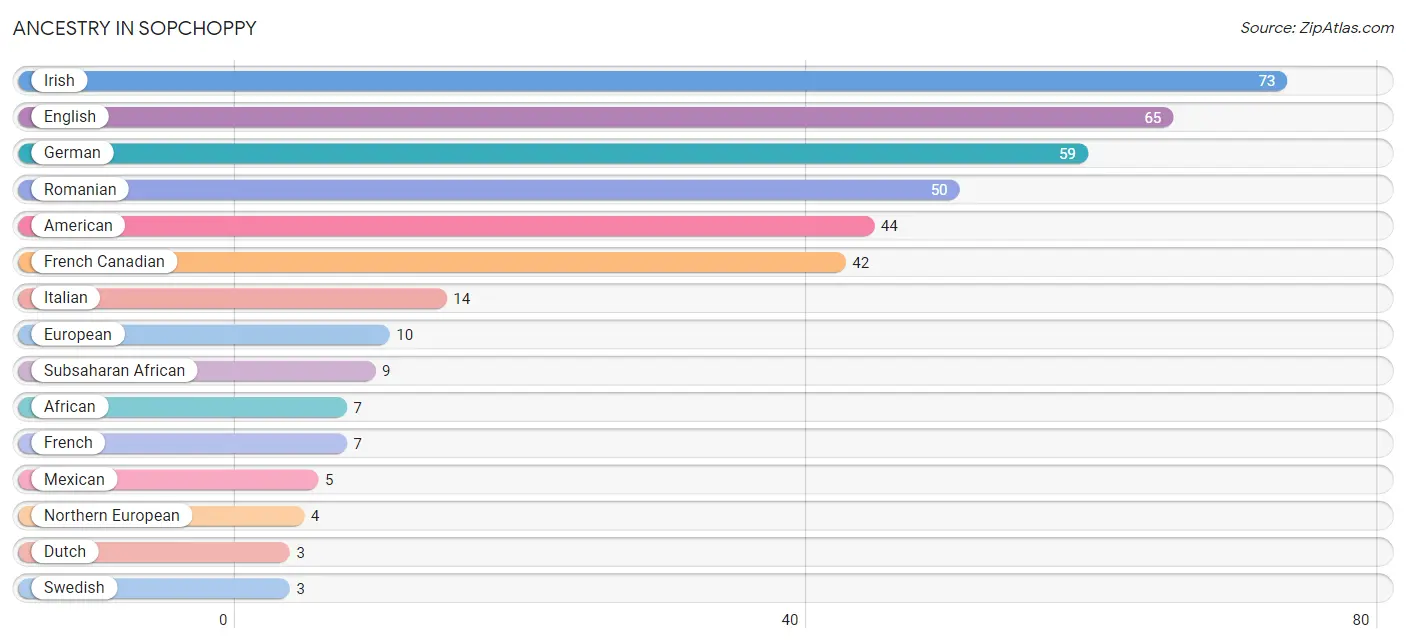
| Ancestry | # Population | % Population |
| African | 7 | 1.6% |
| American | 44 | 10.3% |
| Brazilian | 2 | 0.5% |
| Cherokee | 2 | 0.5% |
| Dutch | 3 | 0.7% |
| English | 65 | 15.3% |
| European | 10 | 2.4% |
| French | 7 | 1.6% |
| French Canadian | 42 | 9.9% |
| German | 59 | 13.9% |
| Indian (Asian) | 1 | 0.2% |
| Irish | 73 | 17.1% |
| Iroquois | 2 | 0.5% |
| Italian | 14 | 3.3% |
| Mexican | 5 | 1.2% |
| Northern European | 4 | 0.9% |
| Romanian | 50 | 11.7% |
| Scandinavian | 2 | 0.5% |
| Scotch-Irish | 1 | 0.2% |
| Scottish | 2 | 0.5% |
| Senegalese | 2 | 0.5% |
| Subsaharan African | 9 | 2.1% |
| Swedish | 3 | 0.7% | View All 23 Rows |
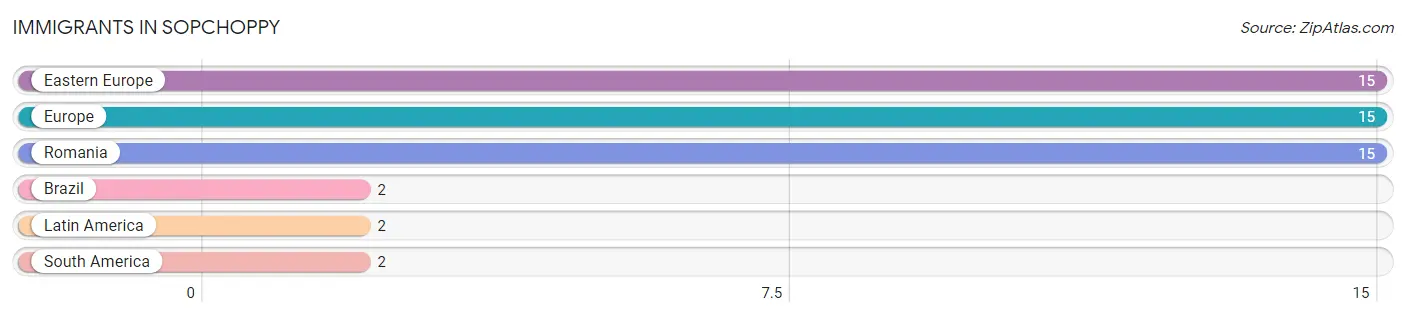
Immigrants in Sopchoppy
The most numerous immigrant groups reported in Sopchoppy came from Eastern Europe (15 | 3.5%), Europe (15 | 3.5%), Romania (15 | 3.5%), Brazil (2 | 0.5%), and Latin America (2 | 0.5%), together accounting for 11.5% of all Sopchoppy residents.
| Immigration Origin | # Population | % Population |
| Brazil | 2 | 0.5% |
| Eastern Europe | 15 | 3.5% |
| Europe | 15 | 3.5% |
| Latin America | 2 | 0.5% |
| Romania | 15 | 3.5% |
| South America | 2 | 0.5% | View All 6 Rows |
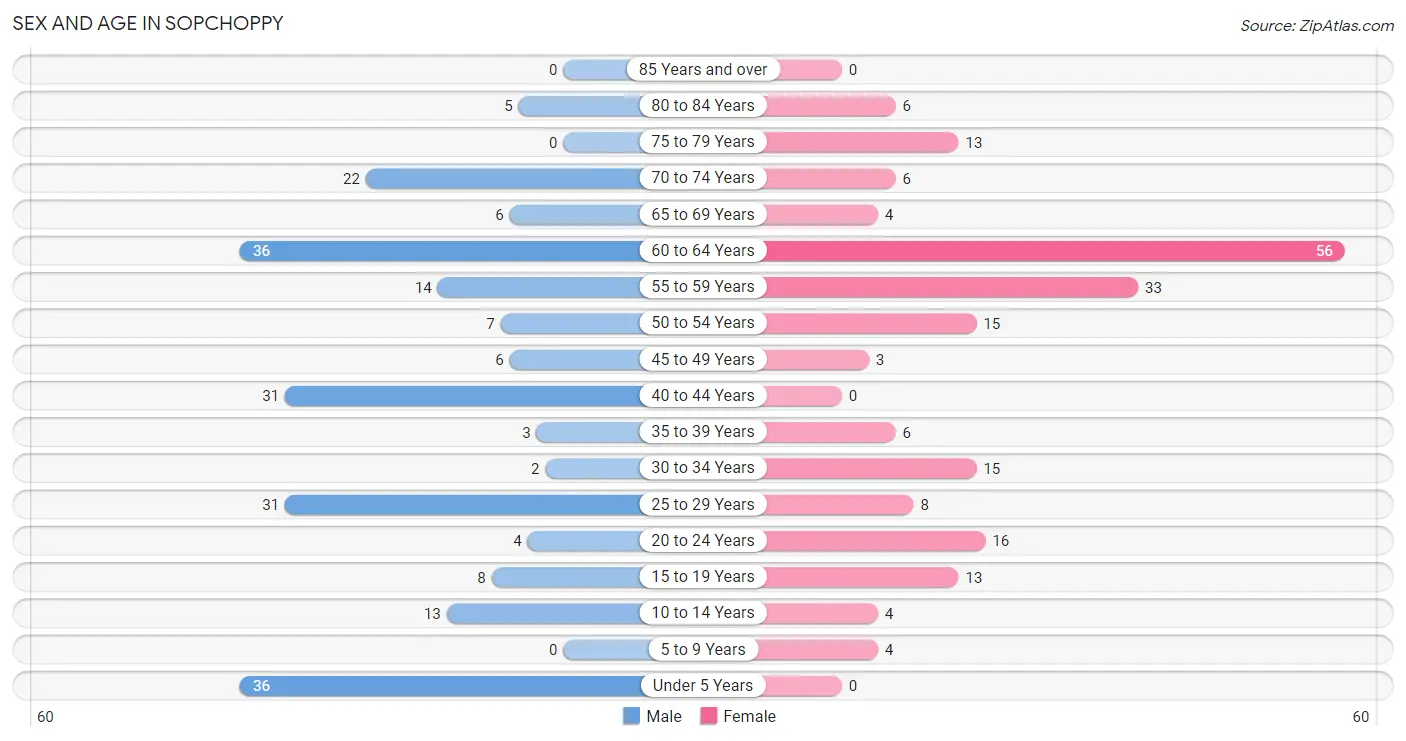
Sex and Age in Sopchoppy
Sex and Age in Sopchoppy
The most populous age groups in Sopchoppy are Under 5 Years (36 | 16.1%) for men and 60 to 64 Years (56 | 27.7%) for women.
| Age Bracket | Male | Female |
| Under 5 Years | 36 (16.1%) | 0 (0.0%) |
| 5 to 9 Years | 0 (0.0%) | 4 (2.0%) |
| 10 to 14 Years | 13 (5.8%) | 4 (2.0%) |
| 15 to 19 Years | 8 (3.6%) | 13 (6.4%) |
| 20 to 24 Years | 4 (1.8%) | 16 (7.9%) |
| 25 to 29 Years | 31 (13.8%) | 8 (4.0%) |
| 30 to 34 Years | 2 (0.9%) | 15 (7.4%) |
| 35 to 39 Years | 3 (1.3%) | 6 (3.0%) |
| 40 to 44 Years | 31 (13.8%) | 0 (0.0%) |
| 45 to 49 Years | 6 (2.7%) | 3 (1.5%) |
| 50 to 54 Years | 7 (3.1%) | 15 (7.4%) |
| 55 to 59 Years | 14 (6.2%) | 33 (16.3%) |
| 60 to 64 Years | 36 (16.1%) | 56 (27.7%) |
| 65 to 69 Years | 6 (2.7%) | 4 (2.0%) |
| 70 to 74 Years | 22 (9.8%) | 6 (3.0%) |
| 75 to 79 Years | 0 (0.0%) | 13 (6.4%) |
| 80 to 84 Years | 5 (2.2%) | 6 (3.0%) |
| 85 Years and over | 0 (0.0%) | 0 (0.0%) |
| Total | 224 (100.0%) | 202 (100.0%) |
Families and Households in Sopchoppy
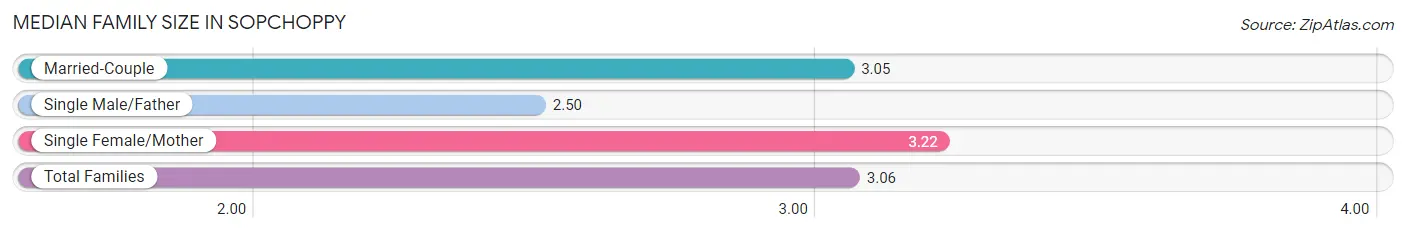
Median Family Size in Sopchoppy
The median family size in Sopchoppy is 3.06 persons per family, with single female/mother families (18 | 16.5%) accounting for the largest median family size of 3.22 persons per family. On the other hand, single male/father families (4 | 3.7%) represent the smallest median family size with 2.50 persons per family.
| Family Type | # Families | Family Size |
| Married-Couple | 87 (79.8%) | 3.05 |
| Single Male/Father | 4 (3.7%) | 2.50 |
| Single Female/Mother | 18 (16.5%) | 3.22 |
| Total Families | 109 (100.0%) | 3.06 |
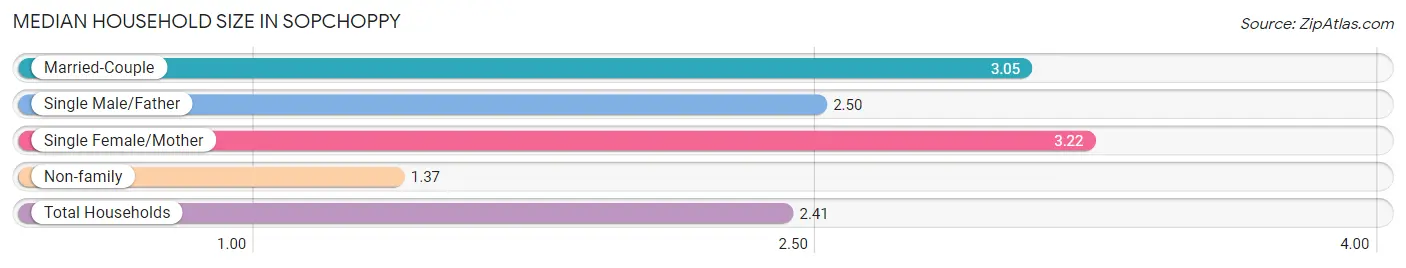
Median Household Size in Sopchoppy
The median household size in Sopchoppy is 2.41 persons per household, with single female/mother households (18 | 10.2%) accounting for the largest median household size of 3.22 persons per household. non-family households (68 | 38.4%) represent the smallest median household size with 1.37 persons per household.
| Household Type | # Households | Household Size |
| Married-Couple | 87 (49.1%) | 3.05 |
| Single Male/Father | 4 (2.3%) | 2.50 |
| Single Female/Mother | 18 (10.2%) | 3.22 |
| Non-family | 68 (38.4%) | 1.37 |
| Total Households | 177 (100.0%) | 2.41 |
Household Size by Marriage Status in Sopchoppy
Out of a total of 177 households in Sopchoppy, 109 (61.6%) are family households, while 68 (38.4%) are nonfamily households. The most numerous type of family households are 2-person households, comprising 69, and the most common type of nonfamily households are 1-person households, comprising 55.
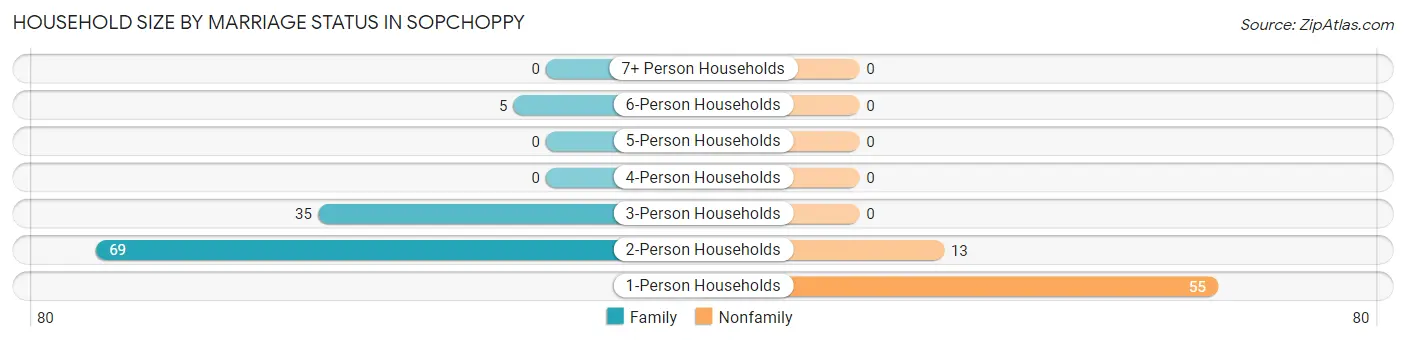
| Household Size | Family Households | Nonfamily Households |
| 1-Person Households | - | 55 (31.1%) |
| 2-Person Households | 69 (39.0%) | 13 (7.3%) |
| 3-Person Households | 35 (19.8%) | 0 (0.0%) |
| 4-Person Households | 0 (0.0%) | 0 (0.0%) |
| 5-Person Households | 0 (0.0%) | 0 (0.0%) |
| 6-Person Households | 5 (2.8%) | 0 (0.0%) |
| 7+ Person Households | 0 (0.0%) | 0 (0.0%) |
| Total | 109 (61.6%) | 68 (38.4%) |
Female Fertility in Sopchoppy
Fertility by Age in Sopchoppy
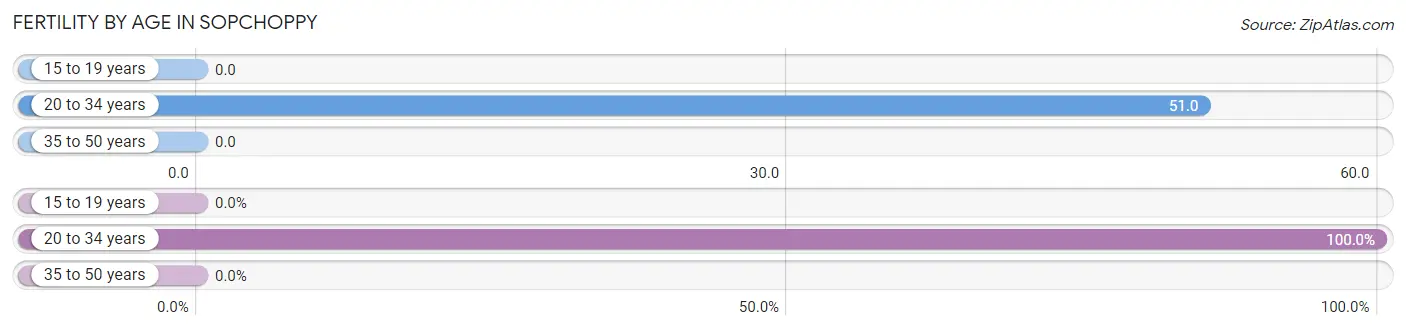
Average fertility rate in Sopchoppy is 29.0 births per 1,000 women. Women in the age bracket of 20 to 34 years have the highest fertility rate with 51.0 births per 1,000 women. Women in the age bracket of 20 to 34 years acount for 100.0% of all women with births.
| Age Bracket | Women with Births | Births / 1,000 Women |
| 15 to 19 years | 0 (0.0%) | 0.0 |
| 20 to 34 years | 2 (100.0%) | 51.0 |
| 35 to 50 years | 0 (0.0%) | 0.0 |
| Total | 2 (100.0%) | 29.0 |
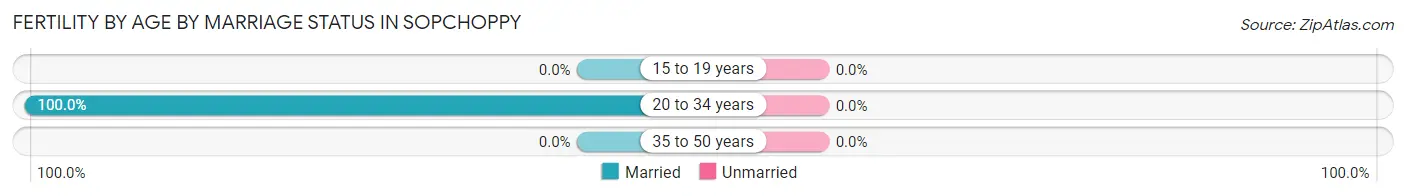
Fertility by Age by Marriage Status in Sopchoppy
| Age Bracket | Married | Unmarried |
| 15 to 19 years | 0 (0.0%) | 0 (0.0%) |
| 20 to 34 years | 2 (100.0%) | 0 (0.0%) |
| 35 to 50 years | 0 (0.0%) | 0 (0.0%) |
| Total | 2 (100.0%) | 0 (0.0%) |
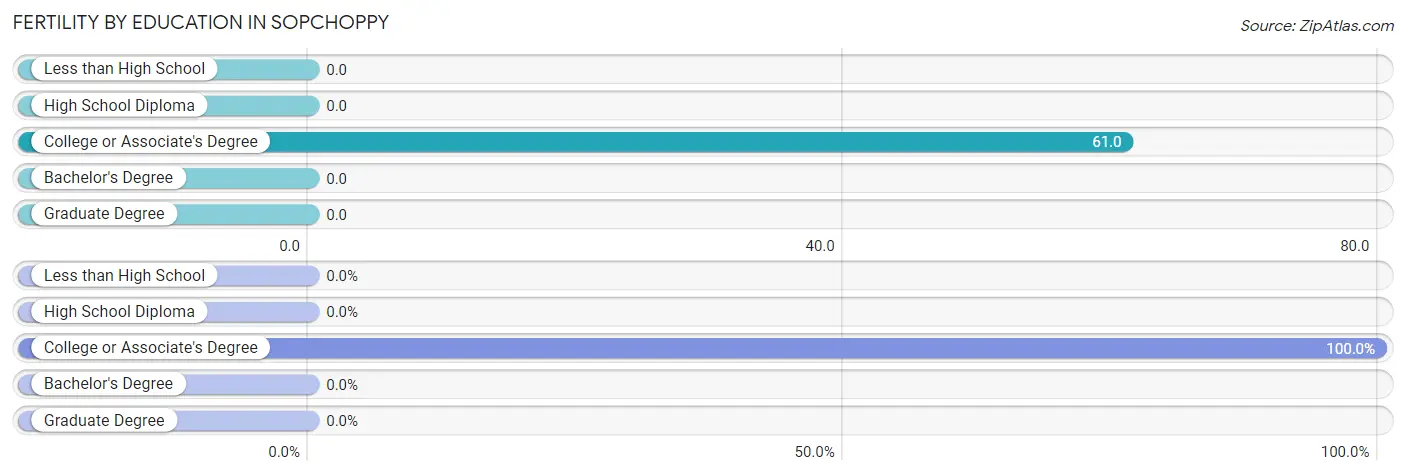
Fertility by Education in Sopchoppy
| Educational Attainment | Women with Births | Births / 1,000 Women |
| Less than High School | 0 (0.0%) | 0.0 |
| High School Diploma | 0 (0.0%) | 0.0 |
| College or Associate's Degree | 2 (100.0%) | 61.0 |
| Bachelor's Degree | 0 (0.0%) | 0.0 |
| Graduate Degree | 0 (0.0%) | 0.0 |
| Total | 2 (100.0%) | 29.0 |
Fertility by Education by Marriage Status in Sopchoppy
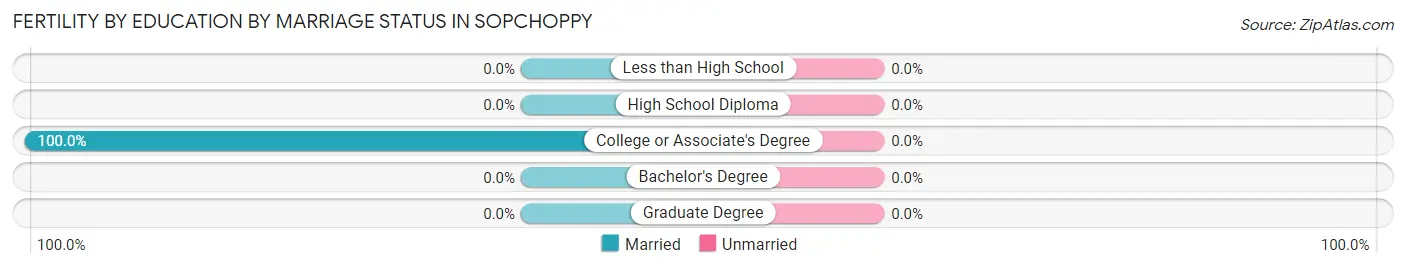
| Educational Attainment | Married | Unmarried |
| Less than High School | 0 (0.0%) | 0 (0.0%) |
| High School Diploma | 0 (0.0%) | 0 (0.0%) |
| College or Associate's Degree | 2 (100.0%) | 0 (0.0%) |
| Bachelor's Degree | 0 (0.0%) | 0 (0.0%) |
| Graduate Degree | 0 (0.0%) | 0 (0.0%) |
| Total | 2 (100.0%) | 0 (0.0%) |
Employment Characteristics in Sopchoppy
Employment by Class of Employer in Sopchoppy
Among the 169 employed individuals in Sopchoppy, private company employees (83 | 49.1%), not-for-profit organizations (35 | 20.7%), and local government employees (21 | 12.4%) make up the most common classes of employment.
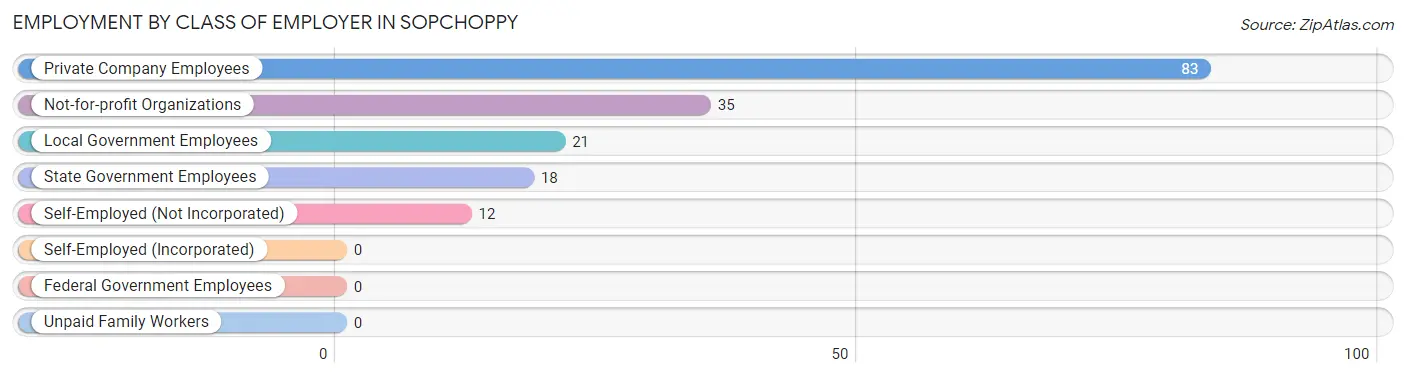
| Employer Class | # Employees | % Employees |
| Private Company Employees | 83 | 49.1% |
| Self-Employed (Incorporated) | 0 | 0.0% |
| Self-Employed (Not Incorporated) | 12 | 7.1% |
| Not-for-profit Organizations | 35 | 20.7% |
| Local Government Employees | 21 | 12.4% |
| State Government Employees | 18 | 10.6% |
| Federal Government Employees | 0 | 0.0% |
| Unpaid Family Workers | 0 | 0.0% |
| Total | 169 | 100.0% |
Employment Status by Age in Sopchoppy
According to the labor force statistics for Sopchoppy, out of the total population over 16 years of age (365), 47.7% or 174 individuals are in the labor force, with 2.9% or 5 of them unemployed. The age group with the highest labor force participation rate is 30 to 34 years, with 100.0% or 17 individuals in the labor force. Within the labor force, the 60 to 64 years age range has the highest percentage of unemployed individuals, with 12.5% or 2 of them being unemployed.
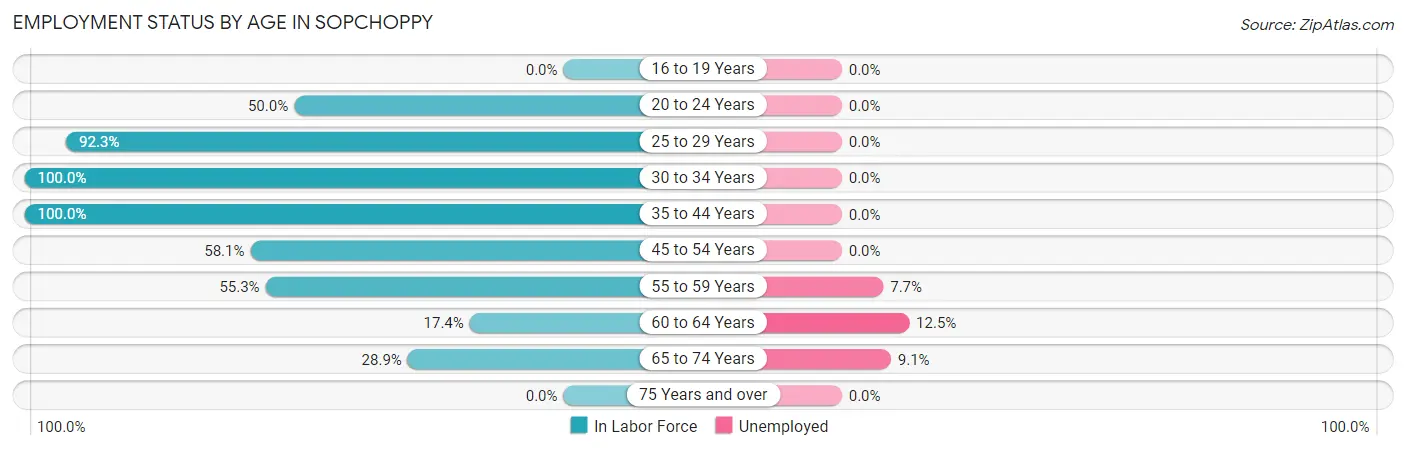
| Age Bracket | In Labor Force | Unemployed |
| 16 to 19 Years | 0 (0.0%) | 0 (0.0%) |
| 20 to 24 Years | 10 (50.0%) | 0 (0.0%) |
| 25 to 29 Years | 36 (92.3%) | 0 (0.0%) |
| 30 to 34 Years | 17 (100.0%) | 0 (0.0%) |
| 35 to 44 Years | 40 (100.0%) | 0 (0.0%) |
| 45 to 54 Years | 18 (58.1%) | 0 (0.0%) |
| 55 to 59 Years | 26 (55.3%) | 2 (7.7%) |
| 60 to 64 Years | 16 (17.4%) | 2 (12.5%) |
| 65 to 74 Years | 11 (28.9%) | 1 (9.1%) |
| 75 Years and over | 0 (0.0%) | 0 (0.0%) |
| Total | 174 (47.7%) | 5 (2.9%) |
Employment Status by Educational Attainment in Sopchoppy
According to labor force statistics for Sopchoppy, 57.5% of individuals (153) out of the total population between 25 and 64 years of age (266) are in the labor force, with 2.6% or 4 of them being unemployed. The group with the highest labor force participation rate are those with the educational attainment of high school diploma, with 64.0% or 32 individuals in the labor force. Within the labor force, individuals with high school diploma education have the highest percentage of unemployment, with 12.5% or 4 of them being unemployed.
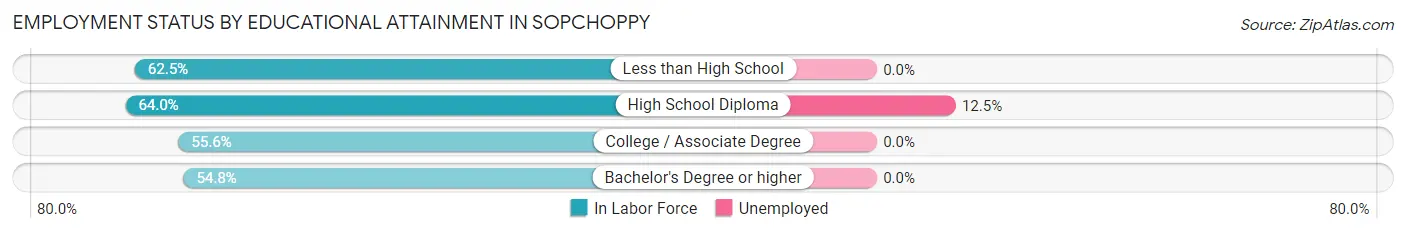
| Educational Attainment | In Labor Force | Unemployed |
| Less than High School | 15 (62.5%) | 0 (0.0%) |
| High School Diploma | 32 (64.0%) | 6 (12.5%) |
| College / Associate Degree | 55 (55.6%) | 0 (0.0%) |
| Bachelor's Degree or higher | 51 (54.8%) | 0 (0.0%) |
| Total | 153 (57.5%) | 7 (2.6%) |
Employment Occupations by Sex in Sopchoppy
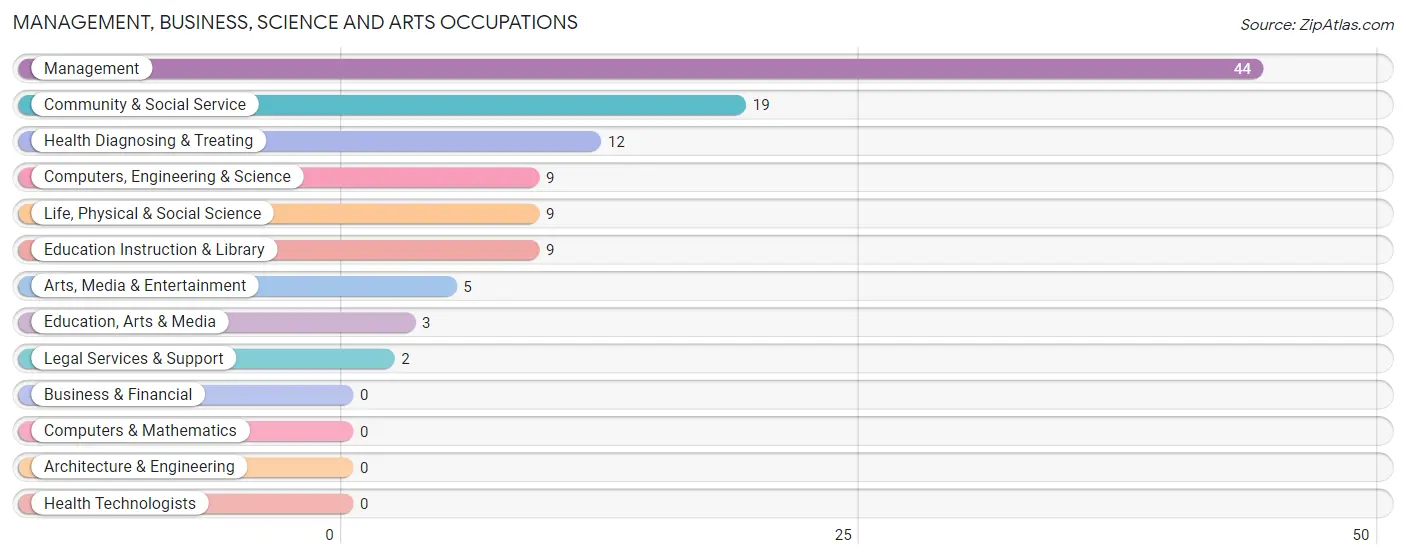
Management, Business, Science and Arts Occupations
The most common Management, Business, Science and Arts occupations in Sopchoppy are Management (44 | 26.0%), Community & Social Service (19 | 11.2%), Health Diagnosing & Treating (12 | 7.1%), Computers, Engineering & Science (9 | 5.3%), and Life, Physical & Social Science (9 | 5.3%).
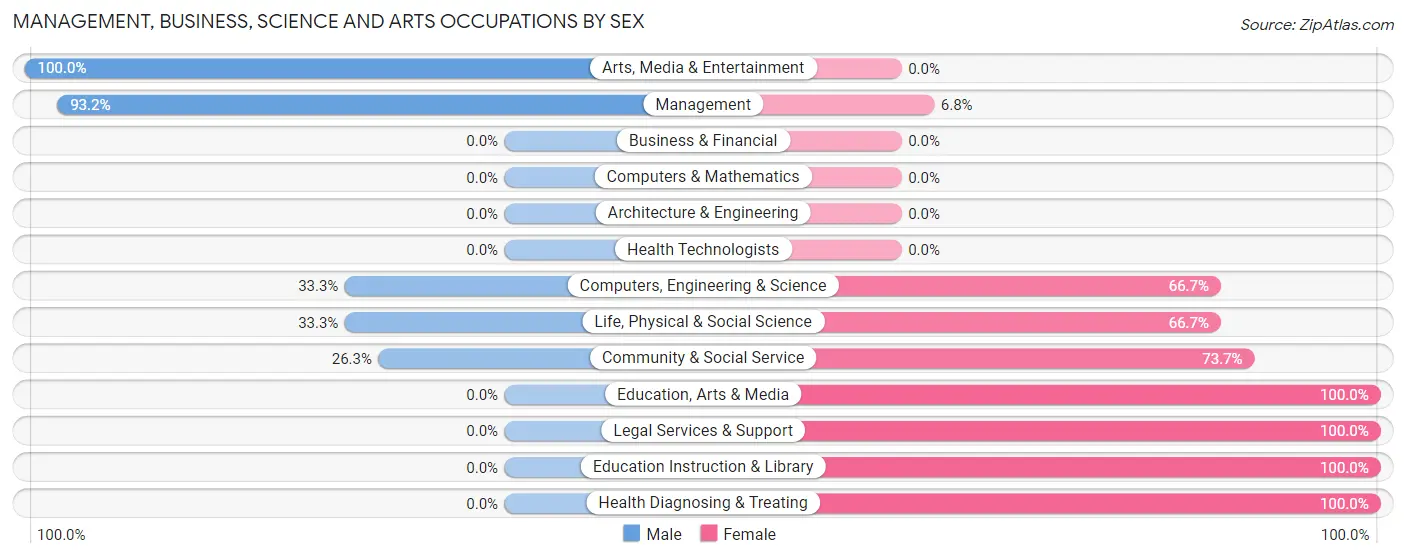
Management, Business, Science and Arts Occupations by Sex
Within the Management, Business, Science and Arts occupations in Sopchoppy, the most male-oriented occupations are Arts, Media & Entertainment (100.0%), Management (93.2%), and Computers, Engineering & Science (33.3%), while the most female-oriented occupations are Education, Arts & Media (100.0%), Legal Services & Support (100.0%), and Education Instruction & Library (100.0%).
| Occupation | Male | Female |
| Management | 41 (93.2%) | 3 (6.8%) |
| Business & Financial | 0 (0.0%) | 0 (0.0%) |
| Computers, Engineering & Science | 3 (33.3%) | 6 (66.7%) |
| Computers & Mathematics | 0 (0.0%) | 0 (0.0%) |
| Architecture & Engineering | 0 (0.0%) | 0 (0.0%) |
| Life, Physical & Social Science | 3 (33.3%) | 6 (66.7%) |
| Community & Social Service | 5 (26.3%) | 14 (73.7%) |
| Education, Arts & Media | 0 (0.0%) | 3 (100.0%) |
| Legal Services & Support | 0 (0.0%) | 2 (100.0%) |
| Education Instruction & Library | 0 (0.0%) | 9 (100.0%) |
| Arts, Media & Entertainment | 5 (100.0%) | 0 (0.0%) |
| Health Diagnosing & Treating | 0 (0.0%) | 12 (100.0%) |
| Health Technologists | 0 (0.0%) | 0 (0.0%) |
| Total (Category) | 49 (58.3%) | 35 (41.7%) |
| Total (Overall) | 102 (60.4%) | 67 (39.6%) |
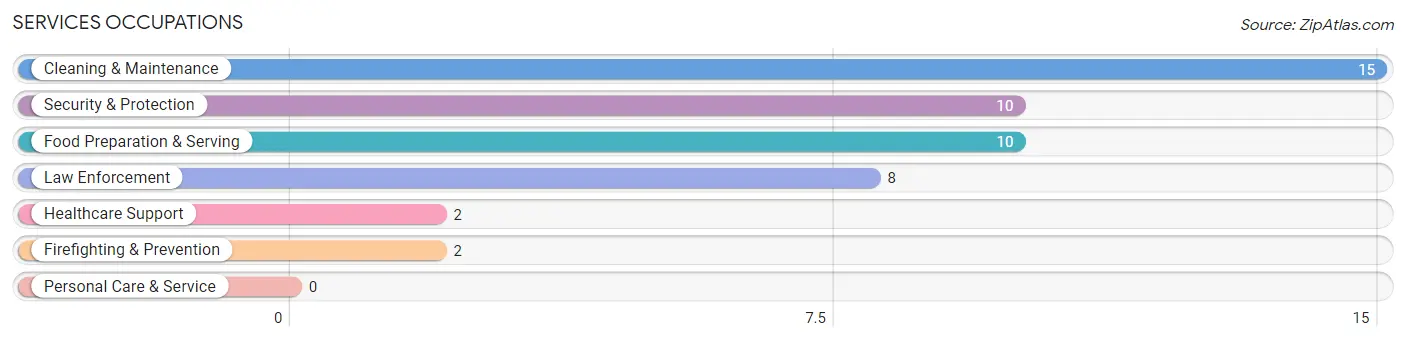
Services Occupations
The most common Services occupations in Sopchoppy are Cleaning & Maintenance (15 | 8.9%), Security & Protection (10 | 5.9%), Food Preparation & Serving (10 | 5.9%), Law Enforcement (8 | 4.7%), and Healthcare Support (2 | 1.2%).
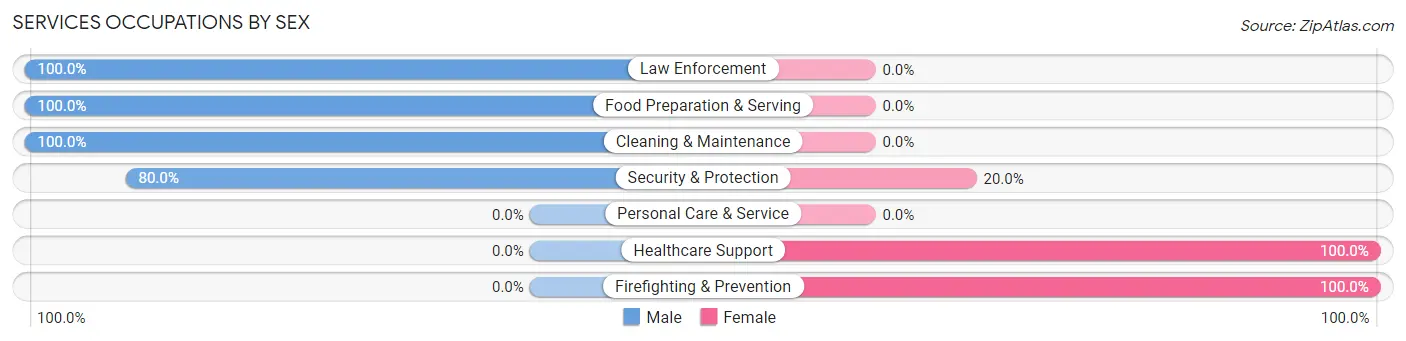
Services Occupations by Sex
Within the Services occupations in Sopchoppy, the most male-oriented occupations are Law Enforcement (100.0%), Food Preparation & Serving (100.0%), and Cleaning & Maintenance (100.0%), while the most female-oriented occupations are Healthcare Support (100.0%), Firefighting & Prevention (100.0%), and Security & Protection (20.0%).
| Occupation | Male | Female |
| Healthcare Support | 0 (0.0%) | 2 (100.0%) |
| Security & Protection | 8 (80.0%) | 2 (20.0%) |
| Firefighting & Prevention | 0 (0.0%) | 2 (100.0%) |
| Law Enforcement | 8 (100.0%) | 0 (0.0%) |
| Food Preparation & Serving | 10 (100.0%) | 0 (0.0%) |
| Cleaning & Maintenance | 15 (100.0%) | 0 (0.0%) |
| Personal Care & Service | 0 (0.0%) | 0 (0.0%) |
| Total (Category) | 33 (89.2%) | 4 (10.8%) |
| Total (Overall) | 102 (60.4%) | 67 (39.6%) |
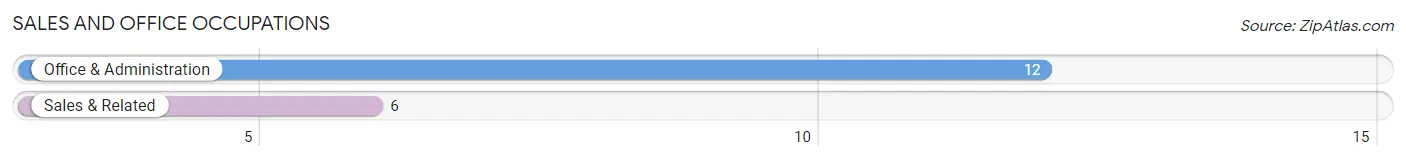
Sales and Office Occupations
The most common Sales and Office occupations in Sopchoppy are Office & Administration (12 | 7.1%), and Sales & Related (6 | 3.5%).
Sales and Office Occupations by Sex
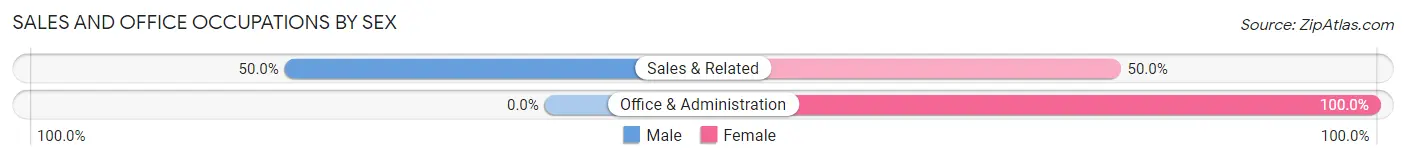
| Occupation | Male | Female |
| Sales & Related | 3 (50.0%) | 3 (50.0%) |
| Office & Administration | 0 (0.0%) | 12 (100.0%) |
| Total (Category) | 3 (16.7%) | 15 (83.3%) |
| Total (Overall) | 102 (60.4%) | 67 (39.6%) |
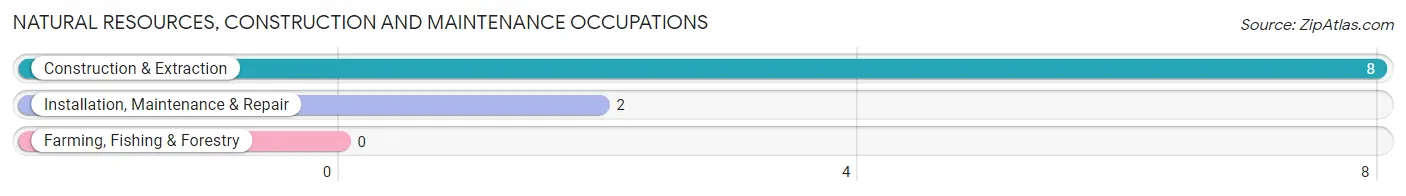
Natural Resources, Construction and Maintenance Occupations
The most common Natural Resources, Construction and Maintenance occupations in Sopchoppy are Construction & Extraction (8 | 4.7%), and Installation, Maintenance & Repair (2 | 1.2%).
Natural Resources, Construction and Maintenance Occupations by Sex
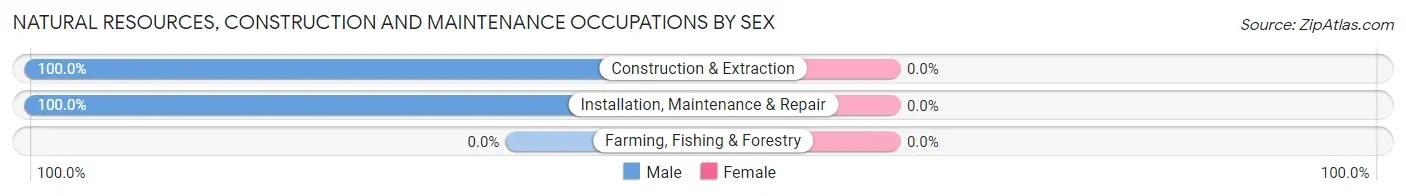
| Occupation | Male | Female |
| Farming, Fishing & Forestry | 0 (0.0%) | 0 (0.0%) |
| Construction & Extraction | 8 (100.0%) | 0 (0.0%) |
| Installation, Maintenance & Repair | 2 (100.0%) | 0 (0.0%) |
| Total (Category) | 10 (100.0%) | 0 (0.0%) |
| Total (Overall) | 102 (60.4%) | 67 (39.6%) |
Production, Transportation and Moving Occupations
The most common Production, Transportation and Moving occupations in Sopchoppy are Material Moving (13 | 7.7%), and Production (7 | 4.1%).
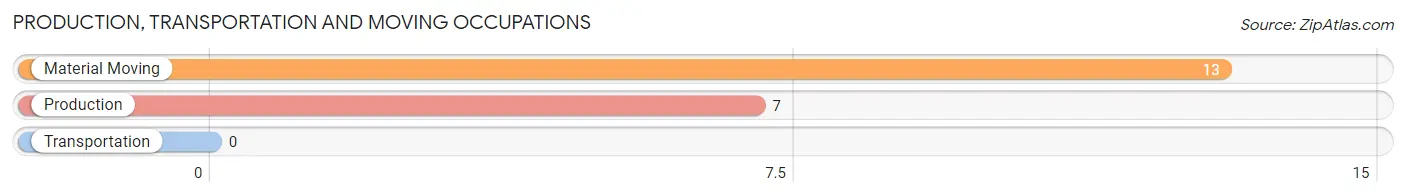
Production, Transportation and Moving Occupations by Sex
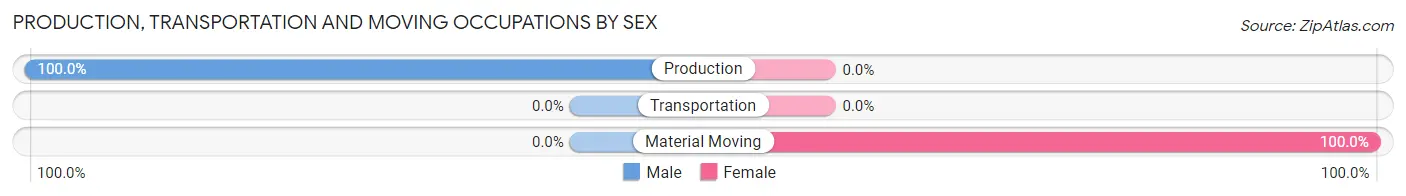
| Occupation | Male | Female |
| Production | 7 (100.0%) | 0 (0.0%) |
| Transportation | 0 (0.0%) | 0 (0.0%) |
| Material Moving | 0 (0.0%) | 13 (100.0%) |
| Total (Category) | 7 (35.0%) | 13 (65.0%) |
| Total (Overall) | 102 (60.4%) | 67 (39.6%) |
Employment Industries by Sex in Sopchoppy
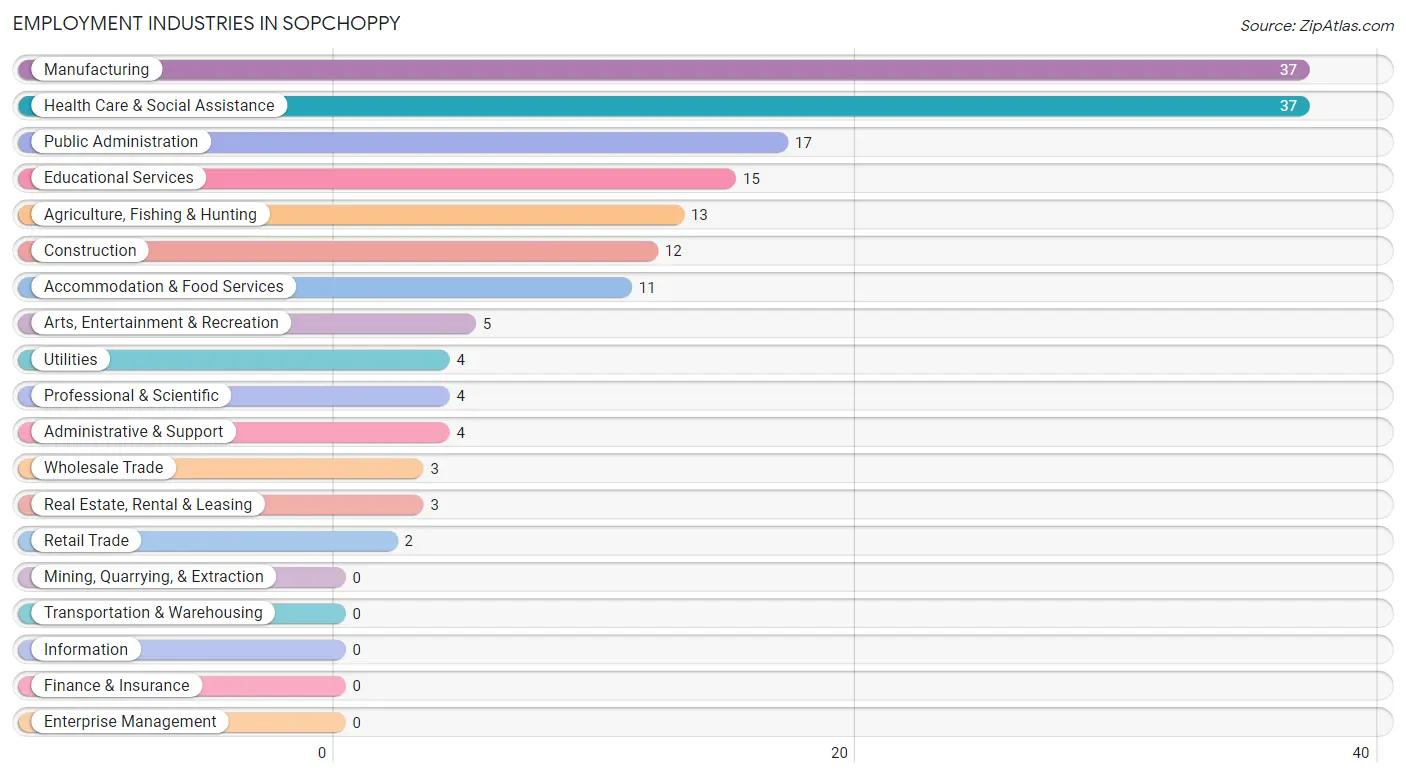
Employment Industries in Sopchoppy
The major employment industries in Sopchoppy include Manufacturing (37 | 21.9%), Health Care & Social Assistance (37 | 21.9%), Public Administration (17 | 10.1%), Educational Services (15 | 8.9%), and Agriculture, Fishing & Hunting (13 | 7.7%).
Employment Industries by Sex in Sopchoppy
The Sopchoppy industries that see more men than women are Agriculture, Fishing & Hunting (100.0%), Construction (100.0%), and Retail Trade (100.0%), whereas the industries that tend to have a higher number of women are Wholesale Trade (100.0%), Real Estate, Rental & Leasing (100.0%), and Educational Services (100.0%).
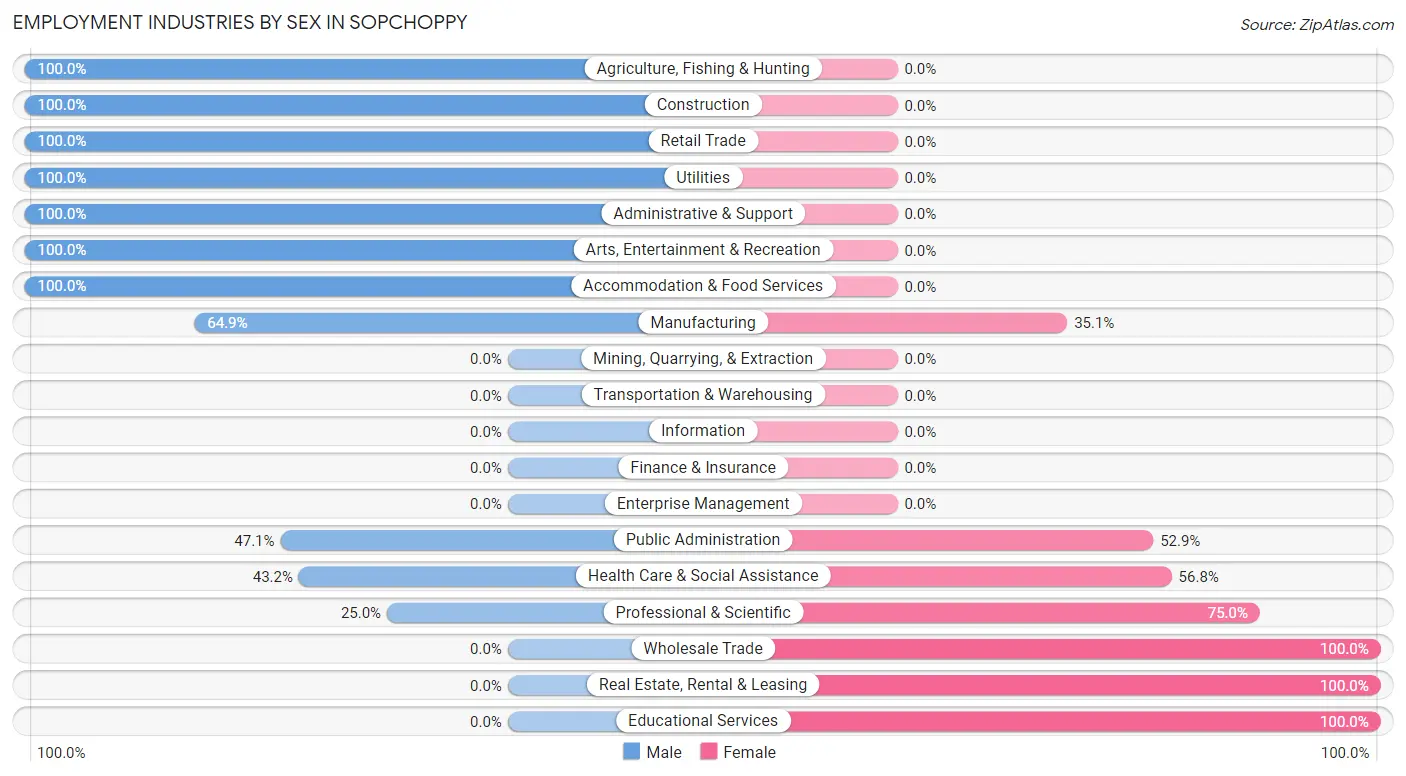
| Industry | Male | Female |
| Agriculture, Fishing & Hunting | 13 (100.0%) | 0 (0.0%) |
| Mining, Quarrying, & Extraction | 0 (0.0%) | 0 (0.0%) |
| Construction | 12 (100.0%) | 0 (0.0%) |
| Manufacturing | 24 (64.9%) | 13 (35.1%) |
| Wholesale Trade | 0 (0.0%) | 3 (100.0%) |
| Retail Trade | 2 (100.0%) | 0 (0.0%) |
| Transportation & Warehousing | 0 (0.0%) | 0 (0.0%) |
| Utilities | 4 (100.0%) | 0 (0.0%) |
| Information | 0 (0.0%) | 0 (0.0%) |
| Finance & Insurance | 0 (0.0%) | 0 (0.0%) |
| Real Estate, Rental & Leasing | 0 (0.0%) | 3 (100.0%) |
| Professional & Scientific | 1 (25.0%) | 3 (75.0%) |
| Enterprise Management | 0 (0.0%) | 0 (0.0%) |
| Administrative & Support | 4 (100.0%) | 0 (0.0%) |
| Educational Services | 0 (0.0%) | 15 (100.0%) |
| Health Care & Social Assistance | 16 (43.2%) | 21 (56.8%) |
| Arts, Entertainment & Recreation | 5 (100.0%) | 0 (0.0%) |
| Accommodation & Food Services | 11 (100.0%) | 0 (0.0%) |
| Public Administration | 8 (47.1%) | 9 (52.9%) |
| Total | 102 (60.4%) | 67 (39.6%) |
Education in Sopchoppy
School Enrollment in Sopchoppy
The most common levels of schooling among the 47 students in Sopchoppy are high school (18 | 38.3%), middle school (17 | 36.2%), and college / undergraduate (5 | 10.6%).
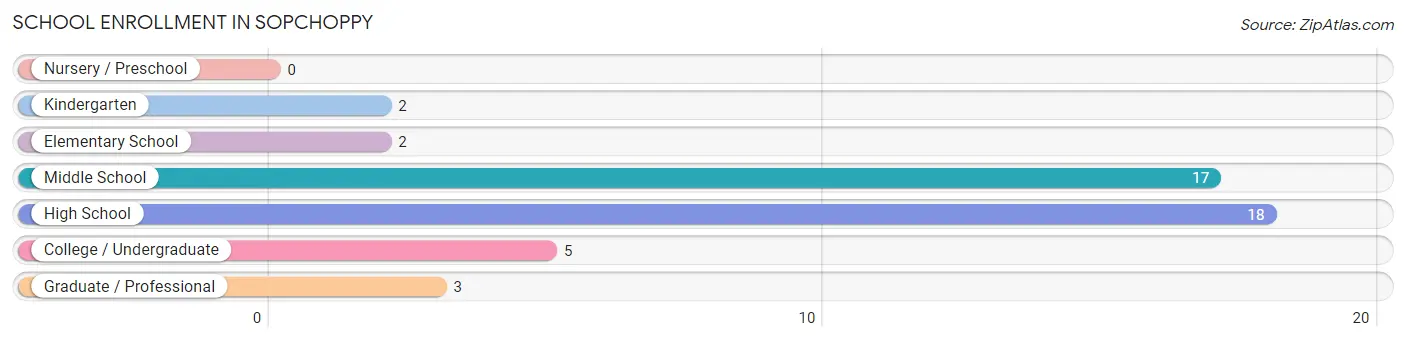
| School Level | # Students | % Students |
| Nursery / Preschool | 0 | 0.0% |
| Kindergarten | 2 | 4.3% |
| Elementary School | 2 | 4.3% |
| Middle School | 17 | 36.2% |
| High School | 18 | 38.3% |
| College / Undergraduate | 5 | 10.6% |
| Graduate / Professional | 3 | 6.4% |
| Total | 47 | 100.0% |
School Enrollment by Age by Funding Source in Sopchoppy
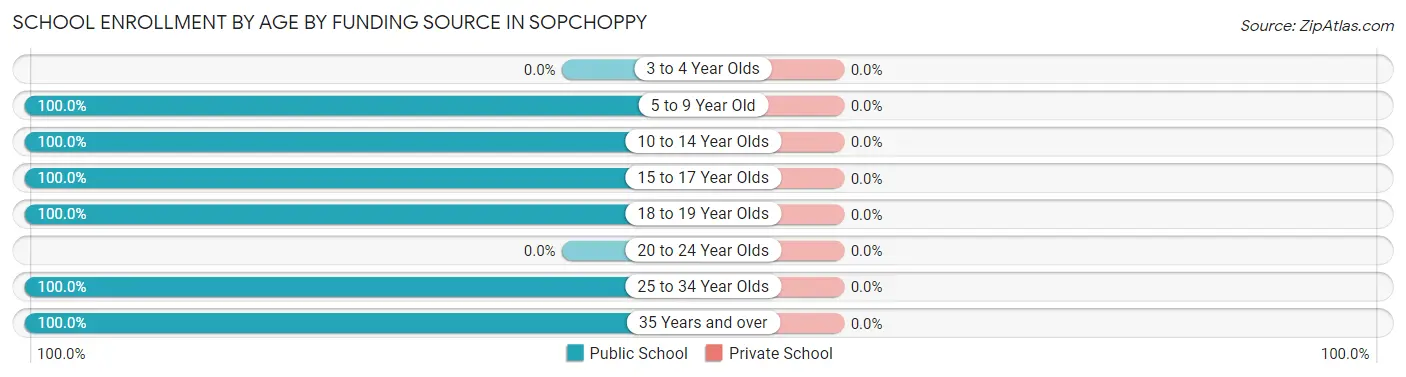
| Age Bracket | Public School | Private School |
| 3 to 4 Year Olds | 0 (0.0%) | 0 (0.0%) |
| 5 to 9 Year Old | 4 (100.0%) | 0 (0.0%) |
| 10 to 14 Year Olds | 17 (100.0%) | 0 (0.0%) |
| 15 to 17 Year Olds | 14 (100.0%) | 0 (0.0%) |
| 18 to 19 Year Olds | 7 (100.0%) | 0 (0.0%) |
| 20 to 24 Year Olds | 0 (0.0%) | 0 (0.0%) |
| 25 to 34 Year Olds | 2 (100.0%) | 0 (0.0%) |
| 35 Years and over | 3 (100.0%) | 0 (0.0%) |
| Total | 47 (100.0%) | 0 (0.0%) |
Educational Attainment by Field of Study in Sopchoppy
Science & technology (59 | 42.1%), social sciences (28 | 20.0%), arts & humanities (24 | 17.1%), computers & mathematics (15 | 10.7%), and psychology (7 | 5.0%) are the most common fields of study among 140 individuals in Sopchoppy who have obtained a bachelor's degree or higher.
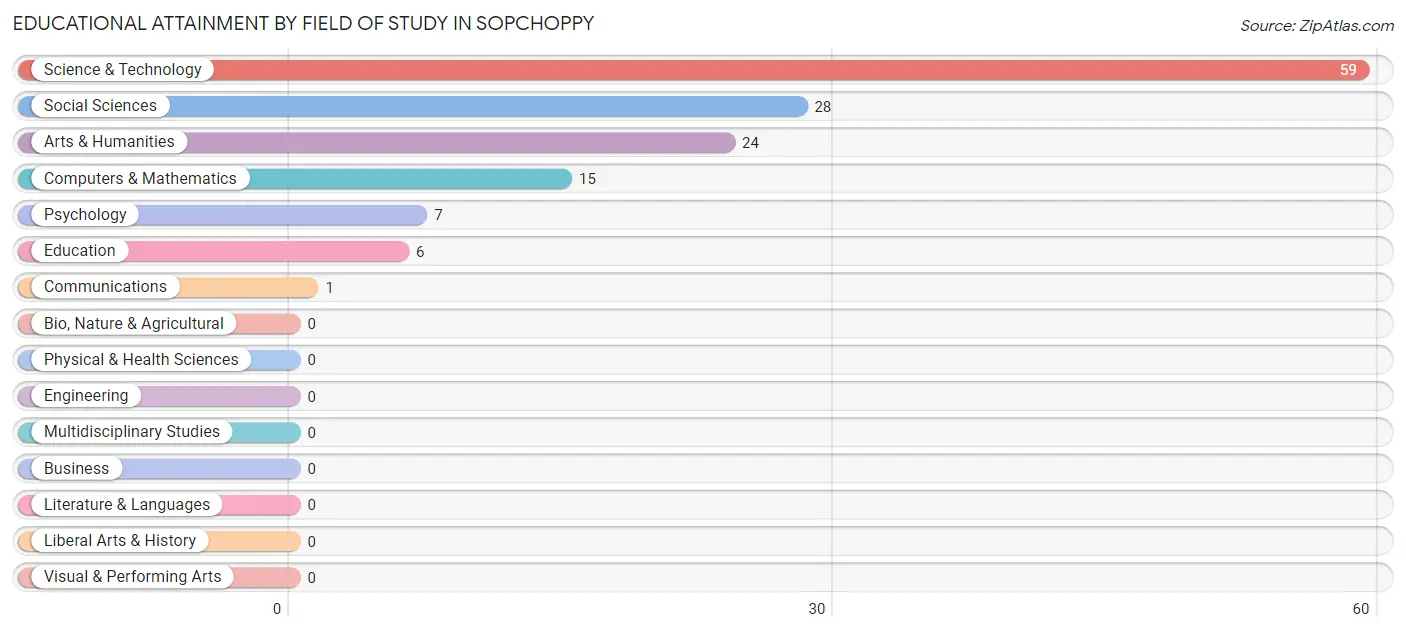
| Field of Study | # Graduates | % Graduates |
| Computers & Mathematics | 15 | 10.7% |
| Bio, Nature & Agricultural | 0 | 0.0% |
| Physical & Health Sciences | 0 | 0.0% |
| Psychology | 7 | 5.0% |
| Social Sciences | 28 | 20.0% |
| Engineering | 0 | 0.0% |
| Multidisciplinary Studies | 0 | 0.0% |
| Science & Technology | 59 | 42.1% |
| Business | 0 | 0.0% |
| Education | 6 | 4.3% |
| Literature & Languages | 0 | 0.0% |
| Liberal Arts & History | 0 | 0.0% |
| Visual & Performing Arts | 0 | 0.0% |
| Communications | 1 | 0.7% |
| Arts & Humanities | 24 | 17.1% |
| Total | 140 | 100.0% |
Transportation & Commute in Sopchoppy
Vehicle Availability by Sex in Sopchoppy
The most prevalent vehicle ownership categories in Sopchoppy are males with 2 vehicles (50, accounting for 49.0%) and females with 2 vehicles (46, making up 74.6%).
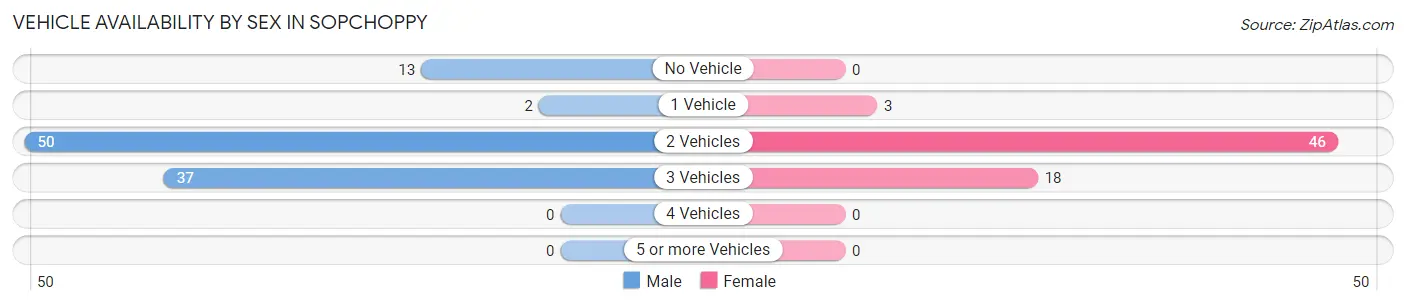
| Vehicles Available | Male | Female |
| No Vehicle | 13 (12.8%) | 0 (0.0%) |
| 1 Vehicle | 2 (2.0%) | 3 (4.5%) |
| 2 Vehicles | 50 (49.0%) | 46 (68.7%) |
| 3 Vehicles | 37 (36.3%) | 18 (26.9%) |
| 4 Vehicles | 0 (0.0%) | 0 (0.0%) |
| 5 or more Vehicles | 0 (0.0%) | 0 (0.0%) |
| Total | 102 (100.0%) | 67 (100.0%) |
Commute Time in Sopchoppy
The most frequently occuring commute durations in Sopchoppy are less than 5 minutes (39 commuters, 23.2%), 15 to 19 minutes (33 commuters, 19.6%), and 60 to 89 minutes (27 commuters, 16.1%).
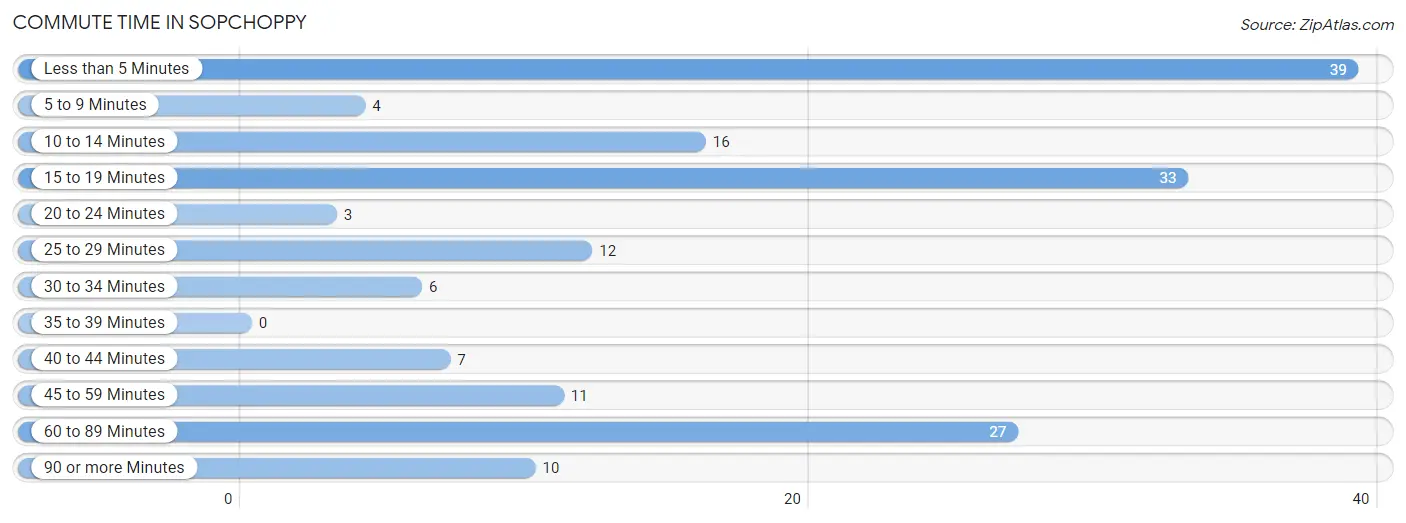
| Commute Time | # Commuters | % Commuters |
| Less than 5 Minutes | 39 | 23.2% |
| 5 to 9 Minutes | 4 | 2.4% |
| 10 to 14 Minutes | 16 | 9.5% |
| 15 to 19 Minutes | 33 | 19.6% |
| 20 to 24 Minutes | 3 | 1.8% |
| 25 to 29 Minutes | 12 | 7.1% |
| 30 to 34 Minutes | 6 | 3.6% |
| 35 to 39 Minutes | 0 | 0.0% |
| 40 to 44 Minutes | 7 | 4.2% |
| 45 to 59 Minutes | 11 | 6.6% |
| 60 to 89 Minutes | 27 | 16.1% |
| 90 or more Minutes | 10 | 5.9% |
Commute Time by Sex in Sopchoppy
The most common commute times in Sopchoppy are less than 5 minutes (26 commuters, 25.7%) for males and less than 5 minutes (13 commuters, 19.4%) for females.
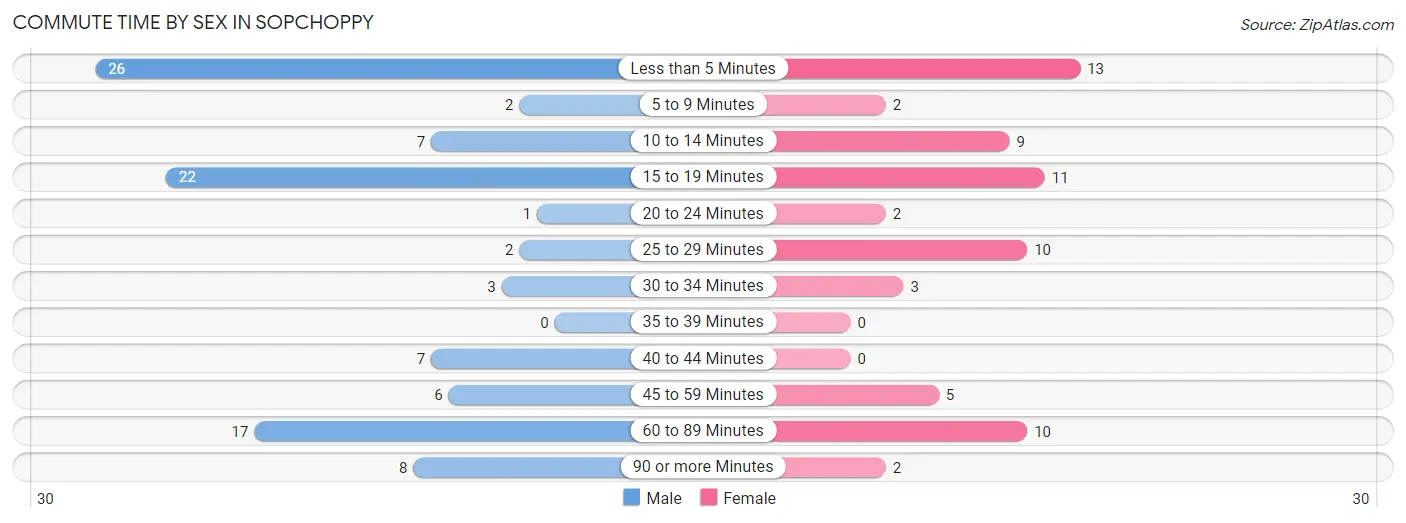
| Commute Time | Male | Female |
| Less than 5 Minutes | 26 (25.7%) | 13 (19.4%) |
| 5 to 9 Minutes | 2 (2.0%) | 2 (3.0%) |
| 10 to 14 Minutes | 7 (6.9%) | 9 (13.4%) |
| 15 to 19 Minutes | 22 (21.8%) | 11 (16.4%) |
| 20 to 24 Minutes | 1 (1.0%) | 2 (3.0%) |
| 25 to 29 Minutes | 2 (2.0%) | 10 (14.9%) |
| 30 to 34 Minutes | 3 (3.0%) | 3 (4.5%) |
| 35 to 39 Minutes | 0 (0.0%) | 0 (0.0%) |
| 40 to 44 Minutes | 7 (6.9%) | 0 (0.0%) |
| 45 to 59 Minutes | 6 (5.9%) | 5 (7.5%) |
| 60 to 89 Minutes | 17 (16.8%) | 10 (14.9%) |
| 90 or more Minutes | 8 (7.9%) | 2 (3.0%) |
Time of Departure to Work by Sex in Sopchoppy
The most frequent times of departure to work in Sopchoppy are 7:30 AM to 7:59 AM (37, 36.6%) for males and 7:30 AM to 7:59 AM (26, 38.8%) for females.
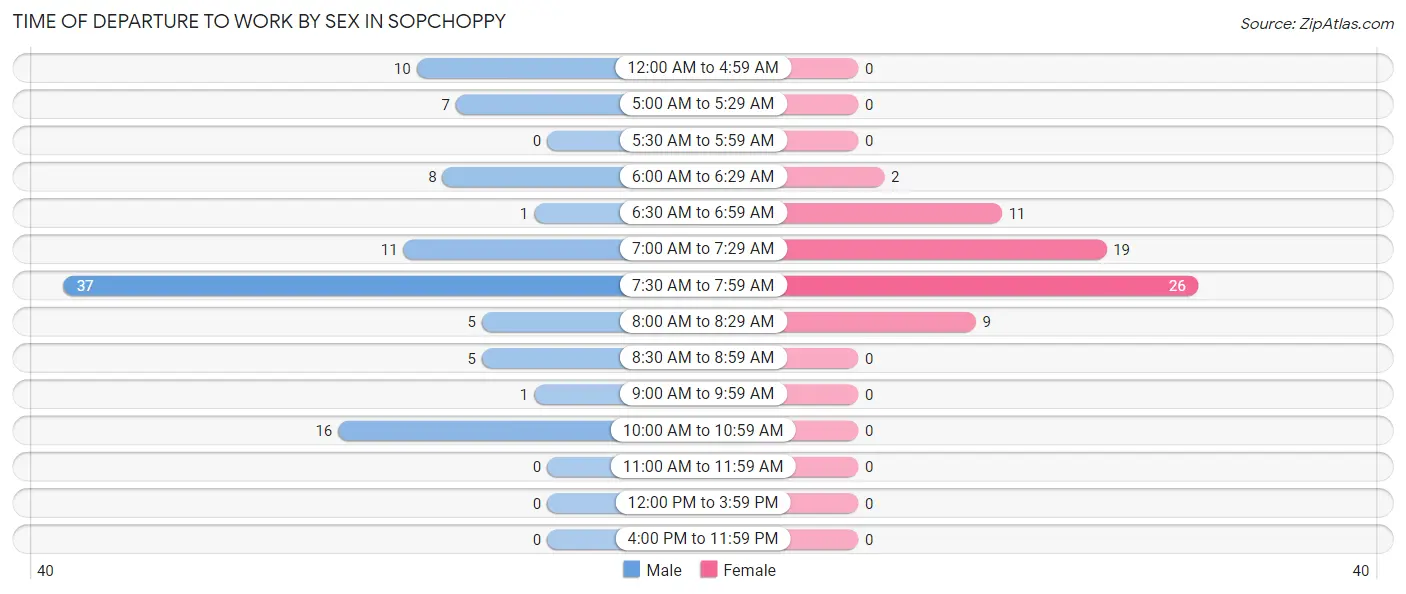
| Time of Departure | Male | Female |
| 12:00 AM to 4:59 AM | 10 (9.9%) | 0 (0.0%) |
| 5:00 AM to 5:29 AM | 7 (6.9%) | 0 (0.0%) |
| 5:30 AM to 5:59 AM | 0 (0.0%) | 0 (0.0%) |
| 6:00 AM to 6:29 AM | 8 (7.9%) | 2 (3.0%) |
| 6:30 AM to 6:59 AM | 1 (1.0%) | 11 (16.4%) |
| 7:00 AM to 7:29 AM | 11 (10.9%) | 19 (28.4%) |
| 7:30 AM to 7:59 AM | 37 (36.6%) | 26 (38.8%) |
| 8:00 AM to 8:29 AM | 5 (5.0%) | 9 (13.4%) |
| 8:30 AM to 8:59 AM | 5 (5.0%) | 0 (0.0%) |
| 9:00 AM to 9:59 AM | 1 (1.0%) | 0 (0.0%) |
| 10:00 AM to 10:59 AM | 16 (15.8%) | 0 (0.0%) |
| 11:00 AM to 11:59 AM | 0 (0.0%) | 0 (0.0%) |
| 12:00 PM to 3:59 PM | 0 (0.0%) | 0 (0.0%) |
| 4:00 PM to 11:59 PM | 0 (0.0%) | 0 (0.0%) |
| Total | 101 (100.0%) | 67 (100.0%) |
Housing Occupancy in Sopchoppy
Occupancy by Ownership in Sopchoppy
Of the total 177 dwellings in Sopchoppy, owner-occupied units account for 150 (84.8%), while renter-occupied units make up 27 (15.2%).
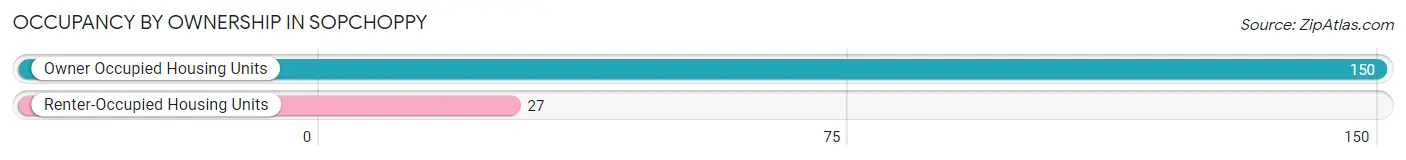
| Occupancy | # Housing Units | % Housing Units |
| Owner Occupied Housing Units | 150 | 84.8% |
| Renter-Occupied Housing Units | 27 | 15.2% |
| Total Occupied Housing Units | 177 | 100.0% |
Occupancy by Household Size in Sopchoppy
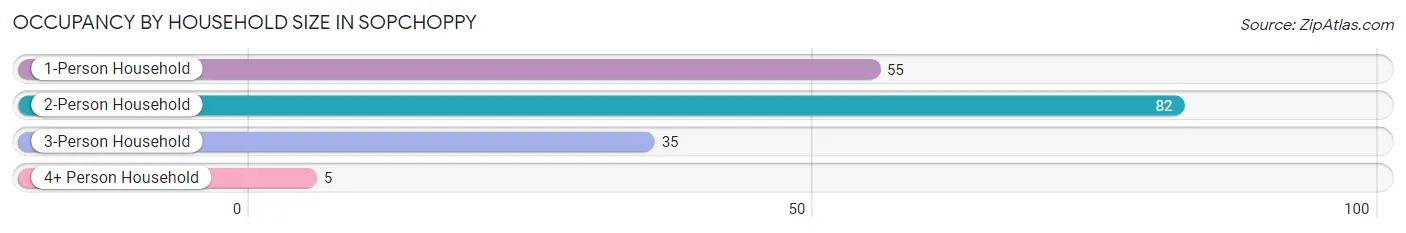
| Household Size | # Housing Units | % Housing Units |
| 1-Person Household | 55 | 31.1% |
| 2-Person Household | 82 | 46.3% |
| 3-Person Household | 35 | 19.8% |
| 4+ Person Household | 5 | 2.8% |
| Total Housing Units | 177 | 100.0% |
Occupancy by Ownership by Household Size in Sopchoppy
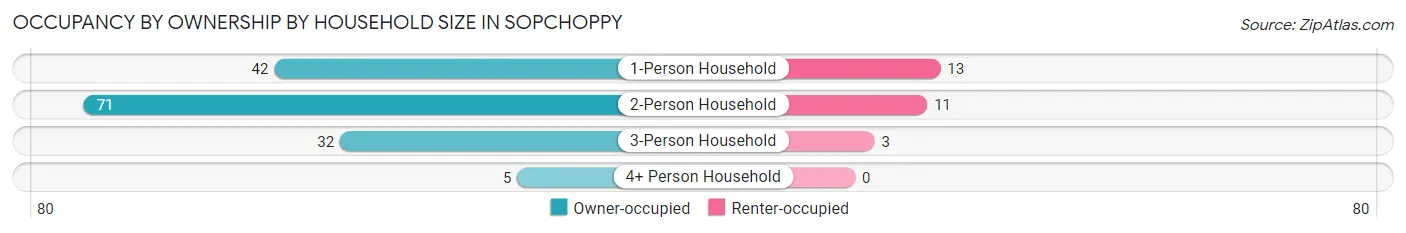
| Household Size | Owner-occupied | Renter-occupied |
| 1-Person Household | 42 (76.4%) | 13 (23.6%) |
| 2-Person Household | 71 (86.6%) | 11 (13.4%) |
| 3-Person Household | 32 (91.4%) | 3 (8.6%) |
| 4+ Person Household | 5 (100.0%) | 0 (0.0%) |
| Total Housing Units | 150 (84.8%) | 27 (15.2%) |
Occupancy by Educational Attainment in Sopchoppy
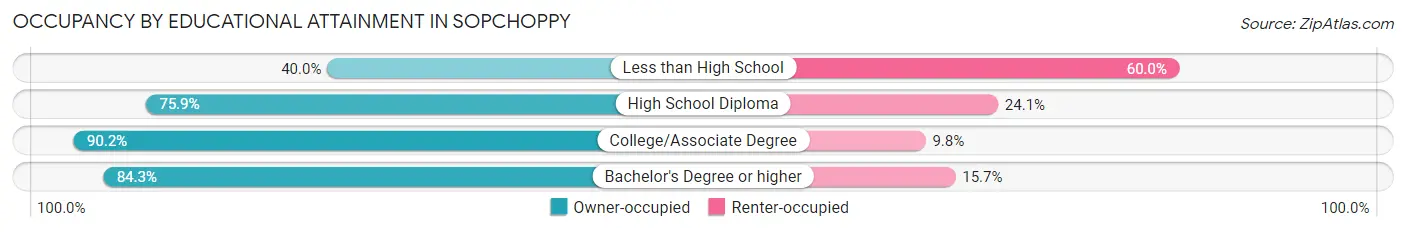
| Household Size | Owner-occupied | Renter-occupied |
| Less than High School | 2 (40.0%) | 3 (60.0%) |
| High School Diploma | 22 (75.9%) | 7 (24.1%) |
| College/Associate Degree | 83 (90.2%) | 9 (9.8%) |
| Bachelor's Degree or higher | 43 (84.3%) | 8 (15.7%) |
Occupancy by Age of Householder in Sopchoppy
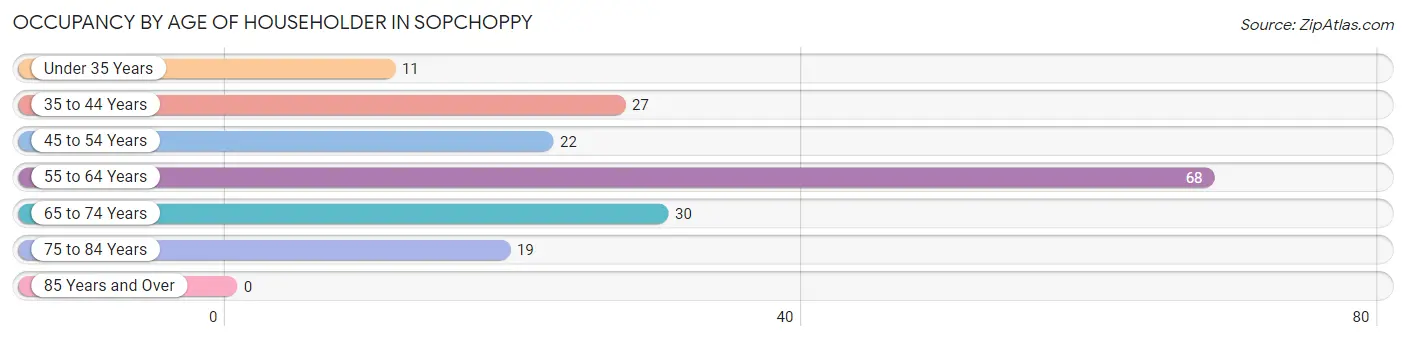
| Age Bracket | # Households | % Households |
| Under 35 Years | 11 | 6.2% |
| 35 to 44 Years | 27 | 15.2% |
| 45 to 54 Years | 22 | 12.4% |
| 55 to 64 Years | 68 | 38.4% |
| 65 to 74 Years | 30 | 17.0% |
| 75 to 84 Years | 19 | 10.7% |
| 85 Years and Over | 0 | 0.0% |
| Total | 177 | 100.0% |
Housing Finances in Sopchoppy
Median Income by Occupancy in Sopchoppy
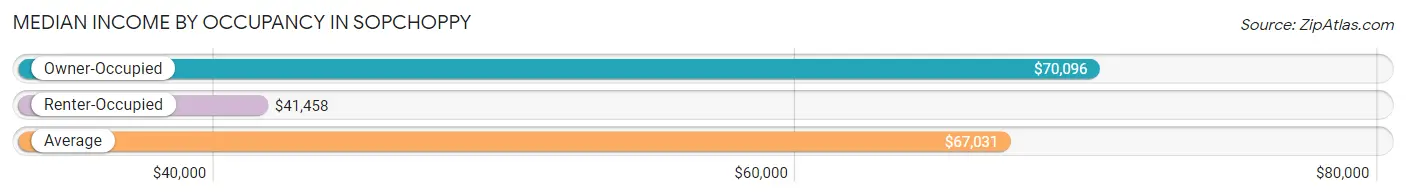
| Occupancy Type | # Households | Median Income |
| Owner-Occupied | 150 (84.8%) | $70,096 |
| Renter-Occupied | 27 (15.2%) | $41,458 |
| Average | 177 (100.0%) | $67,031 |
Occupancy by Householder Income Bracket in Sopchoppy
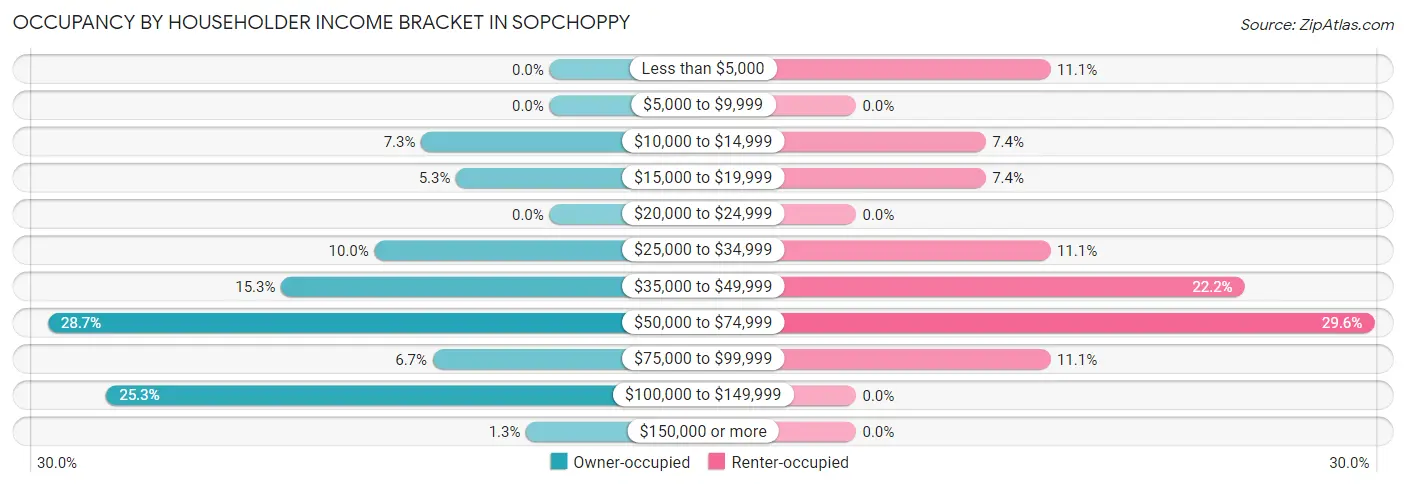
| Income Bracket | Owner-occupied | Renter-occupied |
| Less than $5,000 | 0 (0.0%) | 3 (11.1%) |
| $5,000 to $9,999 | 0 (0.0%) | 0 (0.0%) |
| $10,000 to $14,999 | 11 (7.3%) | 2 (7.4%) |
| $15,000 to $19,999 | 8 (5.3%) | 2 (7.4%) |
| $20,000 to $24,999 | 0 (0.0%) | 0 (0.0%) |
| $25,000 to $34,999 | 15 (10.0%) | 3 (11.1%) |
| $35,000 to $49,999 | 23 (15.3%) | 6 (22.2%) |
| $50,000 to $74,999 | 43 (28.7%) | 8 (29.6%) |
| $75,000 to $99,999 | 10 (6.7%) | 3 (11.1%) |
| $100,000 to $149,999 | 38 (25.3%) | 0 (0.0%) |
| $150,000 or more | 2 (1.3%) | 0 (0.0%) |
| Total | 150 (100.0%) | 27 (100.0%) |
Monthly Housing Cost Tiers in Sopchoppy
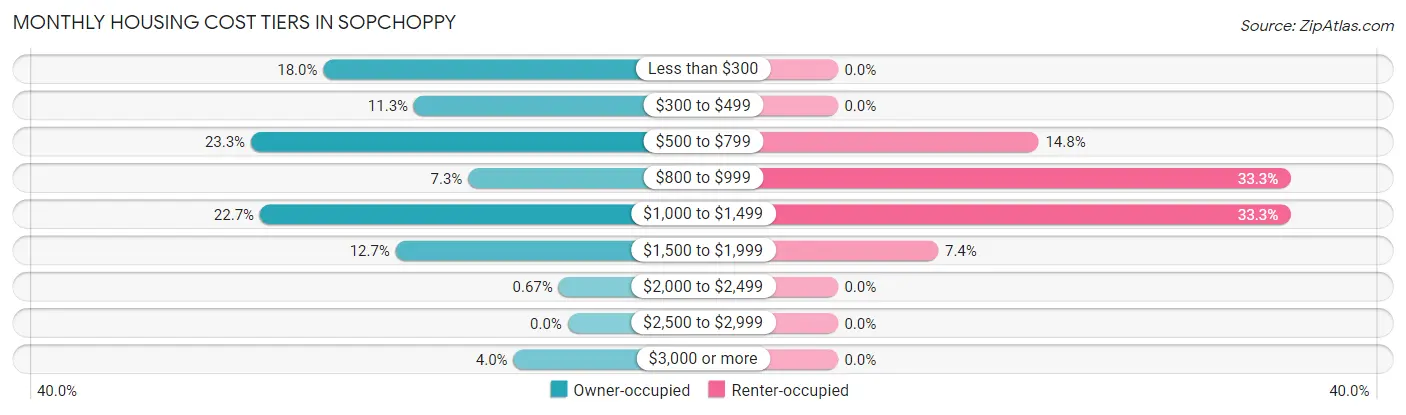
| Monthly Cost | Owner-occupied | Renter-occupied |
| Less than $300 | 27 (18.0%) | 0 (0.0%) |
| $300 to $499 | 17 (11.3%) | 0 (0.0%) |
| $500 to $799 | 35 (23.3%) | 4 (14.8%) |
| $800 to $999 | 11 (7.3%) | 9 (33.3%) |
| $1,000 to $1,499 | 34 (22.7%) | 9 (33.3%) |
| $1,500 to $1,999 | 19 (12.7%) | 2 (7.4%) |
| $2,000 to $2,499 | 1 (0.7%) | 0 (0.0%) |
| $2,500 to $2,999 | 0 (0.0%) | 0 (0.0%) |
| $3,000 or more | 6 (4.0%) | 0 (0.0%) |
| Total | 150 (100.0%) | 27 (100.0%) |
Physical Housing Characteristics in Sopchoppy
Housing Structures in Sopchoppy
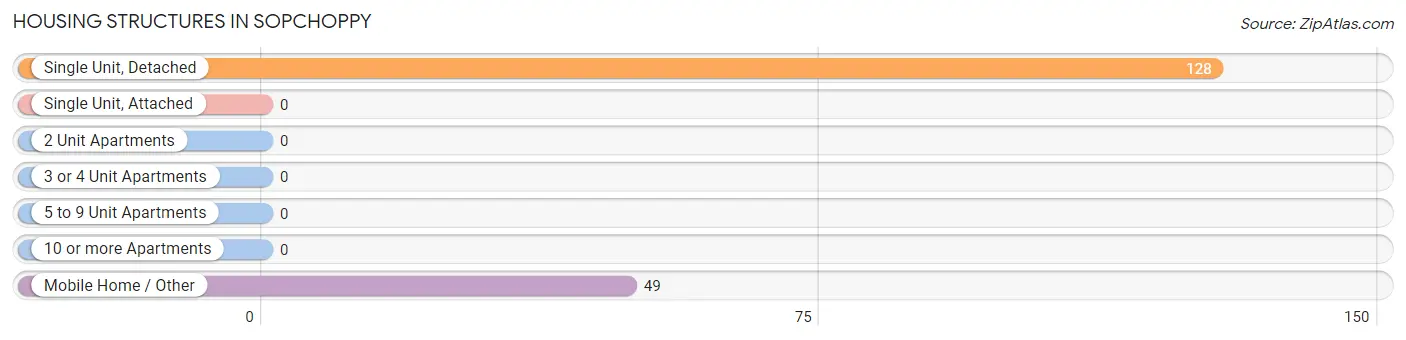
| Structure Type | # Housing Units | % Housing Units |
| Single Unit, Detached | 128 | 72.3% |
| Single Unit, Attached | 0 | 0.0% |
| 2 Unit Apartments | 0 | 0.0% |
| 3 or 4 Unit Apartments | 0 | 0.0% |
| 5 to 9 Unit Apartments | 0 | 0.0% |
| 10 or more Apartments | 0 | 0.0% |
| Mobile Home / Other | 49 | 27.7% |
| Total | 177 | 100.0% |
Housing Structures by Occupancy in Sopchoppy
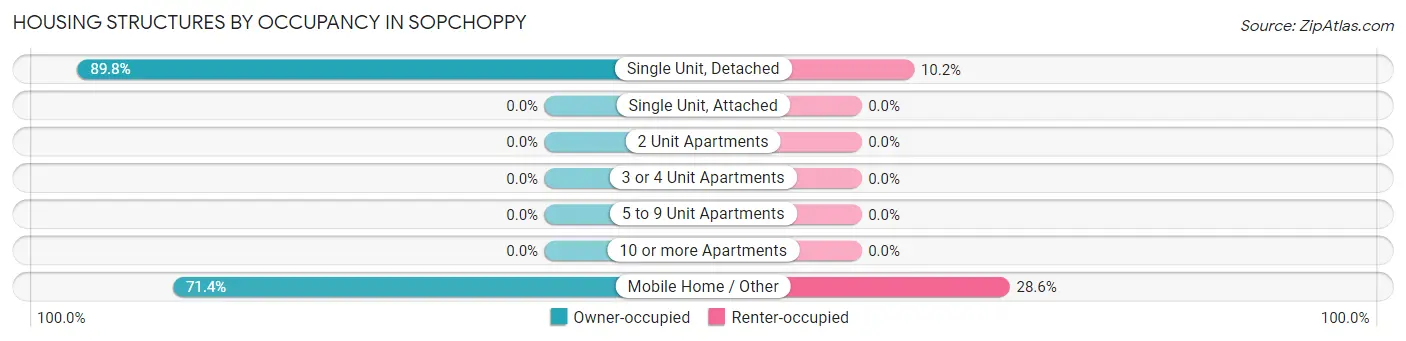
| Structure Type | Owner-occupied | Renter-occupied |
| Single Unit, Detached | 115 (89.8%) | 13 (10.2%) |
| Single Unit, Attached | 0 (0.0%) | 0 (0.0%) |
| 2 Unit Apartments | 0 (0.0%) | 0 (0.0%) |
| 3 or 4 Unit Apartments | 0 (0.0%) | 0 (0.0%) |
| 5 to 9 Unit Apartments | 0 (0.0%) | 0 (0.0%) |
| 10 or more Apartments | 0 (0.0%) | 0 (0.0%) |
| Mobile Home / Other | 35 (71.4%) | 14 (28.6%) |
| Total | 150 (84.8%) | 27 (15.2%) |
Housing Structures by Number of Rooms in Sopchoppy
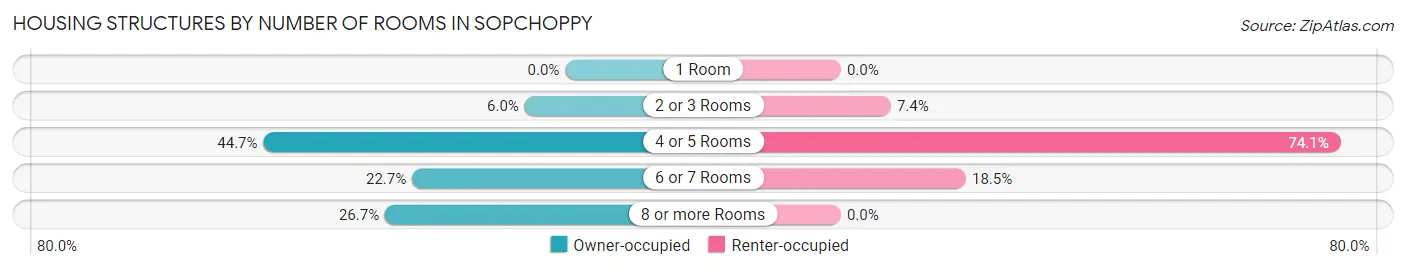
| Number of Rooms | Owner-occupied | Renter-occupied |
| 1 Room | 0 (0.0%) | 0 (0.0%) |
| 2 or 3 Rooms | 9 (6.0%) | 2 (7.4%) |
| 4 or 5 Rooms | 67 (44.7%) | 20 (74.1%) |
| 6 or 7 Rooms | 34 (22.7%) | 5 (18.5%) |
| 8 or more Rooms | 40 (26.7%) | 0 (0.0%) |
| Total | 150 (100.0%) | 27 (100.0%) |
Housing Structure by Heating Type in Sopchoppy
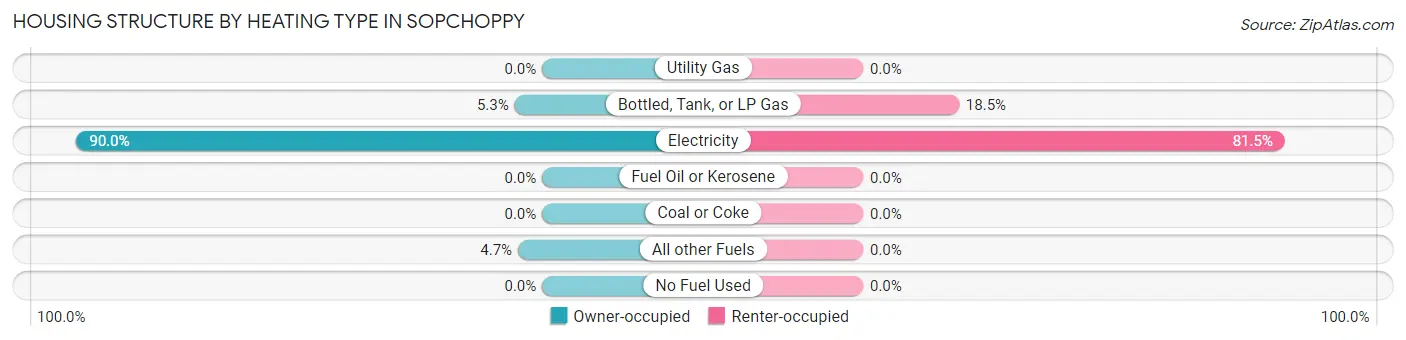
| Heating Type | Owner-occupied | Renter-occupied |
| Utility Gas | 0 (0.0%) | 0 (0.0%) |
| Bottled, Tank, or LP Gas | 8 (5.3%) | 5 (18.5%) |
| Electricity | 135 (90.0%) | 22 (81.5%) |
| Fuel Oil or Kerosene | 0 (0.0%) | 0 (0.0%) |
| Coal or Coke | 0 (0.0%) | 0 (0.0%) |
| All other Fuels | 7 (4.7%) | 0 (0.0%) |
| No Fuel Used | 0 (0.0%) | 0 (0.0%) |
| Total | 150 (100.0%) | 27 (100.0%) |
Household Vehicle Usage in Sopchoppy
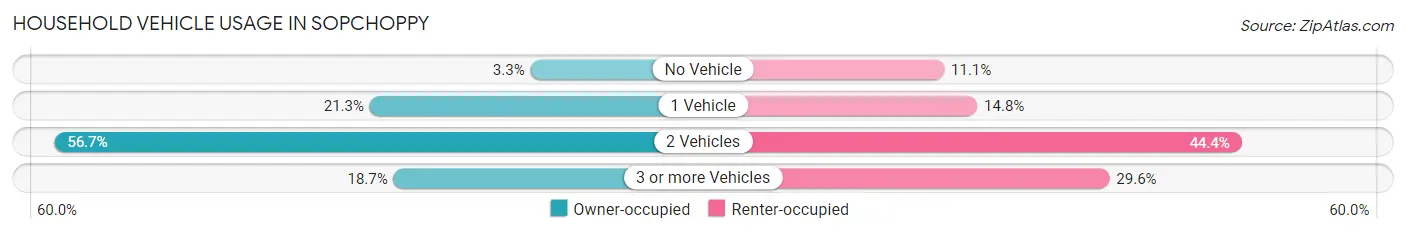
| Vehicles per Household | Owner-occupied | Renter-occupied |
| No Vehicle | 5 (3.3%) | 3 (11.1%) |
| 1 Vehicle | 32 (21.3%) | 4 (14.8%) |
| 2 Vehicles | 85 (56.7%) | 12 (44.4%) |
| 3 or more Vehicles | 28 (18.7%) | 8 (29.6%) |
| Total | 150 (100.0%) | 27 (100.0%) |
Real Estate & Mortgages in Sopchoppy
Real Estate and Mortgage Overview in Sopchoppy
| Characteristic | Without Mortgage | With Mortgage |
| Housing Units | 77 | 73 |
| Median Property Value | $143,100 | $256,100 |
| Median Household Income | - | - |
| Monthly Housing Costs | $383 | $6 |
| Real Estate Taxes | - | - |
Property Value by Mortgage Status in Sopchoppy
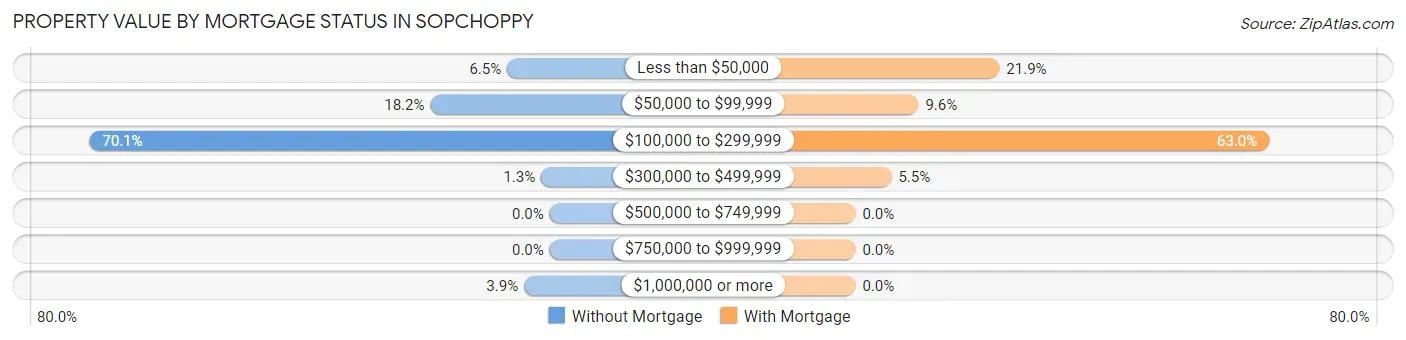
| Property Value | Without Mortgage | With Mortgage |
| Less than $50,000 | 5 (6.5%) | 16 (21.9%) |
| $50,000 to $99,999 | 14 (18.2%) | 7 (9.6%) |
| $100,000 to $299,999 | 54 (70.1%) | 46 (63.0%) |
| $300,000 to $499,999 | 1 (1.3%) | 4 (5.5%) |
| $500,000 to $749,999 | 0 (0.0%) | 0 (0.0%) |
| $750,000 to $999,999 | 0 (0.0%) | 0 (0.0%) |
| $1,000,000 or more | 3 (3.9%) | 0 (0.0%) |
| Total | 77 (100.0%) | 73 (100.0%) |
Household Income by Mortgage Status in Sopchoppy
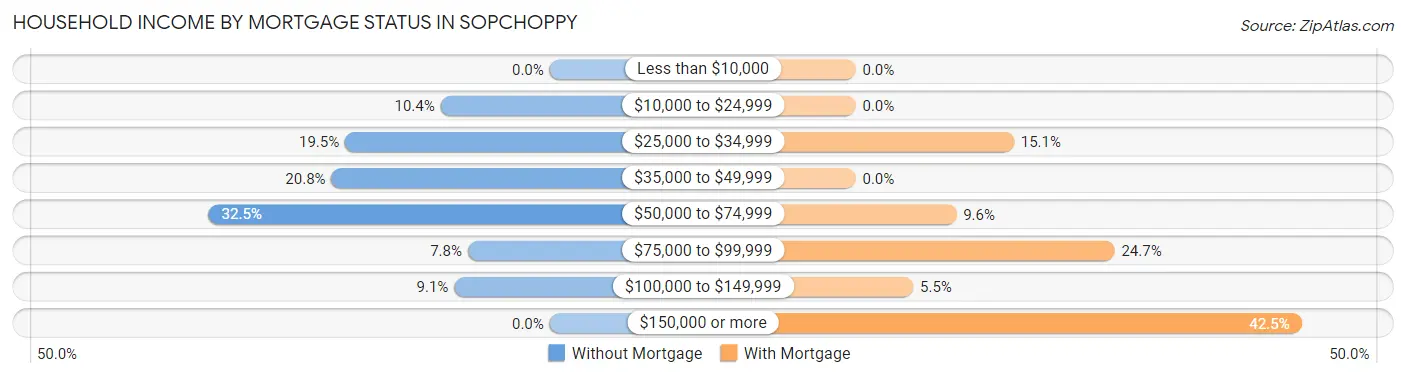
| Household Income | Without Mortgage | With Mortgage |
| Less than $10,000 | 0 (0.0%) | 0 (0.0%) |
| $10,000 to $24,999 | 8 (10.4%) | 0 (0.0%) |
| $25,000 to $34,999 | 15 (19.5%) | 11 (15.1%) |
| $35,000 to $49,999 | 16 (20.8%) | 0 (0.0%) |
| $50,000 to $74,999 | 25 (32.5%) | 7 (9.6%) |
| $75,000 to $99,999 | 6 (7.8%) | 18 (24.7%) |
| $100,000 to $149,999 | 7 (9.1%) | 4 (5.5%) |
| $150,000 or more | 0 (0.0%) | 31 (42.5%) |
| Total | 77 (100.0%) | 73 (100.0%) |
Property Value to Household Income Ratio in Sopchoppy
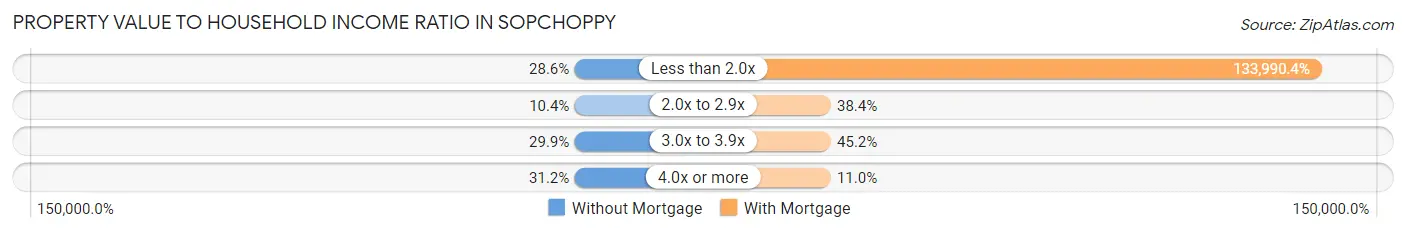
| Value-to-Income Ratio | Without Mortgage | With Mortgage |
| Less than 2.0x | 22 (28.6%) | 97,813 (133,990.4%) |
| 2.0x to 2.9x | 8 (10.4%) | 28 (38.4%) |
| 3.0x to 3.9x | 23 (29.9%) | 33 (45.2%) |
| 4.0x or more | 24 (31.2%) | 8 (11.0%) |
| Total | 77 (100.0%) | 73 (100.0%) |
Real Estate Taxes by Mortgage Status in Sopchoppy
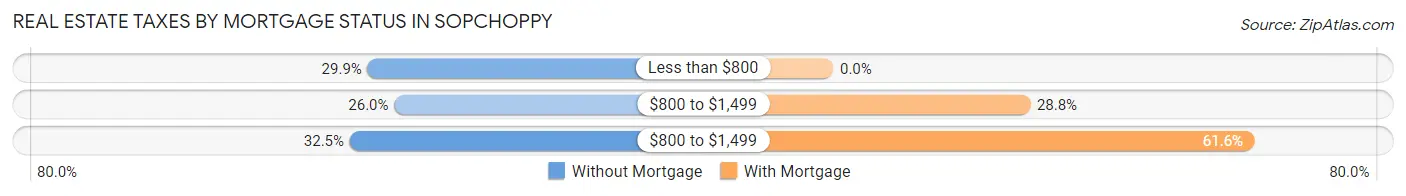
| Property Taxes | Without Mortgage | With Mortgage |
| Less than $800 | 23 (29.9%) | 0 (0.0%) |
| $800 to $1,499 | 20 (26.0%) | 21 (28.8%) |
| $800 to $1,499 | 25 (32.5%) | 45 (61.6%) |
| Total | 77 (100.0%) | 73 (100.0%) |
Health & Disability in Sopchoppy
Health Insurance Coverage by Age in Sopchoppy
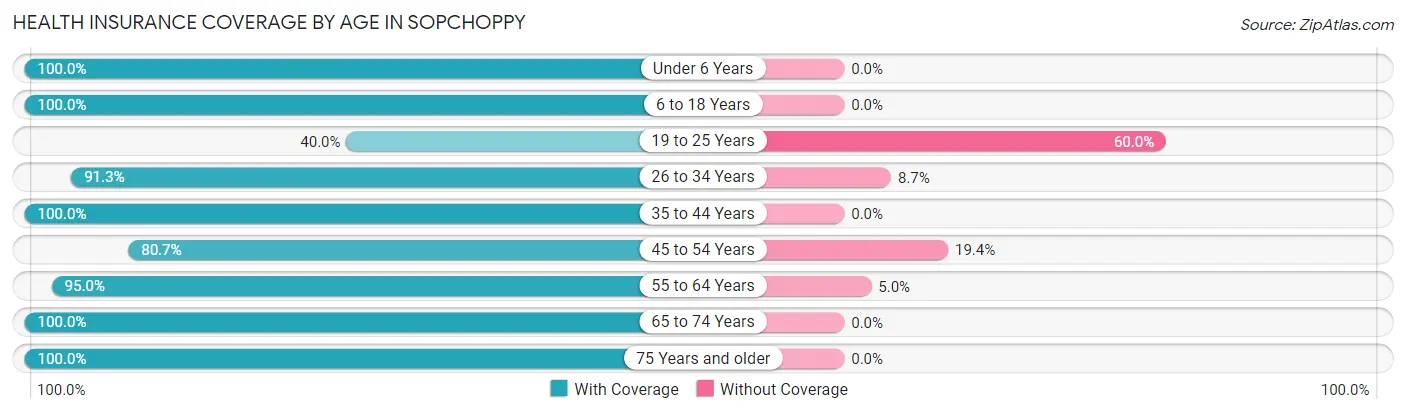
| Age Bracket | With Coverage | Without Coverage |
| Under 6 Years | 38 (100.0%) | 0 (0.0%) |
| 6 to 18 Years | 40 (100.0%) | 0 (0.0%) |
| 19 to 25 Years | 12 (40.0%) | 18 (60.0%) |
| 26 to 34 Years | 42 (91.3%) | 4 (8.7%) |
| 35 to 44 Years | 40 (100.0%) | 0 (0.0%) |
| 45 to 54 Years | 25 (80.6%) | 6 (19.4%) |
| 55 to 64 Years | 132 (95.0%) | 7 (5.0%) |
| 65 to 74 Years | 38 (100.0%) | 0 (0.0%) |
| 75 Years and older | 24 (100.0%) | 0 (0.0%) |
| Total | 391 (91.8%) | 35 (8.2%) |
Health Insurance Coverage by Citizenship Status in Sopchoppy
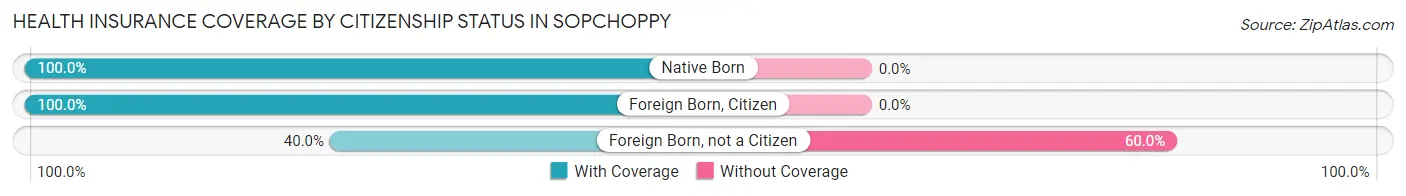
| Citizenship Status | With Coverage | Without Coverage |
| Native Born | 38 (100.0%) | 0 (0.0%) |
| Foreign Born, Citizen | 40 (100.0%) | 0 (0.0%) |
| Foreign Born, not a Citizen | 12 (40.0%) | 18 (60.0%) |
Health Insurance Coverage by Household Income in Sopchoppy
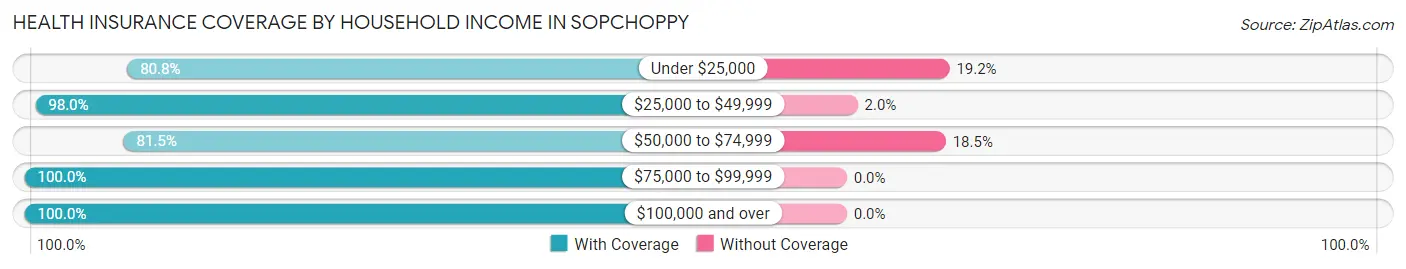
| Household Income | With Coverage | Without Coverage |
| Under $25,000 | 21 (80.8%) | 5 (19.2%) |
| $25,000 to $49,999 | 97 (98.0%) | 2 (2.0%) |
| $50,000 to $74,999 | 123 (81.5%) | 28 (18.5%) |
| $75,000 to $99,999 | 55 (100.0%) | 0 (0.0%) |
| $100,000 and over | 95 (100.0%) | 0 (0.0%) |
Public vs Private Health Insurance Coverage by Age in Sopchoppy
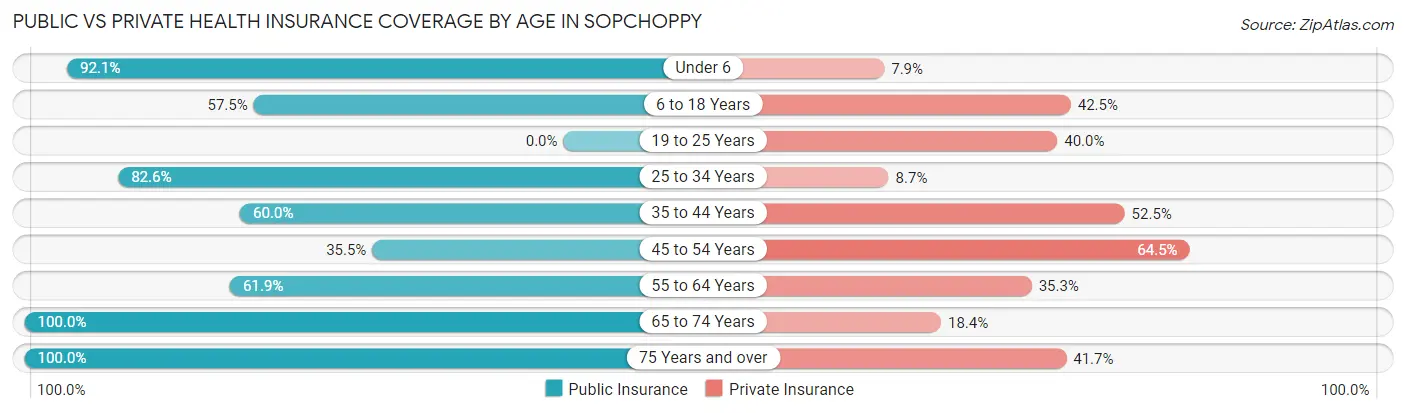
| Age Bracket | Public Insurance | Private Insurance |
| Under 6 | 35 (92.1%) | 3 (7.9%) |
| 6 to 18 Years | 23 (57.5%) | 17 (42.5%) |
| 19 to 25 Years | 0 (0.0%) | 12 (40.0%) |
| 25 to 34 Years | 38 (82.6%) | 4 (8.7%) |
| 35 to 44 Years | 24 (60.0%) | 21 (52.5%) |
| 45 to 54 Years | 11 (35.5%) | 20 (64.5%) |
| 55 to 64 Years | 86 (61.9%) | 49 (35.2%) |
| 65 to 74 Years | 38 (100.0%) | 7 (18.4%) |
| 75 Years and over | 24 (100.0%) | 10 (41.7%) |
| Total | 279 (65.5%) | 143 (33.6%) |
Disability Status by Sex by Age in Sopchoppy
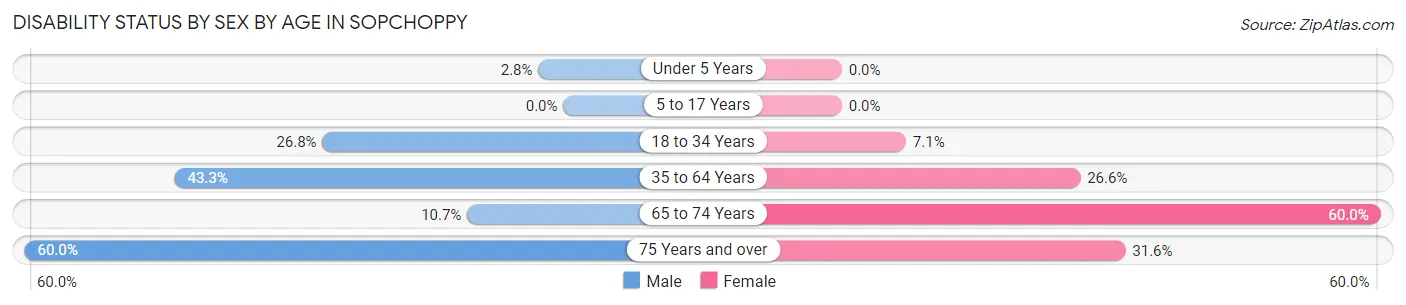
| Age Bracket | Male | Female |
| Under 5 Years | 1 (2.8%) | 0 (0.0%) |
| 5 to 17 Years | 0 (0.0%) | 0 (0.0%) |
| 18 to 34 Years | 11 (26.8%) | 3 (7.1%) |
| 35 to 64 Years | 42 (43.3%) | 30 (26.6%) |
| 65 to 74 Years | 3 (10.7%) | 6 (60.0%) |
| 75 Years and over | 3 (60.0%) | 6 (31.6%) |
Disability Class by Sex by Age in Sopchoppy
Disability Class: Hearing Difficulty
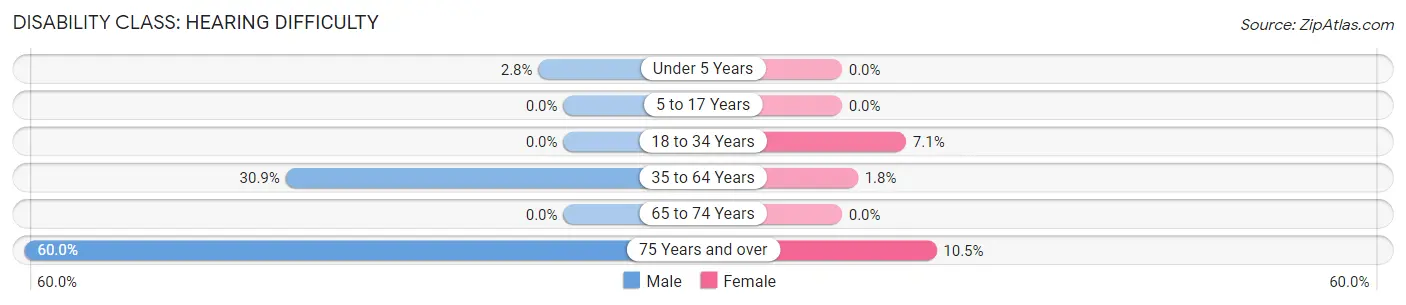
| Age Bracket | Male | Female |
| Under 5 Years | 1 (2.8%) | 0 (0.0%) |
| 5 to 17 Years | 0 (0.0%) | 0 (0.0%) |
| 18 to 34 Years | 0 (0.0%) | 3 (7.1%) |
| 35 to 64 Years | 30 (30.9%) | 2 (1.8%) |
| 65 to 74 Years | 0 (0.0%) | 0 (0.0%) |
| 75 Years and over | 3 (60.0%) | 2 (10.5%) |
Disability Class: Vision Difficulty
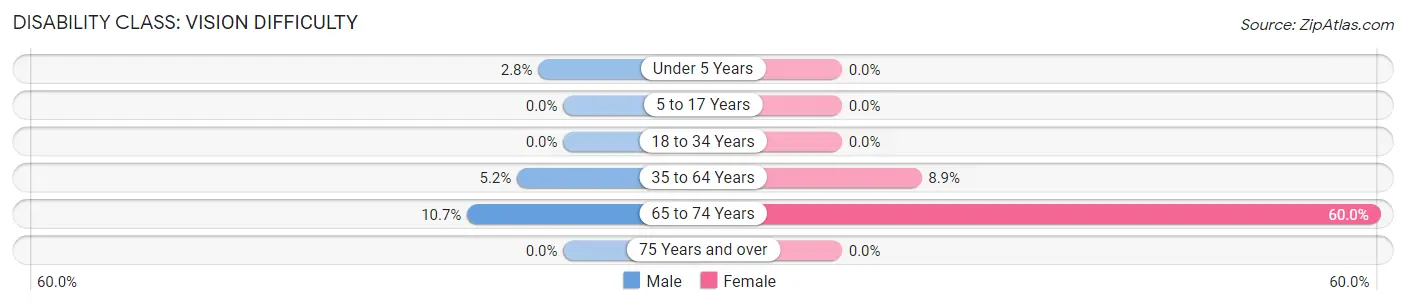
| Age Bracket | Male | Female |
| Under 5 Years | 1 (2.8%) | 0 (0.0%) |
| 5 to 17 Years | 0 (0.0%) | 0 (0.0%) |
| 18 to 34 Years | 0 (0.0%) | 0 (0.0%) |
| 35 to 64 Years | 5 (5.1%) | 10 (8.8%) |
| 65 to 74 Years | 3 (10.7%) | 6 (60.0%) |
| 75 Years and over | 0 (0.0%) | 0 (0.0%) |
Disability Class: Cognitive Difficulty
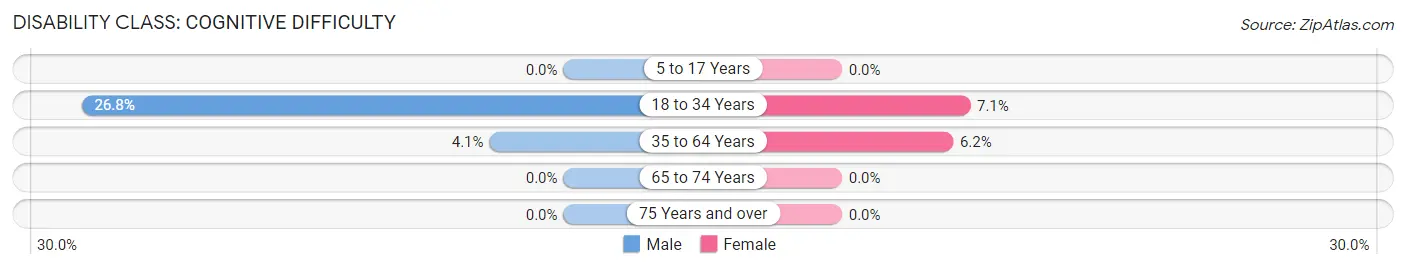
| Age Bracket | Male | Female |
| 5 to 17 Years | 0 (0.0%) | 0 (0.0%) |
| 18 to 34 Years | 11 (26.8%) | 3 (7.1%) |
| 35 to 64 Years | 4 (4.1%) | 7 (6.2%) |
| 65 to 74 Years | 0 (0.0%) | 0 (0.0%) |
| 75 Years and over | 0 (0.0%) | 0 (0.0%) |
Disability Class: Ambulatory Difficulty
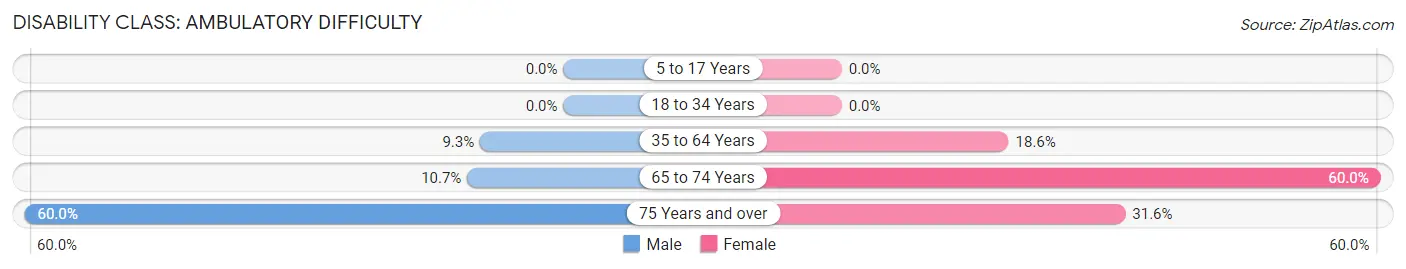
| Age Bracket | Male | Female |
| 5 to 17 Years | 0 (0.0%) | 0 (0.0%) |
| 18 to 34 Years | 0 (0.0%) | 0 (0.0%) |
| 35 to 64 Years | 9 (9.3%) | 21 (18.6%) |
| 65 to 74 Years | 3 (10.7%) | 6 (60.0%) |
| 75 Years and over | 3 (60.0%) | 6 (31.6%) |
Disability Class: Self-Care Difficulty
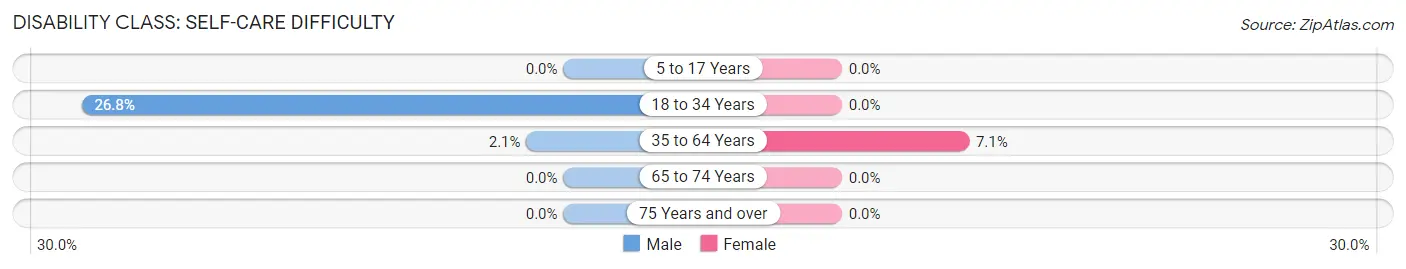
| Age Bracket | Male | Female |
| 5 to 17 Years | 0 (0.0%) | 0 (0.0%) |
| 18 to 34 Years | 11 (26.8%) | 0 (0.0%) |
| 35 to 64 Years | 2 (2.1%) | 8 (7.1%) |
| 65 to 74 Years | 0 (0.0%) | 0 (0.0%) |
| 75 Years and over | 0 (0.0%) | 0 (0.0%) |
Technology Access in Sopchoppy
Computing Device Access in Sopchoppy
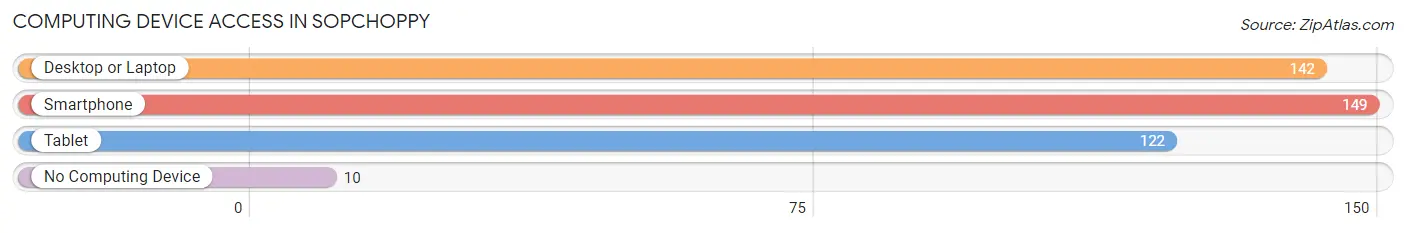
| Device Type | # Households | % Households |
| Desktop or Laptop | 142 | 80.2% |
| Smartphone | 149 | 84.2% |
| Tablet | 122 | 68.9% |
| No Computing Device | 10 | 5.7% |
| Total | 177 | 100.0% |
Internet Access in Sopchoppy
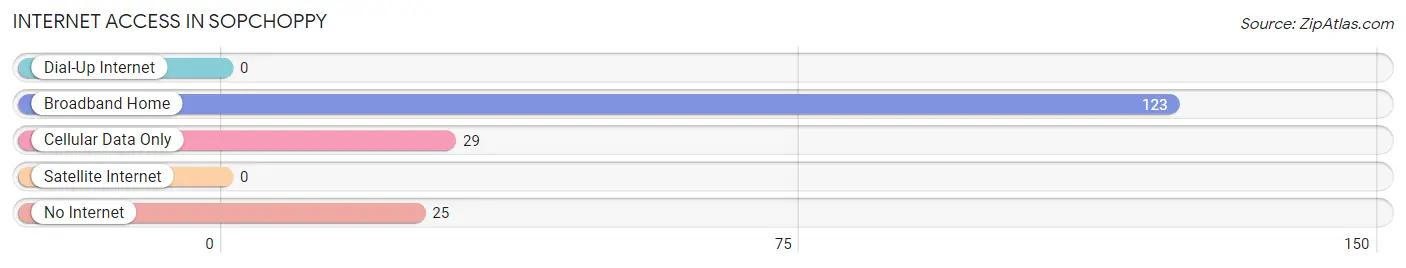
| Internet Type | # Households | % Households |
| Dial-Up Internet | 0 | 0.0% |
| Broadband Home | 123 | 69.5% |
| Cellular Data Only | 29 | 16.4% |
| Satellite Internet | 0 | 0.0% |
| No Internet | 25 | 14.1% |
| Total | 177 | 100.0% |
Sopchoppy Summary
Sopchoppy is a small town located in Wakulla County, Florida, United States. It is situated on the banks of the Sopchoppy River, about 20 miles south of Tallahassee. The population was 890 at the 2010 census.
History
The area around Sopchoppy was first inhabited by Native Americans, including the Apalachee and Creek tribes. The first European settlers arrived in the area in the early 19th century, and the town was officially founded in 1841. The town was named after the nearby Sopchoppy River, which was named after the Creek word for “river of turtles.”
In the late 19th century, Sopchoppy was a thriving lumber town, with several sawmills and a turpentine distillery. The town also had a hotel, a post office, and a general store. The town’s economy was largely based on the timber industry, and the town’s population peaked at around 1,000 in the early 1900s.
In the early 20th century, the timber industry began to decline, and the town’s population began to decline as well. By the 1950s, the population had dropped to around 500. The town’s economy shifted to agriculture, and the population has remained relatively stable since then.
Geography
Sopchoppy is located at 30°14′N 84°25′W (30.23, -84.41). According to the United States Census Bureau, the town has a total area of 1.2 square miles (3.1 km2), all land.
The town is located on the banks of the Sopchoppy River, which flows through the town and is a popular spot for fishing and boating. The town is also located near the Ochlockonee River, which is a popular spot for canoeing and kayaking.
Economy
The economy of Sopchoppy is largely based on agriculture and tourism. The town is home to several farms, which produce a variety of crops, including corn, soybeans, and cotton. The town is also home to several restaurants, bed and breakfasts, and other tourist attractions.
Demographics
As of the 2010 census, there were 890 people, 393 households, and 246 families residing in the town. The population density was 741.7 people per square mile (286.3/km2). There were 463 housing units at an average density of 387.5 per square mile (149.6/km2). The racial makeup of the town was 94.3% White, 2.2% African American, 0.3% Native American, 0.3% Asian, 0.1% Pacific Islander, 1.3% from other races, and 1.5% from two or more races. Hispanic or Latino of any race were 3.7% of the population.
There were 393 households, out of which 24.3% had children under the age of 18 living with them, 48.1% were married couples living together, 11.7% had a female householder with no husband present, and 35.7% were non-families. 30.3% of all households were made up of individuals, and 14.2% had someone living alone who was 65 years of age or older. The average household size was 2.27 and the average family size was 2.79.
In the town, the population was spread out, with 20.9% under the age of 18, 8.2% from 18 to 24, 24.2% from 25 to 44, 28.2% from 45 to 64, and 18.5% who were 65 years of age or older. The median age was 42 years. For every 100 females, there were 94.2 males. For every 100 females age 18 and over, there were 91.2 males.
The median income for a household in the town was $30,000, and the median income for a family was $35,000. Males had a median income of $27,500 versus $20,000 for females. The per capita income for the town was $15,000. About 11.7% of families and 15.2% of the population were below the poverty line, including 22.2% of those under age 18 and 10.3% of those age 65 or over.
Common Questions
What is Per Capita Income in Sopchoppy?
Per Capita income in Sopchoppy is $29,378.
What is the Median Family Income in Sopchoppy?
Median Family Income in Sopchoppy is $71,683.
What is the Median Household income in Sopchoppy?
Median Household Income in Sopchoppy is $67,031.
What is Income or Wage Gap in Sopchoppy?
Income or Wage Gap in Sopchoppy is 28.8%.
Women in Sopchoppy earn 71.2 cents for every dollar earned by a man.
What is Inequality or Gini Index in Sopchoppy?
Inequality or Gini Index in Sopchoppy is 0.33.
What is the Total Population of Sopchoppy?
Total Population of Sopchoppy is 426.
What is the Total Male Population of Sopchoppy?
Total Male Population of Sopchoppy is 224.
What is the Total Female Population of Sopchoppy?
Total Female Population of Sopchoppy is 202.
What is the Ratio of Males per 100 Females in Sopchoppy?
There are 110.89 Males per 100 Females in Sopchoppy.
What is the Ratio of Females per 100 Males in Sopchoppy?
There are 90.18 Females per 100 Males in Sopchoppy.
What is the Median Population Age in Sopchoppy?
Median Population Age in Sopchoppy is 50.8 Years.
What is the Average Family Size in Sopchoppy
Average Family Size in Sopchoppy is 3.1 People.
What is the Average Household Size in Sopchoppy
Average Household Size in Sopchoppy is 2.4 People.
How Large is the Labor Force in Sopchoppy?
There are 174 People in the Labor Forcein in Sopchoppy.
What is the Percentage of People in the Labor Force in Sopchoppy?
47.7% of People are in the Labor Force in Sopchoppy.
What is the Unemployment Rate in Sopchoppy?
Unemployment Rate in Sopchoppy is 2.9%.