Tariffville, CT Map & Demographics
Tariffville Map
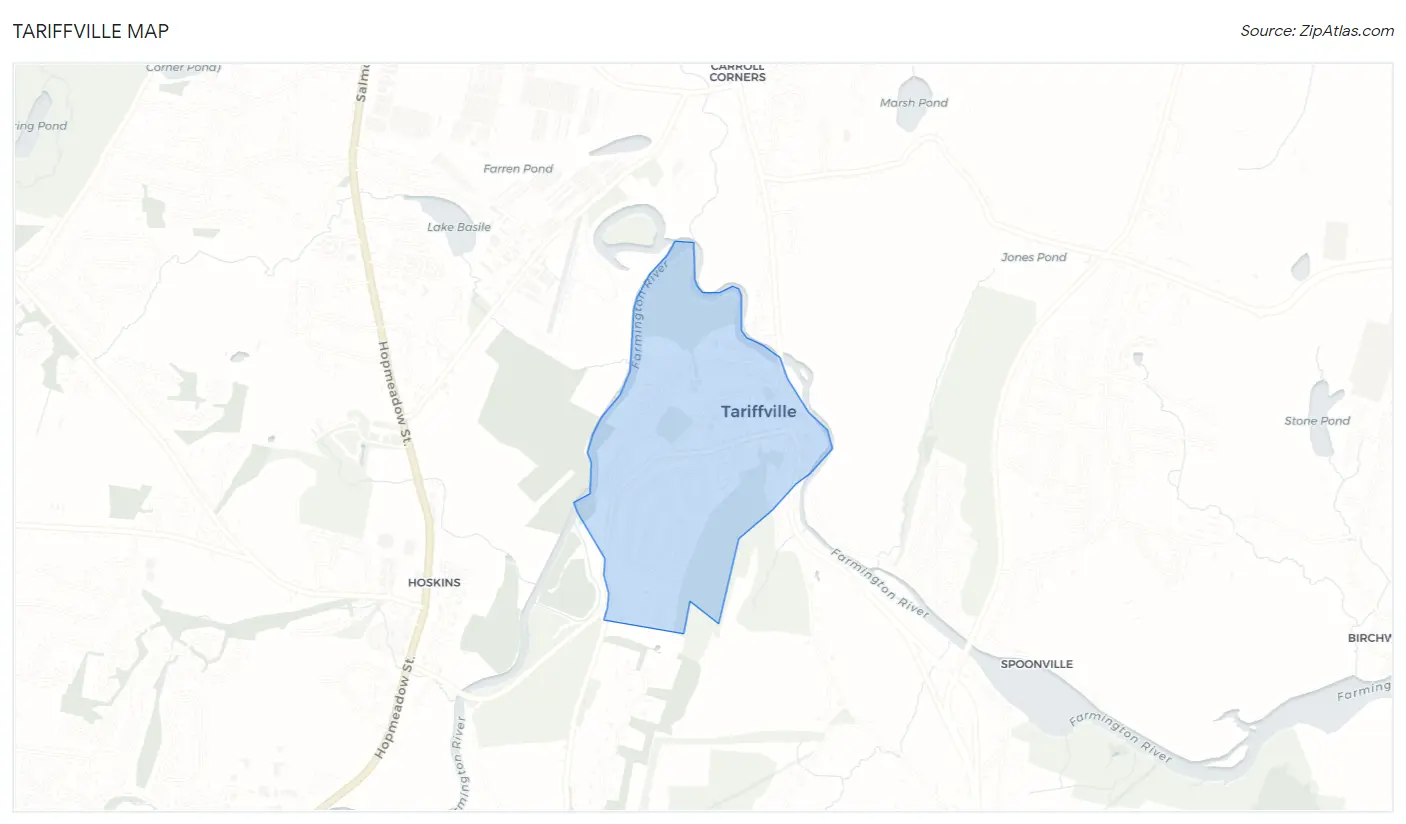
Tariffville Overview
$37,875
PER CAPITA INCOME
$101,250
AVG FAMILY INCOME
$83,607
AVG HOUSEHOLD INCOME
19.5%
WAGE / INCOME GAP [ % ]
80.5¢/ $1
WAGE / INCOME GAP [ $ ]
0.36
INEQUALITY / GINI INDEX
1,803
TOTAL POPULATION
925
MALE POPULATION
878
FEMALE POPULATION
105.35
MALES / 100 FEMALES
94.92
FEMALES / 100 MALES
37.9
MEDIAN AGE
3.2
AVG FAMILY SIZE
2.8
AVG HOUSEHOLD SIZE
1,271
LABOR FORCE [ PEOPLE ]
83.1%
PERCENT IN LABOR FORCE
14.7%
UNEMPLOYMENT RATE
Tariffville Zip Codes
Tariffville Area Codes
Income in Tariffville
Income Overview in Tariffville
Per Capita Income in Tariffville is $37,875, while median incomes of families and households are $101,250 and $83,607 respectively.
| Characteristic | Number | Measure |
| Per Capita Income | 1,803 | $37,875 |
| Median Family Income | 406 | $101,250 |
| Mean Family Income | 406 | $117,766 |
| Median Household Income | 641 | $83,607 |
| Mean Household Income | 641 | $102,435 |
| Income Deficit | 406 | $0 |
| Wage / Income Gap (%) | 1,803 | 19.52% |
| Wage / Income Gap ($) | 1,803 | 80.48¢ per $1 |
| Gini / Inequality Index | 1,803 | 0.36 |
Earnings by Sex in Tariffville
Average Earnings in Tariffville are $42,886, $44,136 for men and $35,521 for women, a difference of 19.5%.
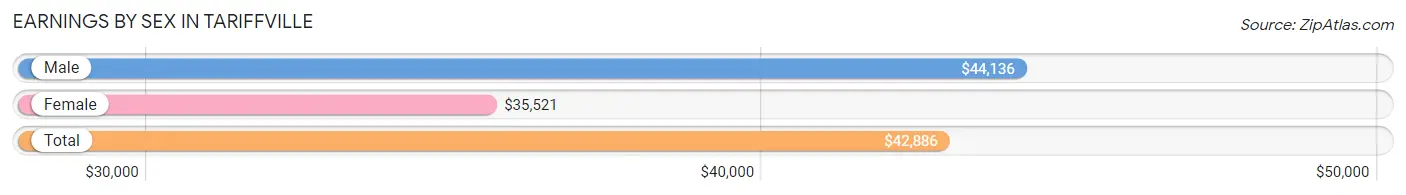
| Sex | Number | Average Earnings |
| Male | 594 (49.0%) | $44,136 |
| Female | 618 (51.0%) | $35,521 |
| Total | 1,212 (100.0%) | $42,886 |
Earnings by Sex by Income Bracket in Tariffville
The most common earnings brackets in Tariffville are $40,000 to $44,999 for men (160 | 26.9%) and $55,000 to $64,999 for women (89 | 14.4%).
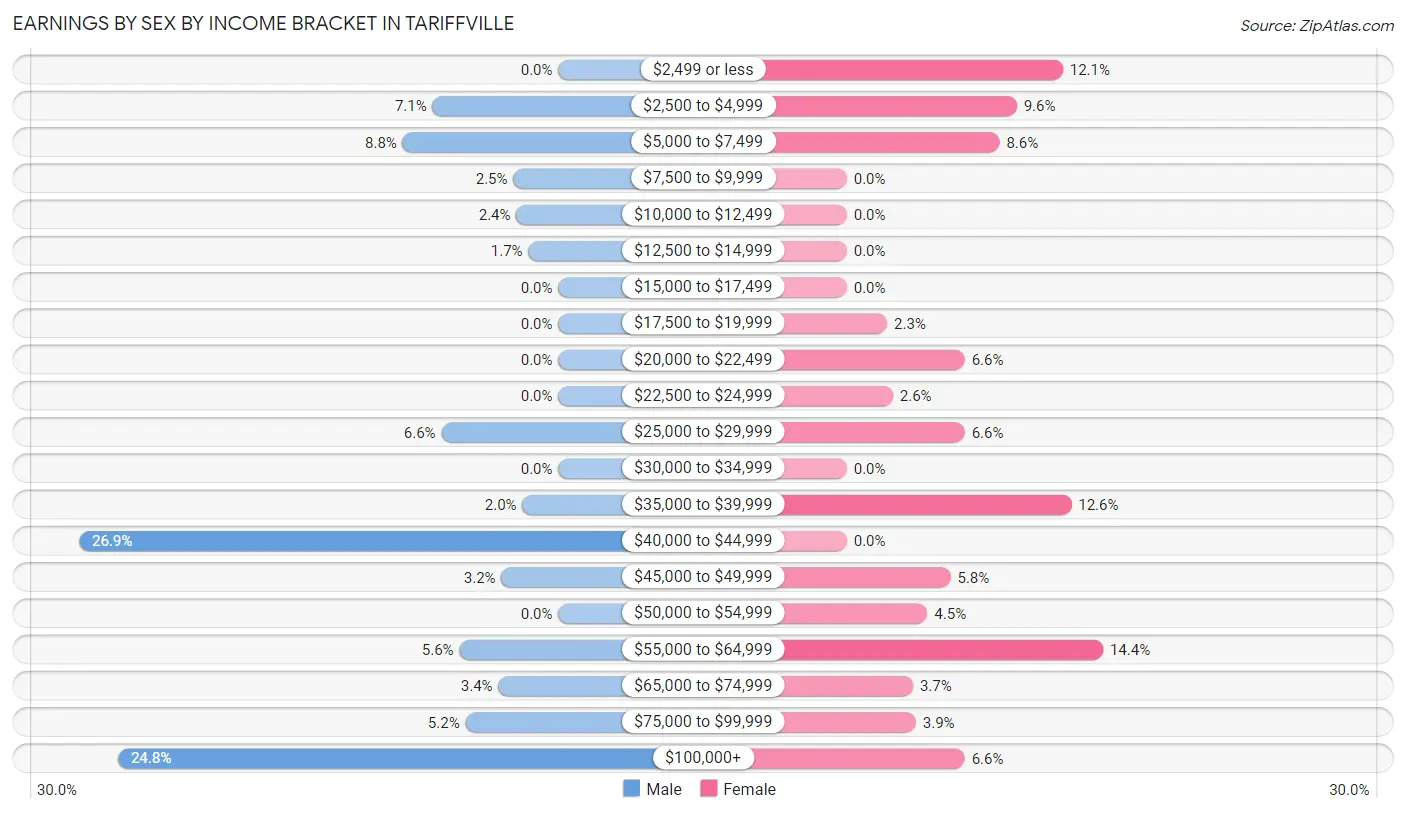
| Income | Male | Female |
| $2,499 or less | 0 (0.0%) | 75 (12.1%) |
| $2,500 to $4,999 | 42 (7.1%) | 59 (9.6%) |
| $5,000 to $7,499 | 52 (8.7%) | 53 (8.6%) |
| $7,500 to $9,999 | 15 (2.5%) | 0 (0.0%) |
| $10,000 to $12,499 | 14 (2.4%) | 0 (0.0%) |
| $12,500 to $14,999 | 10 (1.7%) | 0 (0.0%) |
| $15,000 to $17,499 | 0 (0.0%) | 0 (0.0%) |
| $17,500 to $19,999 | 0 (0.0%) | 14 (2.3%) |
| $20,000 to $22,499 | 0 (0.0%) | 41 (6.6%) |
| $22,500 to $24,999 | 0 (0.0%) | 16 (2.6%) |
| $25,000 to $29,999 | 39 (6.6%) | 41 (6.6%) |
| $30,000 to $34,999 | 0 (0.0%) | 0 (0.0%) |
| $35,000 to $39,999 | 12 (2.0%) | 78 (12.6%) |
| $40,000 to $44,999 | 160 (26.9%) | 0 (0.0%) |
| $45,000 to $49,999 | 19 (3.2%) | 36 (5.8%) |
| $50,000 to $54,999 | 0 (0.0%) | 28 (4.5%) |
| $55,000 to $64,999 | 33 (5.6%) | 89 (14.4%) |
| $65,000 to $74,999 | 20 (3.4%) | 23 (3.7%) |
| $75,000 to $99,999 | 31 (5.2%) | 24 (3.9%) |
| $100,000+ | 147 (24.7%) | 41 (6.6%) |
| Total | 594 (100.0%) | 618 (100.0%) |
Earnings by Sex by Educational Attainment in Tariffville
Average earnings in Tariffville are $44,752 for men and $39,792 for women, a difference of 11.1%. Men with an educational attainment of graduate degree enjoy the highest average annual earnings of $129,179, while those with high school diploma education earn the least with $43,750. Women with an educational attainment of college or associate's degree earn the most with the average annual earnings of $58,219, while those with high school diploma education have the smallest earnings of $36,033.
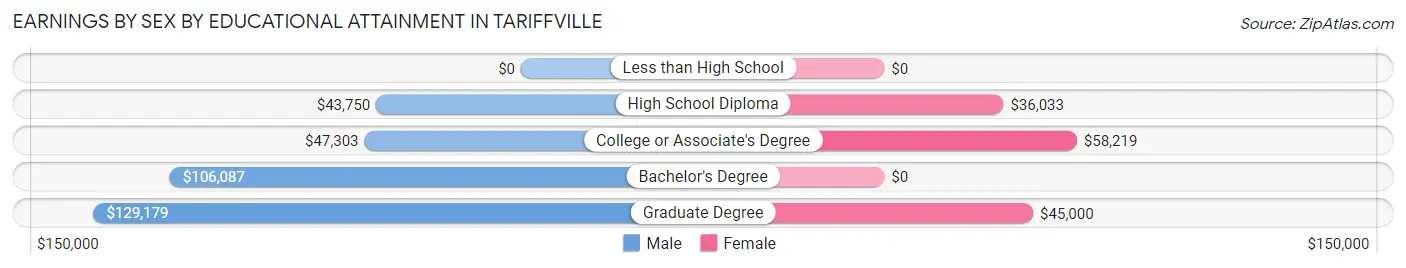
| Educational Attainment | Male Income | Female Income |
| Less than High School | - | - |
| High School Diploma | $43,750 | $36,033 |
| College or Associate's Degree | $47,303 | $58,219 |
| Bachelor's Degree | $106,087 | $0 |
| Graduate Degree | $129,179 | $45,000 |
| Total | $44,752 | $39,792 |
Family Income in Tariffville
Family Income Brackets in Tariffville
According to the Tariffville family income data, there are 96 families falling into the $75,000 to $99,999 income range, which is the most common income bracket and makes up 23.6% of all families.
| Income Bracket | # Families | % Families |
| Less than $10,000 | 0 | 0.0% |
| $10,000 to $14,999 | 0 | 0.0% |
| $15,000 to $24,999 | 12 | 3.0% |
| $25,000 to $34,999 | 47 | 11.6% |
| $35,000 to $49,999 | 11 | 2.7% |
| $50,000 to $74,999 | 34 | 8.4% |
| $75,000 to $99,999 | 96 | 23.6% |
| $100,000 to $149,999 | 95 | 23.4% |
| $150,000 to $199,999 | 43 | 10.6% |
| $200,000+ | 68 | 16.7% |
Family Income by Famaliy Size in Tariffville
4-person families (118 | 29.1%) account for the highest median family income in Tariffville with $226,184 per family, while 4-person families (118 | 29.1%) have the highest median income of $56,546 per family member.
| Income Bracket | # Families | Median Income |
| 2-Person Families | 161 (39.7%) | $62,188 |
| 3-Person Families | 110 (27.1%) | $0 |
| 4-Person Families | 118 (29.1%) | $226,184 |
| 5-Person Families | 17 (4.2%) | $0 |
| 6-Person Families | 0 (0.0%) | $0 |
| 7+ Person Families | 0 (0.0%) | $0 |
| Total | 406 (100.0%) | $101,250 |
Family Income by Number of Earners in Tariffville
| Number of Earners | # Families | Median Income |
| No Earners | 24 (5.9%) | $0 |
| 1 Earner | 137 (33.7%) | $0 |
| 2 Earners | 106 (26.1%) | $108,750 |
| 3+ Earners | 139 (34.2%) | $0 |
| Total | 406 (100.0%) | $101,250 |
Household Income in Tariffville
Household Income Brackets in Tariffville
With 143 households falling in the category, the $100,000 to $149,999 income range is the most frequent in Tariffville, accounting for 22.3% of all households.
| Income Bracket | # Households | % Households |
| Less than $10,000 | 30 | 4.7% |
| $10,000 to $14,999 | 0 | 0.0% |
| $15,000 to $24,999 | 12 | 1.9% |
| $25,000 to $34,999 | 70 | 10.9% |
| $35,000 to $49,999 | 61 | 9.5% |
| $50,000 to $74,999 | 53 | 8.3% |
| $75,000 to $99,999 | 132 | 20.6% |
| $100,000 to $149,999 | 143 | 22.3% |
| $150,000 to $199,999 | 72 | 11.2% |
| $200,000+ | 68 | 10.6% |
Household Income by Householder Age in Tariffville
The median household income in Tariffville is $83,607, with the highest median household income of $118,854 found in the 45 to 64 years age bracket for the primary householder. A total of 281 households (43.8%) fall into this category.
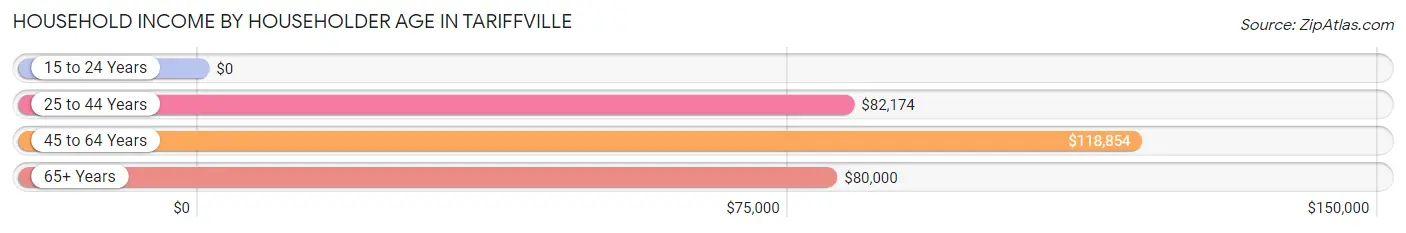
| Income Bracket | # Households | Median Income |
| 15 to 24 Years | 0 (0.0%) | $0 |
| 25 to 44 Years | 274 (42.7%) | $82,174 |
| 45 to 64 Years | 281 (43.8%) | $118,854 |
| 65+ Years | 86 (13.4%) | $80,000 |
| Total | 641 (100.0%) | $83,607 |
Poverty in Tariffville
Income Below Poverty by Sex and Age in Tariffville
With 20.4% poverty level for males and 3.5% for females among the residents of Tariffville, 45 to 54 year old males and 25 to 34 year old females are the most vulnerable to poverty, with 145 males (52.0%) and 30 females (17.1%) in their respective age groups living below the poverty level.
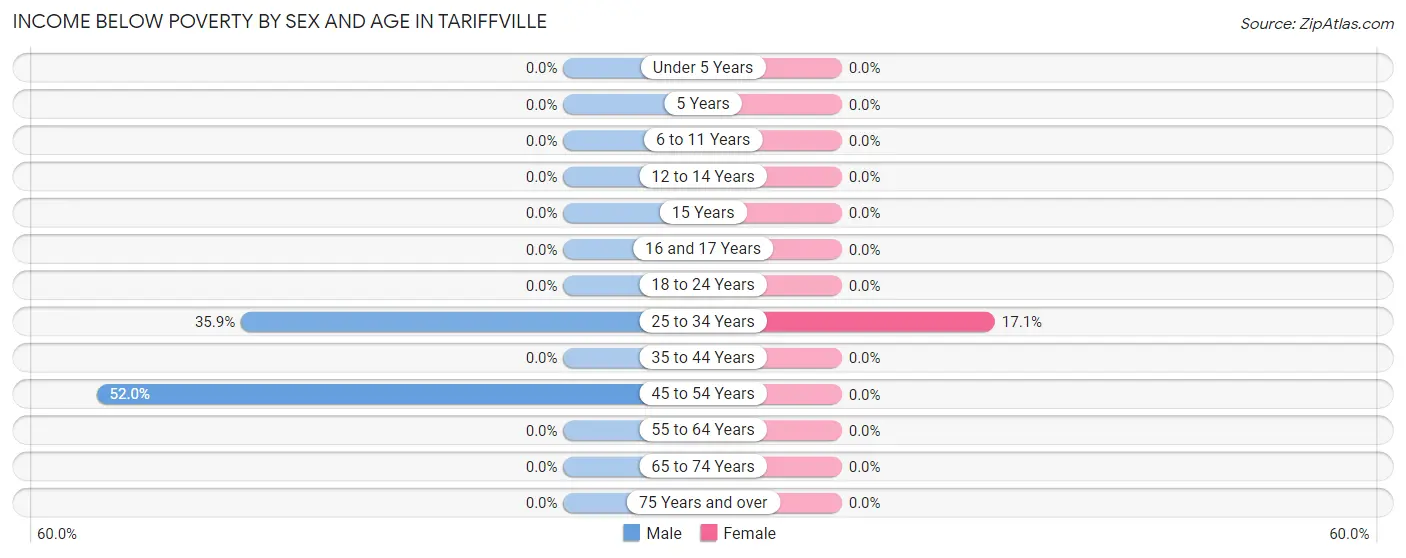
| Age Bracket | Male | Female |
| Under 5 Years | 0 (0.0%) | 0 (0.0%) |
| 5 Years | 0 (0.0%) | 0 (0.0%) |
| 6 to 11 Years | 0 (0.0%) | 0 (0.0%) |
| 12 to 14 Years | 0 (0.0%) | 0 (0.0%) |
| 15 Years | 0 (0.0%) | 0 (0.0%) |
| 16 and 17 Years | 0 (0.0%) | 0 (0.0%) |
| 18 to 24 Years | 0 (0.0%) | 0 (0.0%) |
| 25 to 34 Years | 42 (35.9%) | 30 (17.1%) |
| 35 to 44 Years | 0 (0.0%) | 0 (0.0%) |
| 45 to 54 Years | 145 (52.0%) | 0 (0.0%) |
| 55 to 64 Years | 0 (0.0%) | 0 (0.0%) |
| 65 to 74 Years | 0 (0.0%) | 0 (0.0%) |
| 75 Years and over | 0 (0.0%) | 0 (0.0%) |
| Total | 187 (20.4%) | 30 (3.5%) |
Income Above Poverty by Sex and Age in Tariffville
According to the poverty statistics in Tariffville, males aged under 5 years and females aged under 5 years are the age groups that are most secure financially, with 100.0% of males and 100.0% of females in these age groups living above the poverty line.
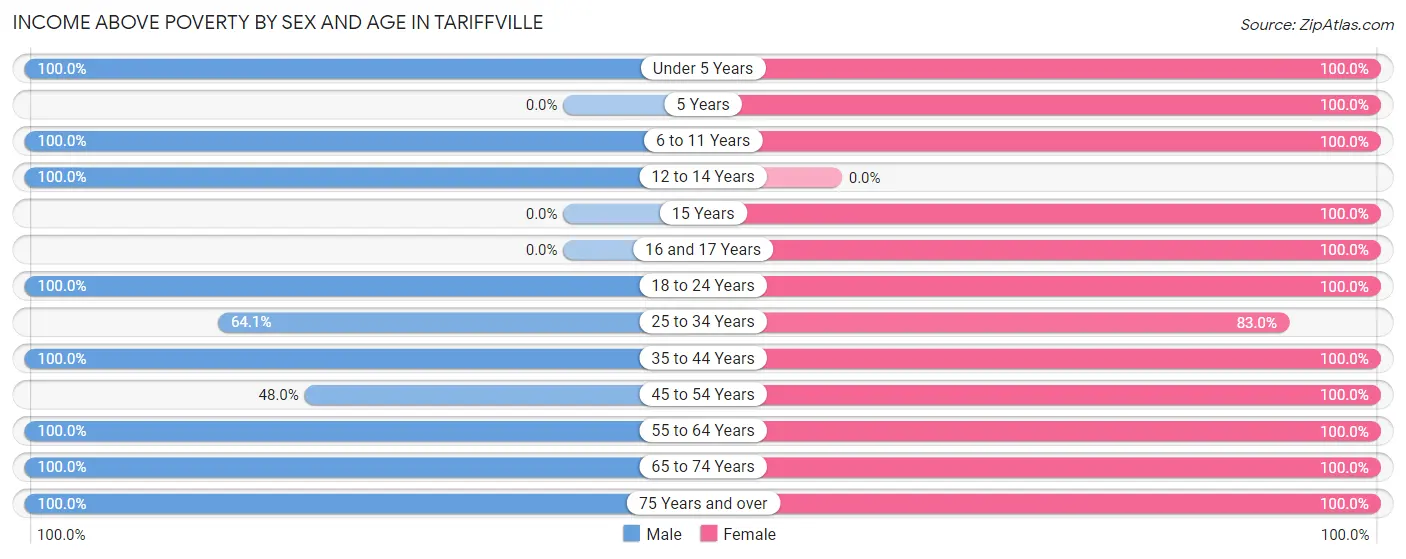
| Age Bracket | Male | Female |
| Under 5 Years | 7 (100.0%) | 18 (100.0%) |
| 5 Years | 0 (0.0%) | 11 (100.0%) |
| 6 to 11 Years | 101 (100.0%) | 71 (100.0%) |
| 12 to 14 Years | 15 (100.0%) | 0 (0.0%) |
| 15 Years | 0 (0.0%) | 28 (100.0%) |
| 16 and 17 Years | 0 (0.0%) | 52 (100.0%) |
| 18 to 24 Years | 67 (100.0%) | 79 (100.0%) |
| 25 to 34 Years | 75 (64.1%) | 146 (83.0%) |
| 35 to 44 Years | 160 (100.0%) | 143 (100.0%) |
| 45 to 54 Years | 134 (48.0%) | 125 (100.0%) |
| 55 to 64 Years | 108 (100.0%) | 103 (100.0%) |
| 65 to 74 Years | 49 (100.0%) | 48 (100.0%) |
| 75 Years and over | 12 (100.0%) | 12 (100.0%) |
| Total | 728 (79.6%) | 836 (96.5%) |
Income Below Poverty Among Married-Couple Families in Tariffville
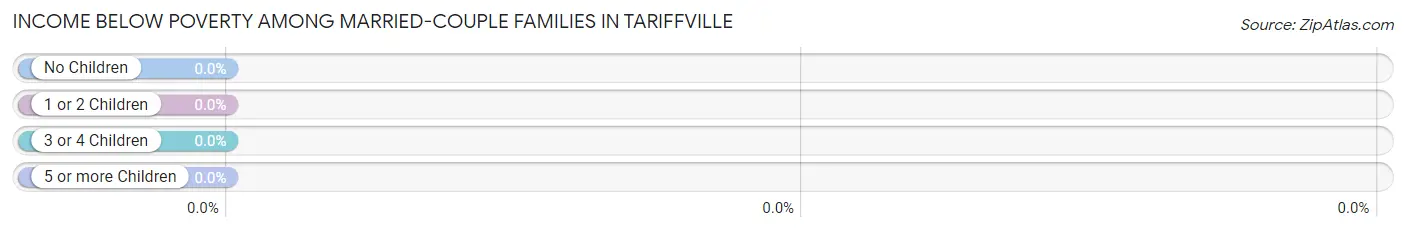
| Children | Above Poverty | Below Poverty |
| No Children | 128 (100.0%) | 0 (0.0%) |
| 1 or 2 Children | 133 (100.0%) | 0 (0.0%) |
| 3 or 4 Children | 17 (100.0%) | 0 (0.0%) |
| 5 or more Children | 0 (0.0%) | 0 (0.0%) |
| Total | 278 (100.0%) | 0 (0.0%) |
Income Below Poverty Among Single-Parent Households in Tariffville
| Children | Single Father | Single Mother |
| No Children | 0 (0.0%) | 0 (0.0%) |
| 1 or 2 Children | 0 (0.0%) | 0 (0.0%) |
| 3 or 4 Children | 0 (0.0%) | 0 (0.0%) |
| 5 or more Children | 0 (0.0%) | 0 (0.0%) |
| Total | 0 (0.0%) | 0 (0.0%) |
Income Below Poverty Among Married-Couple vs Single-Parent Households in Tariffville
| Children | Married-Couple Families | Single-Parent Households |
| No Children | 0 (0.0%) | 0 (0.0%) |
| 1 or 2 Children | 0 (0.0%) | 0 (0.0%) |
| 3 or 4 Children | 0 (0.0%) | 0 (0.0%) |
| 5 or more Children | 0 (0.0%) | 0 (0.0%) |
| Total | 0 (0.0%) | 0 (0.0%) |
Race in Tariffville
The most populous races in Tariffville are White / Caucasian (1,564 | 86.7%), Asian (134 | 7.4%), and Hispanic or Latino (99 | 5.5%).
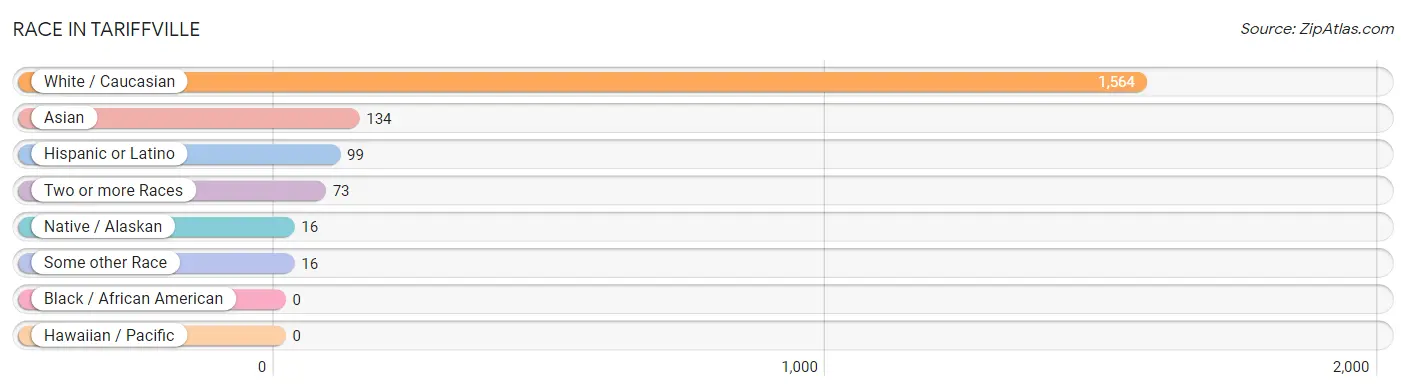
| Race | # Population | % Population |
| Asian | 134 | 7.4% |
| Black / African American | 0 | 0.0% |
| Hawaiian / Pacific | 0 | 0.0% |
| Hispanic or Latino | 99 | 5.5% |
| Native / Alaskan | 16 | 0.9% |
| White / Caucasian | 1,564 | 86.7% |
| Two or more Races | 73 | 4.1% |
| Some other Race | 16 | 0.9% |
| Total | 1,803 | 100.0% |
Ancestry in Tariffville
The most populous ancestries reported in Tariffville are Polish (282 | 15.6%), French (263 | 14.6%), Italian (230 | 12.8%), Irish (227 | 12.6%), and German (219 | 12.1%), together accounting for 67.7% of all Tariffville residents.
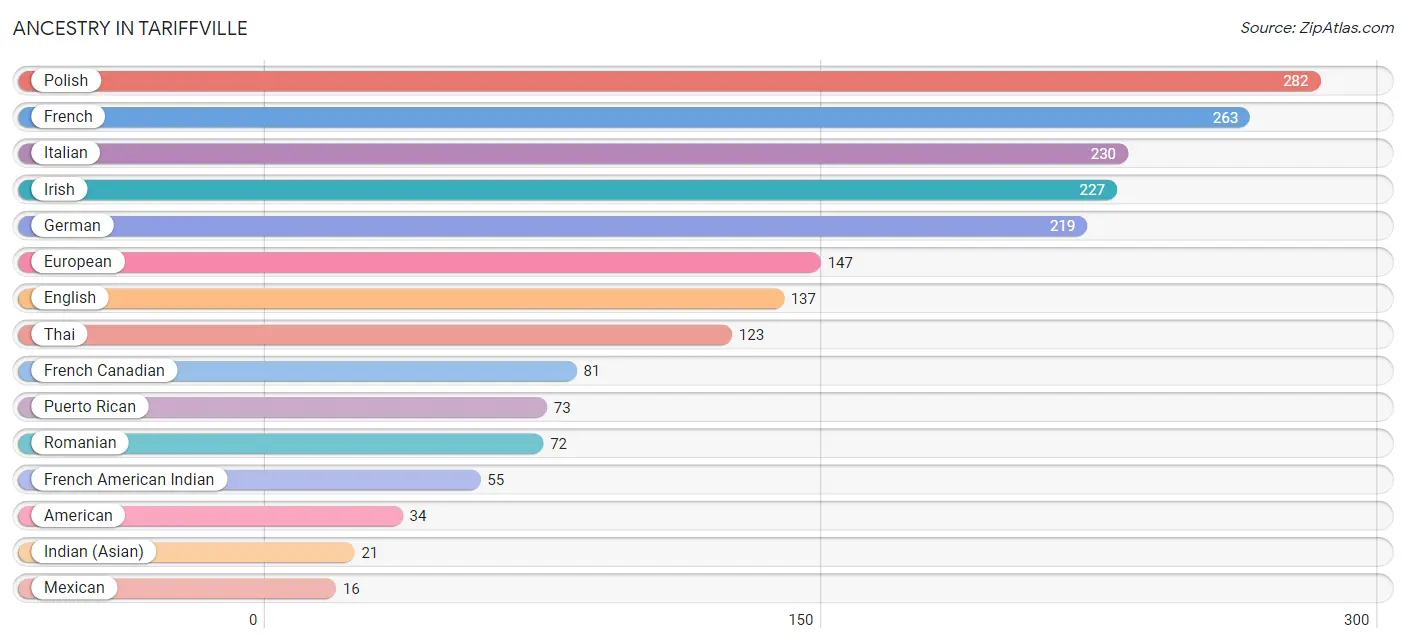
| Ancestry | # Population | % Population |
| American | 34 | 1.9% |
| British | 5 | 0.3% |
| Canadian | 7 | 0.4% |
| Croatian | 11 | 0.6% |
| Dutch | 4 | 0.2% |
| English | 137 | 7.6% |
| European | 147 | 8.2% |
| French | 263 | 14.6% |
| French American Indian | 55 | 3.0% |
| French Canadian | 81 | 4.5% |
| German | 219 | 12.1% |
| Indian (Asian) | 21 | 1.2% |
| Irish | 227 | 12.6% |
| Italian | 230 | 12.8% |
| Mexican | 16 | 0.9% |
| Polish | 282 | 15.6% |
| Puerto Rican | 73 | 4.1% |
| Romanian | 72 | 4.0% |
| Russian | 12 | 0.7% |
| Spaniard | 10 | 0.5% |
| Thai | 123 | 6.8% | View All 21 Rows |
Immigrants in Tariffville
The most numerous immigrant groups reported in Tariffville came from Asia (67 | 3.7%), India (67 | 3.7%), South Central Asia (67 | 3.7%), Europe (40 | 2.2%), and Northern Europe (23 | 1.3%), together accounting for 14.7% of all Tariffville residents.
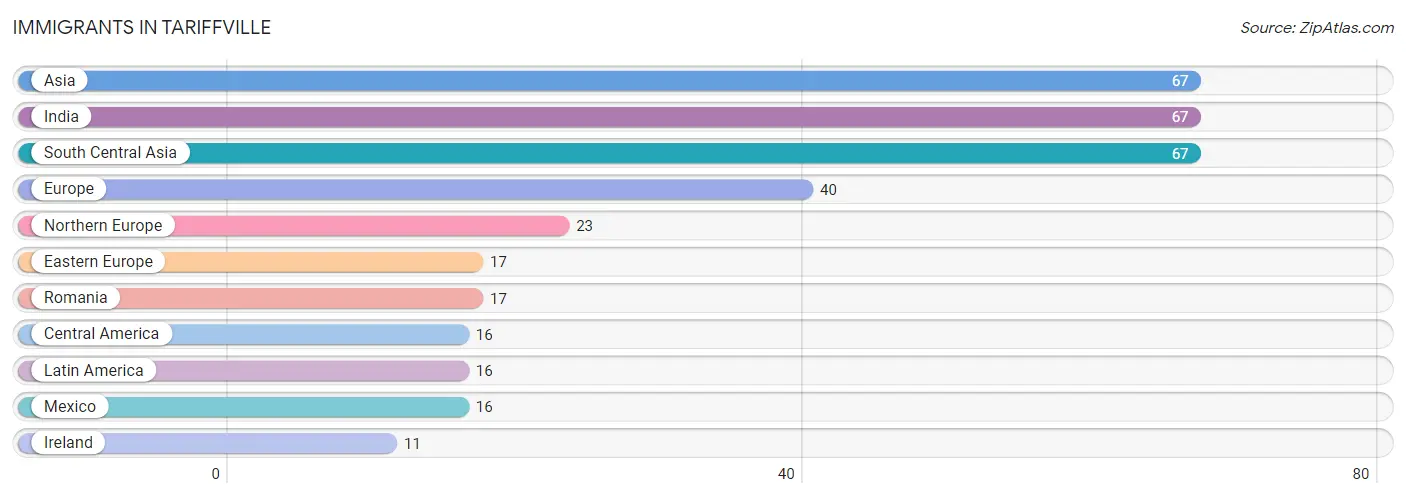
| Immigration Origin | # Population | % Population |
| Asia | 67 | 3.7% |
| Central America | 16 | 0.9% |
| Eastern Europe | 17 | 0.9% |
| Europe | 40 | 2.2% |
| India | 67 | 3.7% |
| Ireland | 11 | 0.6% |
| Latin America | 16 | 0.9% |
| Mexico | 16 | 0.9% |
| Northern Europe | 23 | 1.3% |
| Romania | 17 | 0.9% |
| South Central Asia | 67 | 3.7% | View All 11 Rows |
Sex and Age in Tariffville
Sex and Age in Tariffville
The most populous age groups in Tariffville are 50 to 54 Years (268 | 29.0%) for men and 25 to 29 Years (147 | 16.7%) for women.
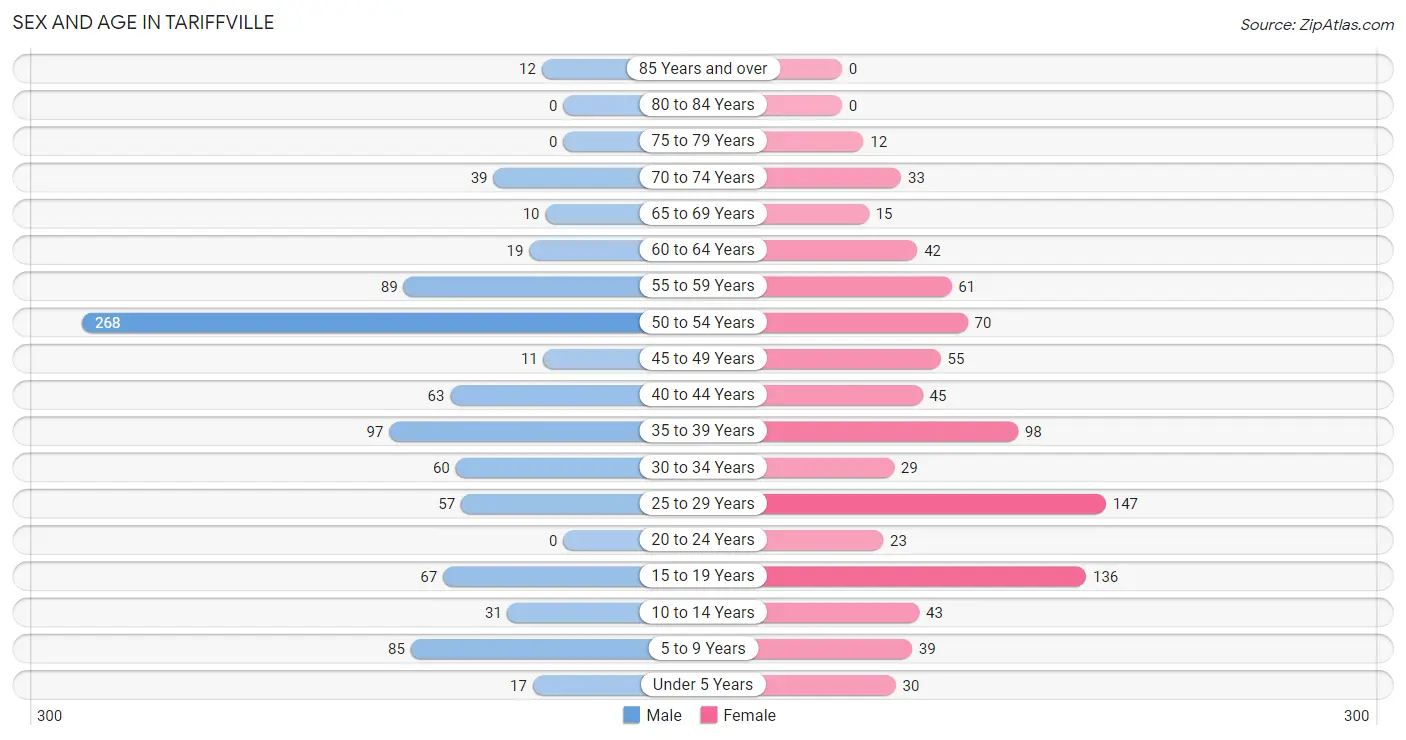
| Age Bracket | Male | Female |
| Under 5 Years | 17 (1.8%) | 30 (3.4%) |
| 5 to 9 Years | 85 (9.2%) | 39 (4.4%) |
| 10 to 14 Years | 31 (3.4%) | 43 (4.9%) |
| 15 to 19 Years | 67 (7.2%) | 136 (15.5%) |
| 20 to 24 Years | 0 (0.0%) | 23 (2.6%) |
| 25 to 29 Years | 57 (6.2%) | 147 (16.7%) |
| 30 to 34 Years | 60 (6.5%) | 29 (3.3%) |
| 35 to 39 Years | 97 (10.5%) | 98 (11.2%) |
| 40 to 44 Years | 63 (6.8%) | 45 (5.1%) |
| 45 to 49 Years | 11 (1.2%) | 55 (6.3%) |
| 50 to 54 Years | 268 (29.0%) | 70 (8.0%) |
| 55 to 59 Years | 89 (9.6%) | 61 (7.0%) |
| 60 to 64 Years | 19 (2.1%) | 42 (4.8%) |
| 65 to 69 Years | 10 (1.1%) | 15 (1.7%) |
| 70 to 74 Years | 39 (4.2%) | 33 (3.8%) |
| 75 to 79 Years | 0 (0.0%) | 12 (1.4%) |
| 80 to 84 Years | 0 (0.0%) | 0 (0.0%) |
| 85 Years and over | 12 (1.3%) | 0 (0.0%) |
| Total | 925 (100.0%) | 878 (100.0%) |
Families and Households in Tariffville
Median Family Size in Tariffville
The median family size in Tariffville is 3.23 persons per family, with married-couple families (278 | 68.5%) accounting for the largest median family size of 3.56 persons per family. On the other hand, single male/father families (12 | 3.0%) represent the smallest median family size with 2.08 persons per family.
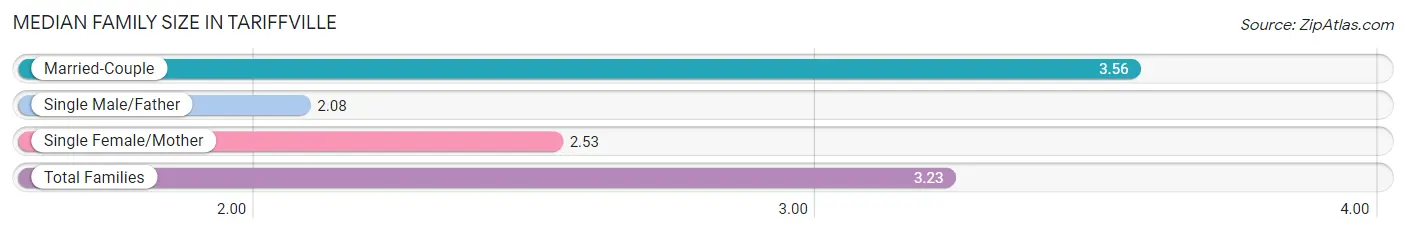
| Family Type | # Families | Family Size |
| Married-Couple | 278 (68.5%) | 3.56 |
| Single Male/Father | 12 (3.0%) | 2.08 |
| Single Female/Mother | 116 (28.6%) | 2.53 |
| Total Families | 406 (100.0%) | 3.23 |
Median Household Size in Tariffville
The median household size in Tariffville is 2.81 persons per household, with married-couple households (278 | 43.4%) accounting for the largest median household size of 4.06 persons per household. non-family households (235 | 36.7%) represent the smallest median household size with 1.29 persons per household.
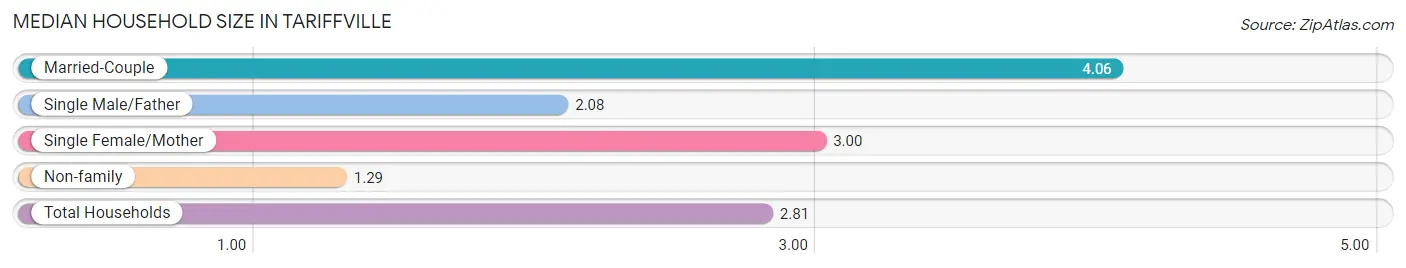
| Household Type | # Households | Household Size |
| Married-Couple | 278 (43.4%) | 4.06 |
| Single Male/Father | 12 (1.9%) | 2.08 |
| Single Female/Mother | 116 (18.1%) | 3.00 |
| Non-family | 235 (36.7%) | 1.29 |
| Total Households | 641 (100.0%) | 2.81 |
Household Size by Marriage Status in Tariffville
Out of a total of 641 households in Tariffville, 406 (63.3%) are family households, while 235 (36.7%) are nonfamily households. The most numerous type of family households are 4-person households, comprising 163, and the most common type of nonfamily households are 1-person households, comprising 159.
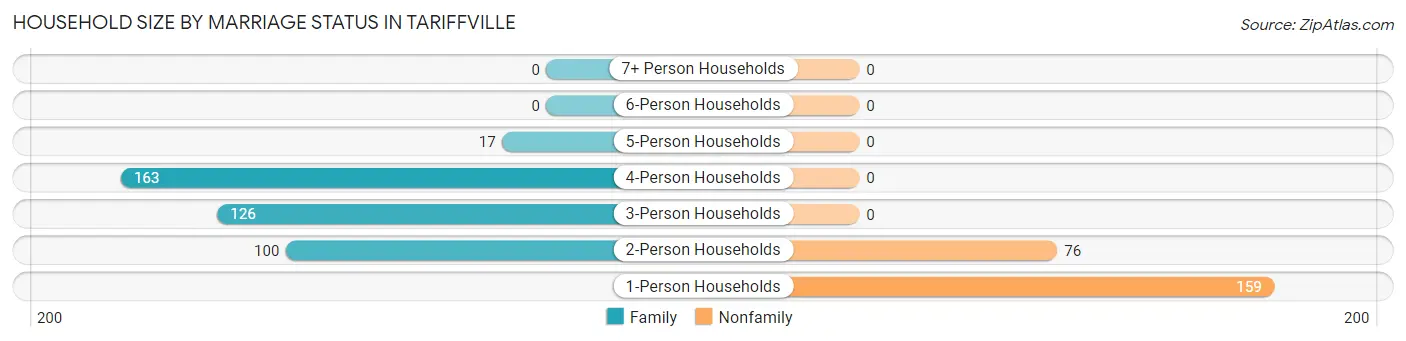
| Household Size | Family Households | Nonfamily Households |
| 1-Person Households | - | 159 (24.8%) |
| 2-Person Households | 100 (15.6%) | 76 (11.9%) |
| 3-Person Households | 126 (19.7%) | 0 (0.0%) |
| 4-Person Households | 163 (25.4%) | 0 (0.0%) |
| 5-Person Households | 17 (2.6%) | 0 (0.0%) |
| 6-Person Households | 0 (0.0%) | 0 (0.0%) |
| 7+ Person Households | 0 (0.0%) | 0 (0.0%) |
| Total | 406 (63.3%) | 235 (36.7%) |
Female Fertility in Tariffville
Fertility by Age in Tariffville
| Age Bracket | Women with Births | Births / 1,000 Women |
| 15 to 19 years | 0 (0.0%) | 0.0 |
| 20 to 34 years | 0 (0.0%) | 0.0 |
| 35 to 50 years | 0 (0.0%) | 0.0 |
| Total | 0 (0.0%) | 0.0 |
Fertility by Age by Marriage Status in Tariffville
| Age Bracket | Married | Unmarried |
| 15 to 19 years | 0 (0.0%) | 0 (0.0%) |
| 20 to 34 years | 0 (0.0%) | 0 (0.0%) |
| 35 to 50 years | 0 (0.0%) | 0 (0.0%) |
| Total | 0 (0.0%) | 0 (0.0%) |
Fertility by Education in Tariffville
| Educational Attainment | Women with Births | Births / 1,000 Women |
| Less than High School | 0 (0.0%) | 0.0 |
| High School Diploma | 0 (0.0%) | 0.0 |
| College or Associate's Degree | 0 (0.0%) | 0.0 |
| Bachelor's Degree | 0 (0.0%) | 0.0 |
| Graduate Degree | 0 (0.0%) | 0.0 |
| Total | 0 (0.0%) | 0.0 |
Fertility by Education by Marriage Status in Tariffville
| Educational Attainment | Married | Unmarried |
| Less than High School | 0 (0.0%) | 0 (0.0%) |
| High School Diploma | 0 (0.0%) | 0 (0.0%) |
| College or Associate's Degree | 0 (0.0%) | 0 (0.0%) |
| Bachelor's Degree | 0 (0.0%) | 0 (0.0%) |
| Graduate Degree | 0 (0.0%) | 0 (0.0%) |
| Total | 0 (0.0%) | 0 (0.0%) |
Employment Characteristics in Tariffville
Employment by Class of Employer in Tariffville
Among the 1,033 employed individuals in Tariffville, private company employees (774 | 74.9%), not-for-profit organizations (81 | 7.8%), and local government employees (62 | 6.0%) make up the most common classes of employment.
| Employer Class | # Employees | % Employees |
| Private Company Employees | 774 | 74.9% |
| Self-Employed (Incorporated) | 0 | 0.0% |
| Self-Employed (Not Incorporated) | 33 | 3.2% |
| Not-for-profit Organizations | 81 | 7.8% |
| Local Government Employees | 62 | 6.0% |
| State Government Employees | 57 | 5.5% |
| Federal Government Employees | 26 | 2.5% |
| Unpaid Family Workers | 0 | 0.0% |
| Total | 1,033 | 100.0% |
Employment Status by Age in Tariffville
According to the labor force statistics for Tariffville, out of the total population over 16 years of age (1,530), 83.1% or 1,271 individuals are in the labor force, with 14.7% or 187 of them unemployed. The age group with the highest labor force participation rate is 20 to 24 years, with 100.0% or 23 individuals in the labor force. Within the labor force, the 45 to 54 years age range has the highest percentage of unemployed individuals, with 37.6% or 145 of them being unemployed.
| Age Bracket | In Labor Force | Unemployed |
| 16 to 19 Years | 119 (68.0%) | 0 (0.0%) |
| 20 to 24 Years | 23 (100.0%) | 0 (0.0%) |
| 25 to 29 Years | 204 (100.0%) | 42 (20.6%) |
| 30 to 34 Years | 72 (80.9%) | 0 (0.0%) |
| 35 to 44 Years | 220 (72.6%) | 0 (0.0%) |
| 45 to 54 Years | 386 (95.5%) | 145 (37.6%) |
| 55 to 59 Years | 150 (100.0%) | 0 (0.0%) |
| 60 to 64 Years | 51 (83.6%) | 0 (0.0%) |
| 65 to 74 Years | 46 (47.4%) | 0 (0.0%) |
| 75 Years and over | 0 (0.0%) | 0 (0.0%) |
| Total | 1,271 (83.1%) | 187 (14.7%) |
Employment Status by Educational Attainment in Tariffville
According to labor force statistics for Tariffville, 89.4% of individuals (1,083) out of the total population between 25 and 64 years of age (1,211) are in the labor force, with 17.3% or 187 of them being unemployed. The group with the highest labor force participation rate are those with the educational attainment of less than high school, with 100.0% or 65 individuals in the labor force. Within the labor force, individuals with less than high school education have the highest percentage of unemployment, with 64.6% or 42 of them being unemployed.
| Educational Attainment | In Labor Force | Unemployed |
| Less than High School | 65 (100.0%) | 42 (64.6%) |
| High School Diploma | 323 (95.3%) | 32 (9.3%) |
| College / Associate Degree | 310 (84.0%) | 137 (37.1%) |
| Bachelor's Degree or higher | 385 (87.9%) | 0 (0.0%) |
| Total | 1,083 (89.4%) | 210 (17.3%) |
Employment Occupations by Sex in Tariffville
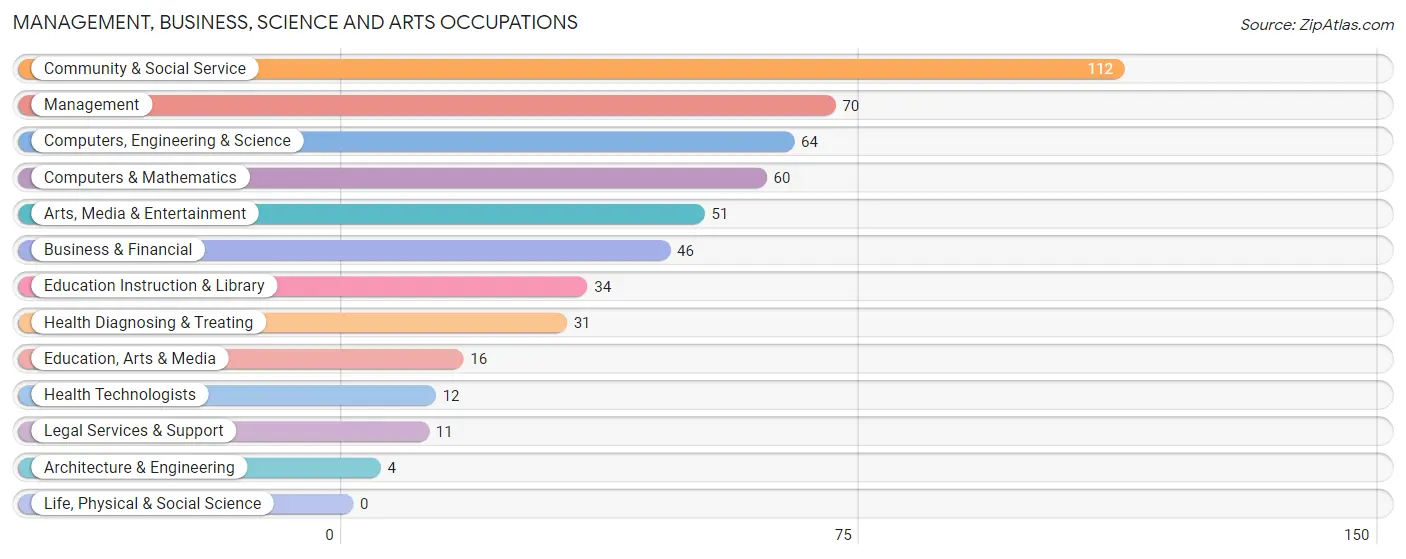
Management, Business, Science and Arts Occupations
The most common Management, Business, Science and Arts occupations in Tariffville are Community & Social Service (112 | 10.3%), Management (70 | 6.5%), Computers, Engineering & Science (64 | 5.9%), Computers & Mathematics (60 | 5.5%), and Arts, Media & Entertainment (51 | 4.7%).
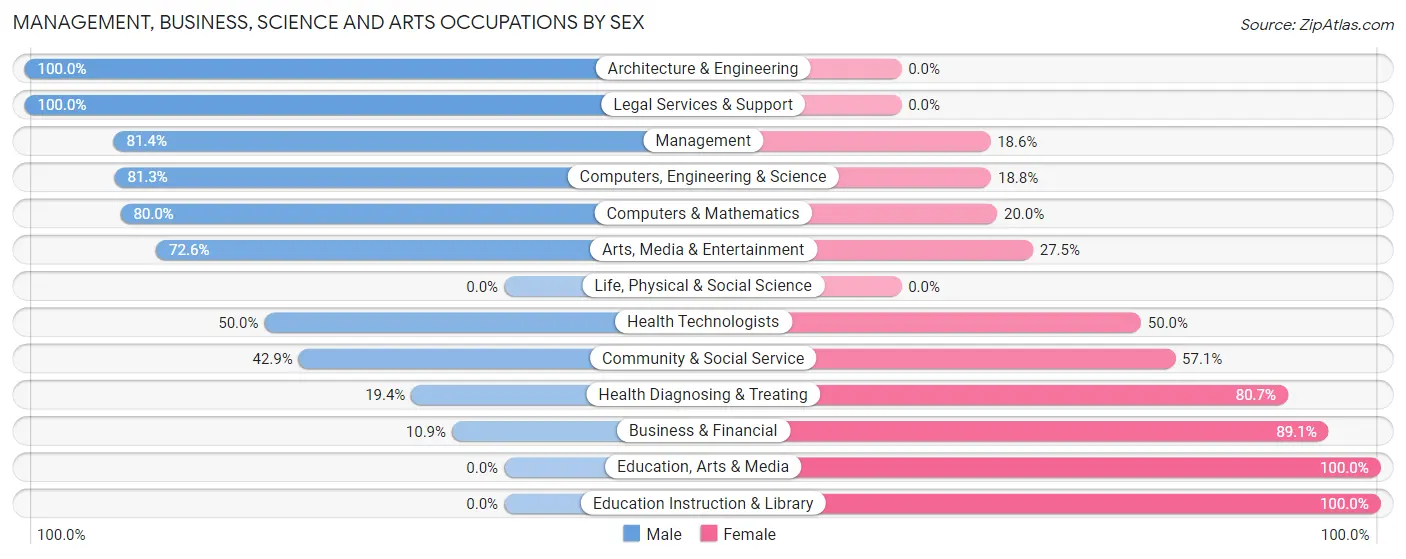
Management, Business, Science and Arts Occupations by Sex
Within the Management, Business, Science and Arts occupations in Tariffville, the most male-oriented occupations are Architecture & Engineering (100.0%), Legal Services & Support (100.0%), and Management (81.4%), while the most female-oriented occupations are Education, Arts & Media (100.0%), Education Instruction & Library (100.0%), and Business & Financial (89.1%).
| Occupation | Male | Female |
| Management | 57 (81.4%) | 13 (18.6%) |
| Business & Financial | 5 (10.9%) | 41 (89.1%) |
| Computers, Engineering & Science | 52 (81.2%) | 12 (18.8%) |
| Computers & Mathematics | 48 (80.0%) | 12 (20.0%) |
| Architecture & Engineering | 4 (100.0%) | 0 (0.0%) |
| Life, Physical & Social Science | 0 (0.0%) | 0 (0.0%) |
| Community & Social Service | 48 (42.9%) | 64 (57.1%) |
| Education, Arts & Media | 0 (0.0%) | 16 (100.0%) |
| Legal Services & Support | 11 (100.0%) | 0 (0.0%) |
| Education Instruction & Library | 0 (0.0%) | 34 (100.0%) |
| Arts, Media & Entertainment | 37 (72.6%) | 14 (27.5%) |
| Health Diagnosing & Treating | 6 (19.4%) | 25 (80.6%) |
| Health Technologists | 6 (50.0%) | 6 (50.0%) |
| Total (Category) | 168 (52.0%) | 155 (48.0%) |
| Total (Overall) | 552 (50.9%) | 532 (49.1%) |
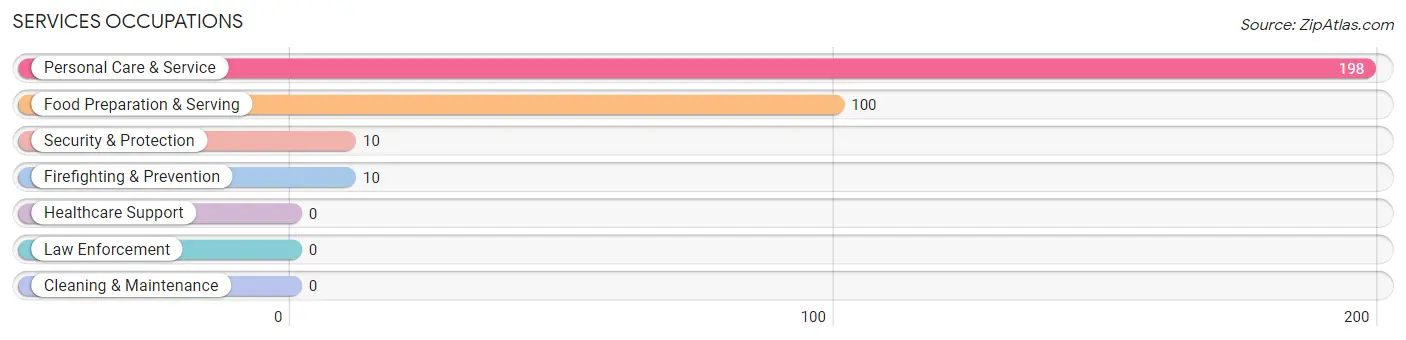
Services Occupations
The most common Services occupations in Tariffville are Personal Care & Service (198 | 18.3%), Food Preparation & Serving (100 | 9.2%), Security & Protection (10 | 0.9%), and Firefighting & Prevention (10 | 0.9%).
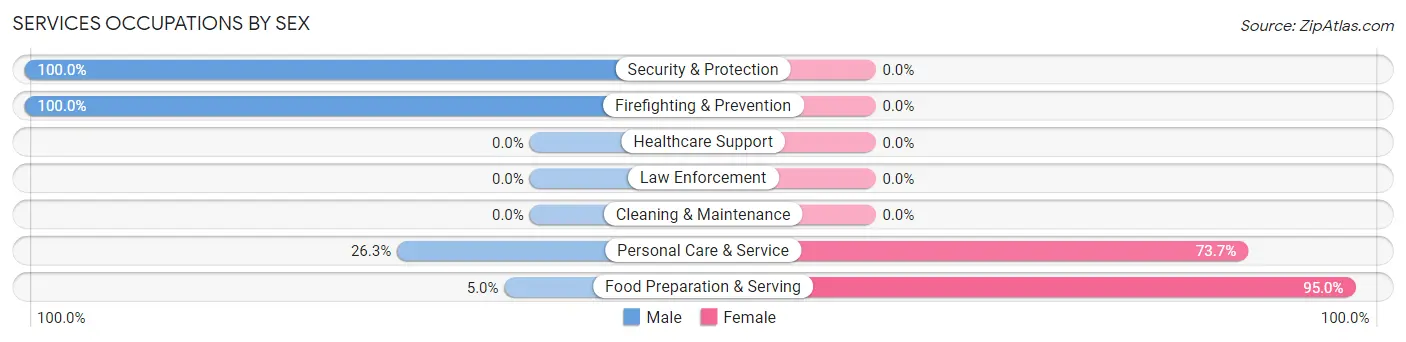
Services Occupations by Sex
Within the Services occupations in Tariffville, the most male-oriented occupations are Security & Protection (100.0%), Firefighting & Prevention (100.0%), and Personal Care & Service (26.3%), while the most female-oriented occupations are Food Preparation & Serving (95.0%), and Personal Care & Service (73.7%).
| Occupation | Male | Female |
| Healthcare Support | 0 (0.0%) | 0 (0.0%) |
| Security & Protection | 10 (100.0%) | 0 (0.0%) |
| Firefighting & Prevention | 10 (100.0%) | 0 (0.0%) |
| Law Enforcement | 0 (0.0%) | 0 (0.0%) |
| Food Preparation & Serving | 5 (5.0%) | 95 (95.0%) |
| Cleaning & Maintenance | 0 (0.0%) | 0 (0.0%) |
| Personal Care & Service | 52 (26.3%) | 146 (73.7%) |
| Total (Category) | 67 (21.7%) | 241 (78.2%) |
| Total (Overall) | 552 (50.9%) | 532 (49.1%) |
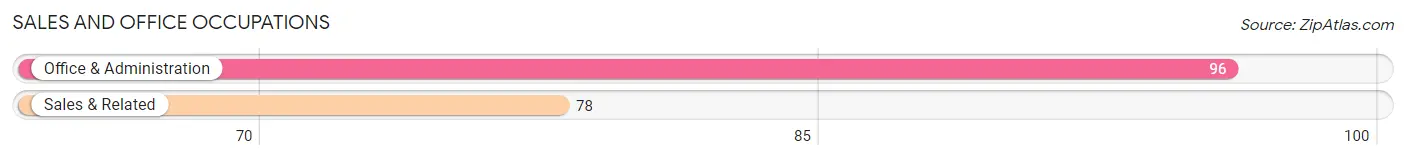
Sales and Office Occupations
The most common Sales and Office occupations in Tariffville are Office & Administration (96 | 8.9%), and Sales & Related (78 | 7.2%).
Sales and Office Occupations by Sex
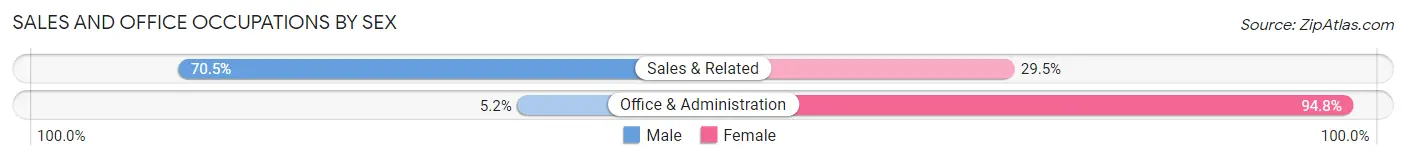
| Occupation | Male | Female |
| Sales & Related | 55 (70.5%) | 23 (29.5%) |
| Office & Administration | 5 (5.2%) | 91 (94.8%) |
| Total (Category) | 60 (34.5%) | 114 (65.5%) |
| Total (Overall) | 552 (50.9%) | 532 (49.1%) |
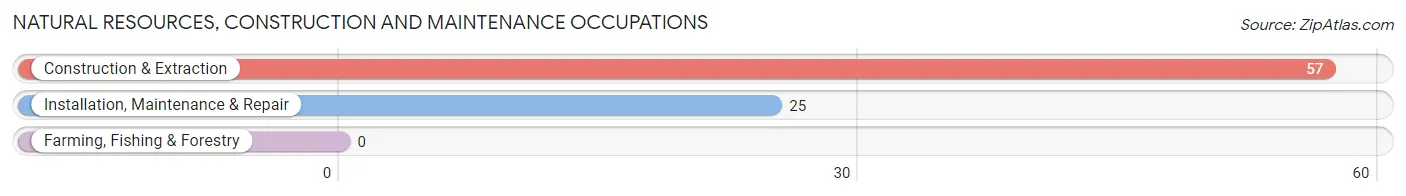
Natural Resources, Construction and Maintenance Occupations
The most common Natural Resources, Construction and Maintenance occupations in Tariffville are Construction & Extraction (57 | 5.3%), and Installation, Maintenance & Repair (25 | 2.3%).
Natural Resources, Construction and Maintenance Occupations by Sex
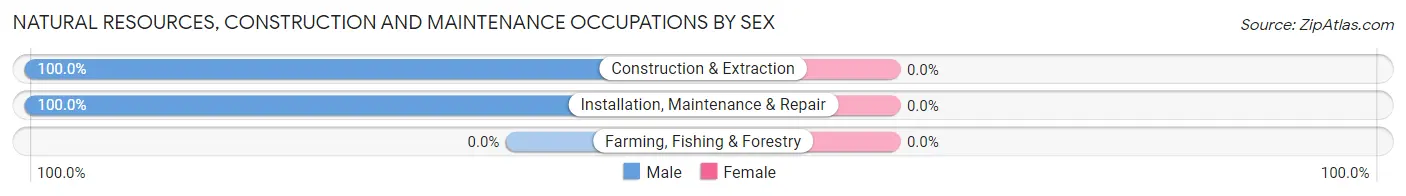
| Occupation | Male | Female |
| Farming, Fishing & Forestry | 0 (0.0%) | 0 (0.0%) |
| Construction & Extraction | 57 (100.0%) | 0 (0.0%) |
| Installation, Maintenance & Repair | 25 (100.0%) | 0 (0.0%) |
| Total (Category) | 82 (100.0%) | 0 (0.0%) |
| Total (Overall) | 552 (50.9%) | 532 (49.1%) |
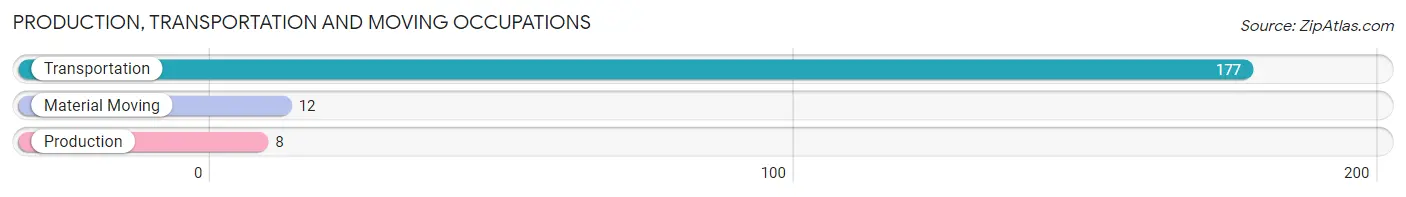
Production, Transportation and Moving Occupations
The most common Production, Transportation and Moving occupations in Tariffville are Transportation (177 | 16.3%), Material Moving (12 | 1.1%), and Production (8 | 0.7%).
Production, Transportation and Moving Occupations by Sex
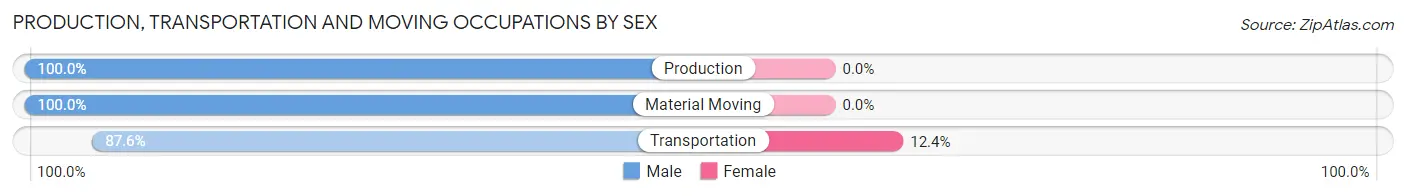
| Occupation | Male | Female |
| Production | 8 (100.0%) | 0 (0.0%) |
| Transportation | 155 (87.6%) | 22 (12.4%) |
| Material Moving | 12 (100.0%) | 0 (0.0%) |
| Total (Category) | 175 (88.8%) | 22 (11.2%) |
| Total (Overall) | 552 (50.9%) | 532 (49.1%) |
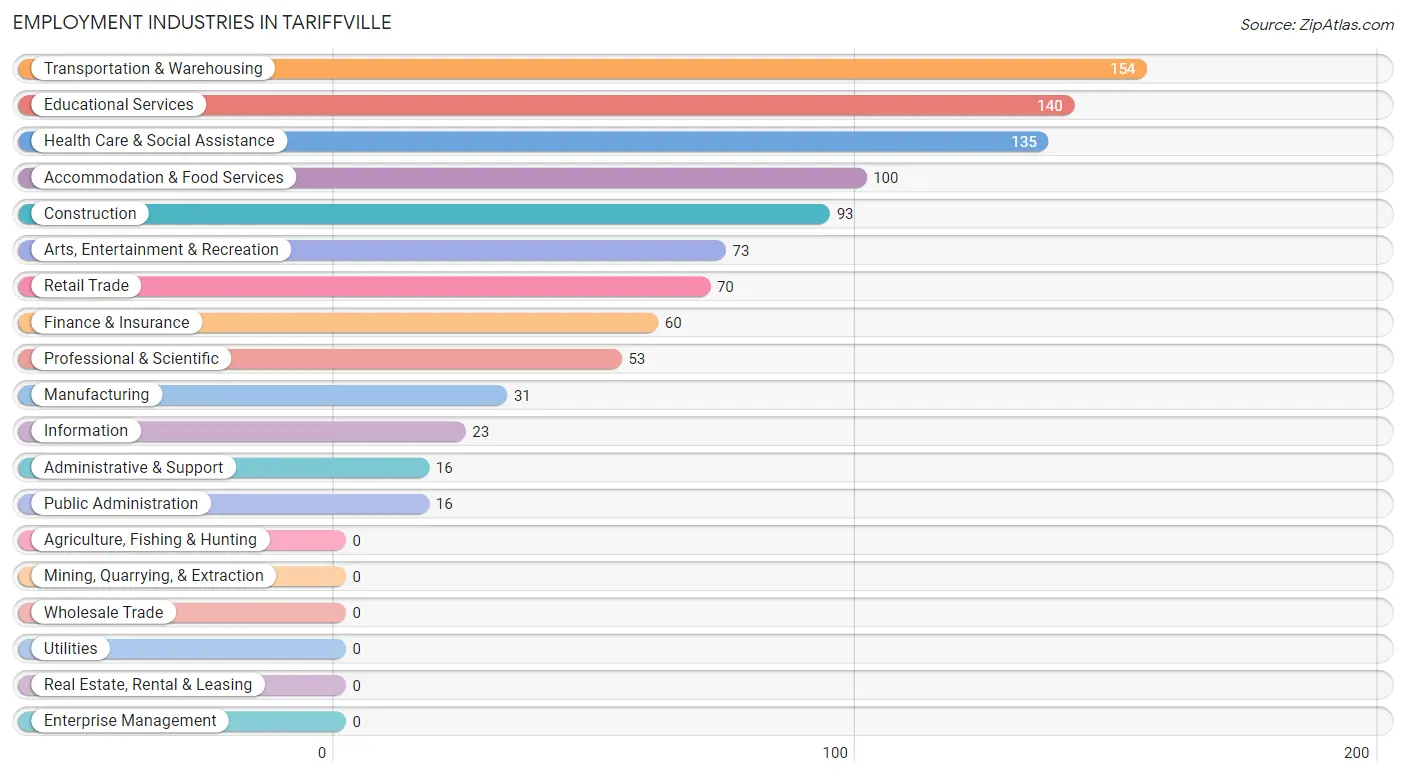
Employment Industries by Sex in Tariffville
Employment Industries in Tariffville
The major employment industries in Tariffville include Transportation & Warehousing (154 | 14.2%), Educational Services (140 | 12.9%), Health Care & Social Assistance (135 | 12.4%), Accommodation & Food Services (100 | 9.2%), and Construction (93 | 8.6%).
Employment Industries by Sex in Tariffville
The Tariffville industries that see more men than women are Information (100.0%), Administrative & Support (100.0%), and Arts, Entertainment & Recreation (100.0%), whereas the industries that tend to have a higher number of women are Accommodation & Food Services (95.0%), Health Care & Social Assistance (78.5%), and Educational Services (68.6%).
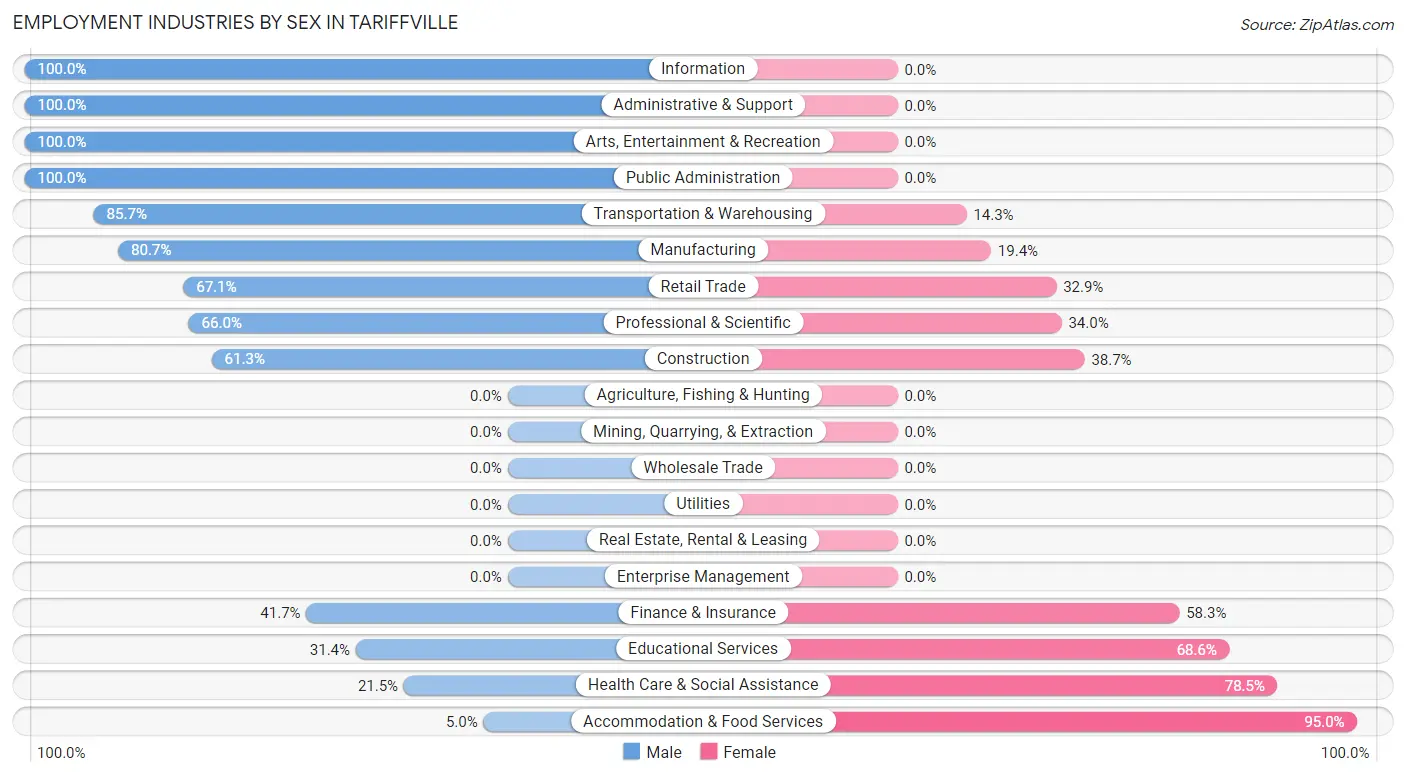
| Industry | Male | Female |
| Agriculture, Fishing & Hunting | 0 (0.0%) | 0 (0.0%) |
| Mining, Quarrying, & Extraction | 0 (0.0%) | 0 (0.0%) |
| Construction | 57 (61.3%) | 36 (38.7%) |
| Manufacturing | 25 (80.6%) | 6 (19.4%) |
| Wholesale Trade | 0 (0.0%) | 0 (0.0%) |
| Retail Trade | 47 (67.1%) | 23 (32.9%) |
| Transportation & Warehousing | 132 (85.7%) | 22 (14.3%) |
| Utilities | 0 (0.0%) | 0 (0.0%) |
| Information | 23 (100.0%) | 0 (0.0%) |
| Finance & Insurance | 25 (41.7%) | 35 (58.3%) |
| Real Estate, Rental & Leasing | 0 (0.0%) | 0 (0.0%) |
| Professional & Scientific | 35 (66.0%) | 18 (34.0%) |
| Enterprise Management | 0 (0.0%) | 0 (0.0%) |
| Administrative & Support | 16 (100.0%) | 0 (0.0%) |
| Educational Services | 44 (31.4%) | 96 (68.6%) |
| Health Care & Social Assistance | 29 (21.5%) | 106 (78.5%) |
| Arts, Entertainment & Recreation | 73 (100.0%) | 0 (0.0%) |
| Accommodation & Food Services | 5 (5.0%) | 95 (95.0%) |
| Public Administration | 16 (100.0%) | 0 (0.0%) |
| Total | 552 (50.9%) | 532 (49.1%) |
Education in Tariffville
School Enrollment in Tariffville
The most common levels of schooling among the 501 students in Tariffville are high school (151 | 30.1%), elementary school (128 | 25.6%), and graduate / professional (87 | 17.4%).
| School Level | # Students | % Students |
| Nursery / Preschool | 18 | 3.6% |
| Kindergarten | 0 | 0.0% |
| Elementary School | 128 | 25.6% |
| Middle School | 44 | 8.8% |
| High School | 151 | 30.1% |
| College / Undergraduate | 73 | 14.6% |
| Graduate / Professional | 87 | 17.4% |
| Total | 501 | 100.0% |
School Enrollment by Age by Funding Source in Tariffville
Out of a total of 501 students who are enrolled in schools in Tariffville, 137 (27.3%) attend a private institution, while the remaining 364 (72.7%) are enrolled in public schools. The age group of 3 to 4 year olds has the highest likelihood of being enrolled in private schools, with 7 (100.0% in the age bracket) enrolled. Conversely, the age group of 10 to 14 year olds has the lowest likelihood of being enrolled in a private school, with 74 (100.0% in the age bracket) attending a public institution.
| Age Bracket | Public School | Private School |
| 3 to 4 Year Olds | 0 (0.0%) | 7 (100.0%) |
| 5 to 9 Year Old | 81 (65.3%) | 43 (34.7%) |
| 10 to 14 Year Olds | 74 (100.0%) | 0 (0.0%) |
| 15 to 17 Year Olds | 80 (100.0%) | 0 (0.0%) |
| 18 to 19 Year Olds | 123 (100.0%) | 0 (0.0%) |
| 20 to 24 Year Olds | 0 (0.0%) | 0 (0.0%) |
| 25 to 34 Year Olds | 0 (0.0%) | 41 (100.0%) |
| 35 Years and over | 6 (11.5%) | 46 (88.5%) |
| Total | 364 (72.7%) | 137 (27.3%) |
Educational Attainment by Field of Study in Tariffville
Business (109 | 20.2%), communications (69 | 12.8%), liberal arts & history (66 | 12.2%), arts & humanities (55 | 10.2%), and education (42 | 7.8%) are the most common fields of study among 539 individuals in Tariffville who have obtained a bachelor's degree or higher.
| Field of Study | # Graduates | % Graduates |
| Computers & Mathematics | 18 | 3.3% |
| Bio, Nature & Agricultural | 35 | 6.5% |
| Physical & Health Sciences | 6 | 1.1% |
| Psychology | 16 | 3.0% |
| Social Sciences | 23 | 4.3% |
| Engineering | 35 | 6.5% |
| Multidisciplinary Studies | 6 | 1.1% |
| Science & Technology | 12 | 2.2% |
| Business | 109 | 20.2% |
| Education | 42 | 7.8% |
| Literature & Languages | 21 | 3.9% |
| Liberal Arts & History | 66 | 12.2% |
| Visual & Performing Arts | 26 | 4.8% |
| Communications | 69 | 12.8% |
| Arts & Humanities | 55 | 10.2% |
| Total | 539 | 100.0% |
Transportation & Commute in Tariffville
Vehicle Availability by Sex in Tariffville
The most prevalent vehicle ownership categories in Tariffville are males with 2 vehicles (192, accounting for 35.7%) and females with 2 vehicles (111, making up 38.8%).
| Vehicles Available | Male | Female |
| No Vehicle | 0 (0.0%) | 0 (0.0%) |
| 1 Vehicle | 85 (15.8%) | 100 (20.2%) |
| 2 Vehicles | 192 (35.7%) | 111 (22.4%) |
| 3 Vehicles | 8 (1.5%) | 88 (17.8%) |
| 4 Vehicles | 102 (19.0%) | 99 (20.0%) |
| 5 or more Vehicles | 151 (28.1%) | 97 (19.6%) |
| Total | 538 (100.0%) | 495 (100.0%) |
Commute Time in Tariffville
The most frequently occuring commute durations in Tariffville are 15 to 19 minutes (260 commuters, 26.3%), 10 to 14 minutes (215 commuters, 21.8%), and 5 to 9 minutes (166 commuters, 16.8%).
| Commute Time | # Commuters | % Commuters |
| Less than 5 Minutes | 36 | 3.6% |
| 5 to 9 Minutes | 166 | 16.8% |
| 10 to 14 Minutes | 215 | 21.8% |
| 15 to 19 Minutes | 260 | 26.3% |
| 20 to 24 Minutes | 16 | 1.6% |
| 25 to 29 Minutes | 28 | 2.8% |
| 30 to 34 Minutes | 21 | 2.1% |
| 35 to 39 Minutes | 76 | 7.7% |
| 40 to 44 Minutes | 31 | 3.1% |
| 45 to 59 Minutes | 101 | 10.2% |
| 60 to 89 Minutes | 14 | 1.4% |
| 90 or more Minutes | 23 | 2.3% |
Commute Time by Sex in Tariffville
The most common commute times in Tariffville are 15 to 19 minutes (118 commuters, 22.9%) for males and 15 to 19 minutes (142 commuters, 30.1%) for females.
| Commute Time | Male | Female |
| Less than 5 Minutes | 0 (0.0%) | 36 (7.6%) |
| 5 to 9 Minutes | 73 (14.1%) | 93 (19.8%) |
| 10 to 14 Minutes | 92 (17.8%) | 123 (26.1%) |
| 15 to 19 Minutes | 118 (22.9%) | 142 (30.1%) |
| 20 to 24 Minutes | 16 (3.1%) | 0 (0.0%) |
| 25 to 29 Minutes | 17 (3.3%) | 11 (2.3%) |
| 30 to 34 Minutes | 9 (1.7%) | 12 (2.5%) |
| 35 to 39 Minutes | 57 (11.1%) | 19 (4.0%) |
| 40 to 44 Minutes | 19 (3.7%) | 12 (2.5%) |
| 45 to 59 Minutes | 78 (15.1%) | 23 (4.9%) |
| 60 to 89 Minutes | 14 (2.7%) | 0 (0.0%) |
| 90 or more Minutes | 23 (4.5%) | 0 (0.0%) |
Time of Departure to Work by Sex in Tariffville
The most frequent times of departure to work in Tariffville are 6:30 AM to 6:59 AM (138, 26.7%) for males and 7:30 AM to 7:59 AM (110, 23.4%) for females.
| Time of Departure | Male | Female |
| 12:00 AM to 4:59 AM | 30 (5.8%) | 0 (0.0%) |
| 5:00 AM to 5:29 AM | 21 (4.1%) | 0 (0.0%) |
| 5:30 AM to 5:59 AM | 5 (1.0%) | 7 (1.5%) |
| 6:00 AM to 6:29 AM | 75 (14.5%) | 64 (13.6%) |
| 6:30 AM to 6:59 AM | 138 (26.7%) | 7 (1.5%) |
| 7:00 AM to 7:29 AM | 67 (13.0%) | 41 (8.7%) |
| 7:30 AM to 7:59 AM | 42 (8.1%) | 110 (23.4%) |
| 8:00 AM to 8:29 AM | 4 (0.8%) | 69 (14.6%) |
| 8:30 AM to 8:59 AM | 14 (2.7%) | 0 (0.0%) |
| 9:00 AM to 9:59 AM | 0 (0.0%) | 27 (5.7%) |
| 10:00 AM to 10:59 AM | 0 (0.0%) | 102 (21.7%) |
| 11:00 AM to 11:59 AM | 0 (0.0%) | 0 (0.0%) |
| 12:00 PM to 3:59 PM | 0 (0.0%) | 0 (0.0%) |
| 4:00 PM to 11:59 PM | 120 (23.3%) | 44 (9.3%) |
| Total | 516 (100.0%) | 471 (100.0%) |
Housing Occupancy in Tariffville
Occupancy by Ownership in Tariffville
Of the total 641 dwellings in Tariffville, owner-occupied units account for 398 (62.1%), while renter-occupied units make up 243 (37.9%).
| Occupancy | # Housing Units | % Housing Units |
| Owner Occupied Housing Units | 398 | 62.1% |
| Renter-Occupied Housing Units | 243 | 37.9% |
| Total Occupied Housing Units | 641 | 100.0% |
Occupancy by Household Size in Tariffville
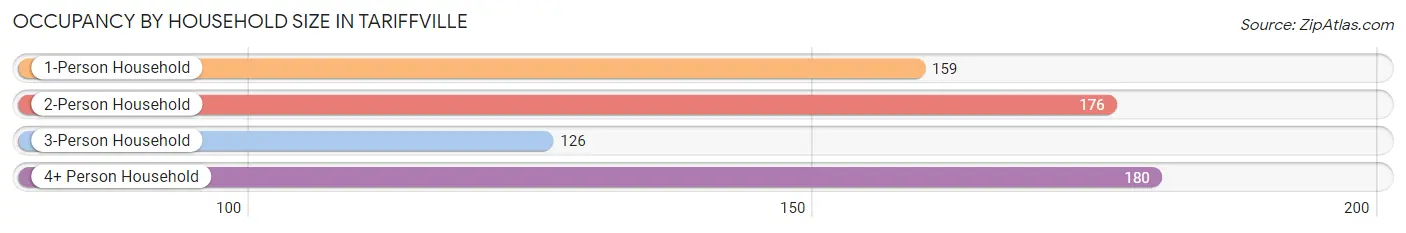
| Household Size | # Housing Units | % Housing Units |
| 1-Person Household | 159 | 24.8% |
| 2-Person Household | 176 | 27.5% |
| 3-Person Household | 126 | 19.7% |
| 4+ Person Household | 180 | 28.1% |
| Total Housing Units | 641 | 100.0% |
Occupancy by Ownership by Household Size in Tariffville
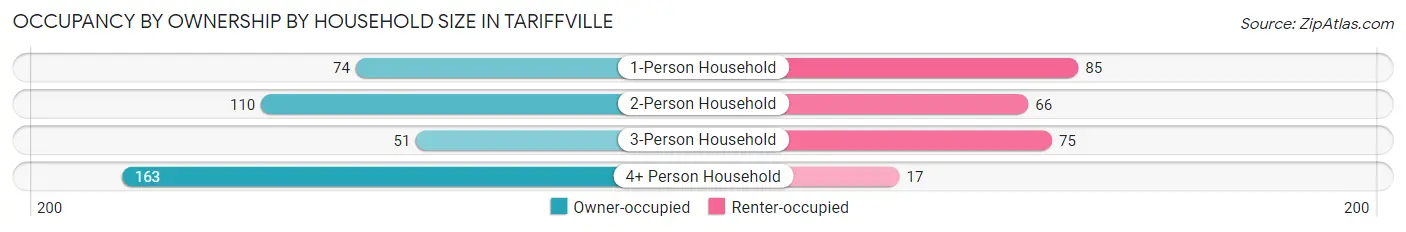
| Household Size | Owner-occupied | Renter-occupied |
| 1-Person Household | 74 (46.5%) | 85 (53.5%) |
| 2-Person Household | 110 (62.5%) | 66 (37.5%) |
| 3-Person Household | 51 (40.5%) | 75 (59.5%) |
| 4+ Person Household | 163 (90.6%) | 17 (9.4%) |
| Total Housing Units | 398 (62.1%) | 243 (37.9%) |
Occupancy by Educational Attainment in Tariffville
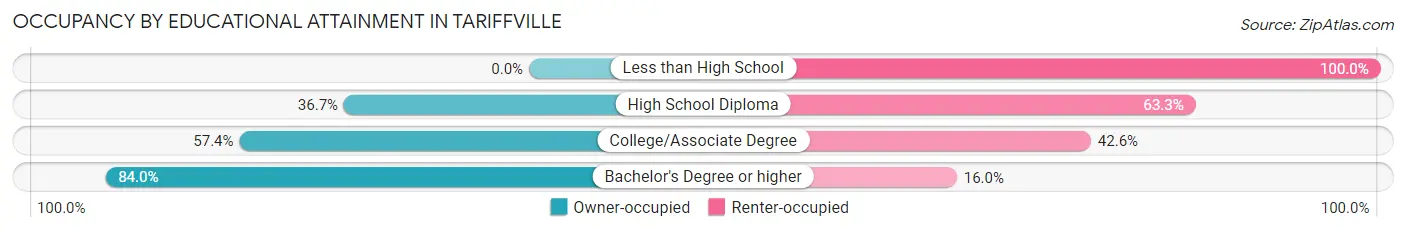
| Household Size | Owner-occupied | Renter-occupied |
| Less than High School | 0 (0.0%) | 23 (100.0%) |
| High School Diploma | 62 (36.7%) | 107 (63.3%) |
| College/Associate Degree | 89 (57.4%) | 66 (42.6%) |
| Bachelor's Degree or higher | 247 (84.0%) | 47 (16.0%) |
Occupancy by Age of Householder in Tariffville
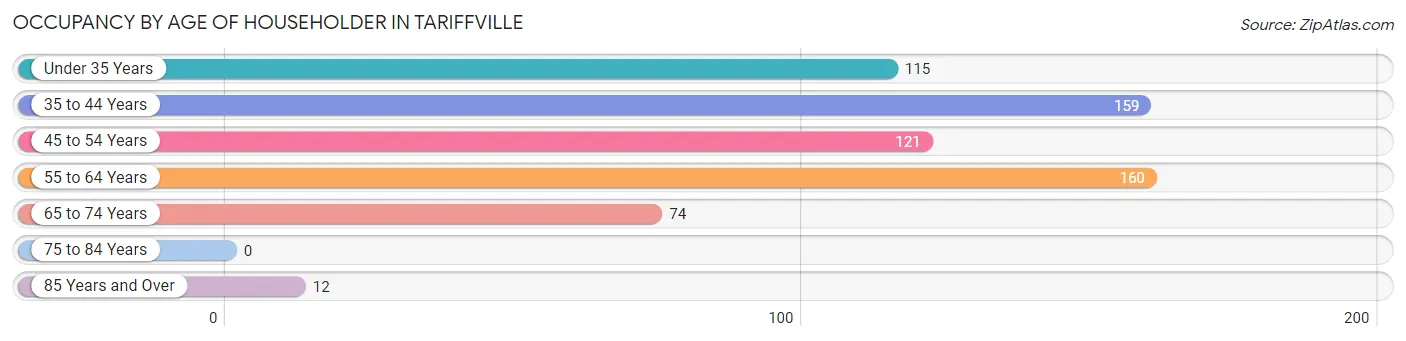
| Age Bracket | # Households | % Households |
| Under 35 Years | 115 | 17.9% |
| 35 to 44 Years | 159 | 24.8% |
| 45 to 54 Years | 121 | 18.9% |
| 55 to 64 Years | 160 | 25.0% |
| 65 to 74 Years | 74 | 11.5% |
| 75 to 84 Years | 0 | 0.0% |
| 85 Years and Over | 12 | 1.9% |
| Total | 641 | 100.0% |
Housing Finances in Tariffville
Median Income by Occupancy in Tariffville
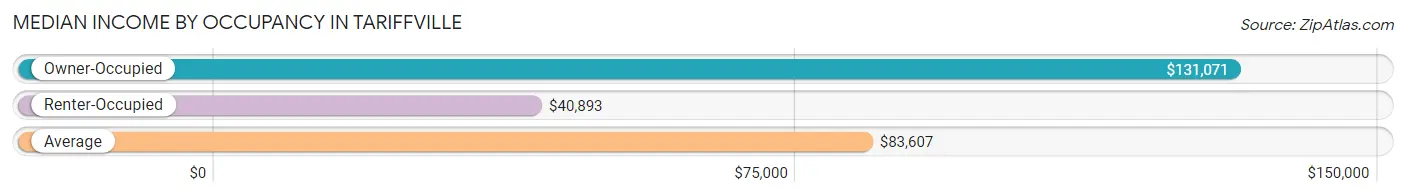
| Occupancy Type | # Households | Median Income |
| Owner-Occupied | 398 (62.1%) | $131,071 |
| Renter-Occupied | 243 (37.9%) | $40,893 |
| Average | 641 (100.0%) | $83,607 |
Occupancy by Householder Income Bracket in Tariffville
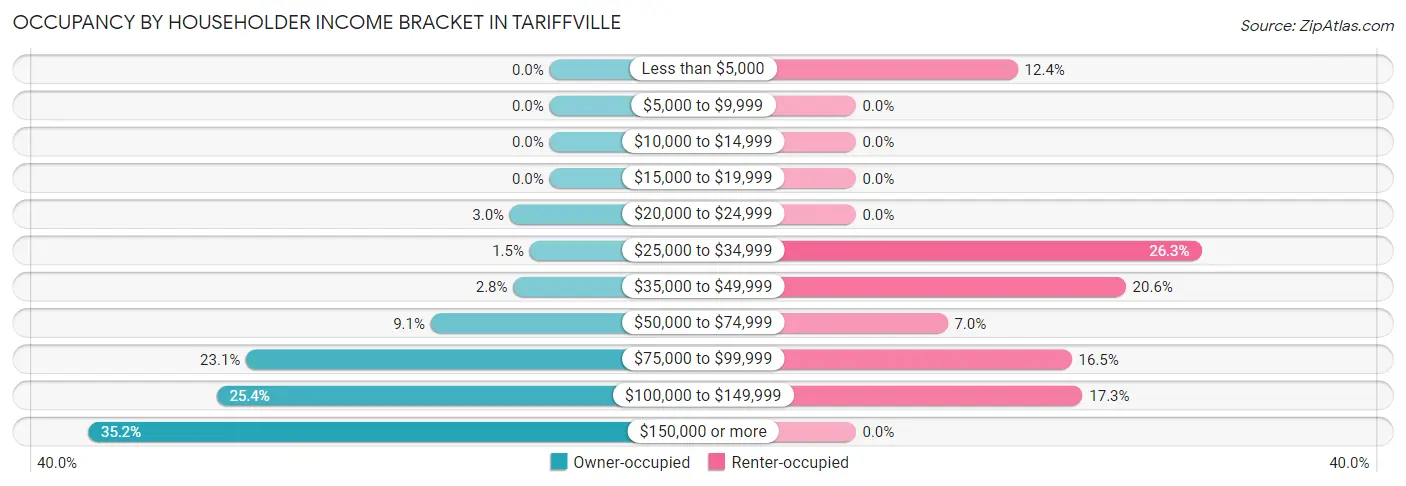
| Income Bracket | Owner-occupied | Renter-occupied |
| Less than $5,000 | 0 (0.0%) | 30 (12.3%) |
| $5,000 to $9,999 | 0 (0.0%) | 0 (0.0%) |
| $10,000 to $14,999 | 0 (0.0%) | 0 (0.0%) |
| $15,000 to $19,999 | 0 (0.0%) | 0 (0.0%) |
| $20,000 to $24,999 | 12 (3.0%) | 0 (0.0%) |
| $25,000 to $34,999 | 6 (1.5%) | 64 (26.3%) |
| $35,000 to $49,999 | 11 (2.8%) | 50 (20.6%) |
| $50,000 to $74,999 | 36 (9.0%) | 17 (7.0%) |
| $75,000 to $99,999 | 92 (23.1%) | 40 (16.5%) |
| $100,000 to $149,999 | 101 (25.4%) | 42 (17.3%) |
| $150,000 or more | 140 (35.2%) | 0 (0.0%) |
| Total | 398 (100.0%) | 243 (100.0%) |
Monthly Housing Cost Tiers in Tariffville
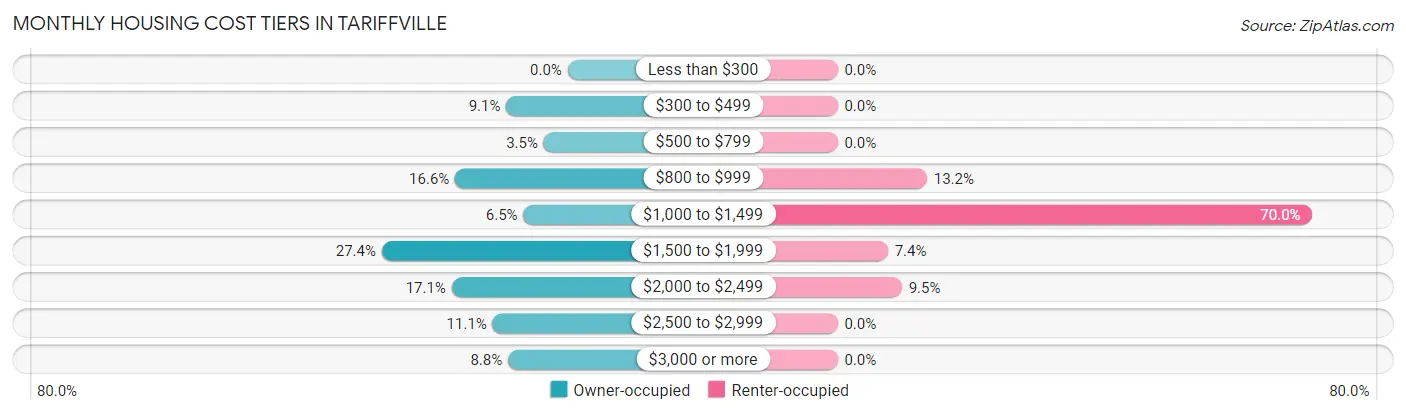
| Monthly Cost | Owner-occupied | Renter-occupied |
| Less than $300 | 0 (0.0%) | 0 (0.0%) |
| $300 to $499 | 36 (9.0%) | 0 (0.0%) |
| $500 to $799 | 14 (3.5%) | 0 (0.0%) |
| $800 to $999 | 66 (16.6%) | 32 (13.2%) |
| $1,000 to $1,499 | 26 (6.5%) | 170 (70.0%) |
| $1,500 to $1,999 | 109 (27.4%) | 18 (7.4%) |
| $2,000 to $2,499 | 68 (17.1%) | 23 (9.5%) |
| $2,500 to $2,999 | 44 (11.1%) | 0 (0.0%) |
| $3,000 or more | 35 (8.8%) | 0 (0.0%) |
| Total | 398 (100.0%) | 243 (100.0%) |
Physical Housing Characteristics in Tariffville
Housing Structures in Tariffville
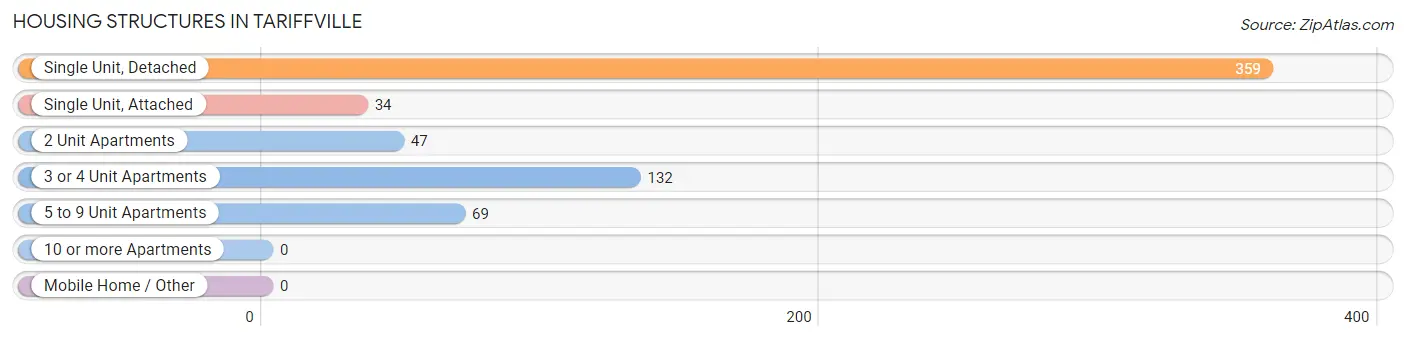
| Structure Type | # Housing Units | % Housing Units |
| Single Unit, Detached | 359 | 56.0% |
| Single Unit, Attached | 34 | 5.3% |
| 2 Unit Apartments | 47 | 7.3% |
| 3 or 4 Unit Apartments | 132 | 20.6% |
| 5 to 9 Unit Apartments | 69 | 10.8% |
| 10 or more Apartments | 0 | 0.0% |
| Mobile Home / Other | 0 | 0.0% |
| Total | 641 | 100.0% |
Housing Structures by Occupancy in Tariffville
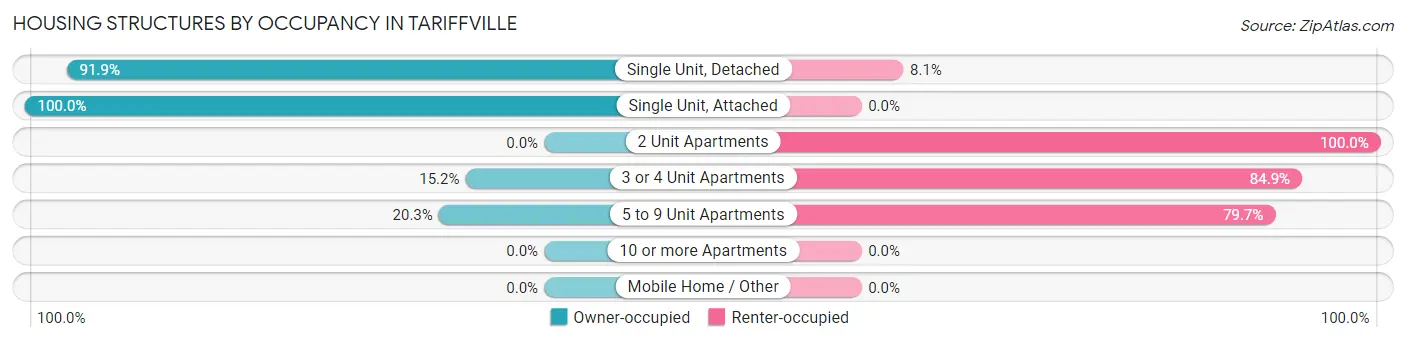
| Structure Type | Owner-occupied | Renter-occupied |
| Single Unit, Detached | 330 (91.9%) | 29 (8.1%) |
| Single Unit, Attached | 34 (100.0%) | 0 (0.0%) |
| 2 Unit Apartments | 0 (0.0%) | 47 (100.0%) |
| 3 or 4 Unit Apartments | 20 (15.1%) | 112 (84.9%) |
| 5 to 9 Unit Apartments | 14 (20.3%) | 55 (79.7%) |
| 10 or more Apartments | 0 (0.0%) | 0 (0.0%) |
| Mobile Home / Other | 0 (0.0%) | 0 (0.0%) |
| Total | 398 (62.1%) | 243 (37.9%) |
Housing Structures by Number of Rooms in Tariffville
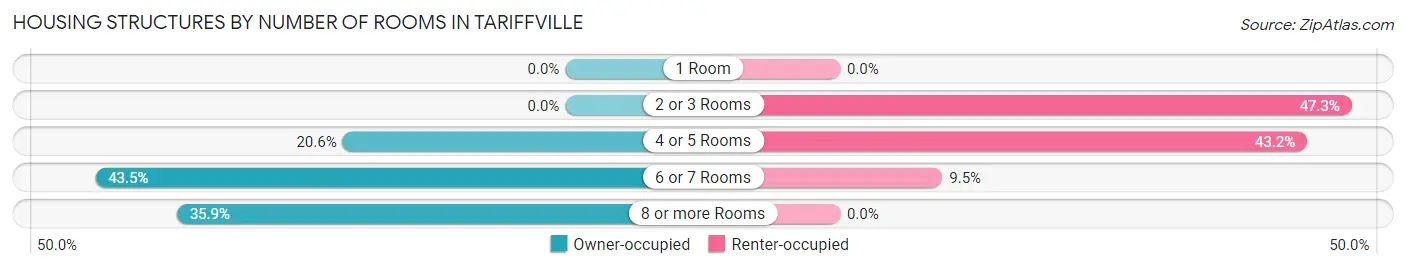
| Number of Rooms | Owner-occupied | Renter-occupied |
| 1 Room | 0 (0.0%) | 0 (0.0%) |
| 2 or 3 Rooms | 0 (0.0%) | 115 (47.3%) |
| 4 or 5 Rooms | 82 (20.6%) | 105 (43.2%) |
| 6 or 7 Rooms | 173 (43.5%) | 23 (9.5%) |
| 8 or more Rooms | 143 (35.9%) | 0 (0.0%) |
| Total | 398 (100.0%) | 243 (100.0%) |
Housing Structure by Heating Type in Tariffville
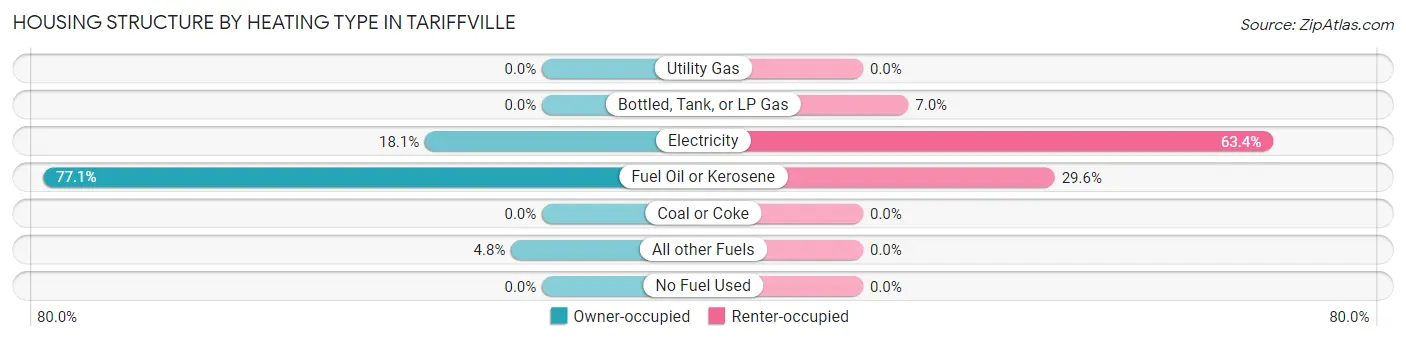
| Heating Type | Owner-occupied | Renter-occupied |
| Utility Gas | 0 (0.0%) | 0 (0.0%) |
| Bottled, Tank, or LP Gas | 0 (0.0%) | 17 (7.0%) |
| Electricity | 72 (18.1%) | 154 (63.4%) |
| Fuel Oil or Kerosene | 307 (77.1%) | 72 (29.6%) |
| Coal or Coke | 0 (0.0%) | 0 (0.0%) |
| All other Fuels | 19 (4.8%) | 0 (0.0%) |
| No Fuel Used | 0 (0.0%) | 0 (0.0%) |
| Total | 398 (100.0%) | 243 (100.0%) |
Household Vehicle Usage in Tariffville
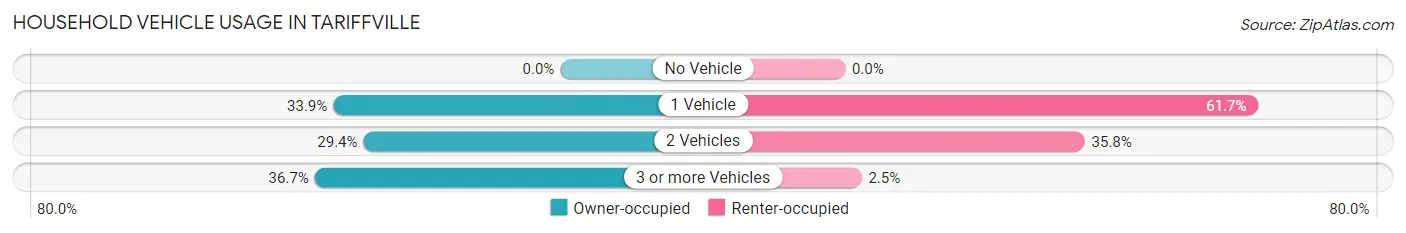
| Vehicles per Household | Owner-occupied | Renter-occupied |
| No Vehicle | 0 (0.0%) | 0 (0.0%) |
| 1 Vehicle | 135 (33.9%) | 150 (61.7%) |
| 2 Vehicles | 117 (29.4%) | 87 (35.8%) |
| 3 or more Vehicles | 146 (36.7%) | 6 (2.5%) |
| Total | 398 (100.0%) | 243 (100.0%) |
Real Estate & Mortgages in Tariffville
Real Estate and Mortgage Overview in Tariffville
| Characteristic | Without Mortgage | With Mortgage |
| Housing Units | 137 | 261 |
| Median Property Value | $225,900 | $269,900 |
| Median Household Income | $84,938 | $123 |
| Monthly Housing Costs | $850 | $35 |
| Real Estate Taxes | $4,843 | $0 |
Property Value by Mortgage Status in Tariffville
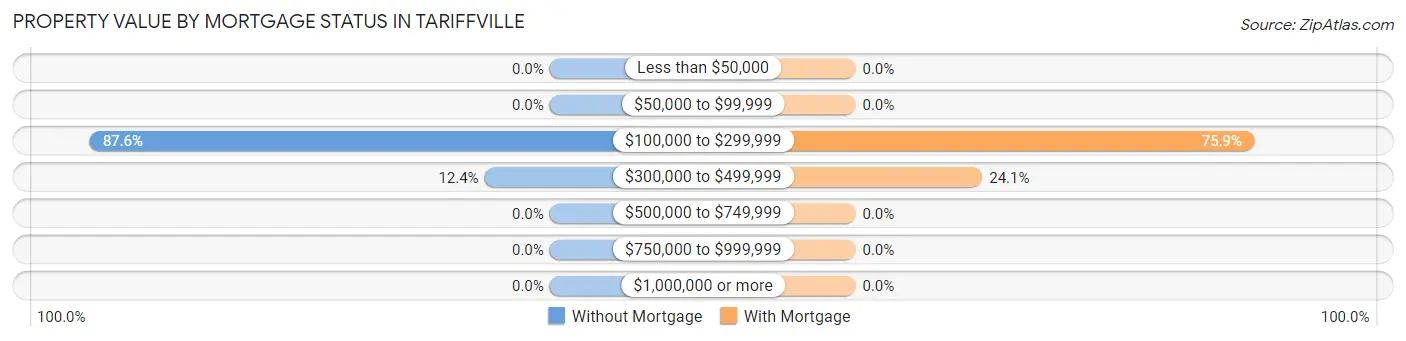
| Property Value | Without Mortgage | With Mortgage |
| Less than $50,000 | 0 (0.0%) | 0 (0.0%) |
| $50,000 to $99,999 | 0 (0.0%) | 0 (0.0%) |
| $100,000 to $299,999 | 120 (87.6%) | 198 (75.9%) |
| $300,000 to $499,999 | 17 (12.4%) | 63 (24.1%) |
| $500,000 to $749,999 | 0 (0.0%) | 0 (0.0%) |
| $750,000 to $999,999 | 0 (0.0%) | 0 (0.0%) |
| $1,000,000 or more | 0 (0.0%) | 0 (0.0%) |
| Total | 137 (100.0%) | 261 (100.0%) |
Household Income by Mortgage Status in Tariffville
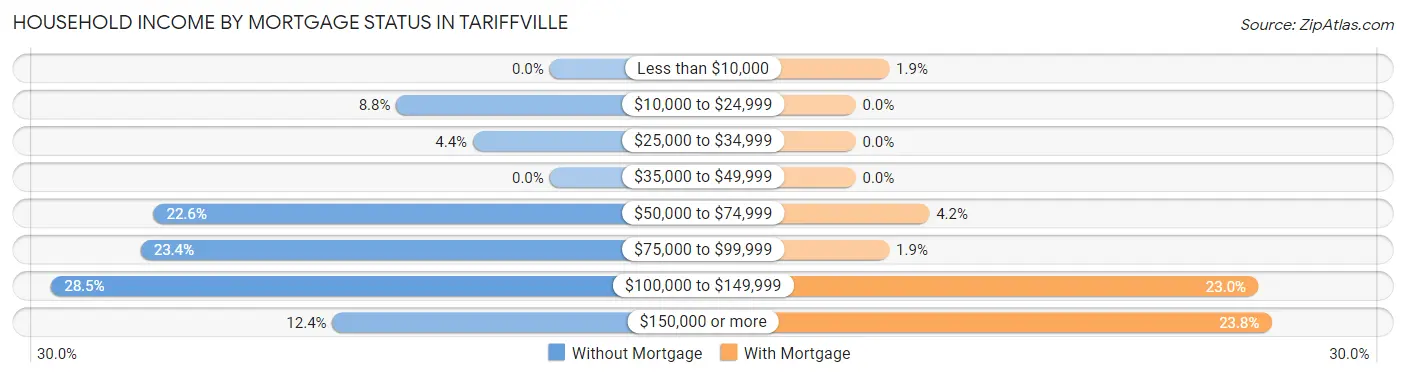
| Household Income | Without Mortgage | With Mortgage |
| Less than $10,000 | 0 (0.0%) | 5 (1.9%) |
| $10,000 to $24,999 | 12 (8.8%) | 0 (0.0%) |
| $25,000 to $34,999 | 6 (4.4%) | 0 (0.0%) |
| $35,000 to $49,999 | 0 (0.0%) | 0 (0.0%) |
| $50,000 to $74,999 | 31 (22.6%) | 11 (4.2%) |
| $75,000 to $99,999 | 32 (23.4%) | 5 (1.9%) |
| $100,000 to $149,999 | 39 (28.5%) | 60 (23.0%) |
| $150,000 or more | 17 (12.4%) | 62 (23.7%) |
| Total | 137 (100.0%) | 261 (100.0%) |
Property Value to Household Income Ratio in Tariffville
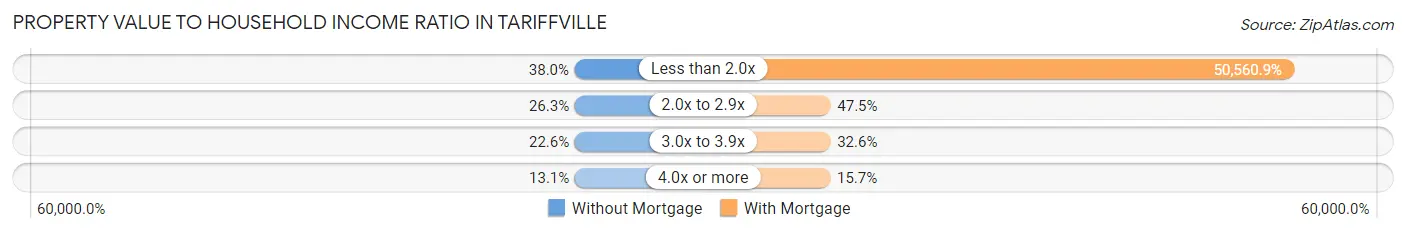
| Value-to-Income Ratio | Without Mortgage | With Mortgage |
| Less than 2.0x | 52 (38.0%) | 131,964 (50,560.9%) |
| 2.0x to 2.9x | 36 (26.3%) | 124 (47.5%) |
| 3.0x to 3.9x | 31 (22.6%) | 85 (32.6%) |
| 4.0x or more | 18 (13.1%) | 41 (15.7%) |
| Total | 137 (100.0%) | 261 (100.0%) |
Real Estate Taxes by Mortgage Status in Tariffville
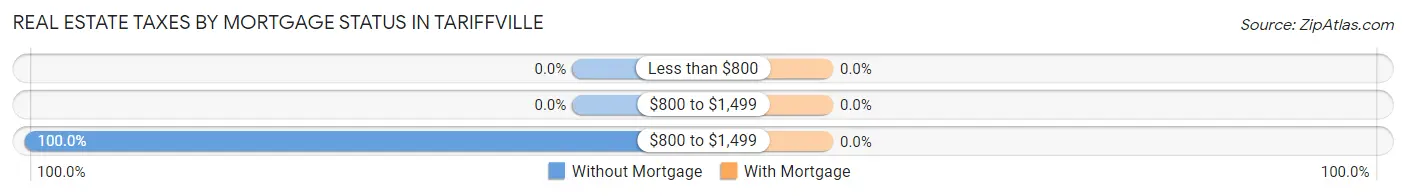
| Property Taxes | Without Mortgage | With Mortgage |
| Less than $800 | 0 (0.0%) | 0 (0.0%) |
| $800 to $1,499 | 0 (0.0%) | 0 (0.0%) |
| $800 to $1,499 | 137 (100.0%) | 0 (0.0%) |
| Total | 137 (100.0%) | 261 (100.0%) |
Health & Disability in Tariffville
Health Insurance Coverage by Age in Tariffville
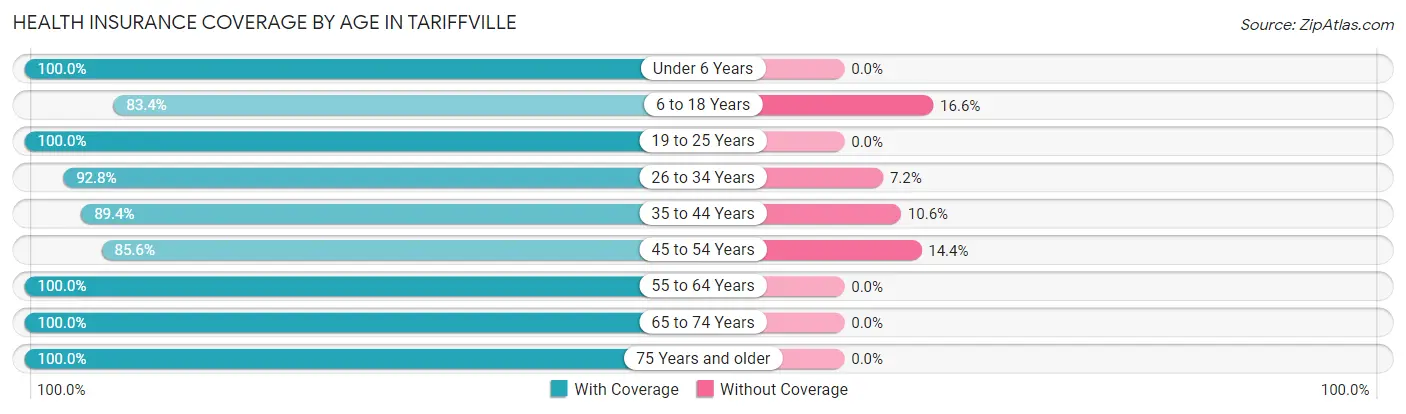
| Age Bracket | With Coverage | Without Coverage |
| Under 6 Years | 58 (100.0%) | 0 (0.0%) |
| 6 to 18 Years | 282 (83.4%) | 56 (16.6%) |
| 19 to 25 Years | 146 (100.0%) | 0 (0.0%) |
| 26 to 34 Years | 206 (92.8%) | 16 (7.2%) |
| 35 to 44 Years | 271 (89.4%) | 32 (10.6%) |
| 45 to 54 Years | 346 (85.6%) | 58 (14.4%) |
| 55 to 64 Years | 211 (100.0%) | 0 (0.0%) |
| 65 to 74 Years | 97 (100.0%) | 0 (0.0%) |
| 75 Years and older | 24 (100.0%) | 0 (0.0%) |
| Total | 1,641 (91.0%) | 162 (9.0%) |
Health Insurance Coverage by Citizenship Status in Tariffville
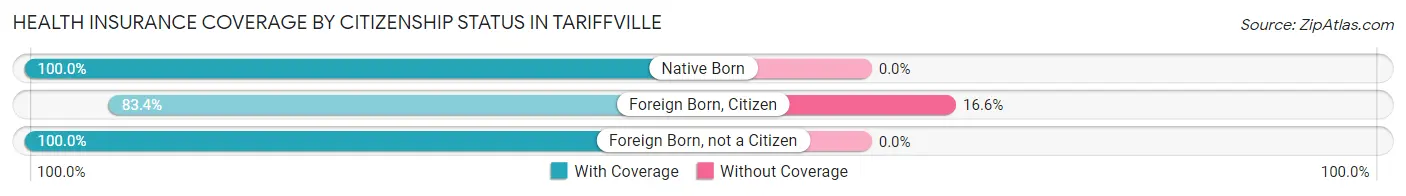
| Citizenship Status | With Coverage | Without Coverage |
| Native Born | 58 (100.0%) | 0 (0.0%) |
| Foreign Born, Citizen | 282 (83.4%) | 56 (16.6%) |
| Foreign Born, not a Citizen | 146 (100.0%) | 0 (0.0%) |
Health Insurance Coverage by Household Income in Tariffville
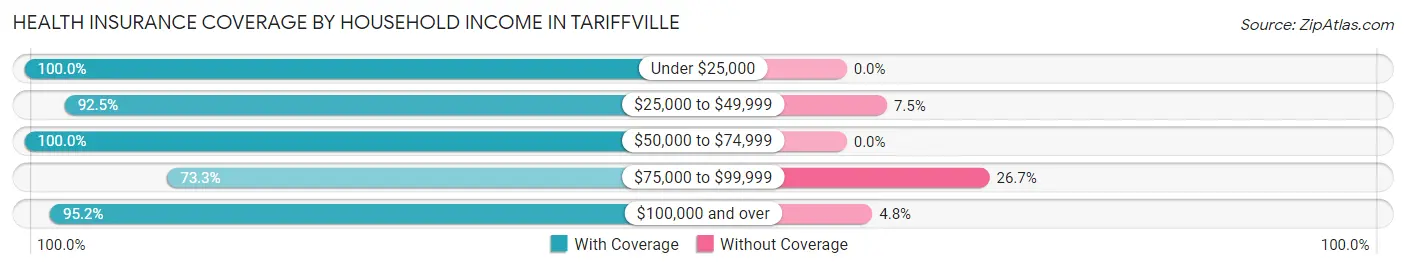
| Household Income | With Coverage | Without Coverage |
| Under $25,000 | 55 (100.0%) | 0 (0.0%) |
| $25,000 to $49,999 | 221 (92.5%) | 18 (7.5%) |
| $50,000 to $74,999 | 145 (100.0%) | 0 (0.0%) |
| $75,000 to $99,999 | 263 (73.3%) | 96 (26.7%) |
| $100,000 and over | 957 (95.2%) | 48 (4.8%) |
Public vs Private Health Insurance Coverage by Age in Tariffville
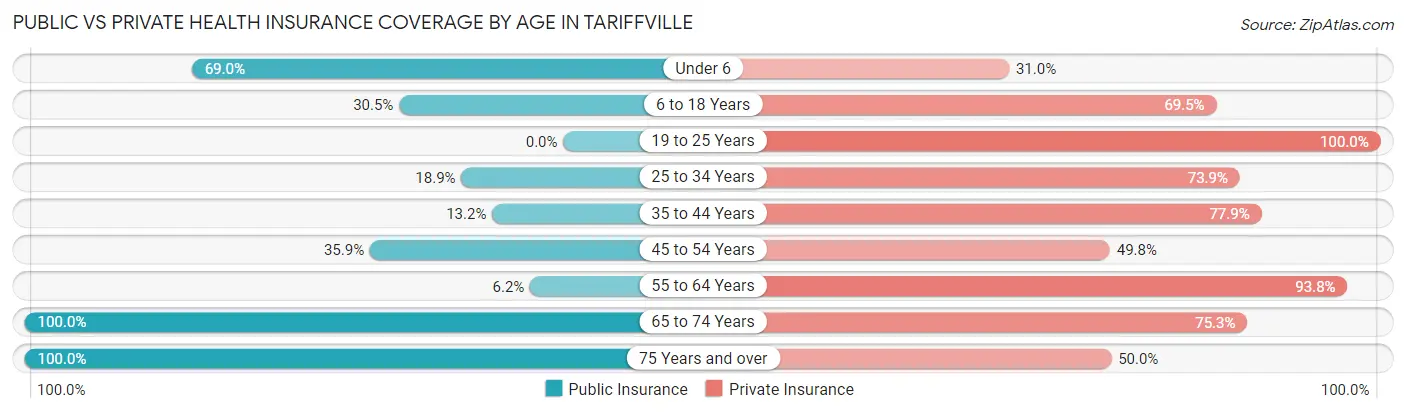
| Age Bracket | Public Insurance | Private Insurance |
| Under 6 | 40 (69.0%) | 18 (31.0%) |
| 6 to 18 Years | 103 (30.5%) | 235 (69.5%) |
| 19 to 25 Years | 0 (0.0%) | 146 (100.0%) |
| 25 to 34 Years | 42 (18.9%) | 164 (73.9%) |
| 35 to 44 Years | 40 (13.2%) | 236 (77.9%) |
| 45 to 54 Years | 145 (35.9%) | 201 (49.7%) |
| 55 to 64 Years | 13 (6.2%) | 198 (93.8%) |
| 65 to 74 Years | 97 (100.0%) | 73 (75.3%) |
| 75 Years and over | 24 (100.0%) | 12 (50.0%) |
| Total | 504 (28.0%) | 1,283 (71.2%) |
Disability Status by Sex by Age in Tariffville
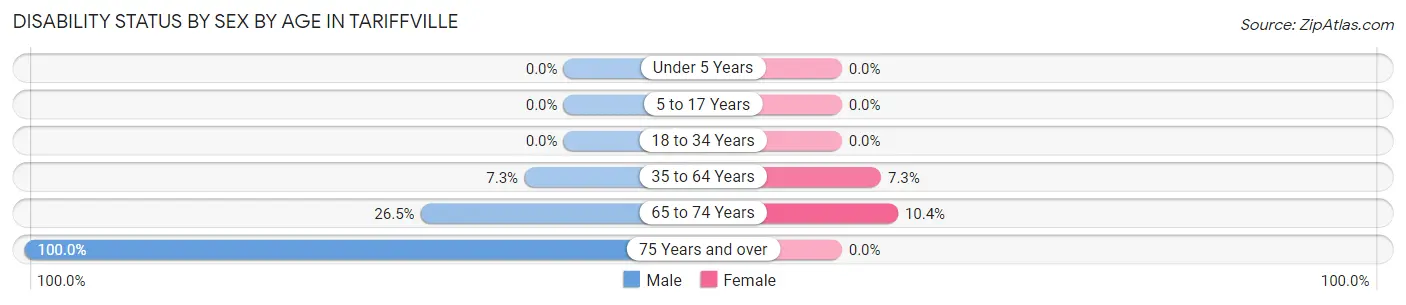
| Age Bracket | Male | Female |
| Under 5 Years | 0 (0.0%) | 0 (0.0%) |
| 5 to 17 Years | 0 (0.0%) | 0 (0.0%) |
| 18 to 34 Years | 0 (0.0%) | 0 (0.0%) |
| 35 to 64 Years | 40 (7.3%) | 27 (7.3%) |
| 65 to 74 Years | 13 (26.5%) | 5 (10.4%) |
| 75 Years and over | 12 (100.0%) | 0 (0.0%) |
Disability Class by Sex by Age in Tariffville
Disability Class: Hearing Difficulty
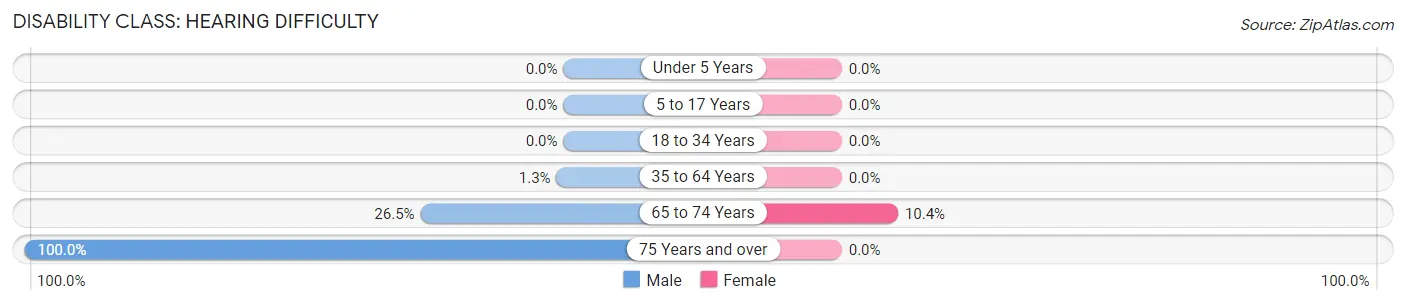
| Age Bracket | Male | Female |
| Under 5 Years | 0 (0.0%) | 0 (0.0%) |
| 5 to 17 Years | 0 (0.0%) | 0 (0.0%) |
| 18 to 34 Years | 0 (0.0%) | 0 (0.0%) |
| 35 to 64 Years | 7 (1.3%) | 0 (0.0%) |
| 65 to 74 Years | 13 (26.5%) | 5 (10.4%) |
| 75 Years and over | 12 (100.0%) | 0 (0.0%) |
Disability Class: Vision Difficulty
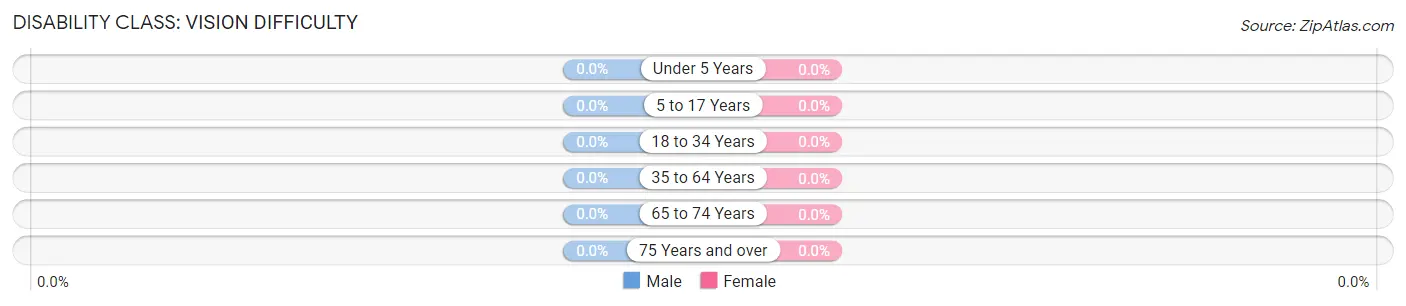
| Age Bracket | Male | Female |
| Under 5 Years | 0 (0.0%) | 0 (0.0%) |
| 5 to 17 Years | 0 (0.0%) | 0 (0.0%) |
| 18 to 34 Years | 0 (0.0%) | 0 (0.0%) |
| 35 to 64 Years | 0 (0.0%) | 0 (0.0%) |
| 65 to 74 Years | 0 (0.0%) | 0 (0.0%) |
| 75 Years and over | 0 (0.0%) | 0 (0.0%) |
Disability Class: Cognitive Difficulty
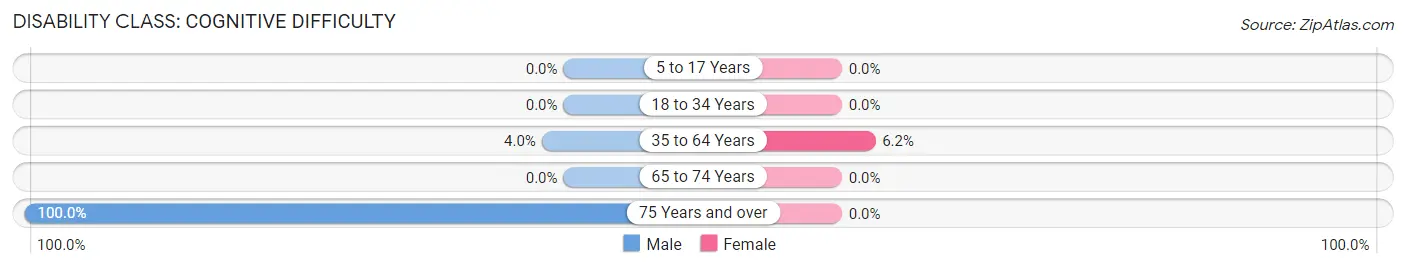
| Age Bracket | Male | Female |
| 5 to 17 Years | 0 (0.0%) | 0 (0.0%) |
| 18 to 34 Years | 0 (0.0%) | 0 (0.0%) |
| 35 to 64 Years | 22 (4.0%) | 23 (6.2%) |
| 65 to 74 Years | 0 (0.0%) | 0 (0.0%) |
| 75 Years and over | 12 (100.0%) | 0 (0.0%) |
Disability Class: Ambulatory Difficulty
| Age Bracket | Male | Female |
| 5 to 17 Years | 0 (0.0%) | 0 (0.0%) |
| 18 to 34 Years | 0 (0.0%) | 0 (0.0%) |
| 35 to 64 Years | 11 (2.0%) | 18 (4.9%) |
| 65 to 74 Years | 0 (0.0%) | 0 (0.0%) |
| 75 Years and over | 0 (0.0%) | 0 (0.0%) |
Disability Class: Self-Care Difficulty
| Age Bracket | Male | Female |
| 5 to 17 Years | 0 (0.0%) | 0 (0.0%) |
| 18 to 34 Years | 0 (0.0%) | 0 (0.0%) |
| 35 to 64 Years | 0 (0.0%) | 0 (0.0%) |
| 65 to 74 Years | 0 (0.0%) | 0 (0.0%) |
| 75 Years and over | 0 (0.0%) | 0 (0.0%) |
Technology Access in Tariffville
Computing Device Access in Tariffville
| Device Type | # Households | % Households |
| Desktop or Laptop | 493 | 76.9% |
| Smartphone | 596 | 93.0% |
| Tablet | 425 | 66.3% |
| No Computing Device | 0 | 0.0% |
| Total | 641 | 100.0% |
Internet Access in Tariffville
| Internet Type | # Households | % Households |
| Dial-Up Internet | 11 | 1.7% |
| Broadband Home | 534 | 83.3% |
| Cellular Data Only | 44 | 6.9% |
| Satellite Internet | 0 | 0.0% |
| No Internet | 52 | 8.1% |
| Total | 641 | 100.0% |
Tariffville Summary
Tariffville, Connecticut is a small village located in the town of Simsbury, Connecticut. It is situated on the Farmington River, and is part of the Hartford metropolitan area. The village is home to approximately 1,000 people, and is known for its historic buildings, scenic views, and recreational activities.
History
The area that is now Tariffville was originally inhabited by the Tunxis Native American tribe. The first European settlers arrived in the area in the late 17th century, and the village was officially incorporated in 1835. The village was named after the Tariff family, who were among the first settlers in the area.
The village was an important center of industry in the 19th century, with several mills and factories located along the Farmington River. The village was also home to a number of inns and taverns, which served as popular gathering places for locals and travelers alike.
Geography
Tariffville is located in the town of Simsbury, Connecticut, in the Farmington Valley region of the state. The village is situated on the banks of the Farmington River, and is bordered by the towns of Avon, Bloomfield, and East Granby. The village is located approximately 15 miles north of Hartford, and is accessible via Interstate 91 and Route 10.
The village is located in a rural area, and is surrounded by rolling hills and forests. The village is home to several parks and recreational areas, including the Tariffville Gorge State Park, which offers hiking, fishing, and camping opportunities.
Economy
The economy of Tariffville is largely based on tourism and recreation. The village is home to several inns and bed and breakfasts, which attract visitors from all over the state. The village is also home to several restaurants, shops, and other businesses, which cater to both locals and visitors.
The village is also home to several small businesses, including a number of manufacturing and industrial companies. The village is also home to a number of farms, which produce a variety of crops and livestock.
Demographics
As of the 2010 census, the population of Tariffville was 1,000. The racial makeup of the village was 94.2% White, 1.7% African American, 0.3% Native American, 1.2% Asian, 0.1% Pacific Islander, and 2.5% from other races. The median household income was $68,750, and the median family income was $76,250.
The village is home to a number of churches, including the First Congregational Church of Tariffville, which was founded in 1835. The village is also home to a number of schools, including the Tariffville Elementary School, which serves students in grades K-5.
Conclusion
Tariffville, Connecticut is a small village located in the town of Simsbury, Connecticut. It is situated on the banks of the Farmington River, and is known for its historic buildings, scenic views, and recreational activities. The village is home to approximately 1,000 people, and is largely supported by tourism and recreation. The village is home to several inns and bed and breakfasts, as well as a number of small businesses, farms, and manufacturing and industrial companies. The village is also home to a number of churches and schools, and is a popular destination for visitors from all over the state.
Common Questions
What is Per Capita Income in Tariffville?
Per Capita income in Tariffville is $37,875.
What is the Median Family Income in Tariffville?
Median Family Income in Tariffville is $101,250.
What is the Median Household income in Tariffville?
Median Household Income in Tariffville is $83,607.
What is Income or Wage Gap in Tariffville?
Income or Wage Gap in Tariffville is 19.5%.
Women in Tariffville earn 80.5 cents for every dollar earned by a man.
What is Inequality or Gini Index in Tariffville?
Inequality or Gini Index in Tariffville is 0.36.
What is the Total Population of Tariffville?
Total Population of Tariffville is 1,803.
What is the Total Male Population of Tariffville?
Total Male Population of Tariffville is 925.
What is the Total Female Population of Tariffville?
Total Female Population of Tariffville is 878.
What is the Ratio of Males per 100 Females in Tariffville?
There are 105.35 Males per 100 Females in Tariffville.
What is the Ratio of Females per 100 Males in Tariffville?
There are 94.92 Females per 100 Males in Tariffville.
What is the Median Population Age in Tariffville?
Median Population Age in Tariffville is 37.9 Years.
What is the Average Family Size in Tariffville
Average Family Size in Tariffville is 3.2 People.
What is the Average Household Size in Tariffville
Average Household Size in Tariffville is 2.8 People.
How Large is the Labor Force in Tariffville?
There are 1,271 People in the Labor Forcein in Tariffville.
What is the Percentage of People in the Labor Force in Tariffville?
83.1% of People are in the Labor Force in Tariffville.
What is the Unemployment Rate in Tariffville?
Unemployment Rate in Tariffville is 14.7%.