Trappe borough, PA Map & Demographics
Trappe borough Overview
$59,097
PER CAPITA INCOME
$139,688
AVG FAMILY INCOME
$111,875
AVG HOUSEHOLD INCOME
22.7%
WAGE / INCOME GAP [ % ]
77.3¢/ $1
WAGE / INCOME GAP [ $ ]
0.40
INEQUALITY / GINI INDEX
3,976
TOTAL POPULATION
1,808
MALE POPULATION
2,168
FEMALE POPULATION
83.39
MALES / 100 FEMALES
119.91
FEMALES / 100 MALES
41.1
MEDIAN AGE
2.9
AVG FAMILY SIZE
2.5
AVG HOUSEHOLD SIZE
2,536
LABOR FORCE [ PEOPLE ]
73.6%
PERCENT IN LABOR FORCE
1.6%
UNEMPLOYMENT RATE
Income in Trappe borough
Income Overview in Trappe borough
Per Capita Income in Trappe borough is $59,097, while median incomes of families and households are $139,688 and $111,875 respectively.
| Characteristic | Number | Measure |
| Per Capita Income | 3,976 | $59,097 |
| Median Family Income | 1,175 | $139,688 |
| Mean Family Income | 1,175 | $173,674 |
| Median Household Income | 1,591 | $111,875 |
| Mean Household Income | 1,591 | $146,169 |
| Income Deficit | 1,175 | $0 |
| Wage / Income Gap (%) | 3,976 | 22.73% |
| Wage / Income Gap ($) | 3,976 | 77.27¢ per $1 |
| Gini / Inequality Index | 3,976 | 0.40 |
Earnings by Sex in Trappe borough
Average Earnings in Trappe borough are $53,255, $59,954 for men and $46,329 for women, a difference of 22.7%.
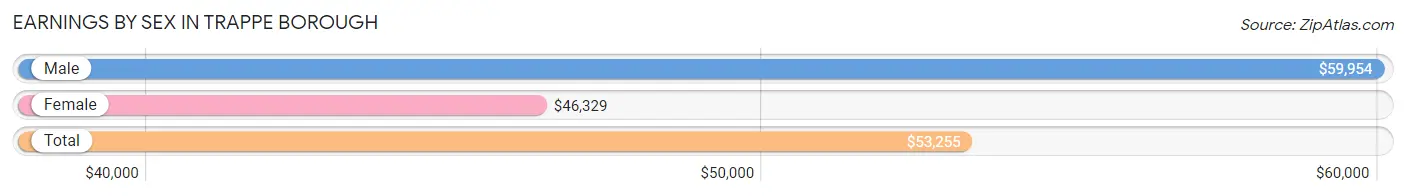
| Sex | Number | Average Earnings |
| Male | 1,199 (43.9%) | $59,954 |
| Female | 1,531 (56.1%) | $46,329 |
| Total | 2,730 (100.0%) | $53,255 |
Earnings by Sex by Income Bracket in Trappe borough
The most common earnings brackets in Trappe borough are $100,000+ for men (438 | 36.5%) and $100,000+ for women (311 | 20.3%).
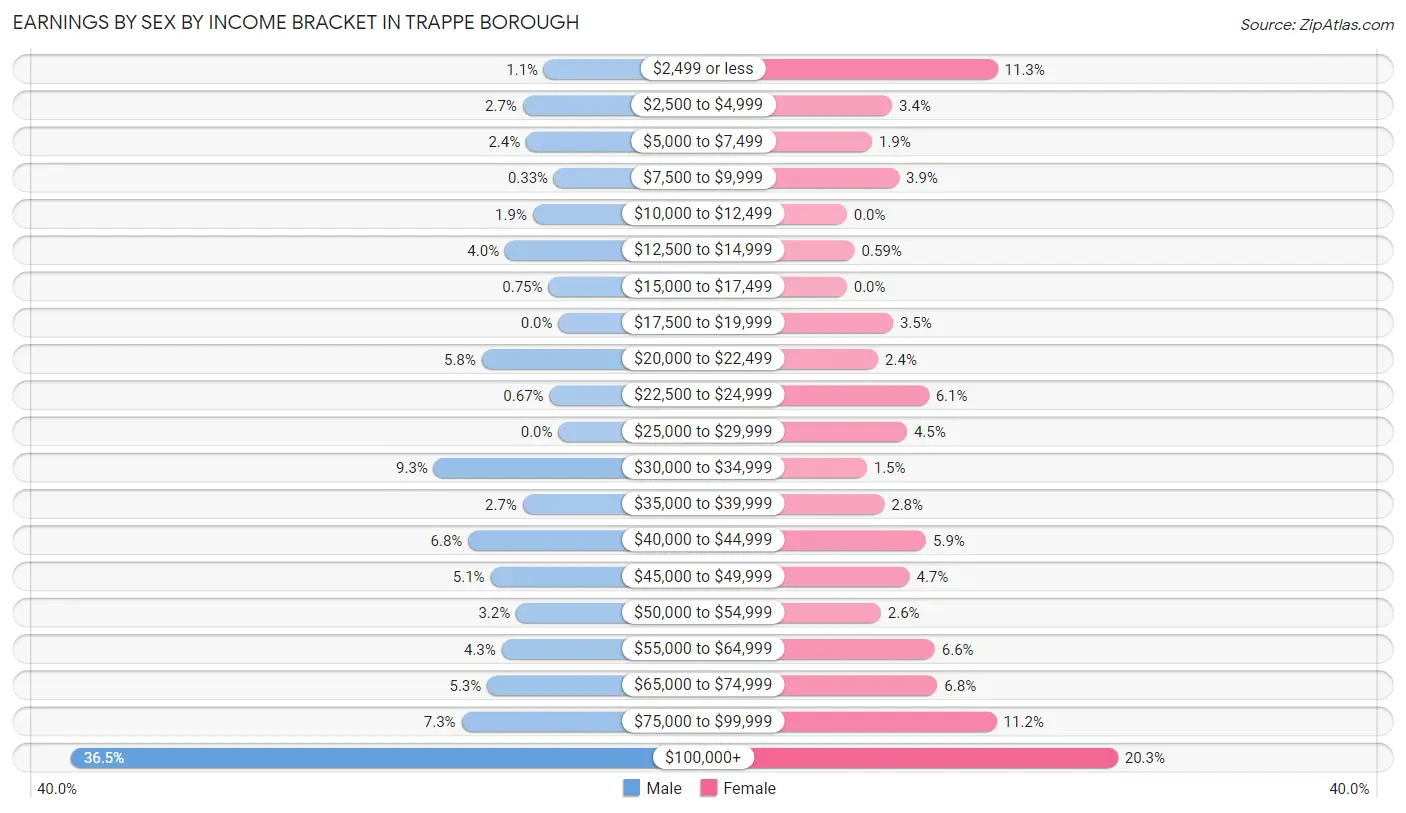
| Income | Male | Female |
| $2,499 or less | 13 (1.1%) | 173 (11.3%) |
| $2,500 to $4,999 | 32 (2.7%) | 52 (3.4%) |
| $5,000 to $7,499 | 29 (2.4%) | 29 (1.9%) |
| $7,500 to $9,999 | 4 (0.3%) | 60 (3.9%) |
| $10,000 to $12,499 | 23 (1.9%) | 0 (0.0%) |
| $12,500 to $14,999 | 48 (4.0%) | 9 (0.6%) |
| $15,000 to $17,499 | 9 (0.7%) | 0 (0.0%) |
| $17,500 to $19,999 | 0 (0.0%) | 53 (3.5%) |
| $20,000 to $22,499 | 69 (5.8%) | 36 (2.4%) |
| $22,500 to $24,999 | 8 (0.7%) | 94 (6.1%) |
| $25,000 to $29,999 | 0 (0.0%) | 69 (4.5%) |
| $30,000 to $34,999 | 112 (9.3%) | 23 (1.5%) |
| $35,000 to $39,999 | 32 (2.7%) | 43 (2.8%) |
| $40,000 to $44,999 | 81 (6.8%) | 91 (5.9%) |
| $45,000 to $49,999 | 61 (5.1%) | 72 (4.7%) |
| $50,000 to $54,999 | 38 (3.2%) | 39 (2.5%) |
| $55,000 to $64,999 | 51 (4.3%) | 101 (6.6%) |
| $65,000 to $74,999 | 64 (5.3%) | 104 (6.8%) |
| $75,000 to $99,999 | 87 (7.3%) | 172 (11.2%) |
| $100,000+ | 438 (36.5%) | 311 (20.3%) |
| Total | 1,199 (100.0%) | 1,531 (100.0%) |
Earnings by Sex by Educational Attainment in Trappe borough
Average earnings in Trappe borough are $72,206 for men and $59,038 for women, a difference of 18.2%. Men with an educational attainment of graduate degree enjoy the highest average annual earnings of $115,188, while those with college or associate's degree education earn the least with $36,250. Women with an educational attainment of bachelor's degree earn the most with the average annual earnings of $94,531, while those with college or associate's degree education have the smallest earnings of $42,386.
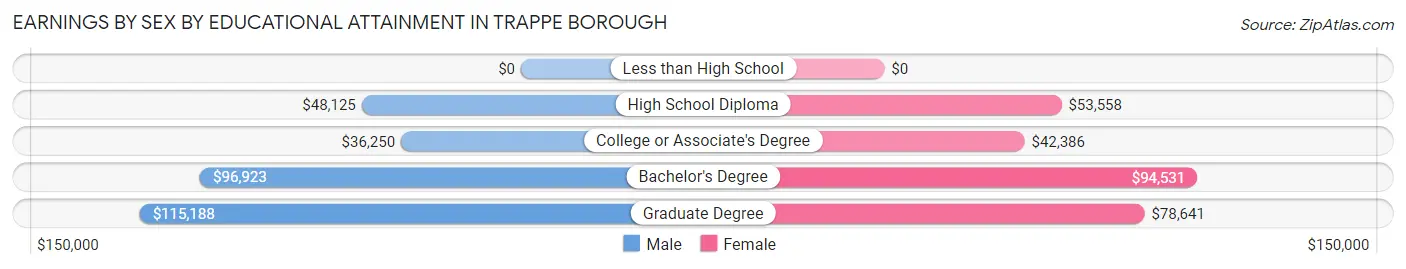
| Educational Attainment | Male Income | Female Income |
| Less than High School | - | - |
| High School Diploma | $48,125 | $53,558 |
| College or Associate's Degree | $36,250 | $42,386 |
| Bachelor's Degree | $96,923 | $94,531 |
| Graduate Degree | $115,188 | $78,641 |
| Total | $72,206 | $59,038 |
Family Income in Trappe borough
Family Income Brackets in Trappe borough
According to the Trappe borough family income data, there are 378 families falling into the $200,000+ income range, which is the most common income bracket and makes up 32.2% of all families. Conversely, the $10,000 to $14,999 income bracket is the least frequent group with only 9 families (0.8%) belonging to this category.
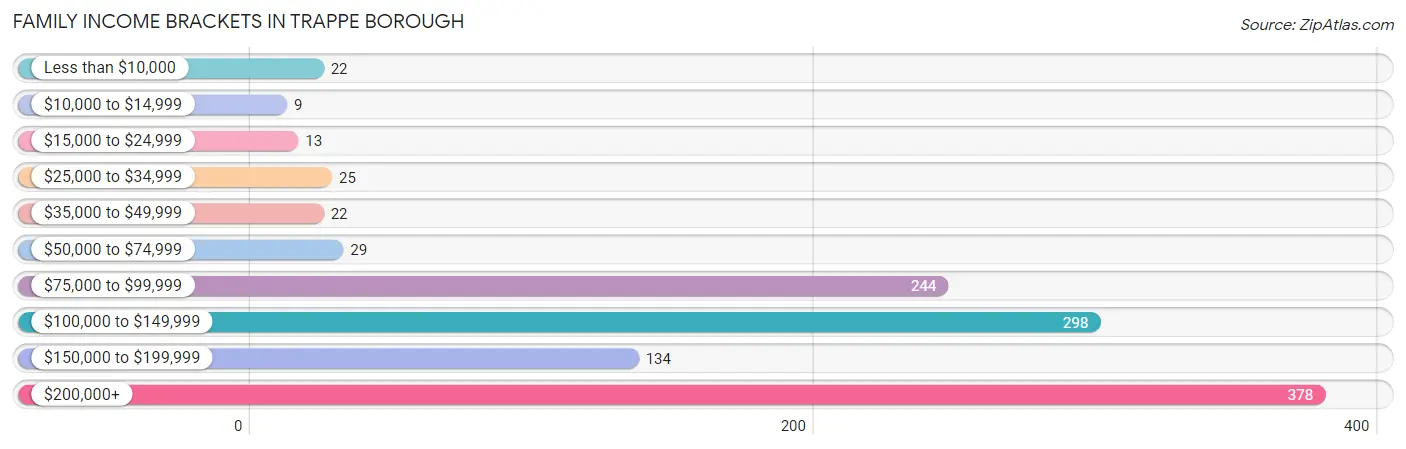
| Income Bracket | # Families | % Families |
| Less than $10,000 | 22 | 1.9% |
| $10,000 to $14,999 | 9 | 0.8% |
| $15,000 to $24,999 | 13 | 1.1% |
| $25,000 to $34,999 | 25 | 2.1% |
| $35,000 to $49,999 | 22 | 1.9% |
| $50,000 to $74,999 | 29 | 2.5% |
| $75,000 to $99,999 | 244 | 20.8% |
| $100,000 to $149,999 | 298 | 25.4% |
| $150,000 to $199,999 | 134 | 11.4% |
| $200,000+ | 378 | 32.2% |
Family Income by Famaliy Size in Trappe borough
5-person families (90 | 7.7%) account for the highest median family income in Trappe borough with $234,439 per family, while 2-person families (630 | 53.6%) have the highest median income of $54,432 per family member.
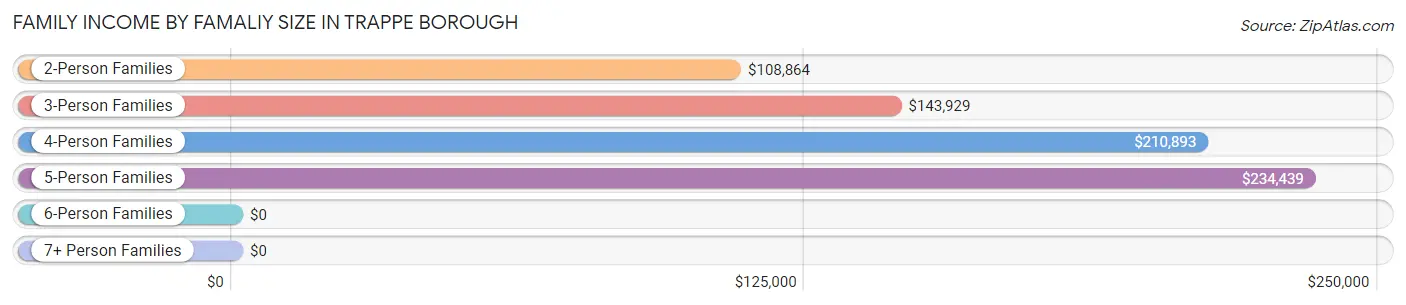
| Income Bracket | # Families | Median Income |
| 2-Person Families | 630 (53.6%) | $108,864 |
| 3-Person Families | 228 (19.4%) | $143,929 |
| 4-Person Families | 205 (17.4%) | $210,893 |
| 5-Person Families | 90 (7.7%) | $234,439 |
| 6-Person Families | 22 (1.9%) | $0 |
| 7+ Person Families | 0 (0.0%) | $0 |
| Total | 1,175 (100.0%) | $139,688 |
Family Income by Number of Earners in Trappe borough
The median family income in Trappe borough is $139,688, with families comprising 3+ earners (205) having the highest median family income of $250,001, while families with no earners (115) have the lowest median family income of $83,467, accounting for 17.4% and 9.8% of families, respectively.
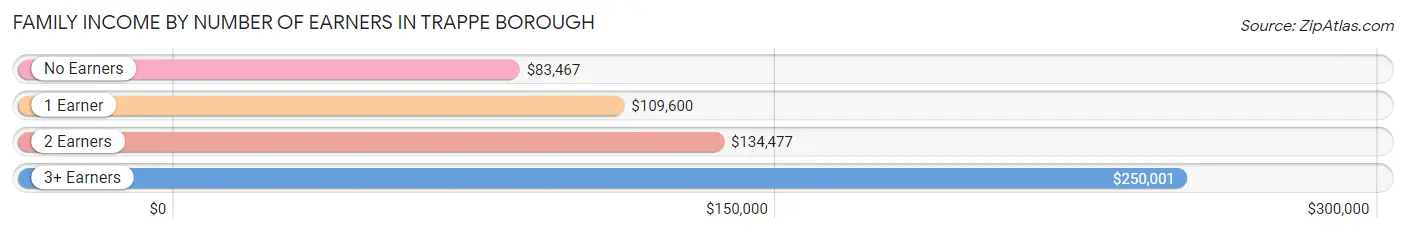
| Number of Earners | # Families | Median Income |
| No Earners | 115 (9.8%) | $83,467 |
| 1 Earner | 220 (18.7%) | $109,600 |
| 2 Earners | 635 (54.0%) | $134,477 |
| 3+ Earners | 205 (17.4%) | $250,001 |
| Total | 1,175 (100.0%) | $139,688 |
Household Income in Trappe borough
Household Income Brackets in Trappe borough
With 379 households falling in the category, the $200,000+ income range is the most frequent in Trappe borough, accounting for 23.8% of all households. In contrast, only 25 households (1.6%) fall into the $25,000 to $34,999 income bracket, making it the least populous group.
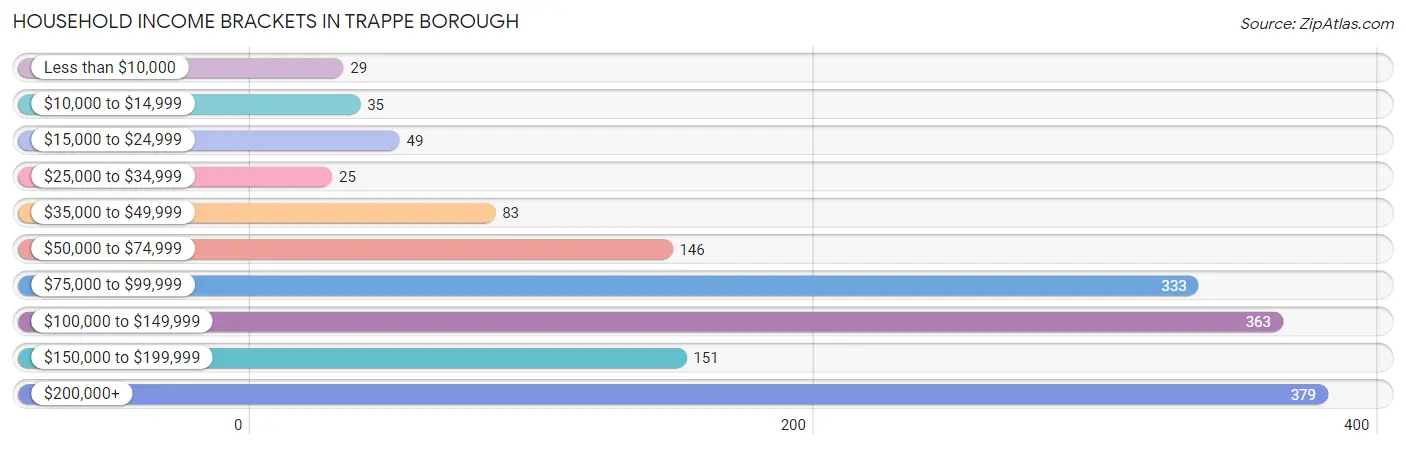
| Income Bracket | # Households | % Households |
| Less than $10,000 | 29 | 1.8% |
| $10,000 to $14,999 | 35 | 2.2% |
| $15,000 to $24,999 | 49 | 3.1% |
| $25,000 to $34,999 | 25 | 1.6% |
| $35,000 to $49,999 | 83 | 5.2% |
| $50,000 to $74,999 | 146 | 9.2% |
| $75,000 to $99,999 | 333 | 20.9% |
| $100,000 to $149,999 | 363 | 22.8% |
| $150,000 to $199,999 | 151 | 9.5% |
| $200,000+ | 379 | 23.8% |
Household Income by Householder Age in Trappe borough
The median household income in Trappe borough is $111,875, with the highest median household income of $143,472 found in the 45 to 64 years age bracket for the primary householder. A total of 605 households (38.0%) fall into this category. Meanwhile, the 15 to 24 years age bracket for the primary householder has the lowest median household income of $0, with 13 households (0.8%) in this group.
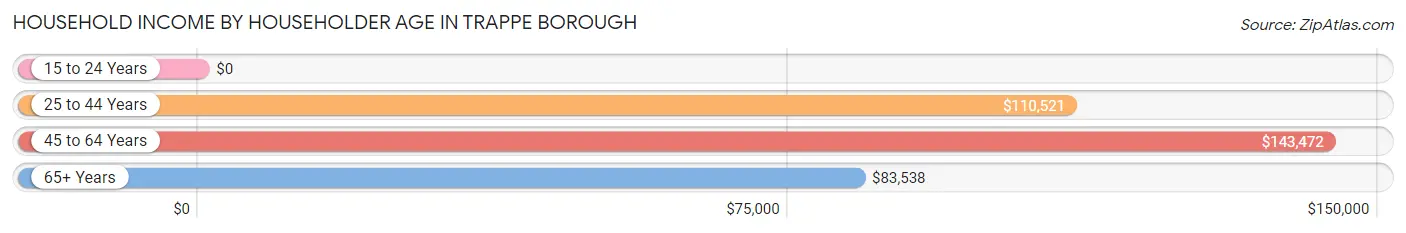
| Income Bracket | # Households | Median Income |
| 15 to 24 Years | 13 (0.8%) | $0 |
| 25 to 44 Years | 641 (40.3%) | $110,521 |
| 45 to 64 Years | 605 (38.0%) | $143,472 |
| 65+ Years | 332 (20.9%) | $83,538 |
| Total | 1,591 (100.0%) | $111,875 |
Poverty in Trappe borough
Income Below Poverty by Sex and Age in Trappe borough
With 3.5% poverty level for males and 4.2% for females among the residents of Trappe borough, 12 to 14 year old males and 6 to 11 year old females are the most vulnerable to poverty, with 14 males (17.5%) and 16 females (22.9%) in their respective age groups living below the poverty level.
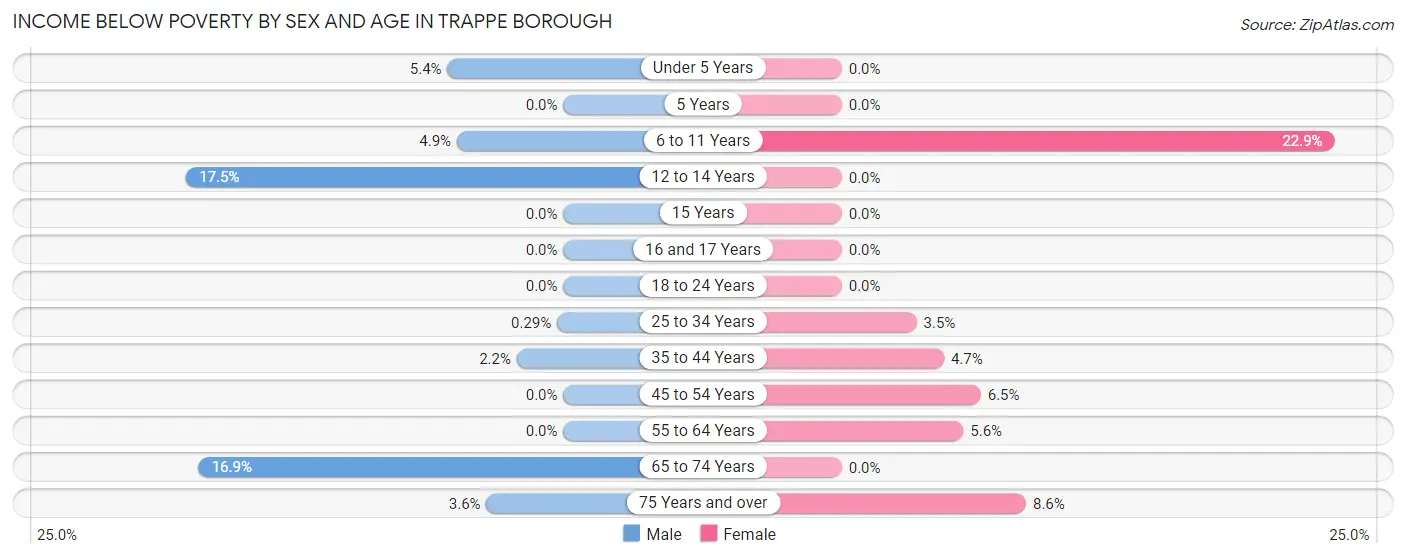
| Age Bracket | Male | Female |
| Under 5 Years | 5 (5.4%) | 0 (0.0%) |
| 5 Years | 0 (0.0%) | 0 (0.0%) |
| 6 to 11 Years | 4 (4.9%) | 16 (22.9%) |
| 12 to 14 Years | 14 (17.5%) | 0 (0.0%) |
| 15 Years | 0 (0.0%) | 0 (0.0%) |
| 16 and 17 Years | 0 (0.0%) | 0 (0.0%) |
| 18 to 24 Years | 0 (0.0%) | 0 (0.0%) |
| 25 to 34 Years | 1 (0.3%) | 12 (3.5%) |
| 35 to 44 Years | 4 (2.2%) | 17 (4.7%) |
| 45 to 54 Years | 0 (0.0%) | 18 (6.5%) |
| 55 to 64 Years | 0 (0.0%) | 19 (5.6%) |
| 65 to 74 Years | 33 (16.9%) | 0 (0.0%) |
| 75 Years and over | 3 (3.6%) | 10 (8.6%) |
| Total | 64 (3.5%) | 92 (4.2%) |
Income Above Poverty by Sex and Age in Trappe borough
According to the poverty statistics in Trappe borough, males aged 5 years and females aged under 5 years are the age groups that are most secure financially, with 100.0% of males and 100.0% of females in these age groups living above the poverty line.
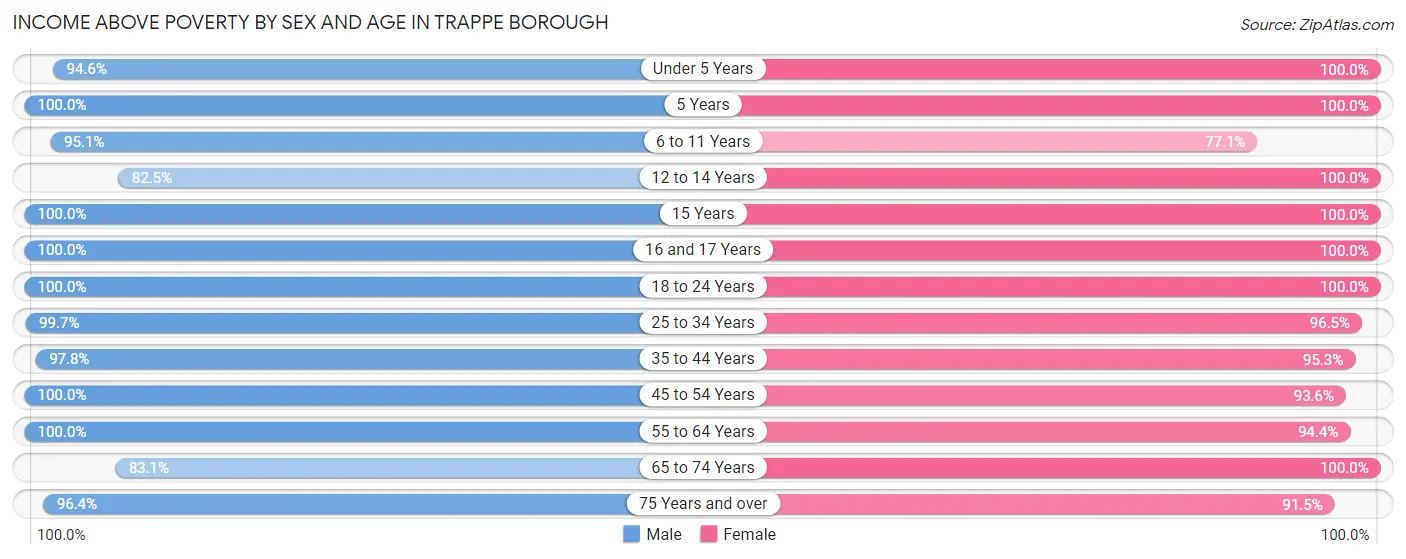
| Age Bracket | Male | Female |
| Under 5 Years | 88 (94.6%) | 63 (100.0%) |
| 5 Years | 9 (100.0%) | 29 (100.0%) |
| 6 to 11 Years | 77 (95.1%) | 54 (77.1%) |
| 12 to 14 Years | 66 (82.5%) | 58 (100.0%) |
| 15 Years | 18 (100.0%) | 30 (100.0%) |
| 16 and 17 Years | 67 (100.0%) | 152 (100.0%) |
| 18 to 24 Years | 109 (100.0%) | 176 (100.0%) |
| 25 to 34 Years | 348 (99.7%) | 334 (96.5%) |
| 35 to 44 Years | 181 (97.8%) | 342 (95.3%) |
| 45 to 54 Years | 216 (100.0%) | 261 (93.5%) |
| 55 to 64 Years | 322 (100.0%) | 318 (94.4%) |
| 65 to 74 Years | 162 (83.1%) | 152 (100.0%) |
| 75 Years and over | 81 (96.4%) | 107 (91.4%) |
| Total | 1,744 (96.5%) | 2,076 (95.8%) |
Income Below Poverty Among Married-Couple Families in Trappe borough
The poverty statistics for married-couple families in Trappe borough show that 1.4% or 14 of the total 995 families live below the poverty line. Families with no children have the highest poverty rate of 1.5%, comprising of 9 families. On the other hand, families with 3 or 4 children have the lowest poverty rate of 0.0%, which includes 0 families.
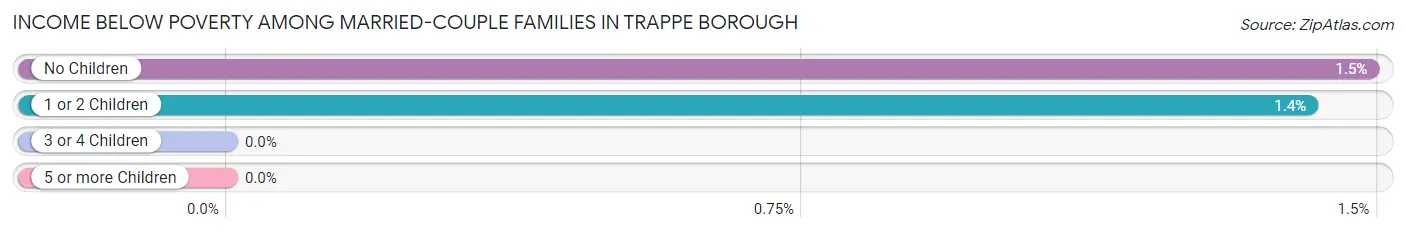
| Children | Above Poverty | Below Poverty |
| No Children | 594 (98.5%) | 9 (1.5%) |
| 1 or 2 Children | 350 (98.6%) | 5 (1.4%) |
| 3 or 4 Children | 37 (100.0%) | 0 (0.0%) |
| 5 or more Children | 0 (0.0%) | 0 (0.0%) |
| Total | 981 (98.6%) | 14 (1.4%) |
Income Below Poverty Among Single-Parent Households in Trappe borough
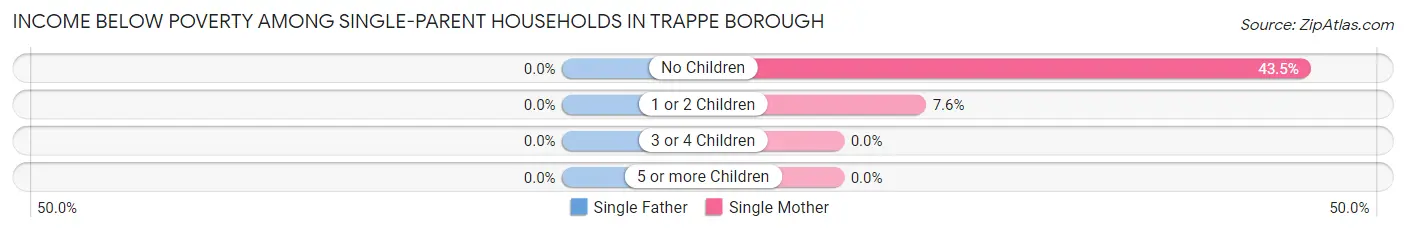
| Children | Single Father | Single Mother |
| No Children | 0 (0.0%) | 10 (43.5%) |
| 1 or 2 Children | 0 (0.0%) | 12 (7.6%) |
| 3 or 4 Children | 0 (0.0%) | 0 (0.0%) |
| 5 or more Children | 0 (0.0%) | 0 (0.0%) |
| Total | 0 (0.0%) | 22 (12.2%) |
Income Below Poverty Among Married-Couple vs Single-Parent Households in Trappe borough
The poverty data for Trappe borough shows that 14 of the married-couple family households (1.4%) and 22 of the single-parent households (12.2%) are living below the poverty level. Within the married-couple family households, those with no children have the highest poverty rate, with 9 households (1.5%) falling below the poverty line. Among the single-parent households, those with no children have the highest poverty rate, with 10 household (43.5%) living below poverty.
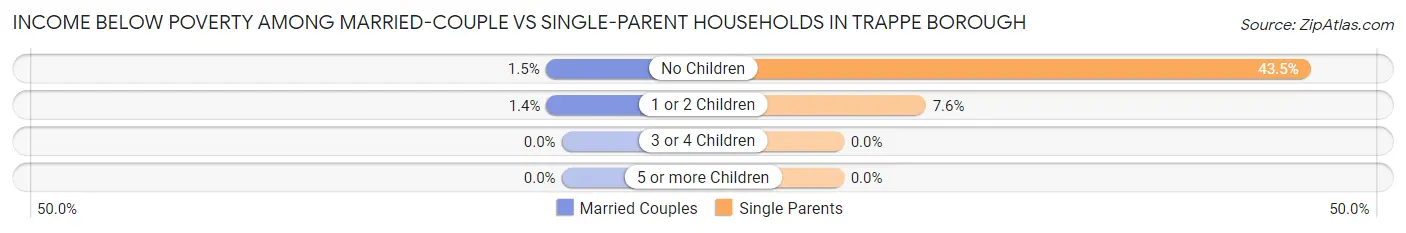
| Children | Married-Couple Families | Single-Parent Households |
| No Children | 9 (1.5%) | 10 (43.5%) |
| 1 or 2 Children | 5 (1.4%) | 12 (7.6%) |
| 3 or 4 Children | 0 (0.0%) | 0 (0.0%) |
| 5 or more Children | 0 (0.0%) | 0 (0.0%) |
| Total | 14 (1.4%) | 22 (12.2%) |
Race in Trappe borough
The most populous races in Trappe borough are White / Caucasian (3,336 | 83.9%), Hispanic or Latino (292 | 7.3%), and Black / African American (282 | 7.1%).
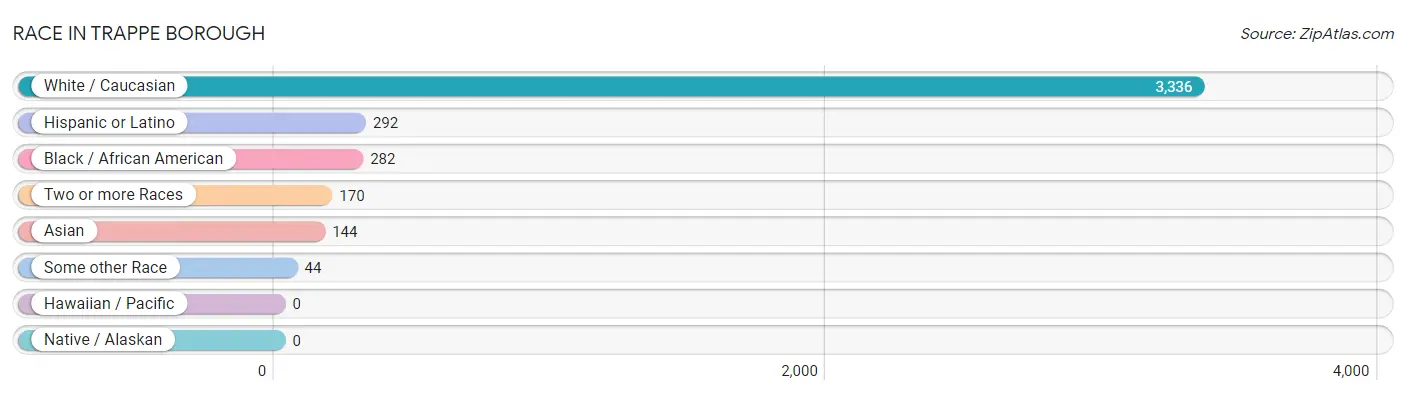
| Race | # Population | % Population |
| Asian | 144 | 3.6% |
| Black / African American | 282 | 7.1% |
| Hawaiian / Pacific | 0 | 0.0% |
| Hispanic or Latino | 292 | 7.3% |
| Native / Alaskan | 0 | 0.0% |
| White / Caucasian | 3,336 | 83.9% |
| Two or more Races | 170 | 4.3% |
| Some other Race | 44 | 1.1% |
| Total | 3,976 | 100.0% |
Ancestry in Trappe borough
The most populous ancestries reported in Trappe borough are German (893 | 22.5%), Irish (812 | 20.4%), Italian (647 | 16.3%), Polish (337 | 8.5%), and French (276 | 6.9%), together accounting for 74.6% of all Trappe borough residents.
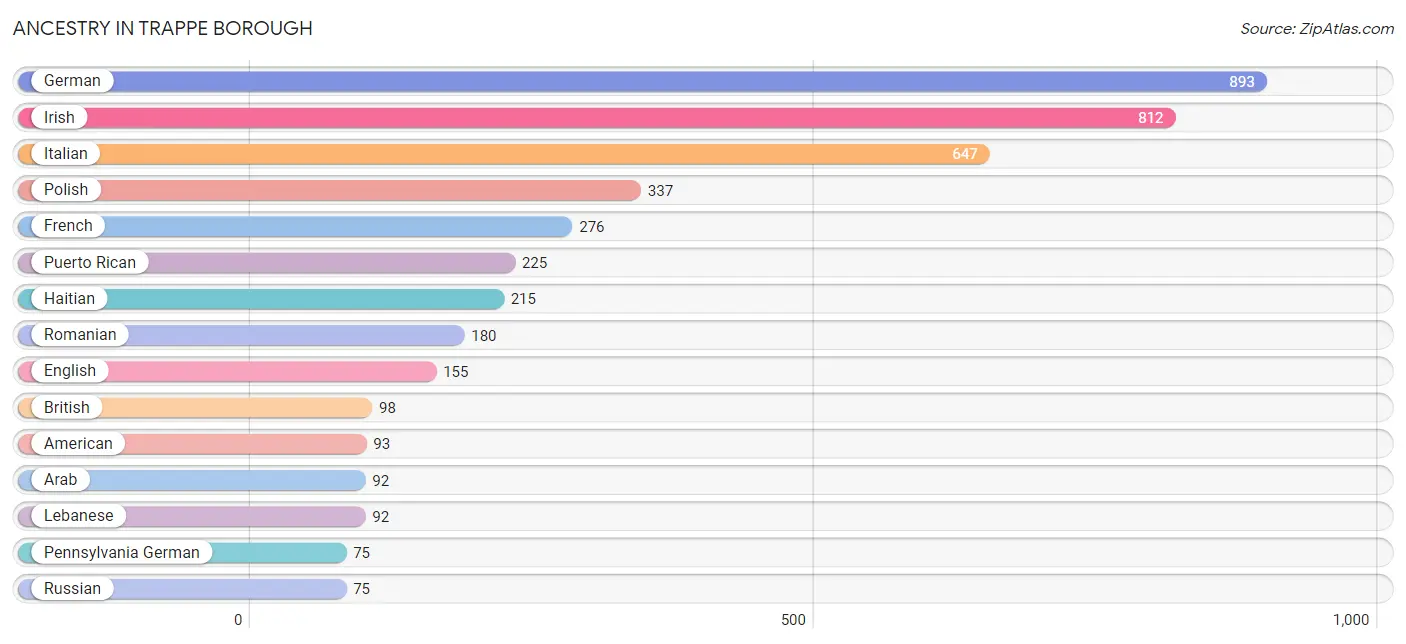
| Ancestry | # Population | % Population |
| Albanian | 24 | 0.6% |
| American | 93 | 2.3% |
| Arab | 92 | 2.3% |
| Austrian | 6 | 0.2% |
| Bhutanese | 12 | 0.3% |
| British | 98 | 2.5% |
| Canadian | 7 | 0.2% |
| Cuban | 16 | 0.4% |
| Czech | 49 | 1.2% |
| Czechoslovakian | 34 | 0.9% |
| Danish | 48 | 1.2% |
| Dutch | 13 | 0.3% |
| Eastern European | 40 | 1.0% |
| Ecuadorian | 42 | 1.1% |
| English | 155 | 3.9% |
| European | 61 | 1.5% |
| Filipino | 19 | 0.5% |
| French | 276 | 6.9% |
| French Canadian | 4 | 0.1% |
| German | 893 | 22.5% |
| Greek | 8 | 0.2% |
| Haitian | 215 | 5.4% |
| Hungarian | 17 | 0.4% |
| Indian (Asian) | 24 | 0.6% |
| Irish | 812 | 20.4% |
| Italian | 647 | 16.3% |
| Jamaican | 16 | 0.4% |
| Lebanese | 92 | 2.3% |
| Liberian | 9 | 0.2% |
| Lithuanian | 9 | 0.2% |
| Northern European | 8 | 0.2% |
| Norwegian | 8 | 0.2% |
| Pennsylvania German | 75 | 1.9% |
| Polish | 337 | 8.5% |
| Puerto Rican | 225 | 5.7% |
| Romanian | 180 | 4.5% |
| Russian | 75 | 1.9% |
| Scandinavian | 5 | 0.1% |
| Scotch-Irish | 21 | 0.5% |
| Scottish | 13 | 0.3% |
| Slovak | 29 | 0.7% |
| South American | 42 | 1.1% |
| Spaniard | 9 | 0.2% |
| Subsaharan African | 9 | 0.2% |
| Swedish | 47 | 1.2% |
| Swiss | 22 | 0.5% |
| Thai | 66 | 1.7% |
| Turkish | 11 | 0.3% |
| Ukrainian | 29 | 0.7% |
| Welsh | 40 | 1.0% |
| Yugoslavian | 10 | 0.3% | View All 51 Rows |
Immigrants in Trappe borough
The most numerous immigrant groups reported in Trappe borough came from Europe (249 | 6.3%), Eastern Europe (226 | 5.7%), Caribbean (176 | 4.4%), Latin America (176 | 4.4%), and Haiti (160 | 4.0%), together accounting for 24.8% of all Trappe borough residents.
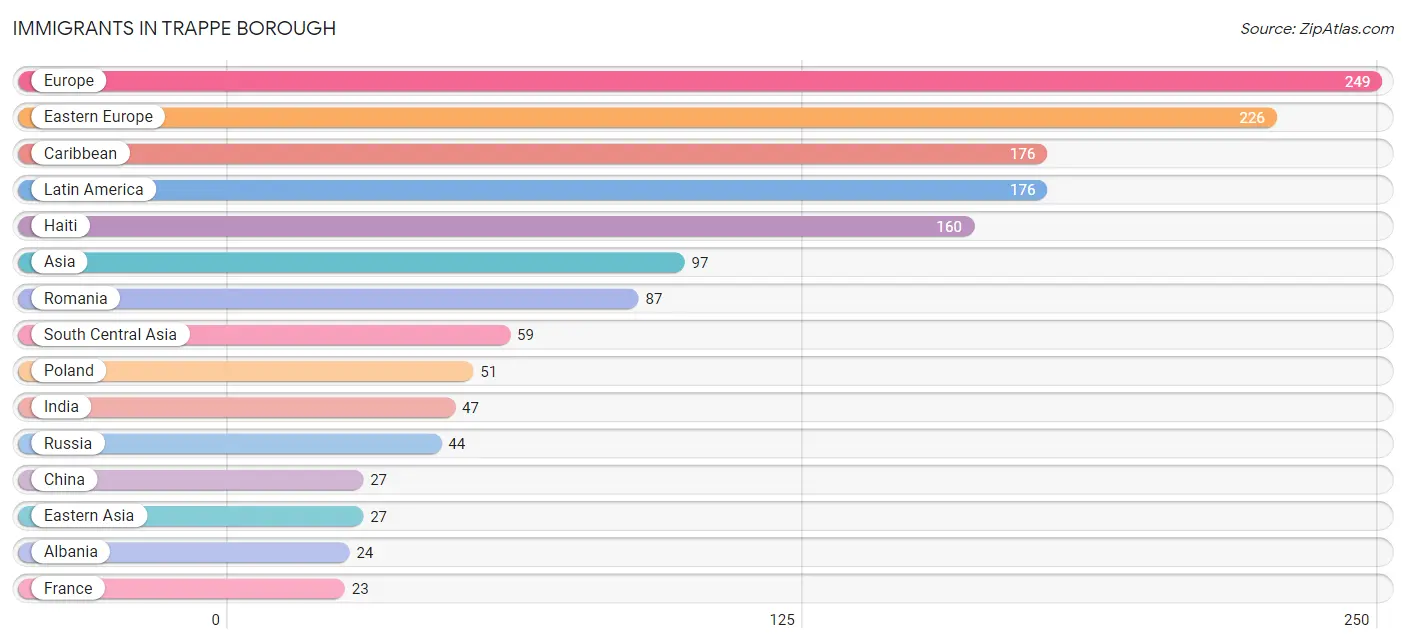
| Immigration Origin | # Population | % Population |
| Africa | 18 | 0.4% |
| Albania | 24 | 0.6% |
| Asia | 97 | 2.4% |
| Canada | 16 | 0.4% |
| Caribbean | 176 | 4.4% |
| China | 27 | 0.7% |
| Cuba | 9 | 0.2% |
| Czechoslovakia | 20 | 0.5% |
| Eastern Asia | 27 | 0.7% |
| Eastern Europe | 226 | 5.7% |
| Europe | 249 | 6.3% |
| France | 23 | 0.6% |
| Haiti | 160 | 4.0% |
| India | 47 | 1.2% |
| Jamaica | 7 | 0.2% |
| Latin America | 176 | 4.4% |
| Liberia | 18 | 0.4% |
| Pakistan | 12 | 0.3% |
| Poland | 51 | 1.3% |
| Romania | 87 | 2.2% |
| Russia | 44 | 1.1% |
| South Central Asia | 59 | 1.5% |
| Taiwan | 19 | 0.5% |
| Turkey | 11 | 0.3% |
| Western Africa | 18 | 0.4% |
| Western Asia | 11 | 0.3% |
| Western Europe | 23 | 0.6% | View All 27 Rows |
Sex and Age in Trappe borough
Sex and Age in Trappe borough
The most populous age groups in Trappe borough are 55 to 59 Years (256 | 14.2%) for men and 40 to 44 Years (247 | 11.4%) for women.
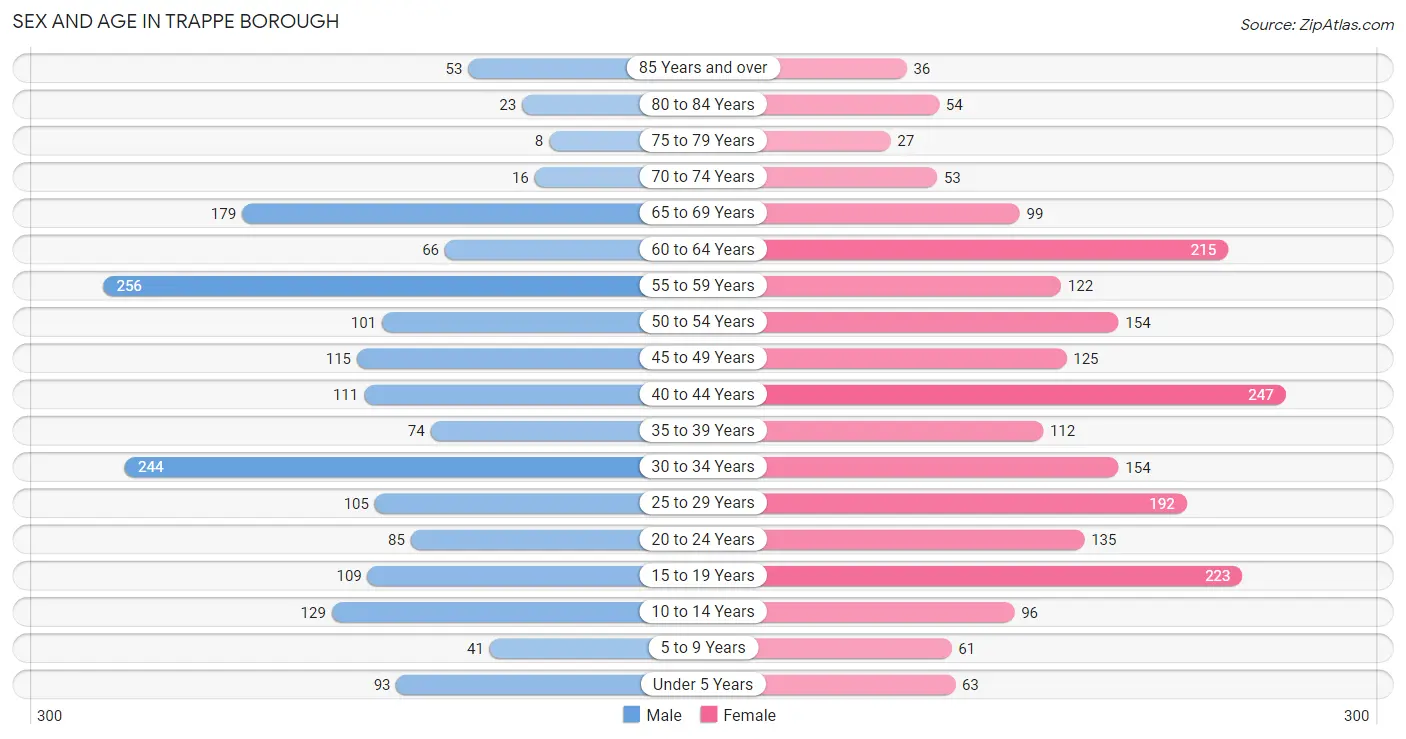
| Age Bracket | Male | Female |
| Under 5 Years | 93 (5.1%) | 63 (2.9%) |
| 5 to 9 Years | 41 (2.3%) | 61 (2.8%) |
| 10 to 14 Years | 129 (7.1%) | 96 (4.4%) |
| 15 to 19 Years | 109 (6.0%) | 223 (10.3%) |
| 20 to 24 Years | 85 (4.7%) | 135 (6.2%) |
| 25 to 29 Years | 105 (5.8%) | 192 (8.9%) |
| 30 to 34 Years | 244 (13.5%) | 154 (7.1%) |
| 35 to 39 Years | 74 (4.1%) | 112 (5.2%) |
| 40 to 44 Years | 111 (6.1%) | 247 (11.4%) |
| 45 to 49 Years | 115 (6.4%) | 125 (5.8%) |
| 50 to 54 Years | 101 (5.6%) | 154 (7.1%) |
| 55 to 59 Years | 256 (14.2%) | 122 (5.6%) |
| 60 to 64 Years | 66 (3.6%) | 215 (9.9%) |
| 65 to 69 Years | 179 (9.9%) | 99 (4.6%) |
| 70 to 74 Years | 16 (0.9%) | 53 (2.4%) |
| 75 to 79 Years | 8 (0.4%) | 27 (1.3%) |
| 80 to 84 Years | 23 (1.3%) | 54 (2.5%) |
| 85 Years and over | 53 (2.9%) | 36 (1.7%) |
| Total | 1,808 (100.0%) | 2,168 (100.0%) |
Families and Households in Trappe borough
Median Family Size in Trappe borough
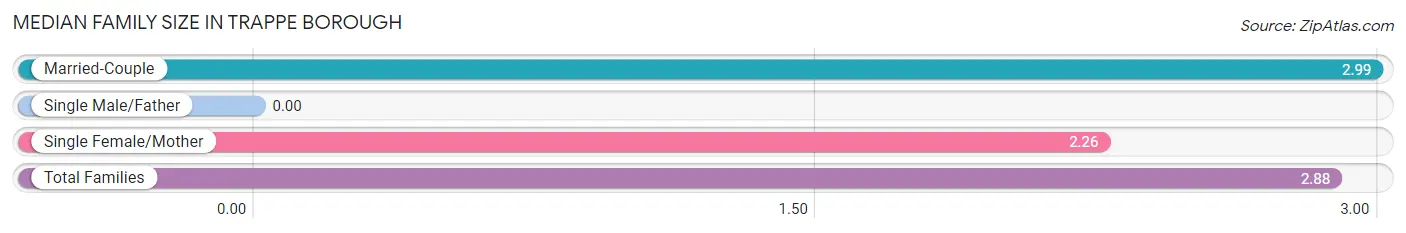
| Family Type | # Families | Family Size |
| Married-Couple | 995 (84.7%) | 2.99 |
| Single Male/Father | 0 (0.0%) | - |
| Single Female/Mother | 180 (15.3%) | 2.26 |
| Total Families | 1,175 (100.0%) | 2.88 |
Median Household Size in Trappe borough
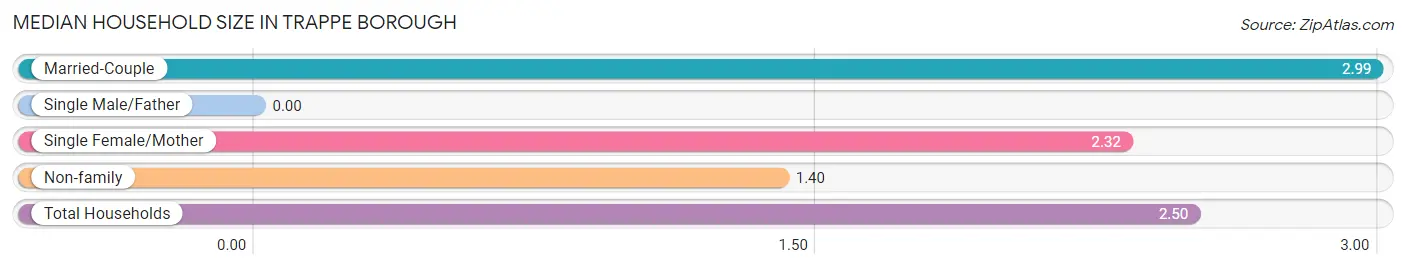
| Household Type | # Households | Household Size |
| Married-Couple | 995 (62.5%) | 2.99 |
| Single Male/Father | 0 (0.0%) | - |
| Single Female/Mother | 180 (11.3%) | 2.32 |
| Non-family | 416 (26.2%) | 1.40 |
| Total Households | 1,591 (100.0%) | 2.50 |
Household Size by Marriage Status in Trappe borough
Out of a total of 1,591 households in Trappe borough, 1,175 (73.9%) are family households, while 416 (26.2%) are nonfamily households. The most numerous type of family households are 2-person households, comprising 630, and the most common type of nonfamily households are 1-person households, comprising 267.
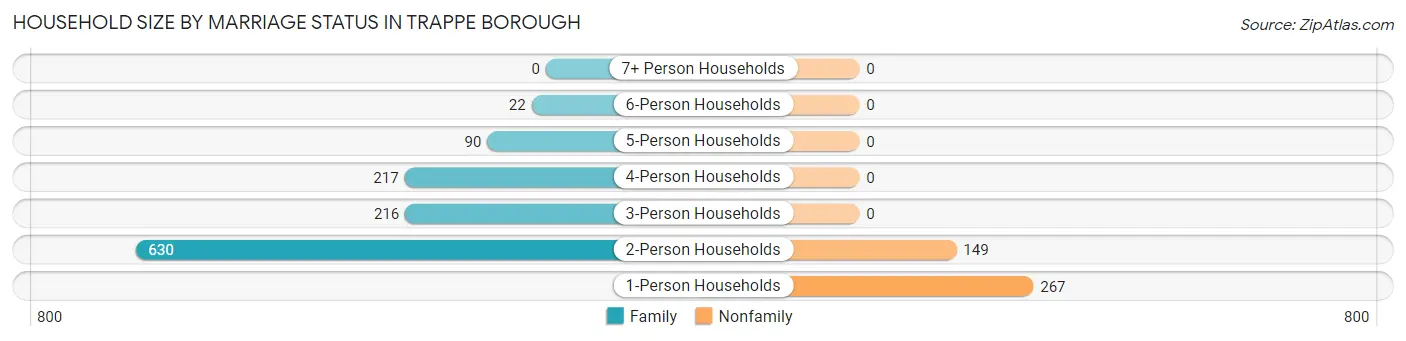
| Household Size | Family Households | Nonfamily Households |
| 1-Person Households | - | 267 (16.8%) |
| 2-Person Households | 630 (39.6%) | 149 (9.4%) |
| 3-Person Households | 216 (13.6%) | 0 (0.0%) |
| 4-Person Households | 217 (13.6%) | 0 (0.0%) |
| 5-Person Households | 90 (5.7%) | 0 (0.0%) |
| 6-Person Households | 22 (1.4%) | 0 (0.0%) |
| 7+ Person Households | 0 (0.0%) | 0 (0.0%) |
| Total | 1,175 (73.9%) | 416 (26.2%) |
Female Fertility in Trappe borough
Fertility by Age in Trappe borough
Average fertility rate in Trappe borough is 50.0 births per 1,000 women. Women in the age bracket of 20 to 34 years have the highest fertility rate with 133.0 births per 1,000 women. Women in the age bracket of 20 to 34 years acount for 100.0% of all women with births.
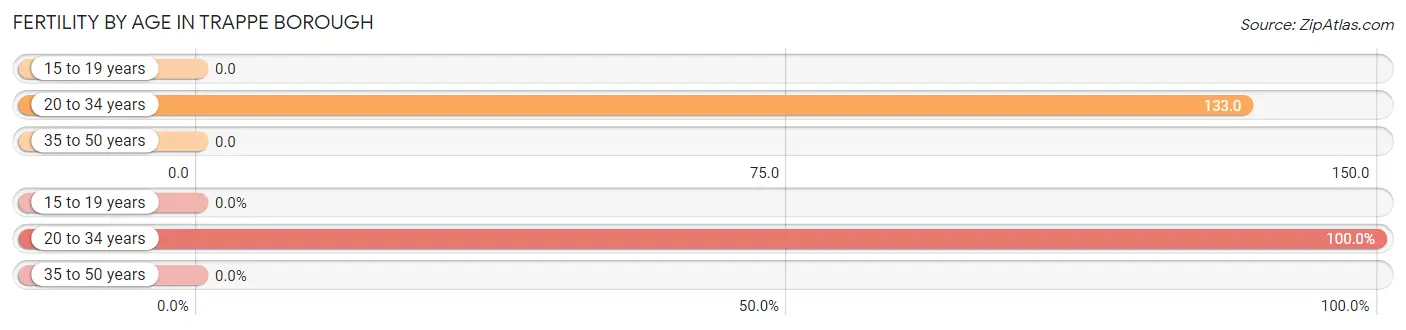
| Age Bracket | Women with Births | Births / 1,000 Women |
| 15 to 19 years | 0 (0.0%) | 0.0 |
| 20 to 34 years | 64 (100.0%) | 133.0 |
| 35 to 50 years | 0 (0.0%) | 0.0 |
| Total | 64 (100.0%) | 50.0 |
Fertility by Age by Marriage Status in Trappe borough
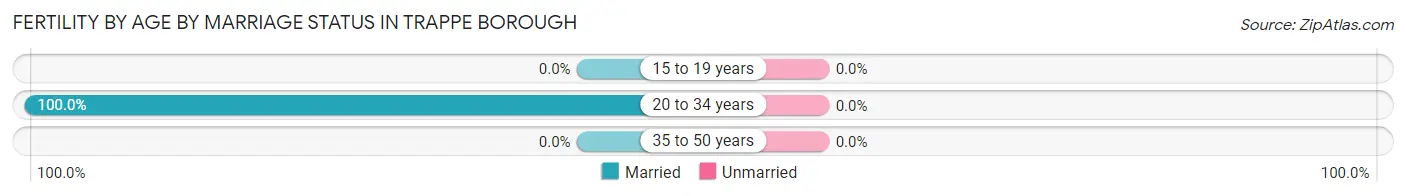
| Age Bracket | Married | Unmarried |
| 15 to 19 years | 0 (0.0%) | 0 (0.0%) |
| 20 to 34 years | 64 (100.0%) | 0 (0.0%) |
| 35 to 50 years | 0 (0.0%) | 0 (0.0%) |
| Total | 64 (100.0%) | 0 (0.0%) |
Fertility by Education in Trappe borough
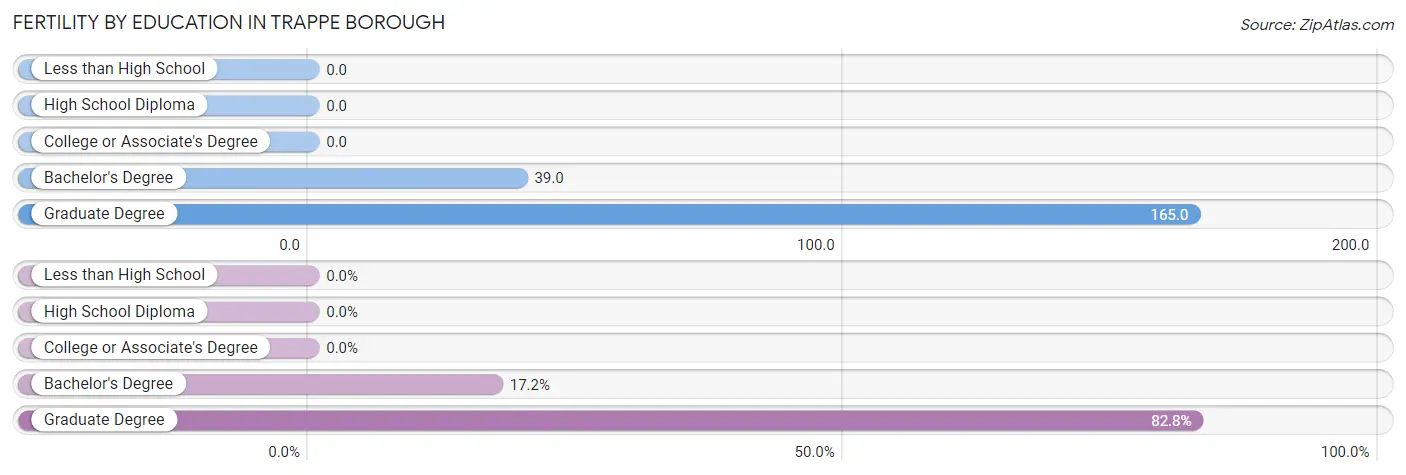
| Educational Attainment | Women with Births | Births / 1,000 Women |
| Less than High School | 0 (0.0%) | 0.0 |
| High School Diploma | 0 (0.0%) | 0.0 |
| College or Associate's Degree | 0 (0.0%) | 0.0 |
| Bachelor's Degree | 11 (17.2%) | 39.0 |
| Graduate Degree | 53 (82.8%) | 165.0 |
| Total | 64 (100.0%) | 50.0 |
Fertility by Education by Marriage Status in Trappe borough
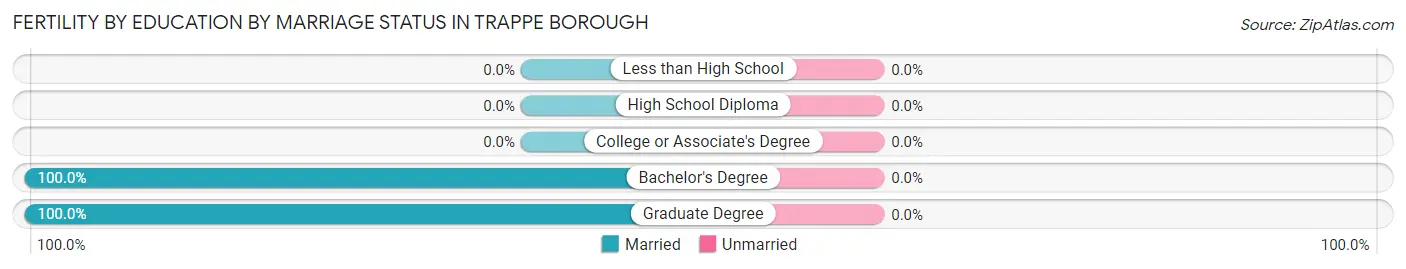
| Educational Attainment | Married | Unmarried |
| Less than High School | 0 (0.0%) | 0 (0.0%) |
| High School Diploma | 0 (0.0%) | 0 (0.0%) |
| College or Associate's Degree | 0 (0.0%) | 0 (0.0%) |
| Bachelor's Degree | 11 (100.0%) | 0 (0.0%) |
| Graduate Degree | 53 (100.0%) | 0 (0.0%) |
| Total | 64 (100.0%) | 0 (0.0%) |
Employment Characteristics in Trappe borough
Employment by Class of Employer in Trappe borough
Among the 2,496 employed individuals in Trappe borough, private company employees (2,011 | 80.6%), self-employed (not incorporated) (134 | 5.4%), and not-for-profit organizations (119 | 4.8%) make up the most common classes of employment.
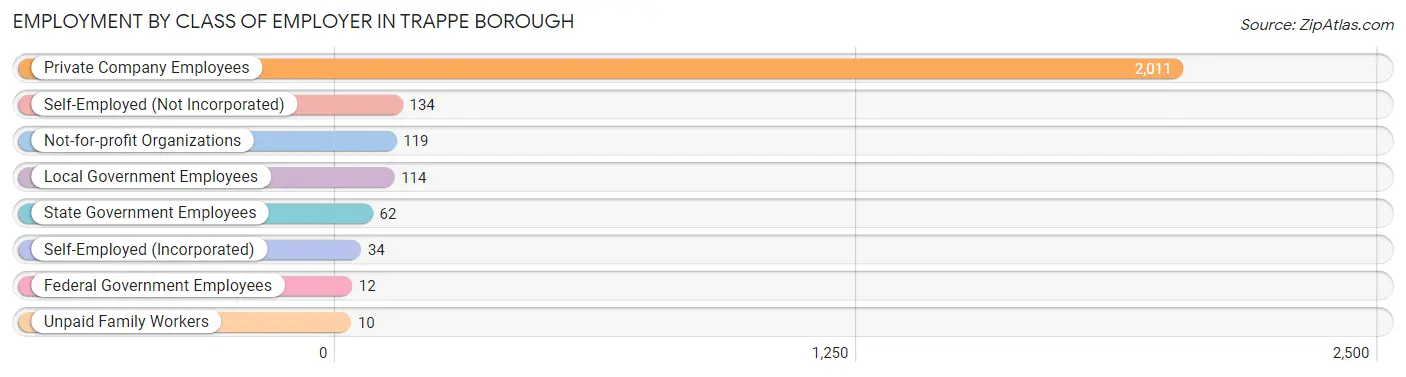
| Employer Class | # Employees | % Employees |
| Private Company Employees | 2,011 | 80.6% |
| Self-Employed (Incorporated) | 34 | 1.4% |
| Self-Employed (Not Incorporated) | 134 | 5.4% |
| Not-for-profit Organizations | 119 | 4.8% |
| Local Government Employees | 114 | 4.6% |
| State Government Employees | 62 | 2.5% |
| Federal Government Employees | 12 | 0.5% |
| Unpaid Family Workers | 10 | 0.4% |
| Total | 2,496 | 100.0% |
Employment Status by Age in Trappe borough
According to the labor force statistics for Trappe borough, out of the total population over 16 years of age (3,445), 73.6% or 2,536 individuals are in the labor force, with 1.6% or 41 of them unemployed. The age group with the highest labor force participation rate is 30 to 34 years, with 98.5% or 392 individuals in the labor force. Within the labor force, the 30 to 34 years age range has the highest percentage of unemployed individuals, with 7.7% or 30 of them being unemployed.
| Age Bracket | In Labor Force | Unemployed |
| 16 to 19 Years | 176 (62.0%) | 0 (0.0%) |
| 20 to 24 Years | 130 (59.1%) | 0 (0.0%) |
| 25 to 29 Years | 244 (82.2%) | 0 (0.0%) |
| 30 to 34 Years | 392 (98.5%) | 30 (7.7%) |
| 35 to 44 Years | 518 (95.2%) | 0 (0.0%) |
| 45 to 54 Years | 474 (95.8%) | 0 (0.0%) |
| 55 to 59 Years | 246 (65.1%) | 0 (0.0%) |
| 60 to 64 Years | 183 (65.1%) | 0 (0.0%) |
| 65 to 74 Years | 169 (48.7%) | 10 (5.9%) |
| 75 Years and over | 4 (2.0%) | 0 (0.0%) |
| Total | 2,536 (73.6%) | 41 (1.6%) |
Employment Status by Educational Attainment in Trappe borough
According to labor force statistics for Trappe borough, 86.0% of individuals (2,058) out of the total population between 25 and 64 years of age (2,393) are in the labor force, with 1.5% or 31 of them being unemployed. The group with the highest labor force participation rate are those with the educational attainment of bachelor's degree or higher, with 89.7% or 1,231 individuals in the labor force. Within the labor force, individuals with college / associate degree education have the highest percentage of unemployment, with 7.5% or 30 of them being unemployed.
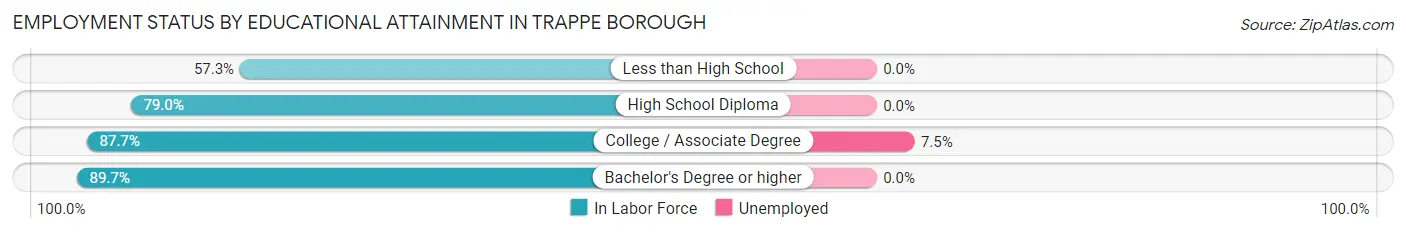
| Educational Attainment | In Labor Force | Unemployed |
| Less than High School | 51 (57.3%) | 0 (0.0%) |
| High School Diploma | 377 (79.0%) | 0 (0.0%) |
| College / Associate Degree | 399 (87.7%) | 34 (7.5%) |
| Bachelor's Degree or higher | 1,231 (89.7%) | 0 (0.0%) |
| Total | 2,058 (86.0%) | 36 (1.5%) |
Employment Occupations by Sex in Trappe borough
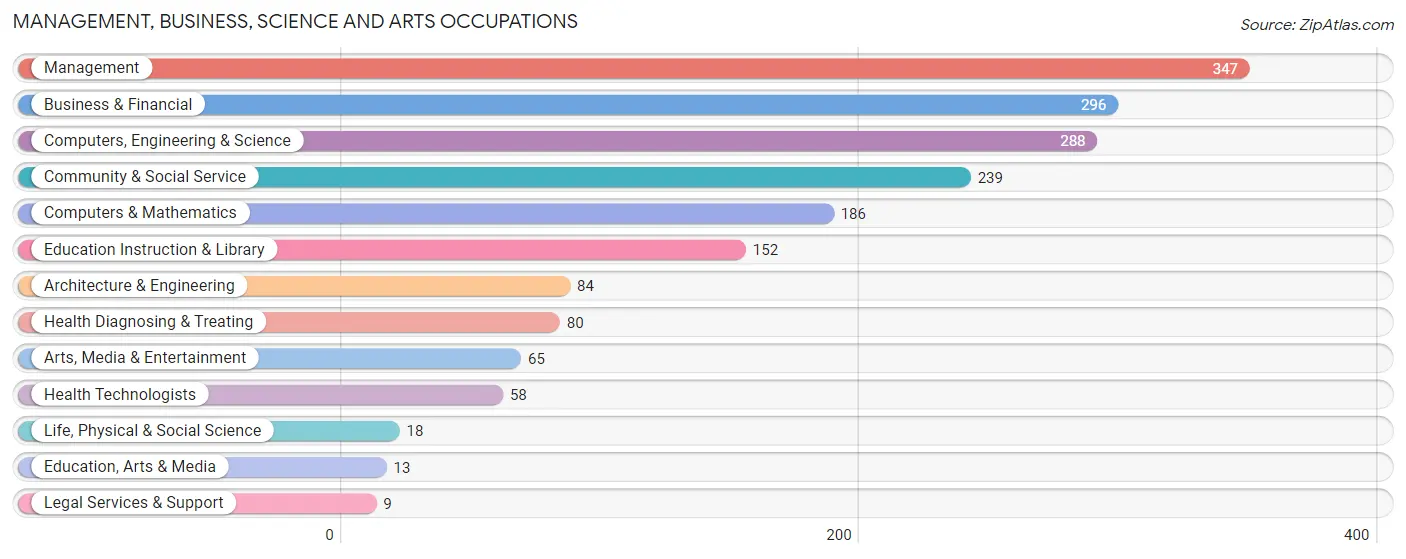
Management, Business, Science and Arts Occupations
The most common Management, Business, Science and Arts occupations in Trappe borough are Management (347 | 13.9%), Business & Financial (296 | 11.9%), Computers, Engineering & Science (288 | 11.5%), Community & Social Service (239 | 9.6%), and Computers & Mathematics (186 | 7.4%).
Management, Business, Science and Arts Occupations by Sex
Within the Management, Business, Science and Arts occupations in Trappe borough, the most male-oriented occupations are Architecture & Engineering (90.5%), Computers, Engineering & Science (83.3%), and Computers & Mathematics (82.8%), while the most female-oriented occupations are Education, Arts & Media (100.0%), Legal Services & Support (100.0%), and Business & Financial (71.0%).
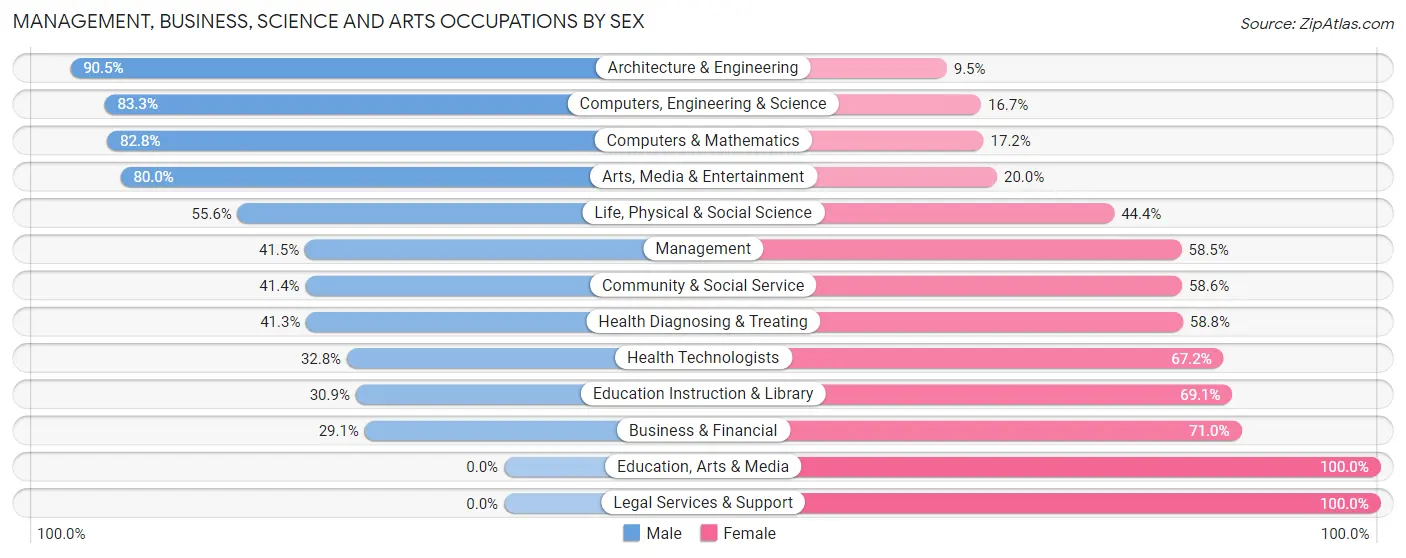
| Occupation | Male | Female |
| Management | 144 (41.5%) | 203 (58.5%) |
| Business & Financial | 86 (29.0%) | 210 (71.0%) |
| Computers, Engineering & Science | 240 (83.3%) | 48 (16.7%) |
| Computers & Mathematics | 154 (82.8%) | 32 (17.2%) |
| Architecture & Engineering | 76 (90.5%) | 8 (9.5%) |
| Life, Physical & Social Science | 10 (55.6%) | 8 (44.4%) |
| Community & Social Service | 99 (41.4%) | 140 (58.6%) |
| Education, Arts & Media | 0 (0.0%) | 13 (100.0%) |
| Legal Services & Support | 0 (0.0%) | 9 (100.0%) |
| Education Instruction & Library | 47 (30.9%) | 105 (69.1%) |
| Arts, Media & Entertainment | 52 (80.0%) | 13 (20.0%) |
| Health Diagnosing & Treating | 33 (41.2%) | 47 (58.8%) |
| Health Technologists | 19 (32.8%) | 39 (67.2%) |
| Total (Category) | 602 (48.2%) | 648 (51.8%) |
| Total (Overall) | 1,112 (44.6%) | 1,384 (55.4%) |
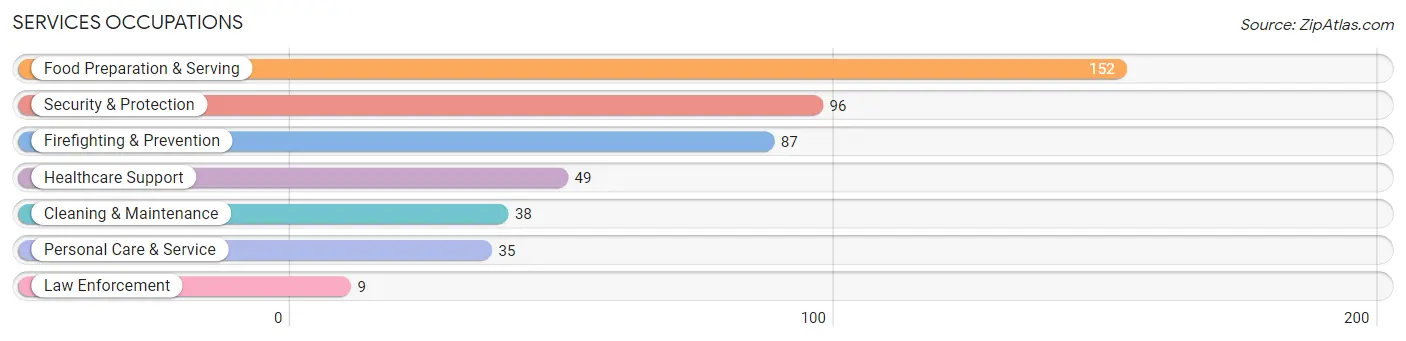
Services Occupations
The most common Services occupations in Trappe borough are Food Preparation & Serving (152 | 6.1%), Security & Protection (96 | 3.8%), Firefighting & Prevention (87 | 3.5%), Healthcare Support (49 | 2.0%), and Cleaning & Maintenance (38 | 1.5%).
Services Occupations by Sex
Within the Services occupations in Trappe borough, the most male-oriented occupations are Law Enforcement (100.0%), Cleaning & Maintenance (100.0%), and Security & Protection (54.2%), while the most female-oriented occupations are Food Preparation & Serving (100.0%), Personal Care & Service (100.0%), and Healthcare Support (75.5%).
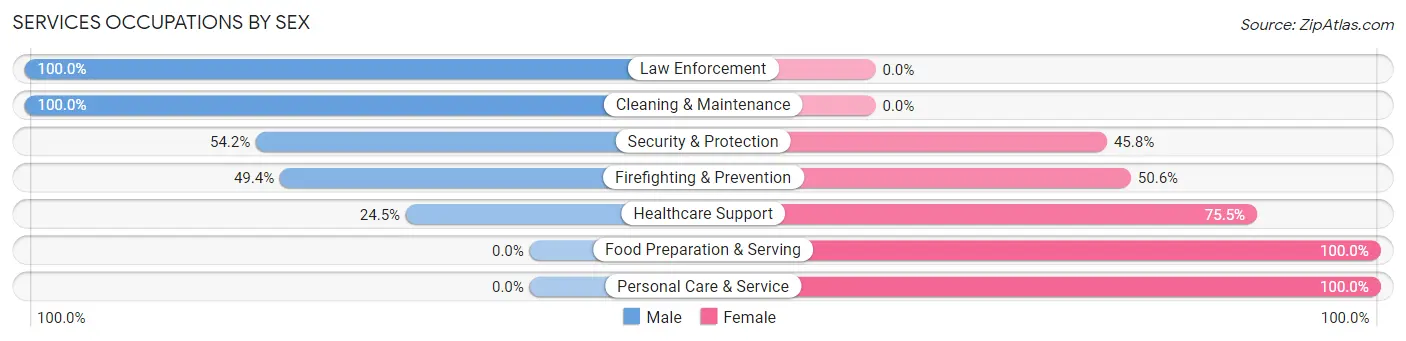
| Occupation | Male | Female |
| Healthcare Support | 12 (24.5%) | 37 (75.5%) |
| Security & Protection | 52 (54.2%) | 44 (45.8%) |
| Firefighting & Prevention | 43 (49.4%) | 44 (50.6%) |
| Law Enforcement | 9 (100.0%) | 0 (0.0%) |
| Food Preparation & Serving | 0 (0.0%) | 152 (100.0%) |
| Cleaning & Maintenance | 38 (100.0%) | 0 (0.0%) |
| Personal Care & Service | 0 (0.0%) | 35 (100.0%) |
| Total (Category) | 102 (27.6%) | 268 (72.4%) |
| Total (Overall) | 1,112 (44.6%) | 1,384 (55.4%) |
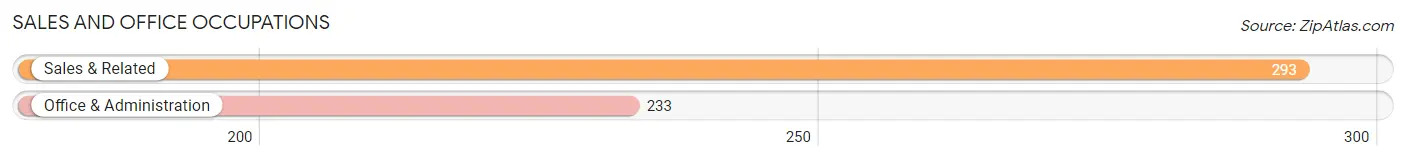
Sales and Office Occupations
The most common Sales and Office occupations in Trappe borough are Sales & Related (293 | 11.7%), and Office & Administration (233 | 9.3%).
Sales and Office Occupations by Sex
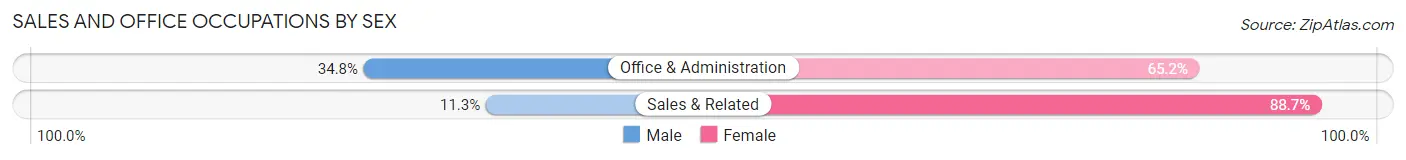
| Occupation | Male | Female |
| Sales & Related | 33 (11.3%) | 260 (88.7%) |
| Office & Administration | 81 (34.8%) | 152 (65.2%) |
| Total (Category) | 114 (21.7%) | 412 (78.3%) |
| Total (Overall) | 1,112 (44.6%) | 1,384 (55.4%) |
Natural Resources, Construction and Maintenance Occupations
The most common Natural Resources, Construction and Maintenance occupations in Trappe borough are Construction & Extraction (112 | 4.5%), and Installation, Maintenance & Repair (98 | 3.9%).
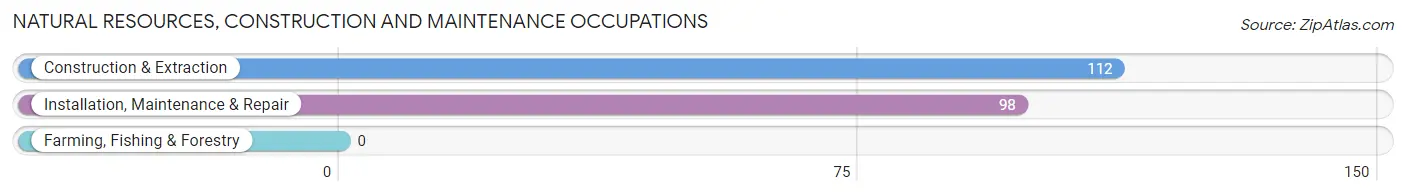
Natural Resources, Construction and Maintenance Occupations by Sex
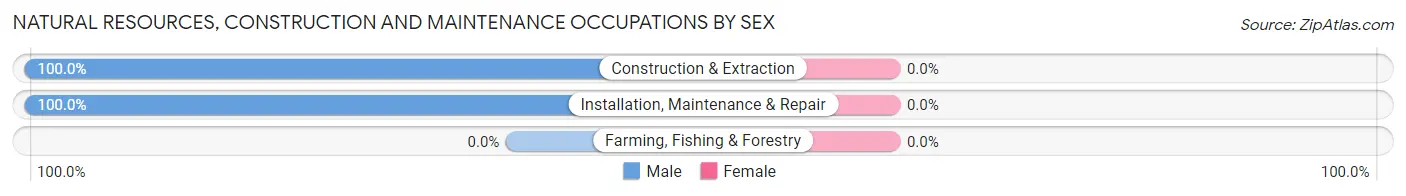
| Occupation | Male | Female |
| Farming, Fishing & Forestry | 0 (0.0%) | 0 (0.0%) |
| Construction & Extraction | 112 (100.0%) | 0 (0.0%) |
| Installation, Maintenance & Repair | 98 (100.0%) | 0 (0.0%) |
| Total (Category) | 210 (100.0%) | 0 (0.0%) |
| Total (Overall) | 1,112 (44.6%) | 1,384 (55.4%) |
Production, Transportation and Moving Occupations
The most common Production, Transportation and Moving occupations in Trappe borough are Production (96 | 3.8%), Material Moving (24 | 1.0%), and Transportation (20 | 0.8%).
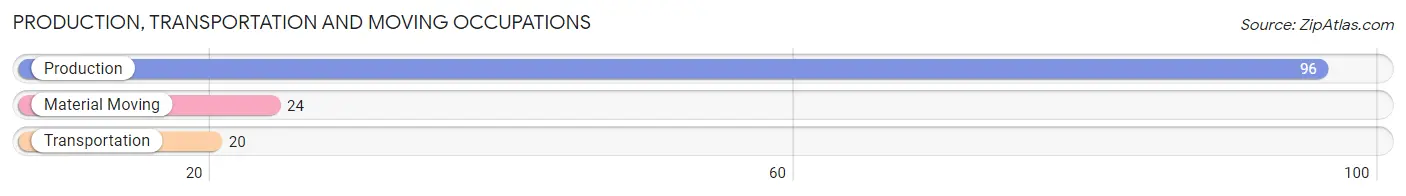
Production, Transportation and Moving Occupations by Sex
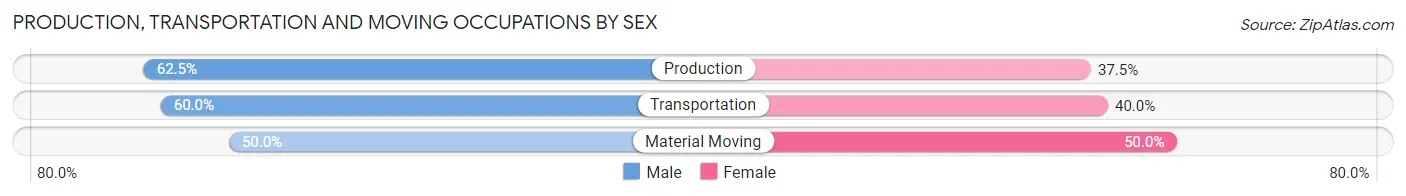
| Occupation | Male | Female |
| Production | 60 (62.5%) | 36 (37.5%) |
| Transportation | 12 (60.0%) | 8 (40.0%) |
| Material Moving | 12 (50.0%) | 12 (50.0%) |
| Total (Category) | 84 (60.0%) | 56 (40.0%) |
| Total (Overall) | 1,112 (44.6%) | 1,384 (55.4%) |
Employment Industries by Sex in Trappe borough
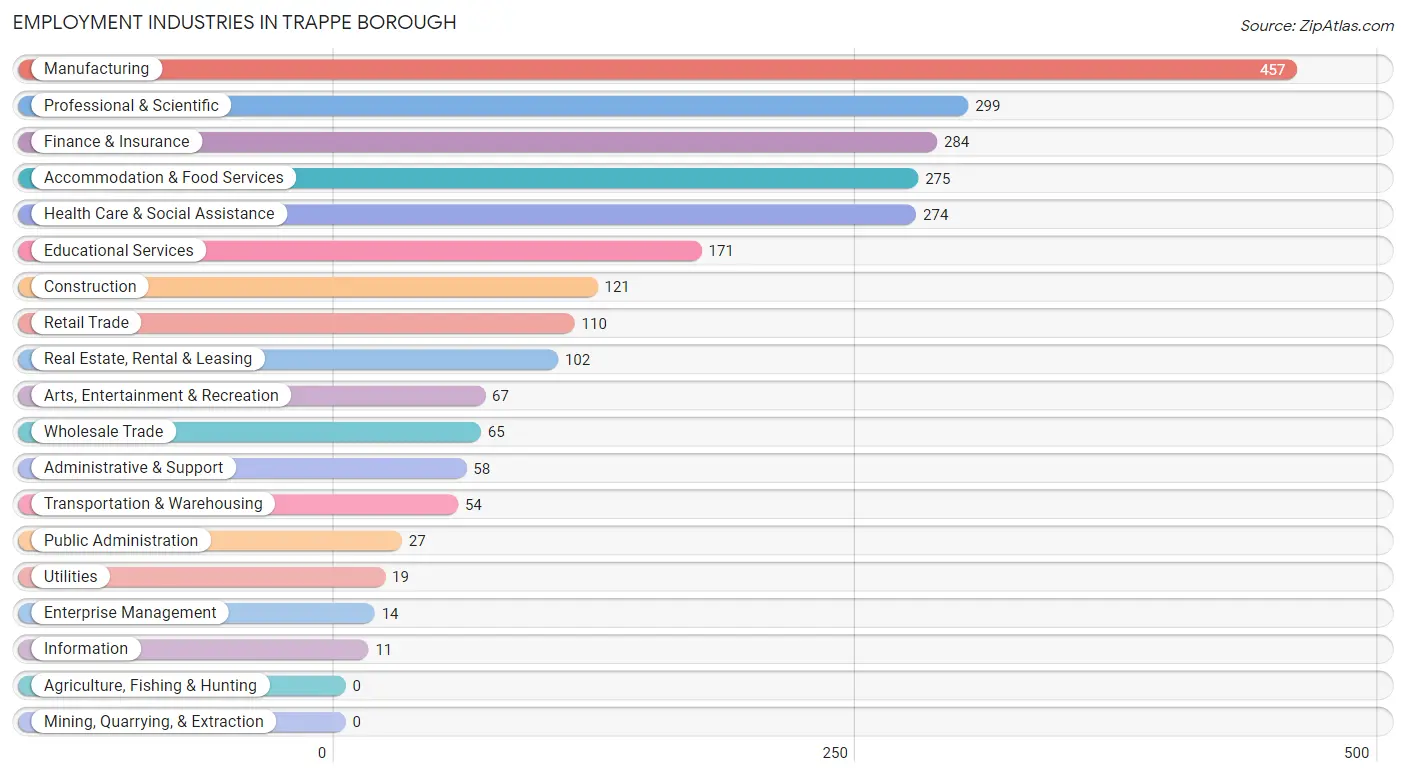
Employment Industries in Trappe borough
The major employment industries in Trappe borough include Manufacturing (457 | 18.3%), Professional & Scientific (299 | 12.0%), Finance & Insurance (284 | 11.4%), Accommodation & Food Services (275 | 11.0%), and Health Care & Social Assistance (274 | 11.0%).
Employment Industries by Sex in Trappe borough
The Trappe borough industries that see more men than women are Construction (100.0%), Public Administration (100.0%), and Administrative & Support (84.5%), whereas the industries that tend to have a higher number of women are Real Estate, Rental & Leasing (100.0%), Enterprise Management (100.0%), and Retail Trade (93.6%).
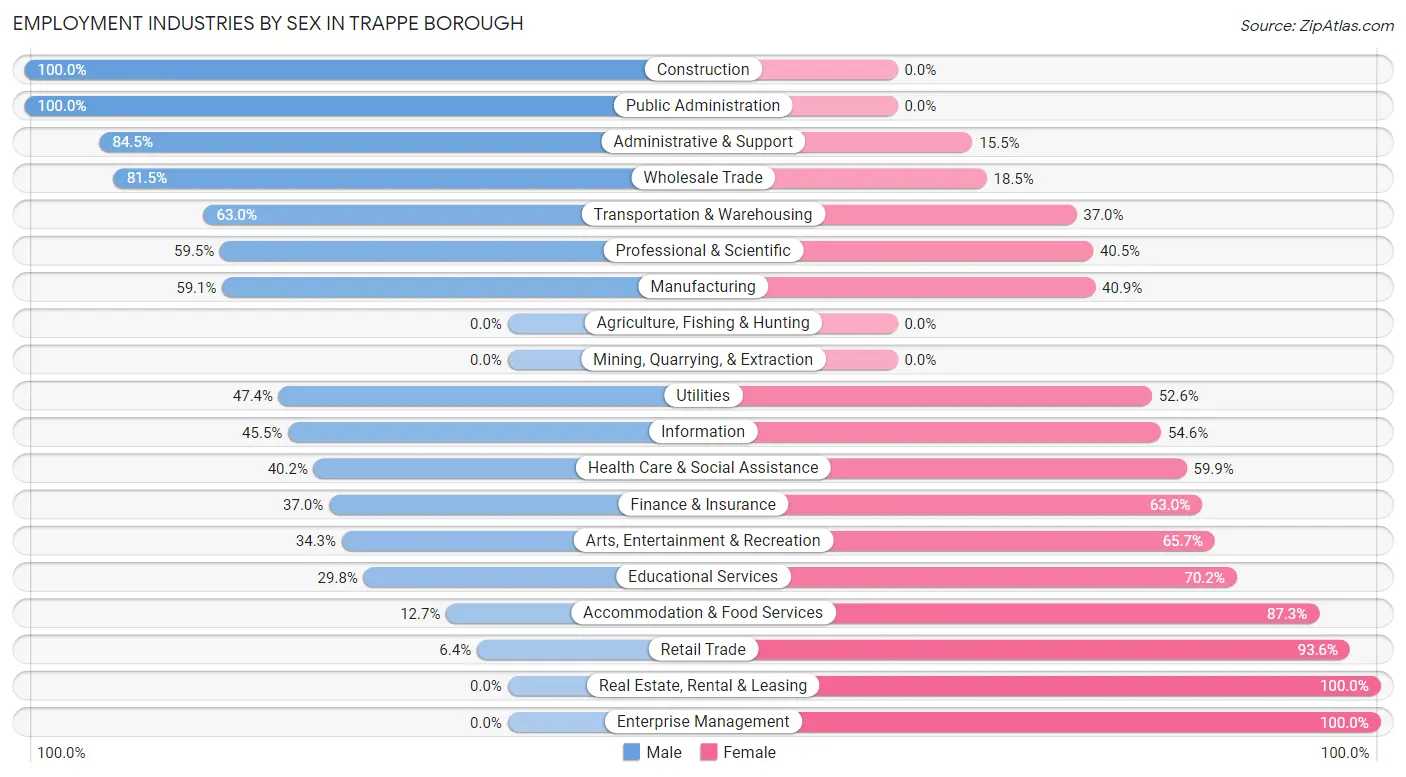
| Industry | Male | Female |
| Agriculture, Fishing & Hunting | 0 (0.0%) | 0 (0.0%) |
| Mining, Quarrying, & Extraction | 0 (0.0%) | 0 (0.0%) |
| Construction | 121 (100.0%) | 0 (0.0%) |
| Manufacturing | 270 (59.1%) | 187 (40.9%) |
| Wholesale Trade | 53 (81.5%) | 12 (18.5%) |
| Retail Trade | 7 (6.4%) | 103 (93.6%) |
| Transportation & Warehousing | 34 (63.0%) | 20 (37.0%) |
| Utilities | 9 (47.4%) | 10 (52.6%) |
| Information | 5 (45.5%) | 6 (54.5%) |
| Finance & Insurance | 105 (37.0%) | 179 (63.0%) |
| Real Estate, Rental & Leasing | 0 (0.0%) | 102 (100.0%) |
| Professional & Scientific | 178 (59.5%) | 121 (40.5%) |
| Enterprise Management | 0 (0.0%) | 14 (100.0%) |
| Administrative & Support | 49 (84.5%) | 9 (15.5%) |
| Educational Services | 51 (29.8%) | 120 (70.2%) |
| Health Care & Social Assistance | 110 (40.2%) | 164 (59.9%) |
| Arts, Entertainment & Recreation | 23 (34.3%) | 44 (65.7%) |
| Accommodation & Food Services | 35 (12.7%) | 240 (87.3%) |
| Public Administration | 27 (100.0%) | 0 (0.0%) |
| Total | 1,112 (44.6%) | 1,384 (55.4%) |
Education in Trappe borough
School Enrollment in Trappe borough
The most common levels of schooling among the 953 students in Trappe borough are high school (323 | 33.9%), college / undergraduate (194 | 20.4%), and middle school (169 | 17.7%).
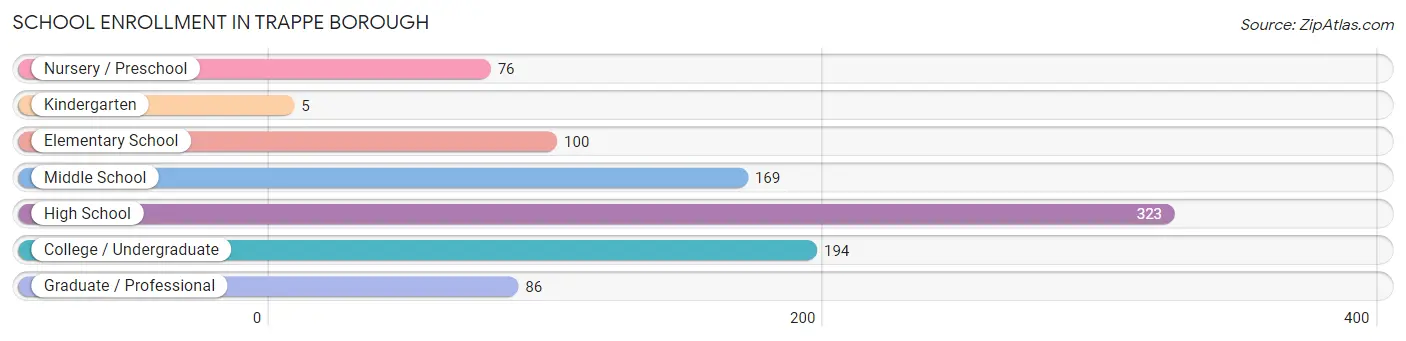
| School Level | # Students | % Students |
| Nursery / Preschool | 76 | 8.0% |
| Kindergarten | 5 | 0.5% |
| Elementary School | 100 | 10.5% |
| Middle School | 169 | 17.7% |
| High School | 323 | 33.9% |
| College / Undergraduate | 194 | 20.4% |
| Graduate / Professional | 86 | 9.0% |
| Total | 953 | 100.0% |
School Enrollment by Age by Funding Source in Trappe borough
Out of a total of 953 students who are enrolled in schools in Trappe borough, 286 (30.0%) attend a private institution, while the remaining 667 (70.0%) are enrolled in public schools. The age group of 3 to 4 year olds has the highest likelihood of being enrolled in private schools, with 48 (100.0% in the age bracket) enrolled. Conversely, the age group of 15 to 17 year olds has the lowest likelihood of being enrolled in a private school, with 259 (97.0% in the age bracket) attending a public institution.
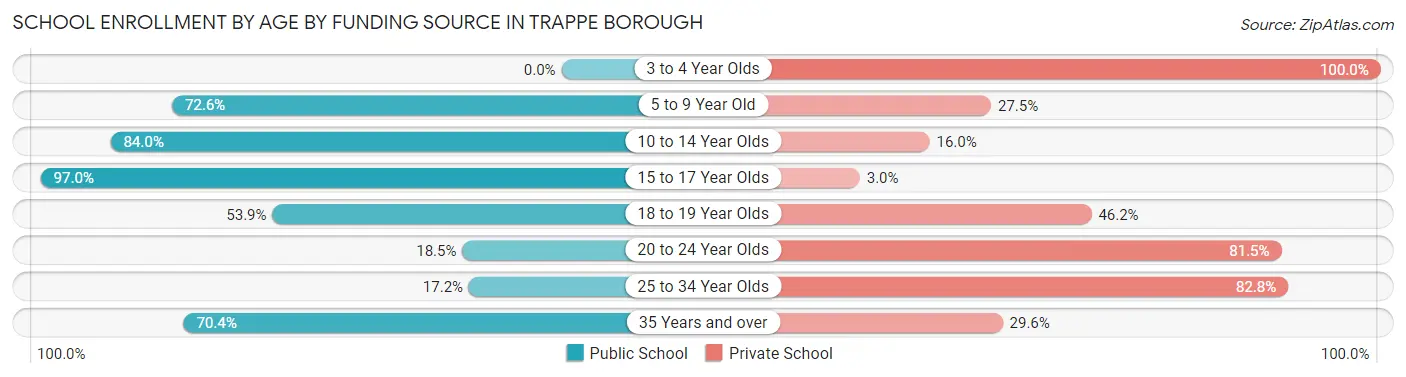
| Age Bracket | Public School | Private School |
| 3 to 4 Year Olds | 0 (0.0%) | 48 (100.0%) |
| 5 to 9 Year Old | 74 (72.6%) | 28 (27.5%) |
| 10 to 14 Year Olds | 189 (84.0%) | 36 (16.0%) |
| 15 to 17 Year Olds | 259 (97.0%) | 8 (3.0%) |
| 18 to 19 Year Olds | 35 (53.8%) | 30 (46.2%) |
| 20 to 24 Year Olds | 17 (18.5%) | 75 (81.5%) |
| 25 to 34 Year Olds | 5 (17.2%) | 24 (82.8%) |
| 35 Years and over | 88 (70.4%) | 37 (29.6%) |
| Total | 667 (70.0%) | 286 (30.0%) |
Educational Attainment by Field of Study in Trappe borough
Business (468 | 27.9%), engineering (259 | 15.4%), bio, nature & agricultural (191 | 11.4%), education (163 | 9.7%), and liberal arts & history (121 | 7.2%) are the most common fields of study among 1,680 individuals in Trappe borough who have obtained a bachelor's degree or higher.
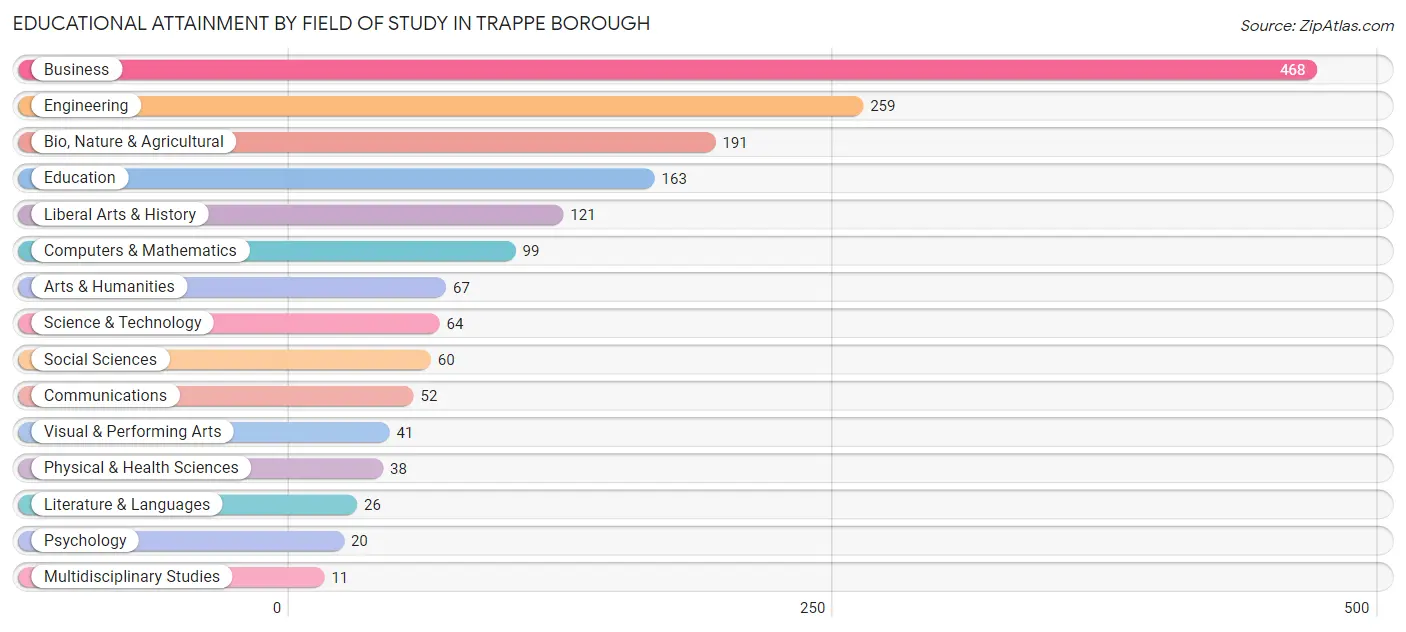
| Field of Study | # Graduates | % Graduates |
| Computers & Mathematics | 99 | 5.9% |
| Bio, Nature & Agricultural | 191 | 11.4% |
| Physical & Health Sciences | 38 | 2.3% |
| Psychology | 20 | 1.2% |
| Social Sciences | 60 | 3.6% |
| Engineering | 259 | 15.4% |
| Multidisciplinary Studies | 11 | 0.6% |
| Science & Technology | 64 | 3.8% |
| Business | 468 | 27.9% |
| Education | 163 | 9.7% |
| Literature & Languages | 26 | 1.5% |
| Liberal Arts & History | 121 | 7.2% |
| Visual & Performing Arts | 41 | 2.4% |
| Communications | 52 | 3.1% |
| Arts & Humanities | 67 | 4.0% |
| Total | 1,680 | 100.0% |
Transportation & Commute in Trappe borough
Vehicle Availability by Sex in Trappe borough
The most prevalent vehicle ownership categories in Trappe borough are males with 2 vehicles (682, accounting for 61.3%) and females with 2 vehicles (800, making up 49.3%).
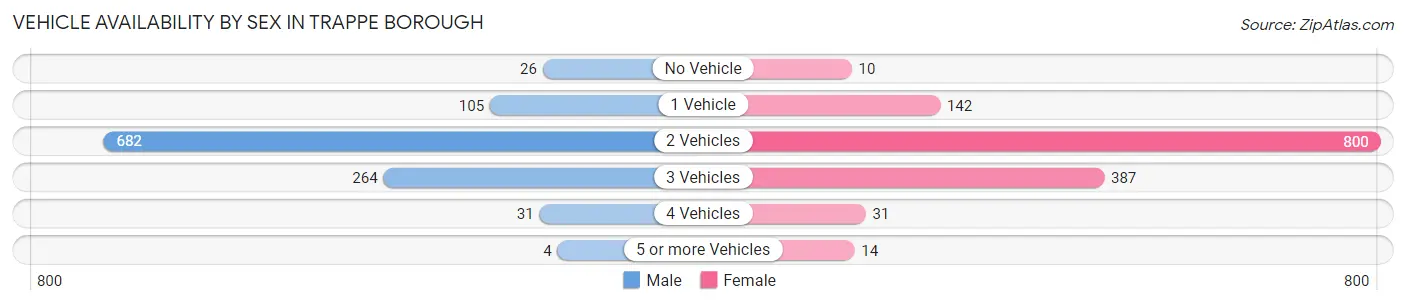
| Vehicles Available | Male | Female |
| No Vehicle | 26 (2.3%) | 10 (0.7%) |
| 1 Vehicle | 105 (9.4%) | 142 (10.3%) |
| 2 Vehicles | 682 (61.3%) | 800 (57.8%) |
| 3 Vehicles | 264 (23.7%) | 387 (28.0%) |
| 4 Vehicles | 31 (2.8%) | 31 (2.2%) |
| 5 or more Vehicles | 4 (0.4%) | 14 (1.0%) |
| Total | 1,112 (100.0%) | 1,384 (100.0%) |
Commute Time in Trappe borough
The most frequently occuring commute durations in Trappe borough are 15 to 19 minutes (273 commuters, 13.2%), 30 to 34 minutes (225 commuters, 10.9%), and 35 to 39 minutes (225 commuters, 10.9%).
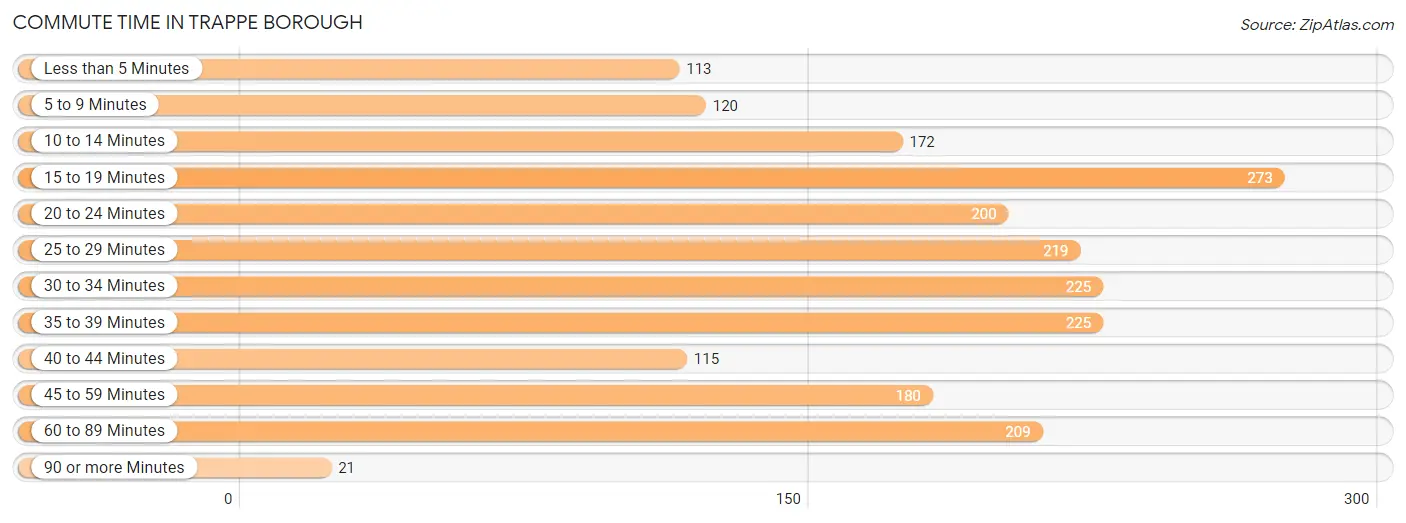
| Commute Time | # Commuters | % Commuters |
| Less than 5 Minutes | 113 | 5.4% |
| 5 to 9 Minutes | 120 | 5.8% |
| 10 to 14 Minutes | 172 | 8.3% |
| 15 to 19 Minutes | 273 | 13.2% |
| 20 to 24 Minutes | 200 | 9.7% |
| 25 to 29 Minutes | 219 | 10.6% |
| 30 to 34 Minutes | 225 | 10.9% |
| 35 to 39 Minutes | 225 | 10.9% |
| 40 to 44 Minutes | 115 | 5.6% |
| 45 to 59 Minutes | 180 | 8.7% |
| 60 to 89 Minutes | 209 | 10.1% |
| 90 or more Minutes | 21 | 1.0% |
Commute Time by Sex in Trappe borough
The most common commute times in Trappe borough are 60 to 89 minutes (174 commuters, 18.4%) for males and 15 to 19 minutes (233 commuters, 20.6%) for females.
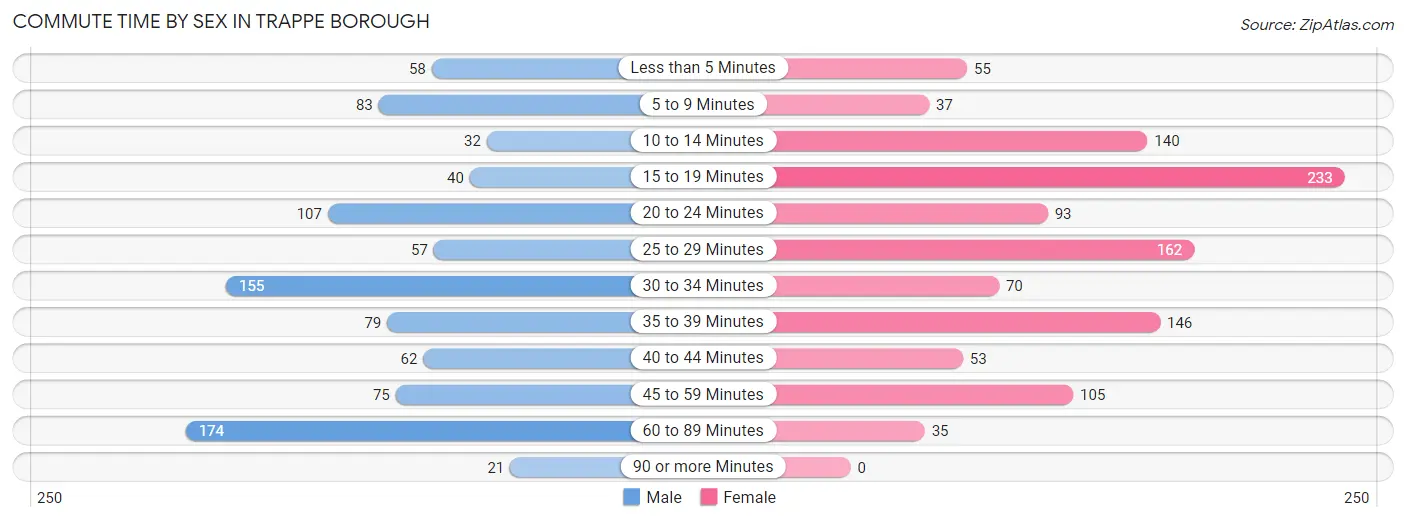
| Commute Time | Male | Female |
| Less than 5 Minutes | 58 (6.1%) | 55 (4.9%) |
| 5 to 9 Minutes | 83 (8.8%) | 37 (3.3%) |
| 10 to 14 Minutes | 32 (3.4%) | 140 (12.4%) |
| 15 to 19 Minutes | 40 (4.2%) | 233 (20.6%) |
| 20 to 24 Minutes | 107 (11.4%) | 93 (8.2%) |
| 25 to 29 Minutes | 57 (6.0%) | 162 (14.3%) |
| 30 to 34 Minutes | 155 (16.4%) | 70 (6.2%) |
| 35 to 39 Minutes | 79 (8.4%) | 146 (12.9%) |
| 40 to 44 Minutes | 62 (6.6%) | 53 (4.7%) |
| 45 to 59 Minutes | 75 (8.0%) | 105 (9.3%) |
| 60 to 89 Minutes | 174 (18.4%) | 35 (3.1%) |
| 90 or more Minutes | 21 (2.2%) | 0 (0.0%) |
Time of Departure to Work by Sex in Trappe borough
The most frequent times of departure to work in Trappe borough are 6:30 AM to 6:59 AM (192, 20.4%) for males and 7:00 AM to 7:29 AM (287, 25.4%) for females.
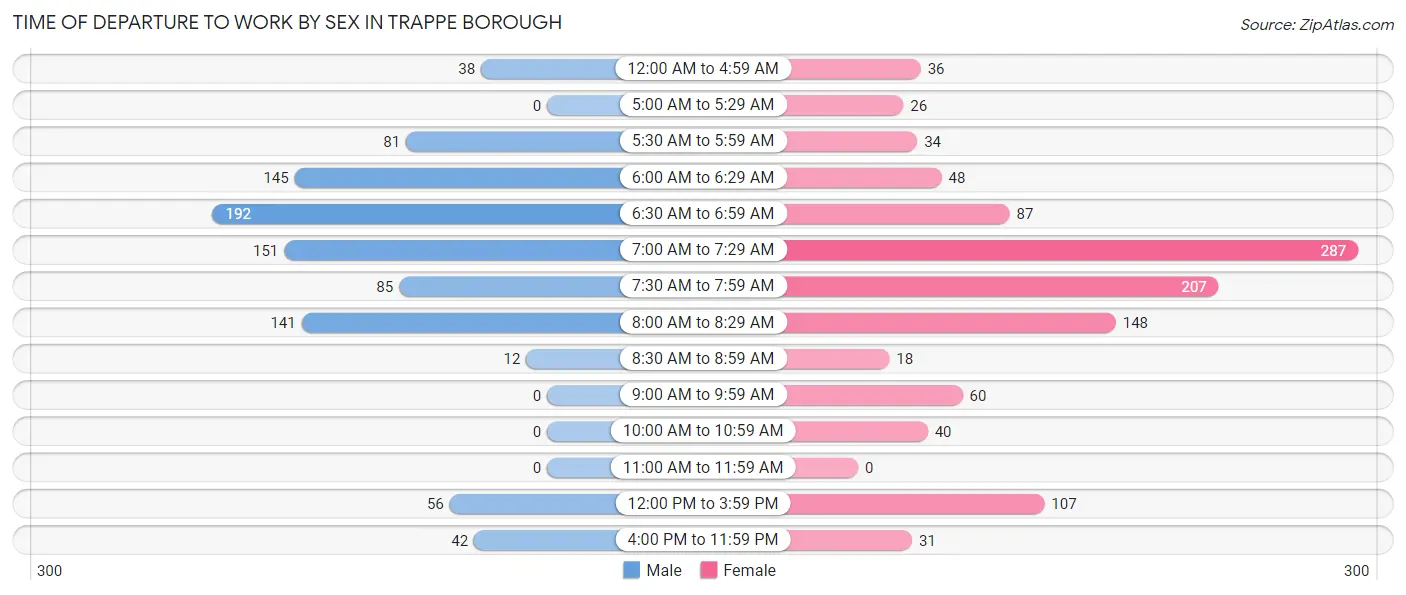
| Time of Departure | Male | Female |
| 12:00 AM to 4:59 AM | 38 (4.0%) | 36 (3.2%) |
| 5:00 AM to 5:29 AM | 0 (0.0%) | 26 (2.3%) |
| 5:30 AM to 5:59 AM | 81 (8.6%) | 34 (3.0%) |
| 6:00 AM to 6:29 AM | 145 (15.4%) | 48 (4.3%) |
| 6:30 AM to 6:59 AM | 192 (20.4%) | 87 (7.7%) |
| 7:00 AM to 7:29 AM | 151 (16.0%) | 287 (25.4%) |
| 7:30 AM to 7:59 AM | 85 (9.0%) | 207 (18.3%) |
| 8:00 AM to 8:29 AM | 141 (14.9%) | 148 (13.1%) |
| 8:30 AM to 8:59 AM | 12 (1.3%) | 18 (1.6%) |
| 9:00 AM to 9:59 AM | 0 (0.0%) | 60 (5.3%) |
| 10:00 AM to 10:59 AM | 0 (0.0%) | 40 (3.5%) |
| 11:00 AM to 11:59 AM | 0 (0.0%) | 0 (0.0%) |
| 12:00 PM to 3:59 PM | 56 (5.9%) | 107 (9.5%) |
| 4:00 PM to 11:59 PM | 42 (4.4%) | 31 (2.8%) |
| Total | 943 (100.0%) | 1,129 (100.0%) |
Housing Occupancy in Trappe borough
Occupancy by Ownership in Trappe borough
Of the total 1,591 dwellings in Trappe borough, owner-occupied units account for 1,190 (74.8%), while renter-occupied units make up 401 (25.2%).
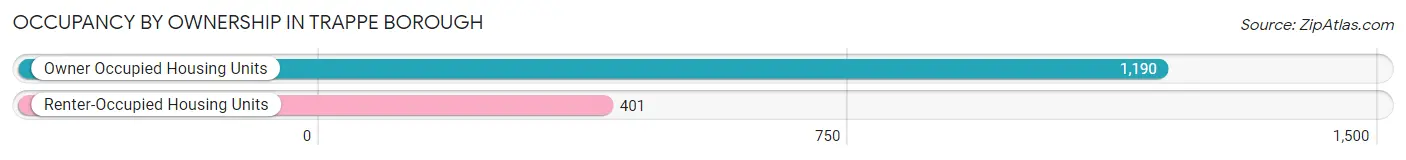
| Occupancy | # Housing Units | % Housing Units |
| Owner Occupied Housing Units | 1,190 | 74.8% |
| Renter-Occupied Housing Units | 401 | 25.2% |
| Total Occupied Housing Units | 1,591 | 100.0% |
Occupancy by Household Size in Trappe borough
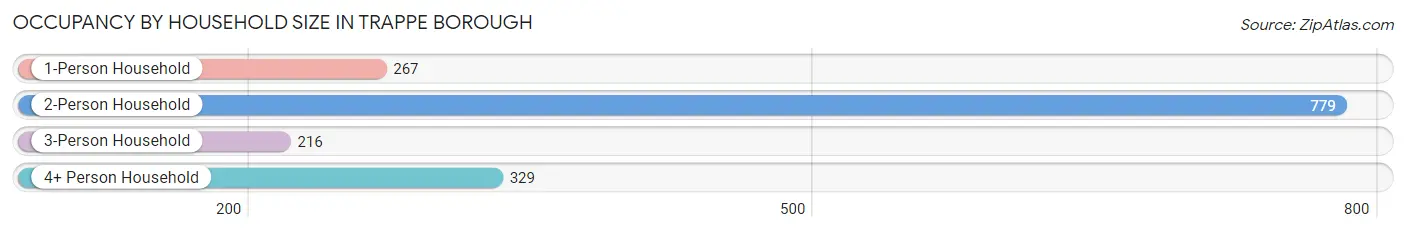
| Household Size | # Housing Units | % Housing Units |
| 1-Person Household | 267 | 16.8% |
| 2-Person Household | 779 | 49.0% |
| 3-Person Household | 216 | 13.6% |
| 4+ Person Household | 329 | 20.7% |
| Total Housing Units | 1,591 | 100.0% |
Occupancy by Ownership by Household Size in Trappe borough
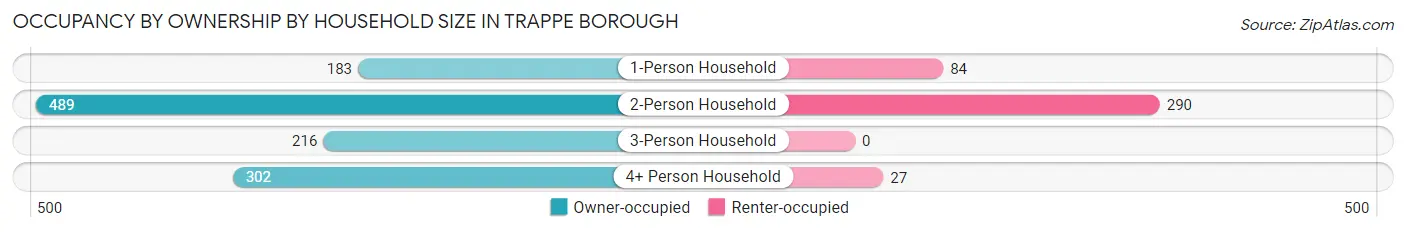
| Household Size | Owner-occupied | Renter-occupied |
| 1-Person Household | 183 (68.5%) | 84 (31.5%) |
| 2-Person Household | 489 (62.8%) | 290 (37.2%) |
| 3-Person Household | 216 (100.0%) | 0 (0.0%) |
| 4+ Person Household | 302 (91.8%) | 27 (8.2%) |
| Total Housing Units | 1,190 (74.8%) | 401 (25.2%) |
Occupancy by Educational Attainment in Trappe borough
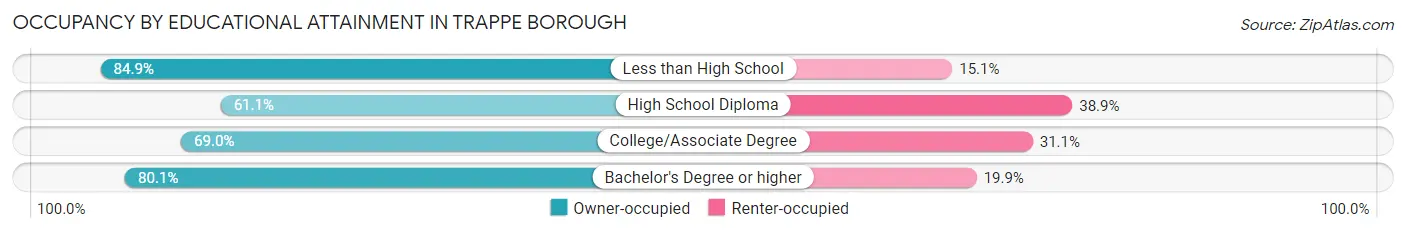
| Household Size | Owner-occupied | Renter-occupied |
| Less than High School | 45 (84.9%) | 8 (15.1%) |
| High School Diploma | 132 (61.1%) | 84 (38.9%) |
| College/Associate Degree | 282 (69.0%) | 127 (31.0%) |
| Bachelor's Degree or higher | 731 (80.1%) | 182 (19.9%) |
Occupancy by Age of Householder in Trappe borough
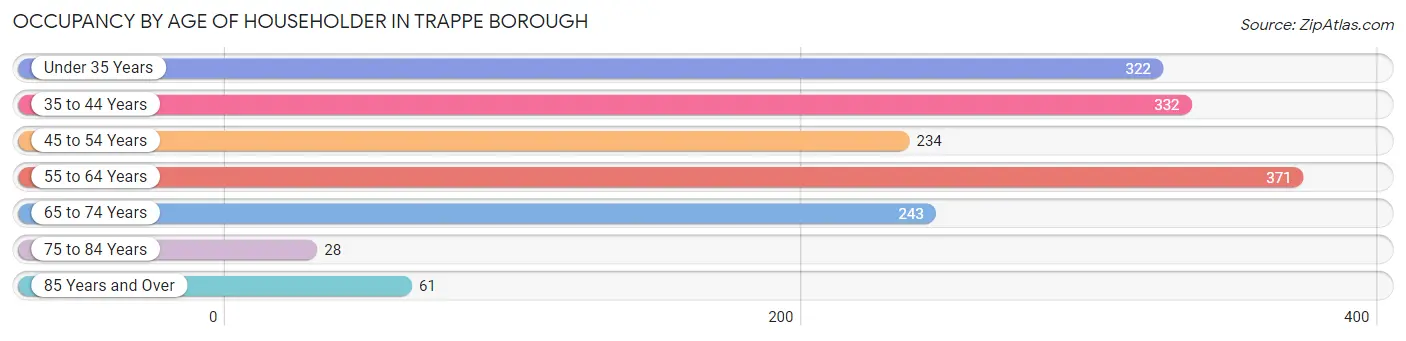
| Age Bracket | # Households | % Households |
| Under 35 Years | 322 | 20.2% |
| 35 to 44 Years | 332 | 20.9% |
| 45 to 54 Years | 234 | 14.7% |
| 55 to 64 Years | 371 | 23.3% |
| 65 to 74 Years | 243 | 15.3% |
| 75 to 84 Years | 28 | 1.8% |
| 85 Years and Over | 61 | 3.8% |
| Total | 1,591 | 100.0% |
Housing Finances in Trappe borough
Median Income by Occupancy in Trappe borough
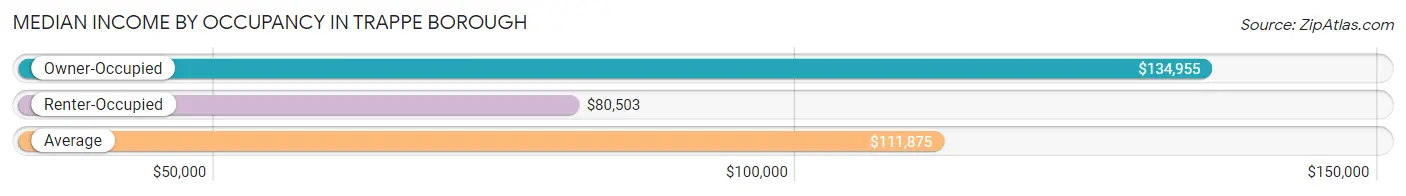
| Occupancy Type | # Households | Median Income |
| Owner-Occupied | 1,190 (74.8%) | $134,955 |
| Renter-Occupied | 401 (25.2%) | $80,503 |
| Average | 1,591 (100.0%) | $111,875 |
Occupancy by Householder Income Bracket in Trappe borough
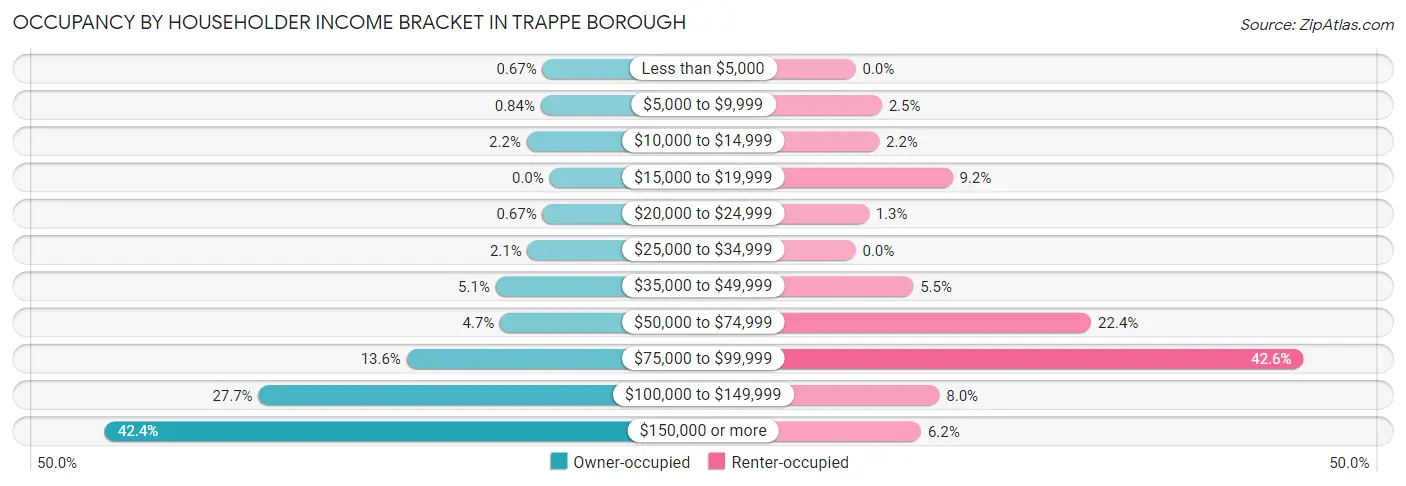
| Income Bracket | Owner-occupied | Renter-occupied |
| Less than $5,000 | 8 (0.7%) | 0 (0.0%) |
| $5,000 to $9,999 | 10 (0.8%) | 10 (2.5%) |
| $10,000 to $14,999 | 26 (2.2%) | 9 (2.2%) |
| $15,000 to $19,999 | 0 (0.0%) | 37 (9.2%) |
| $20,000 to $24,999 | 8 (0.7%) | 5 (1.3%) |
| $25,000 to $34,999 | 25 (2.1%) | 0 (0.0%) |
| $35,000 to $49,999 | 61 (5.1%) | 22 (5.5%) |
| $50,000 to $74,999 | 56 (4.7%) | 90 (22.4%) |
| $75,000 to $99,999 | 162 (13.6%) | 171 (42.6%) |
| $100,000 to $149,999 | 330 (27.7%) | 32 (8.0%) |
| $150,000 or more | 504 (42.3%) | 25 (6.2%) |
| Total | 1,190 (100.0%) | 401 (100.0%) |
Monthly Housing Cost Tiers in Trappe borough
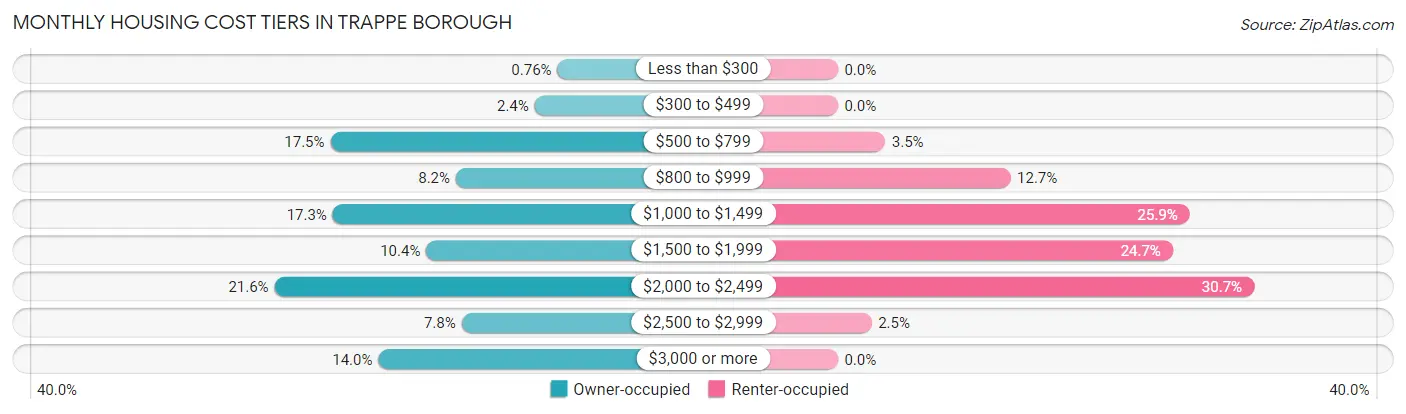
| Monthly Cost | Owner-occupied | Renter-occupied |
| Less than $300 | 9 (0.8%) | 0 (0.0%) |
| $300 to $499 | 29 (2.4%) | 0 (0.0%) |
| $500 to $799 | 208 (17.5%) | 14 (3.5%) |
| $800 to $999 | 98 (8.2%) | 51 (12.7%) |
| $1,000 to $1,499 | 206 (17.3%) | 104 (25.9%) |
| $1,500 to $1,999 | 124 (10.4%) | 99 (24.7%) |
| $2,000 to $2,499 | 257 (21.6%) | 123 (30.7%) |
| $2,500 to $2,999 | 93 (7.8%) | 10 (2.5%) |
| $3,000 or more | 166 (14.0%) | 0 (0.0%) |
| Total | 1,190 (100.0%) | 401 (100.0%) |
Physical Housing Characteristics in Trappe borough
Housing Structures in Trappe borough
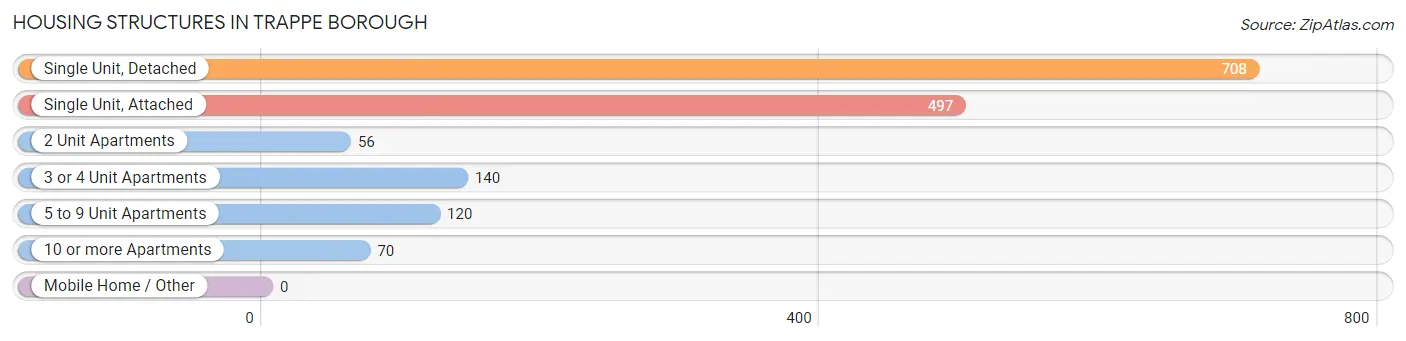
| Structure Type | # Housing Units | % Housing Units |
| Single Unit, Detached | 708 | 44.5% |
| Single Unit, Attached | 497 | 31.2% |
| 2 Unit Apartments | 56 | 3.5% |
| 3 or 4 Unit Apartments | 140 | 8.8% |
| 5 to 9 Unit Apartments | 120 | 7.5% |
| 10 or more Apartments | 70 | 4.4% |
| Mobile Home / Other | 0 | 0.0% |
| Total | 1,591 | 100.0% |
Housing Structures by Occupancy in Trappe borough
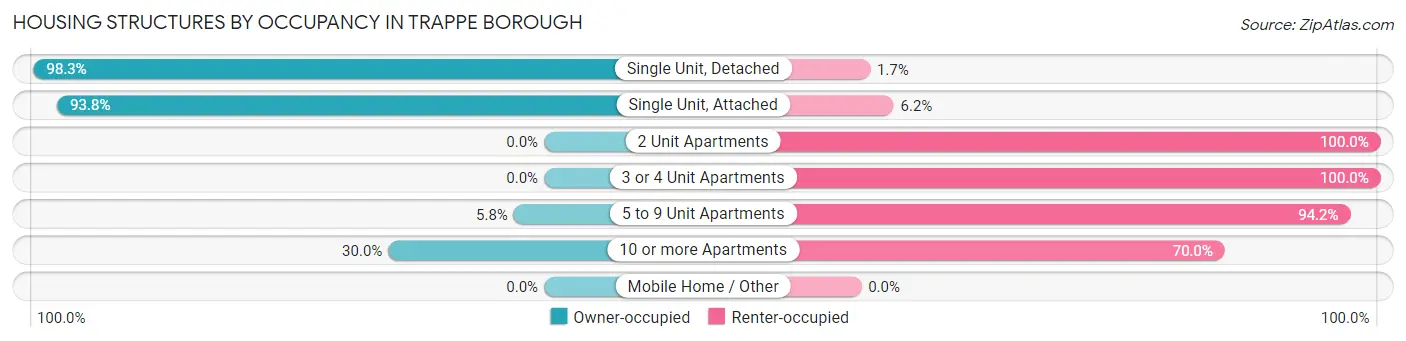
| Structure Type | Owner-occupied | Renter-occupied |
| Single Unit, Detached | 696 (98.3%) | 12 (1.7%) |
| Single Unit, Attached | 466 (93.8%) | 31 (6.2%) |
| 2 Unit Apartments | 0 (0.0%) | 56 (100.0%) |
| 3 or 4 Unit Apartments | 0 (0.0%) | 140 (100.0%) |
| 5 to 9 Unit Apartments | 7 (5.8%) | 113 (94.2%) |
| 10 or more Apartments | 21 (30.0%) | 49 (70.0%) |
| Mobile Home / Other | 0 (0.0%) | 0 (0.0%) |
| Total | 1,190 (74.8%) | 401 (25.2%) |
Housing Structures by Number of Rooms in Trappe borough
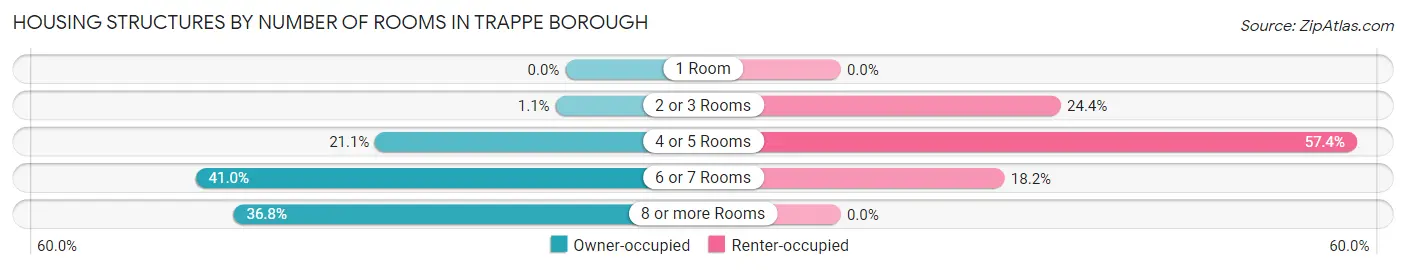
| Number of Rooms | Owner-occupied | Renter-occupied |
| 1 Room | 0 (0.0%) | 0 (0.0%) |
| 2 or 3 Rooms | 13 (1.1%) | 98 (24.4%) |
| 4 or 5 Rooms | 251 (21.1%) | 230 (57.4%) |
| 6 or 7 Rooms | 488 (41.0%) | 73 (18.2%) |
| 8 or more Rooms | 438 (36.8%) | 0 (0.0%) |
| Total | 1,190 (100.0%) | 401 (100.0%) |
Housing Structure by Heating Type in Trappe borough
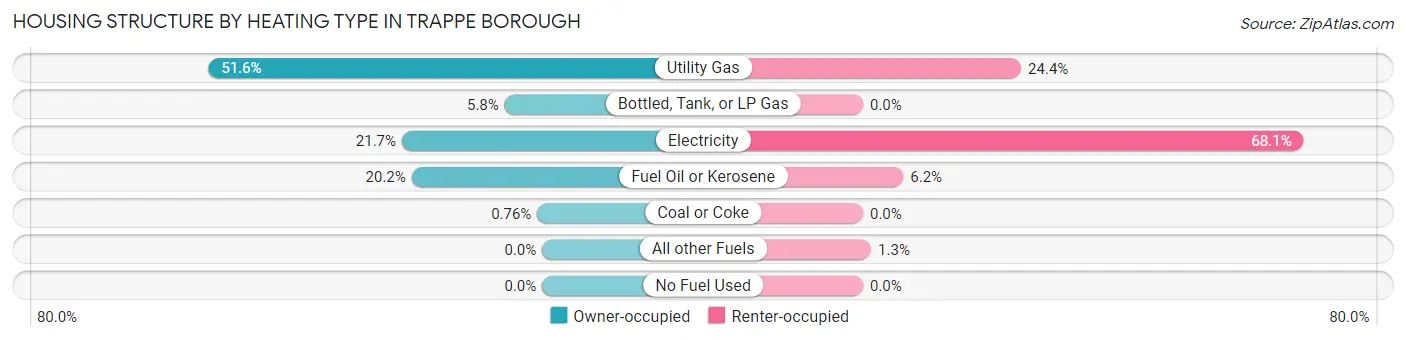
| Heating Type | Owner-occupied | Renter-occupied |
| Utility Gas | 614 (51.6%) | 98 (24.4%) |
| Bottled, Tank, or LP Gas | 69 (5.8%) | 0 (0.0%) |
| Electricity | 258 (21.7%) | 273 (68.1%) |
| Fuel Oil or Kerosene | 240 (20.2%) | 25 (6.2%) |
| Coal or Coke | 9 (0.8%) | 0 (0.0%) |
| All other Fuels | 0 (0.0%) | 5 (1.3%) |
| No Fuel Used | 0 (0.0%) | 0 (0.0%) |
| Total | 1,190 (100.0%) | 401 (100.0%) |
Household Vehicle Usage in Trappe borough
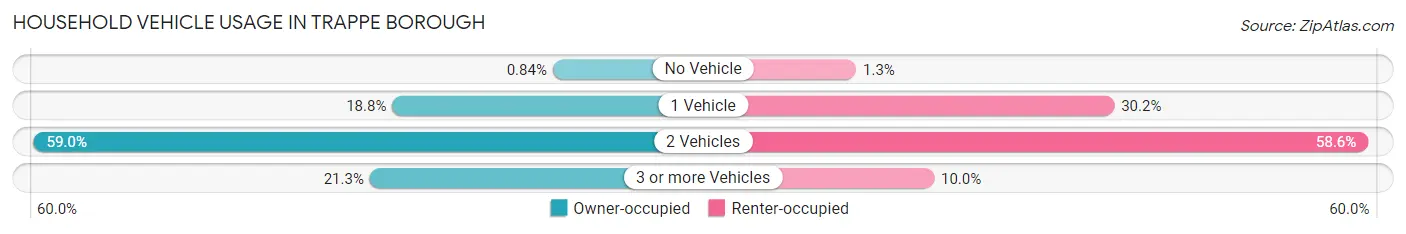
| Vehicles per Household | Owner-occupied | Renter-occupied |
| No Vehicle | 10 (0.8%) | 5 (1.3%) |
| 1 Vehicle | 224 (18.8%) | 121 (30.2%) |
| 2 Vehicles | 702 (59.0%) | 235 (58.6%) |
| 3 or more Vehicles | 254 (21.3%) | 40 (10.0%) |
| Total | 1,190 (100.0%) | 401 (100.0%) |
Real Estate & Mortgages in Trappe borough
Real Estate and Mortgage Overview in Trappe borough
| Characteristic | Without Mortgage | With Mortgage |
| Housing Units | 374 | 816 |
| Median Property Value | $318,600 | $360,500 |
| Median Household Income | $94,583 | $418 |
| Monthly Housing Costs | $719 | $166 |
| Real Estate Taxes | $4,848 | $0 |
Property Value by Mortgage Status in Trappe borough
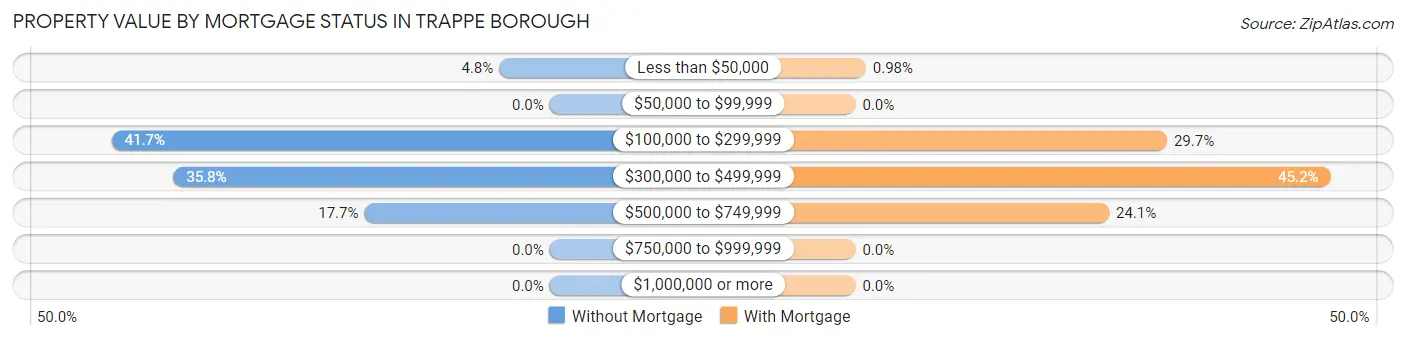
| Property Value | Without Mortgage | With Mortgage |
| Less than $50,000 | 18 (4.8%) | 8 (1.0%) |
| $50,000 to $99,999 | 0 (0.0%) | 0 (0.0%) |
| $100,000 to $299,999 | 156 (41.7%) | 242 (29.7%) |
| $300,000 to $499,999 | 134 (35.8%) | 369 (45.2%) |
| $500,000 to $749,999 | 66 (17.6%) | 197 (24.1%) |
| $750,000 to $999,999 | 0 (0.0%) | 0 (0.0%) |
| $1,000,000 or more | 0 (0.0%) | 0 (0.0%) |
| Total | 374 (100.0%) | 816 (100.0%) |
Household Income by Mortgage Status in Trappe borough
| Household Income | Without Mortgage | With Mortgage |
| Less than $10,000 | 18 (4.8%) | 43 (5.3%) |
| $10,000 to $24,999 | 11 (2.9%) | 0 (0.0%) |
| $25,000 to $34,999 | 25 (6.7%) | 23 (2.8%) |
| $35,000 to $49,999 | 9 (2.4%) | 0 (0.0%) |
| $50,000 to $74,999 | 30 (8.0%) | 52 (6.4%) |
| $75,000 to $99,999 | 112 (29.9%) | 26 (3.2%) |
| $100,000 to $149,999 | 83 (22.2%) | 50 (6.1%) |
| $150,000 or more | 86 (23.0%) | 247 (30.3%) |
| Total | 374 (100.0%) | 816 (100.0%) |
Property Value to Household Income Ratio in Trappe borough
| Value-to-Income Ratio | Without Mortgage | With Mortgage |
| Less than 2.0x | 102 (27.3%) | 157,750 (19,332.1%) |
| 2.0x to 2.9x | 107 (28.6%) | 278 (34.1%) |
| 3.0x to 3.9x | 82 (21.9%) | 336 (41.2%) |
| 4.0x or more | 83 (22.2%) | 93 (11.4%) |
| Total | 374 (100.0%) | 816 (100.0%) |
Real Estate Taxes by Mortgage Status in Trappe borough
| Property Taxes | Without Mortgage | With Mortgage |
| Less than $800 | 9 (2.4%) | 0 (0.0%) |
| $800 to $1,499 | 0 (0.0%) | 0 (0.0%) |
| $800 to $1,499 | 345 (92.2%) | 12 (1.5%) |
| Total | 374 (100.0%) | 816 (100.0%) |
Health & Disability in Trappe borough
Health Insurance Coverage by Age in Trappe borough
| Age Bracket | With Coverage | Without Coverage |
| Under 6 Years | 194 (100.0%) | 0 (0.0%) |
| 6 to 18 Years | 598 (98.0%) | 12 (2.0%) |
| 19 to 25 Years | 269 (100.0%) | 0 (0.0%) |
| 26 to 34 Years | 631 (96.0%) | 26 (4.0%) |
| 35 to 44 Years | 500 (91.9%) | 44 (8.1%) |
| 45 to 54 Years | 489 (98.8%) | 6 (1.2%) |
| 55 to 64 Years | 652 (98.9%) | 7 (1.1%) |
| 65 to 74 Years | 324 (93.4%) | 23 (6.6%) |
| 75 Years and older | 201 (100.0%) | 0 (0.0%) |
| Total | 3,858 (97.0%) | 118 (3.0%) |
Health Insurance Coverage by Citizenship Status in Trappe borough
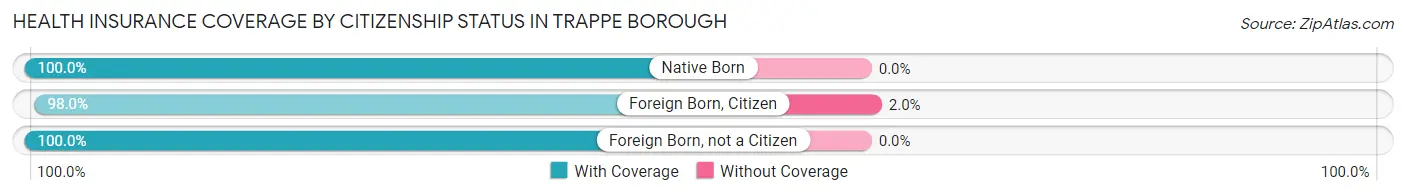
| Citizenship Status | With Coverage | Without Coverage |
| Native Born | 194 (100.0%) | 0 (0.0%) |
| Foreign Born, Citizen | 598 (98.0%) | 12 (2.0%) |
| Foreign Born, not a Citizen | 269 (100.0%) | 0 (0.0%) |
Health Insurance Coverage by Household Income in Trappe borough
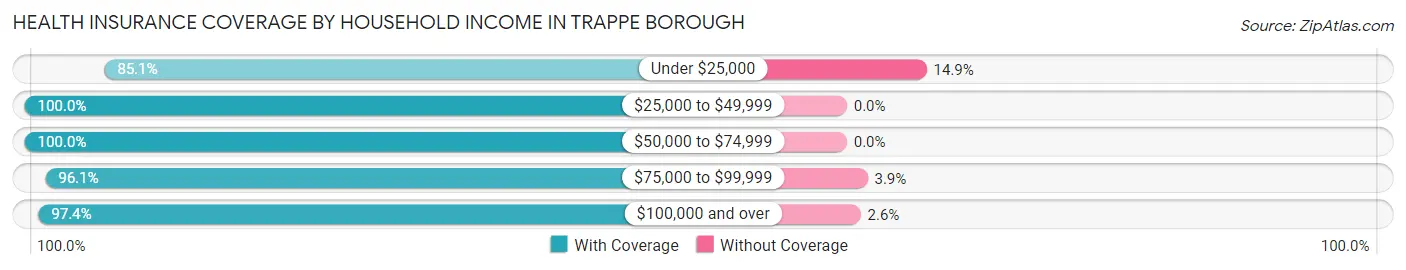
| Household Income | With Coverage | Without Coverage |
| Under $25,000 | 131 (85.1%) | 23 (14.9%) |
| $25,000 to $49,999 | 216 (100.0%) | 0 (0.0%) |
| $50,000 to $74,999 | 267 (100.0%) | 0 (0.0%) |
| $75,000 to $99,999 | 644 (96.1%) | 26 (3.9%) |
| $100,000 and over | 2,597 (97.4%) | 69 (2.6%) |
Public vs Private Health Insurance Coverage by Age in Trappe borough
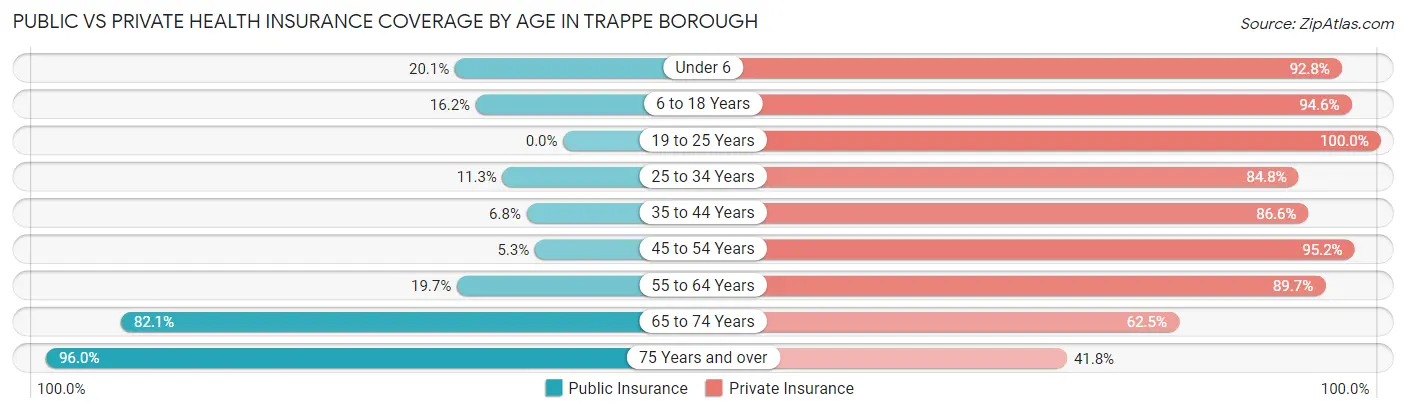
| Age Bracket | Public Insurance | Private Insurance |
| Under 6 | 39 (20.1%) | 180 (92.8%) |
| 6 to 18 Years | 99 (16.2%) | 577 (94.6%) |
| 19 to 25 Years | 0 (0.0%) | 269 (100.0%) |
| 25 to 34 Years | 74 (11.3%) | 557 (84.8%) |
| 35 to 44 Years | 37 (6.8%) | 471 (86.6%) |
| 45 to 54 Years | 26 (5.2%) | 471 (95.2%) |
| 55 to 64 Years | 130 (19.7%) | 591 (89.7%) |
| 65 to 74 Years | 285 (82.1%) | 217 (62.5%) |
| 75 Years and over | 193 (96.0%) | 84 (41.8%) |
| Total | 883 (22.2%) | 3,417 (85.9%) |
Disability Status by Sex by Age in Trappe borough
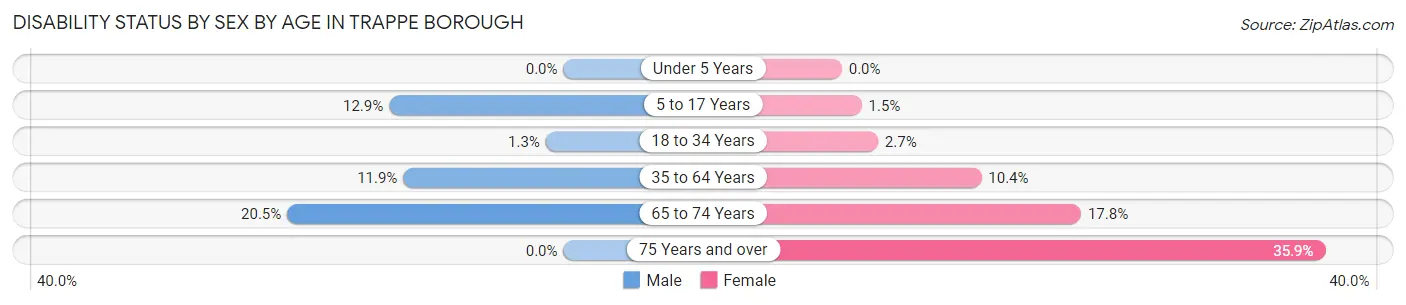
| Age Bracket | Male | Female |
| Under 5 Years | 0 (0.0%) | 0 (0.0%) |
| 5 to 17 Years | 33 (12.9%) | 5 (1.5%) |
| 18 to 34 Years | 6 (1.3%) | 14 (2.7%) |
| 35 to 64 Years | 86 (11.9%) | 101 (10.4%) |
| 65 to 74 Years | 40 (20.5%) | 27 (17.8%) |
| 75 Years and over | 0 (0.0%) | 42 (35.9%) |
Disability Class by Sex by Age in Trappe borough
Disability Class: Hearing Difficulty
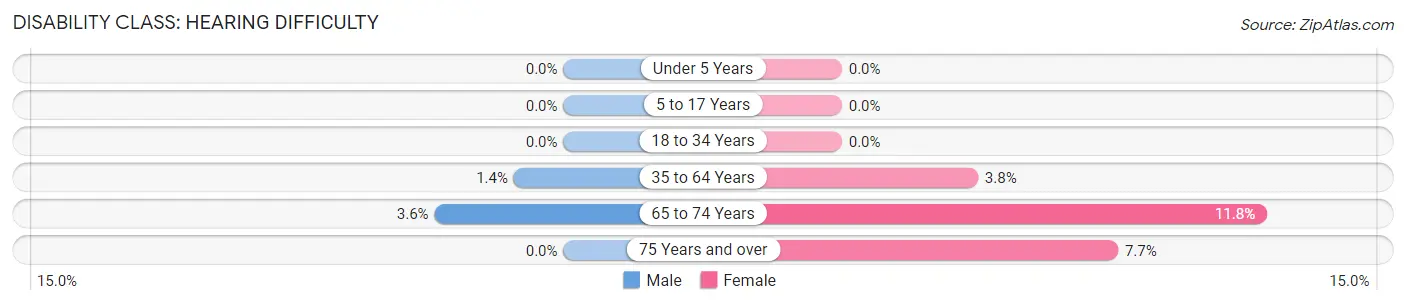
| Age Bracket | Male | Female |
| Under 5 Years | 0 (0.0%) | 0 (0.0%) |
| 5 to 17 Years | 0 (0.0%) | 0 (0.0%) |
| 18 to 34 Years | 0 (0.0%) | 0 (0.0%) |
| 35 to 64 Years | 10 (1.4%) | 37 (3.8%) |
| 65 to 74 Years | 7 (3.6%) | 18 (11.8%) |
| 75 Years and over | 0 (0.0%) | 9 (7.7%) |
Disability Class: Vision Difficulty
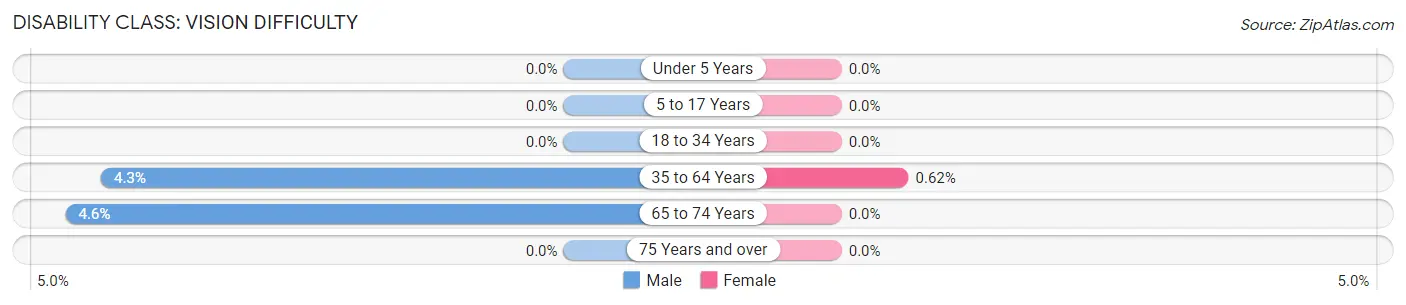
| Age Bracket | Male | Female |
| Under 5 Years | 0 (0.0%) | 0 (0.0%) |
| 5 to 17 Years | 0 (0.0%) | 0 (0.0%) |
| 18 to 34 Years | 0 (0.0%) | 0 (0.0%) |
| 35 to 64 Years | 31 (4.3%) | 6 (0.6%) |
| 65 to 74 Years | 9 (4.6%) | 0 (0.0%) |
| 75 Years and over | 0 (0.0%) | 0 (0.0%) |
Disability Class: Cognitive Difficulty
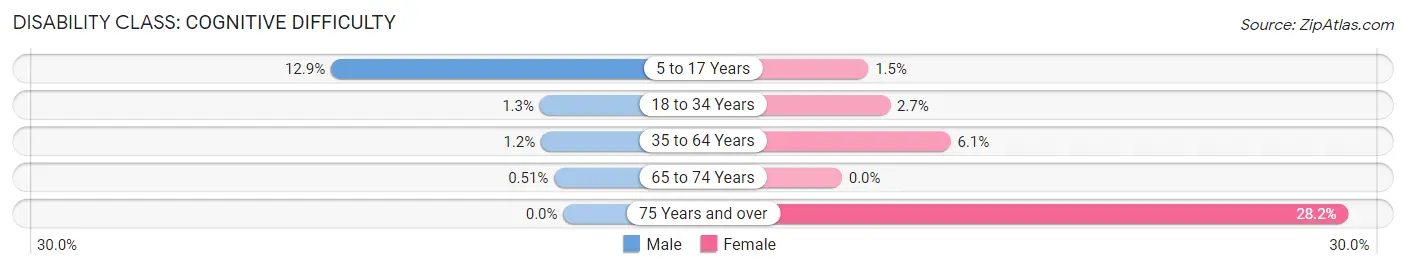
| Age Bracket | Male | Female |
| 5 to 17 Years | 33 (12.9%) | 5 (1.5%) |
| 18 to 34 Years | 6 (1.3%) | 14 (2.7%) |
| 35 to 64 Years | 9 (1.2%) | 59 (6.0%) |
| 65 to 74 Years | 1 (0.5%) | 0 (0.0%) |
| 75 Years and over | 0 (0.0%) | 33 (28.2%) |
Disability Class: Ambulatory Difficulty
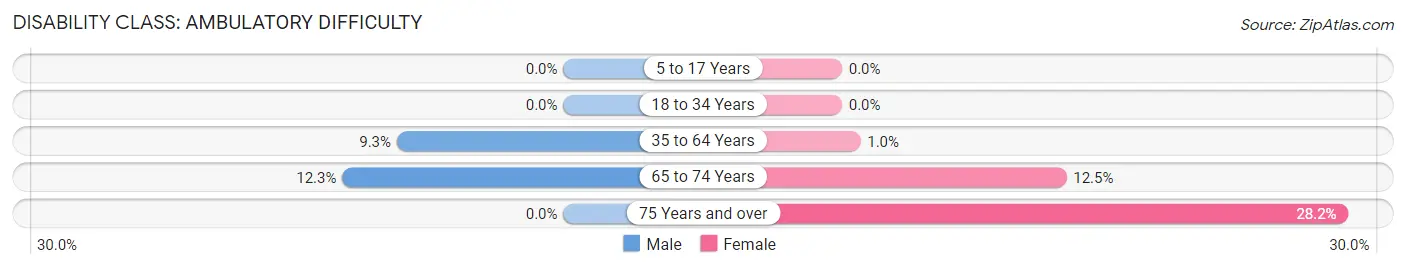
| Age Bracket | Male | Female |
| 5 to 17 Years | 0 (0.0%) | 0 (0.0%) |
| 18 to 34 Years | 0 (0.0%) | 0 (0.0%) |
| 35 to 64 Years | 67 (9.3%) | 10 (1.0%) |
| 65 to 74 Years | 24 (12.3%) | 19 (12.5%) |
| 75 Years and over | 0 (0.0%) | 33 (28.2%) |
Disability Class: Self-Care Difficulty
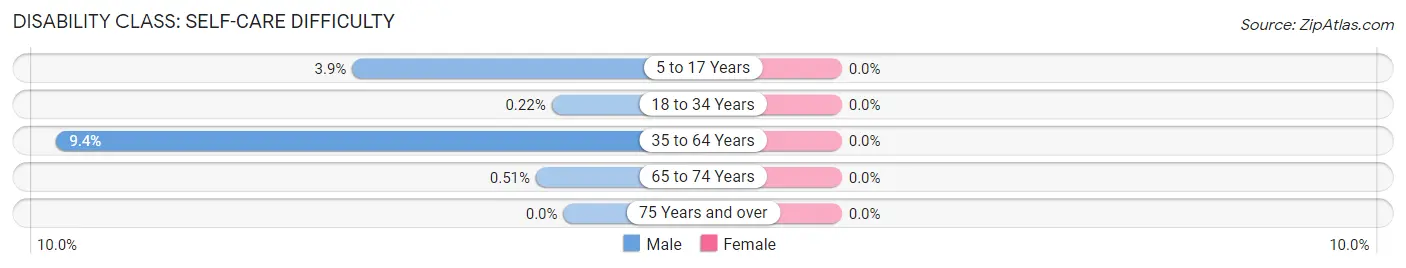
| Age Bracket | Male | Female |
| 5 to 17 Years | 10 (3.9%) | 0 (0.0%) |
| 18 to 34 Years | 1 (0.2%) | 0 (0.0%) |
| 35 to 64 Years | 68 (9.4%) | 0 (0.0%) |
| 65 to 74 Years | 1 (0.5%) | 0 (0.0%) |
| 75 Years and over | 0 (0.0%) | 0 (0.0%) |
Technology Access in Trappe borough
Computing Device Access in Trappe borough
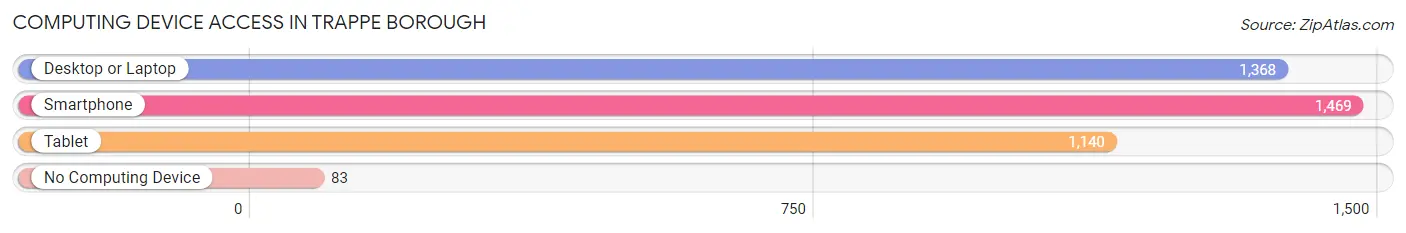
| Device Type | # Households | % Households |
| Desktop or Laptop | 1,368 | 86.0% |
| Smartphone | 1,469 | 92.3% |
| Tablet | 1,140 | 71.7% |
| No Computing Device | 83 | 5.2% |
| Total | 1,591 | 100.0% |
Internet Access in Trappe borough
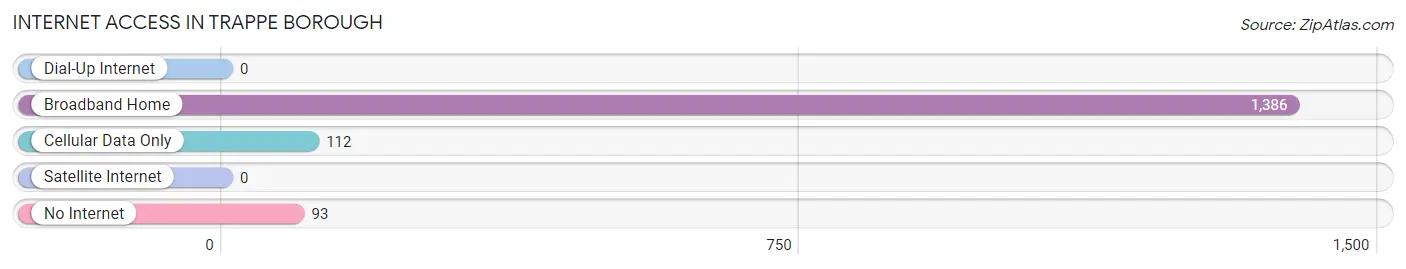
| Internet Type | # Households | % Households |
| Dial-Up Internet | 0 | 0.0% |
| Broadband Home | 1,386 | 87.1% |
| Cellular Data Only | 112 | 7.0% |
| Satellite Internet | 0 | 0.0% |
| No Internet | 93 | 5.9% |
| Total | 1,591 | 100.0% |
Trappe borough Summary
Trappe Borough is a small borough located in Montgomery County, Pennsylvania. It is situated in the southeastern part of the state, approximately 20 miles northwest of Philadelphia. The borough is bordered by Upper Providence Township to the north, Limerick Township to the east, Perkiomen Township to the south, and Collegeville Borough to the west. As of the 2010 census, the population of Trappe Borough was 2,128.
History
The area that is now Trappe Borough was first settled in the late 17th century by German immigrants. The town was originally known as “Falkner Swamp”, named after the family who owned the land. In 1717, the area was officially incorporated as Trappe Borough, named after the nearby Trappe Tavern. The tavern was a popular stop for travelers on the Great Road, which connected Philadelphia to Lancaster.
In the 19th century, Trappe Borough became a center of industry. The town was home to several mills, including a paper mill, a grist mill, and a saw mill. The paper mill was the largest employer in the area, and it was responsible for the growth of the town. In the late 19th century, the town also became a popular summer resort destination, with several hotels and resorts opening in the area.
Geography
Trappe Borough is located at 40°10'N 75°27'W (40.17, -75.45). According to the United States Census Bureau, the borough has a total area of 0.9 square miles (2.3 km2), all of which is land. The borough is located in the southeastern part of Montgomery County, approximately 20 miles northwest of Philadelphia.
Economy
The economy of Trappe Borough is largely based on small businesses and local services. The town is home to several restaurants, retail stores, and professional services. The largest employer in the area is the paper mill, which has been in operation since the 19th century. The town is also home to several small manufacturing companies, as well as a few medical offices.
Demographics
As of the 2010 census, there were 2,128 people, 845 households, and 590 families residing in the borough. The population density was 2,364.2 people per square mile (912.2/km2). There were 890 housing units at an average density of 990.2 per square mile (382.2/km2). The racial makeup of the borough was 94.2% White, 1.7% African American, 0.2% Native American, 1.2% Asian, 0.1% Pacific Islander, 1.2% from other races, and 1.6% from two or more races. Hispanic or Latino of any race were 3.2% of the population.
There were 845 households, out of which 28.2% had children under the age of 18 living with them, 54.2% were married couples living together, 10.2% had a female householder with no husband present, and 30.7% were non-families. 25.2% of all households were made up of individuals, and 11.2% had someone living alone who was 65 years of age or older. The average household size was 2.51 and the average family size was 3.03.
In the borough, the population was spread out, with 22.7% under the age of 18, 6.7% from 18 to 24, 28.2% from 25 to 44, 25.2% from 45 to 64, and 17.2% who were 65 years of age or older. The median age was 40 years. For every 100 females, there were 94.2 males. For every 100 females age 18 and over, there were 91.2 males.
The median income for a household in the borough was $54,917, and the median income for a family was $63,750. Males had a median income of $45,000 versus $35,000 for females. The per capita income for the borough was $25,945. About 4.2% of families and 5.2% of the population were below the poverty line, including 6.2% of those under age 18 and 4.2% of those age 65 or over.
Common Questions
What is Per Capita Income in Trappe borough?
Per Capita income in Trappe borough is $59,097.
What is the Median Family Income in Trappe borough?
Median Family Income in Trappe borough is $139,688.
What is the Median Household income in Trappe borough?
Median Household Income in Trappe borough is $111,875.
What is Income or Wage Gap in Trappe borough?
Income or Wage Gap in Trappe borough is 22.7%.
Women in Trappe borough earn 77.3 cents for every dollar earned by a man.
What is Inequality or Gini Index in Trappe borough?
Inequality or Gini Index in Trappe borough is 0.40.
What is the Total Population of Trappe borough?
Total Population of Trappe borough is 3,976.
What is the Total Male Population of Trappe borough?
Total Male Population of Trappe borough is 1,808.
What is the Total Female Population of Trappe borough?
Total Female Population of Trappe borough is 2,168.
What is the Ratio of Males per 100 Females in Trappe borough?
There are 83.39 Males per 100 Females in Trappe borough.
What is the Ratio of Females per 100 Males in Trappe borough?
There are 119.91 Females per 100 Males in Trappe borough.
What is the Median Population Age in Trappe borough?
Median Population Age in Trappe borough is 41.1 Years.
What is the Average Family Size in Trappe borough
Average Family Size in Trappe borough is 2.9 People.
What is the Average Household Size in Trappe borough
Average Household Size in Trappe borough is 2.5 People.
How Large is the Labor Force in Trappe borough?
There are 2,536 People in the Labor Forcein in Trappe borough.
What is the Percentage of People in the Labor Force in Trappe borough?
73.6% of People are in the Labor Force in Trappe borough.
What is the Unemployment Rate in Trappe borough?
Unemployment Rate in Trappe borough is 1.6%.