McKinley Heights, OH Map & Demographics
McKinley Heights Map
McKinley Heights Overview
$27,475
PER CAPITA INCOME
$60,179
AVG FAMILY INCOME
$40,240
AVG HOUSEHOLD INCOME
12.1%
WAGE / INCOME GAP [ % ]
87.9¢/ $1
WAGE / INCOME GAP [ $ ]
0.43
INEQUALITY / GINI INDEX
938
TOTAL POPULATION
555
MALE POPULATION
383
FEMALE POPULATION
144.91
MALES / 100 FEMALES
69.01
FEMALES / 100 MALES
47.2
MEDIAN AGE
3.0
AVG FAMILY SIZE
1.8
AVG HOUSEHOLD SIZE
414
LABOR FORCE [ PEOPLE ]
53.2%
PERCENT IN LABOR FORCE
12.1%
UNEMPLOYMENT RATE
Income in McKinley Heights
Income Overview in McKinley Heights
Per Capita Income in McKinley Heights is $27,475, while median incomes of families and households are $60,179 and $40,240 respectively.
| Characteristic | Number | Measure |
| Per Capita Income | 938 | $27,475 |
| Median Family Income | 185 | $60,179 |
| Mean Family Income | 185 | $66,148 |
| Median Household Income | 523 | $40,240 |
| Mean Household Income | 523 | $49,462 |
| Income Deficit | 185 | $0 |
| Wage / Income Gap (%) | 938 | 12.10% |
| Wage / Income Gap ($) | 938 | 87.90¢ per $1 |
| Gini / Inequality Index | 938 | 0.43 |
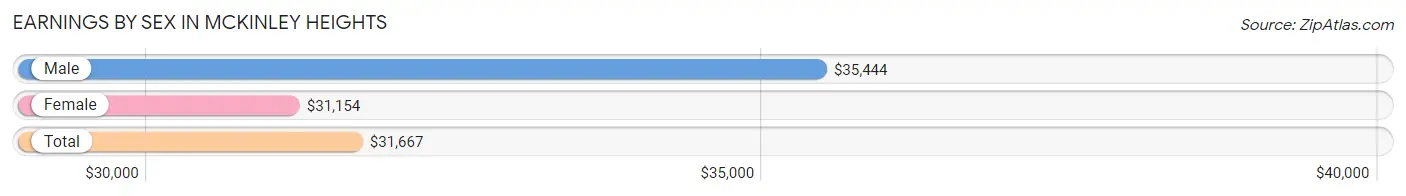
Earnings by Sex in McKinley Heights
Average Earnings in McKinley Heights are $31,667, $35,444 for men and $31,154 for women, a difference of 12.1%.
| Sex | Number | Average Earnings |
| Male | 188 (51.6%) | $35,444 |
| Female | 176 (48.3%) | $31,154 |
| Total | 364 (100.0%) | $31,667 |
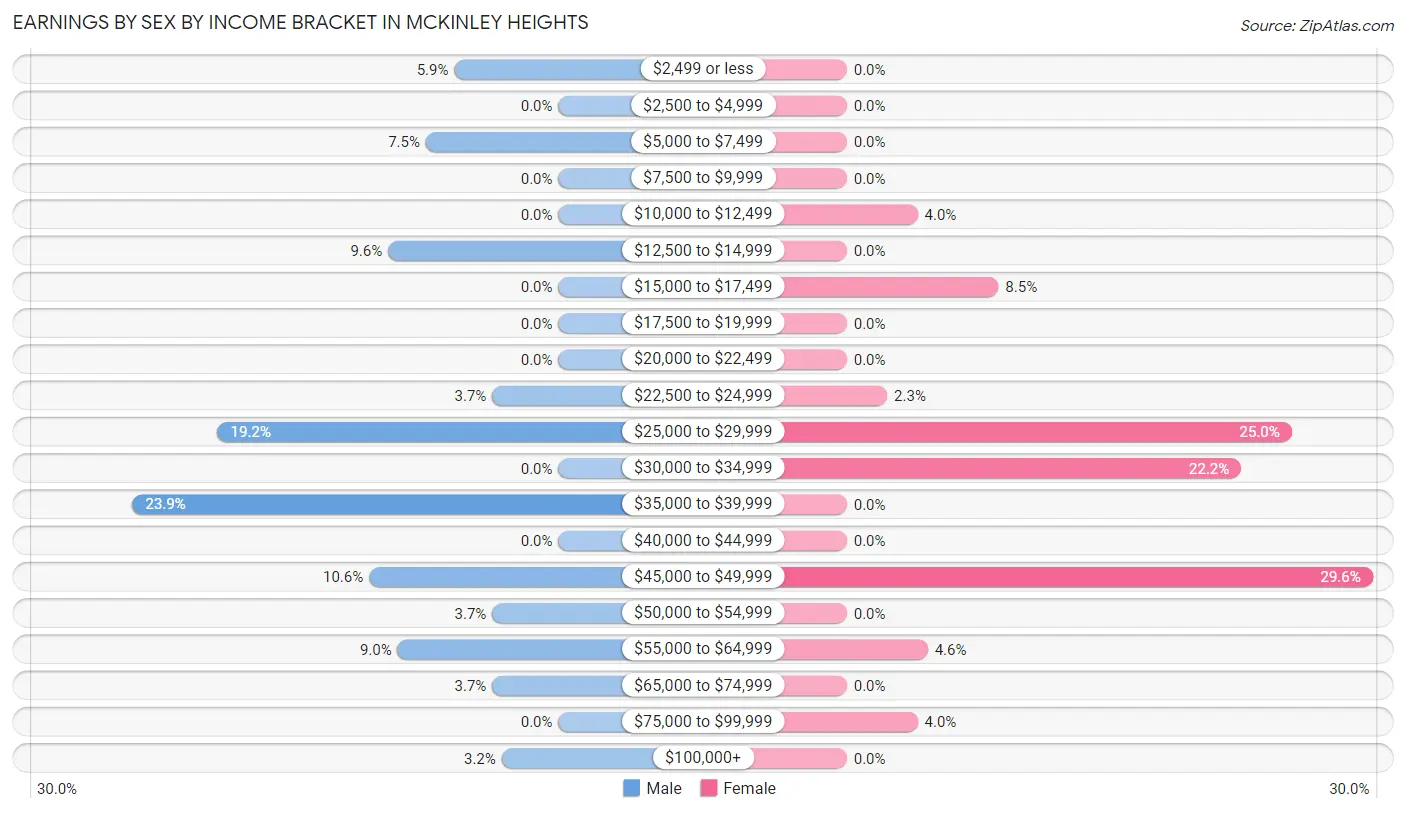
Earnings by Sex by Income Bracket in McKinley Heights
The most common earnings brackets in McKinley Heights are $35,000 to $39,999 for men (45 | 23.9%) and $45,000 to $49,999 for women (52 | 29.5%).
| Income | Male | Female |
| $2,499 or less | 11 (5.9%) | 0 (0.0%) |
| $2,500 to $4,999 | 0 (0.0%) | 0 (0.0%) |
| $5,000 to $7,499 | 14 (7.4%) | 0 (0.0%) |
| $7,500 to $9,999 | 0 (0.0%) | 0 (0.0%) |
| $10,000 to $12,499 | 0 (0.0%) | 7 (4.0%) |
| $12,500 to $14,999 | 18 (9.6%) | 0 (0.0%) |
| $15,000 to $17,499 | 0 (0.0%) | 15 (8.5%) |
| $17,500 to $19,999 | 0 (0.0%) | 0 (0.0%) |
| $20,000 to $22,499 | 0 (0.0%) | 0 (0.0%) |
| $22,500 to $24,999 | 7 (3.7%) | 4 (2.3%) |
| $25,000 to $29,999 | 36 (19.2%) | 44 (25.0%) |
| $30,000 to $34,999 | 0 (0.0%) | 39 (22.2%) |
| $35,000 to $39,999 | 45 (23.9%) | 0 (0.0%) |
| $40,000 to $44,999 | 0 (0.0%) | 0 (0.0%) |
| $45,000 to $49,999 | 20 (10.6%) | 52 (29.5%) |
| $50,000 to $54,999 | 7 (3.7%) | 0 (0.0%) |
| $55,000 to $64,999 | 17 (9.0%) | 8 (4.5%) |
| $65,000 to $74,999 | 7 (3.7%) | 0 (0.0%) |
| $75,000 to $99,999 | 0 (0.0%) | 7 (4.0%) |
| $100,000+ | 6 (3.2%) | 0 (0.0%) |
| Total | 188 (100.0%) | 176 (100.0%) |
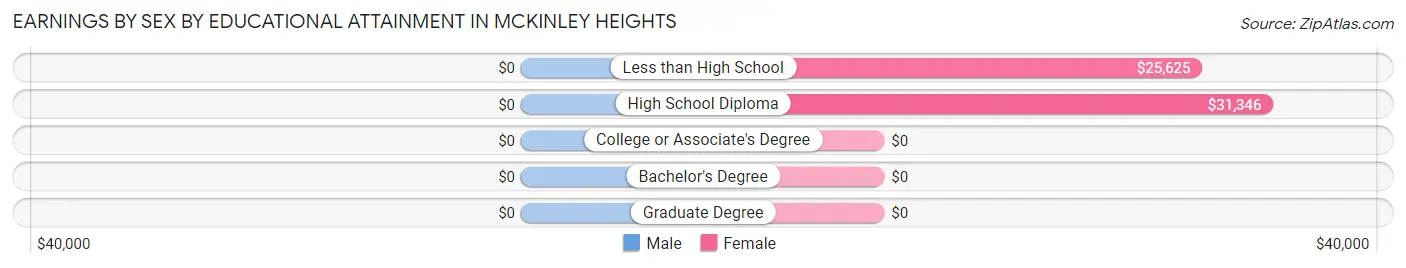
Earnings by Sex by Educational Attainment in McKinley Heights
| Educational Attainment | Male Income | Female Income |
| Less than High School | - | - |
| High School Diploma | - | - |
| College or Associate's Degree | - | - |
| Bachelor's Degree | - | - |
| Graduate Degree | - | - |
| Total | $35,444 | $31,154 |
Family Income in McKinley Heights
Family Income Brackets in McKinley Heights
According to the McKinley Heights family income data, there are 57 families falling into the $75,000 to $99,999 income range, which is the most common income bracket and makes up 30.8% of all families.
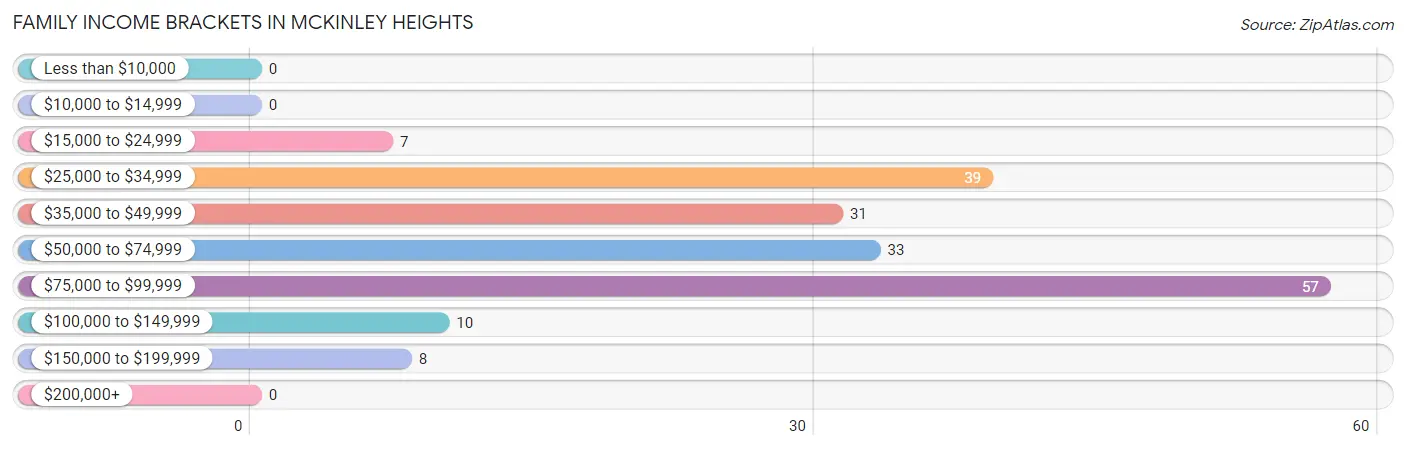
| Income Bracket | # Families | % Families |
| Less than $10,000 | 0 | 0.0% |
| $10,000 to $14,999 | 0 | 0.0% |
| $15,000 to $24,999 | 7 | 3.8% |
| $25,000 to $34,999 | 39 | 21.1% |
| $35,000 to $49,999 | 31 | 16.8% |
| $50,000 to $74,999 | 33 | 17.8% |
| $75,000 to $99,999 | 57 | 30.8% |
| $100,000 to $149,999 | 10 | 5.4% |
| $150,000 to $199,999 | 8 | 4.3% |
| $200,000+ | 0 | 0.0% |
Family Income by Famaliy Size in McKinley Heights
3-person families (93 | 50.3%) account for the highest median family income in McKinley Heights with $76,458 per family, while 3-person families (93 | 50.3%) have the highest median income of $25,486 per family member.
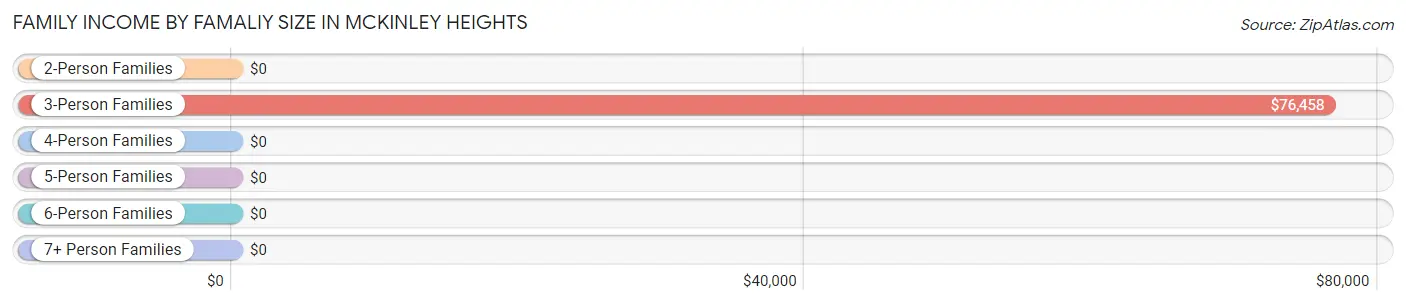
| Income Bracket | # Families | Median Income |
| 2-Person Families | 80 (43.2%) | $0 |
| 3-Person Families | 93 (50.3%) | $76,458 |
| 4-Person Families | 4 (2.2%) | $0 |
| 5-Person Families | 8 (4.3%) | $0 |
| 6-Person Families | 0 (0.0%) | $0 |
| 7+ Person Families | 0 (0.0%) | $0 |
| Total | 185 (100.0%) | $60,179 |
Family Income by Number of Earners in McKinley Heights
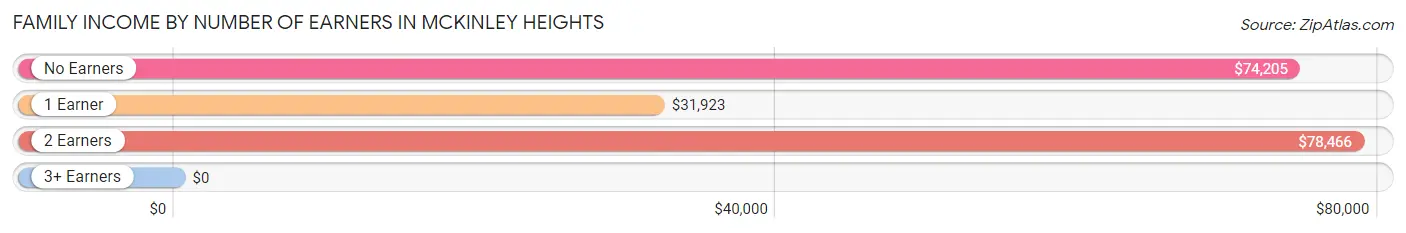
| Number of Earners | # Families | Median Income |
| No Earners | 27 (14.6%) | $74,205 |
| 1 Earner | 74 (40.0%) | $31,923 |
| 2 Earners | 84 (45.4%) | $78,466 |
| 3+ Earners | 0 (0.0%) | $0 |
| Total | 185 (100.0%) | $60,179 |
Household Income in McKinley Heights
Household Income Brackets in McKinley Heights
With 165 households falling in the category, the $15,000 to $24,999 income range is the most frequent in McKinley Heights, accounting for 31.6% of all households.
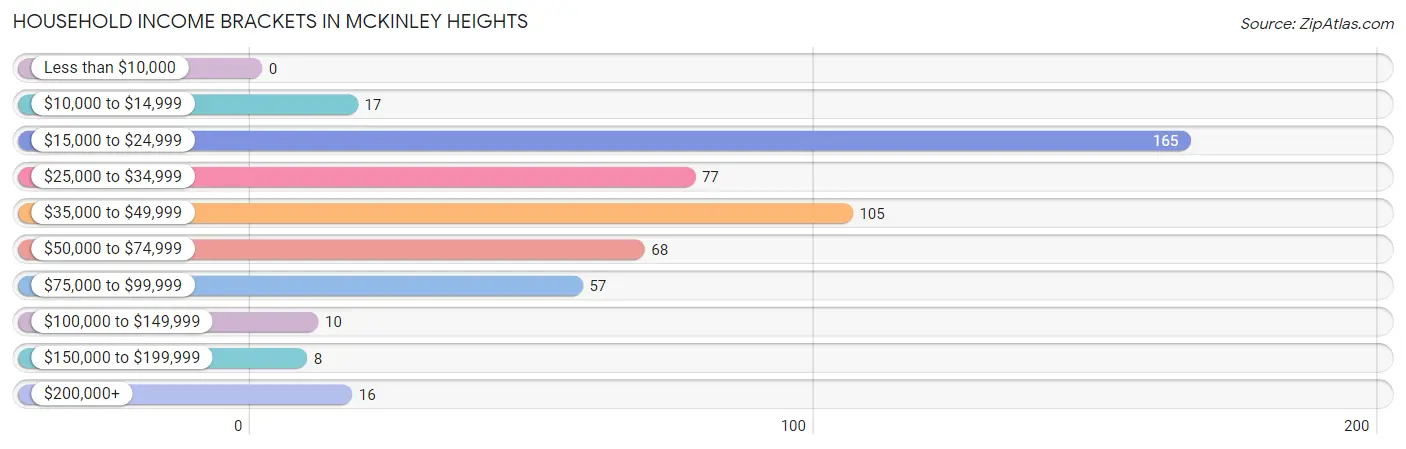
| Income Bracket | # Households | % Households |
| Less than $10,000 | 0 | 0.0% |
| $10,000 to $14,999 | 17 | 3.3% |
| $15,000 to $24,999 | 165 | 31.5% |
| $25,000 to $34,999 | 77 | 14.7% |
| $35,000 to $49,999 | 105 | 20.1% |
| $50,000 to $74,999 | 68 | 13.0% |
| $75,000 to $99,999 | 57 | 10.9% |
| $100,000 to $149,999 | 10 | 1.9% |
| $150,000 to $199,999 | 8 | 1.5% |
| $200,000+ | 16 | 3.1% |
Household Income by Householder Age in McKinley Heights
The median household income in McKinley Heights is $40,240, with the highest median household income of $49,881 found in the 25 to 44 years age bracket for the primary householder. A total of 54 households (10.3%) fall into this category.
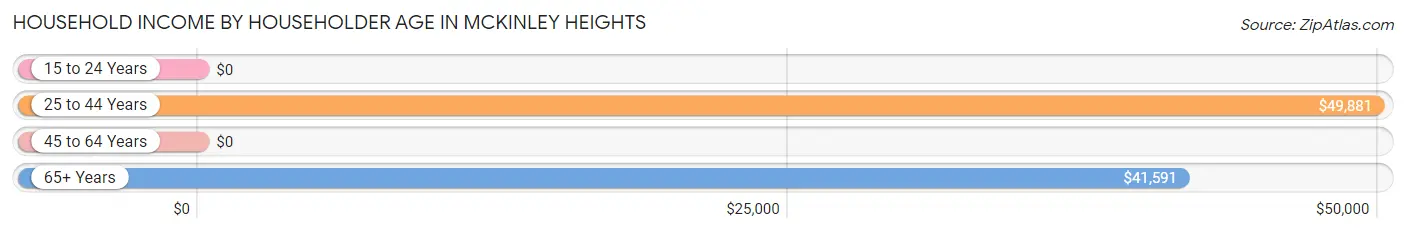
| Income Bracket | # Households | Median Income |
| 15 to 24 Years | 0 (0.0%) | $0 |
| 25 to 44 Years | 54 (10.3%) | $49,881 |
| 45 to 64 Years | 325 (62.1%) | $0 |
| 65+ Years | 144 (27.5%) | $41,591 |
| Total | 523 (100.0%) | $40,240 |
Poverty in McKinley Heights
Income Below Poverty by Sex and Age in McKinley Heights
With 5.6% poverty level for males and 6.3% for females among the residents of McKinley Heights, 12 to 14 year old males and 25 to 34 year old females are the most vulnerable to poverty, with 7 males (63.6%) and 6 females (100.0%) in their respective age groups living below the poverty level.
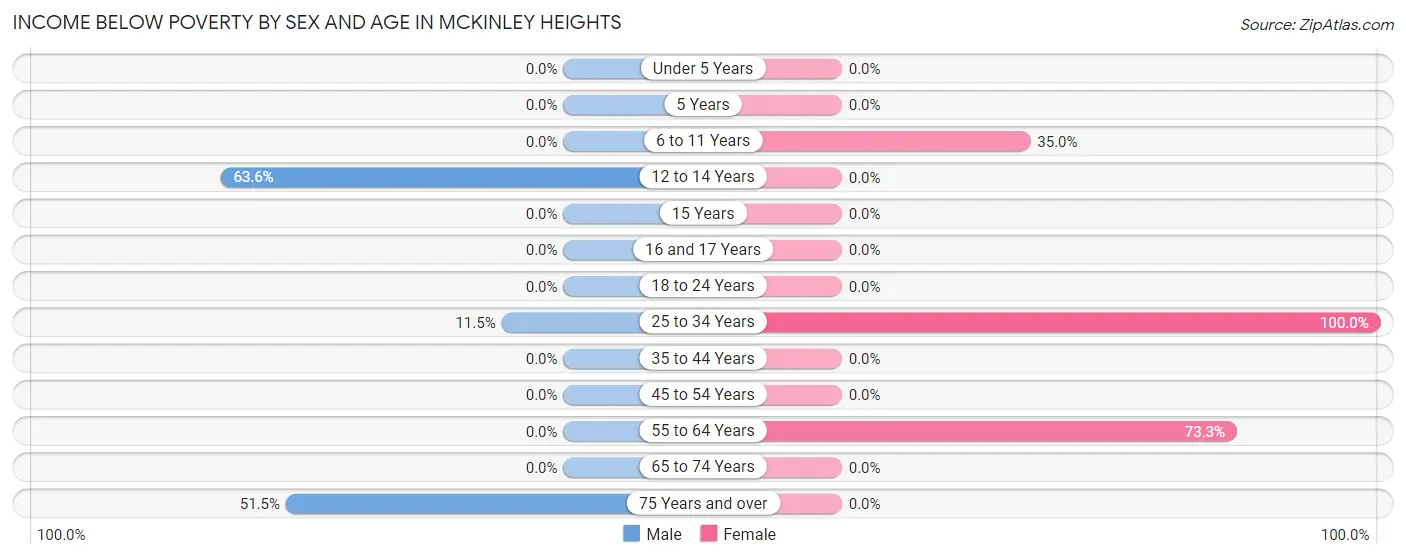
| Age Bracket | Male | Female |
| Under 5 Years | 0 (0.0%) | 0 (0.0%) |
| 5 Years | 0 (0.0%) | 0 (0.0%) |
| 6 to 11 Years | 0 (0.0%) | 7 (35.0%) |
| 12 to 14 Years | 7 (63.6%) | 0 (0.0%) |
| 15 Years | 0 (0.0%) | 0 (0.0%) |
| 16 and 17 Years | 0 (0.0%) | 0 (0.0%) |
| 18 to 24 Years | 0 (0.0%) | 0 (0.0%) |
| 25 to 34 Years | 7 (11.5%) | 6 (100.0%) |
| 35 to 44 Years | 0 (0.0%) | 0 (0.0%) |
| 45 to 54 Years | 0 (0.0%) | 0 (0.0%) |
| 55 to 64 Years | 0 (0.0%) | 11 (73.3%) |
| 65 to 74 Years | 0 (0.0%) | 0 (0.0%) |
| 75 Years and over | 17 (51.5%) | 0 (0.0%) |
| Total | 31 (5.6%) | 24 (6.3%) |
Income Above Poverty by Sex and Age in McKinley Heights
According to the poverty statistics in McKinley Heights, males aged 6 to 11 years and females aged 18 to 24 years are the age groups that are most secure financially, with 100.0% of males and 100.0% of females in these age groups living above the poverty line.
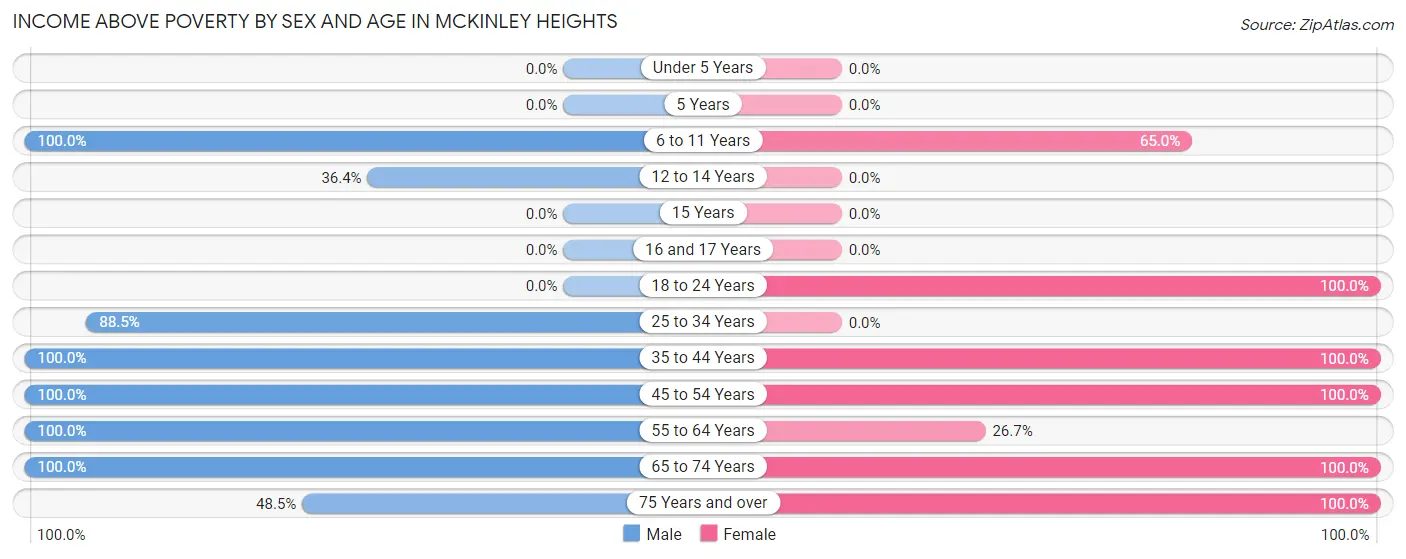
| Age Bracket | Male | Female |
| Under 5 Years | 0 (0.0%) | 0 (0.0%) |
| 5 Years | 0 (0.0%) | 0 (0.0%) |
| 6 to 11 Years | 129 (100.0%) | 13 (65.0%) |
| 12 to 14 Years | 4 (36.4%) | 0 (0.0%) |
| 15 Years | 0 (0.0%) | 0 (0.0%) |
| 16 and 17 Years | 0 (0.0%) | 0 (0.0%) |
| 18 to 24 Years | 0 (0.0%) | 45 (100.0%) |
| 25 to 34 Years | 54 (88.5%) | 0 (0.0%) |
| 35 to 44 Years | 51 (100.0%) | 34 (100.0%) |
| 45 to 54 Years | 42 (100.0%) | 142 (100.0%) |
| 55 to 64 Years | 176 (100.0%) | 4 (26.7%) |
| 65 to 74 Years | 52 (100.0%) | 77 (100.0%) |
| 75 Years and over | 16 (48.5%) | 44 (100.0%) |
| Total | 524 (94.4%) | 359 (93.7%) |
Income Below Poverty Among Married-Couple Families in McKinley Heights
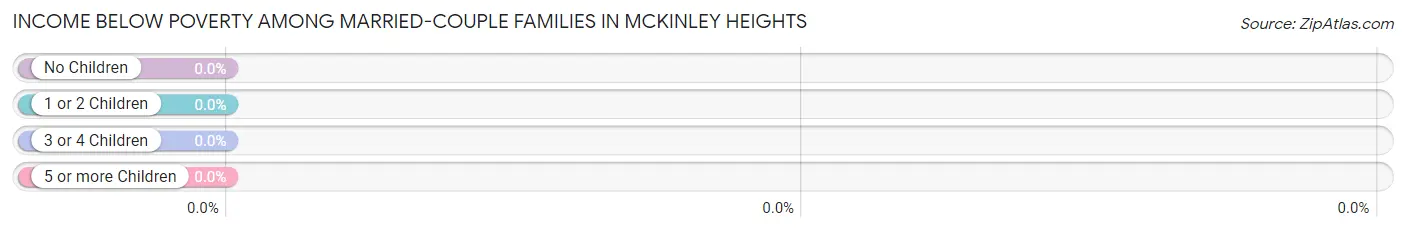
| Children | Above Poverty | Below Poverty |
| No Children | 74 (100.0%) | 0 (0.0%) |
| 1 or 2 Children | 25 (100.0%) | 0 (0.0%) |
| 3 or 4 Children | 8 (100.0%) | 0 (0.0%) |
| 5 or more Children | 0 (0.0%) | 0 (0.0%) |
| Total | 107 (100.0%) | 0 (0.0%) |
Income Below Poverty Among Single-Parent Households in McKinley Heights
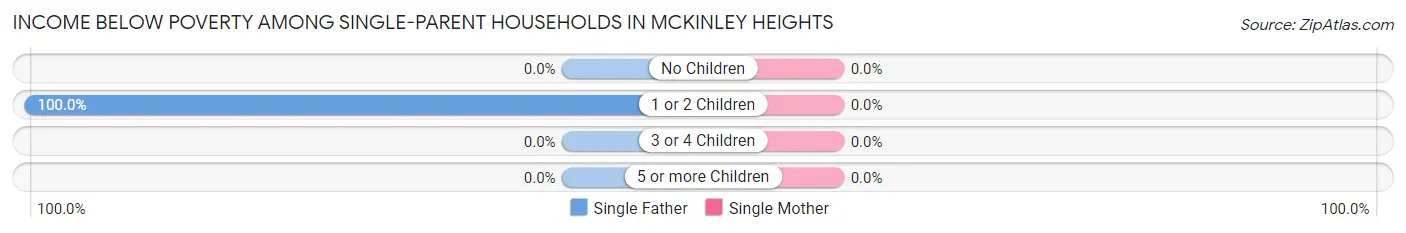
| Children | Single Father | Single Mother |
| No Children | 0 (0.0%) | 0 (0.0%) |
| 1 or 2 Children | 7 (100.0%) | 0 (0.0%) |
| 3 or 4 Children | 0 (0.0%) | 0 (0.0%) |
| 5 or more Children | 0 (0.0%) | 0 (0.0%) |
| Total | 7 (100.0%) | 0 (0.0%) |
Income Below Poverty Among Married-Couple vs Single-Parent Households in McKinley Heights
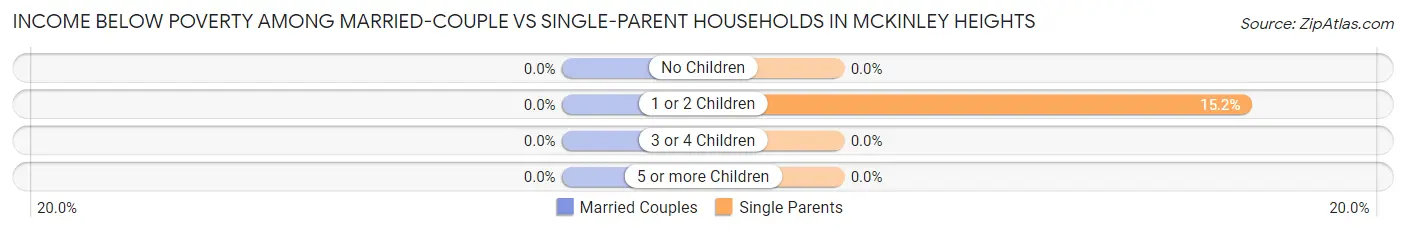
| Children | Married-Couple Families | Single-Parent Households |
| No Children | 0 (0.0%) | 0 (0.0%) |
| 1 or 2 Children | 0 (0.0%) | 7 (15.2%) |
| 3 or 4 Children | 0 (0.0%) | 0 (0.0%) |
| 5 or more Children | 0 (0.0%) | 0 (0.0%) |
| Total | 0 (0.0%) | 7 (9.0%) |
Race in McKinley Heights
The most populous races in McKinley Heights are White / Caucasian (799 | 85.2%), and Black / African American (139 | 14.8%).
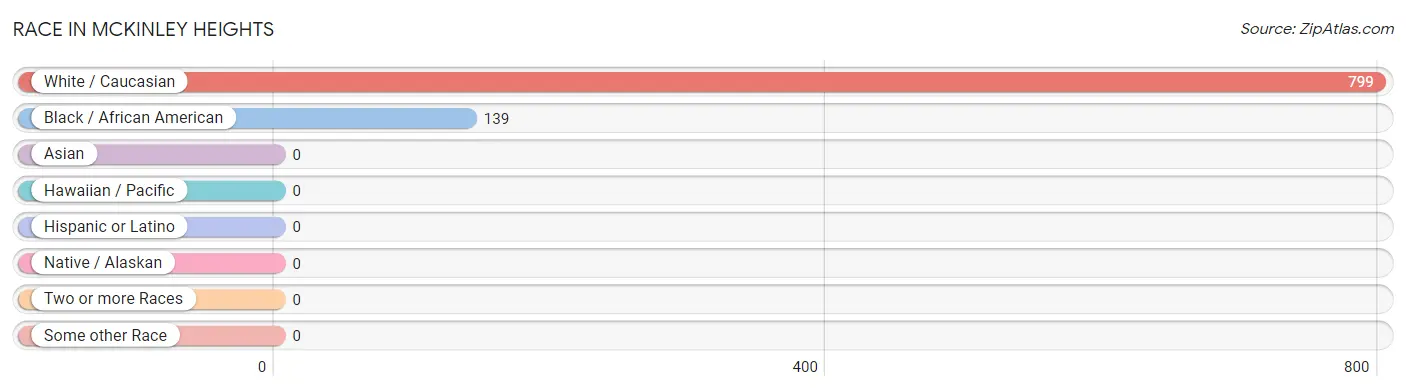
| Race | # Population | % Population |
| Asian | 0 | 0.0% |
| Black / African American | 139 | 14.8% |
| Hawaiian / Pacific | 0 | 0.0% |
| Hispanic or Latino | 0 | 0.0% |
| Native / Alaskan | 0 | 0.0% |
| White / Caucasian | 799 | 85.2% |
| Two or more Races | 0 | 0.0% |
| Some other Race | 0 | 0.0% |
| Total | 938 | 100.0% |
Ancestry in McKinley Heights
The most populous ancestries reported in McKinley Heights are American (187 | 19.9%), Italian (122 | 13.0%), German (115 | 12.3%), Irish (65 | 6.9%), and Romanian (36 | 3.8%), together accounting for 56.0% of all McKinley Heights residents.
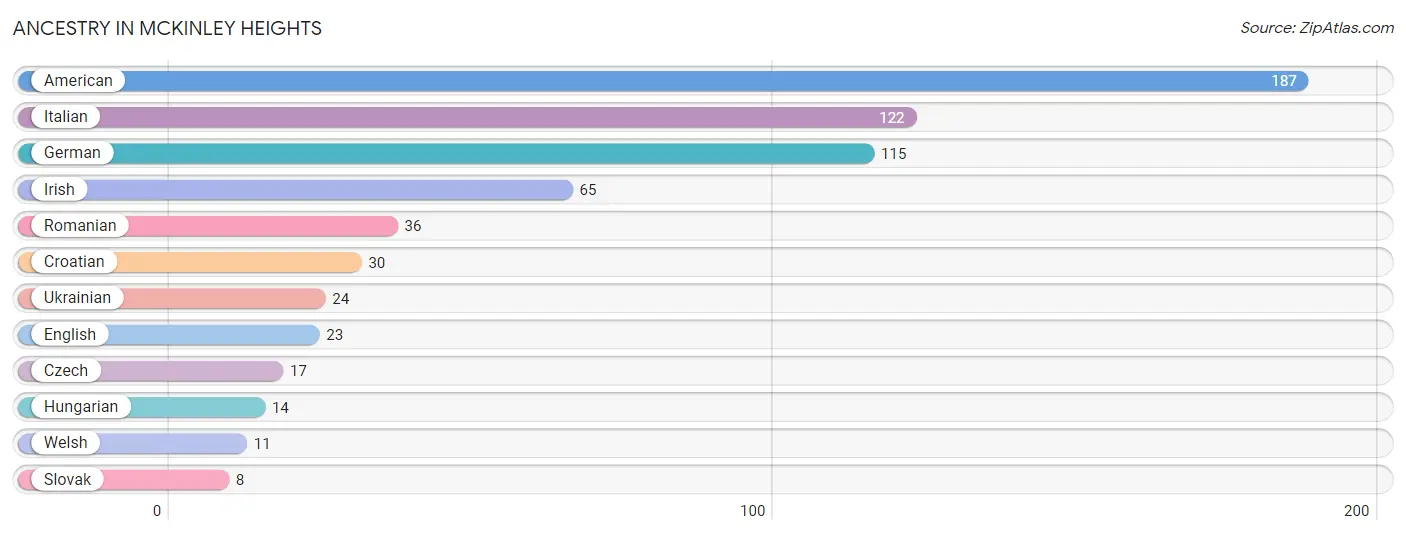
| Ancestry | # Population | % Population |
| American | 187 | 19.9% |
| Croatian | 30 | 3.2% |
| Czech | 17 | 1.8% |
| English | 23 | 2.5% |
| German | 115 | 12.3% |
| Hungarian | 14 | 1.5% |
| Irish | 65 | 6.9% |
| Italian | 122 | 13.0% |
| Romanian | 36 | 3.8% |
| Slovak | 8 | 0.9% |
| Ukrainian | 24 | 2.6% |
| Welsh | 11 | 1.2% | View All 12 Rows |
Immigrants in McKinley Heights

| Immigration Origin | # Population | % Population | View All 0 Rows |
Sex and Age in McKinley Heights
Sex and Age in McKinley Heights
The most populous age groups in McKinley Heights are 60 to 64 Years (165 | 29.7%) for men and 45 to 49 Years (142 | 37.1%) for women.
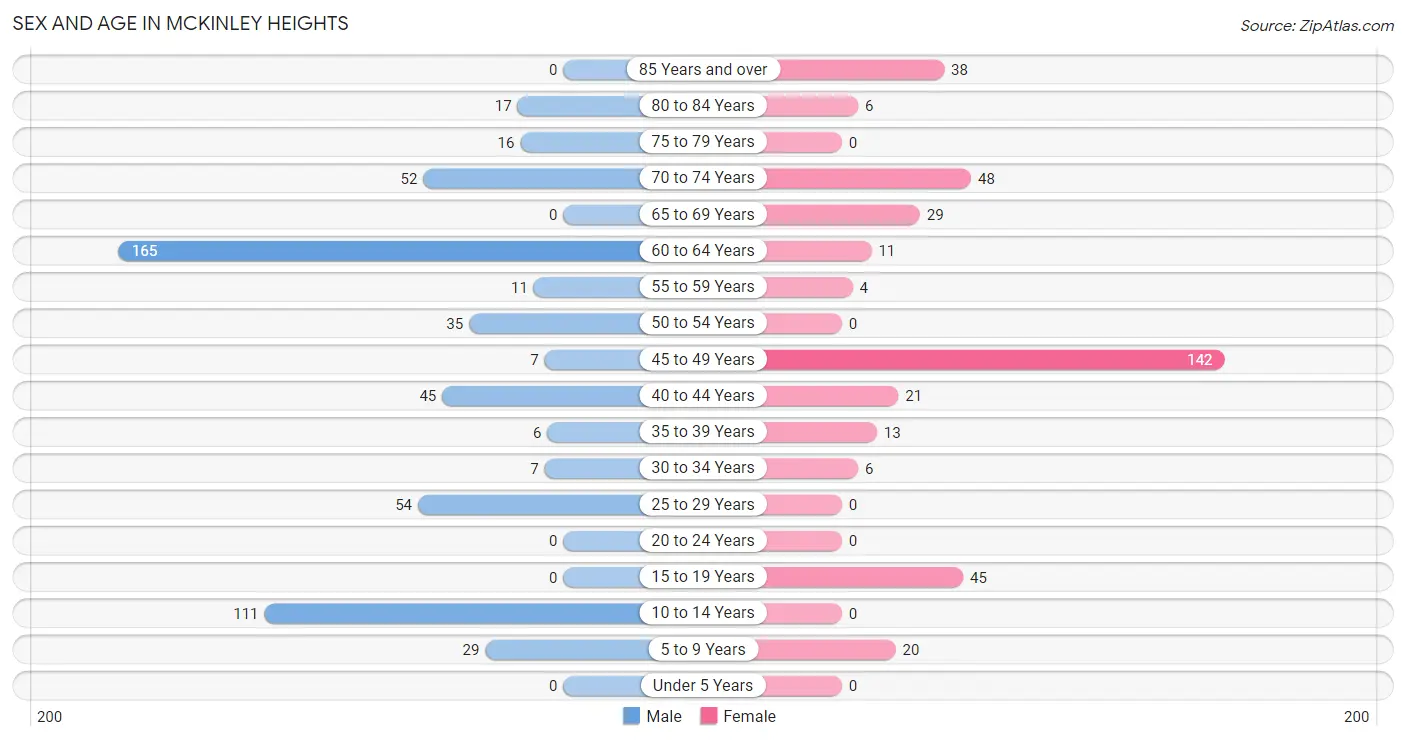
| Age Bracket | Male | Female |
| Under 5 Years | 0 (0.0%) | 0 (0.0%) |
| 5 to 9 Years | 29 (5.2%) | 20 (5.2%) |
| 10 to 14 Years | 111 (20.0%) | 0 (0.0%) |
| 15 to 19 Years | 0 (0.0%) | 45 (11.7%) |
| 20 to 24 Years | 0 (0.0%) | 0 (0.0%) |
| 25 to 29 Years | 54 (9.7%) | 0 (0.0%) |
| 30 to 34 Years | 7 (1.3%) | 6 (1.6%) |
| 35 to 39 Years | 6 (1.1%) | 13 (3.4%) |
| 40 to 44 Years | 45 (8.1%) | 21 (5.5%) |
| 45 to 49 Years | 7 (1.3%) | 142 (37.1%) |
| 50 to 54 Years | 35 (6.3%) | 0 (0.0%) |
| 55 to 59 Years | 11 (2.0%) | 4 (1.0%) |
| 60 to 64 Years | 165 (29.7%) | 11 (2.9%) |
| 65 to 69 Years | 0 (0.0%) | 29 (7.6%) |
| 70 to 74 Years | 52 (9.4%) | 48 (12.5%) |
| 75 to 79 Years | 16 (2.9%) | 0 (0.0%) |
| 80 to 84 Years | 17 (3.1%) | 6 (1.6%) |
| 85 Years and over | 0 (0.0%) | 38 (9.9%) |
| Total | 555 (100.0%) | 383 (100.0%) |
Families and Households in McKinley Heights
Median Family Size in McKinley Heights
The median family size in McKinley Heights is 3.04 persons per family, with single female/mother families (71 | 38.4%) accounting for the largest median family size of 3.18 persons per family. On the other hand, married-couple families (107 | 57.8%) represent the smallest median family size with 2.94 persons per family.
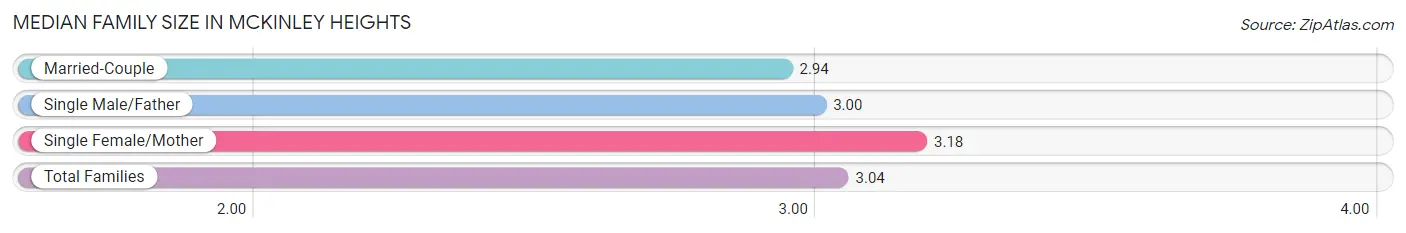
| Family Type | # Families | Family Size |
| Married-Couple | 107 (57.8%) | 2.94 |
| Single Male/Father | 7 (3.8%) | 3.00 |
| Single Female/Mother | 71 (38.4%) | 3.18 |
| Total Families | 185 (100.0%) | 3.04 |
Median Household Size in McKinley Heights
The median household size in McKinley Heights is 1.79 persons per household, with single male/father households (7 | 1.3%) accounting for the largest median household size of 3.86 persons per household. non-family households (338 | 64.6%) represent the smallest median household size with 1.09 persons per household.
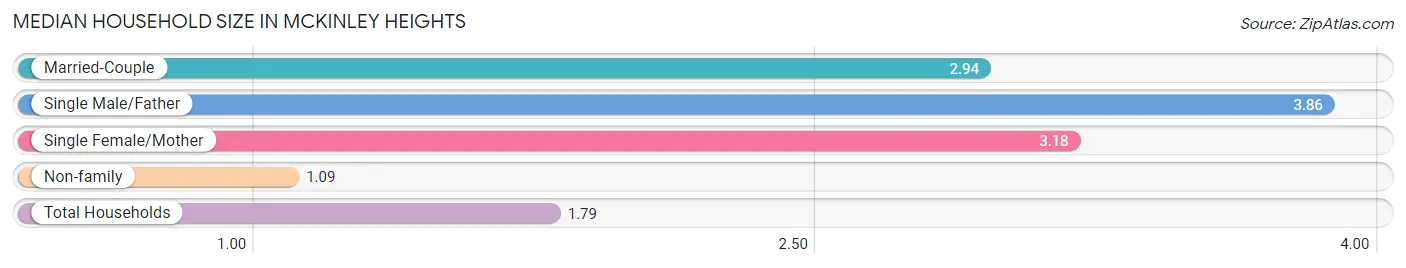
| Household Type | # Households | Household Size |
| Married-Couple | 107 (20.5%) | 2.94 |
| Single Male/Father | 7 (1.3%) | 3.86 |
| Single Female/Mother | 71 (13.6%) | 3.18 |
| Non-family | 338 (64.6%) | 1.09 |
| Total Households | 523 (100.0%) | 1.79 |
Household Size by Marriage Status in McKinley Heights
Out of a total of 523 households in McKinley Heights, 185 (35.4%) are family households, while 338 (64.6%) are nonfamily households. The most numerous type of family households are 3-person households, comprising 86, and the most common type of nonfamily households are 1-person households, comprising 309.
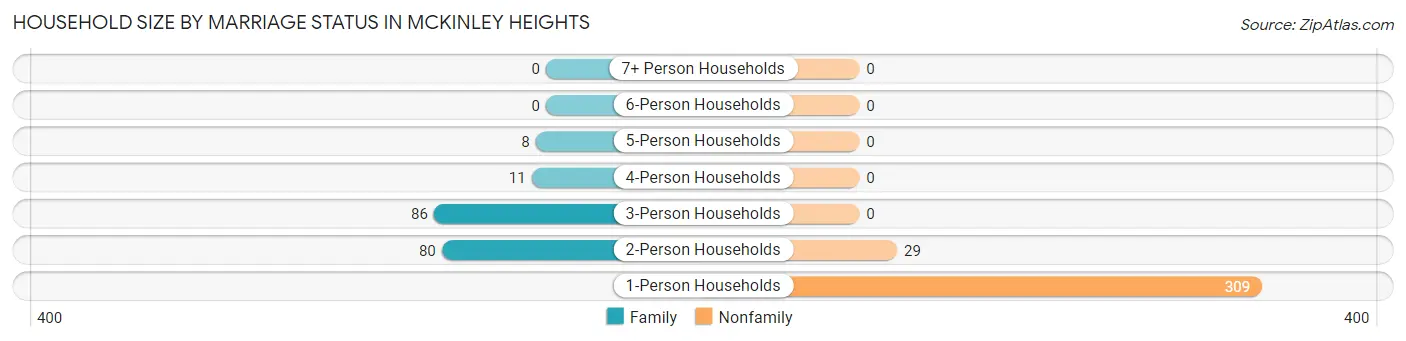
| Household Size | Family Households | Nonfamily Households |
| 1-Person Households | - | 309 (59.1%) |
| 2-Person Households | 80 (15.3%) | 29 (5.5%) |
| 3-Person Households | 86 (16.4%) | 0 (0.0%) |
| 4-Person Households | 11 (2.1%) | 0 (0.0%) |
| 5-Person Households | 8 (1.5%) | 0 (0.0%) |
| 6-Person Households | 0 (0.0%) | 0 (0.0%) |
| 7+ Person Households | 0 (0.0%) | 0 (0.0%) |
| Total | 185 (35.4%) | 338 (64.6%) |
Female Fertility in McKinley Heights
Fertility by Age in McKinley Heights
| Age Bracket | Women with Births | Births / 1,000 Women |
| 15 to 19 years | 0 (0.0%) | 0.0 |
| 20 to 34 years | 0 (0.0%) | 0.0 |
| 35 to 50 years | 0 (0.0%) | 0.0 |
| Total | 0 (0.0%) | 0.0 |
Fertility by Age by Marriage Status in McKinley Heights
| Age Bracket | Married | Unmarried |
| 15 to 19 years | 0 (0.0%) | 0 (0.0%) |
| 20 to 34 years | 0 (0.0%) | 0 (0.0%) |
| 35 to 50 years | 0 (0.0%) | 0 (0.0%) |
| Total | 0 (0.0%) | 0 (0.0%) |
Fertility by Education in McKinley Heights
| Educational Attainment | Women with Births | Births / 1,000 Women |
| Less than High School | 0 (0.0%) | 0.0 |
| High School Diploma | 0 (0.0%) | 0.0 |
| College or Associate's Degree | 0 (0.0%) | 0.0 |
| Bachelor's Degree | 0 (0.0%) | 0.0 |
| Graduate Degree | 0 (0.0%) | 0.0 |
| Total | 0 (0.0%) | 0.0 |
Fertility by Education by Marriage Status in McKinley Heights
| Educational Attainment | Married | Unmarried |
| Less than High School | 0 (0.0%) | 0 (0.0%) |
| High School Diploma | 0 (0.0%) | 0 (0.0%) |
| College or Associate's Degree | 0 (0.0%) | 0 (0.0%) |
| Bachelor's Degree | 0 (0.0%) | 0 (0.0%) |
| Graduate Degree | 0 (0.0%) | 0 (0.0%) |
| Total | 0 (0.0%) | 0 (0.0%) |
Employment Characteristics in McKinley Heights
Employment by Class of Employer in McKinley Heights
Among the 364 employed individuals in McKinley Heights, private company employees (289 | 79.4%), not-for-profit organizations (53 | 14.6%), and local government employees (15 | 4.1%) make up the most common classes of employment.
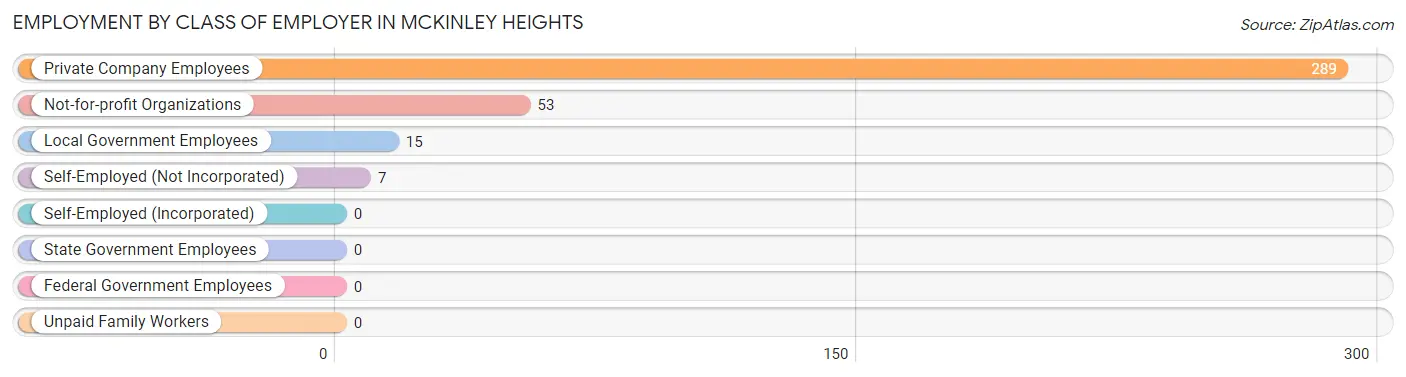
| Employer Class | # Employees | % Employees |
| Private Company Employees | 289 | 79.4% |
| Self-Employed (Incorporated) | 0 | 0.0% |
| Self-Employed (Not Incorporated) | 7 | 1.9% |
| Not-for-profit Organizations | 53 | 14.6% |
| Local Government Employees | 15 | 4.1% |
| State Government Employees | 0 | 0.0% |
| Federal Government Employees | 0 | 0.0% |
| Unpaid Family Workers | 0 | 0.0% |
| Total | 364 | 100.0% |
Employment Status by Age in McKinley Heights
According to the labor force statistics for McKinley Heights, out of the total population over 16 years of age (778), 53.2% or 414 individuals are in the labor force, with 12.1% or 50 of them unemployed. The age group with the highest labor force participation rate is 16 to 19 years, with 100.0% or 45 individuals in the labor force. Within the labor force, the 16 to 19 years age range has the highest percentage of unemployed individuals, with 100.0% or 45 of them being unemployed.
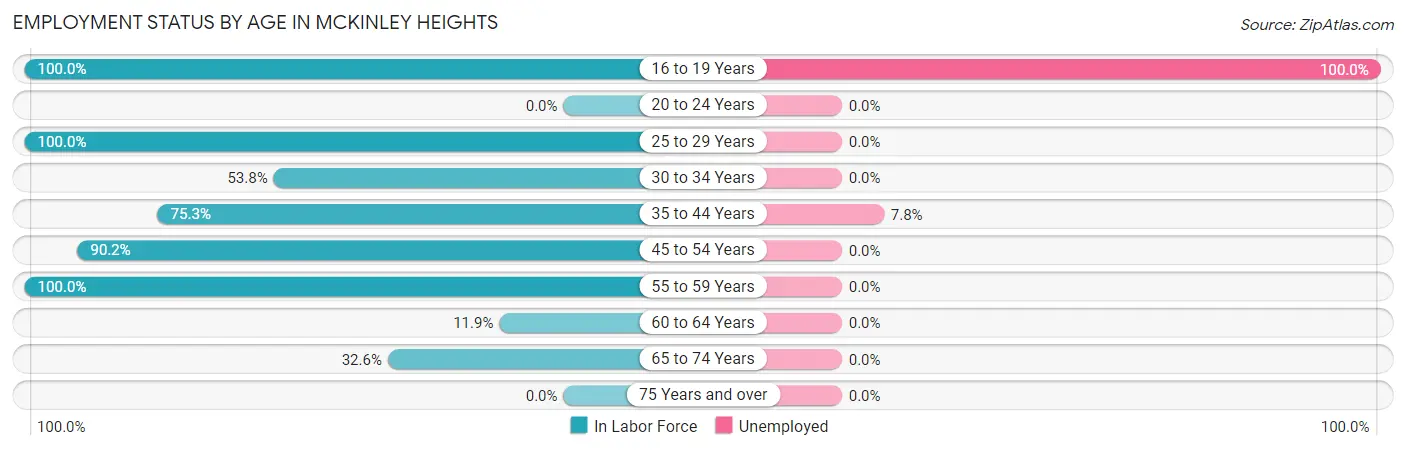
| Age Bracket | In Labor Force | Unemployed |
| 16 to 19 Years | 45 (100.0%) | 45 (100.0%) |
| 20 to 24 Years | 0 (0.0%) | 0 (0.0%) |
| 25 to 29 Years | 54 (100.0%) | 0 (0.0%) |
| 30 to 34 Years | 7 (53.8%) | 0 (0.0%) |
| 35 to 44 Years | 64 (75.3%) | 5 (7.8%) |
| 45 to 54 Years | 166 (90.2%) | 0 (0.0%) |
| 55 to 59 Years | 15 (100.0%) | 0 (0.0%) |
| 60 to 64 Years | 21 (11.9%) | 0 (0.0%) |
| 65 to 74 Years | 42 (32.6%) | 0 (0.0%) |
| 75 Years and over | 0 (0.0%) | 0 (0.0%) |
| Total | 414 (53.2%) | 50 (12.1%) |
Employment Status by Educational Attainment in McKinley Heights
According to labor force statistics for McKinley Heights, 62.0% of individuals (327) out of the total population between 25 and 64 years of age (527) are in the labor force, with 1.5% or 5 of them being unemployed. The group with the highest labor force participation rate are those with the educational attainment of less than high school, with 91.2% or 62 individuals in the labor force. Within the labor force, individuals with high school diploma education have the highest percentage of unemployment, with 4.8% or 5 of them being unemployed.
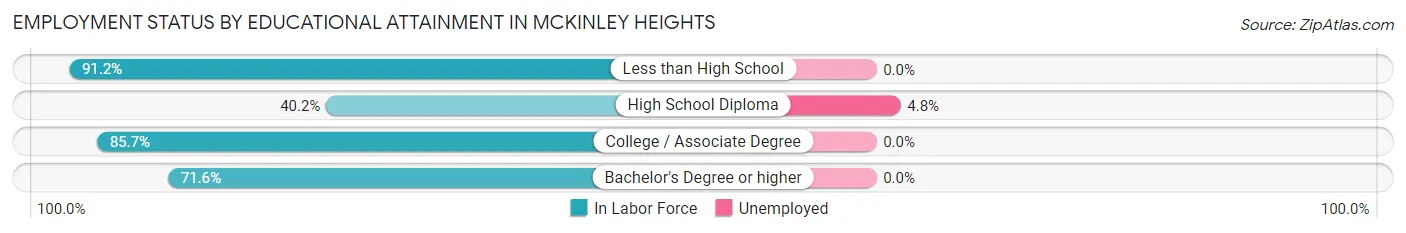
| Educational Attainment | In Labor Force | Unemployed |
| Less than High School | 62 (91.2%) | 0 (0.0%) |
| High School Diploma | 104 (40.2%) | 12 (4.8%) |
| College / Associate Degree | 108 (85.7%) | 0 (0.0%) |
| Bachelor's Degree or higher | 53 (71.6%) | 0 (0.0%) |
| Total | 327 (62.0%) | 8 (1.5%) |
Employment Occupations by Sex in McKinley Heights
Management, Business, Science and Arts Occupations
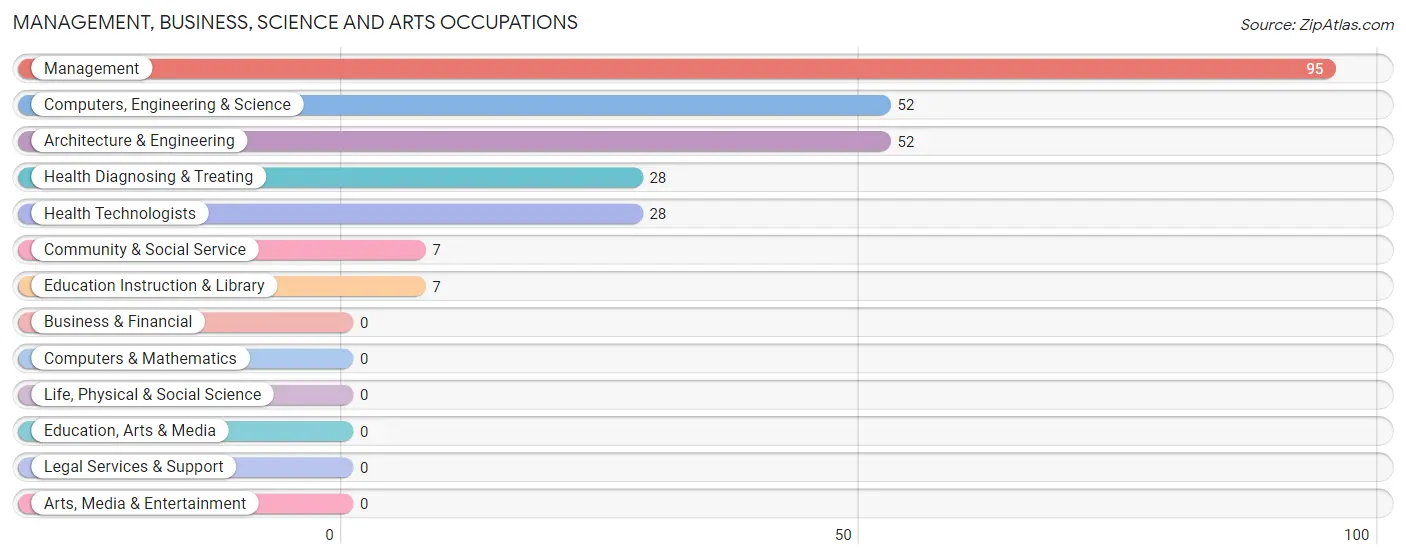
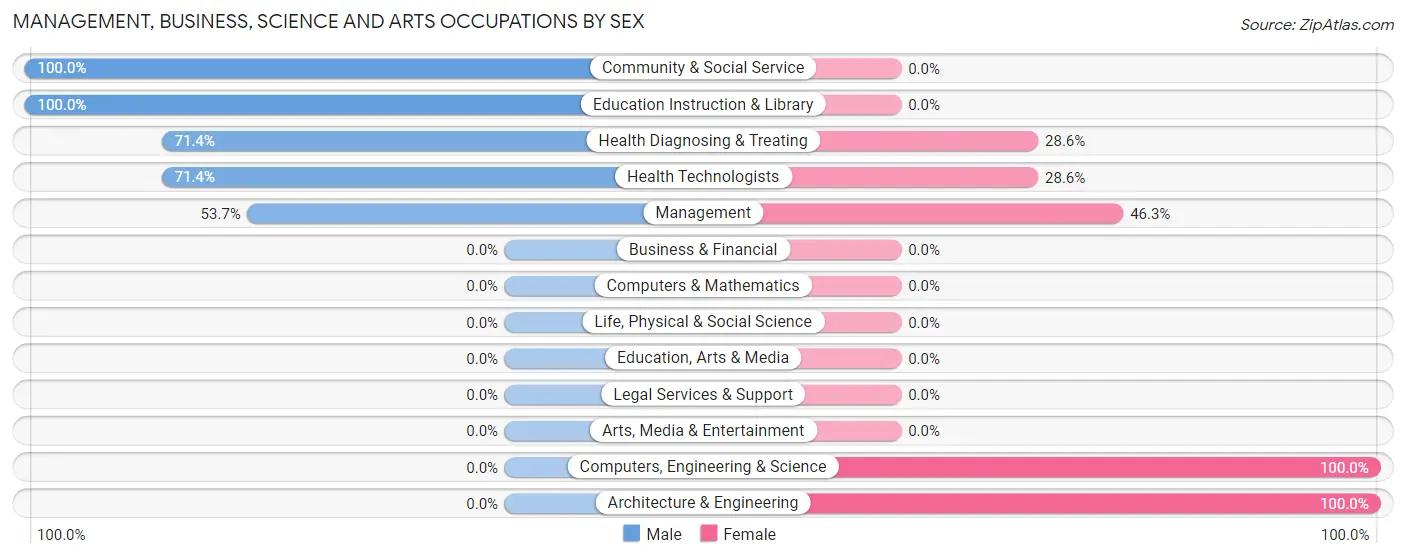
The most common Management, Business, Science and Arts occupations in McKinley Heights are Management (95 | 26.1%), Computers, Engineering & Science (52 | 14.3%), Architecture & Engineering (52 | 14.3%), Health Diagnosing & Treating (28 | 7.7%), and Health Technologists (28 | 7.7%).
Management, Business, Science and Arts Occupations by Sex
Within the Management, Business, Science and Arts occupations in McKinley Heights, the most male-oriented occupations are Community & Social Service (100.0%), Education Instruction & Library (100.0%), and Health Diagnosing & Treating (71.4%), while the most female-oriented occupations are Computers, Engineering & Science (100.0%), Architecture & Engineering (100.0%), and Management (46.3%).
| Occupation | Male | Female |
| Management | 51 (53.7%) | 44 (46.3%) |
| Business & Financial | 0 (0.0%) | 0 (0.0%) |
| Computers, Engineering & Science | 0 (0.0%) | 52 (100.0%) |
| Computers & Mathematics | 0 (0.0%) | 0 (0.0%) |
| Architecture & Engineering | 0 (0.0%) | 52 (100.0%) |
| Life, Physical & Social Science | 0 (0.0%) | 0 (0.0%) |
| Community & Social Service | 7 (100.0%) | 0 (0.0%) |
| Education, Arts & Media | 0 (0.0%) | 0 (0.0%) |
| Legal Services & Support | 0 (0.0%) | 0 (0.0%) |
| Education Instruction & Library | 7 (100.0%) | 0 (0.0%) |
| Arts, Media & Entertainment | 0 (0.0%) | 0 (0.0%) |
| Health Diagnosing & Treating | 20 (71.4%) | 8 (28.6%) |
| Health Technologists | 20 (71.4%) | 8 (28.6%) |
| Total (Category) | 78 (42.9%) | 104 (57.1%) |
| Total (Overall) | 188 (51.6%) | 176 (48.3%) |
Services Occupations
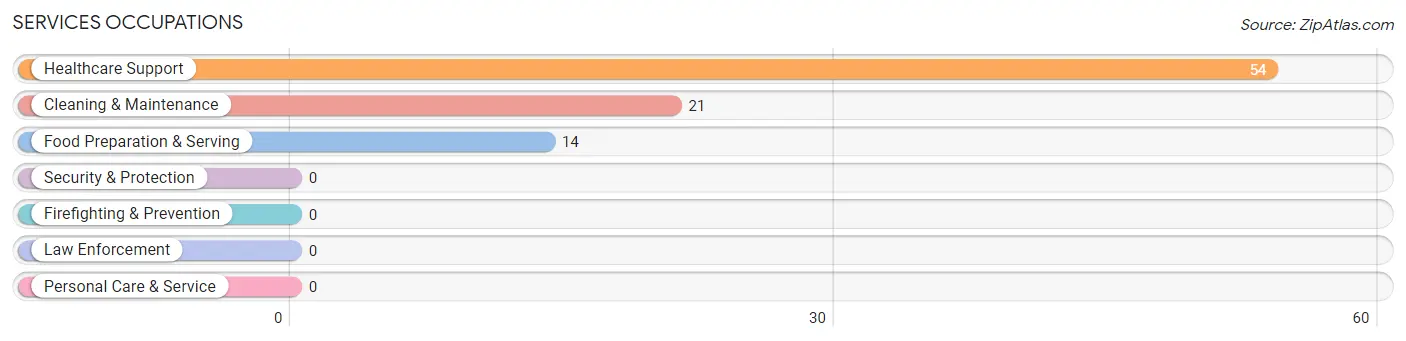
The most common Services occupations in McKinley Heights are Healthcare Support (54 | 14.8%), Cleaning & Maintenance (21 | 5.8%), and Food Preparation & Serving (14 | 3.8%).
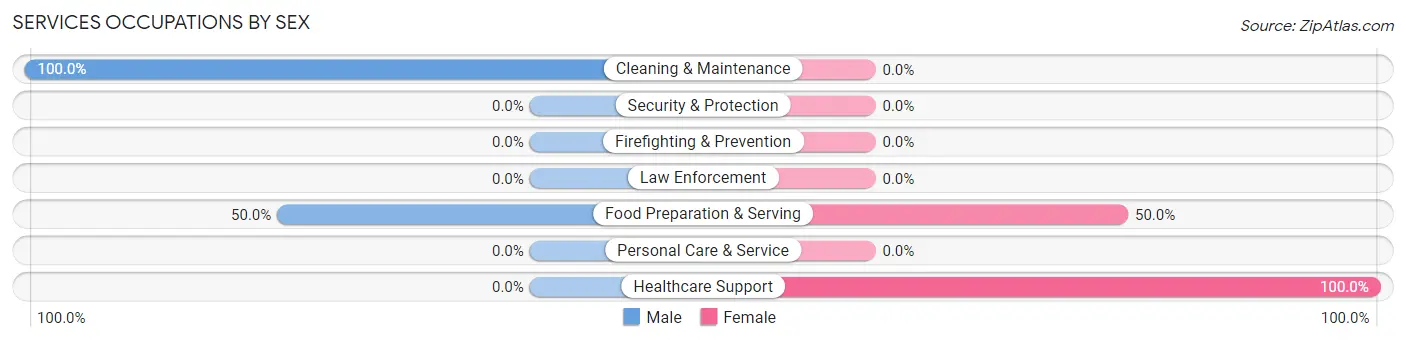
Services Occupations by Sex
Within the Services occupations in McKinley Heights, the most male-oriented occupations are Cleaning & Maintenance (100.0%), and Food Preparation & Serving (50.0%), while the most female-oriented occupations are Healthcare Support (100.0%), and Food Preparation & Serving (50.0%).
| Occupation | Male | Female |
| Healthcare Support | 0 (0.0%) | 54 (100.0%) |
| Security & Protection | 0 (0.0%) | 0 (0.0%) |
| Firefighting & Prevention | 0 (0.0%) | 0 (0.0%) |
| Law Enforcement | 0 (0.0%) | 0 (0.0%) |
| Food Preparation & Serving | 7 (50.0%) | 7 (50.0%) |
| Cleaning & Maintenance | 21 (100.0%) | 0 (0.0%) |
| Personal Care & Service | 0 (0.0%) | 0 (0.0%) |
| Total (Category) | 28 (31.5%) | 61 (68.5%) |
| Total (Overall) | 188 (51.6%) | 176 (48.3%) |
Sales and Office Occupations
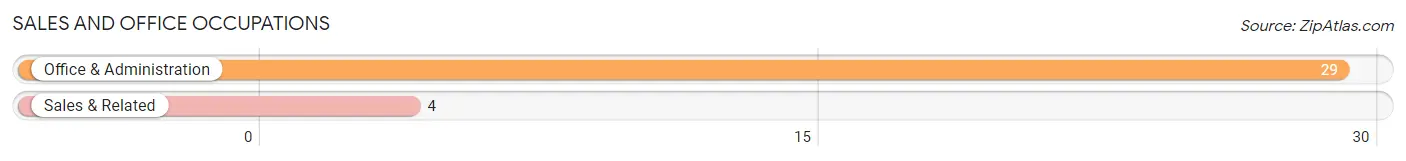
The most common Sales and Office occupations in McKinley Heights are Office & Administration (29 | 8.0%), and Sales & Related (4 | 1.1%).
Sales and Office Occupations by Sex
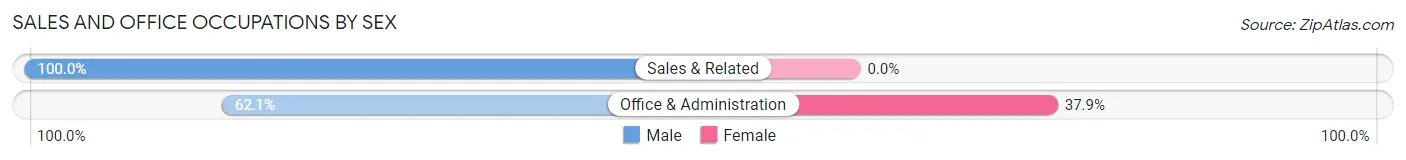
| Occupation | Male | Female |
| Sales & Related | 4 (100.0%) | 0 (0.0%) |
| Office & Administration | 18 (62.1%) | 11 (37.9%) |
| Total (Category) | 22 (66.7%) | 11 (33.3%) |
| Total (Overall) | 188 (51.6%) | 176 (48.3%) |
Natural Resources, Construction and Maintenance Occupations
Natural Resources, Construction and Maintenance Occupations by Sex
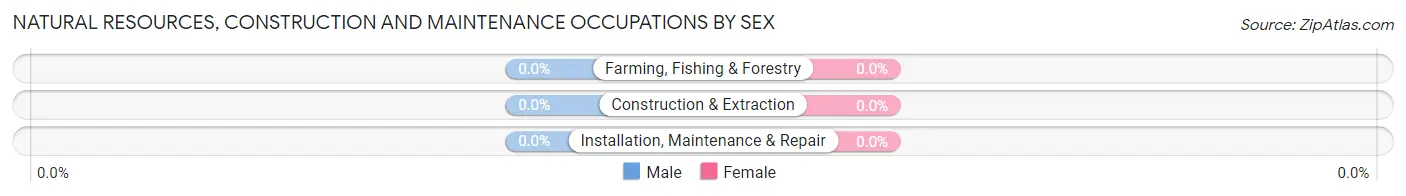
| Occupation | Male | Female |
| Farming, Fishing & Forestry | 0 (0.0%) | 0 (0.0%) |
| Construction & Extraction | 0 (0.0%) | 0 (0.0%) |
| Installation, Maintenance & Repair | 0 (0.0%) | 0 (0.0%) |
| Total (Category) | 0 (0.0%) | 0 (0.0%) |
| Total (Overall) | 188 (51.6%) | 176 (48.3%) |
Production, Transportation and Moving Occupations
The most common Production, Transportation and Moving occupations in McKinley Heights are Material Moving (35 | 9.6%), Production (18 | 5.0%), and Transportation (7 | 1.9%).
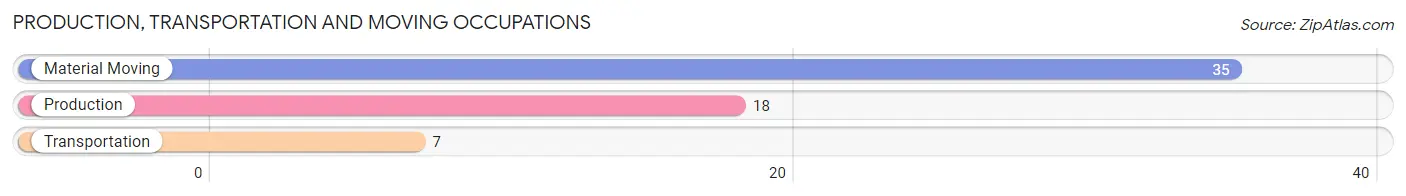
Production, Transportation and Moving Occupations by Sex
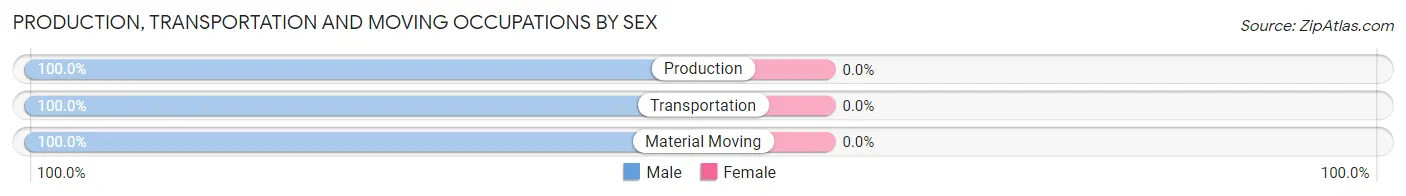
| Occupation | Male | Female |
| Production | 18 (100.0%) | 0 (0.0%) |
| Transportation | 7 (100.0%) | 0 (0.0%) |
| Material Moving | 35 (100.0%) | 0 (0.0%) |
| Total (Category) | 60 (100.0%) | 0 (0.0%) |
| Total (Overall) | 188 (51.6%) | 176 (48.3%) |
Employment Industries by Sex in McKinley Heights
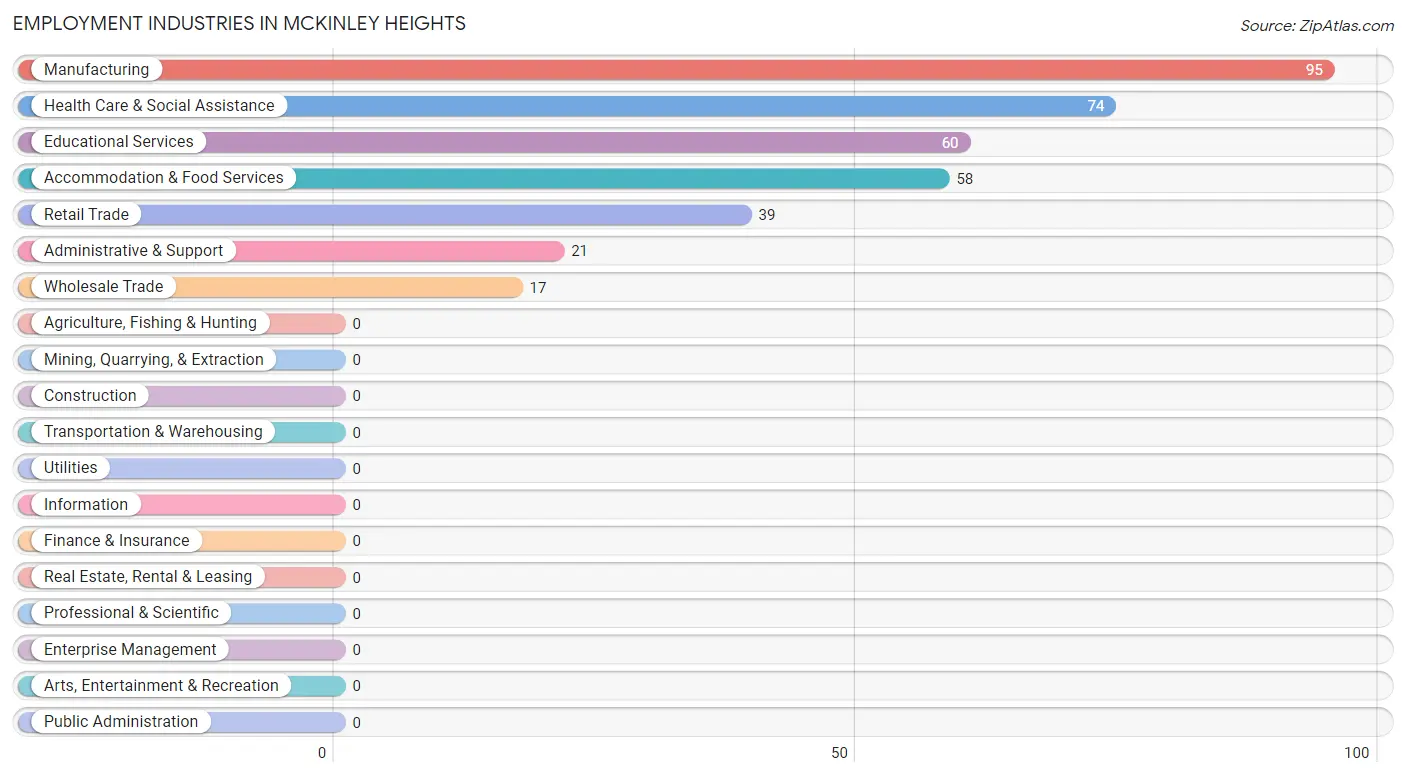
Employment Industries in McKinley Heights
The major employment industries in McKinley Heights include Manufacturing (95 | 26.1%), Health Care & Social Assistance (74 | 20.3%), Educational Services (60 | 16.5%), Accommodation & Food Services (58 | 15.9%), and Retail Trade (39 | 10.7%).
Employment Industries by Sex in McKinley Heights
The McKinley Heights industries that see more men than women are Wholesale Trade (100.0%), Administrative & Support (100.0%), and Retail Trade (89.7%), whereas the industries that tend to have a higher number of women are Accommodation & Food Services (87.9%), Health Care & Social Assistance (73.0%), and Manufacturing (62.1%).
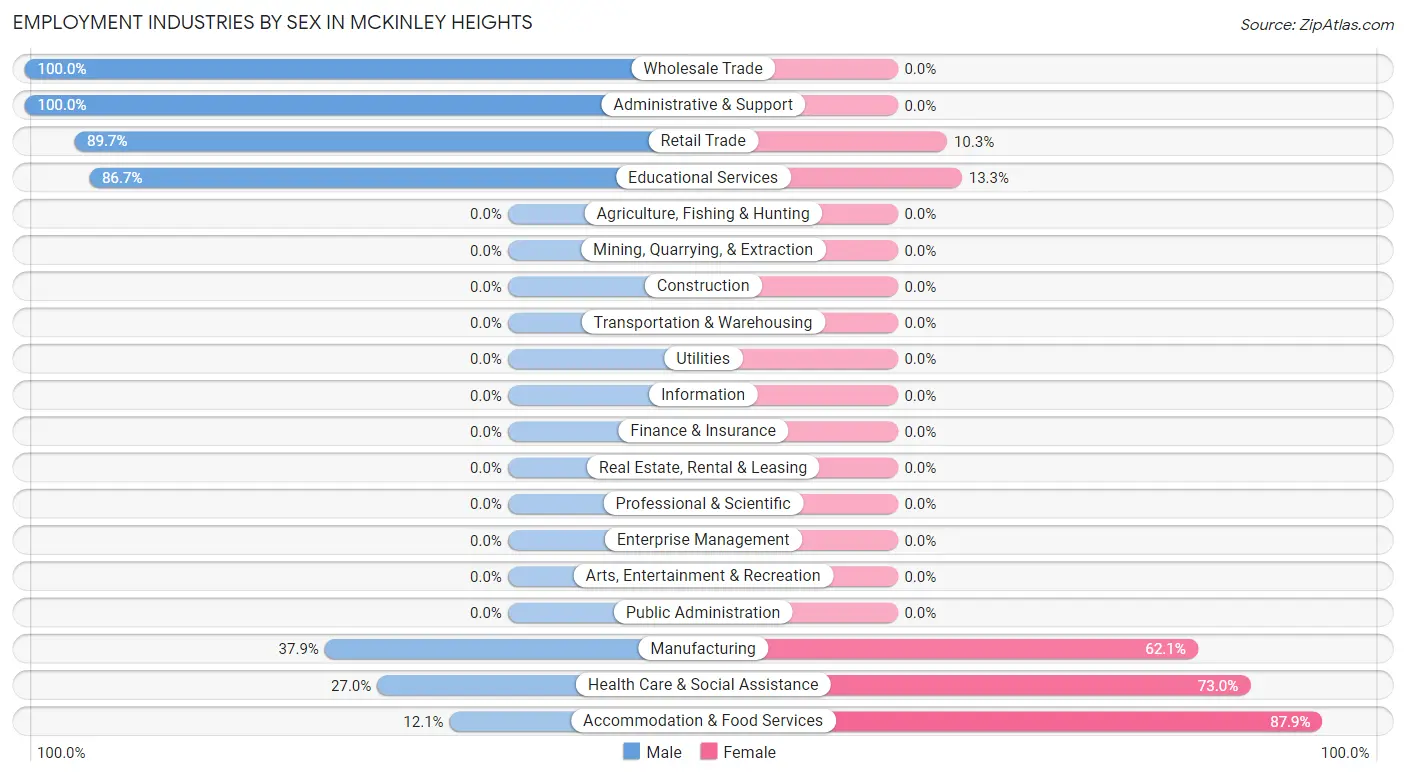
| Industry | Male | Female |
| Agriculture, Fishing & Hunting | 0 (0.0%) | 0 (0.0%) |
| Mining, Quarrying, & Extraction | 0 (0.0%) | 0 (0.0%) |
| Construction | 0 (0.0%) | 0 (0.0%) |
| Manufacturing | 36 (37.9%) | 59 (62.1%) |
| Wholesale Trade | 17 (100.0%) | 0 (0.0%) |
| Retail Trade | 35 (89.7%) | 4 (10.3%) |
| Transportation & Warehousing | 0 (0.0%) | 0 (0.0%) |
| Utilities | 0 (0.0%) | 0 (0.0%) |
| Information | 0 (0.0%) | 0 (0.0%) |
| Finance & Insurance | 0 (0.0%) | 0 (0.0%) |
| Real Estate, Rental & Leasing | 0 (0.0%) | 0 (0.0%) |
| Professional & Scientific | 0 (0.0%) | 0 (0.0%) |
| Enterprise Management | 0 (0.0%) | 0 (0.0%) |
| Administrative & Support | 21 (100.0%) | 0 (0.0%) |
| Educational Services | 52 (86.7%) | 8 (13.3%) |
| Health Care & Social Assistance | 20 (27.0%) | 54 (73.0%) |
| Arts, Entertainment & Recreation | 0 (0.0%) | 0 (0.0%) |
| Accommodation & Food Services | 7 (12.1%) | 51 (87.9%) |
| Public Administration | 0 (0.0%) | 0 (0.0%) |
| Total | 188 (51.6%) | 176 (48.3%) |
Education in McKinley Heights
School Enrollment in McKinley Heights
The most common levels of schooling among the 164 students in McKinley Heights are middle school (111 | 67.7%), elementary school (34 | 20.7%), and kindergarten (15 | 9.1%).
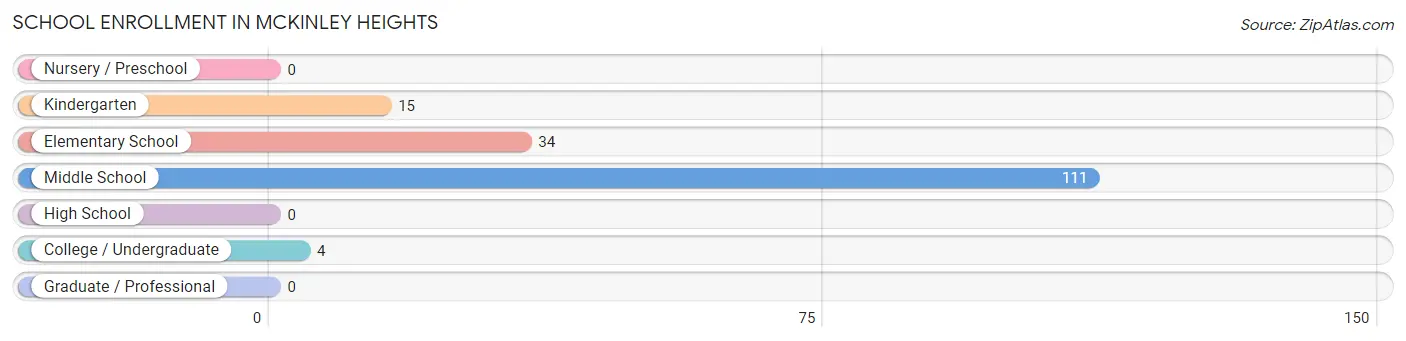
| School Level | # Students | % Students |
| Nursery / Preschool | 0 | 0.0% |
| Kindergarten | 15 | 9.1% |
| Elementary School | 34 | 20.7% |
| Middle School | 111 | 67.7% |
| High School | 0 | 0.0% |
| College / Undergraduate | 4 | 2.4% |
| Graduate / Professional | 0 | 0.0% |
| Total | 164 | 100.0% |
School Enrollment by Age by Funding Source in McKinley Heights
Out of a total of 164 students who are enrolled in schools in McKinley Heights, 22 (13.4%) attend a private institution, while the remaining 142 (86.6%) are enrolled in public schools. The age group of 5 to 9 year old has the highest likelihood of being enrolled in private schools, with 22 (44.9% in the age bracket) enrolled. Conversely, the age group of 10 to 14 year olds has the lowest likelihood of being enrolled in a private school, with 111 (100.0% in the age bracket) attending a public institution.
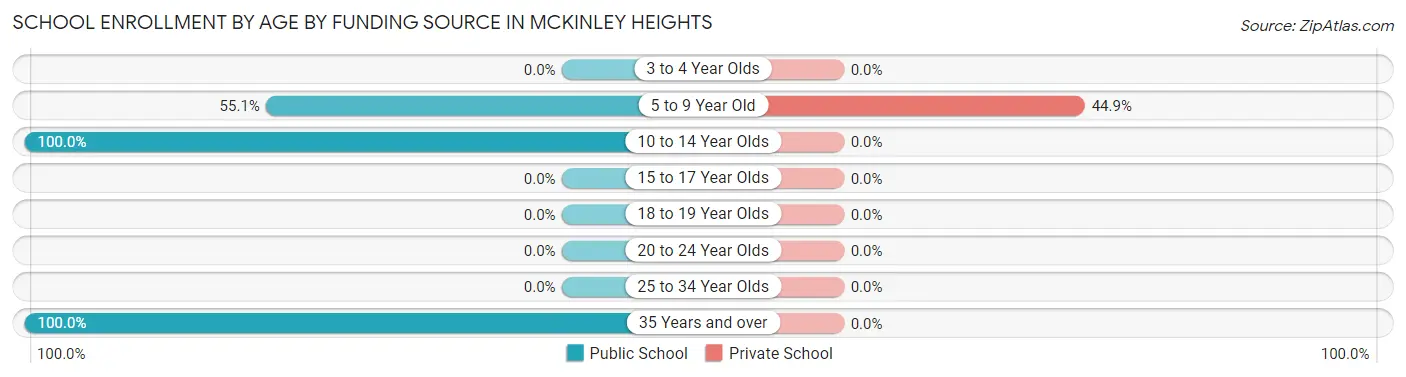
| Age Bracket | Public School | Private School |
| 3 to 4 Year Olds | 0 (0.0%) | 0 (0.0%) |
| 5 to 9 Year Old | 27 (55.1%) | 22 (44.9%) |
| 10 to 14 Year Olds | 111 (100.0%) | 0 (0.0%) |
| 15 to 17 Year Olds | 0 (0.0%) | 0 (0.0%) |
| 18 to 19 Year Olds | 0 (0.0%) | 0 (0.0%) |
| 20 to 24 Year Olds | 0 (0.0%) | 0 (0.0%) |
| 25 to 34 Year Olds | 0 (0.0%) | 0 (0.0%) |
| 35 Years and over | 4 (100.0%) | 0 (0.0%) |
| Total | 142 (86.6%) | 22 (13.4%) |
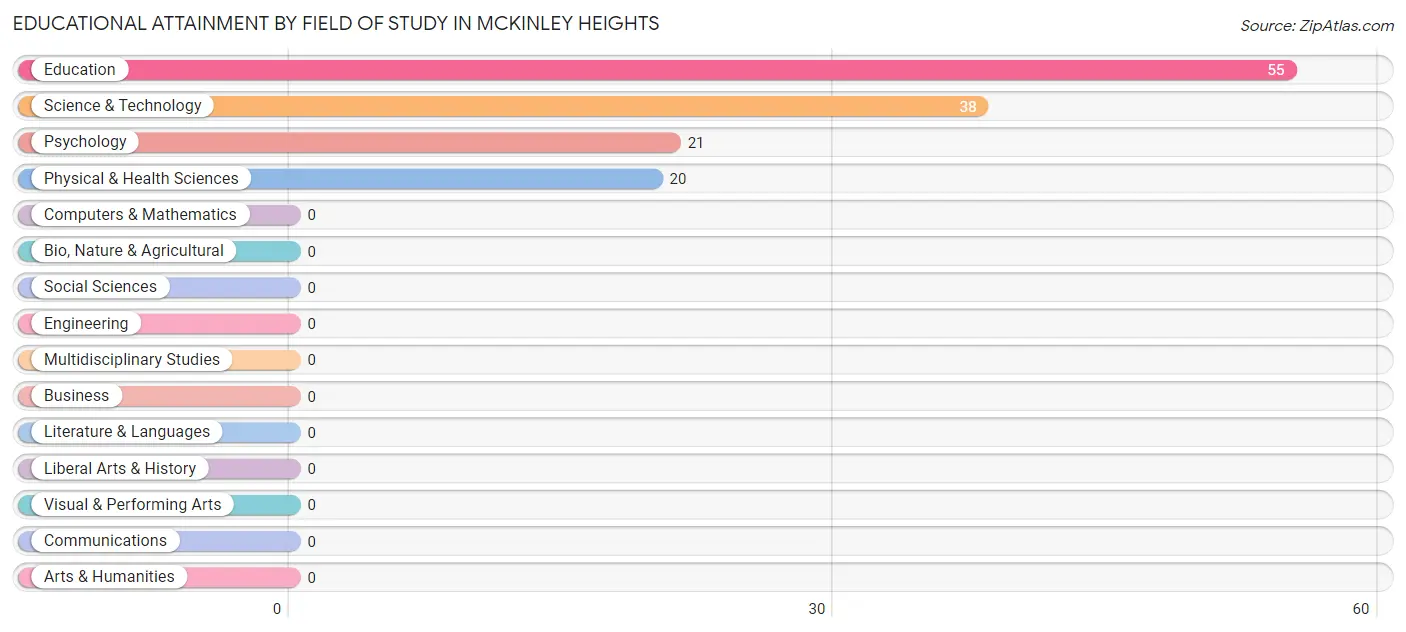
Educational Attainment by Field of Study in McKinley Heights
Education (55 | 41.0%), science & technology (38 | 28.4%), psychology (21 | 15.7%), and physical & health sciences (20 | 14.9%) are the most common fields of study among 134 individuals in McKinley Heights who have obtained a bachelor's degree or higher.
| Field of Study | # Graduates | % Graduates |
| Computers & Mathematics | 0 | 0.0% |
| Bio, Nature & Agricultural | 0 | 0.0% |
| Physical & Health Sciences | 20 | 14.9% |
| Psychology | 21 | 15.7% |
| Social Sciences | 0 | 0.0% |
| Engineering | 0 | 0.0% |
| Multidisciplinary Studies | 0 | 0.0% |
| Science & Technology | 38 | 28.4% |
| Business | 0 | 0.0% |
| Education | 55 | 41.0% |
| Literature & Languages | 0 | 0.0% |
| Liberal Arts & History | 0 | 0.0% |
| Visual & Performing Arts | 0 | 0.0% |
| Communications | 0 | 0.0% |
| Arts & Humanities | 0 | 0.0% |
| Total | 134 | 100.0% |
Transportation & Commute in McKinley Heights
Vehicle Availability by Sex in McKinley Heights
The most prevalent vehicle ownership categories in McKinley Heights are males with 2 vehicles (127, accounting for 67.5%) and females with 2 vehicles (74, making up 72.2%).
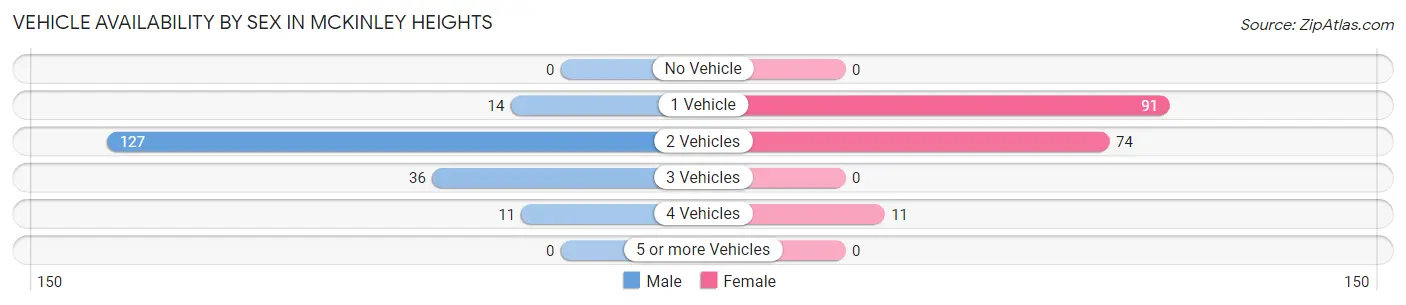
| Vehicles Available | Male | Female |
| No Vehicle | 0 (0.0%) | 0 (0.0%) |
| 1 Vehicle | 14 (7.4%) | 91 (51.7%) |
| 2 Vehicles | 127 (67.5%) | 74 (42.0%) |
| 3 Vehicles | 36 (19.2%) | 0 (0.0%) |
| 4 Vehicles | 11 (5.9%) | 11 (6.2%) |
| 5 or more Vehicles | 0 (0.0%) | 0 (0.0%) |
| Total | 188 (100.0%) | 176 (100.0%) |
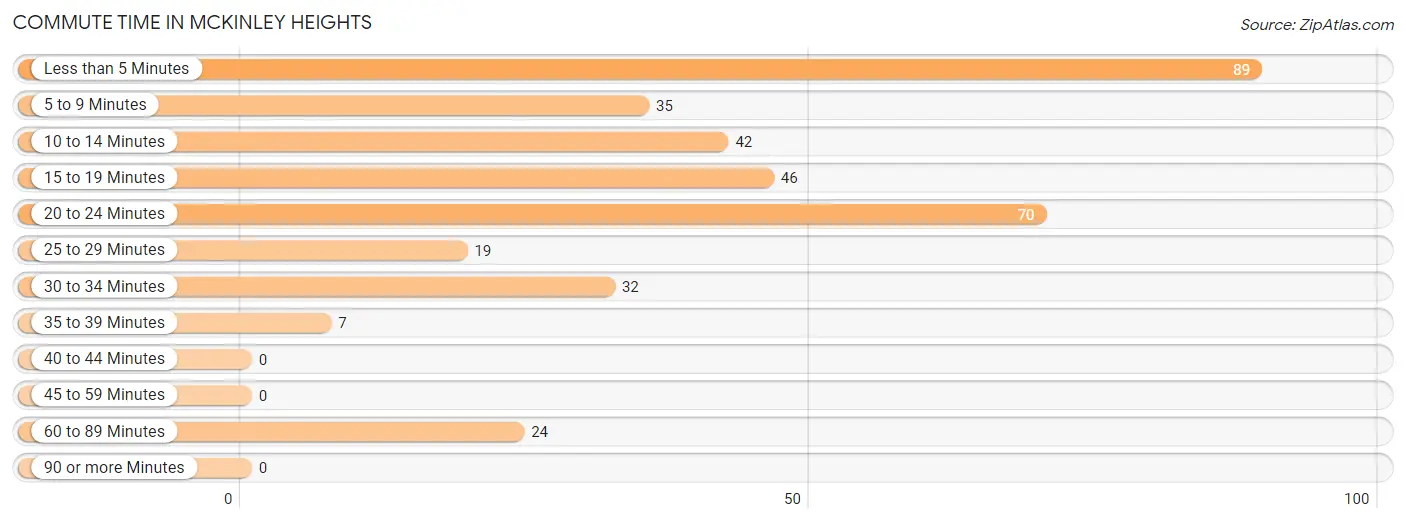
Commute Time in McKinley Heights
The most frequently occuring commute durations in McKinley Heights are less than 5 minutes (89 commuters, 24.4%), 20 to 24 minutes (70 commuters, 19.2%), and 15 to 19 minutes (46 commuters, 12.6%).
| Commute Time | # Commuters | % Commuters |
| Less than 5 Minutes | 89 | 24.4% |
| 5 to 9 Minutes | 35 | 9.6% |
| 10 to 14 Minutes | 42 | 11.5% |
| 15 to 19 Minutes | 46 | 12.6% |
| 20 to 24 Minutes | 70 | 19.2% |
| 25 to 29 Minutes | 19 | 5.2% |
| 30 to 34 Minutes | 32 | 8.8% |
| 35 to 39 Minutes | 7 | 1.9% |
| 40 to 44 Minutes | 0 | 0.0% |
| 45 to 59 Minutes | 0 | 0.0% |
| 60 to 89 Minutes | 24 | 6.6% |
| 90 or more Minutes | 0 | 0.0% |
Commute Time by Sex in McKinley Heights
The most common commute times in McKinley Heights are less than 5 minutes (45 commuters, 23.9%) for males and 20 to 24 minutes (56 commuters, 31.8%) for females.
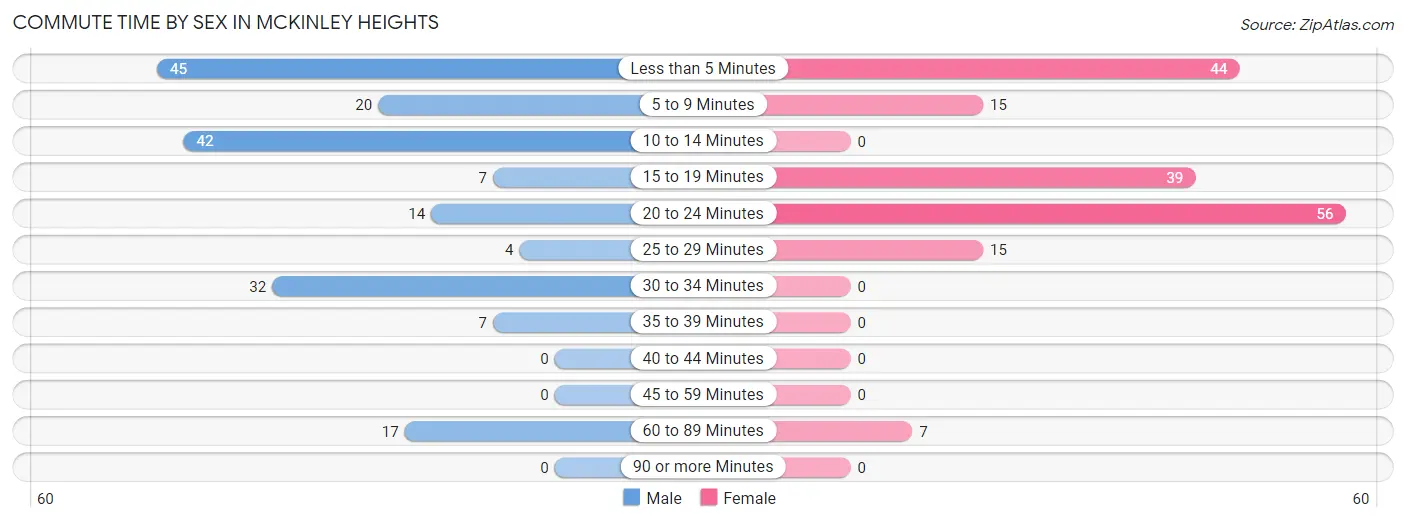
| Commute Time | Male | Female |
| Less than 5 Minutes | 45 (23.9%) | 44 (25.0%) |
| 5 to 9 Minutes | 20 (10.6%) | 15 (8.5%) |
| 10 to 14 Minutes | 42 (22.3%) | 0 (0.0%) |
| 15 to 19 Minutes | 7 (3.7%) | 39 (22.2%) |
| 20 to 24 Minutes | 14 (7.4%) | 56 (31.8%) |
| 25 to 29 Minutes | 4 (2.1%) | 15 (8.5%) |
| 30 to 34 Minutes | 32 (17.0%) | 0 (0.0%) |
| 35 to 39 Minutes | 7 (3.7%) | 0 (0.0%) |
| 40 to 44 Minutes | 0 (0.0%) | 0 (0.0%) |
| 45 to 59 Minutes | 0 (0.0%) | 0 (0.0%) |
| 60 to 89 Minutes | 17 (9.0%) | 7 (4.0%) |
| 90 or more Minutes | 0 (0.0%) | 0 (0.0%) |
Time of Departure to Work by Sex in McKinley Heights
The most frequent times of departure to work in McKinley Heights are 11:00 AM to 11:59 AM (45, 23.9%) for males and 5:00 AM to 5:29 AM (52, 29.5%) for females.
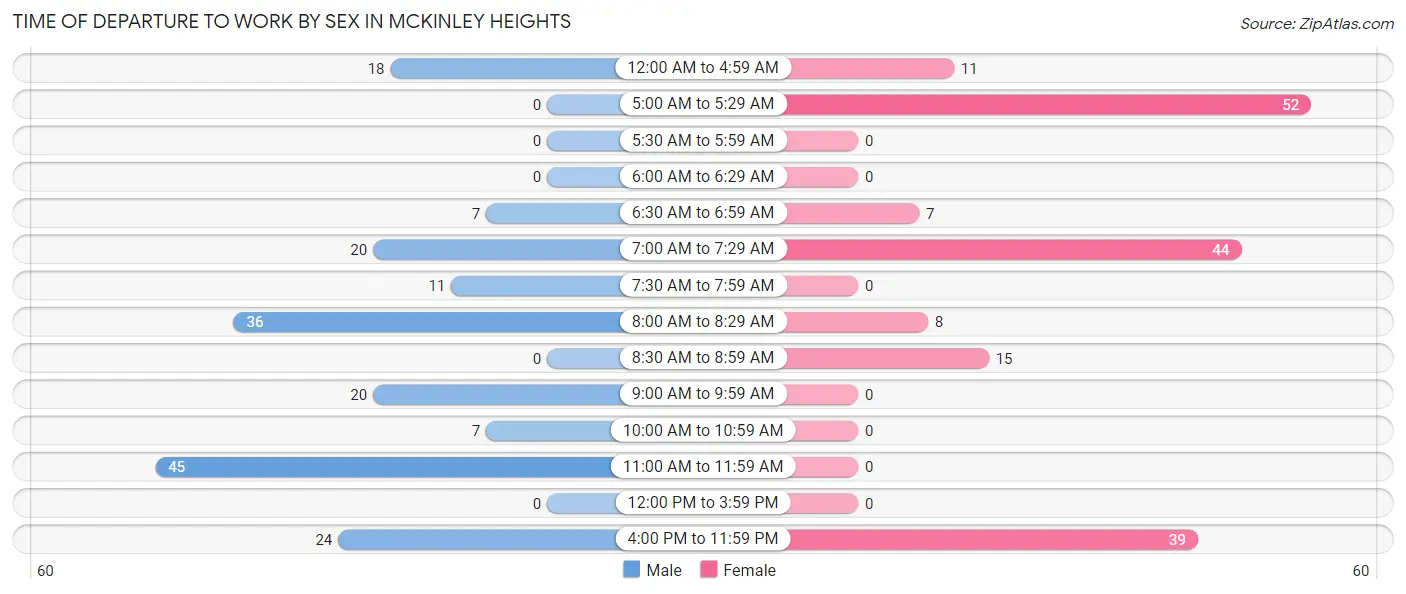
| Time of Departure | Male | Female |
| 12:00 AM to 4:59 AM | 18 (9.6%) | 11 (6.2%) |
| 5:00 AM to 5:29 AM | 0 (0.0%) | 52 (29.5%) |
| 5:30 AM to 5:59 AM | 0 (0.0%) | 0 (0.0%) |
| 6:00 AM to 6:29 AM | 0 (0.0%) | 0 (0.0%) |
| 6:30 AM to 6:59 AM | 7 (3.7%) | 7 (4.0%) |
| 7:00 AM to 7:29 AM | 20 (10.6%) | 44 (25.0%) |
| 7:30 AM to 7:59 AM | 11 (5.9%) | 0 (0.0%) |
| 8:00 AM to 8:29 AM | 36 (19.2%) | 8 (4.5%) |
| 8:30 AM to 8:59 AM | 0 (0.0%) | 15 (8.5%) |
| 9:00 AM to 9:59 AM | 20 (10.6%) | 0 (0.0%) |
| 10:00 AM to 10:59 AM | 7 (3.7%) | 0 (0.0%) |
| 11:00 AM to 11:59 AM | 45 (23.9%) | 0 (0.0%) |
| 12:00 PM to 3:59 PM | 0 (0.0%) | 0 (0.0%) |
| 4:00 PM to 11:59 PM | 24 (12.8%) | 39 (22.2%) |
| Total | 188 (100.0%) | 176 (100.0%) |
Housing Occupancy in McKinley Heights
Occupancy by Ownership in McKinley Heights
Of the total 523 dwellings in McKinley Heights, owner-occupied units account for 244 (46.7%), while renter-occupied units make up 279 (53.3%).
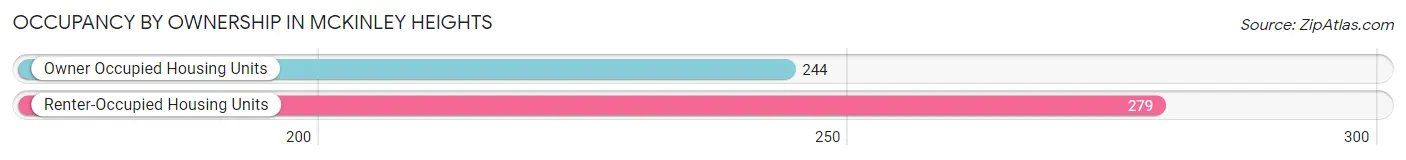
| Occupancy | # Housing Units | % Housing Units |
| Owner Occupied Housing Units | 244 | 46.7% |
| Renter-Occupied Housing Units | 279 | 53.3% |
| Total Occupied Housing Units | 523 | 100.0% |
Occupancy by Household Size in McKinley Heights
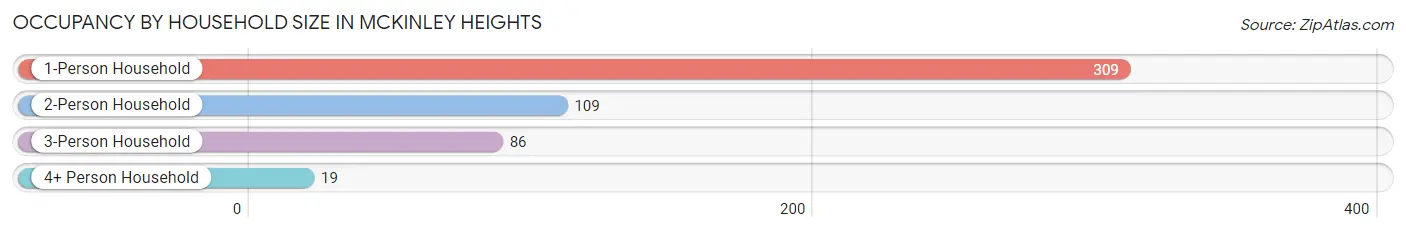
| Household Size | # Housing Units | % Housing Units |
| 1-Person Household | 309 | 59.1% |
| 2-Person Household | 109 | 20.8% |
| 3-Person Household | 86 | 16.4% |
| 4+ Person Household | 19 | 3.6% |
| Total Housing Units | 523 | 100.0% |
Occupancy by Ownership by Household Size in McKinley Heights
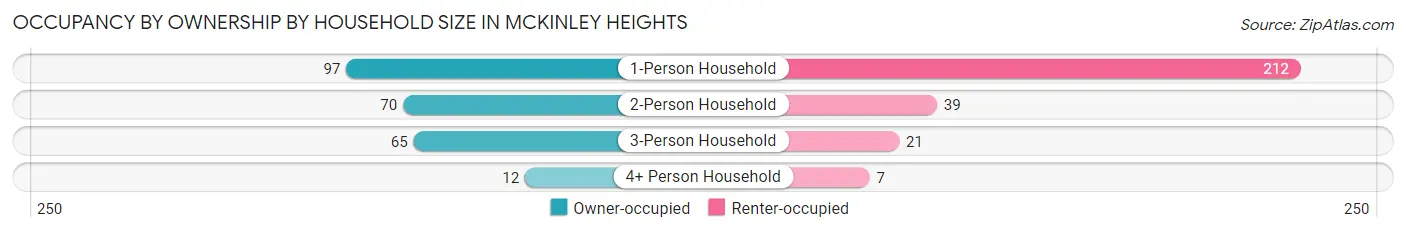
| Household Size | Owner-occupied | Renter-occupied |
| 1-Person Household | 97 (31.4%) | 212 (68.6%) |
| 2-Person Household | 70 (64.2%) | 39 (35.8%) |
| 3-Person Household | 65 (75.6%) | 21 (24.4%) |
| 4+ Person Household | 12 (63.2%) | 7 (36.8%) |
| Total Housing Units | 244 (46.7%) | 279 (53.3%) |
Occupancy by Educational Attainment in McKinley Heights
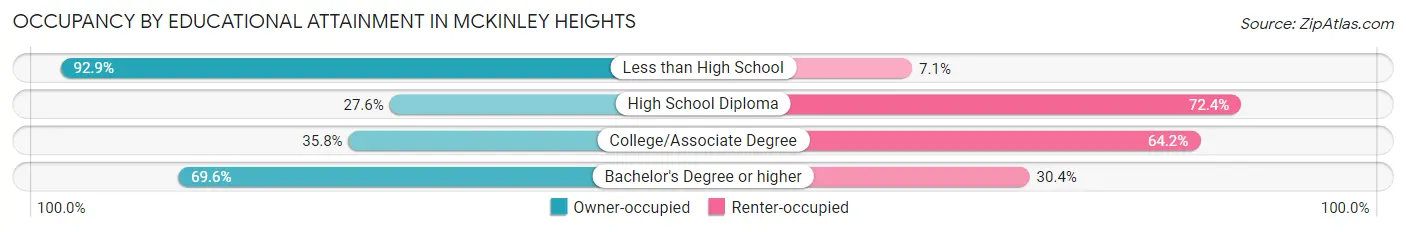
| Household Size | Owner-occupied | Renter-occupied |
| Less than High School | 91 (92.9%) | 7 (7.1%) |
| High School Diploma | 76 (27.6%) | 199 (72.4%) |
| College/Associate Degree | 29 (35.8%) | 52 (64.2%) |
| Bachelor's Degree or higher | 48 (69.6%) | 21 (30.4%) |
Occupancy by Age of Householder in McKinley Heights
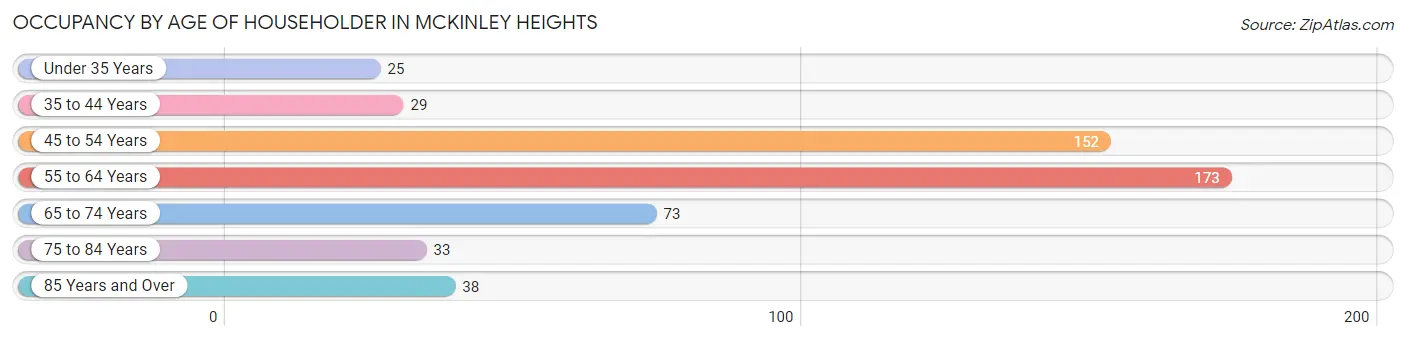
| Age Bracket | # Households | % Households |
| Under 35 Years | 25 | 4.8% |
| 35 to 44 Years | 29 | 5.5% |
| 45 to 54 Years | 152 | 29.1% |
| 55 to 64 Years | 173 | 33.1% |
| 65 to 74 Years | 73 | 14.0% |
| 75 to 84 Years | 33 | 6.3% |
| 85 Years and Over | 38 | 7.3% |
| Total | 523 | 100.0% |
Housing Finances in McKinley Heights
Median Income by Occupancy in McKinley Heights
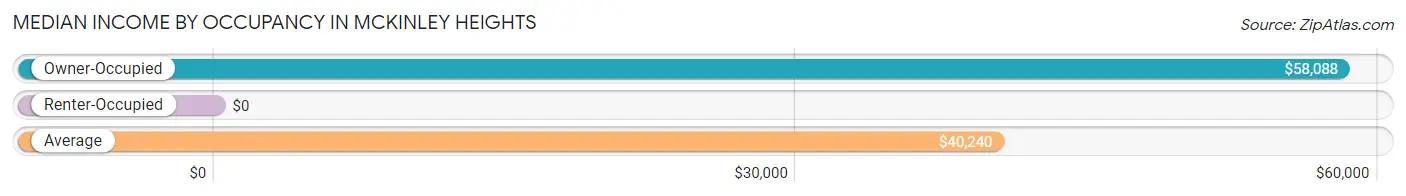
| Occupancy Type | # Households | Median Income |
| Owner-Occupied | 244 (46.7%) | $58,088 |
| Renter-Occupied | 279 (53.3%) | $0 |
| Average | 523 (100.0%) | $40,240 |
Occupancy by Householder Income Bracket in McKinley Heights
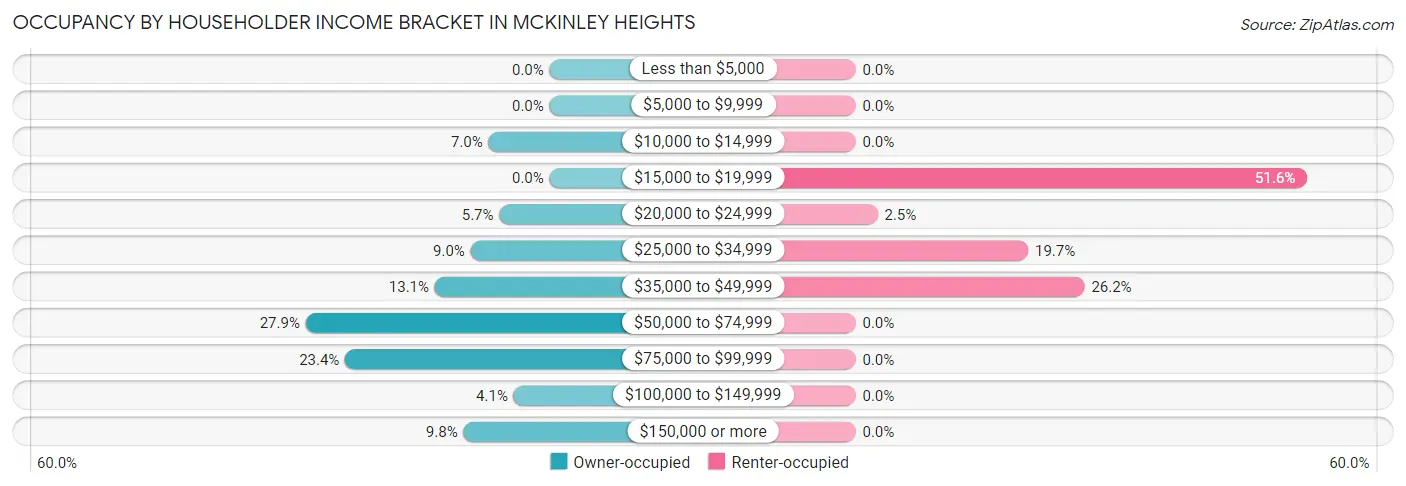
| Income Bracket | Owner-occupied | Renter-occupied |
| Less than $5,000 | 0 (0.0%) | 0 (0.0%) |
| $5,000 to $9,999 | 0 (0.0%) | 0 (0.0%) |
| $10,000 to $14,999 | 17 (7.0%) | 0 (0.0%) |
| $15,000 to $19,999 | 0 (0.0%) | 144 (51.6%) |
| $20,000 to $24,999 | 14 (5.7%) | 7 (2.5%) |
| $25,000 to $34,999 | 22 (9.0%) | 55 (19.7%) |
| $35,000 to $49,999 | 32 (13.1%) | 73 (26.2%) |
| $50,000 to $74,999 | 68 (27.9%) | 0 (0.0%) |
| $75,000 to $99,999 | 57 (23.4%) | 0 (0.0%) |
| $100,000 to $149,999 | 10 (4.1%) | 0 (0.0%) |
| $150,000 or more | 24 (9.8%) | 0 (0.0%) |
| Total | 244 (100.0%) | 279 (100.0%) |
Monthly Housing Cost Tiers in McKinley Heights
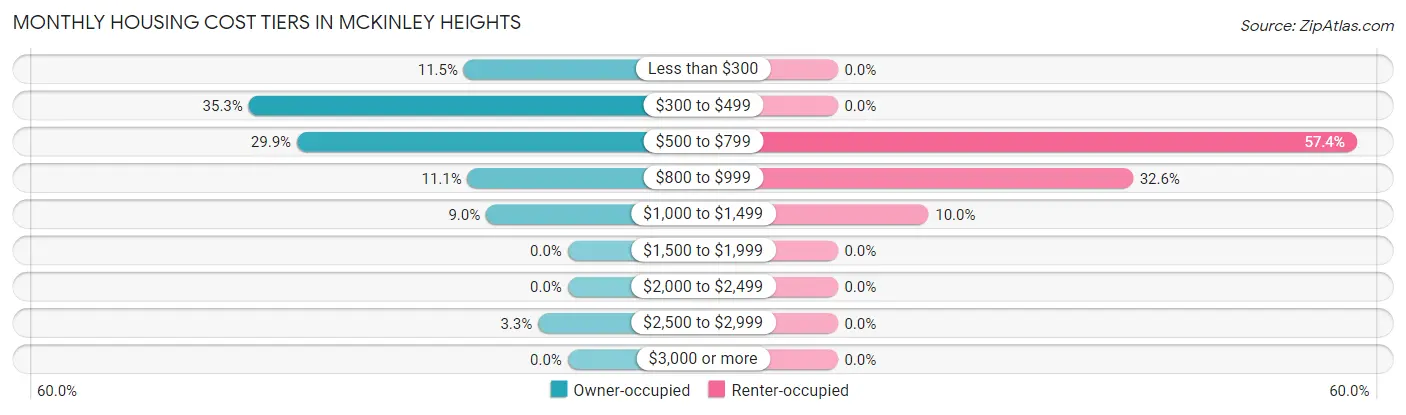
| Monthly Cost | Owner-occupied | Renter-occupied |
| Less than $300 | 28 (11.5%) | 0 (0.0%) |
| $300 to $499 | 86 (35.2%) | 0 (0.0%) |
| $500 to $799 | 73 (29.9%) | 160 (57.4%) |
| $800 to $999 | 27 (11.1%) | 91 (32.6%) |
| $1,000 to $1,499 | 22 (9.0%) | 28 (10.0%) |
| $1,500 to $1,999 | 0 (0.0%) | 0 (0.0%) |
| $2,000 to $2,499 | 0 (0.0%) | 0 (0.0%) |
| $2,500 to $2,999 | 8 (3.3%) | 0 (0.0%) |
| $3,000 or more | 0 (0.0%) | 0 (0.0%) |
| Total | 244 (100.0%) | 279 (100.0%) |
Physical Housing Characteristics in McKinley Heights
Housing Structures in McKinley Heights
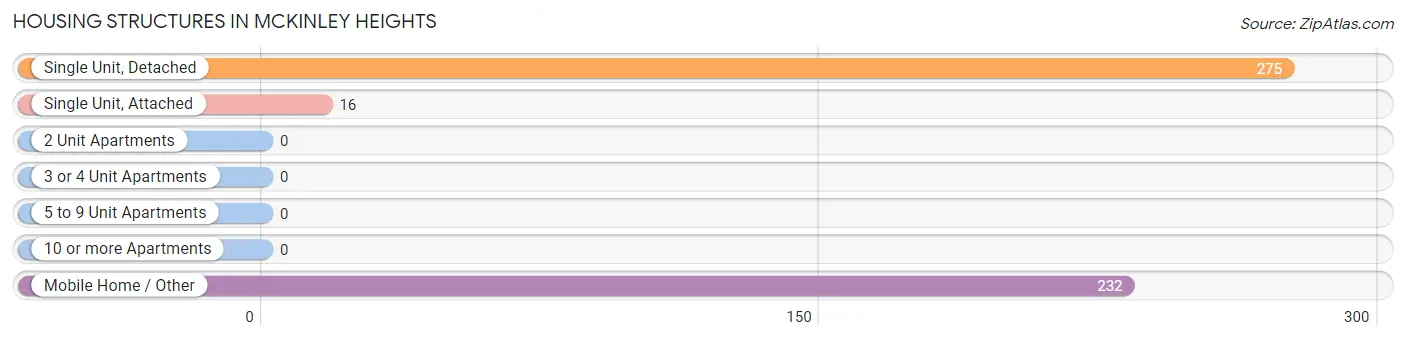
| Structure Type | # Housing Units | % Housing Units |
| Single Unit, Detached | 275 | 52.6% |
| Single Unit, Attached | 16 | 3.1% |
| 2 Unit Apartments | 0 | 0.0% |
| 3 or 4 Unit Apartments | 0 | 0.0% |
| 5 to 9 Unit Apartments | 0 | 0.0% |
| 10 or more Apartments | 0 | 0.0% |
| Mobile Home / Other | 232 | 44.4% |
| Total | 523 | 100.0% |
Housing Structures by Occupancy in McKinley Heights
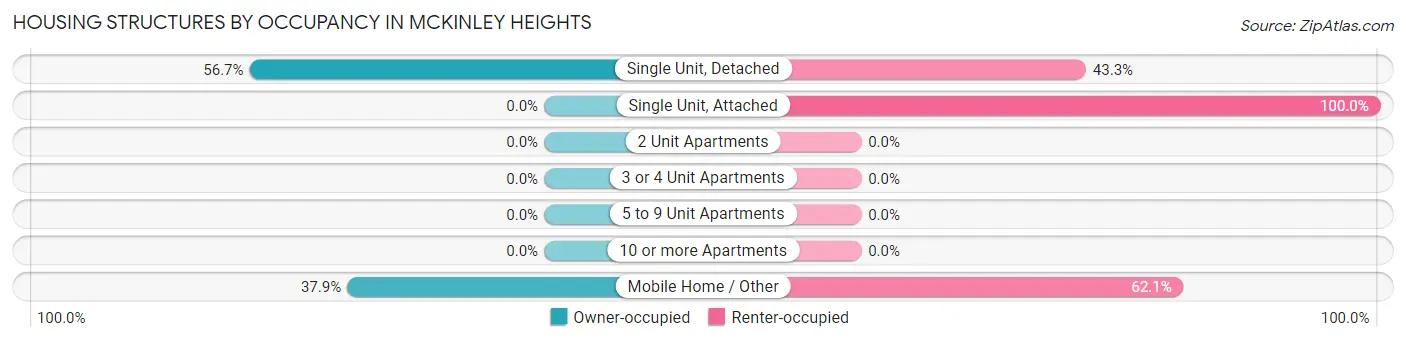
| Structure Type | Owner-occupied | Renter-occupied |
| Single Unit, Detached | 156 (56.7%) | 119 (43.3%) |
| Single Unit, Attached | 0 (0.0%) | 16 (100.0%) |
| 2 Unit Apartments | 0 (0.0%) | 0 (0.0%) |
| 3 or 4 Unit Apartments | 0 (0.0%) | 0 (0.0%) |
| 5 to 9 Unit Apartments | 0 (0.0%) | 0 (0.0%) |
| 10 or more Apartments | 0 (0.0%) | 0 (0.0%) |
| Mobile Home / Other | 88 (37.9%) | 144 (62.1%) |
| Total | 244 (46.7%) | 279 (53.3%) |
Housing Structures by Number of Rooms in McKinley Heights
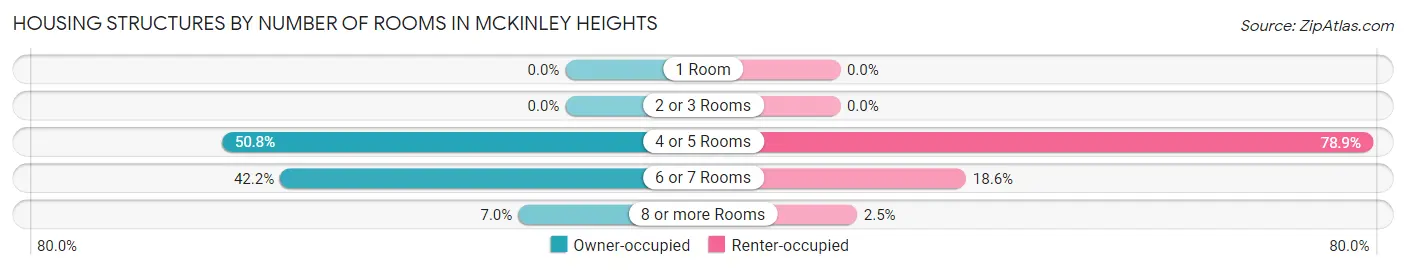
| Number of Rooms | Owner-occupied | Renter-occupied |
| 1 Room | 0 (0.0%) | 0 (0.0%) |
| 2 or 3 Rooms | 0 (0.0%) | 0 (0.0%) |
| 4 or 5 Rooms | 124 (50.8%) | 220 (78.8%) |
| 6 or 7 Rooms | 103 (42.2%) | 52 (18.6%) |
| 8 or more Rooms | 17 (7.0%) | 7 (2.5%) |
| Total | 244 (100.0%) | 279 (100.0%) |
Housing Structure by Heating Type in McKinley Heights
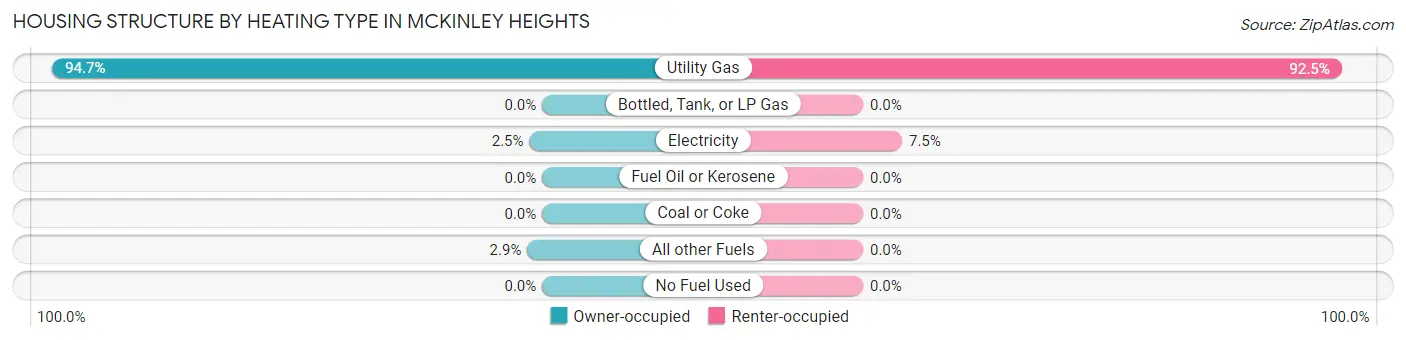
| Heating Type | Owner-occupied | Renter-occupied |
| Utility Gas | 231 (94.7%) | 258 (92.5%) |
| Bottled, Tank, or LP Gas | 0 (0.0%) | 0 (0.0%) |
| Electricity | 6 (2.5%) | 21 (7.5%) |
| Fuel Oil or Kerosene | 0 (0.0%) | 0 (0.0%) |
| Coal or Coke | 0 (0.0%) | 0 (0.0%) |
| All other Fuels | 7 (2.9%) | 0 (0.0%) |
| No Fuel Used | 0 (0.0%) | 0 (0.0%) |
| Total | 244 (100.0%) | 279 (100.0%) |
Household Vehicle Usage in McKinley Heights
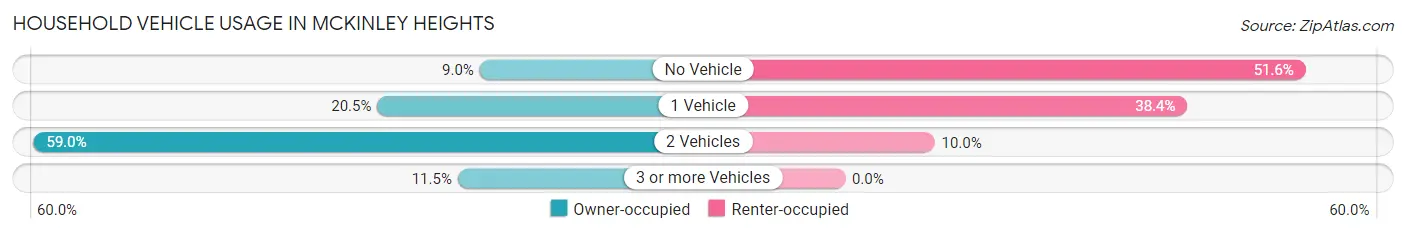
| Vehicles per Household | Owner-occupied | Renter-occupied |
| No Vehicle | 22 (9.0%) | 144 (51.6%) |
| 1 Vehicle | 50 (20.5%) | 107 (38.4%) |
| 2 Vehicles | 144 (59.0%) | 28 (10.0%) |
| 3 or more Vehicles | 28 (11.5%) | 0 (0.0%) |
| Total | 244 (100.0%) | 279 (100.0%) |
Real Estate & Mortgages in McKinley Heights
Real Estate and Mortgage Overview in McKinley Heights
| Characteristic | Without Mortgage | With Mortgage |
| Housing Units | 158 | 86 |
| Median Property Value | - | - |
| Median Household Income | $74,318 | $8 |
| Monthly Housing Costs | $449 | $0 |
| Real Estate Taxes | - | - |
Property Value by Mortgage Status in McKinley Heights
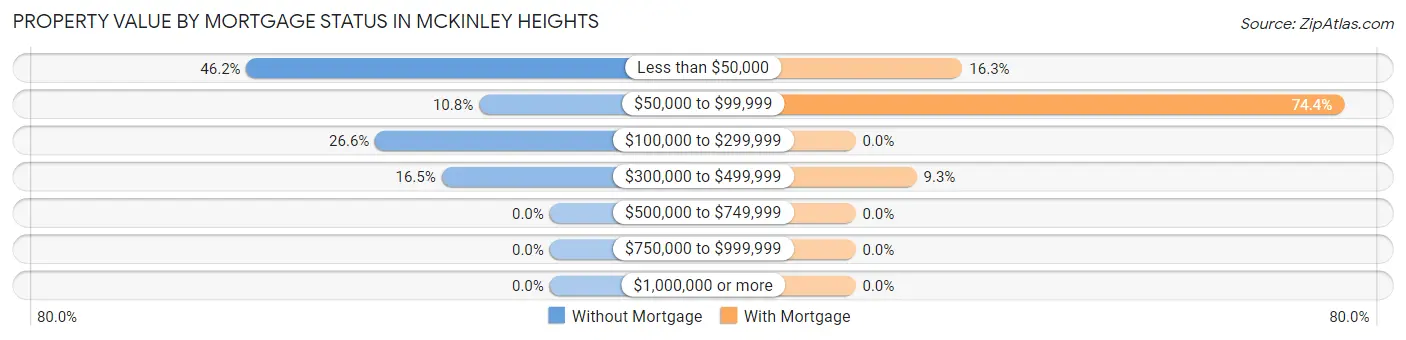
| Property Value | Without Mortgage | With Mortgage |
| Less than $50,000 | 73 (46.2%) | 14 (16.3%) |
| $50,000 to $99,999 | 17 (10.8%) | 64 (74.4%) |
| $100,000 to $299,999 | 42 (26.6%) | 0 (0.0%) |
| $300,000 to $499,999 | 26 (16.5%) | 8 (9.3%) |
| $500,000 to $749,999 | 0 (0.0%) | 0 (0.0%) |
| $750,000 to $999,999 | 0 (0.0%) | 0 (0.0%) |
| $1,000,000 or more | 0 (0.0%) | 0 (0.0%) |
| Total | 158 (100.0%) | 86 (100.0%) |
Household Income by Mortgage Status in McKinley Heights
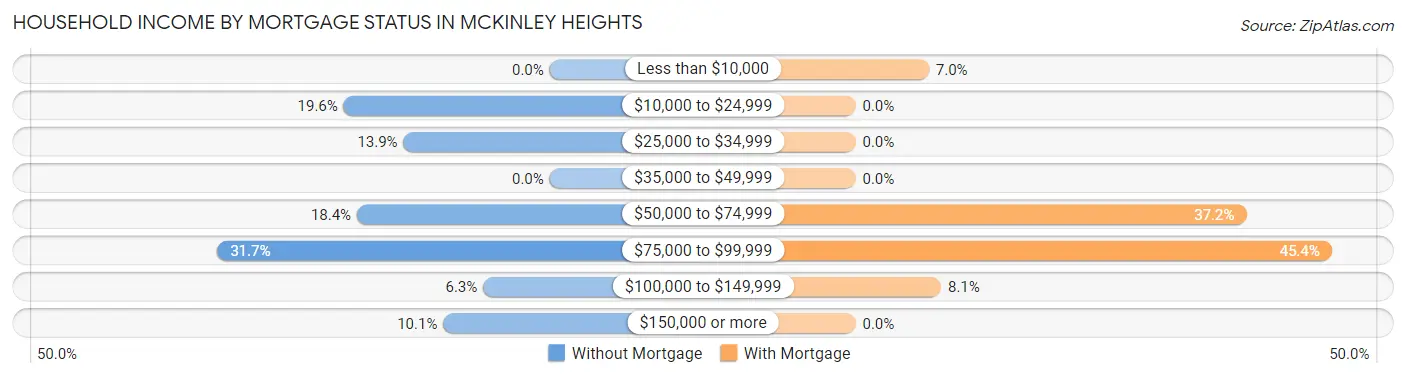
| Household Income | Without Mortgage | With Mortgage |
| Less than $10,000 | 0 (0.0%) | 6 (7.0%) |
| $10,000 to $24,999 | 31 (19.6%) | 0 (0.0%) |
| $25,000 to $34,999 | 22 (13.9%) | 0 (0.0%) |
| $35,000 to $49,999 | 0 (0.0%) | 0 (0.0%) |
| $50,000 to $74,999 | 29 (18.3%) | 32 (37.2%) |
| $75,000 to $99,999 | 50 (31.7%) | 39 (45.4%) |
| $100,000 to $149,999 | 10 (6.3%) | 7 (8.1%) |
| $150,000 or more | 16 (10.1%) | 0 (0.0%) |
| Total | 158 (100.0%) | 86 (100.0%) |
Property Value to Household Income Ratio in McKinley Heights
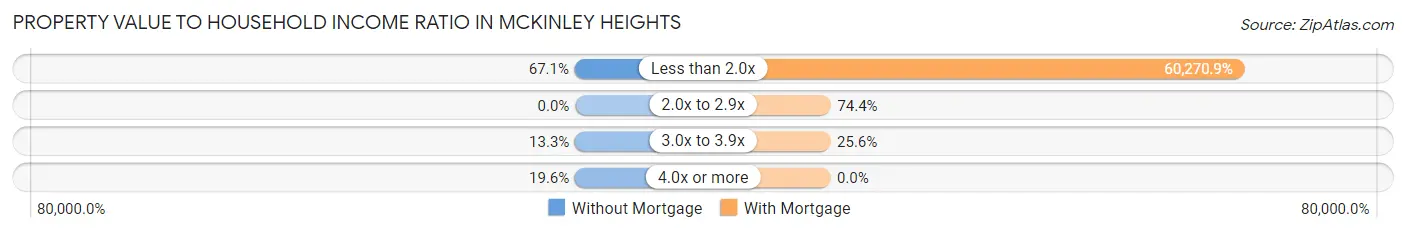
| Value-to-Income Ratio | Without Mortgage | With Mortgage |
| Less than 2.0x | 106 (67.1%) | 51,833 (60,270.9%) |
| 2.0x to 2.9x | 0 (0.0%) | 64 (74.4%) |
| 3.0x to 3.9x | 21 (13.3%) | 22 (25.6%) |
| 4.0x or more | 31 (19.6%) | 0 (0.0%) |
| Total | 158 (100.0%) | 86 (100.0%) |
Real Estate Taxes by Mortgage Status in McKinley Heights
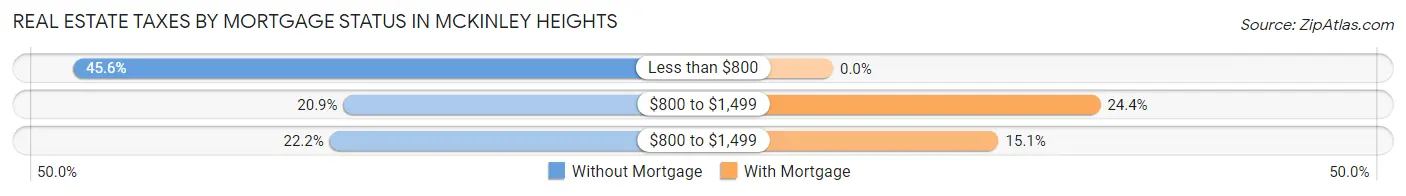
| Property Taxes | Without Mortgage | With Mortgage |
| Less than $800 | 72 (45.6%) | 0 (0.0%) |
| $800 to $1,499 | 33 (20.9%) | 21 (24.4%) |
| $800 to $1,499 | 35 (22.2%) | 13 (15.1%) |
| Total | 158 (100.0%) | 86 (100.0%) |
Health & Disability in McKinley Heights
Health Insurance Coverage by Age in McKinley Heights
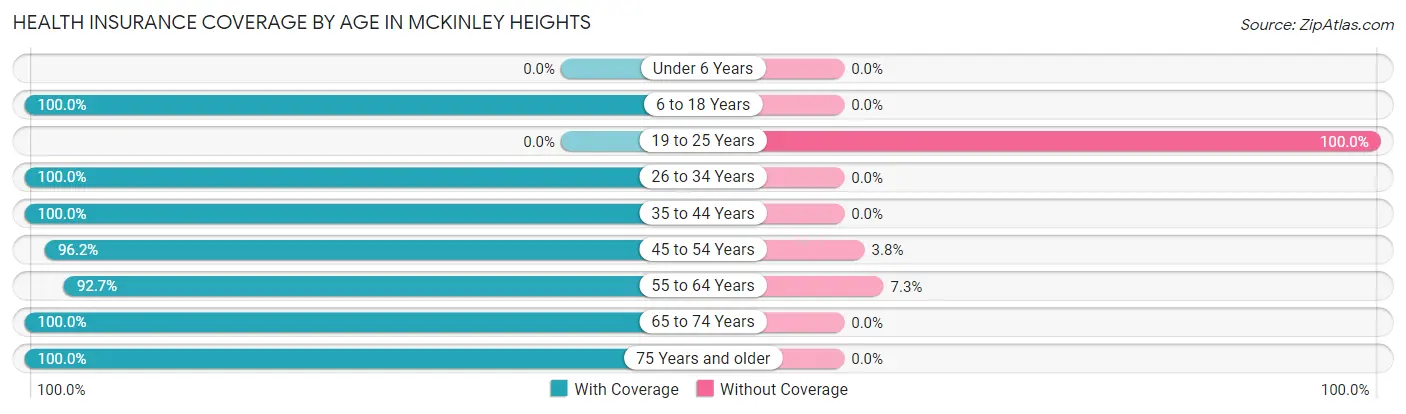
| Age Bracket | With Coverage | Without Coverage |
| Under 6 Years | 0 (0.0%) | 0 (0.0%) |
| 6 to 18 Years | 205 (100.0%) | 0 (0.0%) |
| 19 to 25 Years | 0 (0.0%) | 36 (100.0%) |
| 26 to 34 Years | 31 (100.0%) | 0 (0.0%) |
| 35 to 44 Years | 85 (100.0%) | 0 (0.0%) |
| 45 to 54 Years | 177 (96.2%) | 7 (3.8%) |
| 55 to 64 Years | 177 (92.7%) | 14 (7.3%) |
| 65 to 74 Years | 129 (100.0%) | 0 (0.0%) |
| 75 Years and older | 77 (100.0%) | 0 (0.0%) |
| Total | 881 (93.9%) | 57 (6.1%) |
Health Insurance Coverage by Citizenship Status in McKinley Heights
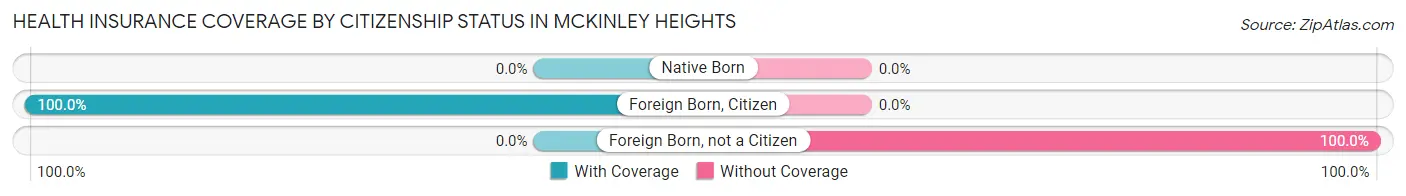
| Citizenship Status | With Coverage | Without Coverage |
| Native Born | 0 (0.0%) | 0 (0.0%) |
| Foreign Born, Citizen | 205 (100.0%) | 0 (0.0%) |
| Foreign Born, not a Citizen | 0 (0.0%) | 36 (100.0%) |
Health Insurance Coverage by Household Income in McKinley Heights
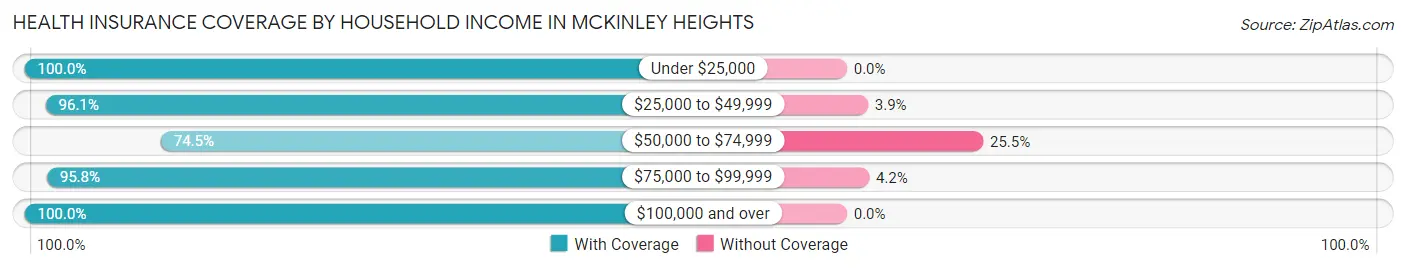
| Household Income | With Coverage | Without Coverage |
| Under $25,000 | 202 (100.0%) | 0 (0.0%) |
| $25,000 to $49,999 | 341 (96.1%) | 14 (3.9%) |
| $50,000 to $74,999 | 105 (74.5%) | 36 (25.5%) |
| $75,000 to $99,999 | 161 (95.8%) | 7 (4.2%) |
| $100,000 and over | 72 (100.0%) | 0 (0.0%) |
Public vs Private Health Insurance Coverage by Age in McKinley Heights
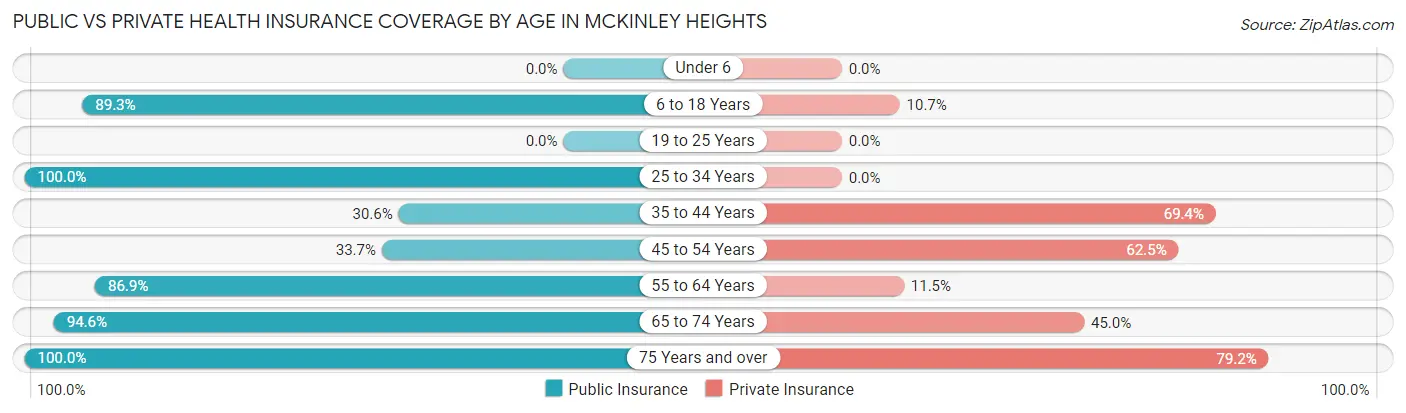
| Age Bracket | Public Insurance | Private Insurance |
| Under 6 | 0 (0.0%) | 0 (0.0%) |
| 6 to 18 Years | 183 (89.3%) | 22 (10.7%) |
| 19 to 25 Years | 0 (0.0%) | 0 (0.0%) |
| 25 to 34 Years | 31 (100.0%) | 0 (0.0%) |
| 35 to 44 Years | 26 (30.6%) | 59 (69.4%) |
| 45 to 54 Years | 62 (33.7%) | 115 (62.5%) |
| 55 to 64 Years | 166 (86.9%) | 22 (11.5%) |
| 65 to 74 Years | 122 (94.6%) | 58 (45.0%) |
| 75 Years and over | 77 (100.0%) | 61 (79.2%) |
| Total | 667 (71.1%) | 337 (35.9%) |
Disability Status by Sex by Age in McKinley Heights
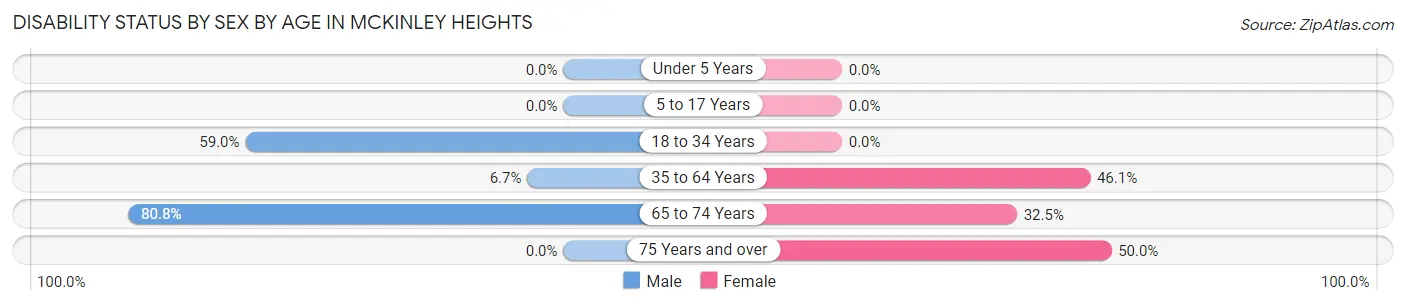
| Age Bracket | Male | Female |
| Under 5 Years | 0 (0.0%) | 0 (0.0%) |
| 5 to 17 Years | 0 (0.0%) | 0 (0.0%) |
| 18 to 34 Years | 36 (59.0%) | 0 (0.0%) |
| 35 to 64 Years | 18 (6.7%) | 88 (46.1%) |
| 65 to 74 Years | 42 (80.8%) | 25 (32.5%) |
| 75 Years and over | 0 (0.0%) | 22 (50.0%) |
Disability Class by Sex by Age in McKinley Heights
Disability Class: Hearing Difficulty
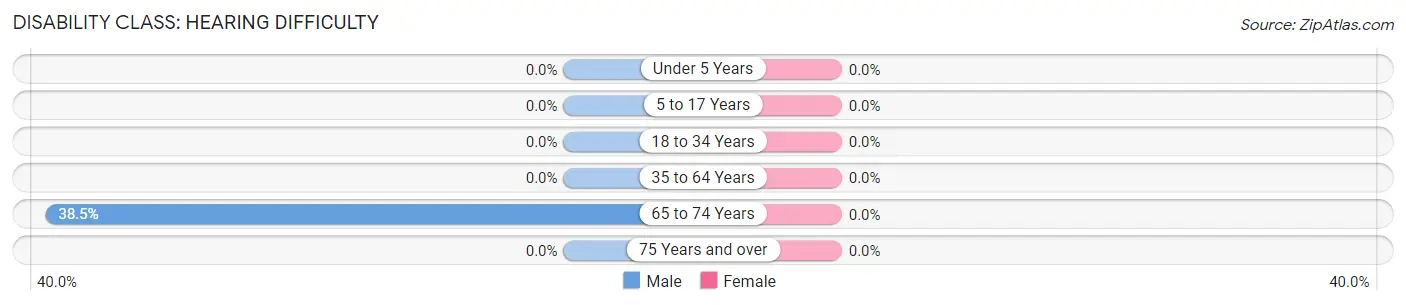
| Age Bracket | Male | Female |
| Under 5 Years | 0 (0.0%) | 0 (0.0%) |
| 5 to 17 Years | 0 (0.0%) | 0 (0.0%) |
| 18 to 34 Years | 0 (0.0%) | 0 (0.0%) |
| 35 to 64 Years | 0 (0.0%) | 0 (0.0%) |
| 65 to 74 Years | 20 (38.5%) | 0 (0.0%) |
| 75 Years and over | 0 (0.0%) | 0 (0.0%) |
Disability Class: Vision Difficulty
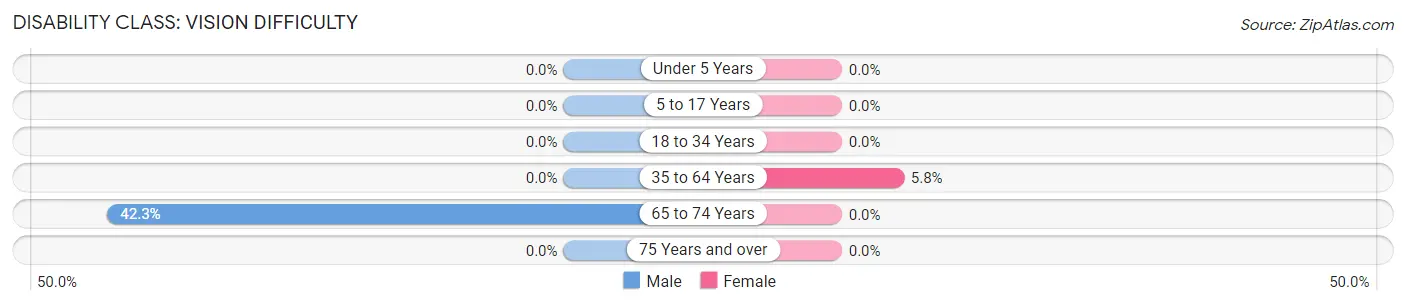
| Age Bracket | Male | Female |
| Under 5 Years | 0 (0.0%) | 0 (0.0%) |
| 5 to 17 Years | 0 (0.0%) | 0 (0.0%) |
| 18 to 34 Years | 0 (0.0%) | 0 (0.0%) |
| 35 to 64 Years | 0 (0.0%) | 11 (5.8%) |
| 65 to 74 Years | 22 (42.3%) | 0 (0.0%) |
| 75 Years and over | 0 (0.0%) | 0 (0.0%) |
Disability Class: Cognitive Difficulty
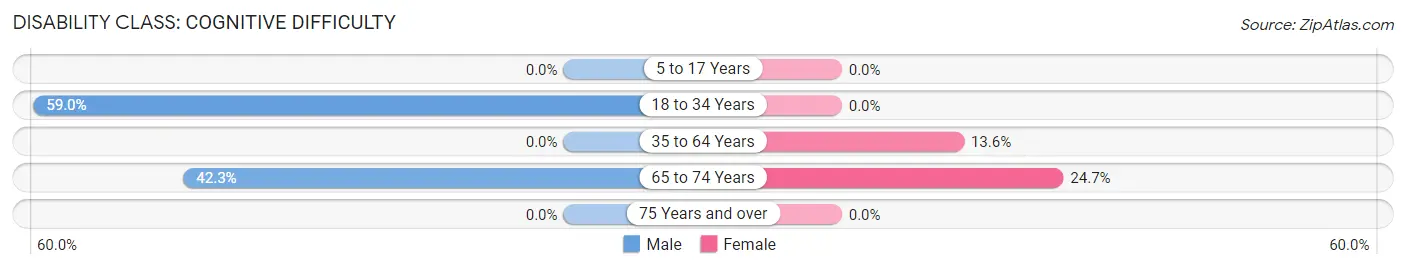
| Age Bracket | Male | Female |
| 5 to 17 Years | 0 (0.0%) | 0 (0.0%) |
| 18 to 34 Years | 36 (59.0%) | 0 (0.0%) |
| 35 to 64 Years | 0 (0.0%) | 26 (13.6%) |
| 65 to 74 Years | 22 (42.3%) | 19 (24.7%) |
| 75 Years and over | 0 (0.0%) | 0 (0.0%) |
Disability Class: Ambulatory Difficulty
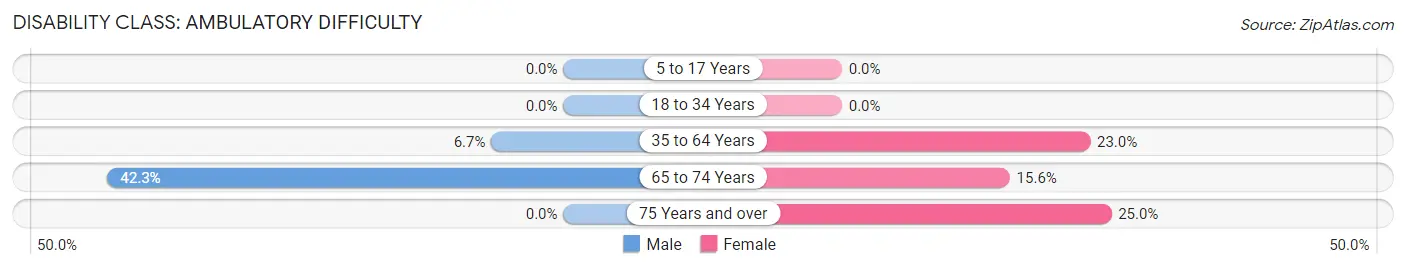
| Age Bracket | Male | Female |
| 5 to 17 Years | 0 (0.0%) | 0 (0.0%) |
| 18 to 34 Years | 0 (0.0%) | 0 (0.0%) |
| 35 to 64 Years | 18 (6.7%) | 44 (23.0%) |
| 65 to 74 Years | 22 (42.3%) | 12 (15.6%) |
| 75 Years and over | 0 (0.0%) | 11 (25.0%) |
Disability Class: Self-Care Difficulty
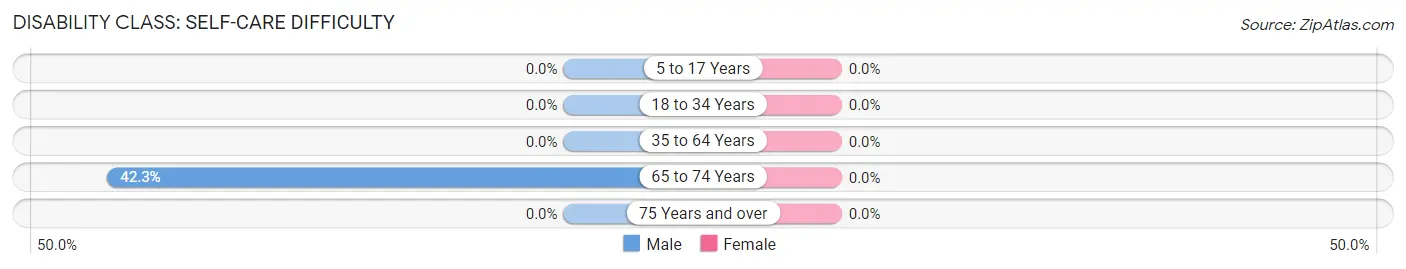
| Age Bracket | Male | Female |
| 5 to 17 Years | 0 (0.0%) | 0 (0.0%) |
| 18 to 34 Years | 0 (0.0%) | 0 (0.0%) |
| 35 to 64 Years | 0 (0.0%) | 0 (0.0%) |
| 65 to 74 Years | 22 (42.3%) | 0 (0.0%) |
| 75 Years and over | 0 (0.0%) | 0 (0.0%) |
Technology Access in McKinley Heights
Computing Device Access in McKinley Heights
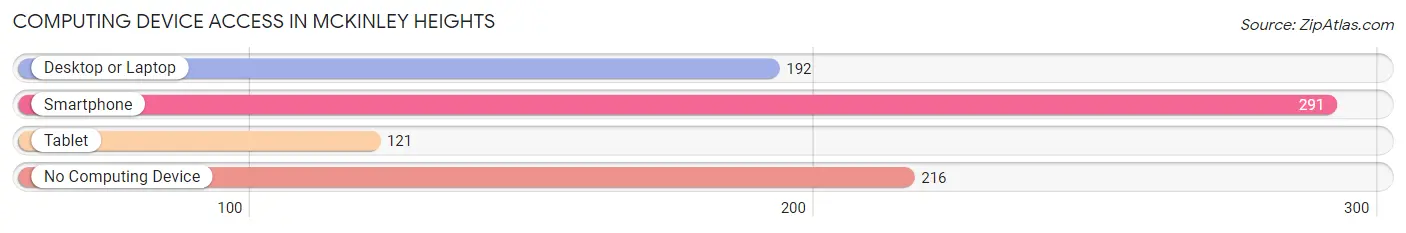
| Device Type | # Households | % Households |
| Desktop or Laptop | 192 | 36.7% |
| Smartphone | 291 | 55.6% |
| Tablet | 121 | 23.1% |
| No Computing Device | 216 | 41.3% |
| Total | 523 | 100.0% |
Internet Access in McKinley Heights
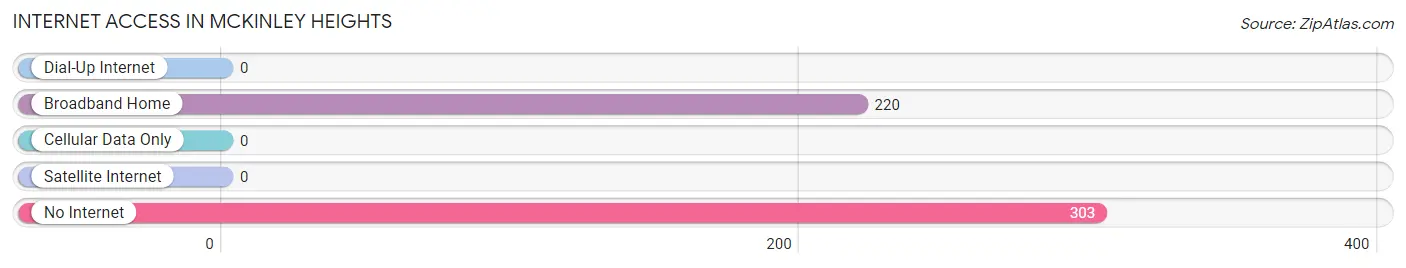
| Internet Type | # Households | % Households |
| Dial-Up Internet | 0 | 0.0% |
| Broadband Home | 220 | 42.1% |
| Cellular Data Only | 0 | 0.0% |
| Satellite Internet | 0 | 0.0% |
| No Internet | 303 | 57.9% |
| Total | 523 | 100.0% |
McKinley Heights Summary
McKinley Heights is a small village located in the state of Ohio, United States. It is situated in the county of Cuyahoga and is part of the Greater Cleveland Metropolitan Area. The village has a population of approximately 1,000 people and is located just south of the city of Cleveland.
History
McKinley Heights was founded in 1891 by a group of settlers from the nearby city of Cleveland. The village was named after President William McKinley, who was born in nearby Niles, Ohio. The village was originally a farming community, but as the city of Cleveland grew, so did McKinley Heights. By the early 1900s, the village had become a popular residential area for Clevelanders looking to escape the hustle and bustle of the city.
In the 1950s, the village began to experience a period of growth and development. The population increased from just over 500 in 1950 to nearly 1,000 by the end of the decade. During this time, the village saw the construction of several new homes and businesses, as well as the establishment of a public library and a post office.
Geography
McKinley Heights is located in the county of Cuyahoga, Ohio. It is situated just south of the city of Cleveland and is bordered by the cities of Parma and Brooklyn Heights. The village is located on the western edge of the Cuyahoga Valley National Park, which is a popular destination for outdoor recreation. The village is also located near the Cuyahoga River, which provides a scenic backdrop for the village.
Economy
McKinley Heights is primarily a residential community, with most of its residents employed in the nearby city of Cleveland. The village does have a few small businesses, including a grocery store, a hardware store, and a few restaurants. The village also has a post office and a public library.
Demographics
As of the 2010 census, the population of McKinley Heights was 1,000. The racial makeup of the village was 95.2% White, 1.2% African American, 0.2% Native American, 0.6% Asian, 0.2% from other races, and 2.8% from two or more races. Hispanic or Latino of any race were 1.2% of the population.
The median income for a household in the village was $45,000, and the median income for a family was $50,000. The per capita income for the village was $20,000. About 8.3% of families and 10.2% of the population were below the poverty line, including 14.3% of those under age 18 and 6.7% of those age 65 or over.
Conclusion
McKinley Heights is a small village located in the state of Ohio, United States. It is situated in the county of Cuyahoga and is part of the Greater Cleveland Metropolitan Area. The village has a population of approximately 1,000 people and is located just south of the city of Cleveland. The village was founded in 1891 and has since become a popular residential area for Clevelanders looking to escape the hustle and bustle of the city. The village is primarily a residential community, with most of its residents employed in the nearby city of Cleveland. The village also has a few small businesses, including a grocery store, a hardware store, and a few restaurants. The racial makeup of the village is 95.2% White, 1.2% African American, 0.2% Native American, 0.6% Asian, 0.2% from other races, and 2.8% from two or more races. The median income for a household in the village was $45,000, and the median income for a family was $50,000.
Common Questions
What is Per Capita Income in McKinley Heights?
Per Capita income in McKinley Heights is $27,475.
What is the Median Family Income in McKinley Heights?
Median Family Income in McKinley Heights is $60,179.
What is the Median Household income in McKinley Heights?
Median Household Income in McKinley Heights is $40,240.
What is Income or Wage Gap in McKinley Heights?
Income or Wage Gap in McKinley Heights is 12.1%.
Women in McKinley Heights earn 87.9 cents for every dollar earned by a man.
What is Inequality or Gini Index in McKinley Heights?
Inequality or Gini Index in McKinley Heights is 0.43.
What is the Total Population of McKinley Heights?
Total Population of McKinley Heights is 938.
What is the Total Male Population of McKinley Heights?
Total Male Population of McKinley Heights is 555.
What is the Total Female Population of McKinley Heights?
Total Female Population of McKinley Heights is 383.
What is the Ratio of Males per 100 Females in McKinley Heights?
There are 144.91 Males per 100 Females in McKinley Heights.
What is the Ratio of Females per 100 Males in McKinley Heights?
There are 69.01 Females per 100 Males in McKinley Heights.
What is the Median Population Age in McKinley Heights?
Median Population Age in McKinley Heights is 47.2 Years.
What is the Average Family Size in McKinley Heights
Average Family Size in McKinley Heights is 3.0 People.
What is the Average Household Size in McKinley Heights
Average Household Size in McKinley Heights is 1.8 People.
How Large is the Labor Force in McKinley Heights?
There are 414 People in the Labor Forcein in McKinley Heights.
What is the Percentage of People in the Labor Force in McKinley Heights?
53.2% of People are in the Labor Force in McKinley Heights.
What is the Unemployment Rate in McKinley Heights?
Unemployment Rate in McKinley Heights is 12.1%.