Leola, PA Map & Demographics
Leola Map
Leola Overview
$34,366
PER CAPITA INCOME
$101,585
AVG FAMILY INCOME
$85,529
AVG HOUSEHOLD INCOME
23.2%
WAGE / INCOME GAP [ % ]
76.8¢/ $1
WAGE / INCOME GAP [ $ ]
0.38
INEQUALITY / GINI INDEX
7,945
TOTAL POPULATION
4,130
MALE POPULATION
3,815
FEMALE POPULATION
108.26
MALES / 100 FEMALES
92.37
FEMALES / 100 MALES
35.1
MEDIAN AGE
3.3
AVG FAMILY SIZE
2.9
AVG HOUSEHOLD SIZE
4,122
LABOR FORCE [ PEOPLE ]
70.6%
PERCENT IN LABOR FORCE
6.0%
UNEMPLOYMENT RATE
Leola Zip Codes
Leola Area Codes
Income in Leola
Income Overview in Leola
Per Capita Income in Leola is $34,366, while median incomes of families and households are $101,585 and $85,529 respectively.
| Characteristic | Number | Measure |
| Per Capita Income | 7,945 | $34,366 |
| Median Family Income | 2,111 | $101,585 |
| Mean Family Income | 2,111 | $107,279 |
| Median Household Income | 2,747 | $85,529 |
| Mean Household Income | 2,747 | $98,540 |
| Income Deficit | 2,111 | $0 |
| Wage / Income Gap (%) | 7,945 | 23.24% |
| Wage / Income Gap ($) | 7,945 | 76.76¢ per $1 |
| Gini / Inequality Index | 7,945 | 0.38 |
Earnings by Sex in Leola
Average Earnings in Leola are $45,242, $52,630 for men and $40,400 for women, a difference of 23.2%.
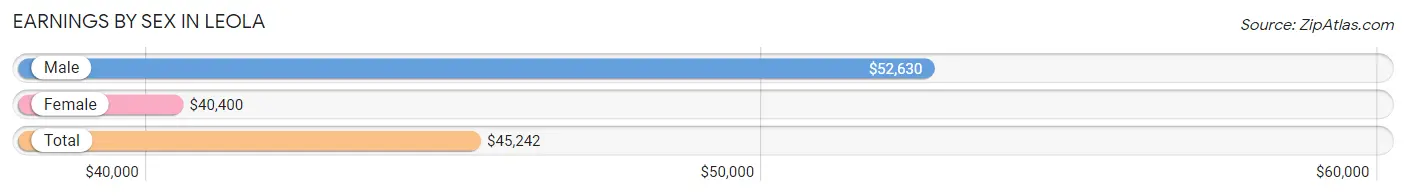
| Sex | Number | Average Earnings |
| Male | 2,276 (52.8%) | $52,630 |
| Female | 2,036 (47.2%) | $40,400 |
| Total | 4,312 (100.0%) | $45,242 |
Earnings by Sex by Income Bracket in Leola
The most common earnings brackets in Leola are $100,000+ for men (401 | 17.6%) and $75,000 to $99,999 for women (226 | 11.1%).
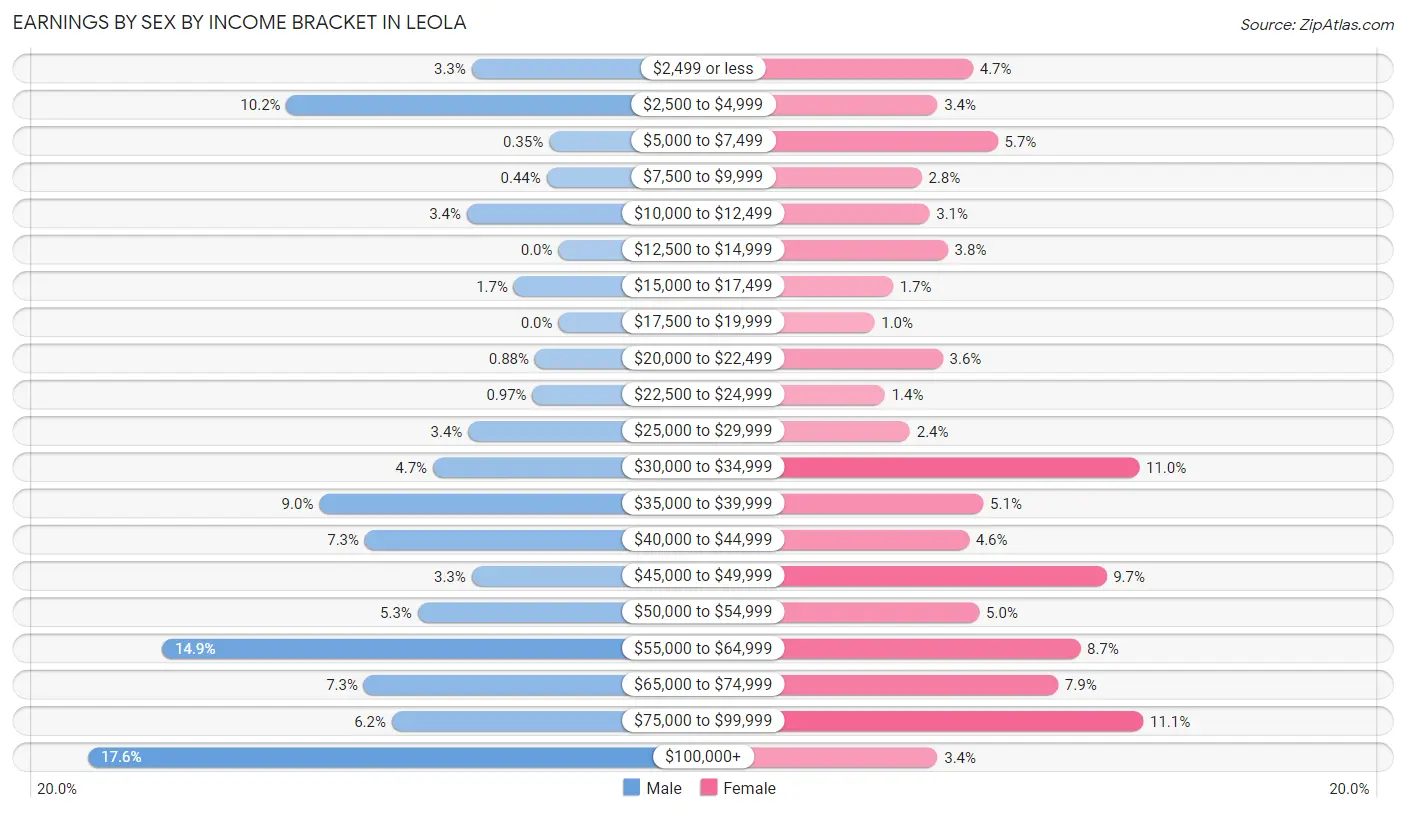
| Income | Male | Female |
| $2,499 or less | 74 (3.3%) | 96 (4.7%) |
| $2,500 to $4,999 | 232 (10.2%) | 69 (3.4%) |
| $5,000 to $7,499 | 8 (0.4%) | 115 (5.7%) |
| $7,500 to $9,999 | 10 (0.4%) | 57 (2.8%) |
| $10,000 to $12,499 | 78 (3.4%) | 63 (3.1%) |
| $12,500 to $14,999 | 0 (0.0%) | 77 (3.8%) |
| $15,000 to $17,499 | 38 (1.7%) | 35 (1.7%) |
| $17,500 to $19,999 | 0 (0.0%) | 21 (1.0%) |
| $20,000 to $22,499 | 20 (0.9%) | 73 (3.6%) |
| $22,500 to $24,999 | 22 (1.0%) | 29 (1.4%) |
| $25,000 to $29,999 | 77 (3.4%) | 48 (2.4%) |
| $30,000 to $34,999 | 107 (4.7%) | 223 (11.0%) |
| $35,000 to $39,999 | 204 (9.0%) | 104 (5.1%) |
| $40,000 to $44,999 | 165 (7.2%) | 93 (4.6%) |
| $45,000 to $49,999 | 74 (3.3%) | 198 (9.7%) |
| $50,000 to $54,999 | 120 (5.3%) | 101 (5.0%) |
| $55,000 to $64,999 | 338 (14.8%) | 178 (8.7%) |
| $65,000 to $74,999 | 166 (7.3%) | 161 (7.9%) |
| $75,000 to $99,999 | 142 (6.2%) | 226 (11.1%) |
| $100,000+ | 401 (17.6%) | 69 (3.4%) |
| Total | 2,276 (100.0%) | 2,036 (100.0%) |
Earnings by Sex by Educational Attainment in Leola
Average earnings in Leola are $57,820 for men and $45,672 for women, a difference of 21.0%. Men with an educational attainment of graduate degree enjoy the highest average annual earnings of $106,932, while those with less than high school education earn the least with $36,321. Women with an educational attainment of bachelor's degree earn the most with the average annual earnings of $66,494, while those with high school diploma education have the smallest earnings of $31,632.
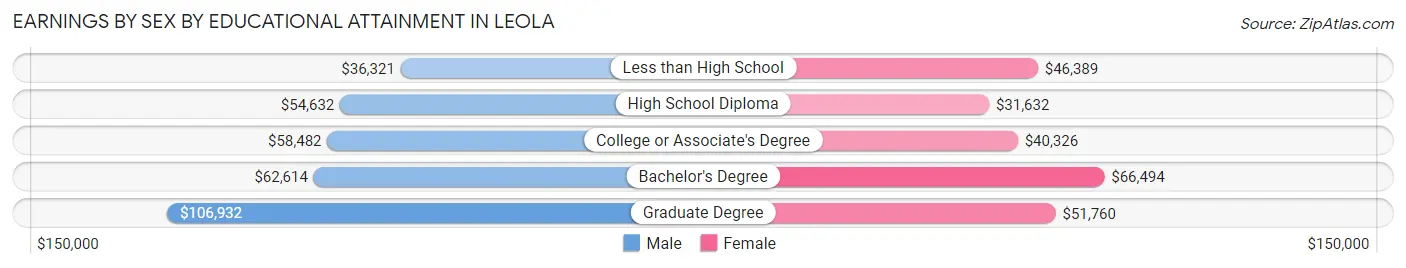
| Educational Attainment | Male Income | Female Income |
| Less than High School | $36,321 | $46,389 |
| High School Diploma | $54,632 | $31,632 |
| College or Associate's Degree | $58,482 | $40,326 |
| Bachelor's Degree | $62,614 | $66,494 |
| Graduate Degree | $106,932 | $51,760 |
| Total | $57,820 | $45,672 |
Family Income in Leola
Family Income Brackets in Leola
According to the Leola family income data, there are 676 families falling into the $100,000 to $149,999 income range, which is the most common income bracket and makes up 32.0% of all families.
| Income Bracket | # Families | % Families |
| Less than $10,000 | 72 | 3.4% |
| $10,000 to $14,999 | 0 | 0.0% |
| $15,000 to $24,999 | 21 | 1.0% |
| $25,000 to $34,999 | 158 | 7.5% |
| $35,000 to $49,999 | 251 | 11.9% |
| $50,000 to $74,999 | 338 | 16.0% |
| $75,000 to $99,999 | 182 | 8.6% |
| $100,000 to $149,999 | 676 | 32.0% |
| $150,000 to $199,999 | 249 | 11.8% |
| $200,000+ | 167 | 7.9% |
Family Income by Famaliy Size in Leola
4-person families (447 | 21.2%) account for the highest median family income in Leola with $134,432 per family, while 2-person families (844 | 40.0%) have the highest median income of $38,804 per family member.
| Income Bracket | # Families | Median Income |
| 2-Person Families | 844 (40.0%) | $77,609 |
| 3-Person Families | 524 (24.8%) | $89,459 |
| 4-Person Families | 447 (21.2%) | $134,432 |
| 5-Person Families | 160 (7.6%) | $104,722 |
| 6-Person Families | 83 (3.9%) | $124,484 |
| 7+ Person Families | 53 (2.5%) | $0 |
| Total | 2,111 (100.0%) | $101,585 |
Family Income by Number of Earners in Leola
The median family income in Leola is $101,585, with families comprising 3+ earners (356) having the highest median family income of $146,331, while families with no earners (212) have the lowest median family income of $45,962, accounting for 16.9% and 10.0% of families, respectively.
| Number of Earners | # Families | Median Income |
| No Earners | 212 (10.0%) | $45,962 |
| 1 Earner | 662 (31.4%) | $57,969 |
| 2 Earners | 881 (41.7%) | $124,103 |
| 3+ Earners | 356 (16.9%) | $146,331 |
| Total | 2,111 (100.0%) | $101,585 |
Household Income in Leola
Household Income Brackets in Leola
With 733 households falling in the category, the $100,000 to $149,999 income range is the most frequent in Leola, accounting for 26.7% of all households. In contrast, only 49 households (1.8%) fall into the $10,000 to $14,999 income bracket, making it the least populous group.
| Income Bracket | # Households | % Households |
| Less than $10,000 | 82 | 3.0% |
| $10,000 to $14,999 | 49 | 1.8% |
| $15,000 to $24,999 | 118 | 4.3% |
| $25,000 to $34,999 | 223 | 8.1% |
| $35,000 to $49,999 | 283 | 10.3% |
| $50,000 to $74,999 | 555 | 20.2% |
| $75,000 to $99,999 | 239 | 8.7% |
| $100,000 to $149,999 | 733 | 26.7% |
| $150,000 to $199,999 | 283 | 10.3% |
| $200,000+ | 181 | 6.6% |
Household Income by Householder Age in Leola
The median household income in Leola is $85,529, with the highest median household income of $116,971 found in the 45 to 64 years age bracket for the primary householder. A total of 947 households (34.5%) fall into this category. Meanwhile, the 15 to 24 years age bracket for the primary householder has the lowest median household income of $41,439, with 118 households (4.3%) in this group.
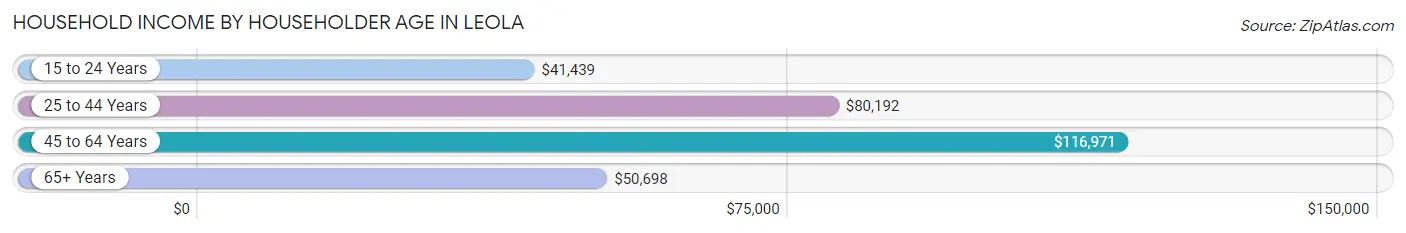
| Income Bracket | # Households | Median Income |
| 15 to 24 Years | 118 (4.3%) | $41,439 |
| 25 to 44 Years | 1,048 (38.2%) | $80,192 |
| 45 to 64 Years | 947 (34.5%) | $116,971 |
| 65+ Years | 634 (23.1%) | $50,698 |
| Total | 2,747 (100.0%) | $85,529 |
Poverty in Leola
Income Below Poverty by Sex and Age in Leola
With 9.6% poverty level for males and 7.2% for females among the residents of Leola, 16 and 17 year old males and 16 and 17 year old females are the most vulnerable to poverty, with 56 males (39.7%) and 47 females (43.1%) in their respective age groups living below the poverty level.
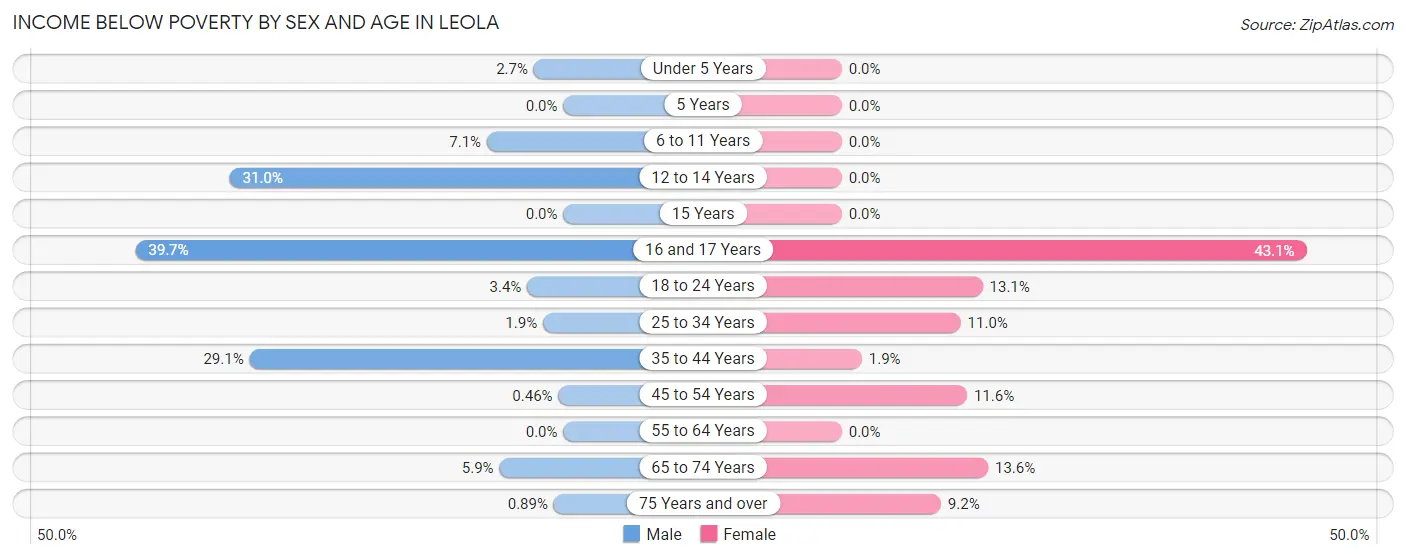
| Age Bracket | Male | Female |
| Under 5 Years | 9 (2.7%) | 0 (0.0%) |
| 5 Years | 0 (0.0%) | 0 (0.0%) |
| 6 to 11 Years | 42 (7.1%) | 0 (0.0%) |
| 12 to 14 Years | 83 (31.0%) | 0 (0.0%) |
| 15 Years | 0 (0.0%) | 0 (0.0%) |
| 16 and 17 Years | 56 (39.7%) | 47 (43.1%) |
| 18 to 24 Years | 10 (3.4%) | 37 (13.1%) |
| 25 to 34 Years | 9 (1.9%) | 61 (11.0%) |
| 35 to 44 Years | 164 (29.1%) | 9 (1.9%) |
| 45 to 54 Years | 2 (0.5%) | 56 (11.6%) |
| 55 to 64 Years | 0 (0.0%) | 0 (0.0%) |
| 65 to 74 Years | 21 (5.9%) | 49 (13.6%) |
| 75 Years and over | 1 (0.9%) | 16 (9.2%) |
| Total | 397 (9.6%) | 275 (7.2%) |
Income Above Poverty by Sex and Age in Leola
According to the poverty statistics in Leola, males aged 5 years and females aged under 5 years are the age groups that are most secure financially, with 100.0% of males and 100.0% of females in these age groups living above the poverty line.
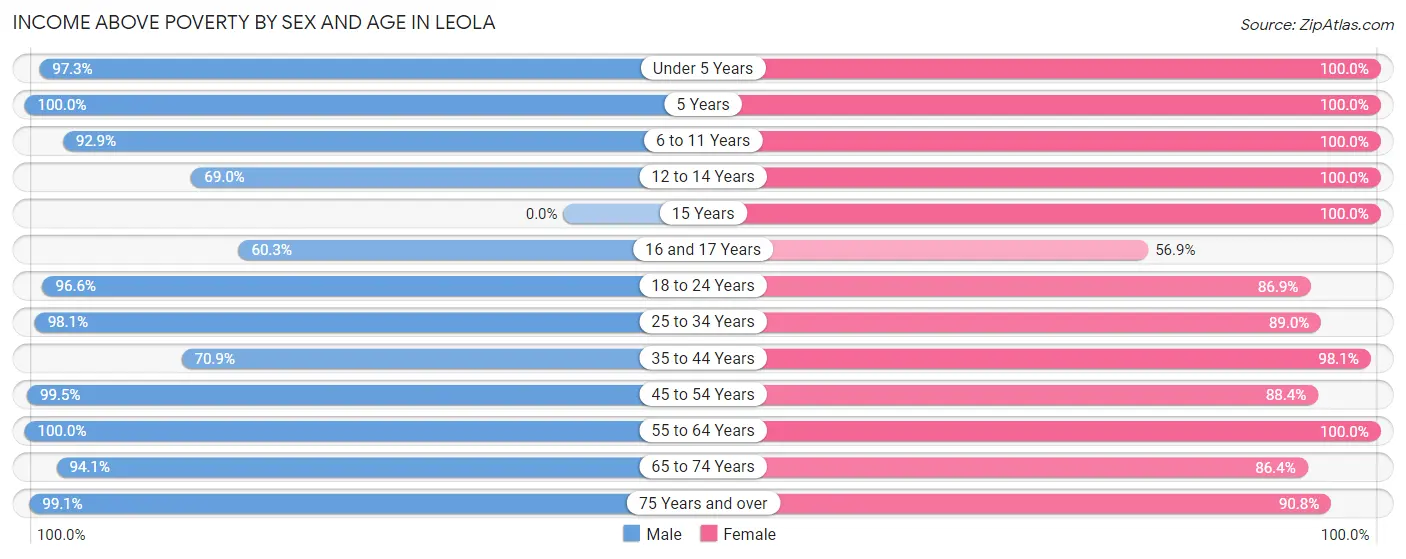
| Age Bracket | Male | Female |
| Under 5 Years | 320 (97.3%) | 181 (100.0%) |
| 5 Years | 62 (100.0%) | 28 (100.0%) |
| 6 to 11 Years | 550 (92.9%) | 265 (100.0%) |
| 12 to 14 Years | 185 (69.0%) | 139 (100.0%) |
| 15 Years | 0 (0.0%) | 242 (100.0%) |
| 16 and 17 Years | 85 (60.3%) | 62 (56.9%) |
| 18 to 24 Years | 288 (96.6%) | 246 (86.9%) |
| 25 to 34 Years | 467 (98.1%) | 492 (89.0%) |
| 35 to 44 Years | 399 (70.9%) | 474 (98.1%) |
| 45 to 54 Years | 436 (99.5%) | 426 (88.4%) |
| 55 to 64 Years | 497 (100.0%) | 515 (100.0%) |
| 65 to 74 Years | 333 (94.1%) | 312 (86.4%) |
| 75 Years and over | 111 (99.1%) | 158 (90.8%) |
| Total | 3,733 (90.4%) | 3,540 (92.8%) |
Income Below Poverty Among Married-Couple Families in Leola
The poverty statistics for married-couple families in Leola show that 1.1% or 19 of the total 1,692 families live below the poverty line. Families with 3 or 4 children have the highest poverty rate of 5.1%, comprising of 10 families. On the other hand, families with 1 or 2 children have the lowest poverty rate of 0.0%, which includes 0 families.
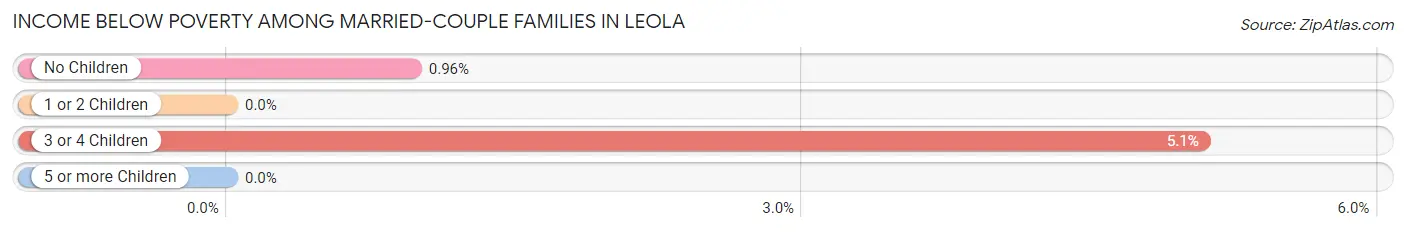
| Children | Above Poverty | Below Poverty |
| No Children | 927 (99.0%) | 9 (1.0%) |
| 1 or 2 Children | 535 (100.0%) | 0 (0.0%) |
| 3 or 4 Children | 187 (94.9%) | 10 (5.1%) |
| 5 or more Children | 24 (100.0%) | 0 (0.0%) |
| Total | 1,673 (98.9%) | 19 (1.1%) |
Income Below Poverty Among Single-Parent Households in Leola
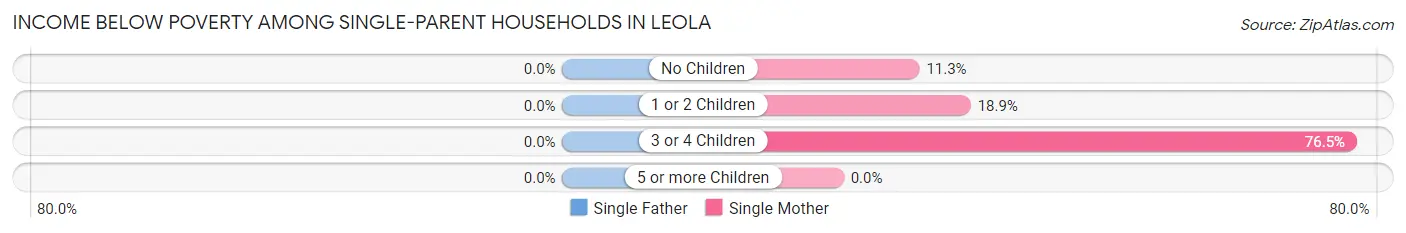
| Children | Single Father | Single Mother |
| No Children | 0 (0.0%) | 7 (11.3%) |
| 1 or 2 Children | 0 (0.0%) | 32 (18.9%) |
| 3 or 4 Children | 0 (0.0%) | 39 (76.5%) |
| 5 or more Children | 0 (0.0%) | 0 (0.0%) |
| Total | 0 (0.0%) | 78 (27.7%) |
Income Below Poverty Among Married-Couple vs Single-Parent Households in Leola
The poverty data for Leola shows that 19 of the married-couple family households (1.1%) and 78 of the single-parent households (18.6%) are living below the poverty level. Within the married-couple family households, those with 3 or 4 children have the highest poverty rate, with 10 households (5.1%) falling below the poverty line. Among the single-parent households, those with 3 or 4 children have the highest poverty rate, with 39 household (56.5%) living below poverty.
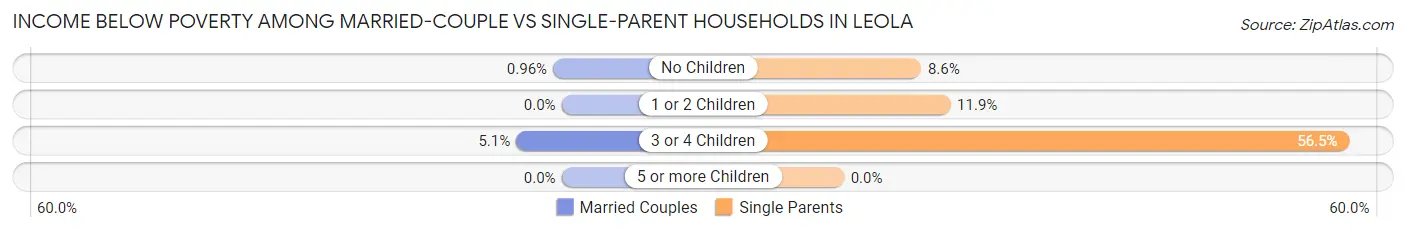
| Children | Married-Couple Families | Single-Parent Households |
| No Children | 9 (1.0%) | 7 (8.6%) |
| 1 or 2 Children | 0 (0.0%) | 32 (11.9%) |
| 3 or 4 Children | 10 (5.1%) | 39 (56.5%) |
| 5 or more Children | 0 (0.0%) | 0 (0.0%) |
| Total | 19 (1.1%) | 78 (18.6%) |
Race in Leola
The most populous races in Leola are White / Caucasian (6,380 | 80.3%), Hispanic or Latino (1,037 | 13.1%), and Two or more Races (607 | 7.6%).
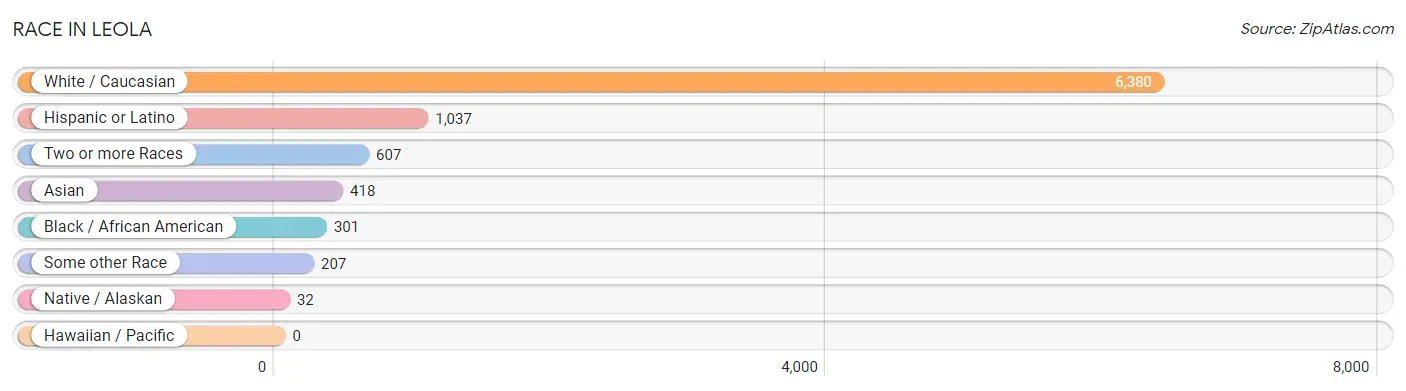
| Race | # Population | % Population |
| Asian | 418 | 5.3% |
| Black / African American | 301 | 3.8% |
| Hawaiian / Pacific | 0 | 0.0% |
| Hispanic or Latino | 1,037 | 13.1% |
| Native / Alaskan | 32 | 0.4% |
| White / Caucasian | 6,380 | 80.3% |
| Two or more Races | 607 | 7.6% |
| Some other Race | 207 | 2.6% |
| Total | 7,945 | 100.0% |
Ancestry in Leola
The most populous ancestries reported in Leola are German (2,570 | 32.4%), Puerto Rican (787 | 9.9%), Italian (719 | 9.0%), Irish (692 | 8.7%), and American (486 | 6.1%), together accounting for 66.1% of all Leola residents.
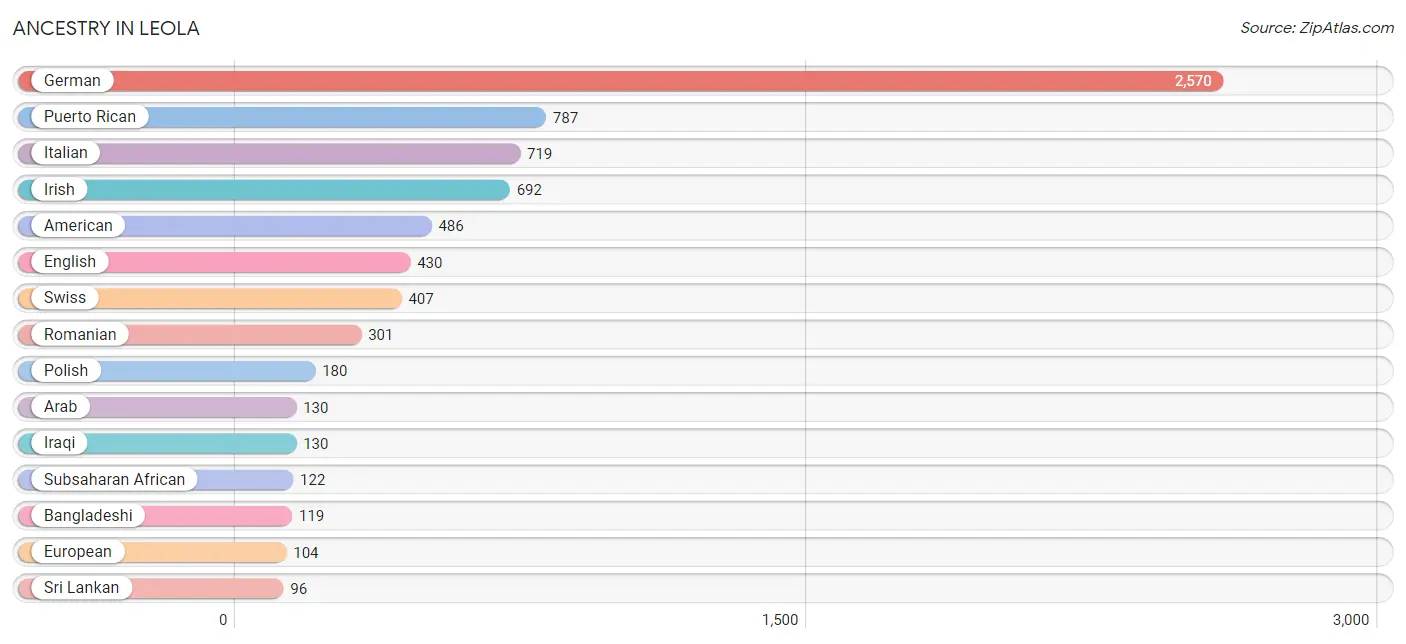
| Ancestry | # Population | % Population |
| Albanian | 17 | 0.2% |
| American | 486 | 6.1% |
| Arab | 130 | 1.6% |
| Austrian | 25 | 0.3% |
| Bangladeshi | 119 | 1.5% |
| Bhutanese | 53 | 0.7% |
| British | 18 | 0.2% |
| British West Indian | 15 | 0.2% |
| Central American | 59 | 0.7% |
| Central American Indian | 74 | 0.9% |
| Cherokee | 2 | 0.0% |
| Colombian | 9 | 0.1% |
| Danish | 30 | 0.4% |
| Dutch | 28 | 0.4% |
| Eastern European | 12 | 0.2% |
| English | 430 | 5.4% |
| European | 104 | 1.3% |
| Finnish | 7 | 0.1% |
| French | 30 | 0.4% |
| German | 2,570 | 32.4% |
| Greek | 44 | 0.5% |
| Honduran | 59 | 0.7% |
| Icelander | 11 | 0.1% |
| Indian (Asian) | 29 | 0.4% |
| Iraqi | 130 | 1.6% |
| Irish | 692 | 8.7% |
| Italian | 719 | 9.0% |
| Malaysian | 89 | 1.1% |
| Mexican | 83 | 1.0% |
| Nigerian | 85 | 1.1% |
| Northern European | 7 | 0.1% |
| Pakistani | 32 | 0.4% |
| Pennsylvania German | 29 | 0.4% |
| Polish | 180 | 2.3% |
| Puerto Rican | 787 | 9.9% |
| Romanian | 301 | 3.8% |
| Russian | 80 | 1.0% |
| Scandinavian | 37 | 0.5% |
| Scotch-Irish | 47 | 0.6% |
| Scottish | 94 | 1.2% |
| Slavic | 13 | 0.2% |
| Slovak | 11 | 0.1% |
| Slovene | 9 | 0.1% |
| South American | 9 | 0.1% |
| Spanish | 29 | 0.4% |
| Sri Lankan | 96 | 1.2% |
| Subsaharan African | 122 | 1.5% |
| Swedish | 11 | 0.1% |
| Swiss | 407 | 5.1% |
| Welsh | 37 | 0.5% | View All 50 Rows |
Immigrants in Leola
The most numerous immigrant groups reported in Leola came from Asia (285 | 3.6%), Europe (193 | 2.4%), Eastern Europe (161 | 2.0%), Romania (155 | 1.9%), and South Eastern Asia (140 | 1.8%), together accounting for 11.8% of all Leola residents.
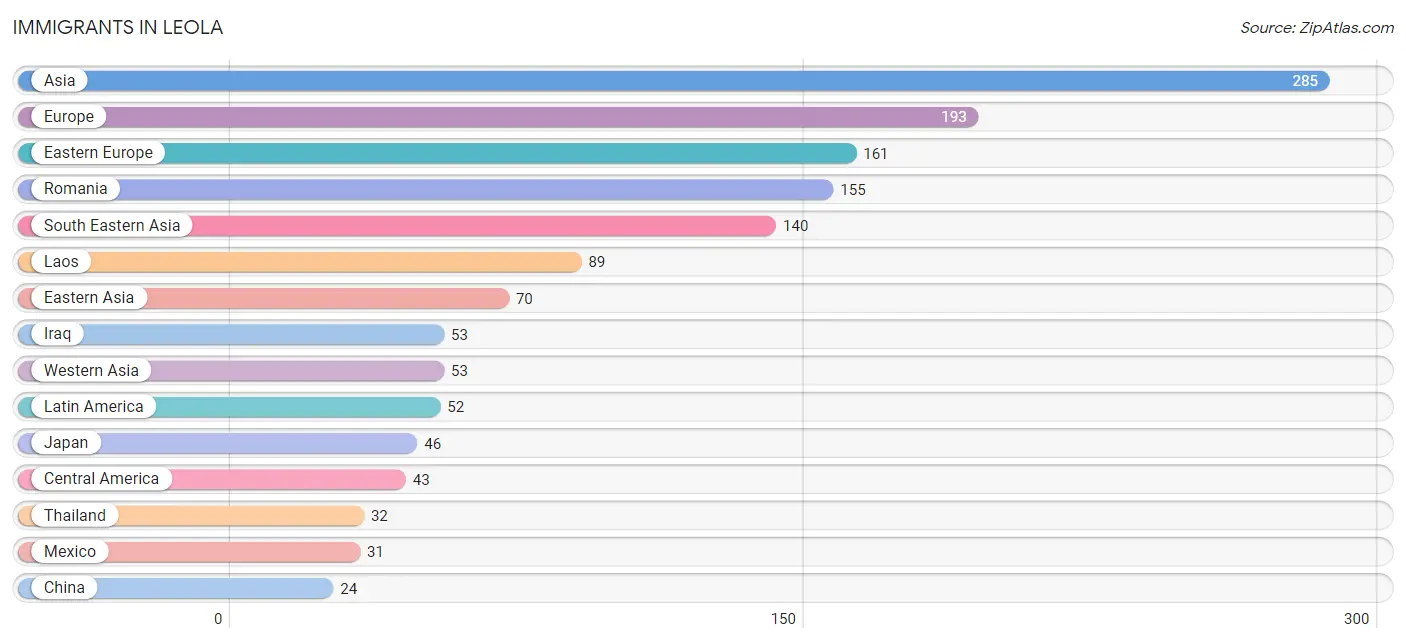
| Immigration Origin | # Population | % Population |
| Africa | 5 | 0.1% |
| Asia | 285 | 3.6% |
| Canada | 7 | 0.1% |
| Central America | 43 | 0.5% |
| China | 24 | 0.3% |
| Colombia | 9 | 0.1% |
| Eastern Africa | 5 | 0.1% |
| Eastern Asia | 70 | 0.9% |
| Eastern Europe | 161 | 2.0% |
| Europe | 193 | 2.4% |
| Germany | 21 | 0.3% |
| Honduras | 12 | 0.2% |
| India | 22 | 0.3% |
| Iraq | 53 | 0.7% |
| Japan | 46 | 0.6% |
| Laos | 89 | 1.1% |
| Latin America | 52 | 0.6% |
| Mexico | 31 | 0.4% |
| Northern Europe | 11 | 0.1% |
| Philippines | 19 | 0.2% |
| Romania | 155 | 1.9% |
| Russia | 6 | 0.1% |
| South America | 9 | 0.1% |
| South Central Asia | 22 | 0.3% |
| South Eastern Asia | 140 | 1.8% |
| Thailand | 32 | 0.4% |
| Western Asia | 53 | 0.7% |
| Western Europe | 21 | 0.3% | View All 28 Rows |
Sex and Age in Leola
Sex and Age in Leola
The most populous age groups in Leola are 10 to 14 Years (500 | 12.1%) for men and 15 to 19 Years (393 | 10.3%) for women.
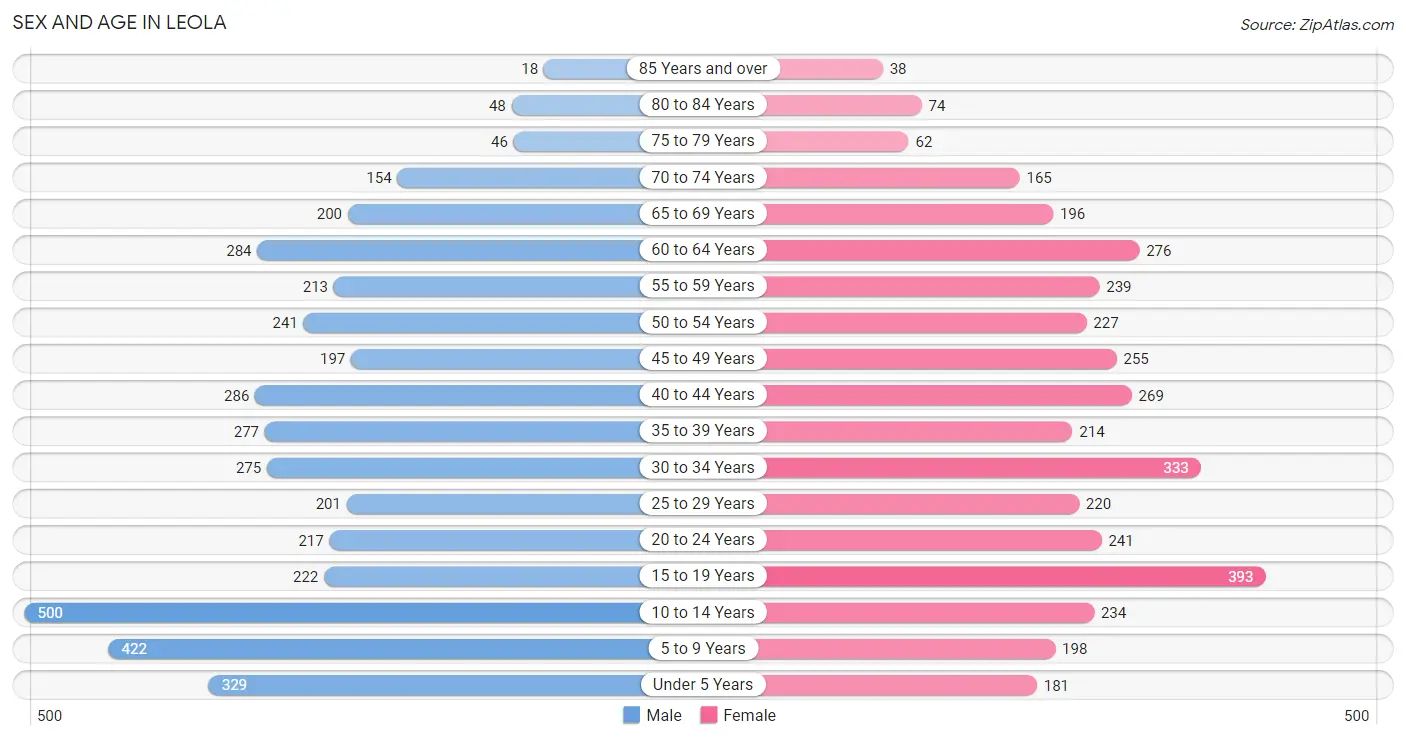
| Age Bracket | Male | Female |
| Under 5 Years | 329 (8.0%) | 181 (4.7%) |
| 5 to 9 Years | 422 (10.2%) | 198 (5.2%) |
| 10 to 14 Years | 500 (12.1%) | 234 (6.1%) |
| 15 to 19 Years | 222 (5.4%) | 393 (10.3%) |
| 20 to 24 Years | 217 (5.2%) | 241 (6.3%) |
| 25 to 29 Years | 201 (4.9%) | 220 (5.8%) |
| 30 to 34 Years | 275 (6.7%) | 333 (8.7%) |
| 35 to 39 Years | 277 (6.7%) | 214 (5.6%) |
| 40 to 44 Years | 286 (6.9%) | 269 (7.0%) |
| 45 to 49 Years | 197 (4.8%) | 255 (6.7%) |
| 50 to 54 Years | 241 (5.8%) | 227 (5.9%) |
| 55 to 59 Years | 213 (5.2%) | 239 (6.3%) |
| 60 to 64 Years | 284 (6.9%) | 276 (7.2%) |
| 65 to 69 Years | 200 (4.8%) | 196 (5.1%) |
| 70 to 74 Years | 154 (3.7%) | 165 (4.3%) |
| 75 to 79 Years | 46 (1.1%) | 62 (1.6%) |
| 80 to 84 Years | 48 (1.2%) | 74 (1.9%) |
| 85 Years and over | 18 (0.4%) | 38 (1.0%) |
| Total | 4,130 (100.0%) | 3,815 (100.0%) |
Families and Households in Leola
Median Family Size in Leola
The median family size in Leola is 3.28 persons per family, with married-couple families (1,692 | 80.1%) accounting for the largest median family size of 3.33 persons per family. On the other hand, single male/father families (137 | 6.5%) represent the smallest median family size with 2.94 persons per family.
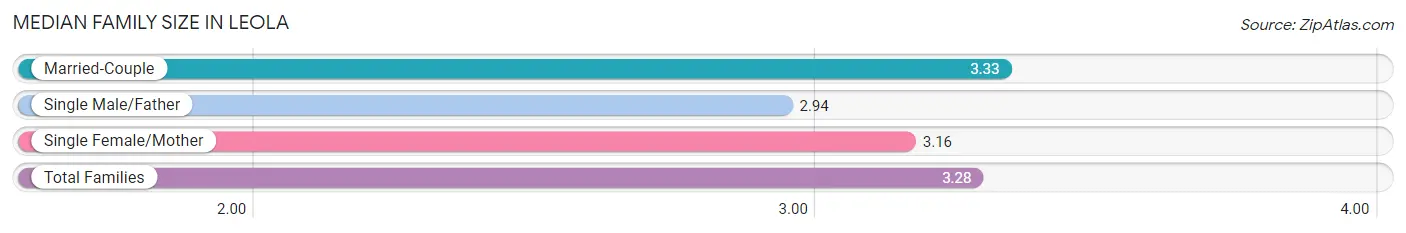
| Family Type | # Families | Family Size |
| Married-Couple | 1,692 (80.1%) | 3.33 |
| Single Male/Father | 137 (6.5%) | 2.94 |
| Single Female/Mother | 282 (13.4%) | 3.16 |
| Total Families | 2,111 (100.0%) | 3.28 |
Median Household Size in Leola
The median household size in Leola is 2.89 persons per household, with single female/mother households (282 | 10.3%) accounting for the largest median household size of 3.71 persons per household. non-family households (636 | 23.2%) represent the smallest median household size with 1.26 persons per household.
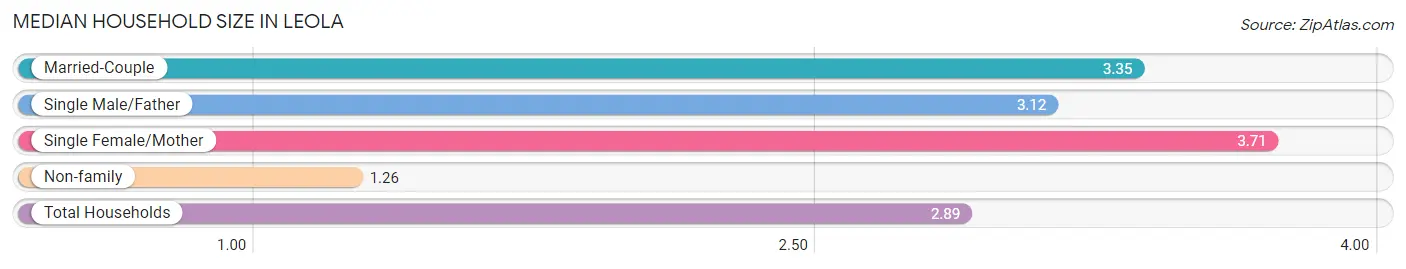
| Household Type | # Households | Household Size |
| Married-Couple | 1,692 (61.6%) | 3.35 |
| Single Male/Father | 137 (5.0%) | 3.12 |
| Single Female/Mother | 282 (10.3%) | 3.71 |
| Non-family | 636 (23.2%) | 1.26 |
| Total Households | 2,747 (100.0%) | 2.89 |
Household Size by Marriage Status in Leola
Out of a total of 2,747 households in Leola, 2,111 (76.8%) are family households, while 636 (23.2%) are nonfamily households. The most numerous type of family households are 2-person households, comprising 759, and the most common type of nonfamily households are 1-person households, comprising 491.
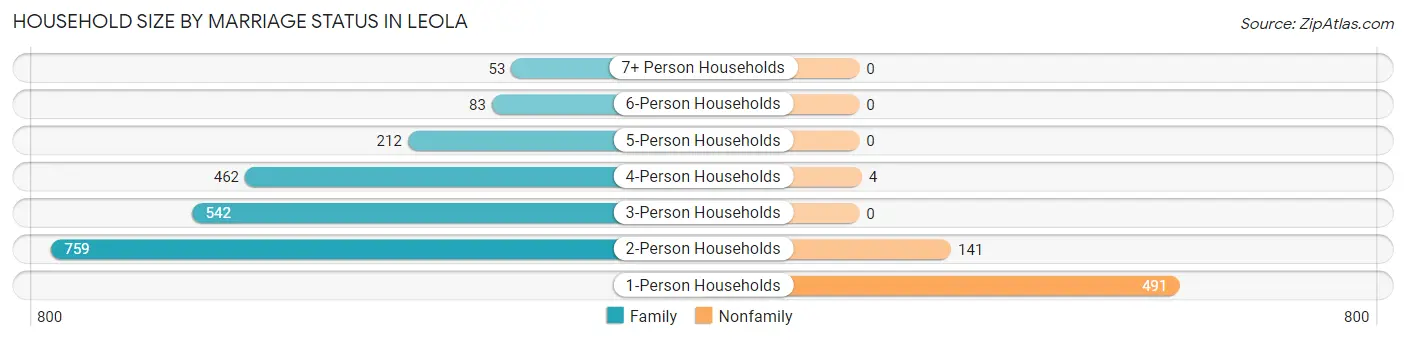
| Household Size | Family Households | Nonfamily Households |
| 1-Person Households | - | 491 (17.9%) |
| 2-Person Households | 759 (27.6%) | 141 (5.1%) |
| 3-Person Households | 542 (19.7%) | 0 (0.0%) |
| 4-Person Households | 462 (16.8%) | 4 (0.2%) |
| 5-Person Households | 212 (7.7%) | 0 (0.0%) |
| 6-Person Households | 83 (3.0%) | 0 (0.0%) |
| 7+ Person Households | 53 (1.9%) | 0 (0.0%) |
| Total | 2,111 (76.8%) | 636 (23.2%) |
Female Fertility in Leola
Fertility by Age in Leola
Average fertility rate in Leola is 49.0 births per 1,000 women. Women in the age bracket of 20 to 34 years have the highest fertility rate with 120.0 births per 1,000 women. Women in the age bracket of 20 to 34 years acount for 100.0% of all women with births.
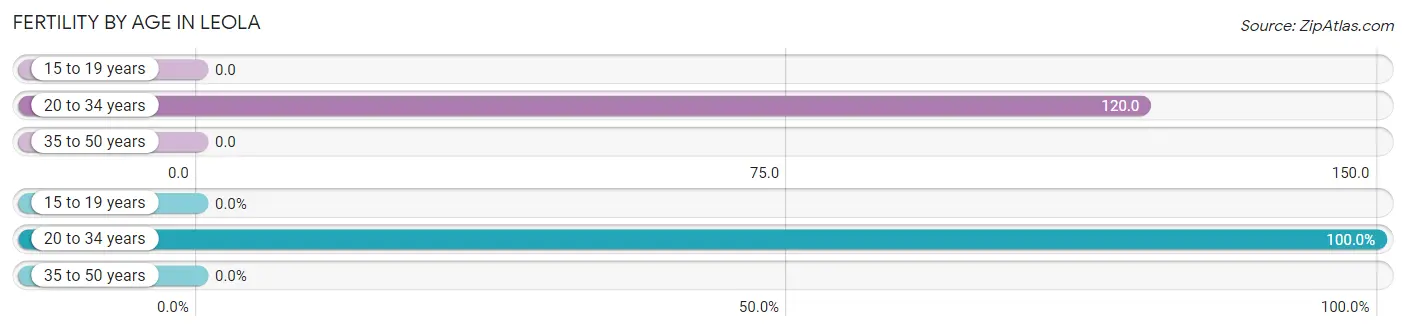
| Age Bracket | Women with Births | Births / 1,000 Women |
| 15 to 19 years | 0 (0.0%) | 0.0 |
| 20 to 34 years | 95 (100.0%) | 120.0 |
| 35 to 50 years | 0 (0.0%) | 0.0 |
| Total | 95 (100.0%) | 49.0 |
Fertility by Age by Marriage Status in Leola
94.7% of women with births (95) in Leola are married. The highest percentage of unmarried women with births falls into 20 to 34 years age bracket with 5.3% of them unmarried at the time of birth, while the lowest percentage of unmarried women with births belong to 20 to 34 years age bracket with 5.3% of them unmarried.
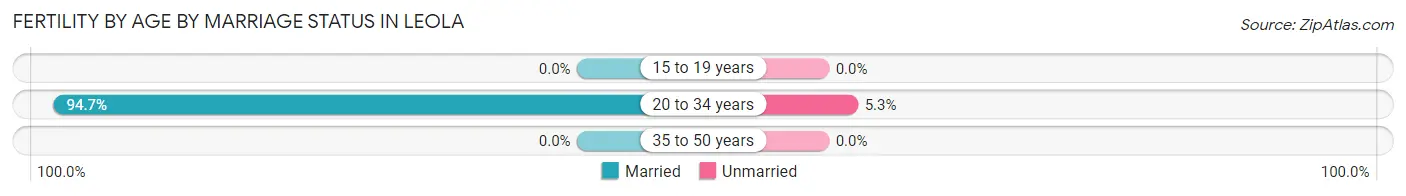
| Age Bracket | Married | Unmarried |
| 15 to 19 years | 0 (0.0%) | 0 (0.0%) |
| 20 to 34 years | 90 (94.7%) | 5 (5.3%) |
| 35 to 50 years | 0 (0.0%) | 0 (0.0%) |
| Total | 90 (94.7%) | 5 (5.3%) |
Fertility by Education in Leola
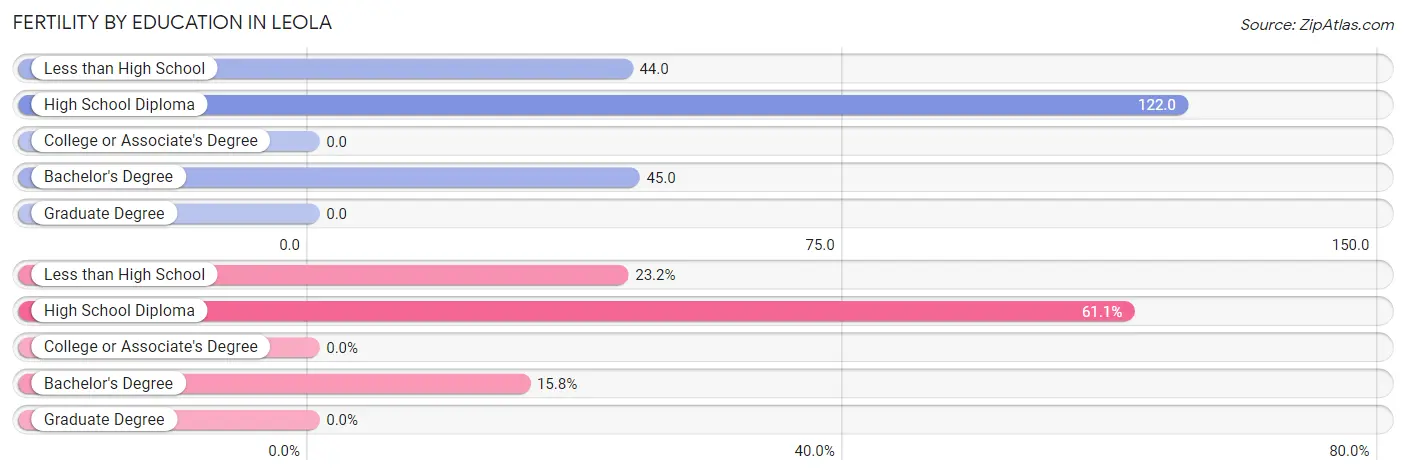
| Educational Attainment | Women with Births | Births / 1,000 Women |
| Less than High School | 22 (23.2%) | 44.0 |
| High School Diploma | 58 (61.1%) | 122.0 |
| College or Associate's Degree | 0 (0.0%) | 0.0 |
| Bachelor's Degree | 15 (15.8%) | 45.0 |
| Graduate Degree | 0 (0.0%) | 0.0 |
| Total | 95 (100.0%) | 49.0 |
Fertility by Education by Marriage Status in Leola
5.3% of women with births in Leola are unmarried. Women with the educational attainment of less than high school are most likely to be married with 100.0% of them married at childbirth, while women with the educational attainment of high school diploma are least likely to be married with 8.6% of them unmarried at childbirth.
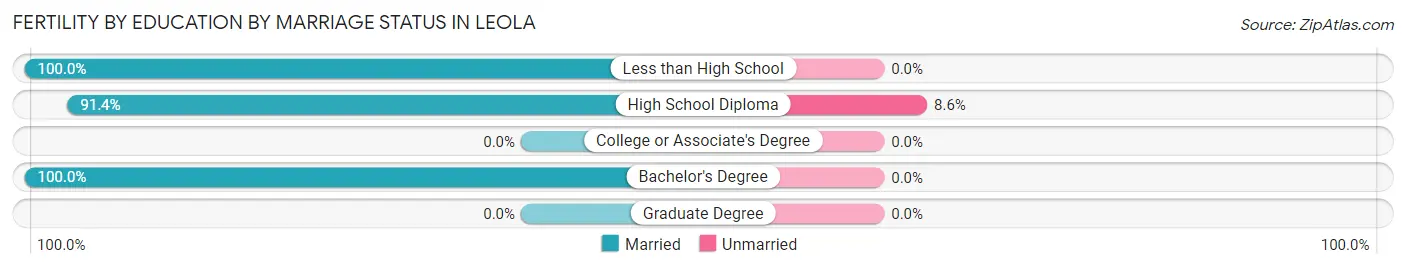
| Educational Attainment | Married | Unmarried |
| Less than High School | 22 (100.0%) | 0 (0.0%) |
| High School Diploma | 53 (91.4%) | 5 (8.6%) |
| College or Associate's Degree | 0 (0.0%) | 0 (0.0%) |
| Bachelor's Degree | 15 (100.0%) | 0 (0.0%) |
| Graduate Degree | 0 (0.0%) | 0 (0.0%) |
| Total | 90 (94.7%) | 5 (5.3%) |
Employment Characteristics in Leola
Employment by Class of Employer in Leola
Among the 3,786 employed individuals in Leola, private company employees (2,803 | 74.0%), not-for-profit organizations (336 | 8.9%), and self-employed (not incorporated) (251 | 6.6%) make up the most common classes of employment.
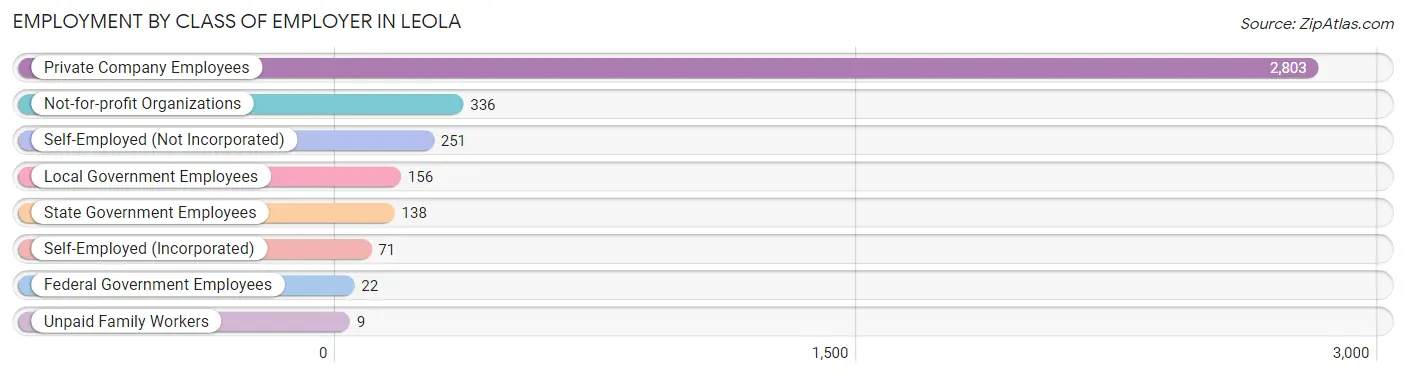
| Employer Class | # Employees | % Employees |
| Private Company Employees | 2,803 | 74.0% |
| Self-Employed (Incorporated) | 71 | 1.9% |
| Self-Employed (Not Incorporated) | 251 | 6.6% |
| Not-for-profit Organizations | 336 | 8.9% |
| Local Government Employees | 156 | 4.1% |
| State Government Employees | 138 | 3.6% |
| Federal Government Employees | 22 | 0.6% |
| Unpaid Family Workers | 9 | 0.2% |
| Total | 3,786 | 100.0% |
Employment Status by Age in Leola
According to the labor force statistics for Leola, out of the total population over 16 years of age (5,839), 70.6% or 4,122 individuals are in the labor force, with 6.0% or 247 of them unemployed. The age group with the highest labor force participation rate is 30 to 34 years, with 91.6% or 557 individuals in the labor force. Within the labor force, the 20 to 24 years age range has the highest percentage of unemployed individuals, with 15.4% or 57 of them being unemployed.
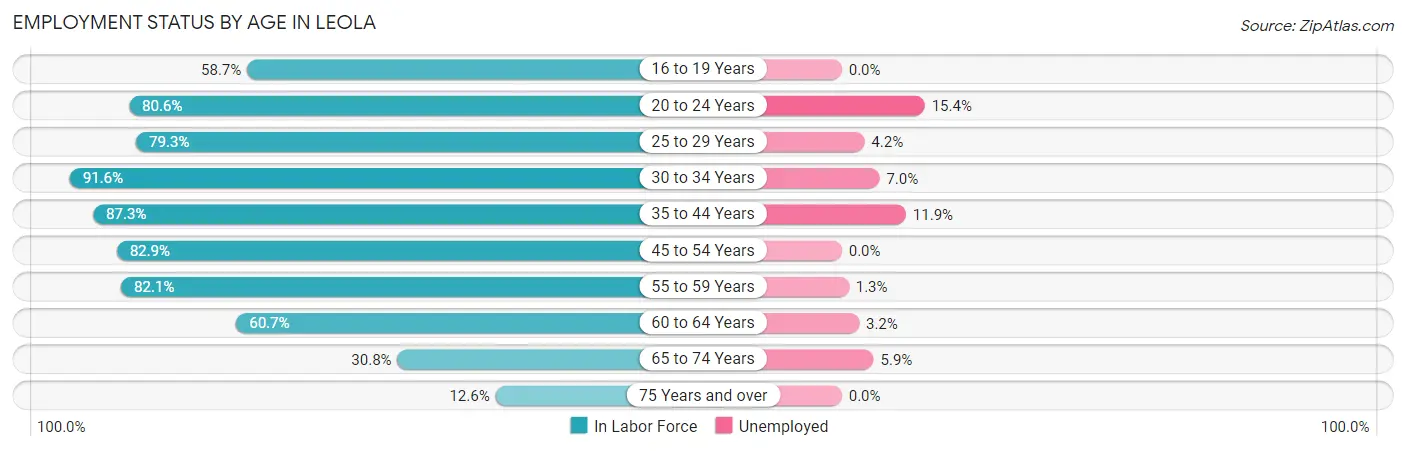
| Age Bracket | In Labor Force | Unemployed |
| 16 to 19 Years | 219 (58.7%) | 0 (0.0%) |
| 20 to 24 Years | 369 (80.6%) | 57 (15.4%) |
| 25 to 29 Years | 334 (79.3%) | 14 (4.2%) |
| 30 to 34 Years | 557 (91.6%) | 39 (7.0%) |
| 35 to 44 Years | 913 (87.3%) | 109 (11.9%) |
| 45 to 54 Years | 763 (82.9%) | 0 (0.0%) |
| 55 to 59 Years | 371 (82.1%) | 5 (1.3%) |
| 60 to 64 Years | 340 (60.7%) | 11 (3.2%) |
| 65 to 74 Years | 220 (30.8%) | 13 (5.9%) |
| 75 Years and over | 36 (12.6%) | 0 (0.0%) |
| Total | 4,122 (70.6%) | 247 (6.0%) |
Employment Status by Educational Attainment in Leola
According to labor force statistics for Leola, 81.8% of individuals (3,278) out of the total population between 25 and 64 years of age (4,007) are in the labor force, with 5.4% or 177 of them being unemployed. The group with the highest labor force participation rate are those with the educational attainment of bachelor's degree or higher, with 91.1% or 1,141 individuals in the labor force. Within the labor force, individuals with less than high school education have the highest percentage of unemployment, with 30.2% or 115 of them being unemployed.
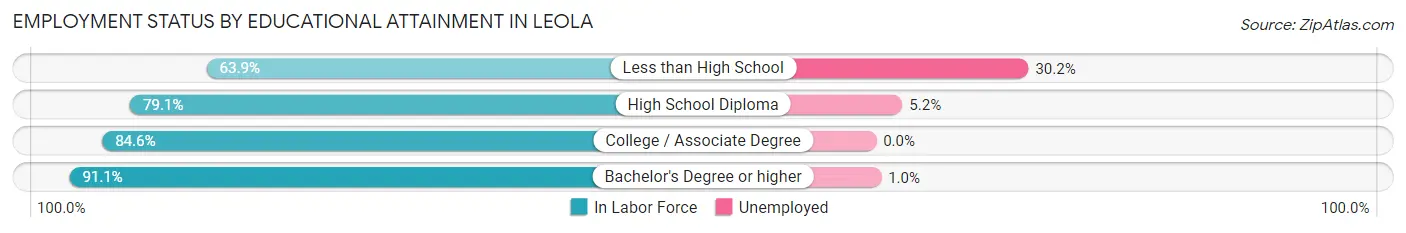
| Educational Attainment | In Labor Force | Unemployed |
| Less than High School | 381 (63.9%) | 180 (30.2%) |
| High School Diploma | 1,009 (79.1%) | 66 (5.2%) |
| College / Associate Degree | 748 (84.6%) | 0 (0.0%) |
| Bachelor's Degree or higher | 1,141 (91.1%) | 13 (1.0%) |
| Total | 3,278 (81.8%) | 216 (5.4%) |
Employment Occupations by Sex in Leola
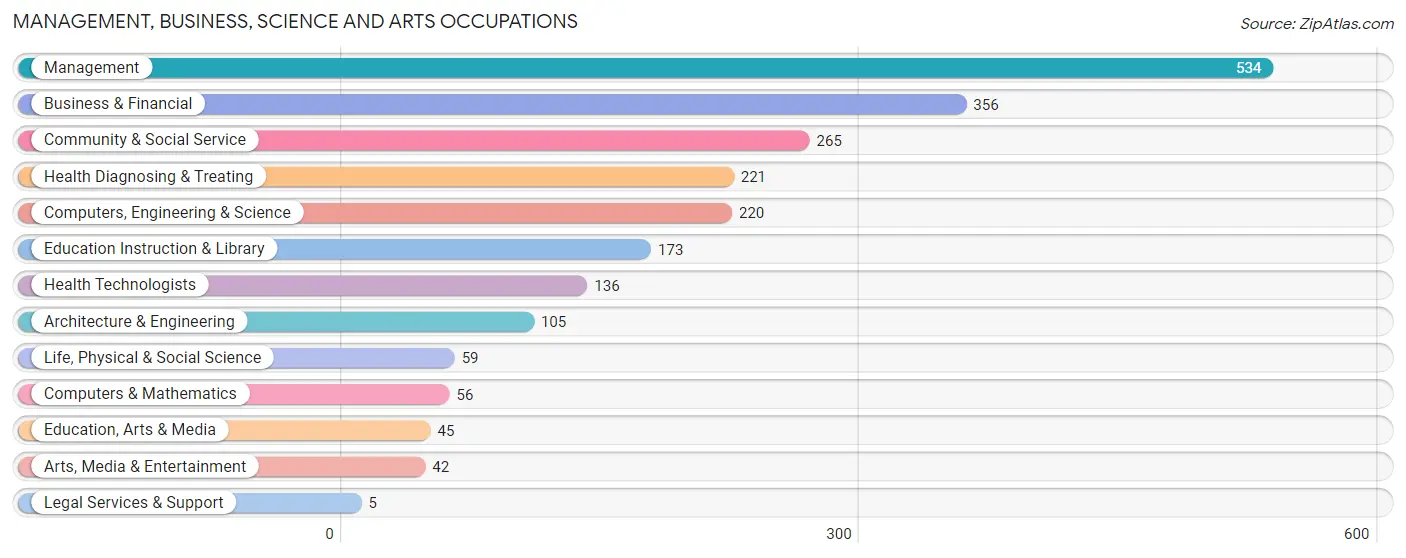
Management, Business, Science and Arts Occupations
The most common Management, Business, Science and Arts occupations in Leola are Management (534 | 13.8%), Business & Financial (356 | 9.2%), Community & Social Service (265 | 6.8%), Health Diagnosing & Treating (221 | 5.7%), and Computers, Engineering & Science (220 | 5.7%).
Management, Business, Science and Arts Occupations by Sex
Within the Management, Business, Science and Arts occupations in Leola, the most male-oriented occupations are Computers & Mathematics (100.0%), Arts, Media & Entertainment (100.0%), and Architecture & Engineering (84.8%), while the most female-oriented occupations are Legal Services & Support (100.0%), Education Instruction & Library (93.6%), and Health Technologists (88.2%).
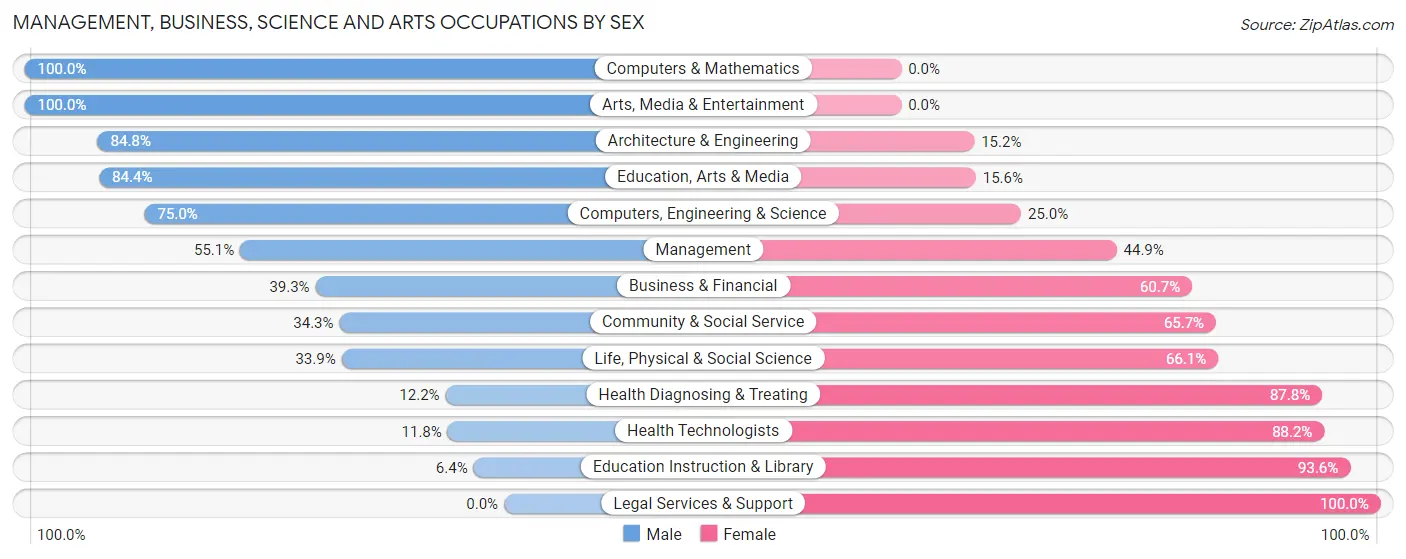
| Occupation | Male | Female |
| Management | 294 (55.1%) | 240 (44.9%) |
| Business & Financial | 140 (39.3%) | 216 (60.7%) |
| Computers, Engineering & Science | 165 (75.0%) | 55 (25.0%) |
| Computers & Mathematics | 56 (100.0%) | 0 (0.0%) |
| Architecture & Engineering | 89 (84.8%) | 16 (15.2%) |
| Life, Physical & Social Science | 20 (33.9%) | 39 (66.1%) |
| Community & Social Service | 91 (34.3%) | 174 (65.7%) |
| Education, Arts & Media | 38 (84.4%) | 7 (15.6%) |
| Legal Services & Support | 0 (0.0%) | 5 (100.0%) |
| Education Instruction & Library | 11 (6.4%) | 162 (93.6%) |
| Arts, Media & Entertainment | 42 (100.0%) | 0 (0.0%) |
| Health Diagnosing & Treating | 27 (12.2%) | 194 (87.8%) |
| Health Technologists | 16 (11.8%) | 120 (88.2%) |
| Total (Category) | 717 (44.9%) | 879 (55.1%) |
| Total (Overall) | 2,009 (51.9%) | 1,865 (48.1%) |
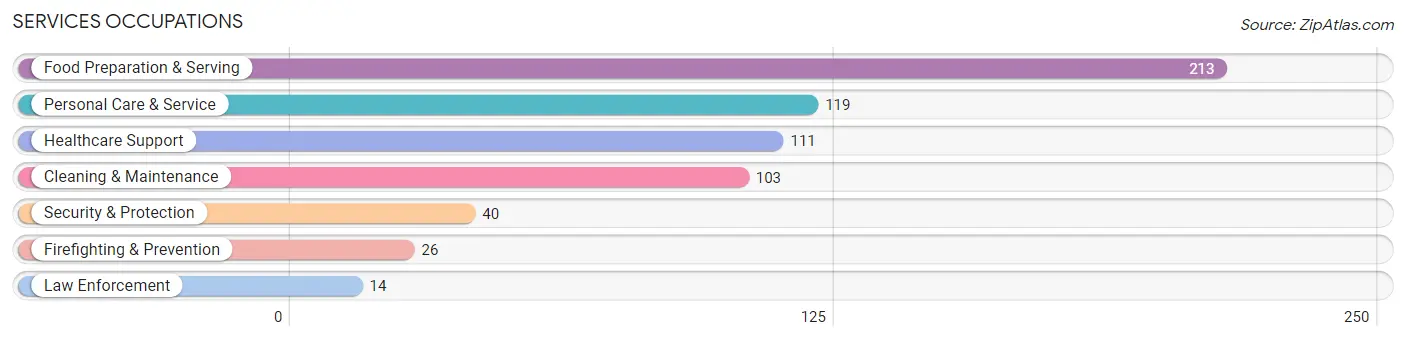
Services Occupations
The most common Services occupations in Leola are Food Preparation & Serving (213 | 5.5%), Personal Care & Service (119 | 3.1%), Healthcare Support (111 | 2.9%), Cleaning & Maintenance (103 | 2.7%), and Security & Protection (40 | 1.0%).
Services Occupations by Sex
Within the Services occupations in Leola, the most male-oriented occupations are Law Enforcement (100.0%), Security & Protection (62.5%), and Personal Care & Service (48.7%), while the most female-oriented occupations are Healthcare Support (100.0%), Food Preparation & Serving (74.2%), and Cleaning & Maintenance (73.8%).
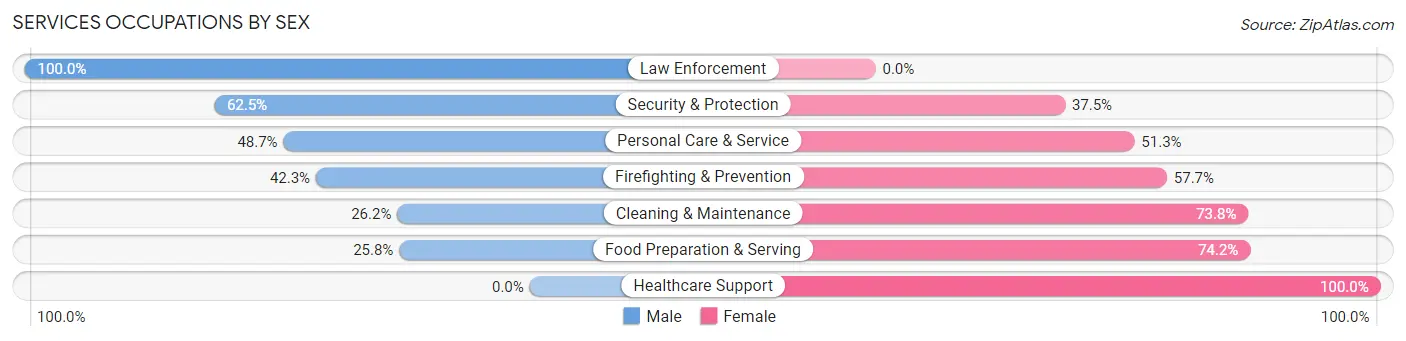
| Occupation | Male | Female |
| Healthcare Support | 0 (0.0%) | 111 (100.0%) |
| Security & Protection | 25 (62.5%) | 15 (37.5%) |
| Firefighting & Prevention | 11 (42.3%) | 15 (57.7%) |
| Law Enforcement | 14 (100.0%) | 0 (0.0%) |
| Food Preparation & Serving | 55 (25.8%) | 158 (74.2%) |
| Cleaning & Maintenance | 27 (26.2%) | 76 (73.8%) |
| Personal Care & Service | 58 (48.7%) | 61 (51.3%) |
| Total (Category) | 165 (28.2%) | 421 (71.8%) |
| Total (Overall) | 2,009 (51.9%) | 1,865 (48.1%) |
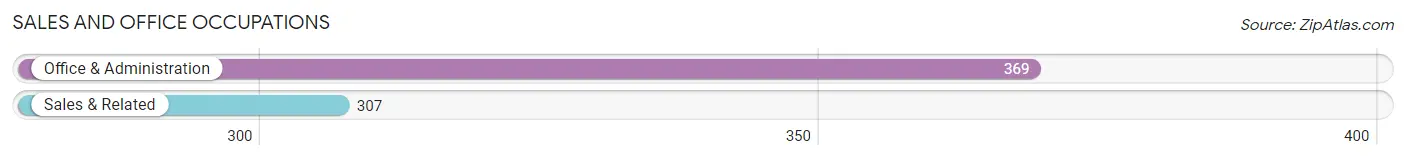
Sales and Office Occupations
The most common Sales and Office occupations in Leola are Office & Administration (369 | 9.5%), and Sales & Related (307 | 7.9%).
Sales and Office Occupations by Sex
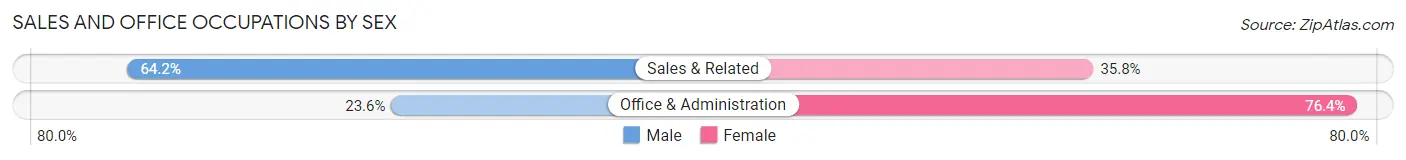
| Occupation | Male | Female |
| Sales & Related | 197 (64.2%) | 110 (35.8%) |
| Office & Administration | 87 (23.6%) | 282 (76.4%) |
| Total (Category) | 284 (42.0%) | 392 (58.0%) |
| Total (Overall) | 2,009 (51.9%) | 1,865 (48.1%) |
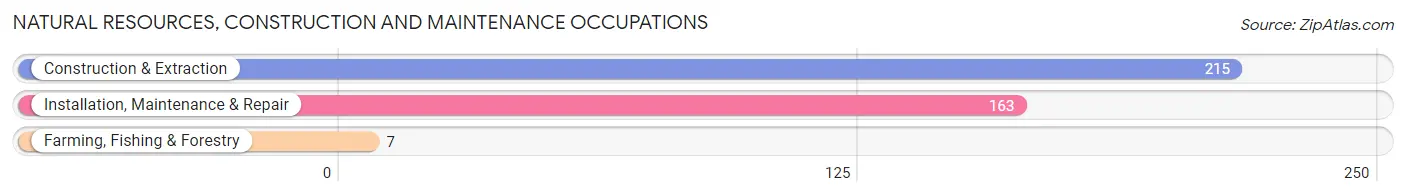
Natural Resources, Construction and Maintenance Occupations
The most common Natural Resources, Construction and Maintenance occupations in Leola are Construction & Extraction (215 | 5.6%), Installation, Maintenance & Repair (163 | 4.2%), and Farming, Fishing & Forestry (7 | 0.2%).
Natural Resources, Construction and Maintenance Occupations by Sex
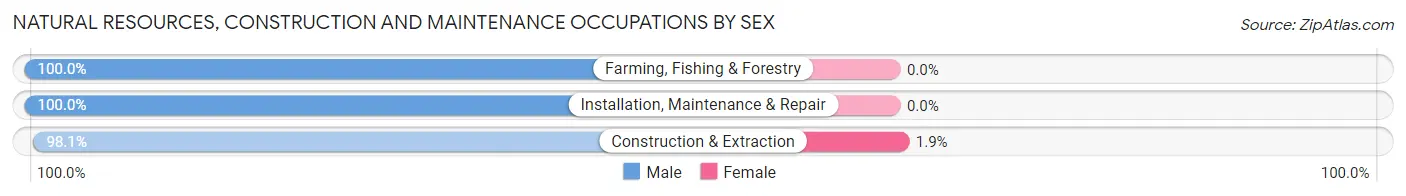
| Occupation | Male | Female |
| Farming, Fishing & Forestry | 7 (100.0%) | 0 (0.0%) |
| Construction & Extraction | 211 (98.1%) | 4 (1.9%) |
| Installation, Maintenance & Repair | 163 (100.0%) | 0 (0.0%) |
| Total (Category) | 381 (99.0%) | 4 (1.0%) |
| Total (Overall) | 2,009 (51.9%) | 1,865 (48.1%) |
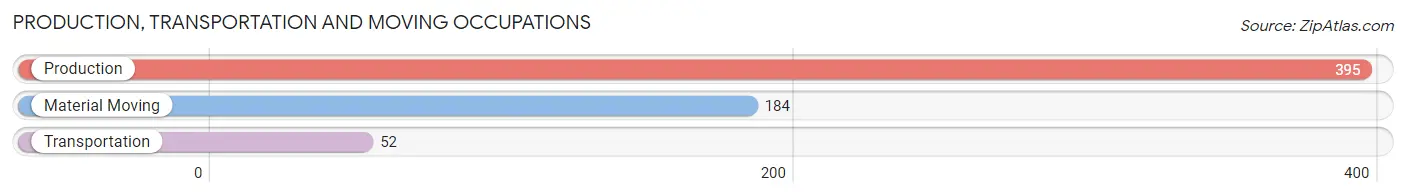
Production, Transportation and Moving Occupations
The most common Production, Transportation and Moving occupations in Leola are Production (395 | 10.2%), Material Moving (184 | 4.8%), and Transportation (52 | 1.3%).
Production, Transportation and Moving Occupations by Sex
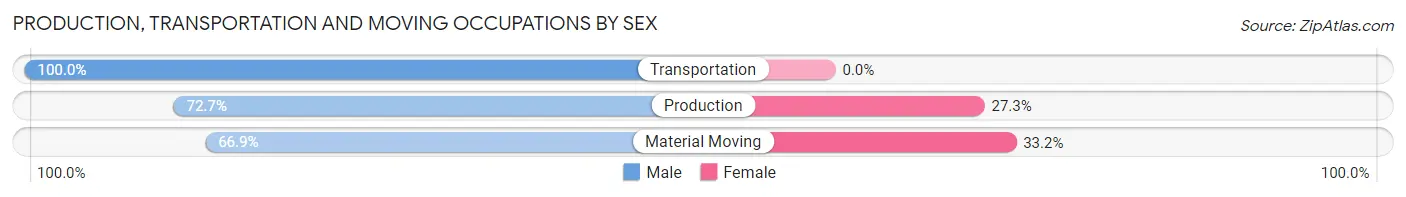
| Occupation | Male | Female |
| Production | 287 (72.7%) | 108 (27.3%) |
| Transportation | 52 (100.0%) | 0 (0.0%) |
| Material Moving | 123 (66.8%) | 61 (33.2%) |
| Total (Category) | 462 (73.2%) | 169 (26.8%) |
| Total (Overall) | 2,009 (51.9%) | 1,865 (48.1%) |
Employment Industries by Sex in Leola
Employment Industries in Leola
The major employment industries in Leola include Manufacturing (642 | 16.6%), Health Care & Social Assistance (547 | 14.1%), Retail Trade (515 | 13.3%), Construction (330 | 8.5%), and Professional & Scientific (286 | 7.4%).
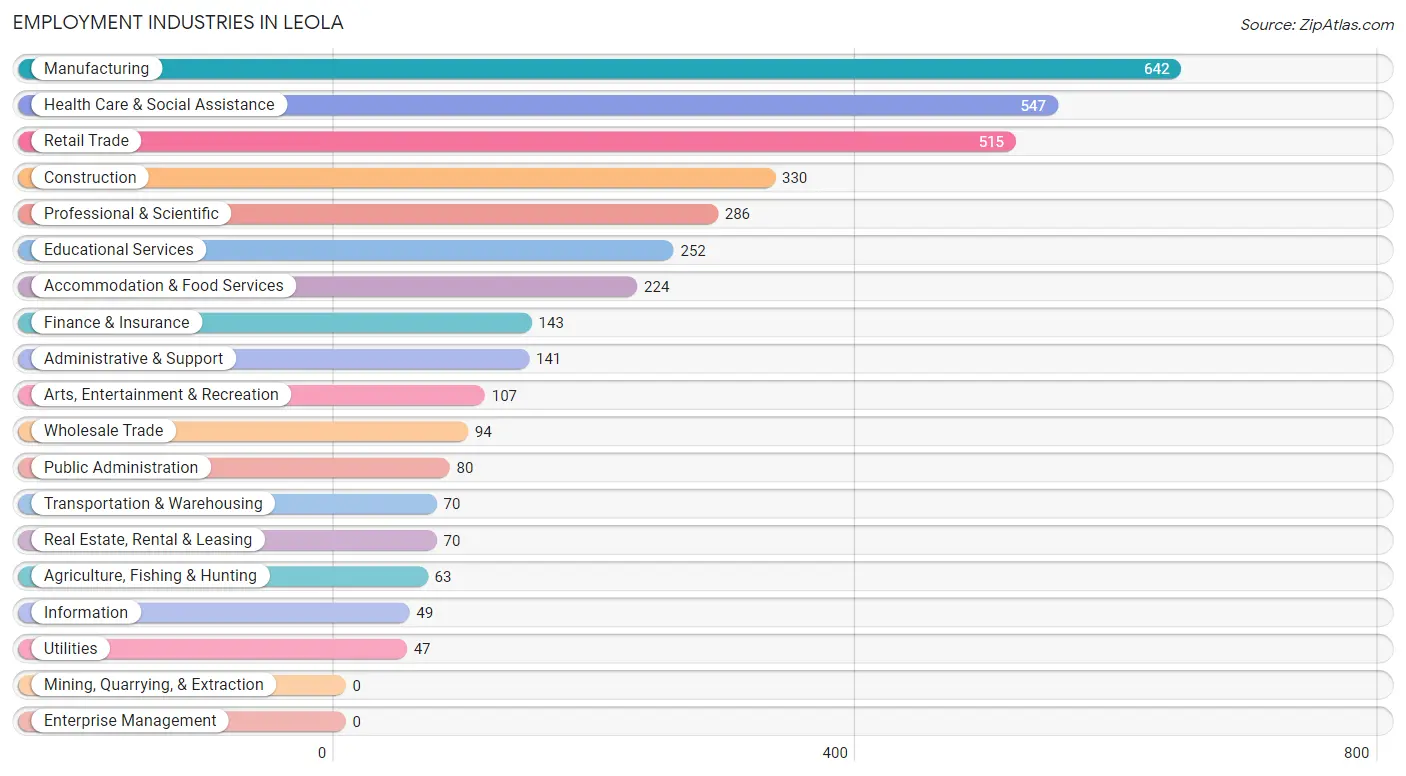
Employment Industries by Sex in Leola
The Leola industries that see more men than women are Utilities (100.0%), Construction (92.1%), and Agriculture, Fishing & Hunting (85.7%), whereas the industries that tend to have a higher number of women are Health Care & Social Assistance (83.7%), Finance & Insurance (76.9%), and Accommodation & Food Services (75.4%).
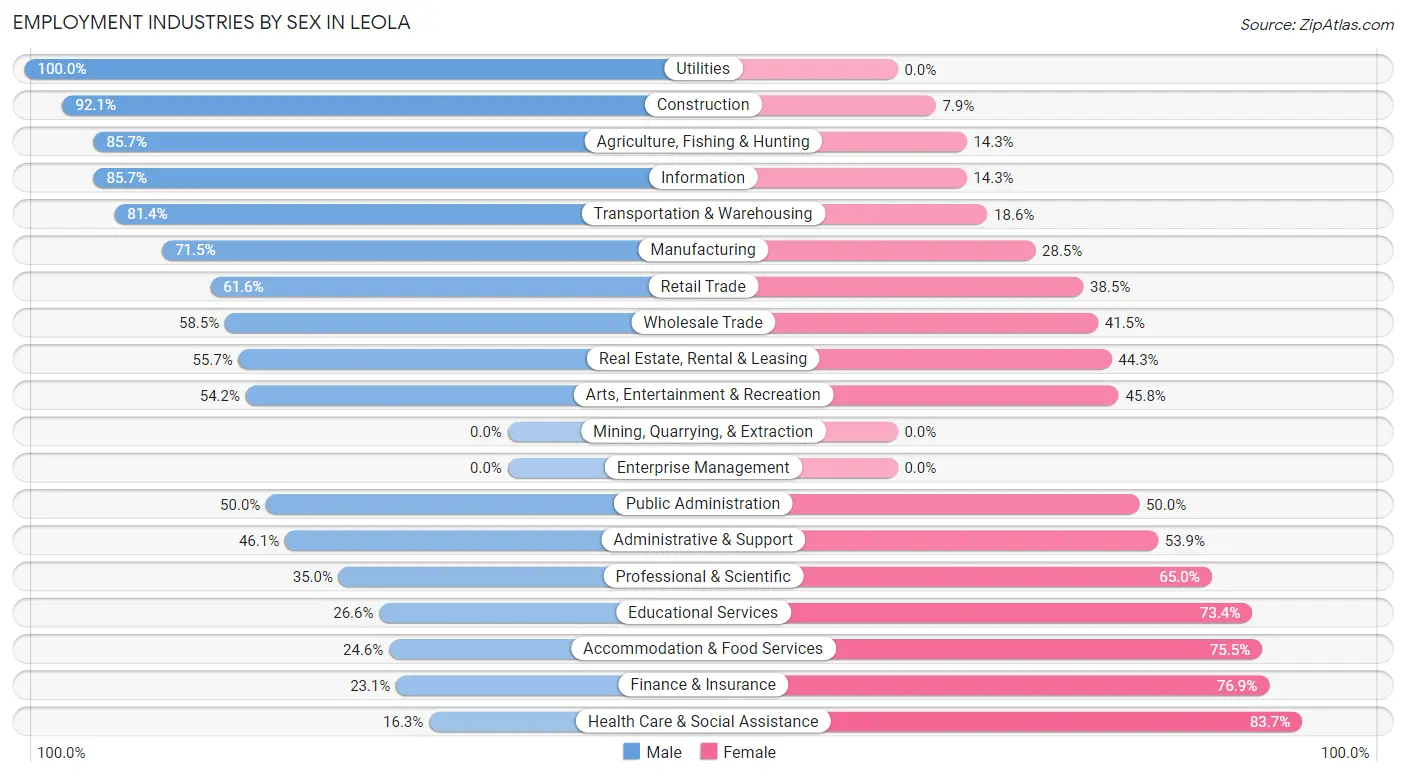
| Industry | Male | Female |
| Agriculture, Fishing & Hunting | 54 (85.7%) | 9 (14.3%) |
| Mining, Quarrying, & Extraction | 0 (0.0%) | 0 (0.0%) |
| Construction | 304 (92.1%) | 26 (7.9%) |
| Manufacturing | 459 (71.5%) | 183 (28.5%) |
| Wholesale Trade | 55 (58.5%) | 39 (41.5%) |
| Retail Trade | 317 (61.6%) | 198 (38.5%) |
| Transportation & Warehousing | 57 (81.4%) | 13 (18.6%) |
| Utilities | 47 (100.0%) | 0 (0.0%) |
| Information | 42 (85.7%) | 7 (14.3%) |
| Finance & Insurance | 33 (23.1%) | 110 (76.9%) |
| Real Estate, Rental & Leasing | 39 (55.7%) | 31 (44.3%) |
| Professional & Scientific | 100 (35.0%) | 186 (65.0%) |
| Enterprise Management | 0 (0.0%) | 0 (0.0%) |
| Administrative & Support | 65 (46.1%) | 76 (53.9%) |
| Educational Services | 67 (26.6%) | 185 (73.4%) |
| Health Care & Social Assistance | 89 (16.3%) | 458 (83.7%) |
| Arts, Entertainment & Recreation | 58 (54.2%) | 49 (45.8%) |
| Accommodation & Food Services | 55 (24.5%) | 169 (75.4%) |
| Public Administration | 40 (50.0%) | 40 (50.0%) |
| Total | 2,009 (51.9%) | 1,865 (48.1%) |
Education in Leola
School Enrollment in Leola
The most common levels of schooling among the 2,276 students in Leola are middle school (664 | 29.2%), high school (584 | 25.7%), and elementary school (530 | 23.3%).
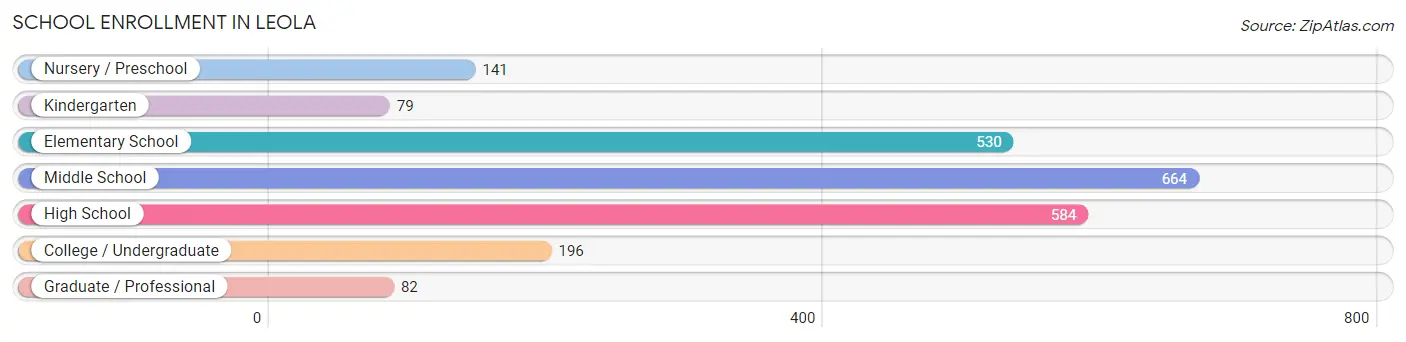
| School Level | # Students | % Students |
| Nursery / Preschool | 141 | 6.2% |
| Kindergarten | 79 | 3.5% |
| Elementary School | 530 | 23.3% |
| Middle School | 664 | 29.2% |
| High School | 584 | 25.7% |
| College / Undergraduate | 196 | 8.6% |
| Graduate / Professional | 82 | 3.6% |
| Total | 2,276 | 100.0% |
School Enrollment by Age by Funding Source in Leola
Out of a total of 2,276 students who are enrolled in schools in Leola, 480 (21.1%) attend a private institution, while the remaining 1,796 (78.9%) are enrolled in public schools. The age group of 25 to 34 year olds has the highest likelihood of being enrolled in private schools, with 97 (90.6% in the age bracket) enrolled. Conversely, the age group of 35 years and over has the lowest likelihood of being enrolled in a private school, with 65 (100.0% in the age bracket) attending a public institution.
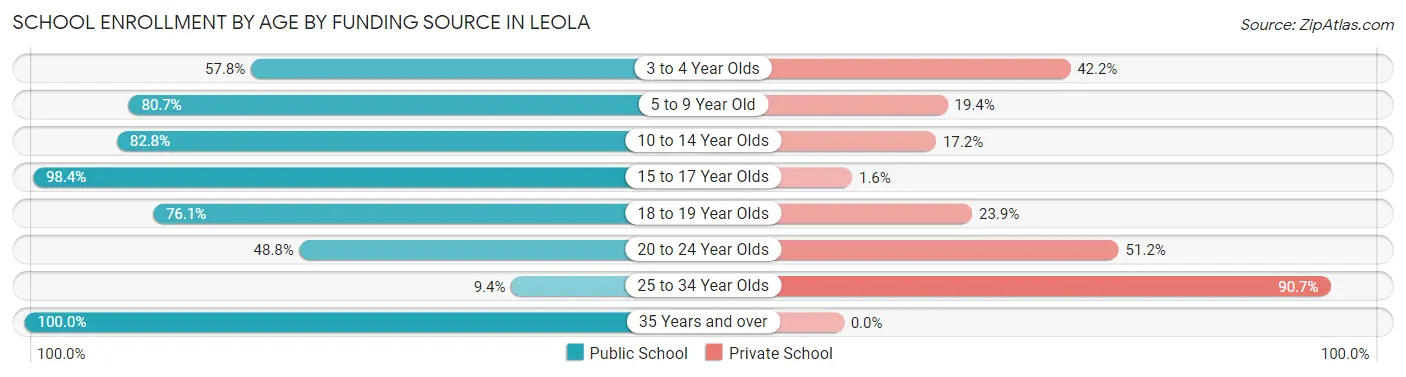
| Age Bracket | Public School | Private School |
| 3 to 4 Year Olds | 74 (57.8%) | 54 (42.2%) |
| 5 to 9 Year Old | 471 (80.6%) | 113 (19.4%) |
| 10 to 14 Year Olds | 602 (82.8%) | 125 (17.2%) |
| 15 to 17 Year Olds | 443 (98.4%) | 7 (1.6%) |
| 18 to 19 Year Olds | 70 (76.1%) | 22 (23.9%) |
| 20 to 24 Year Olds | 60 (48.8%) | 63 (51.2%) |
| 25 to 34 Year Olds | 10 (9.3%) | 97 (90.6%) |
| 35 Years and over | 65 (100.0%) | 0 (0.0%) |
| Total | 1,796 (78.9%) | 480 (21.1%) |
Educational Attainment by Field of Study in Leola
Business (240 | 13.9%), education (213 | 12.3%), science & technology (200 | 11.6%), bio, nature & agricultural (139 | 8.1%), and computers & mathematics (133 | 7.7%) are the most common fields of study among 1,724 individuals in Leola who have obtained a bachelor's degree or higher.
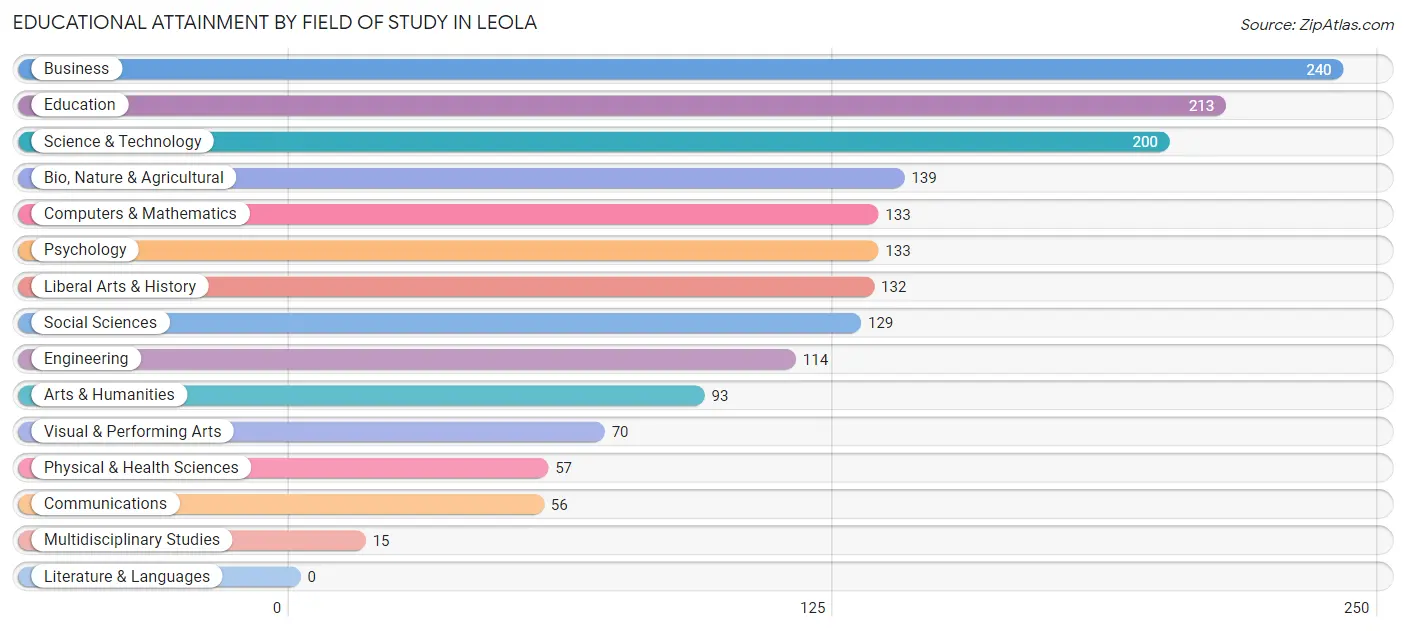
| Field of Study | # Graduates | % Graduates |
| Computers & Mathematics | 133 | 7.7% |
| Bio, Nature & Agricultural | 139 | 8.1% |
| Physical & Health Sciences | 57 | 3.3% |
| Psychology | 133 | 7.7% |
| Social Sciences | 129 | 7.5% |
| Engineering | 114 | 6.6% |
| Multidisciplinary Studies | 15 | 0.9% |
| Science & Technology | 200 | 11.6% |
| Business | 240 | 13.9% |
| Education | 213 | 12.3% |
| Literature & Languages | 0 | 0.0% |
| Liberal Arts & History | 132 | 7.7% |
| Visual & Performing Arts | 70 | 4.1% |
| Communications | 56 | 3.3% |
| Arts & Humanities | 93 | 5.4% |
| Total | 1,724 | 100.0% |
Transportation & Commute in Leola
Vehicle Availability by Sex in Leola
The most prevalent vehicle ownership categories in Leola are males with 2 vehicles (970, accounting for 49.4%) and females with 2 vehicles (816, making up 53.3%).
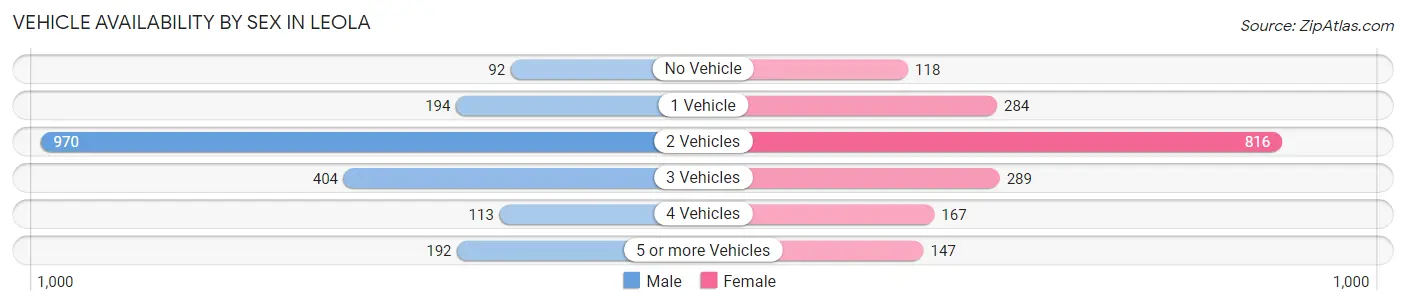
| Vehicles Available | Male | Female |
| No Vehicle | 92 (4.7%) | 118 (6.5%) |
| 1 Vehicle | 194 (9.9%) | 284 (15.6%) |
| 2 Vehicles | 970 (49.4%) | 816 (44.8%) |
| 3 Vehicles | 404 (20.6%) | 289 (15.9%) |
| 4 Vehicles | 113 (5.8%) | 167 (9.2%) |
| 5 or more Vehicles | 192 (9.8%) | 147 (8.1%) |
| Total | 1,965 (100.0%) | 1,821 (100.0%) |
Commute Time in Leola
The most frequently occuring commute durations in Leola are 20 to 24 minutes (595 commuters, 17.3%), 10 to 14 minutes (590 commuters, 17.2%), and 15 to 19 minutes (546 commuters, 15.9%).
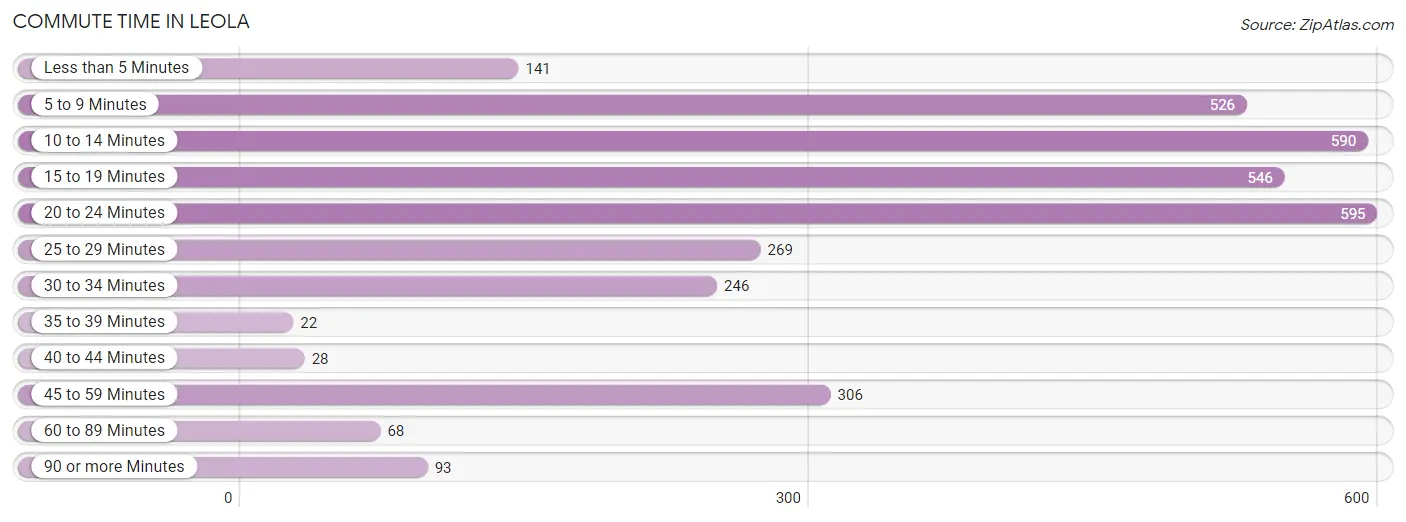
| Commute Time | # Commuters | % Commuters |
| Less than 5 Minutes | 141 | 4.1% |
| 5 to 9 Minutes | 526 | 15.3% |
| 10 to 14 Minutes | 590 | 17.2% |
| 15 to 19 Minutes | 546 | 15.9% |
| 20 to 24 Minutes | 595 | 17.3% |
| 25 to 29 Minutes | 269 | 7.8% |
| 30 to 34 Minutes | 246 | 7.2% |
| 35 to 39 Minutes | 22 | 0.6% |
| 40 to 44 Minutes | 28 | 0.8% |
| 45 to 59 Minutes | 306 | 8.9% |
| 60 to 89 Minutes | 68 | 2.0% |
| 90 or more Minutes | 93 | 2.7% |
Commute Time by Sex in Leola
The most common commute times in Leola are 10 to 14 minutes (355 commuters, 18.7%) for males and 20 to 24 minutes (297 commuters, 19.4%) for females.
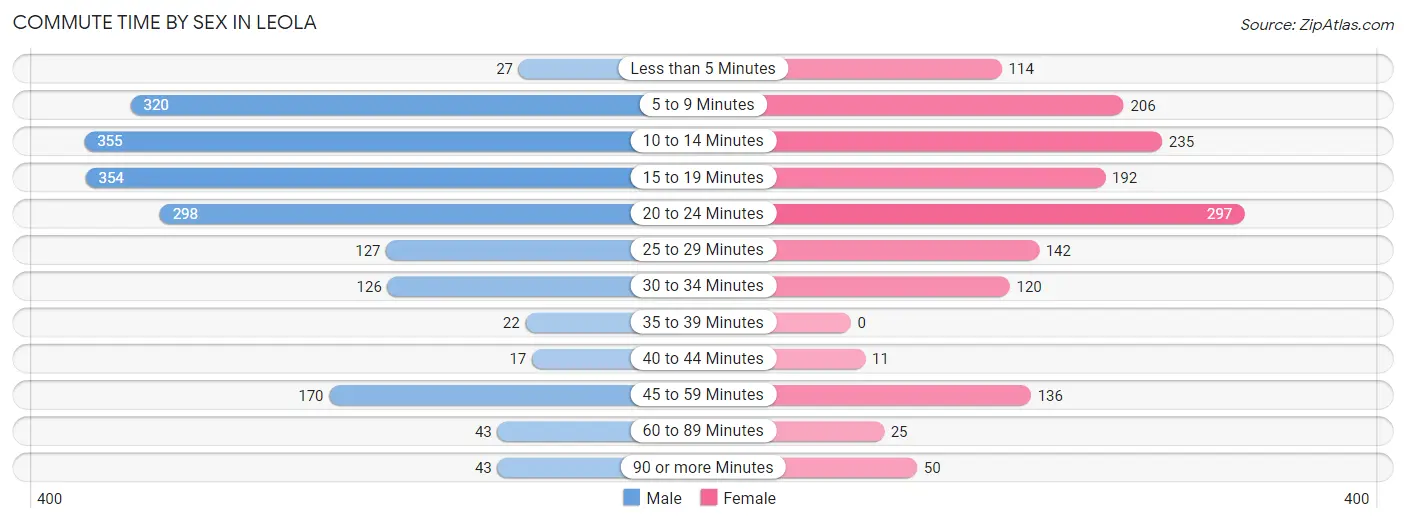
| Commute Time | Male | Female |
| Less than 5 Minutes | 27 (1.4%) | 114 (7.5%) |
| 5 to 9 Minutes | 320 (16.8%) | 206 (13.5%) |
| 10 to 14 Minutes | 355 (18.7%) | 235 (15.4%) |
| 15 to 19 Minutes | 354 (18.6%) | 192 (12.6%) |
| 20 to 24 Minutes | 298 (15.7%) | 297 (19.4%) |
| 25 to 29 Minutes | 127 (6.7%) | 142 (9.3%) |
| 30 to 34 Minutes | 126 (6.6%) | 120 (7.9%) |
| 35 to 39 Minutes | 22 (1.2%) | 0 (0.0%) |
| 40 to 44 Minutes | 17 (0.9%) | 11 (0.7%) |
| 45 to 59 Minutes | 170 (8.9%) | 136 (8.9%) |
| 60 to 89 Minutes | 43 (2.3%) | 25 (1.6%) |
| 90 or more Minutes | 43 (2.3%) | 50 (3.3%) |
Time of Departure to Work by Sex in Leola
The most frequent times of departure to work in Leola are 5:30 AM to 5:59 AM (283, 14.9%) for males and 8:00 AM to 8:29 AM (246, 16.1%) for females.
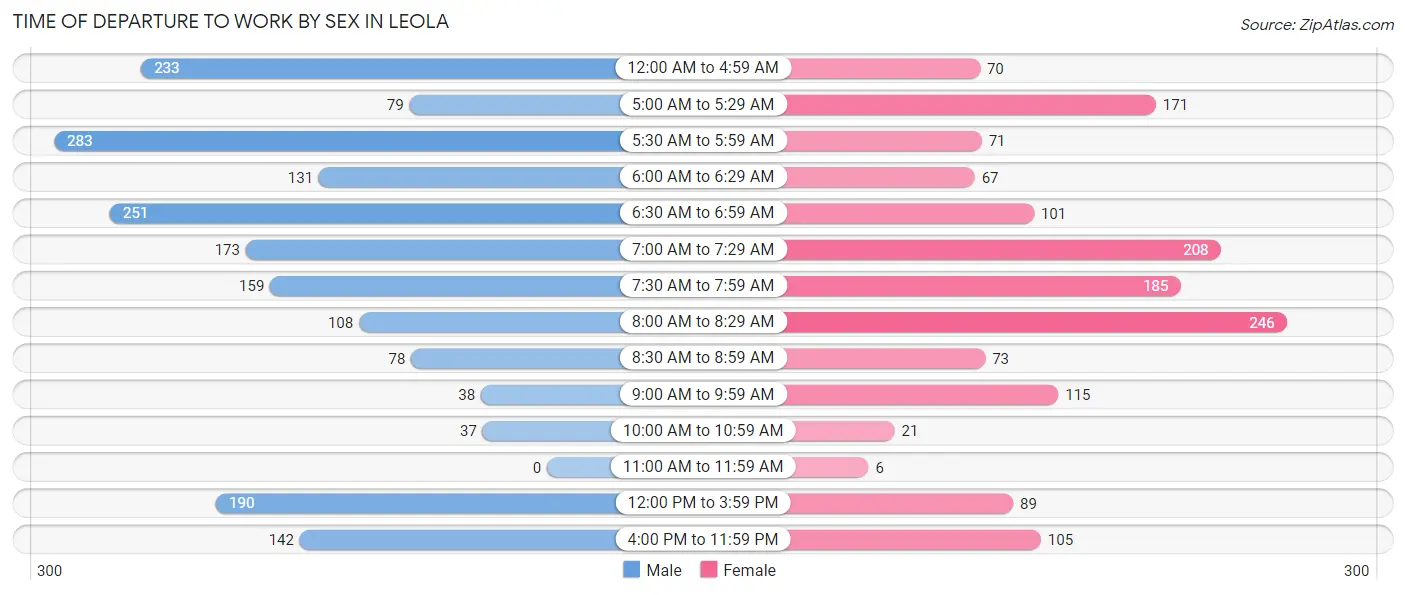
| Time of Departure | Male | Female |
| 12:00 AM to 4:59 AM | 233 (12.2%) | 70 (4.6%) |
| 5:00 AM to 5:29 AM | 79 (4.2%) | 171 (11.2%) |
| 5:30 AM to 5:59 AM | 283 (14.9%) | 71 (4.6%) |
| 6:00 AM to 6:29 AM | 131 (6.9%) | 67 (4.4%) |
| 6:30 AM to 6:59 AM | 251 (13.2%) | 101 (6.6%) |
| 7:00 AM to 7:29 AM | 173 (9.1%) | 208 (13.6%) |
| 7:30 AM to 7:59 AM | 159 (8.4%) | 185 (12.1%) |
| 8:00 AM to 8:29 AM | 108 (5.7%) | 246 (16.1%) |
| 8:30 AM to 8:59 AM | 78 (4.1%) | 73 (4.8%) |
| 9:00 AM to 9:59 AM | 38 (2.0%) | 115 (7.5%) |
| 10:00 AM to 10:59 AM | 37 (1.9%) | 21 (1.4%) |
| 11:00 AM to 11:59 AM | 0 (0.0%) | 6 (0.4%) |
| 12:00 PM to 3:59 PM | 190 (10.0%) | 89 (5.8%) |
| 4:00 PM to 11:59 PM | 142 (7.5%) | 105 (6.9%) |
| Total | 1,902 (100.0%) | 1,528 (100.0%) |
Housing Occupancy in Leola
Occupancy by Ownership in Leola
Of the total 2,747 dwellings in Leola, owner-occupied units account for 1,591 (57.9%), while renter-occupied units make up 1,156 (42.1%).
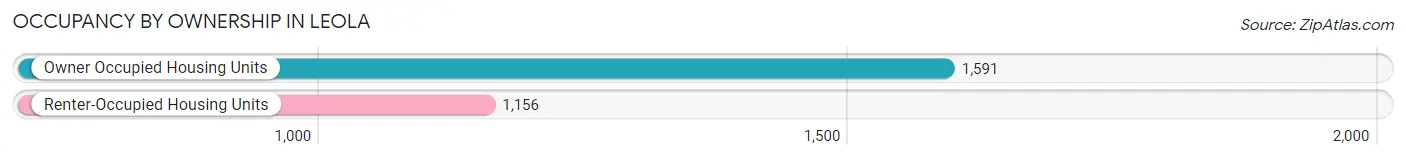
| Occupancy | # Housing Units | % Housing Units |
| Owner Occupied Housing Units | 1,591 | 57.9% |
| Renter-Occupied Housing Units | 1,156 | 42.1% |
| Total Occupied Housing Units | 2,747 | 100.0% |
Occupancy by Household Size in Leola
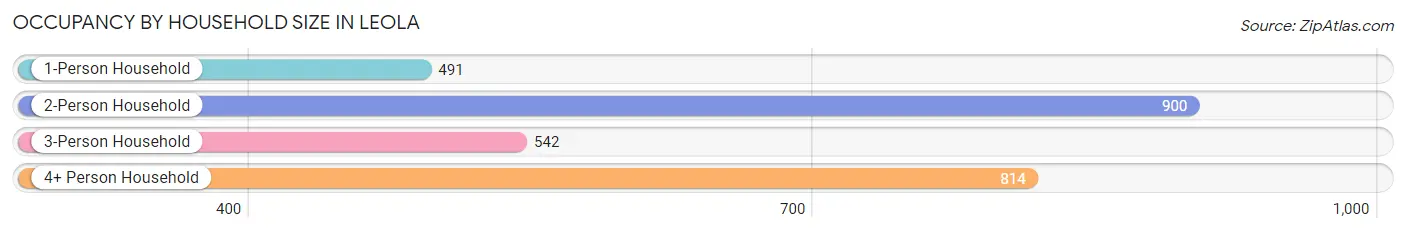
| Household Size | # Housing Units | % Housing Units |
| 1-Person Household | 491 | 17.9% |
| 2-Person Household | 900 | 32.8% |
| 3-Person Household | 542 | 19.7% |
| 4+ Person Household | 814 | 29.6% |
| Total Housing Units | 2,747 | 100.0% |
Occupancy by Ownership by Household Size in Leola
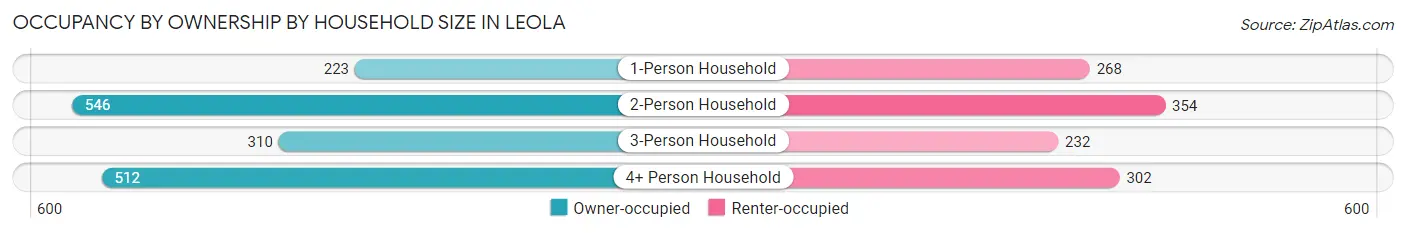
| Household Size | Owner-occupied | Renter-occupied |
| 1-Person Household | 223 (45.4%) | 268 (54.6%) |
| 2-Person Household | 546 (60.7%) | 354 (39.3%) |
| 3-Person Household | 310 (57.2%) | 232 (42.8%) |
| 4+ Person Household | 512 (62.9%) | 302 (37.1%) |
| Total Housing Units | 1,591 (57.9%) | 1,156 (42.1%) |
Occupancy by Educational Attainment in Leola
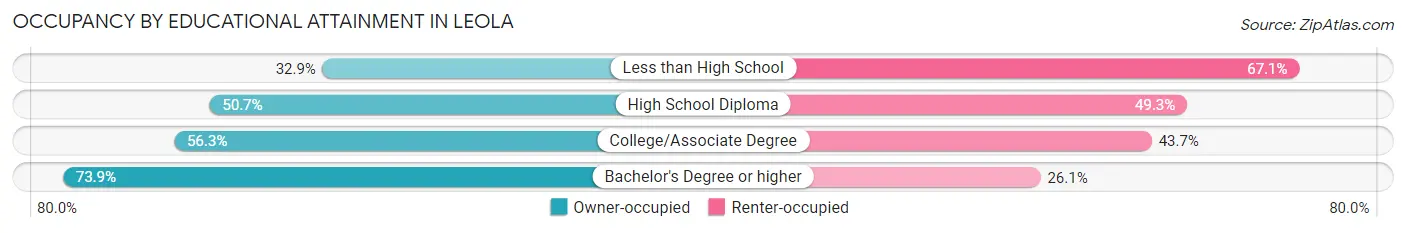
| Household Size | Owner-occupied | Renter-occupied |
| Less than High School | 97 (32.9%) | 198 (67.1%) |
| High School Diploma | 442 (50.7%) | 430 (49.3%) |
| College/Associate Degree | 371 (56.3%) | 288 (43.7%) |
| Bachelor's Degree or higher | 681 (73.9%) | 240 (26.1%) |
Occupancy by Age of Householder in Leola
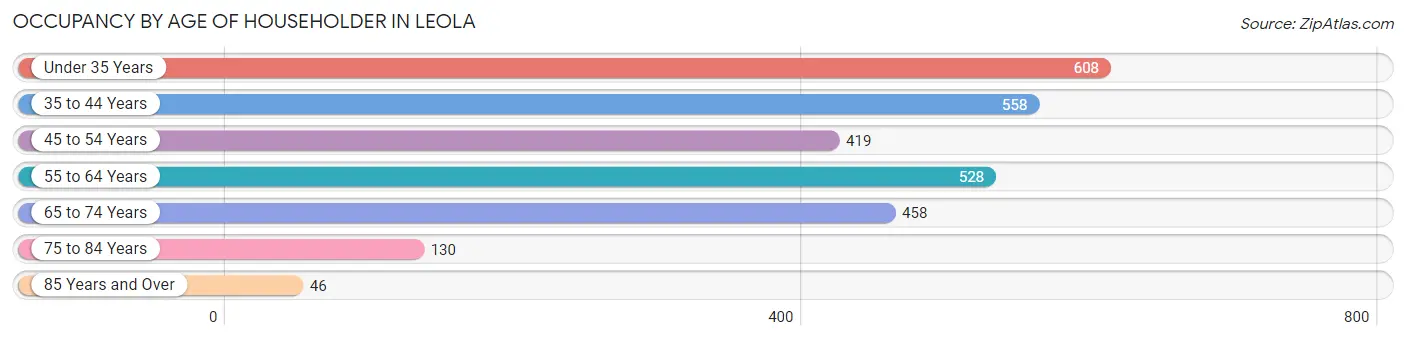
| Age Bracket | # Households | % Households |
| Under 35 Years | 608 | 22.1% |
| 35 to 44 Years | 558 | 20.3% |
| 45 to 54 Years | 419 | 15.2% |
| 55 to 64 Years | 528 | 19.2% |
| 65 to 74 Years | 458 | 16.7% |
| 75 to 84 Years | 130 | 4.7% |
| 85 Years and Over | 46 | 1.7% |
| Total | 2,747 | 100.0% |
Housing Finances in Leola
Median Income by Occupancy in Leola
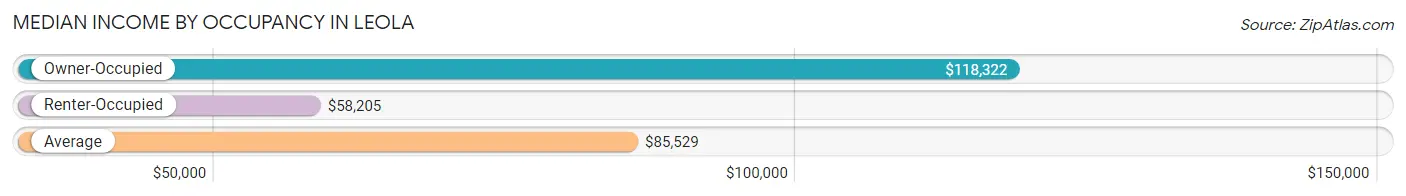
| Occupancy Type | # Households | Median Income |
| Owner-Occupied | 1,591 (57.9%) | $118,322 |
| Renter-Occupied | 1,156 (42.1%) | $58,205 |
| Average | 2,747 (100.0%) | $85,529 |
Occupancy by Householder Income Bracket in Leola
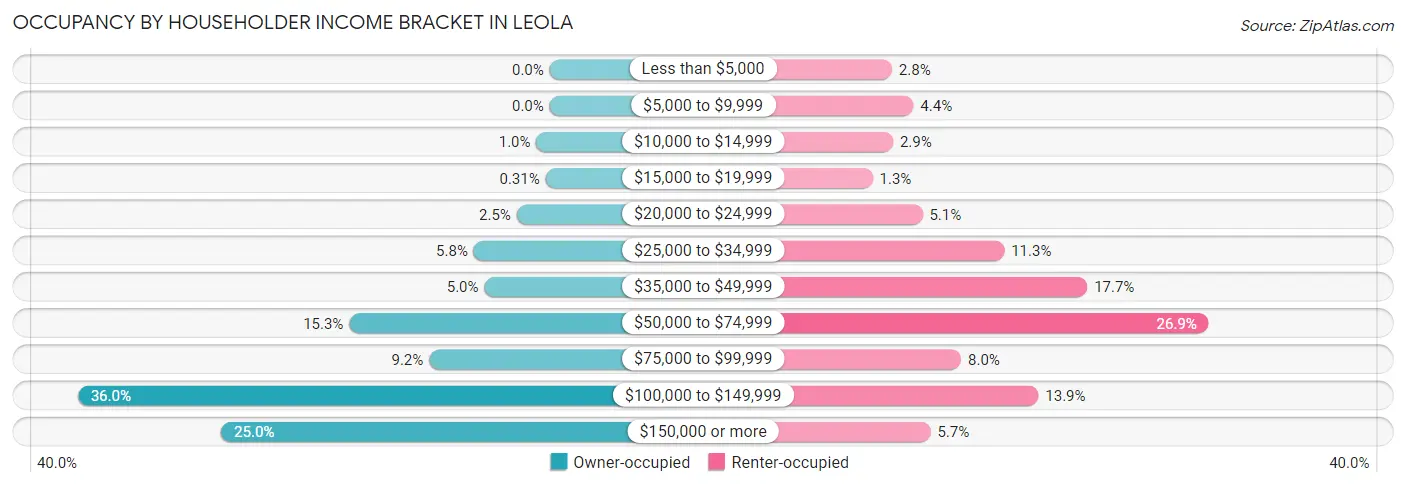
| Income Bracket | Owner-occupied | Renter-occupied |
| Less than $5,000 | 0 (0.0%) | 32 (2.8%) |
| $5,000 to $9,999 | 0 (0.0%) | 51 (4.4%) |
| $10,000 to $14,999 | 16 (1.0%) | 33 (2.9%) |
| $15,000 to $19,999 | 5 (0.3%) | 15 (1.3%) |
| $20,000 to $24,999 | 40 (2.5%) | 59 (5.1%) |
| $25,000 to $34,999 | 92 (5.8%) | 131 (11.3%) |
| $35,000 to $49,999 | 79 (5.0%) | 204 (17.6%) |
| $50,000 to $74,999 | 243 (15.3%) | 311 (26.9%) |
| $75,000 to $99,999 | 146 (9.2%) | 93 (8.0%) |
| $100,000 to $149,999 | 572 (35.9%) | 161 (13.9%) |
| $150,000 or more | 398 (25.0%) | 66 (5.7%) |
| Total | 1,591 (100.0%) | 1,156 (100.0%) |
Monthly Housing Cost Tiers in Leola
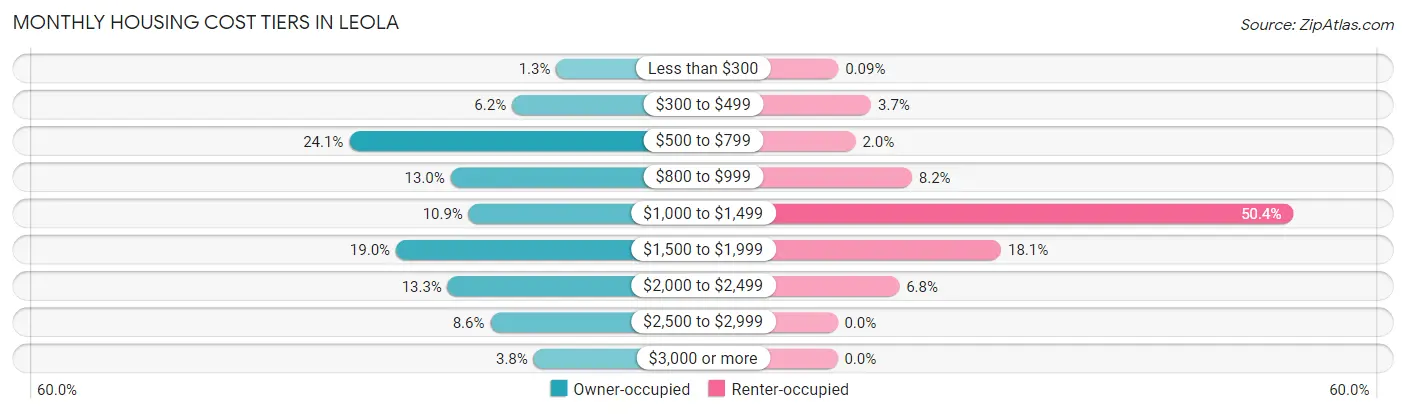
| Monthly Cost | Owner-occupied | Renter-occupied |
| Less than $300 | 20 (1.3%) | 1 (0.1%) |
| $300 to $499 | 98 (6.2%) | 43 (3.7%) |
| $500 to $799 | 384 (24.1%) | 23 (2.0%) |
| $800 to $999 | 206 (13.0%) | 95 (8.2%) |
| $1,000 to $1,499 | 174 (10.9%) | 582 (50.3%) |
| $1,500 to $1,999 | 302 (19.0%) | 209 (18.1%) |
| $2,000 to $2,499 | 211 (13.3%) | 79 (6.8%) |
| $2,500 to $2,999 | 136 (8.6%) | 0 (0.0%) |
| $3,000 or more | 60 (3.8%) | 0 (0.0%) |
| Total | 1,591 (100.0%) | 1,156 (100.0%) |
Physical Housing Characteristics in Leola
Housing Structures in Leola
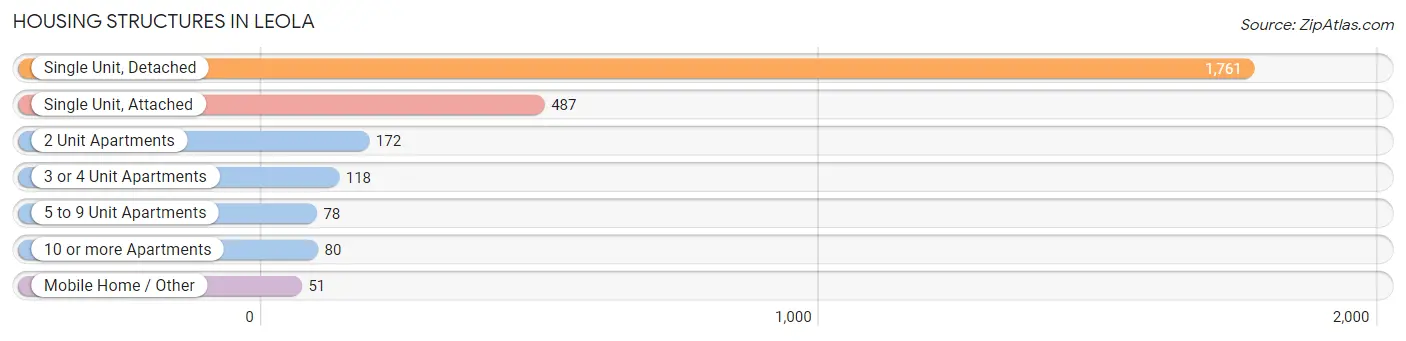
| Structure Type | # Housing Units | % Housing Units |
| Single Unit, Detached | 1,761 | 64.1% |
| Single Unit, Attached | 487 | 17.7% |
| 2 Unit Apartments | 172 | 6.3% |
| 3 or 4 Unit Apartments | 118 | 4.3% |
| 5 to 9 Unit Apartments | 78 | 2.8% |
| 10 or more Apartments | 80 | 2.9% |
| Mobile Home / Other | 51 | 1.9% |
| Total | 2,747 | 100.0% |
Housing Structures by Occupancy in Leola
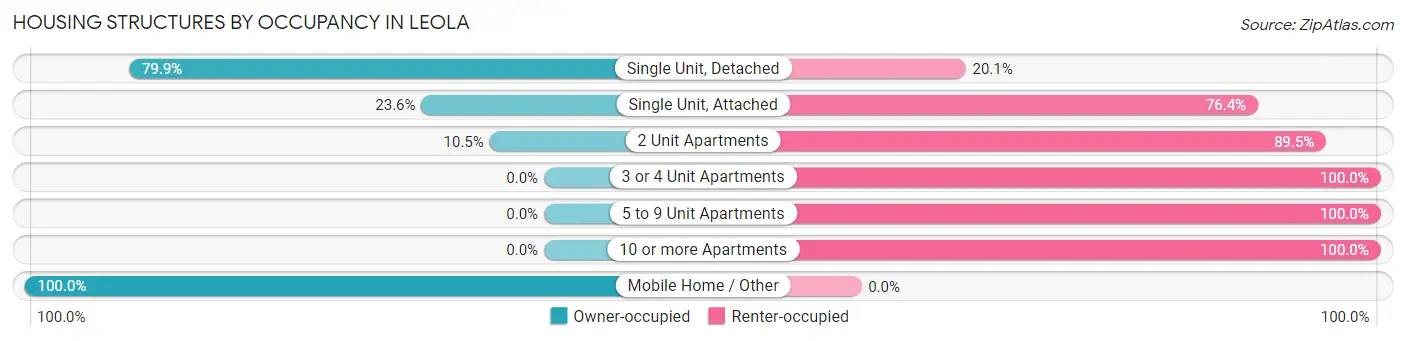
| Structure Type | Owner-occupied | Renter-occupied |
| Single Unit, Detached | 1,407 (79.9%) | 354 (20.1%) |
| Single Unit, Attached | 115 (23.6%) | 372 (76.4%) |
| 2 Unit Apartments | 18 (10.5%) | 154 (89.5%) |
| 3 or 4 Unit Apartments | 0 (0.0%) | 118 (100.0%) |
| 5 to 9 Unit Apartments | 0 (0.0%) | 78 (100.0%) |
| 10 or more Apartments | 0 (0.0%) | 80 (100.0%) |
| Mobile Home / Other | 51 (100.0%) | 0 (0.0%) |
| Total | 1,591 (57.9%) | 1,156 (42.1%) |
Housing Structures by Number of Rooms in Leola
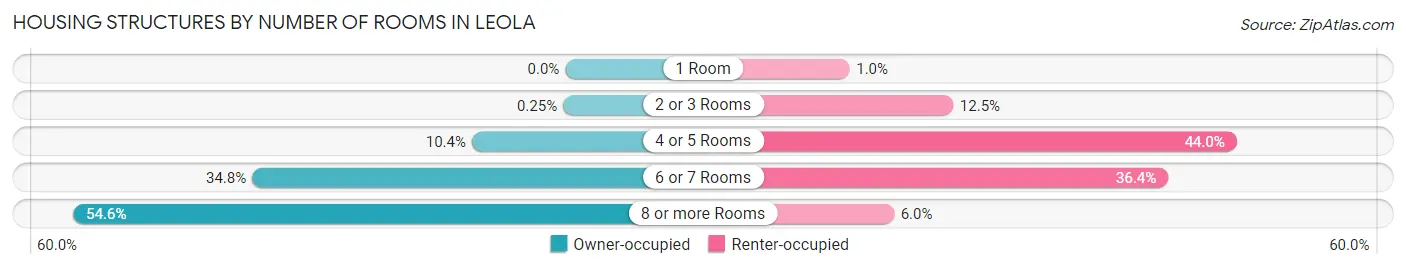
| Number of Rooms | Owner-occupied | Renter-occupied |
| 1 Room | 0 (0.0%) | 12 (1.0%) |
| 2 or 3 Rooms | 4 (0.3%) | 145 (12.5%) |
| 4 or 5 Rooms | 165 (10.4%) | 509 (44.0%) |
| 6 or 7 Rooms | 553 (34.8%) | 421 (36.4%) |
| 8 or more Rooms | 869 (54.6%) | 69 (6.0%) |
| Total | 1,591 (100.0%) | 1,156 (100.0%) |
Housing Structure by Heating Type in Leola
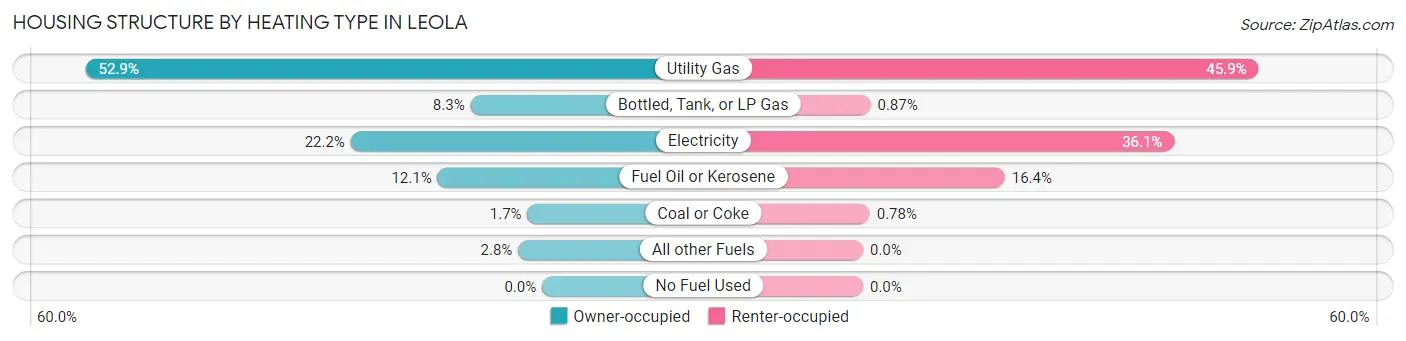
| Heating Type | Owner-occupied | Renter-occupied |
| Utility Gas | 842 (52.9%) | 530 (45.9%) |
| Bottled, Tank, or LP Gas | 132 (8.3%) | 10 (0.9%) |
| Electricity | 353 (22.2%) | 417 (36.1%) |
| Fuel Oil or Kerosene | 193 (12.1%) | 190 (16.4%) |
| Coal or Coke | 27 (1.7%) | 9 (0.8%) |
| All other Fuels | 44 (2.8%) | 0 (0.0%) |
| No Fuel Used | 0 (0.0%) | 0 (0.0%) |
| Total | 1,591 (100.0%) | 1,156 (100.0%) |
Household Vehicle Usage in Leola
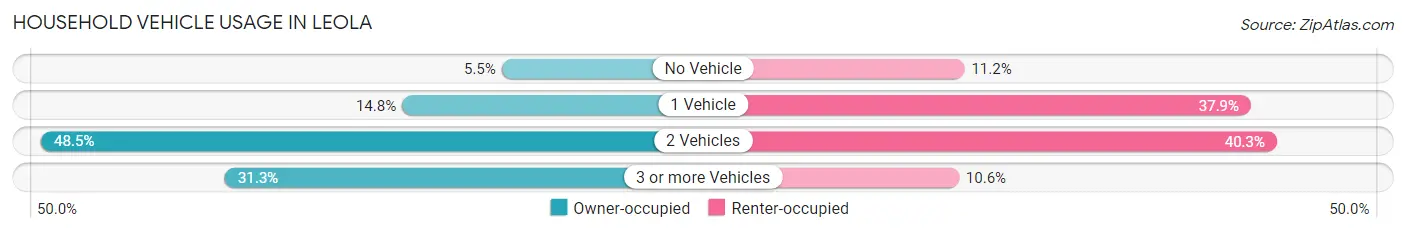
| Vehicles per Household | Owner-occupied | Renter-occupied |
| No Vehicle | 87 (5.5%) | 129 (11.2%) |
| 1 Vehicle | 235 (14.8%) | 438 (37.9%) |
| 2 Vehicles | 771 (48.5%) | 466 (40.3%) |
| 3 or more Vehicles | 498 (31.3%) | 123 (10.6%) |
| Total | 1,591 (100.0%) | 1,156 (100.0%) |
Real Estate & Mortgages in Leola
Real Estate and Mortgage Overview in Leola
| Characteristic | Without Mortgage | With Mortgage |
| Housing Units | 692 | 899 |
| Median Property Value | $283,500 | $279,900 |
| Median Household Income | $99,500 | $281 |
| Monthly Housing Costs | $690 | $60 |
| Real Estate Taxes | $3,787 | $30 |
Property Value by Mortgage Status in Leola
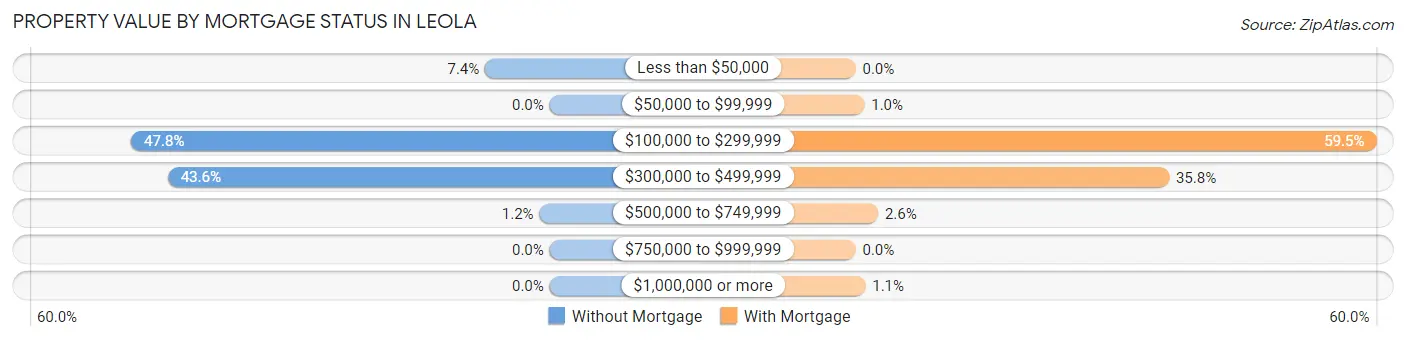
| Property Value | Without Mortgage | With Mortgage |
| Less than $50,000 | 51 (7.4%) | 0 (0.0%) |
| $50,000 to $99,999 | 0 (0.0%) | 9 (1.0%) |
| $100,000 to $299,999 | 331 (47.8%) | 535 (59.5%) |
| $300,000 to $499,999 | 302 (43.6%) | 322 (35.8%) |
| $500,000 to $749,999 | 8 (1.2%) | 23 (2.6%) |
| $750,000 to $999,999 | 0 (0.0%) | 0 (0.0%) |
| $1,000,000 or more | 0 (0.0%) | 10 (1.1%) |
| Total | 692 (100.0%) | 899 (100.0%) |
Household Income by Mortgage Status in Leola
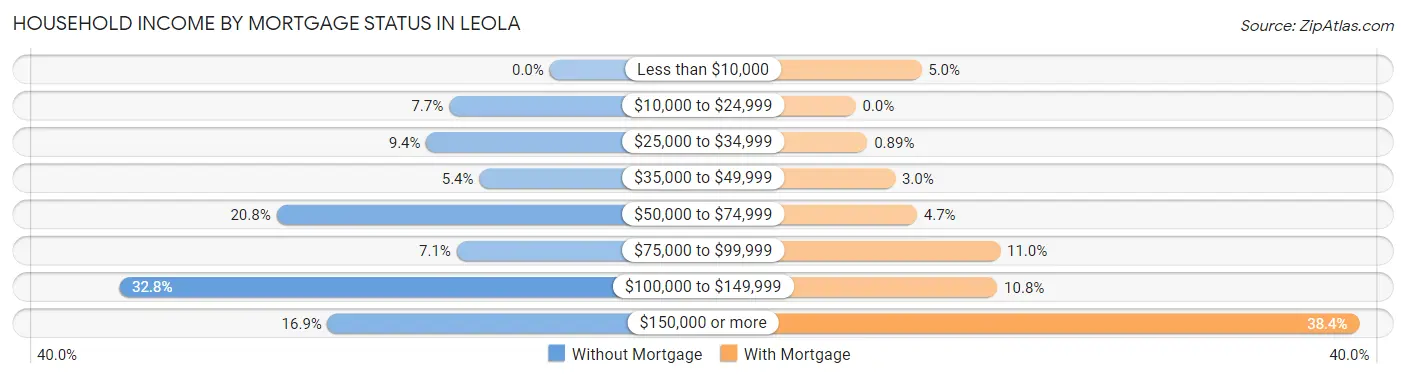
| Household Income | Without Mortgage | With Mortgage |
| Less than $10,000 | 0 (0.0%) | 45 (5.0%) |
| $10,000 to $24,999 | 53 (7.7%) | 0 (0.0%) |
| $25,000 to $34,999 | 65 (9.4%) | 8 (0.9%) |
| $35,000 to $49,999 | 37 (5.3%) | 27 (3.0%) |
| $50,000 to $74,999 | 144 (20.8%) | 42 (4.7%) |
| $75,000 to $99,999 | 49 (7.1%) | 99 (11.0%) |
| $100,000 to $149,999 | 227 (32.8%) | 97 (10.8%) |
| $150,000 or more | 117 (16.9%) | 345 (38.4%) |
| Total | 692 (100.0%) | 899 (100.0%) |
Property Value to Household Income Ratio in Leola
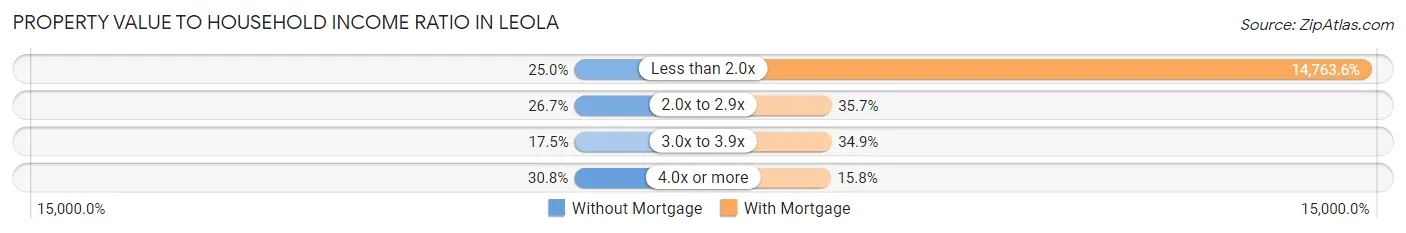
| Value-to-Income Ratio | Without Mortgage | With Mortgage |
| Less than 2.0x | 173 (25.0%) | 132,725 (14,763.6%) |
| 2.0x to 2.9x | 185 (26.7%) | 321 (35.7%) |
| 3.0x to 3.9x | 121 (17.5%) | 314 (34.9%) |
| 4.0x or more | 213 (30.8%) | 142 (15.8%) |
| Total | 692 (100.0%) | 899 (100.0%) |
Real Estate Taxes by Mortgage Status in Leola
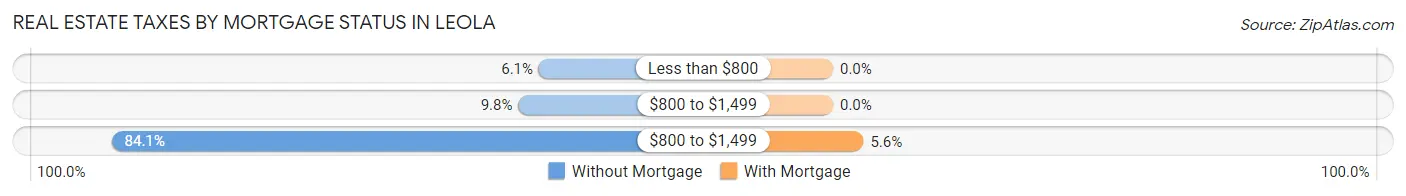
| Property Taxes | Without Mortgage | With Mortgage |
| Less than $800 | 42 (6.1%) | 0 (0.0%) |
| $800 to $1,499 | 68 (9.8%) | 0 (0.0%) |
| $800 to $1,499 | 582 (84.1%) | 50 (5.6%) |
| Total | 692 (100.0%) | 899 (100.0%) |
Health & Disability in Leola
Health Insurance Coverage by Age in Leola
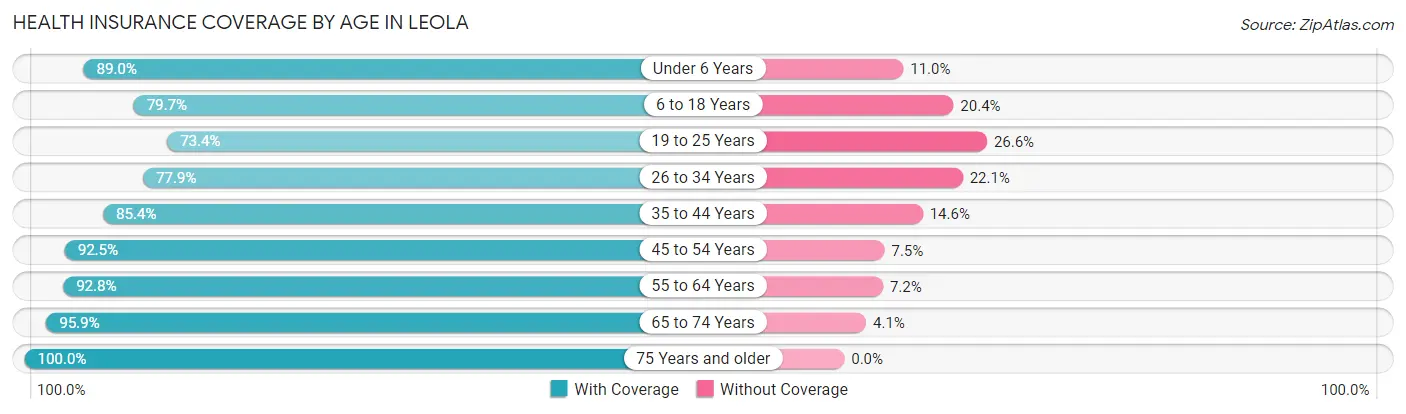
| Age Bracket | With Coverage | Without Coverage |
| Under 6 Years | 534 (89.0%) | 66 (11.0%) |
| 6 to 18 Years | 1,472 (79.6%) | 376 (20.3%) |
| 19 to 25 Years | 436 (73.4%) | 158 (26.6%) |
| 26 to 34 Years | 720 (77.9%) | 204 (22.1%) |
| 35 to 44 Years | 893 (85.4%) | 153 (14.6%) |
| 45 to 54 Years | 851 (92.5%) | 69 (7.5%) |
| 55 to 64 Years | 939 (92.8%) | 73 (7.2%) |
| 65 to 74 Years | 686 (95.9%) | 29 (4.1%) |
| 75 Years and older | 286 (100.0%) | 0 (0.0%) |
| Total | 6,817 (85.8%) | 1,128 (14.2%) |
Health Insurance Coverage by Citizenship Status in Leola
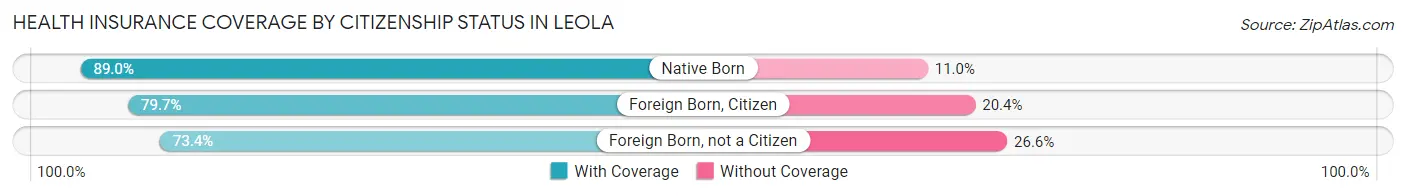
| Citizenship Status | With Coverage | Without Coverage |
| Native Born | 534 (89.0%) | 66 (11.0%) |
| Foreign Born, Citizen | 1,472 (79.6%) | 376 (20.3%) |
| Foreign Born, not a Citizen | 436 (73.4%) | 158 (26.6%) |
Health Insurance Coverage by Household Income in Leola
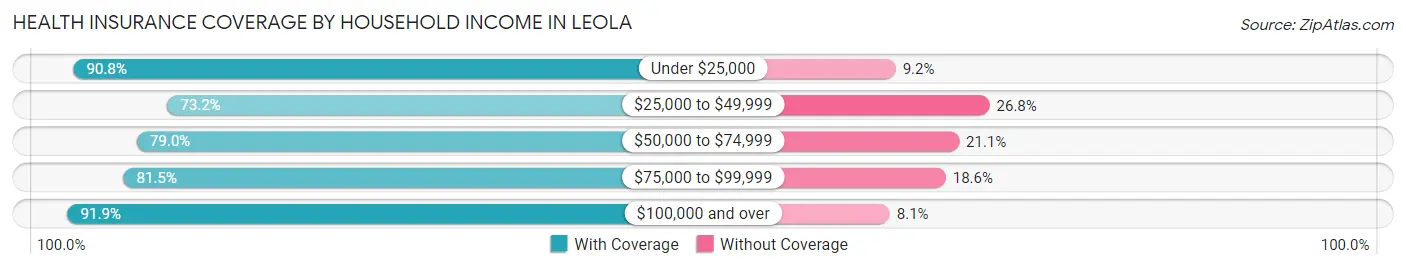
| Household Income | With Coverage | Without Coverage |
| Under $25,000 | 525 (90.8%) | 53 (9.2%) |
| $25,000 to $49,999 | 895 (73.2%) | 327 (26.8%) |
| $50,000 to $74,999 | 1,069 (78.9%) | 285 (21.0%) |
| $75,000 to $99,999 | 597 (81.5%) | 136 (18.5%) |
| $100,000 and over | 3,726 (91.9%) | 327 (8.1%) |
Public vs Private Health Insurance Coverage by Age in Leola
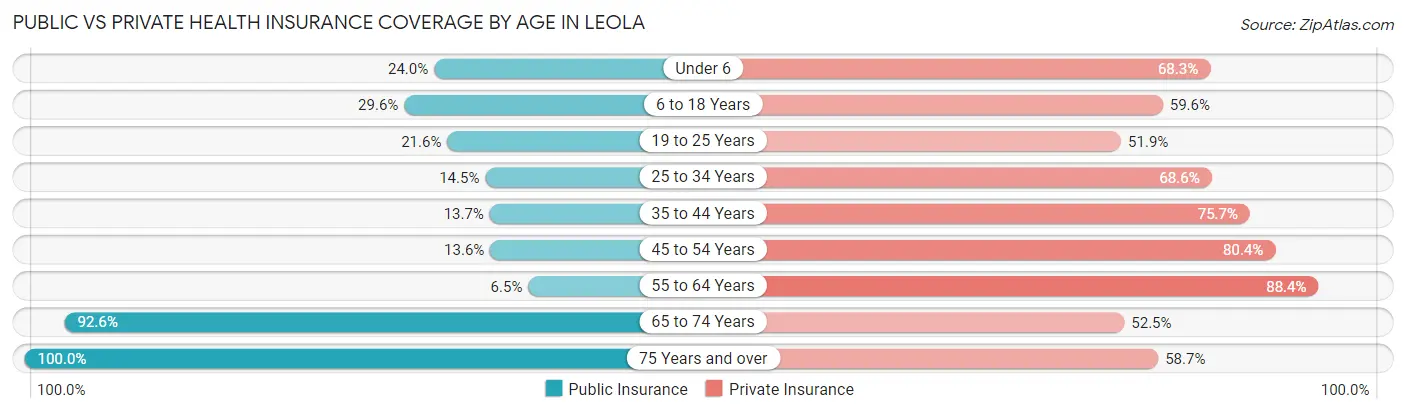
| Age Bracket | Public Insurance | Private Insurance |
| Under 6 | 144 (24.0%) | 410 (68.3%) |
| 6 to 18 Years | 546 (29.5%) | 1,101 (59.6%) |
| 19 to 25 Years | 128 (21.5%) | 308 (51.8%) |
| 25 to 34 Years | 134 (14.5%) | 634 (68.6%) |
| 35 to 44 Years | 143 (13.7%) | 792 (75.7%) |
| 45 to 54 Years | 125 (13.6%) | 740 (80.4%) |
| 55 to 64 Years | 66 (6.5%) | 895 (88.4%) |
| 65 to 74 Years | 662 (92.6%) | 375 (52.4%) |
| 75 Years and over | 286 (100.0%) | 168 (58.7%) |
| Total | 2,234 (28.1%) | 5,423 (68.3%) |
Disability Status by Sex by Age in Leola
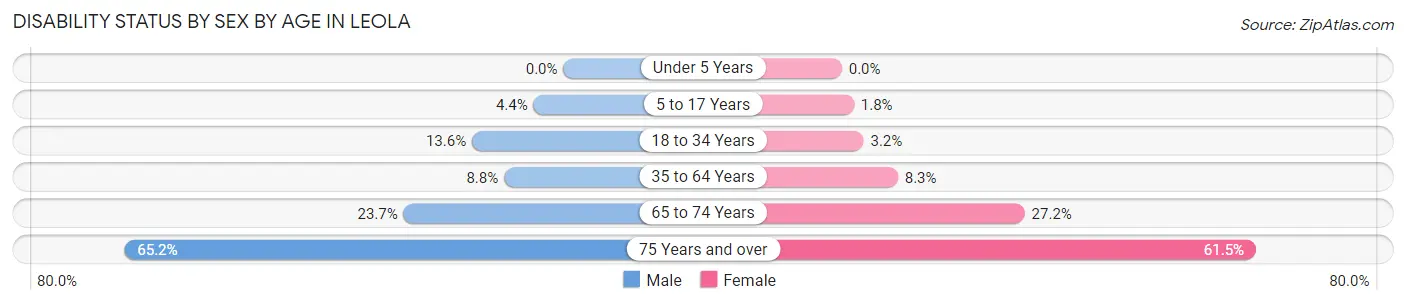
| Age Bracket | Male | Female |
| Under 5 Years | 0 (0.0%) | 0 (0.0%) |
| 5 to 17 Years | 47 (4.4%) | 14 (1.8%) |
| 18 to 34 Years | 105 (13.6%) | 27 (3.2%) |
| 35 to 64 Years | 132 (8.8%) | 123 (8.3%) |
| 65 to 74 Years | 84 (23.7%) | 98 (27.2%) |
| 75 Years and over | 73 (65.2%) | 107 (61.5%) |
Disability Class by Sex by Age in Leola
Disability Class: Hearing Difficulty
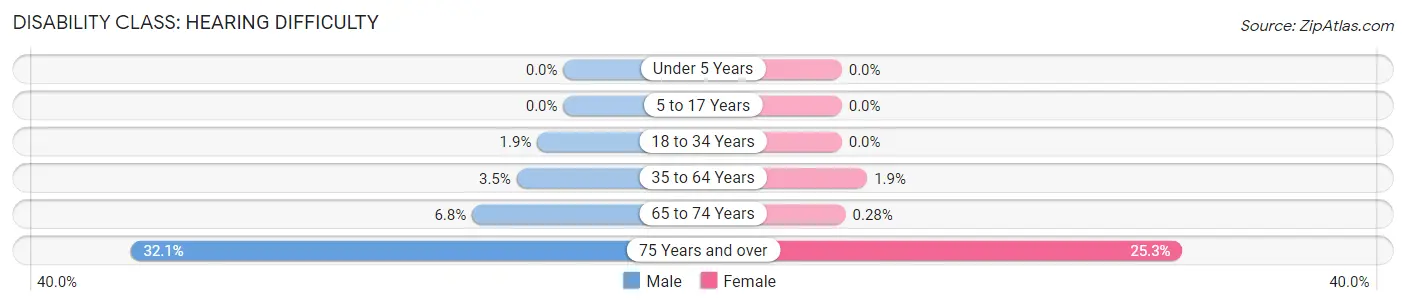
| Age Bracket | Male | Female |
| Under 5 Years | 0 (0.0%) | 0 (0.0%) |
| 5 to 17 Years | 0 (0.0%) | 0 (0.0%) |
| 18 to 34 Years | 15 (1.9%) | 0 (0.0%) |
| 35 to 64 Years | 52 (3.5%) | 28 (1.9%) |
| 65 to 74 Years | 24 (6.8%) | 1 (0.3%) |
| 75 Years and over | 36 (32.1%) | 44 (25.3%) |
Disability Class: Vision Difficulty
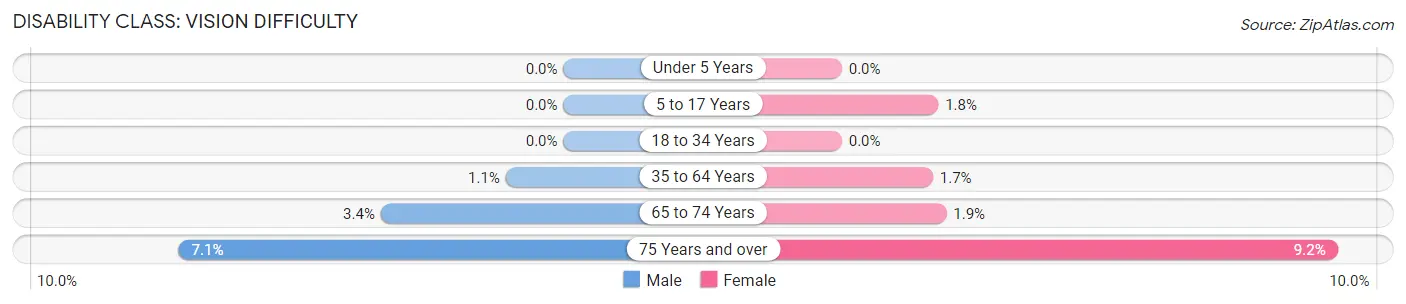
| Age Bracket | Male | Female |
| Under 5 Years | 0 (0.0%) | 0 (0.0%) |
| 5 to 17 Years | 0 (0.0%) | 14 (1.8%) |
| 18 to 34 Years | 0 (0.0%) | 0 (0.0%) |
| 35 to 64 Years | 16 (1.1%) | 25 (1.7%) |
| 65 to 74 Years | 12 (3.4%) | 7 (1.9%) |
| 75 Years and over | 8 (7.1%) | 16 (9.2%) |
Disability Class: Cognitive Difficulty
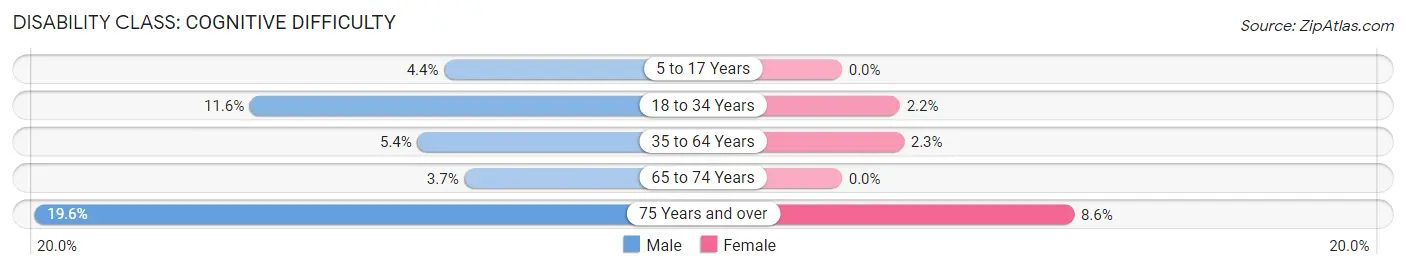
| Age Bracket | Male | Female |
| 5 to 17 Years | 47 (4.4%) | 0 (0.0%) |
| 18 to 34 Years | 90 (11.6%) | 18 (2.1%) |
| 35 to 64 Years | 81 (5.4%) | 34 (2.3%) |
| 65 to 74 Years | 13 (3.7%) | 0 (0.0%) |
| 75 Years and over | 22 (19.6%) | 15 (8.6%) |
Disability Class: Ambulatory Difficulty
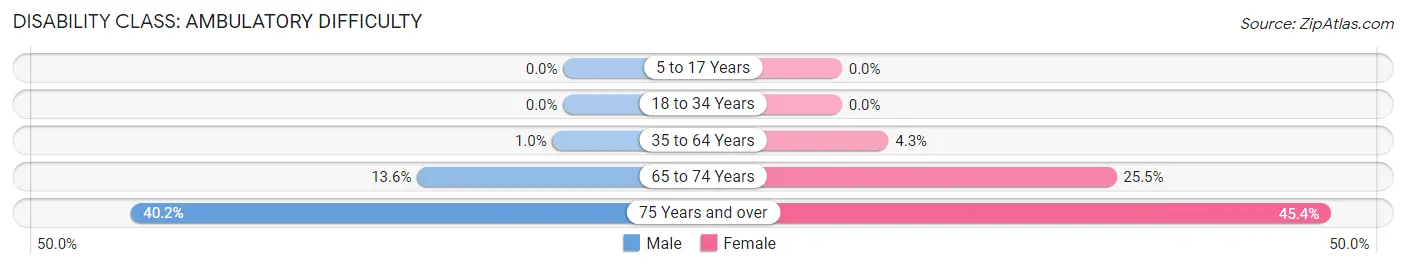
| Age Bracket | Male | Female |
| 5 to 17 Years | 0 (0.0%) | 0 (0.0%) |
| 18 to 34 Years | 0 (0.0%) | 0 (0.0%) |
| 35 to 64 Years | 15 (1.0%) | 64 (4.3%) |
| 65 to 74 Years | 48 (13.6%) | 92 (25.5%) |
| 75 Years and over | 45 (40.2%) | 79 (45.4%) |
Disability Class: Self-Care Difficulty

| Age Bracket | Male | Female |
| 5 to 17 Years | 12 (1.1%) | 0 (0.0%) |
| 18 to 34 Years | 0 (0.0%) | 0 (0.0%) |
| 35 to 64 Years | 15 (1.0%) | 42 (2.8%) |
| 65 to 74 Years | 41 (11.6%) | 1 (0.3%) |
| 75 Years and over | 7 (6.2%) | 14 (8.1%) |
Technology Access in Leola
Computing Device Access in Leola
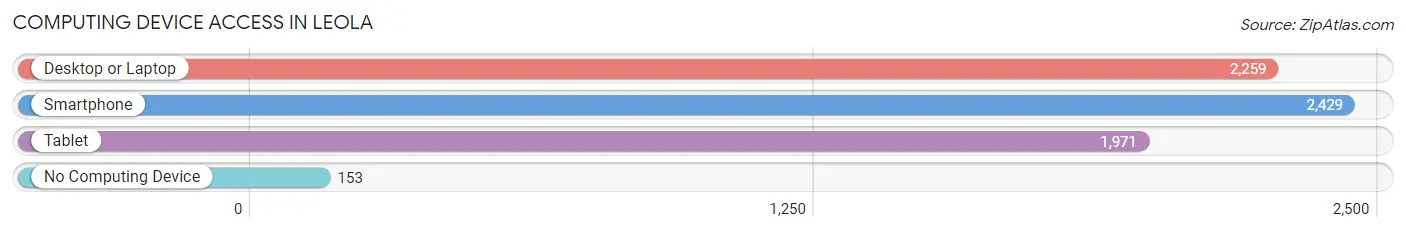
| Device Type | # Households | % Households |
| Desktop or Laptop | 2,259 | 82.2% |
| Smartphone | 2,429 | 88.4% |
| Tablet | 1,971 | 71.8% |
| No Computing Device | 153 | 5.6% |
| Total | 2,747 | 100.0% |
Internet Access in Leola
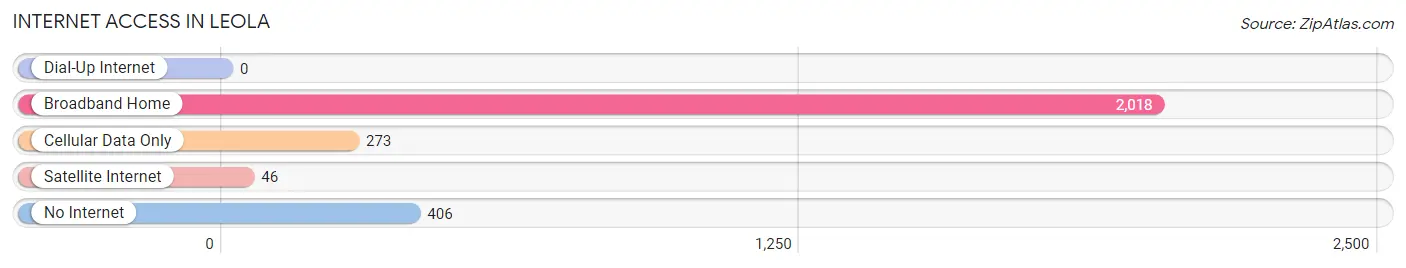
| Internet Type | # Households | % Households |
| Dial-Up Internet | 0 | 0.0% |
| Broadband Home | 2,018 | 73.5% |
| Cellular Data Only | 273 | 9.9% |
| Satellite Internet | 46 | 1.7% |
| No Internet | 406 | 14.8% |
| Total | 2,747 | 100.0% |
Leola Summary
Leola is a borough located in Lancaster County, Pennsylvania. It is situated in the heart of Pennsylvania Dutch Country, and is home to a population of approximately 1,500 people. The borough is located in the southeastern corner of the county, and is bordered by the townships of East Lampeter, West Lampeter, and Salisbury.
History
Leola was founded in 1854 by a group of Mennonites from the nearby village of Groffdale. The name of the borough was derived from the first two letters of the names of the founders’ wives: LEna and LOuisa. The Mennonites were attracted to the area due to its fertile soil and its proximity to the railroad. The railroad allowed the Mennonites to transport their goods to markets in Philadelphia and beyond.
The borough was officially incorporated in 1873. In the late 19th century, the borough was home to a variety of industries, including a flour mill, a sawmill, a brickyard, and a cigar factory. The borough also had a thriving agricultural industry, with many of the residents growing wheat, corn, and other crops.
Geography
Leola is located in southeastern Lancaster County, Pennsylvania. It is situated in the heart of Pennsylvania Dutch Country, and is bordered by the townships of East Lampeter, West Lampeter, and Salisbury. The borough is located at the intersection of US Route 30 and Pennsylvania Route 23.
The borough has a total area of 0.8 square miles, all of which is land. The borough is located in the Conestoga Valley, and is surrounded by rolling hills and farmland. The borough is located approximately 10 miles east of the city of Lancaster, and is approximately 60 miles west of Philadelphia.
Economy
Leola’s economy is largely based on agriculture and tourism. The borough is home to a variety of farms, which produce a variety of crops, including wheat, corn, and hay. The borough is also home to a number of tourist attractions, including the Leola Carriage Works, the Leola Farmers Market, and the Leola Historical Society.
The borough is also home to a variety of small businesses, including restaurants, retail stores, and professional services. The borough is home to a number of manufacturing companies, including a furniture manufacturer, a printing company, and a metal fabrication company.
Demographics
As of the 2010 census, the borough had a population of 1,521. The racial makeup of the borough was 95.3% White, 0.7% African American, 0.2% Native American, 0.7% Asian, 0.1% Pacific Islander, 1.2% from other races, and 1.8% from two or more races. Hispanic or Latino of any race were 3.2% of the population.
The median household income in the borough was $50,938, and the median family income was $60,938. The per capita income for the borough was $25,938. About 4.2% of families and 5.3% of the population were below the poverty line, including 6.2% of those under age 18 and 4.2% of those age 65 or over.
Common Questions
What is Per Capita Income in Leola?
Per Capita income in Leola is $34,366.
What is the Median Family Income in Leola?
Median Family Income in Leola is $101,585.
What is the Median Household income in Leola?
Median Household Income in Leola is $85,529.
What is Income or Wage Gap in Leola?
Income or Wage Gap in Leola is 23.2%.
Women in Leola earn 76.8 cents for every dollar earned by a man.
What is Inequality or Gini Index in Leola?
Inequality or Gini Index in Leola is 0.38.
What is the Total Population of Leola?
Total Population of Leola is 7,945.
What is the Total Male Population of Leola?
Total Male Population of Leola is 4,130.
What is the Total Female Population of Leola?
Total Female Population of Leola is 3,815.
What is the Ratio of Males per 100 Females in Leola?
There are 108.26 Males per 100 Females in Leola.
What is the Ratio of Females per 100 Males in Leola?
There are 92.37 Females per 100 Males in Leola.
What is the Median Population Age in Leola?
Median Population Age in Leola is 35.1 Years.
What is the Average Family Size in Leola
Average Family Size in Leola is 3.3 People.
What is the Average Household Size in Leola
Average Household Size in Leola is 2.9 People.
How Large is the Labor Force in Leola?
There are 4,122 People in the Labor Forcein in Leola.
What is the Percentage of People in the Labor Force in Leola?
70.6% of People are in the Labor Force in Leola.
What is the Unemployment Rate in Leola?
Unemployment Rate in Leola is 6.0%.