Lake Milton, OH Map & Demographics
Lake Milton Map
Lake Milton Overview
$45,280
PER CAPITA INCOME
$70,602
AVG FAMILY INCOME
$70,926
AVG HOUSEHOLD INCOME
0.38
INEQUALITY / GINI INDEX
469
TOTAL POPULATION
259
MALE POPULATION
210
FEMALE POPULATION
123.33
MALES / 100 FEMALES
81.08
FEMALES / 100 MALES
50.4
MEDIAN AGE
2.8
AVG FAMILY SIZE
2.2
AVG HOUSEHOLD SIZE
195
LABOR FORCE [ PEOPLE ]
53.3%
PERCENT IN LABOR FORCE
Lake Milton Zip Codes
Lake Milton Area Codes
Income in Lake Milton
Income Overview in Lake Milton
Per Capita Income in Lake Milton is $45,280, while median incomes of families and households are $70,602 and $70,926 respectively.
| Characteristic | Number | Measure |
| Per Capita Income | 469 | $45,280 |
| Median Family Income | 133 | $70,602 |
| Mean Family Income | 133 | $114,080 |
| Median Household Income | 208 | $70,926 |
| Mean Household Income | 208 | $102,876 |
| Income Deficit | 133 | $0 |
| Wage / Income Gap (%) | 469 | 0.00% |
| Wage / Income Gap ($) | 469 | 100.00¢ per $1 |
| Gini / Inequality Index | 469 | 0.38 |
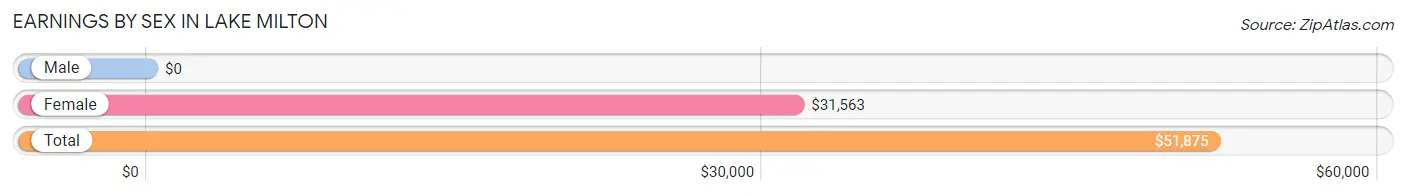
Earnings by Sex in Lake Milton
| Sex | Number | Average Earnings |
| Male | 124 (57.9%) | $0 |
| Female | 90 (42.1%) | $31,563 |
| Total | 214 (100.0%) | $51,875 |
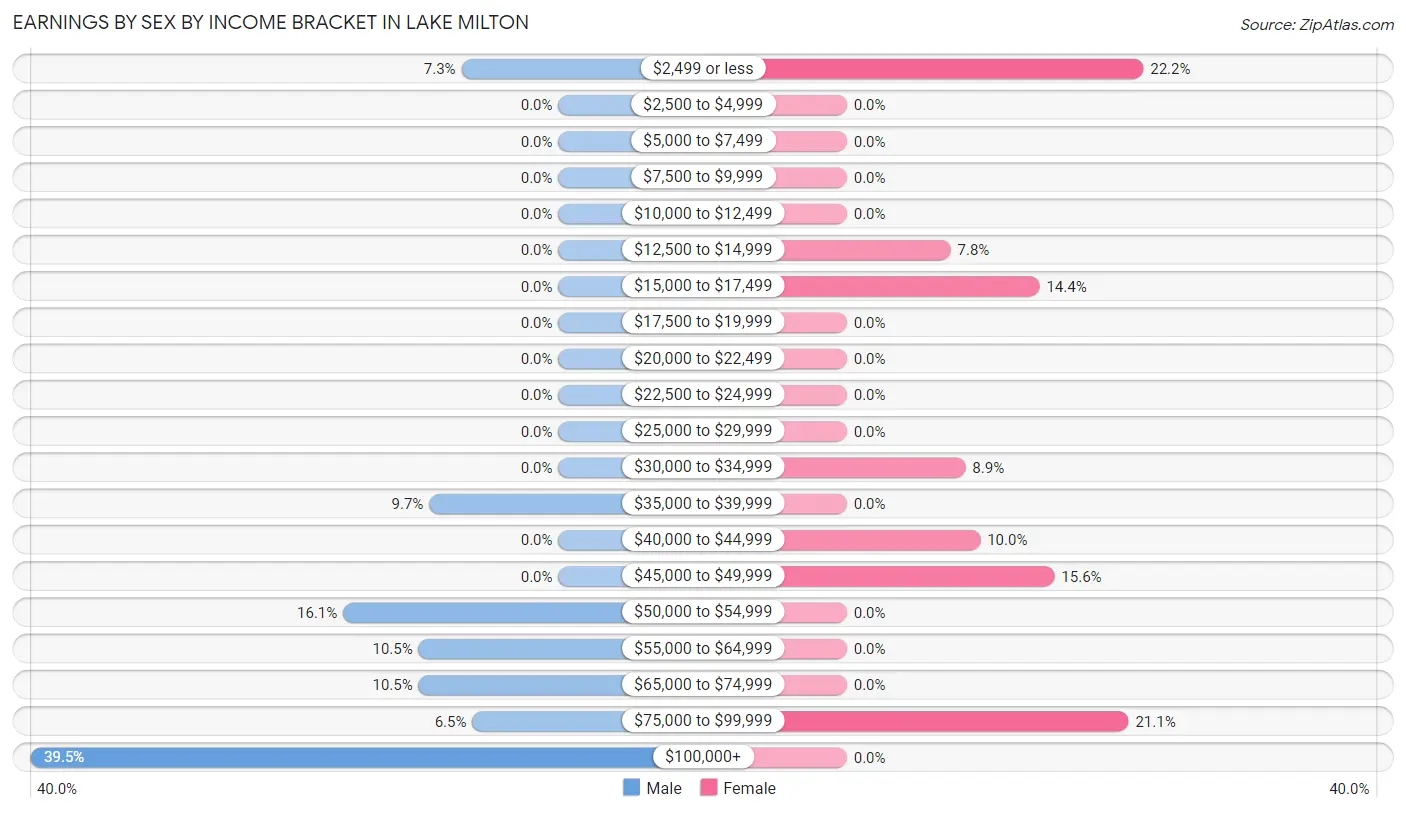
Earnings by Sex by Income Bracket in Lake Milton
The most common earnings brackets in Lake Milton are $100,000+ for men (49 | 39.5%) and $2,499 or less for women (20 | 22.2%).
| Income | Male | Female |
| $2,499 or less | 9 (7.3%) | 20 (22.2%) |
| $2,500 to $4,999 | 0 (0.0%) | 0 (0.0%) |
| $5,000 to $7,499 | 0 (0.0%) | 0 (0.0%) |
| $7,500 to $9,999 | 0 (0.0%) | 0 (0.0%) |
| $10,000 to $12,499 | 0 (0.0%) | 0 (0.0%) |
| $12,500 to $14,999 | 0 (0.0%) | 7 (7.8%) |
| $15,000 to $17,499 | 0 (0.0%) | 13 (14.4%) |
| $17,500 to $19,999 | 0 (0.0%) | 0 (0.0%) |
| $20,000 to $22,499 | 0 (0.0%) | 0 (0.0%) |
| $22,500 to $24,999 | 0 (0.0%) | 0 (0.0%) |
| $25,000 to $29,999 | 0 (0.0%) | 0 (0.0%) |
| $30,000 to $34,999 | 0 (0.0%) | 8 (8.9%) |
| $35,000 to $39,999 | 12 (9.7%) | 0 (0.0%) |
| $40,000 to $44,999 | 0 (0.0%) | 9 (10.0%) |
| $45,000 to $49,999 | 0 (0.0%) | 14 (15.6%) |
| $50,000 to $54,999 | 20 (16.1%) | 0 (0.0%) |
| $55,000 to $64,999 | 13 (10.5%) | 0 (0.0%) |
| $65,000 to $74,999 | 13 (10.5%) | 0 (0.0%) |
| $75,000 to $99,999 | 8 (6.5%) | 19 (21.1%) |
| $100,000+ | 49 (39.5%) | 0 (0.0%) |
| Total | 124 (100.0%) | 90 (100.0%) |
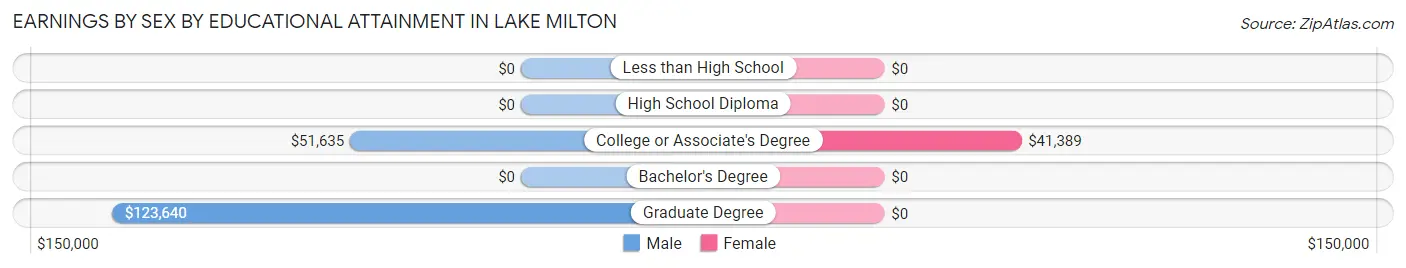
Earnings by Sex by Educational Attainment in Lake Milton
| Educational Attainment | Male Income | Female Income |
| Less than High School | - | - |
| High School Diploma | - | - |
| College or Associate's Degree | $51,635 | $41,389 |
| Bachelor's Degree | - | - |
| Graduate Degree | $123,640 | $0 |
| Total | - | - |
Family Income in Lake Milton
Family Income Brackets in Lake Milton
According to the Lake Milton family income data, there are 67 families falling into the $50,000 to $74,999 income range, which is the most common income bracket and makes up 50.4% of all families.
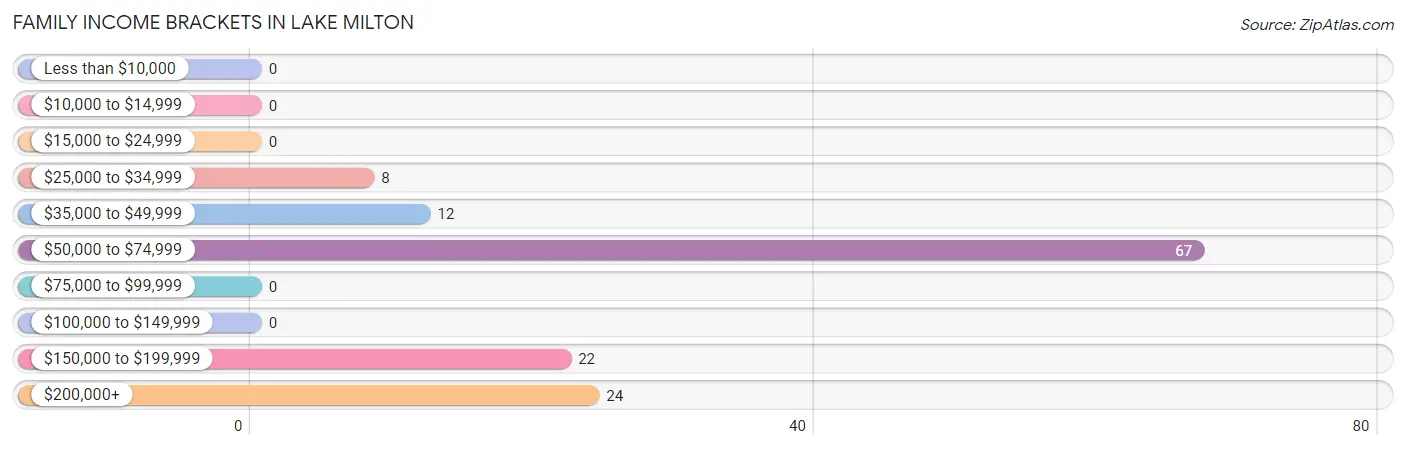
| Income Bracket | # Families | % Families |
| Less than $10,000 | 0 | 0.0% |
| $10,000 to $14,999 | 0 | 0.0% |
| $15,000 to $24,999 | 0 | 0.0% |
| $25,000 to $34,999 | 8 | 6.0% |
| $35,000 to $49,999 | 12 | 9.0% |
| $50,000 to $74,999 | 67 | 50.4% |
| $75,000 to $99,999 | 0 | 0.0% |
| $100,000 to $149,999 | 0 | 0.0% |
| $150,000 to $199,999 | 22 | 16.5% |
| $200,000+ | 24 | 18.0% |
Family Income by Famaliy Size in Lake Milton
2-person families (87 | 65.4%) account for the highest median family income in Lake Milton with $69,135 per family, while 2-person families (87 | 65.4%) have the highest median income of $34,568 per family member.
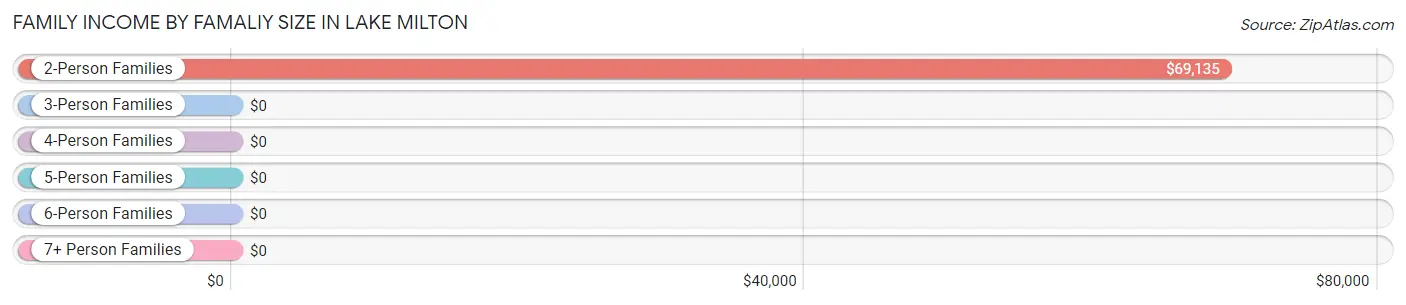
| Income Bracket | # Families | Median Income |
| 2-Person Families | 87 (65.4%) | $69,135 |
| 3-Person Families | 0 (0.0%) | $0 |
| 4-Person Families | 46 (34.6%) | $0 |
| 5-Person Families | 0 (0.0%) | $0 |
| 6-Person Families | 0 (0.0%) | $0 |
| 7+ Person Families | 0 (0.0%) | $0 |
| Total | 133 (100.0%) | $70,602 |
Family Income by Number of Earners in Lake Milton
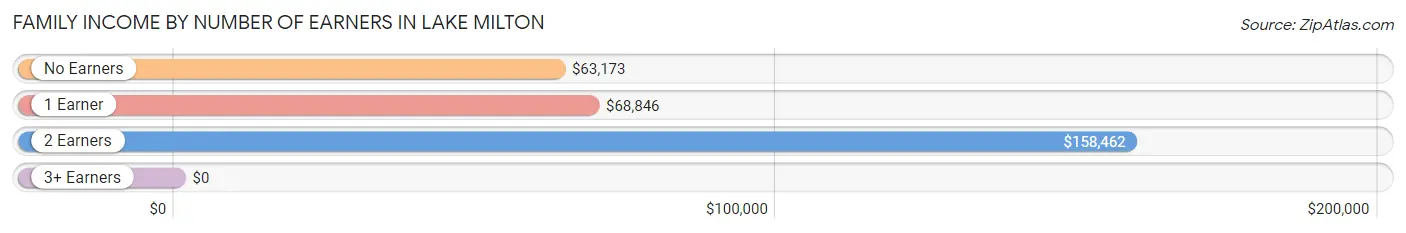
| Number of Earners | # Families | Median Income |
| No Earners | 51 (38.4%) | $63,173 |
| 1 Earner | 38 (28.6%) | $68,846 |
| 2 Earners | 36 (27.1%) | $158,462 |
| 3+ Earners | 8 (6.0%) | $0 |
| Total | 133 (100.0%) | $70,602 |
Household Income in Lake Milton
Household Income Brackets in Lake Milton
With 67 households falling in the category, the $50,000 to $74,999 income range is the most frequent in Lake Milton, accounting for 32.2% of all households.
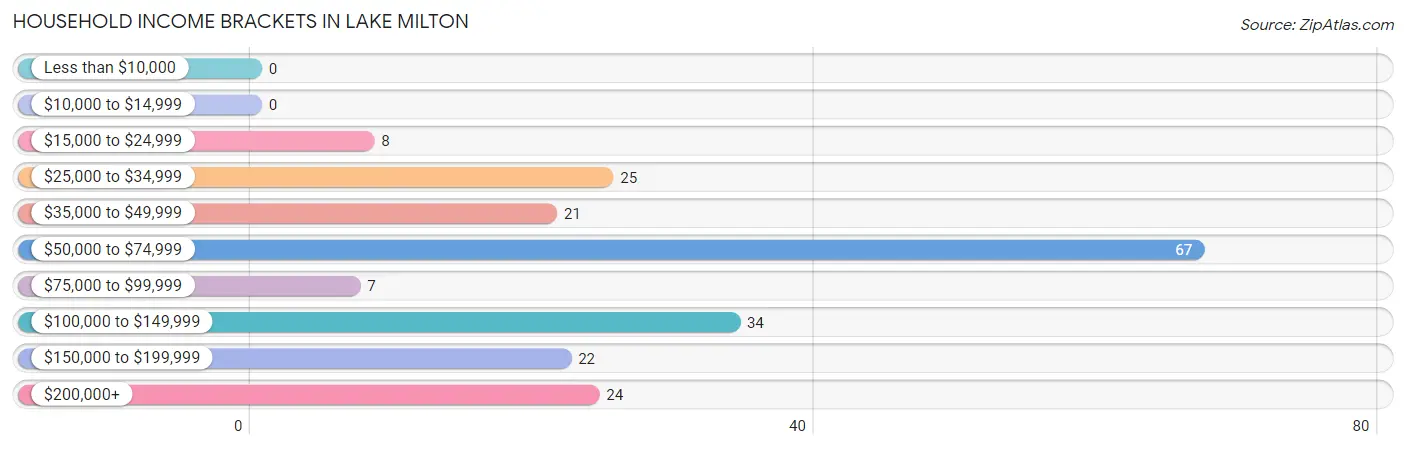
| Income Bracket | # Households | % Households |
| Less than $10,000 | 0 | 0.0% |
| $10,000 to $14,999 | 0 | 0.0% |
| $15,000 to $24,999 | 8 | 3.8% |
| $25,000 to $34,999 | 25 | 12.0% |
| $35,000 to $49,999 | 21 | 10.1% |
| $50,000 to $74,999 | 67 | 32.2% |
| $75,000 to $99,999 | 7 | 3.4% |
| $100,000 to $149,999 | 34 | 16.3% |
| $150,000 to $199,999 | 22 | 10.6% |
| $200,000+ | 24 | 11.5% |
Household Income by Householder Age in Lake Milton
The median household income in Lake Milton is $70,926, with the highest median household income of $131,103 found in the 45 to 64 years age bracket for the primary householder. A total of 70 households (33.7%) fall into this category.
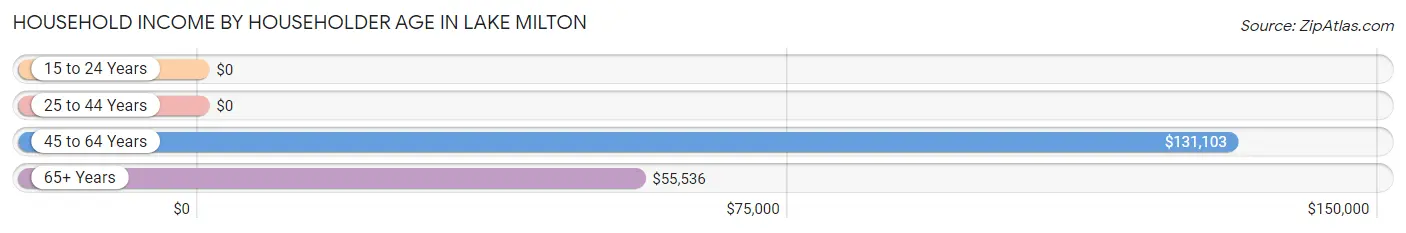
| Income Bracket | # Households | Median Income |
| 15 to 24 Years | 0 (0.0%) | $0 |
| 25 to 44 Years | 55 (26.4%) | $0 |
| 45 to 64 Years | 70 (33.7%) | $131,103 |
| 65+ Years | 83 (39.9%) | $55,536 |
| Total | 208 (100.0%) | $70,926 |
Poverty in Lake Milton
Income Below Poverty by Sex and Age in Lake Milton
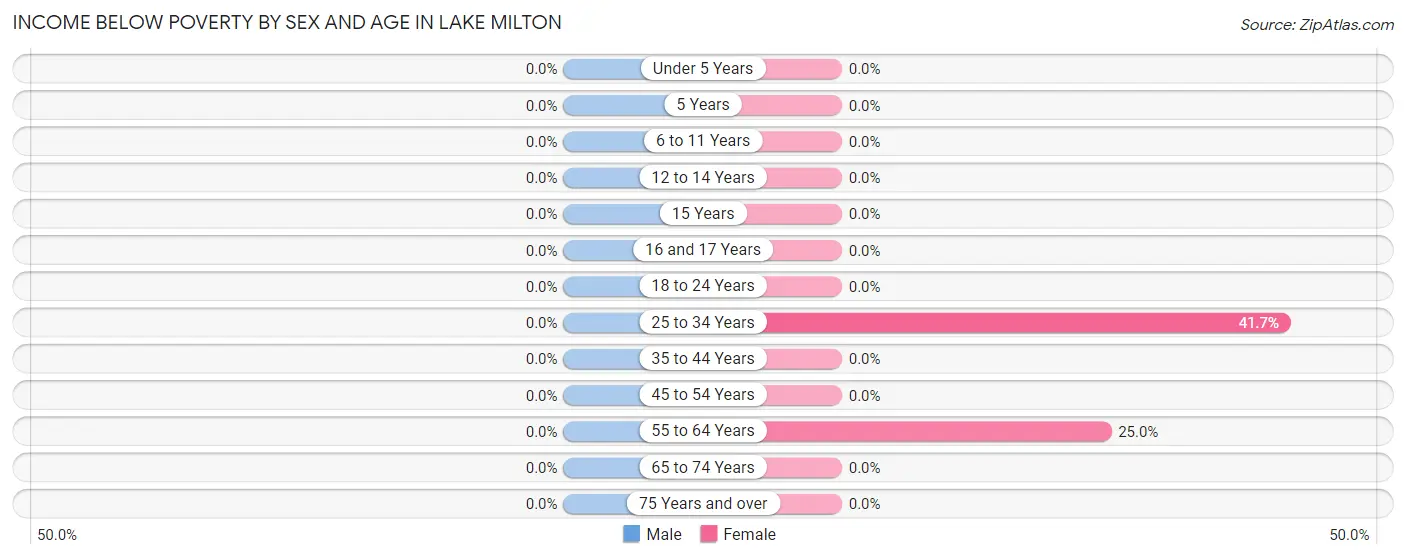
| Age Bracket | Male | Female |
| Under 5 Years | 0 (0.0%) | 0 (0.0%) |
| 5 Years | 0 (0.0%) | 0 (0.0%) |
| 6 to 11 Years | 0 (0.0%) | 0 (0.0%) |
| 12 to 14 Years | 0 (0.0%) | 0 (0.0%) |
| 15 Years | 0 (0.0%) | 0 (0.0%) |
| 16 and 17 Years | 0 (0.0%) | 0 (0.0%) |
| 18 to 24 Years | 0 (0.0%) | 0 (0.0%) |
| 25 to 34 Years | 0 (0.0%) | 10 (41.7%) |
| 35 to 44 Years | 0 (0.0%) | 0 (0.0%) |
| 45 to 54 Years | 0 (0.0%) | 0 (0.0%) |
| 55 to 64 Years | 0 (0.0%) | 7 (25.0%) |
| 65 to 74 Years | 0 (0.0%) | 0 (0.0%) |
| 75 Years and over | 0 (0.0%) | 0 (0.0%) |
| Total | 0 (0.0%) | 17 (8.1%) |
Income Above Poverty by Sex and Age in Lake Milton
According to the poverty statistics in Lake Milton, males aged under 5 years and females aged under 5 years are the age groups that are most secure financially, with 100.0% of males and 100.0% of females in these age groups living above the poverty line.
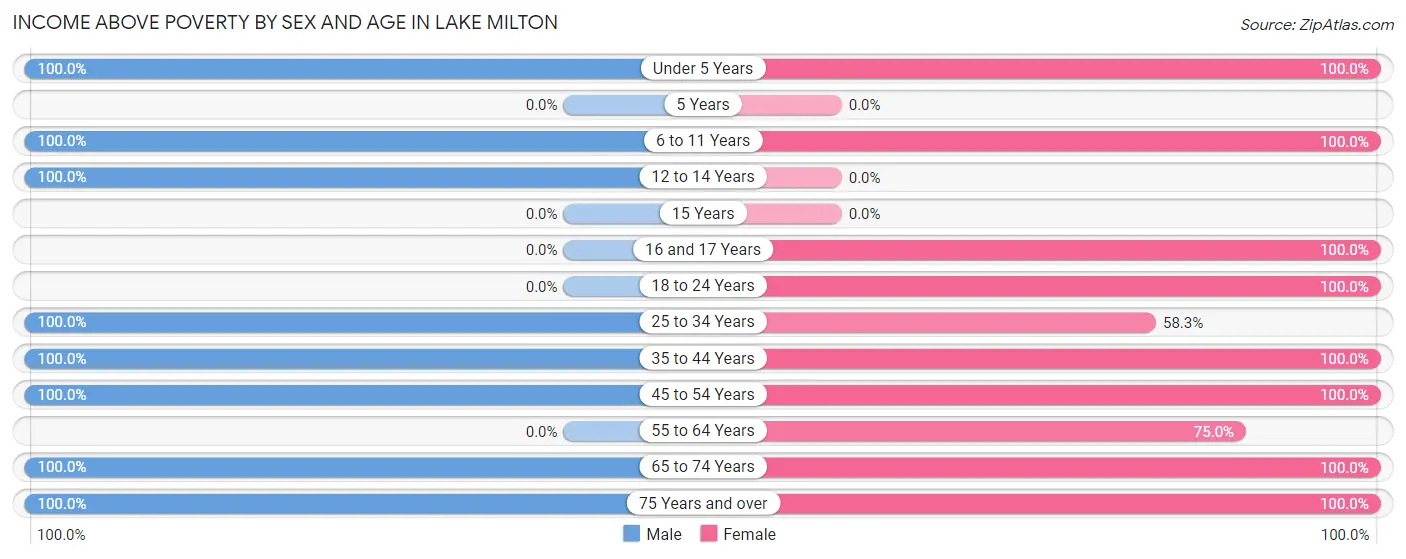
| Age Bracket | Male | Female |
| Under 5 Years | 42 (100.0%) | 21 (100.0%) |
| 5 Years | 0 (0.0%) | 0 (0.0%) |
| 6 to 11 Years | 16 (100.0%) | 12 (100.0%) |
| 12 to 14 Years | 12 (100.0%) | 0 (0.0%) |
| 15 Years | 0 (0.0%) | 0 (0.0%) |
| 16 and 17 Years | 0 (0.0%) | 10 (100.0%) |
| 18 to 24 Years | 0 (0.0%) | 8 (100.0%) |
| 25 to 34 Years | 25 (100.0%) | 14 (58.3%) |
| 35 to 44 Years | 21 (100.0%) | 22 (100.0%) |
| 45 to 54 Years | 57 (100.0%) | 19 (100.0%) |
| 55 to 64 Years | 0 (0.0%) | 21 (75.0%) |
| 65 to 74 Years | 43 (100.0%) | 14 (100.0%) |
| 75 Years and over | 43 (100.0%) | 52 (100.0%) |
| Total | 259 (100.0%) | 193 (91.9%) |
Income Below Poverty Among Married-Couple Families in Lake Milton
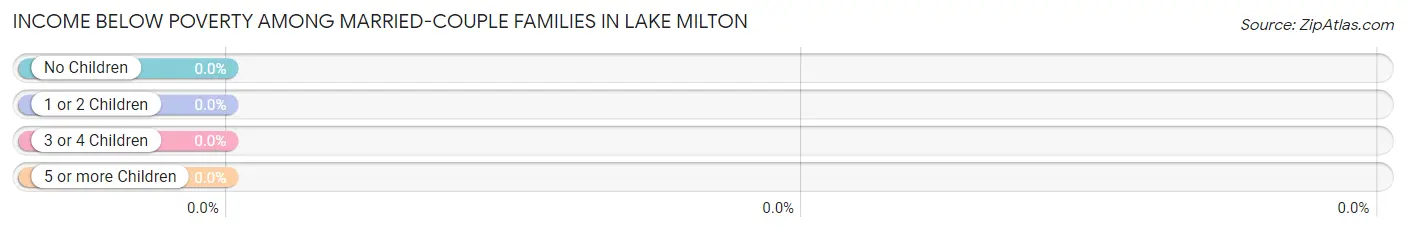
| Children | Above Poverty | Below Poverty |
| No Children | 87 (100.0%) | 0 (0.0%) |
| 1 or 2 Children | 34 (100.0%) | 0 (0.0%) |
| 3 or 4 Children | 0 (0.0%) | 0 (0.0%) |
| 5 or more Children | 0 (0.0%) | 0 (0.0%) |
| Total | 121 (100.0%) | 0 (0.0%) |
Income Below Poverty Among Single-Parent Households in Lake Milton
| Children | Single Father | Single Mother |
| No Children | 0 (0.0%) | 0 (0.0%) |
| 1 or 2 Children | 0 (0.0%) | 0 (0.0%) |
| 3 or 4 Children | 0 (0.0%) | 0 (0.0%) |
| 5 or more Children | 0 (0.0%) | 0 (0.0%) |
| Total | 0 (0.0%) | 0 (0.0%) |
Income Below Poverty Among Married-Couple vs Single-Parent Households in Lake Milton
| Children | Married-Couple Families | Single-Parent Households |
| No Children | 0 (0.0%) | 0 (0.0%) |
| 1 or 2 Children | 0 (0.0%) | 0 (0.0%) |
| 3 or 4 Children | 0 (0.0%) | 0 (0.0%) |
| 5 or more Children | 0 (0.0%) | 0 (0.0%) |
| Total | 0 (0.0%) | 0 (0.0%) |
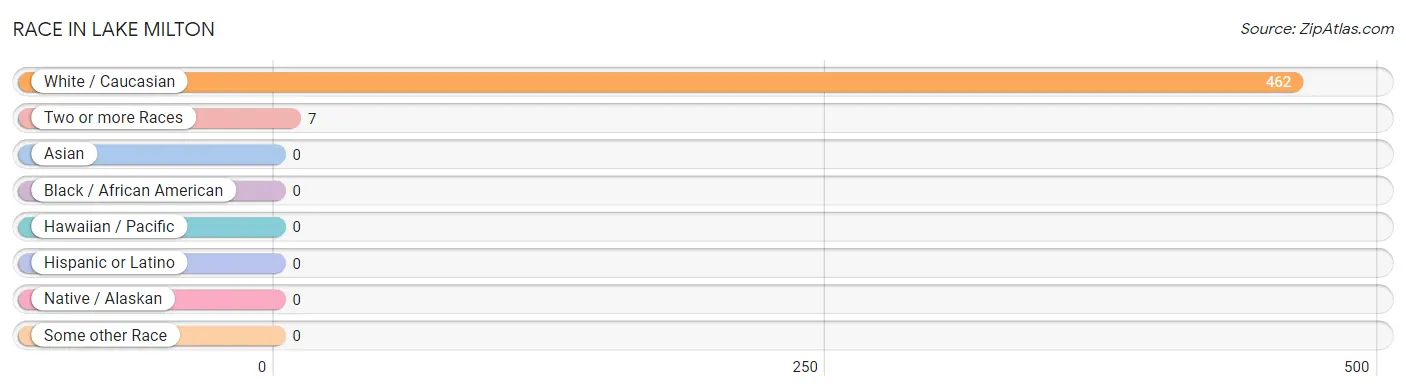
Race in Lake Milton
The most populous races in Lake Milton are White / Caucasian (462 | 98.5%), and Two or more Races (7 | 1.5%).
| Race | # Population | % Population |
| Asian | 0 | 0.0% |
| Black / African American | 0 | 0.0% |
| Hawaiian / Pacific | 0 | 0.0% |
| Hispanic or Latino | 0 | 0.0% |
| Native / Alaskan | 0 | 0.0% |
| White / Caucasian | 462 | 98.5% |
| Two or more Races | 7 | 1.5% |
| Some other Race | 0 | 0.0% |
| Total | 469 | 100.0% |
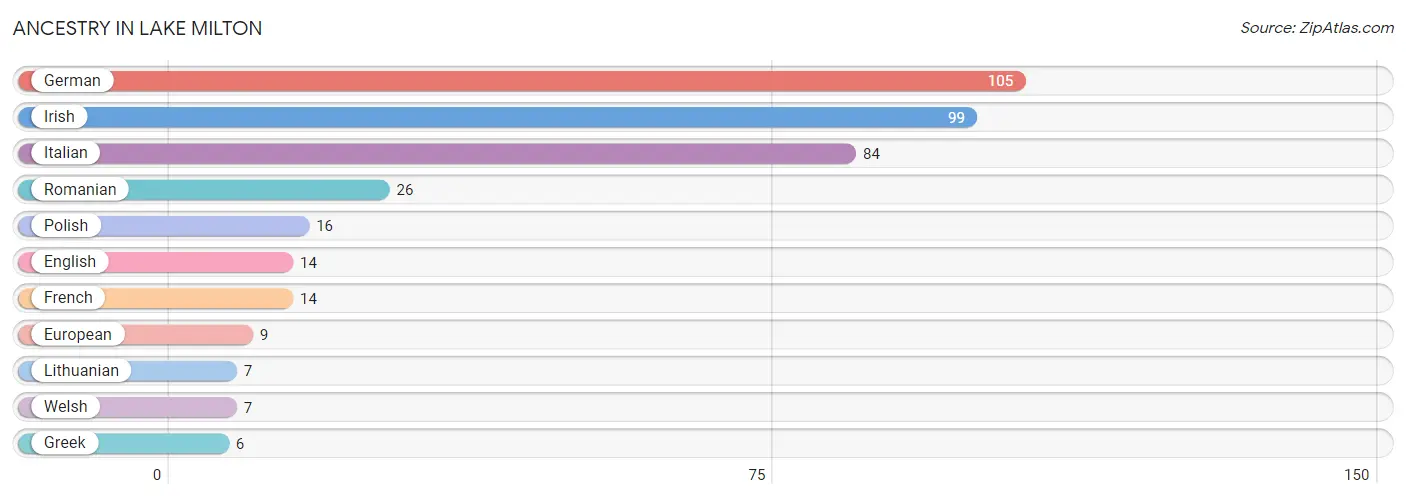
Ancestry in Lake Milton
The most populous ancestries reported in Lake Milton are German (105 | 22.4%), Irish (99 | 21.1%), Italian (84 | 17.9%), Romanian (26 | 5.5%), and Polish (16 | 3.4%), together accounting for 70.4% of all Lake Milton residents.
| Ancestry | # Population | % Population |
| English | 14 | 3.0% |
| European | 9 | 1.9% |
| French | 14 | 3.0% |
| German | 105 | 22.4% |
| Greek | 6 | 1.3% |
| Irish | 99 | 21.1% |
| Italian | 84 | 17.9% |
| Lithuanian | 7 | 1.5% |
| Polish | 16 | 3.4% |
| Romanian | 26 | 5.5% |
| Welsh | 7 | 1.5% | View All 11 Rows |
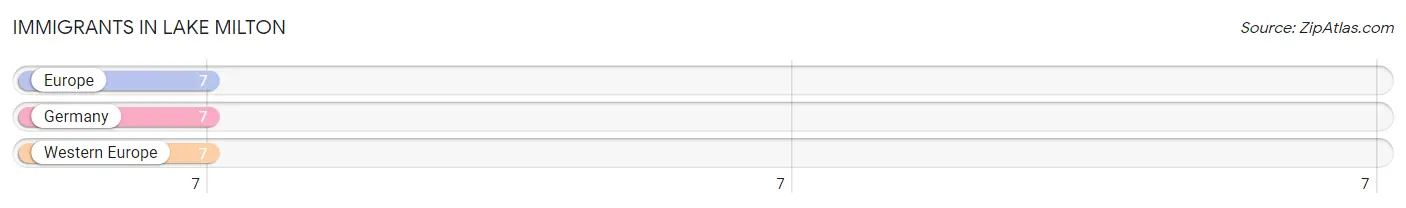
Immigrants in Lake Milton
The most numerous immigrant groups reported in Lake Milton came from Europe (7 | 1.5%), Germany (7 | 1.5%), and Western Europe (7 | 1.5%), together accounting for 4.5% of all Lake Milton residents.
| Immigration Origin | # Population | % Population |
| Europe | 7 | 1.5% |
| Germany | 7 | 1.5% |
| Western Europe | 7 | 1.5% | View All 3 Rows |
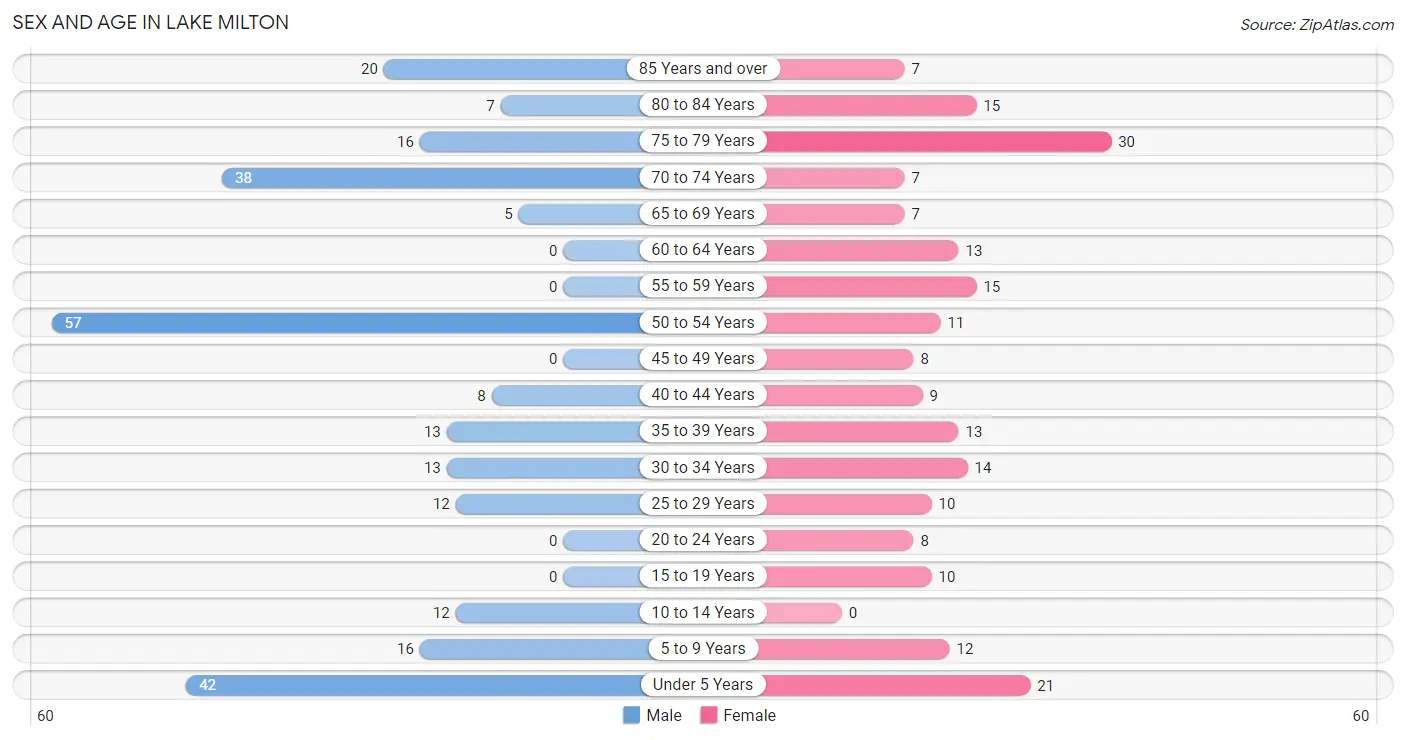
Sex and Age in Lake Milton
Sex and Age in Lake Milton
The most populous age groups in Lake Milton are 50 to 54 Years (57 | 22.0%) for men and 75 to 79 Years (30 | 14.3%) for women.
| Age Bracket | Male | Female |
| Under 5 Years | 42 (16.2%) | 21 (10.0%) |
| 5 to 9 Years | 16 (6.2%) | 12 (5.7%) |
| 10 to 14 Years | 12 (4.6%) | 0 (0.0%) |
| 15 to 19 Years | 0 (0.0%) | 10 (4.8%) |
| 20 to 24 Years | 0 (0.0%) | 8 (3.8%) |
| 25 to 29 Years | 12 (4.6%) | 10 (4.8%) |
| 30 to 34 Years | 13 (5.0%) | 14 (6.7%) |
| 35 to 39 Years | 13 (5.0%) | 13 (6.2%) |
| 40 to 44 Years | 8 (3.1%) | 9 (4.3%) |
| 45 to 49 Years | 0 (0.0%) | 8 (3.8%) |
| 50 to 54 Years | 57 (22.0%) | 11 (5.2%) |
| 55 to 59 Years | 0 (0.0%) | 15 (7.1%) |
| 60 to 64 Years | 0 (0.0%) | 13 (6.2%) |
| 65 to 69 Years | 5 (1.9%) | 7 (3.3%) |
| 70 to 74 Years | 38 (14.7%) | 7 (3.3%) |
| 75 to 79 Years | 16 (6.2%) | 30 (14.3%) |
| 80 to 84 Years | 7 (2.7%) | 15 (7.1%) |
| 85 Years and over | 20 (7.7%) | 7 (3.3%) |
| Total | 259 (100.0%) | 210 (100.0%) |
Families and Households in Lake Milton
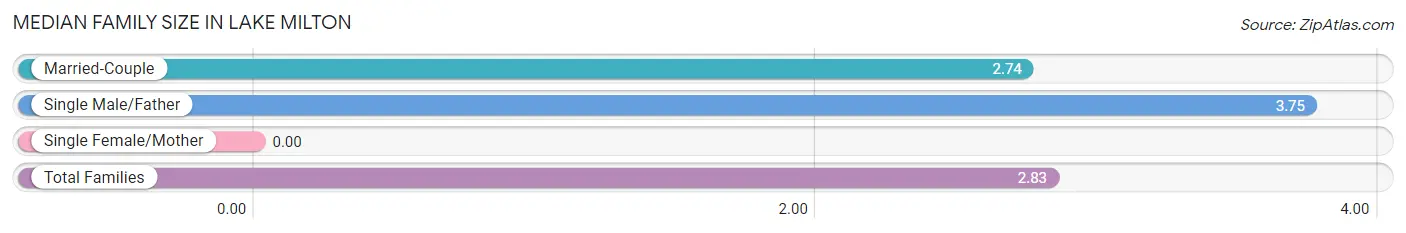
Median Family Size in Lake Milton
| Family Type | # Families | Family Size |
| Married-Couple | 121 (91.0%) | 2.74 |
| Single Male/Father | 12 (9.0%) | 3.75 |
| Single Female/Mother | 0 (0.0%) | - |
| Total Families | 133 (100.0%) | 2.83 |
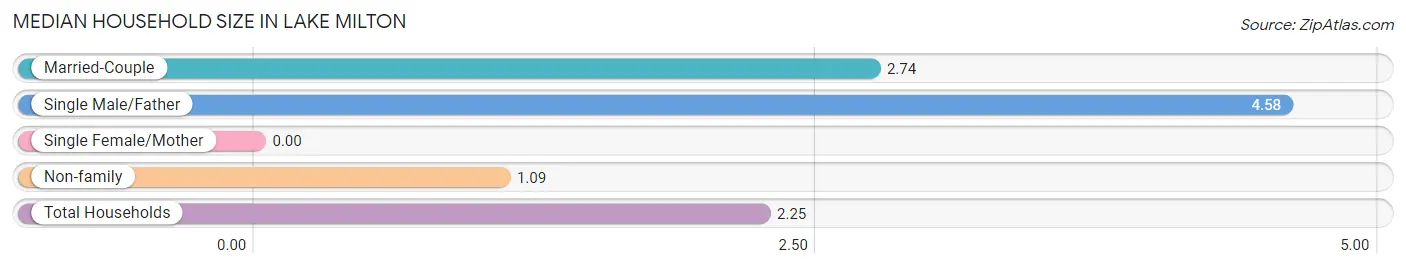
Median Household Size in Lake Milton
| Household Type | # Households | Household Size |
| Married-Couple | 121 (58.2%) | 2.74 |
| Single Male/Father | 12 (5.8%) | 4.58 |
| Single Female/Mother | 0 (0.0%) | - |
| Non-family | 75 (36.1%) | 1.09 |
| Total Households | 208 (100.0%) | 2.25 |
Household Size by Marriage Status in Lake Milton
Out of a total of 208 households in Lake Milton, 133 (63.9%) are family households, while 75 (36.1%) are nonfamily households. The most numerous type of family households are 2-person households, comprising 87, and the most common type of nonfamily households are 1-person households, comprising 68.
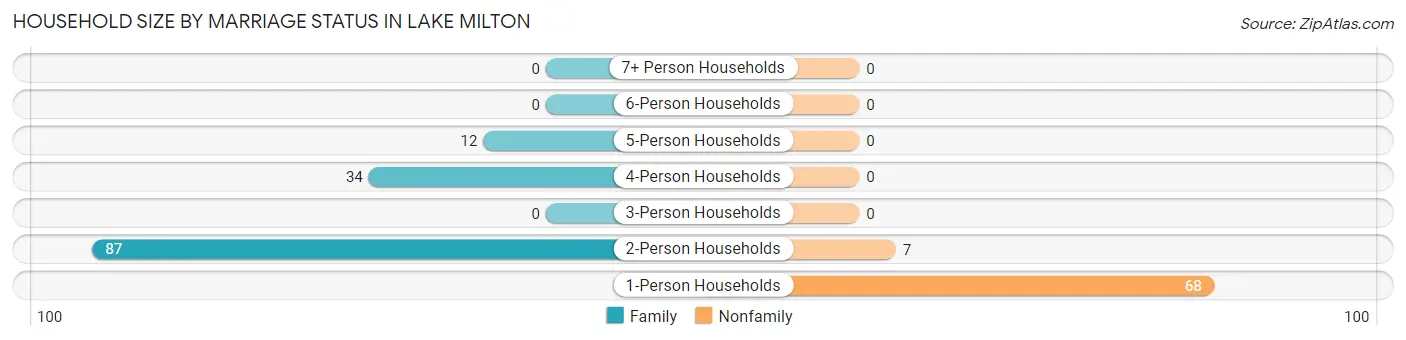
| Household Size | Family Households | Nonfamily Households |
| 1-Person Households | - | 68 (32.7%) |
| 2-Person Households | 87 (41.8%) | 7 (3.4%) |
| 3-Person Households | 0 (0.0%) | 0 (0.0%) |
| 4-Person Households | 34 (16.4%) | 0 (0.0%) |
| 5-Person Households | 12 (5.8%) | 0 (0.0%) |
| 6-Person Households | 0 (0.0%) | 0 (0.0%) |
| 7+ Person Households | 0 (0.0%) | 0 (0.0%) |
| Total | 133 (63.9%) | 75 (36.1%) |
Female Fertility in Lake Milton
Fertility by Age in Lake Milton
Average fertility rate in Lake Milton is 139.0 births per 1,000 women. Women in the age bracket of 20 to 34 years have the highest fertility rate with 313.0 births per 1,000 women. Women in the age bracket of 20 to 34 years acount for 100.0% of all women with births.
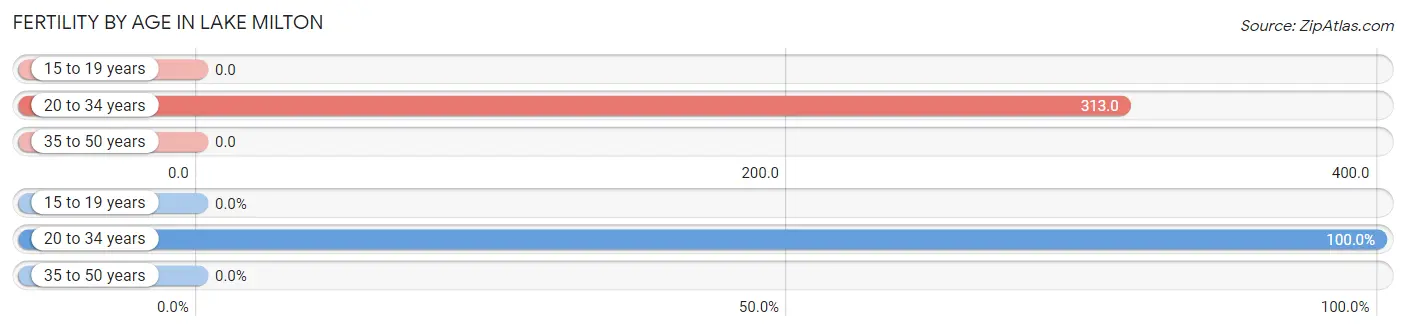
| Age Bracket | Women with Births | Births / 1,000 Women |
| 15 to 19 years | 0 (0.0%) | 0.0 |
| 20 to 34 years | 10 (100.0%) | 313.0 |
| 35 to 50 years | 0 (0.0%) | 0.0 |
| Total | 10 (100.0%) | 139.0 |
Fertility by Age by Marriage Status in Lake Milton
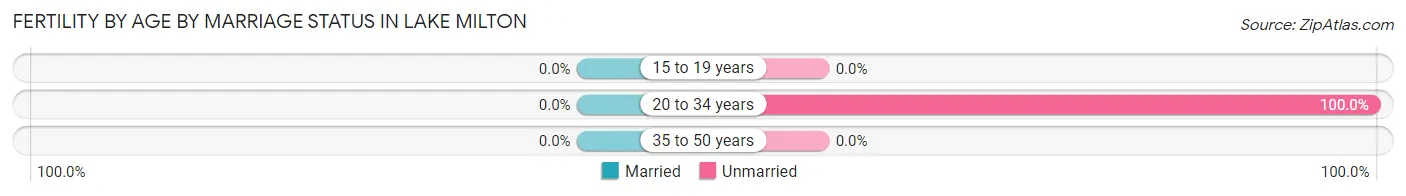
| Age Bracket | Married | Unmarried |
| 15 to 19 years | 0 (0.0%) | 0 (0.0%) |
| 20 to 34 years | 0 (0.0%) | 10 (100.0%) |
| 35 to 50 years | 0 (0.0%) | 0 (0.0%) |
| Total | 0 (0.0%) | 10 (100.0%) |
Fertility by Education in Lake Milton
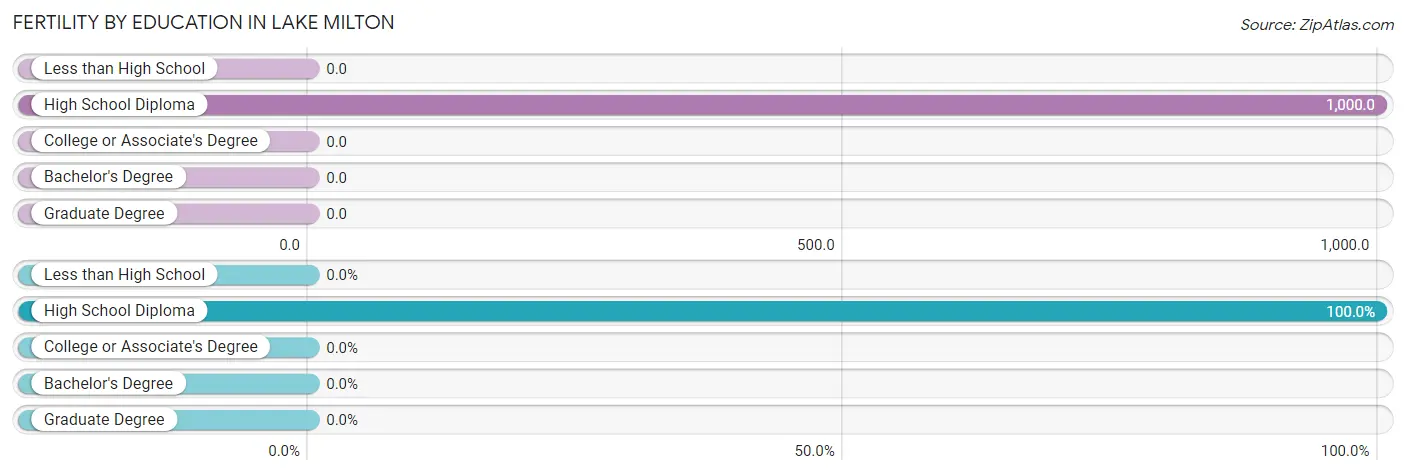
| Educational Attainment | Women with Births | Births / 1,000 Women |
| Less than High School | 0 (0.0%) | 0.0 |
| High School Diploma | 10 (100.0%) | 1,000.0 |
| College or Associate's Degree | 0 (0.0%) | 0.0 |
| Bachelor's Degree | 0 (0.0%) | 0.0 |
| Graduate Degree | 0 (0.0%) | 0.0 |
| Total | 10 (100.0%) | 139.0 |
Fertility by Education by Marriage Status in Lake Milton
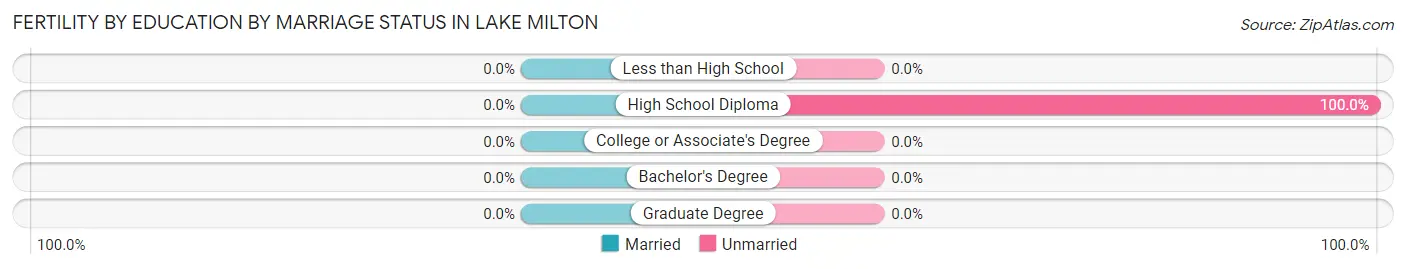
| Educational Attainment | Married | Unmarried |
| Less than High School | 0 (0.0%) | 0 (0.0%) |
| High School Diploma | 0 (0.0%) | 10 (100.0%) |
| College or Associate's Degree | 0 (0.0%) | 0 (0.0%) |
| Bachelor's Degree | 0 (0.0%) | 0 (0.0%) |
| Graduate Degree | 0 (0.0%) | 0 (0.0%) |
| Total | 0 (0.0%) | 10 (100.0%) |
Employment Characteristics in Lake Milton
Employment by Class of Employer in Lake Milton
Among the 195 employed individuals in Lake Milton, private company employees (129 | 66.1%), self-employed (incorporated) (34 | 17.4%), and state government employees (19 | 9.7%) make up the most common classes of employment.
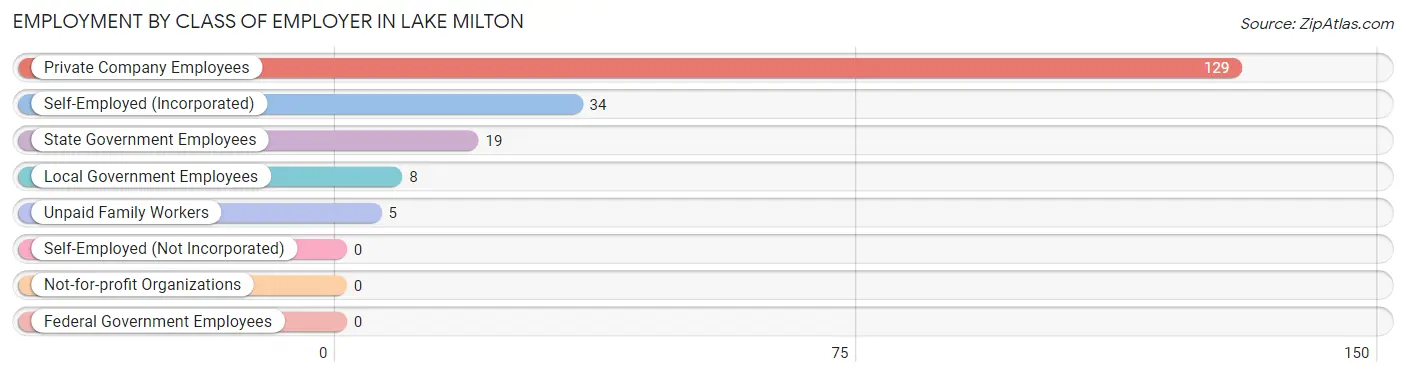
| Employer Class | # Employees | % Employees |
| Private Company Employees | 129 | 66.1% |
| Self-Employed (Incorporated) | 34 | 17.4% |
| Self-Employed (Not Incorporated) | 0 | 0.0% |
| Not-for-profit Organizations | 0 | 0.0% |
| Local Government Employees | 8 | 4.1% |
| State Government Employees | 19 | 9.7% |
| Federal Government Employees | 0 | 0.0% |
| Unpaid Family Workers | 5 | 2.6% |
| Total | 195 | 100.0% |
Employment Status by Age in Lake Milton
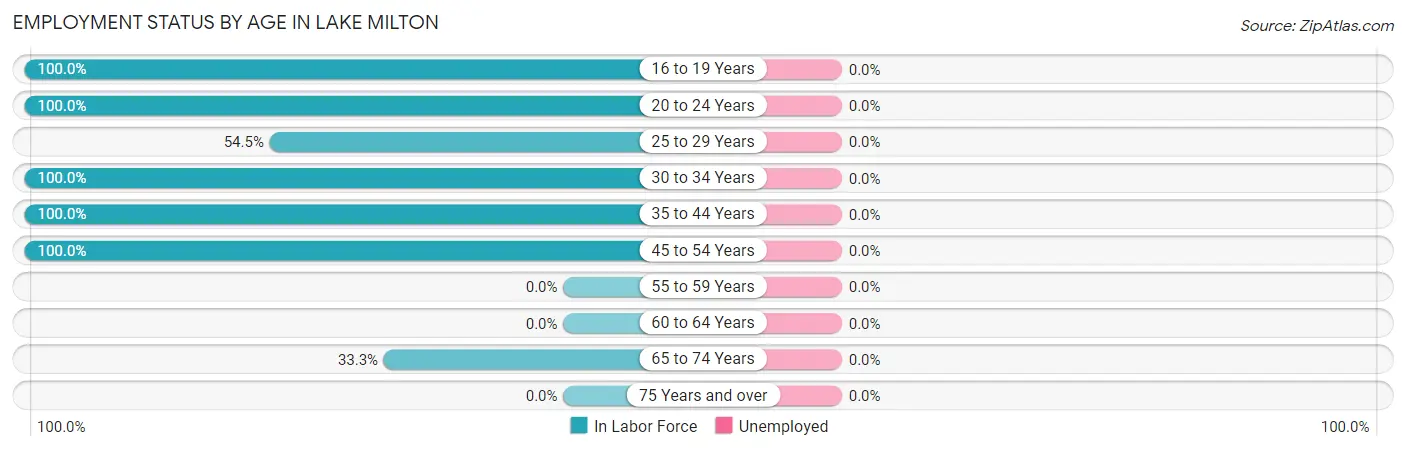
| Age Bracket | In Labor Force | Unemployed |
| 16 to 19 Years | 10 (100.0%) | 0 (0.0%) |
| 20 to 24 Years | 8 (100.0%) | 0 (0.0%) |
| 25 to 29 Years | 12 (54.5%) | 0 (0.0%) |
| 30 to 34 Years | 27 (100.0%) | 0 (0.0%) |
| 35 to 44 Years | 43 (100.0%) | 0 (0.0%) |
| 45 to 54 Years | 76 (100.0%) | 0 (0.0%) |
| 55 to 59 Years | 0 (0.0%) | 0 (0.0%) |
| 60 to 64 Years | 0 (0.0%) | 0 (0.0%) |
| 65 to 74 Years | 19 (33.3%) | 0 (0.0%) |
| 75 Years and over | 0 (0.0%) | 0 (0.0%) |
| Total | 195 (53.3%) | 0 (0.0%) |
Employment Status by Educational Attainment in Lake Milton
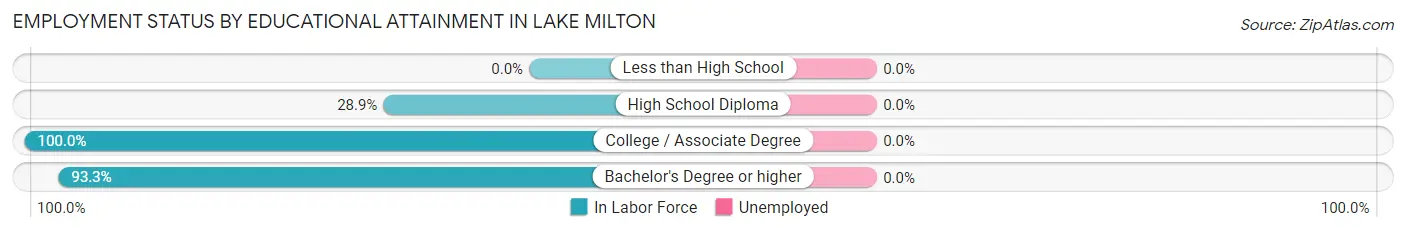
| Educational Attainment | In Labor Force | Unemployed |
| Less than High School | 0 (0.0%) | 0 (0.0%) |
| High School Diploma | 13 (28.9%) | 0 (0.0%) |
| College / Associate Degree | 62 (100.0%) | 0 (0.0%) |
| Bachelor's Degree or higher | 83 (93.3%) | 0 (0.0%) |
| Total | 158 (80.6%) | 0 (0.0%) |
Employment Occupations by Sex in Lake Milton
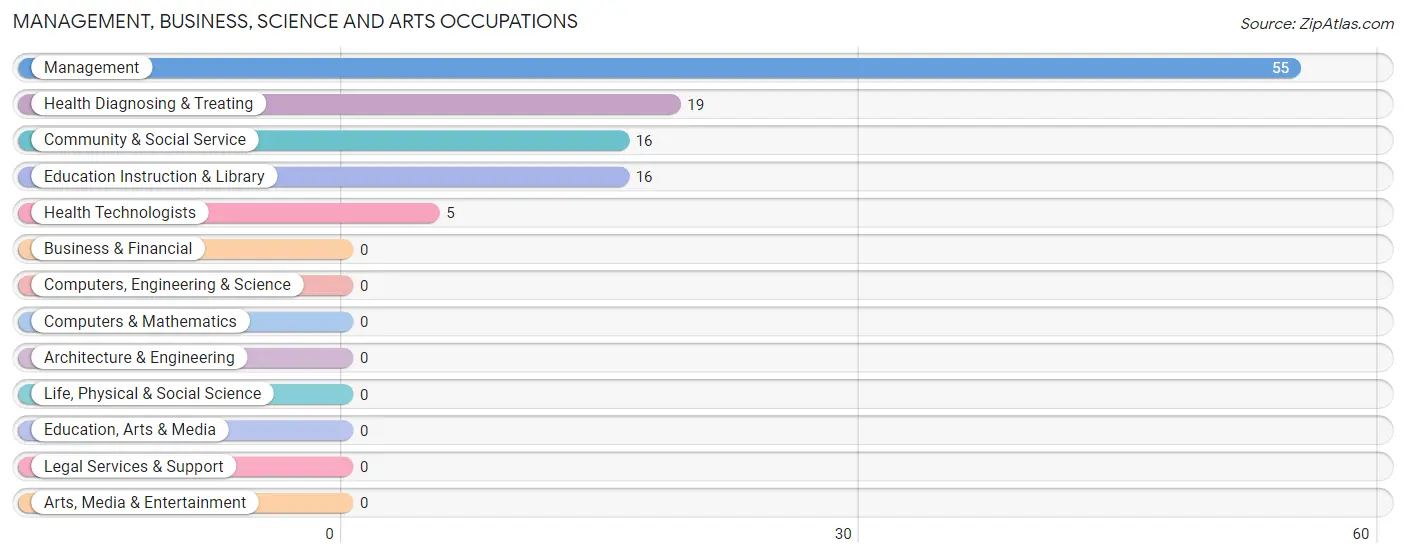
Management, Business, Science and Arts Occupations
The most common Management, Business, Science and Arts occupations in Lake Milton are Management (55 | 28.2%), Health Diagnosing & Treating (19 | 9.7%), Community & Social Service (16 | 8.2%), Education Instruction & Library (16 | 8.2%), and Health Technologists (5 | 2.6%).
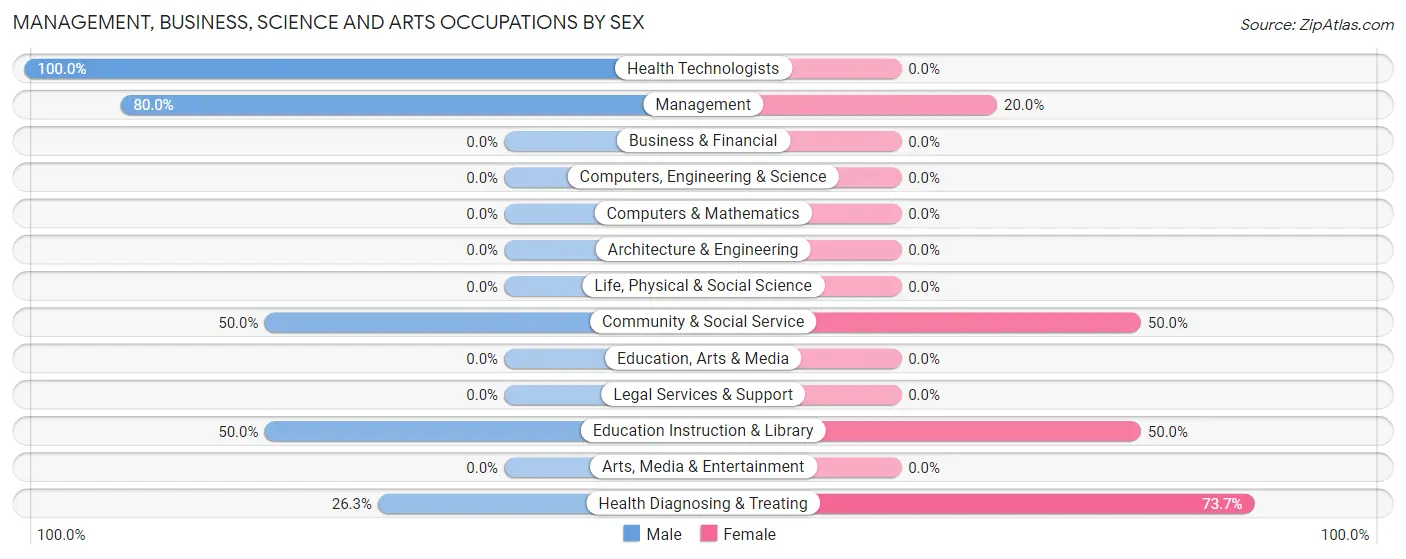
Management, Business, Science and Arts Occupations by Sex
Within the Management, Business, Science and Arts occupations in Lake Milton, the most male-oriented occupations are Health Technologists (100.0%), Management (80.0%), and Community & Social Service (50.0%), while the most female-oriented occupations are Health Diagnosing & Treating (73.7%), Community & Social Service (50.0%), and Education Instruction & Library (50.0%).
| Occupation | Male | Female |
| Management | 44 (80.0%) | 11 (20.0%) |
| Business & Financial | 0 (0.0%) | 0 (0.0%) |
| Computers, Engineering & Science | 0 (0.0%) | 0 (0.0%) |
| Computers & Mathematics | 0 (0.0%) | 0 (0.0%) |
| Architecture & Engineering | 0 (0.0%) | 0 (0.0%) |
| Life, Physical & Social Science | 0 (0.0%) | 0 (0.0%) |
| Community & Social Service | 8 (50.0%) | 8 (50.0%) |
| Education, Arts & Media | 0 (0.0%) | 0 (0.0%) |
| Legal Services & Support | 0 (0.0%) | 0 (0.0%) |
| Education Instruction & Library | 8 (50.0%) | 8 (50.0%) |
| Arts, Media & Entertainment | 0 (0.0%) | 0 (0.0%) |
| Health Diagnosing & Treating | 5 (26.3%) | 14 (73.7%) |
| Health Technologists | 5 (100.0%) | 0 (0.0%) |
| Total (Category) | 57 (63.3%) | 33 (36.7%) |
| Total (Overall) | 115 (59.0%) | 80 (41.0%) |
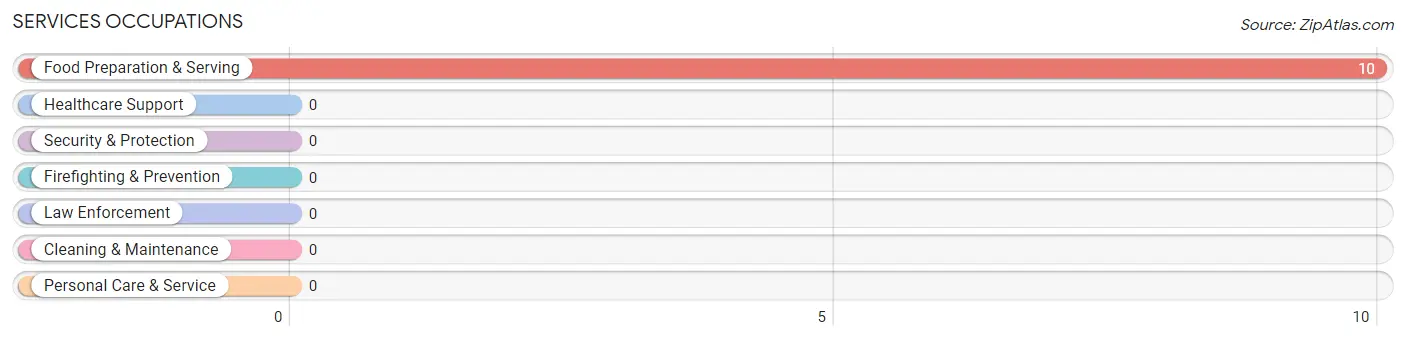
Services Occupations
The most common Services occupations in Lake Milton are , and Food Preparation & Serving (10 | 5.1%).
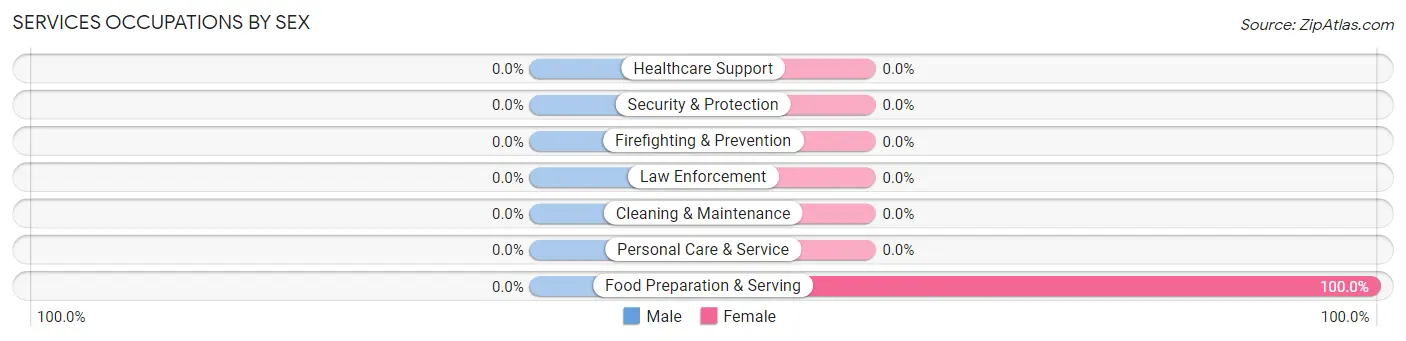
Services Occupations by Sex
| Occupation | Male | Female |
| Healthcare Support | 0 (0.0%) | 0 (0.0%) |
| Security & Protection | 0 (0.0%) | 0 (0.0%) |
| Firefighting & Prevention | 0 (0.0%) | 0 (0.0%) |
| Law Enforcement | 0 (0.0%) | 0 (0.0%) |
| Food Preparation & Serving | 0 (0.0%) | 10 (100.0%) |
| Cleaning & Maintenance | 0 (0.0%) | 0 (0.0%) |
| Personal Care & Service | 0 (0.0%) | 0 (0.0%) |
| Total (Category) | 0 (0.0%) | 10 (100.0%) |
| Total (Overall) | 115 (59.0%) | 80 (41.0%) |
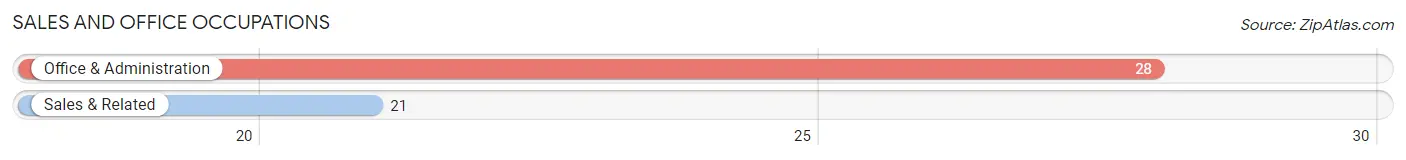
Sales and Office Occupations
The most common Sales and Office occupations in Lake Milton are Office & Administration (28 | 14.4%), and Sales & Related (21 | 10.8%).
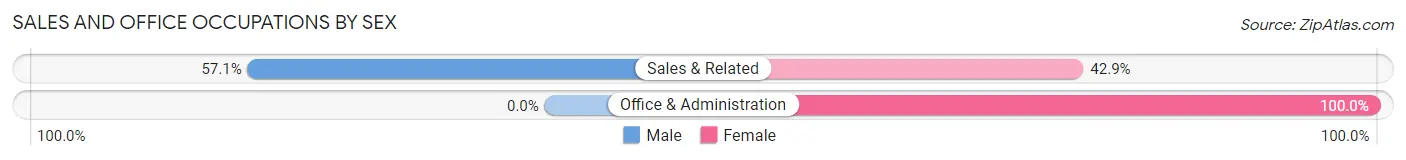
Sales and Office Occupations by Sex
| Occupation | Male | Female |
| Sales & Related | 12 (57.1%) | 9 (42.9%) |
| Office & Administration | 0 (0.0%) | 28 (100.0%) |
| Total (Category) | 12 (24.5%) | 37 (75.5%) |
| Total (Overall) | 115 (59.0%) | 80 (41.0%) |
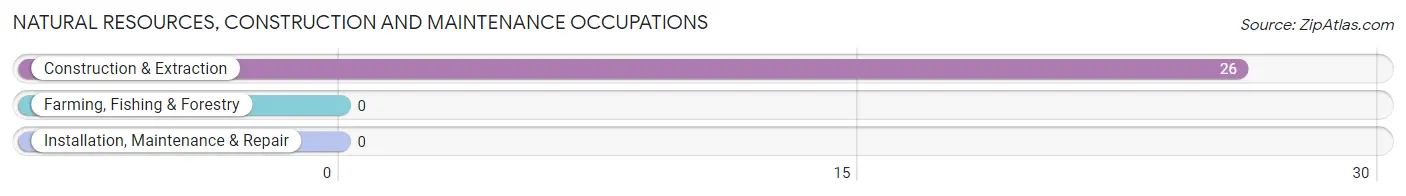
Natural Resources, Construction and Maintenance Occupations
The most common Natural Resources, Construction and Maintenance occupations in Lake Milton are , and Construction & Extraction (26 | 13.3%).
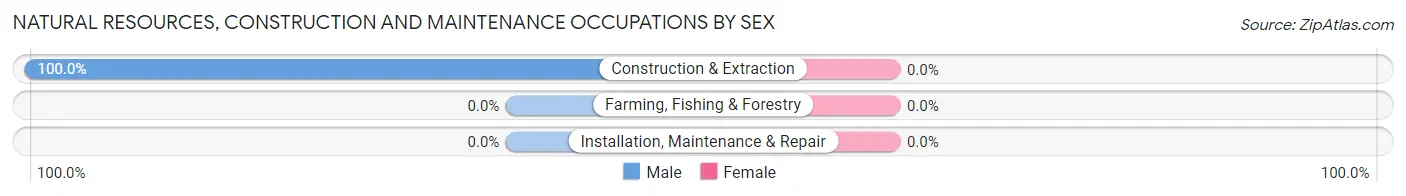
Natural Resources, Construction and Maintenance Occupations by Sex
| Occupation | Male | Female |
| Farming, Fishing & Forestry | 0 (0.0%) | 0 (0.0%) |
| Construction & Extraction | 26 (100.0%) | 0 (0.0%) |
| Installation, Maintenance & Repair | 0 (0.0%) | 0 (0.0%) |
| Total (Category) | 26 (100.0%) | 0 (0.0%) |
| Total (Overall) | 115 (59.0%) | 80 (41.0%) |
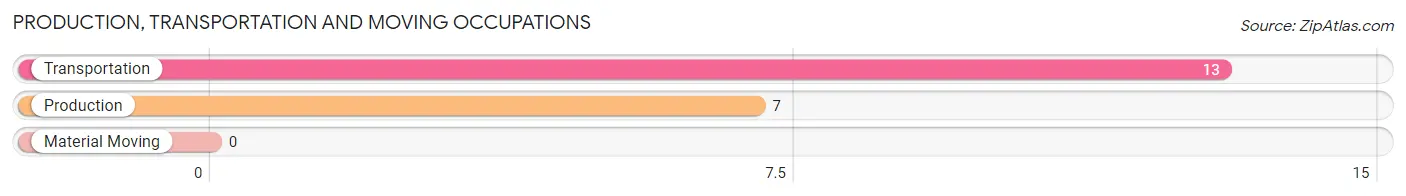
Production, Transportation and Moving Occupations
The most common Production, Transportation and Moving occupations in Lake Milton are Transportation (13 | 6.7%), and Production (7 | 3.6%).
Production, Transportation and Moving Occupations by Sex
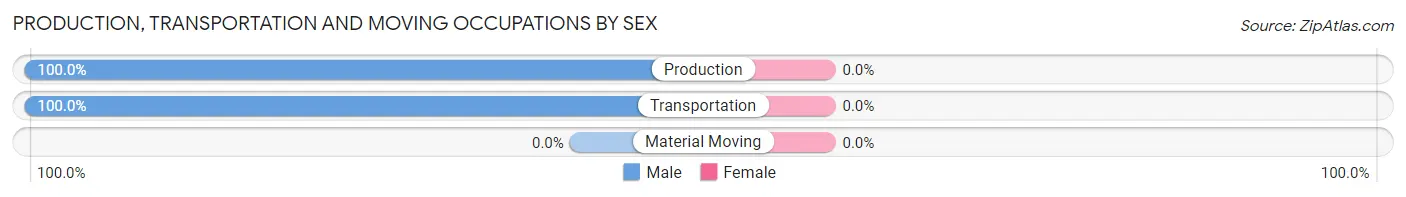
| Occupation | Male | Female |
| Production | 7 (100.0%) | 0 (0.0%) |
| Transportation | 13 (100.0%) | 0 (0.0%) |
| Material Moving | 0 (0.0%) | 0 (0.0%) |
| Total (Category) | 20 (100.0%) | 0 (0.0%) |
| Total (Overall) | 115 (59.0%) | 80 (41.0%) |
Employment Industries by Sex in Lake Milton
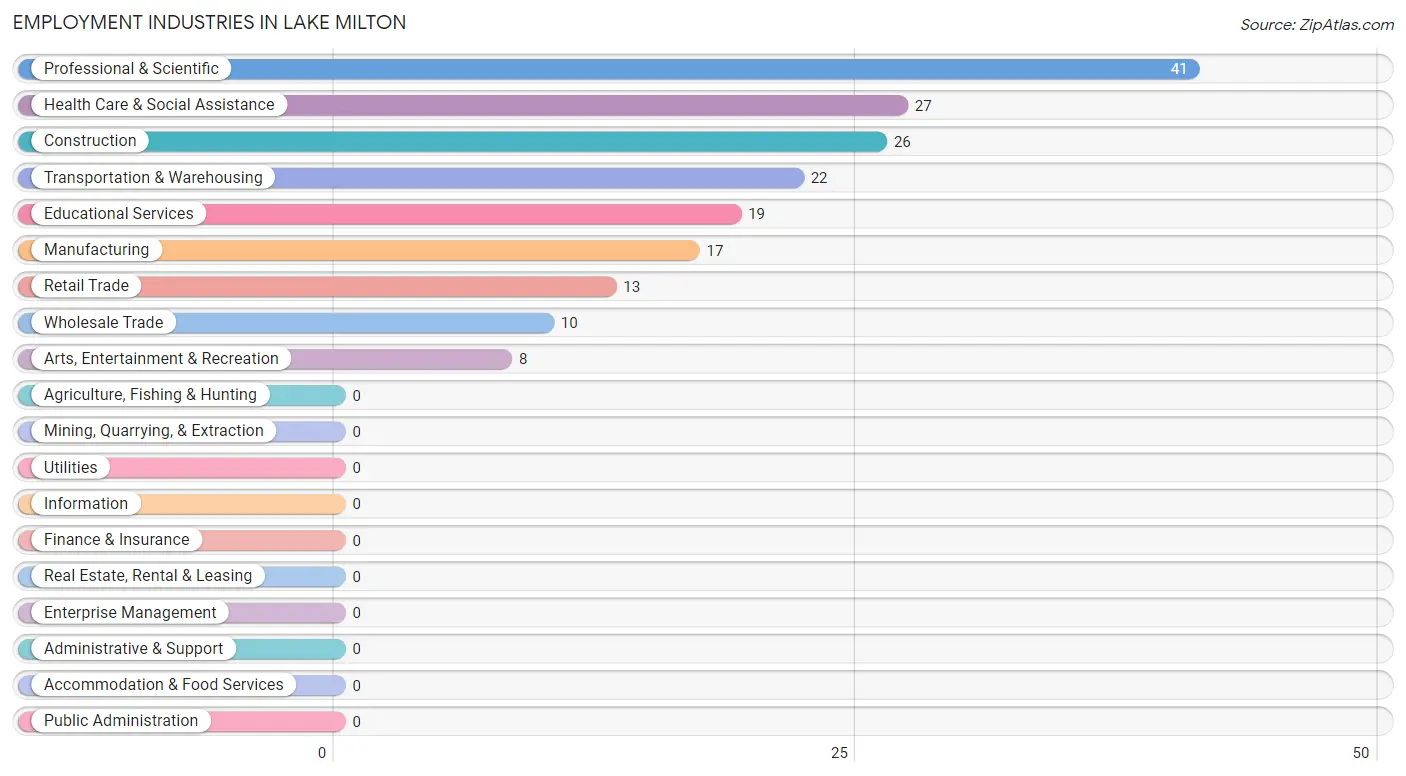
Employment Industries in Lake Milton
The major employment industries in Lake Milton include Professional & Scientific (41 | 21.0%), Health Care & Social Assistance (27 | 13.9%), Construction (26 | 13.3%), Transportation & Warehousing (22 | 11.3%), and Educational Services (19 | 9.7%).
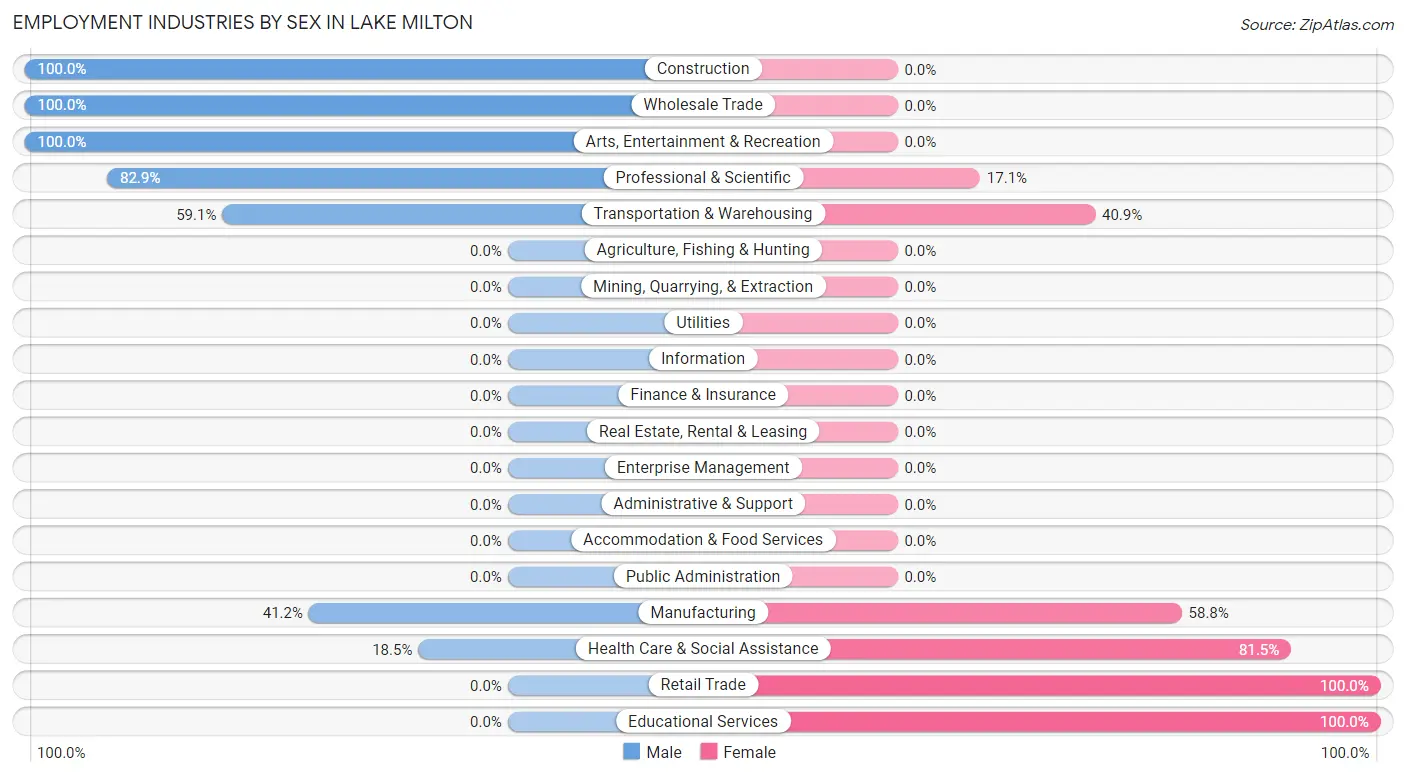
Employment Industries by Sex in Lake Milton
The Lake Milton industries that see more men than women are Construction (100.0%), Wholesale Trade (100.0%), and Arts, Entertainment & Recreation (100.0%), whereas the industries that tend to have a higher number of women are Retail Trade (100.0%), Educational Services (100.0%), and Health Care & Social Assistance (81.5%).
| Industry | Male | Female |
| Agriculture, Fishing & Hunting | 0 (0.0%) | 0 (0.0%) |
| Mining, Quarrying, & Extraction | 0 (0.0%) | 0 (0.0%) |
| Construction | 26 (100.0%) | 0 (0.0%) |
| Manufacturing | 7 (41.2%) | 10 (58.8%) |
| Wholesale Trade | 10 (100.0%) | 0 (0.0%) |
| Retail Trade | 0 (0.0%) | 13 (100.0%) |
| Transportation & Warehousing | 13 (59.1%) | 9 (40.9%) |
| Utilities | 0 (0.0%) | 0 (0.0%) |
| Information | 0 (0.0%) | 0 (0.0%) |
| Finance & Insurance | 0 (0.0%) | 0 (0.0%) |
| Real Estate, Rental & Leasing | 0 (0.0%) | 0 (0.0%) |
| Professional & Scientific | 34 (82.9%) | 7 (17.1%) |
| Enterprise Management | 0 (0.0%) | 0 (0.0%) |
| Administrative & Support | 0 (0.0%) | 0 (0.0%) |
| Educational Services | 0 (0.0%) | 19 (100.0%) |
| Health Care & Social Assistance | 5 (18.5%) | 22 (81.5%) |
| Arts, Entertainment & Recreation | 8 (100.0%) | 0 (0.0%) |
| Accommodation & Food Services | 0 (0.0%) | 0 (0.0%) |
| Public Administration | 0 (0.0%) | 0 (0.0%) |
| Total | 115 (59.0%) | 80 (41.0%) |
Education in Lake Milton
School Enrollment in Lake Milton
The most common levels of schooling among the 50 students in Lake Milton are elementary school (28 | 56.0%), middle school (12 | 24.0%), and high school (10 | 20.0%).
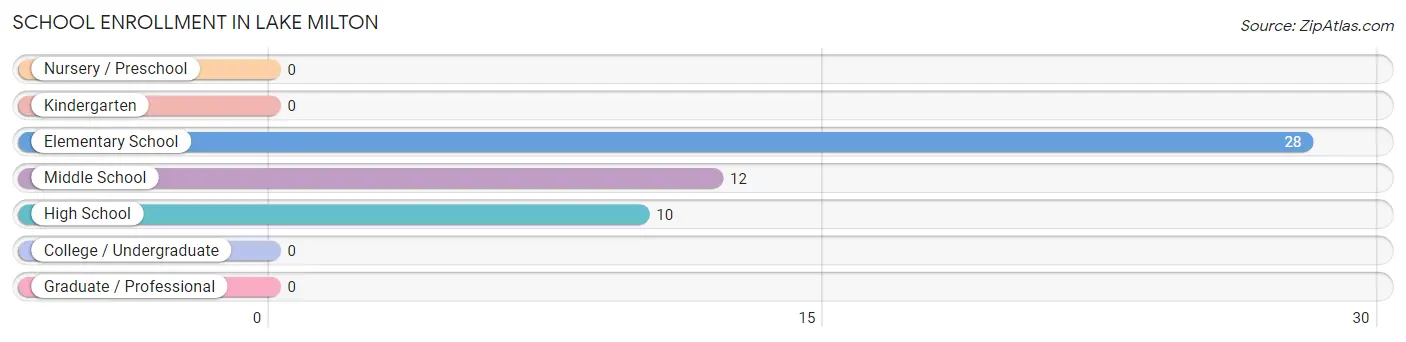
| School Level | # Students | % Students |
| Nursery / Preschool | 0 | 0.0% |
| Kindergarten | 0 | 0.0% |
| Elementary School | 28 | 56.0% |
| Middle School | 12 | 24.0% |
| High School | 10 | 20.0% |
| College / Undergraduate | 0 | 0.0% |
| Graduate / Professional | 0 | 0.0% |
| Total | 50 | 100.0% |
School Enrollment by Age by Funding Source in Lake Milton
Out of a total of 50 students who are enrolled in schools in Lake Milton, 12 (24.0%) attend a private institution, while the remaining 38 (76.0%) are enrolled in public schools. The age group of 5 to 9 year old has the highest likelihood of being enrolled in private schools, with 12 (42.9% in the age bracket) enrolled. Conversely, the age group of 10 to 14 year olds has the lowest likelihood of being enrolled in a private school, with 12 (100.0% in the age bracket) attending a public institution.
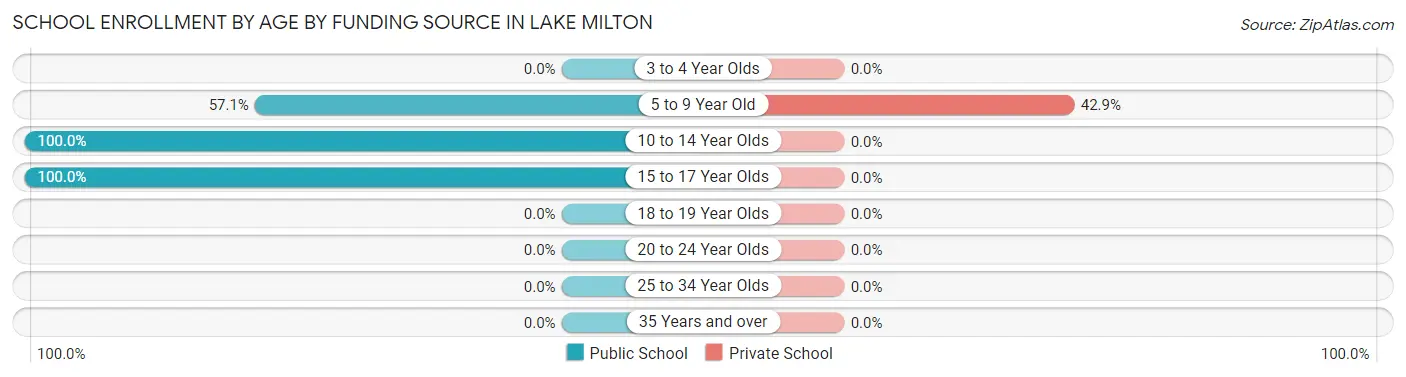
| Age Bracket | Public School | Private School |
| 3 to 4 Year Olds | 0 (0.0%) | 0 (0.0%) |
| 5 to 9 Year Old | 16 (57.1%) | 12 (42.9%) |
| 10 to 14 Year Olds | 12 (100.0%) | 0 (0.0%) |
| 15 to 17 Year Olds | 10 (100.0%) | 0 (0.0%) |
| 18 to 19 Year Olds | 0 (0.0%) | 0 (0.0%) |
| 20 to 24 Year Olds | 0 (0.0%) | 0 (0.0%) |
| 25 to 34 Year Olds | 0 (0.0%) | 0 (0.0%) |
| 35 Years and over | 0 (0.0%) | 0 (0.0%) |
| Total | 38 (76.0%) | 12 (24.0%) |
Educational Attainment by Field of Study in Lake Milton
Science & technology (39 | 31.5%), business (39 | 31.5%), education (26 | 21.0%), arts & humanities (12 | 9.7%), and bio, nature & agricultural (8 | 6.5%) are the most common fields of study among 124 individuals in Lake Milton who have obtained a bachelor's degree or higher.
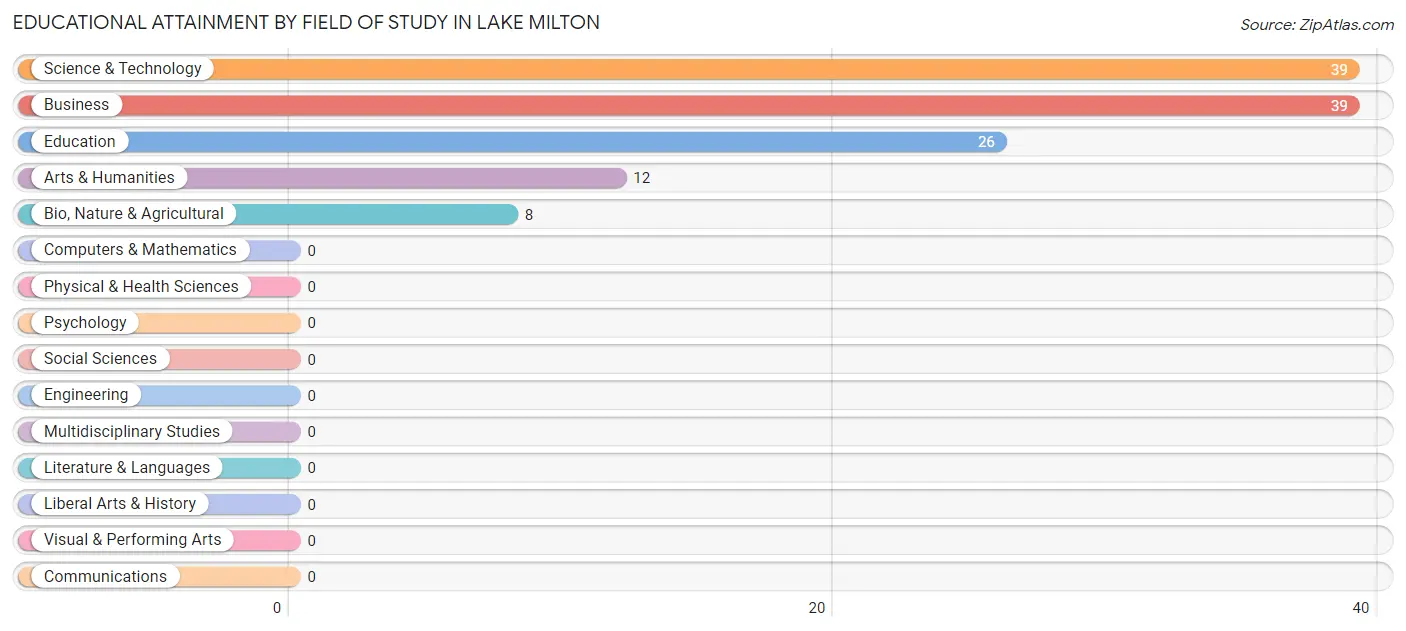
| Field of Study | # Graduates | % Graduates |
| Computers & Mathematics | 0 | 0.0% |
| Bio, Nature & Agricultural | 8 | 6.5% |
| Physical & Health Sciences | 0 | 0.0% |
| Psychology | 0 | 0.0% |
| Social Sciences | 0 | 0.0% |
| Engineering | 0 | 0.0% |
| Multidisciplinary Studies | 0 | 0.0% |
| Science & Technology | 39 | 31.5% |
| Business | 39 | 31.5% |
| Education | 26 | 21.0% |
| Literature & Languages | 0 | 0.0% |
| Liberal Arts & History | 0 | 0.0% |
| Visual & Performing Arts | 0 | 0.0% |
| Communications | 0 | 0.0% |
| Arts & Humanities | 12 | 9.7% |
| Total | 124 | 100.0% |
Transportation & Commute in Lake Milton
Vehicle Availability by Sex in Lake Milton
The most prevalent vehicle ownership categories in Lake Milton are males with 1 vehicle (34, accounting for 29.6%) and females with 1 vehicle (9, making up 42.5%).
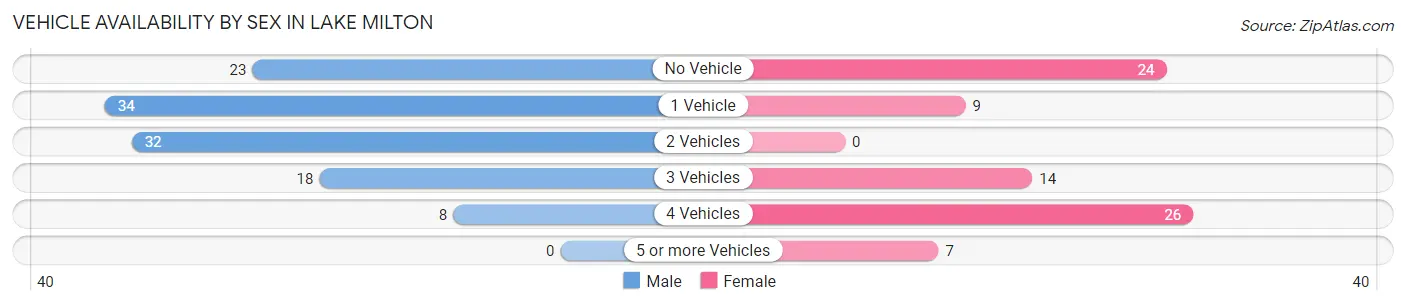
| Vehicles Available | Male | Female |
| No Vehicle | 23 (20.0%) | 24 (30.0%) |
| 1 Vehicle | 34 (29.6%) | 9 (11.3%) |
| 2 Vehicles | 32 (27.8%) | 0 (0.0%) |
| 3 Vehicles | 18 (15.7%) | 14 (17.5%) |
| 4 Vehicles | 8 (7.0%) | 26 (32.5%) |
| 5 or more Vehicles | 0 (0.0%) | 7 (8.7%) |
| Total | 115 (100.0%) | 80 (100.0%) |
Commute Time in Lake Milton
The most frequently occuring commute durations in Lake Milton are 30 to 34 minutes (49 commuters, 30.4%), 10 to 14 minutes (42 commuters, 26.1%), and 20 to 24 minutes (31 commuters, 19.3%).
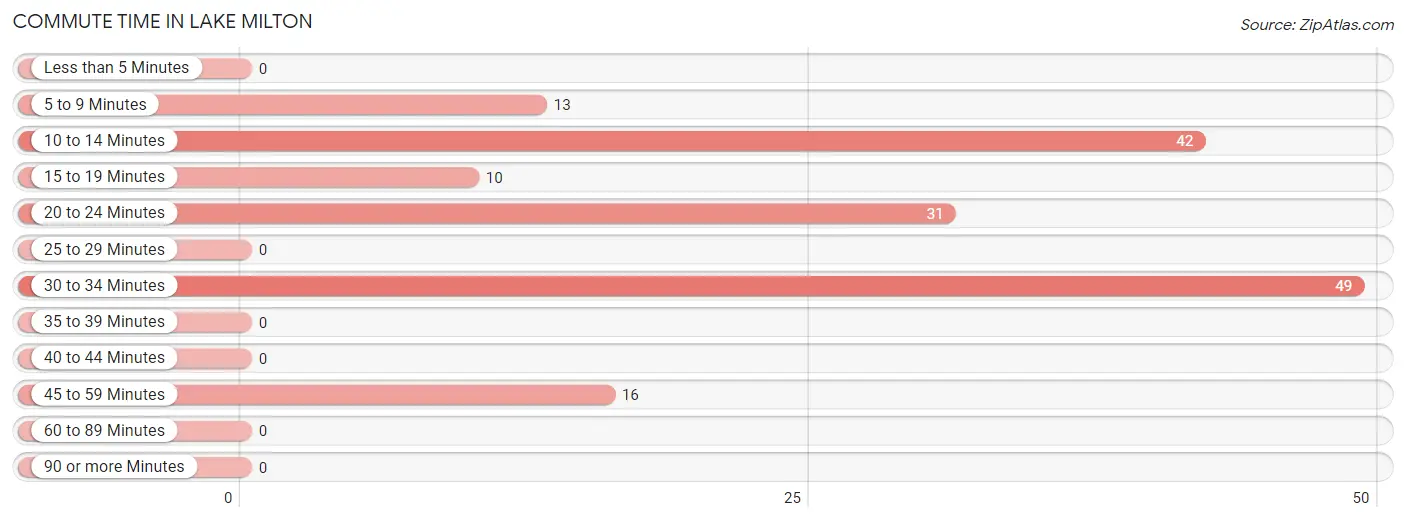
| Commute Time | # Commuters | % Commuters |
| Less than 5 Minutes | 0 | 0.0% |
| 5 to 9 Minutes | 13 | 8.1% |
| 10 to 14 Minutes | 42 | 26.1% |
| 15 to 19 Minutes | 10 | 6.2% |
| 20 to 24 Minutes | 31 | 19.3% |
| 25 to 29 Minutes | 0 | 0.0% |
| 30 to 34 Minutes | 49 | 30.4% |
| 35 to 39 Minutes | 0 | 0.0% |
| 40 to 44 Minutes | 0 | 0.0% |
| 45 to 59 Minutes | 16 | 9.9% |
| 60 to 89 Minutes | 0 | 0.0% |
| 90 or more Minutes | 0 | 0.0% |
Commute Time by Sex in Lake Milton
The most common commute times in Lake Milton are 30 to 34 minutes (26 commuters, 32.1%) for males and 10 to 14 minutes (23 commuters, 28.7%) for females.
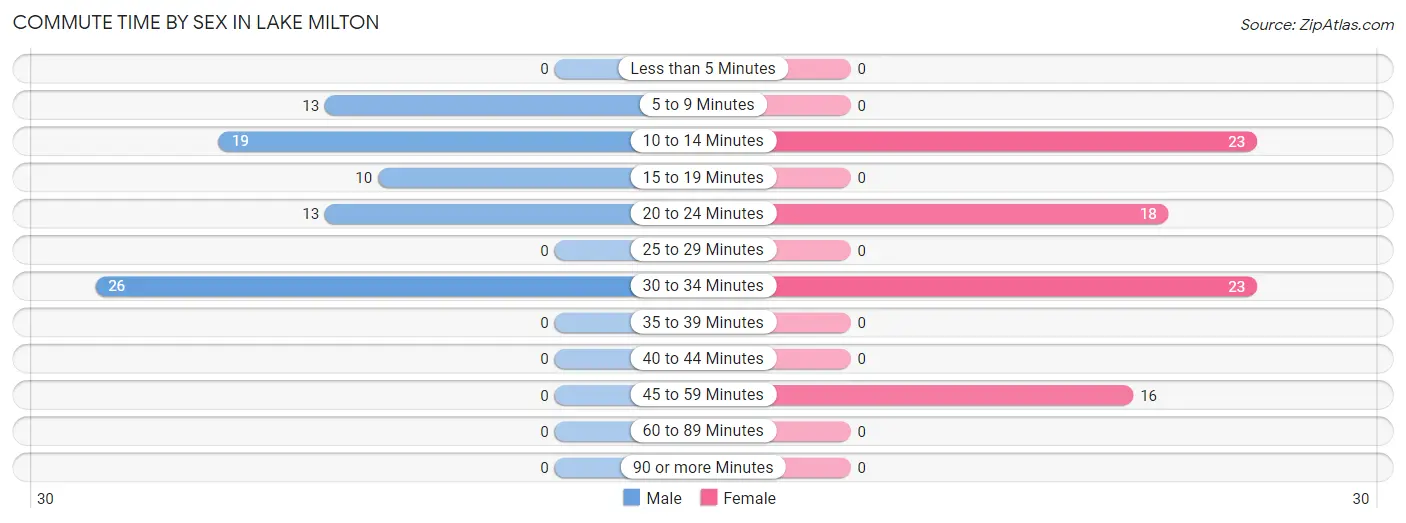
| Commute Time | Male | Female |
| Less than 5 Minutes | 0 (0.0%) | 0 (0.0%) |
| 5 to 9 Minutes | 13 (16.1%) | 0 (0.0%) |
| 10 to 14 Minutes | 19 (23.5%) | 23 (28.7%) |
| 15 to 19 Minutes | 10 (12.3%) | 0 (0.0%) |
| 20 to 24 Minutes | 13 (16.1%) | 18 (22.5%) |
| 25 to 29 Minutes | 0 (0.0%) | 0 (0.0%) |
| 30 to 34 Minutes | 26 (32.1%) | 23 (28.7%) |
| 35 to 39 Minutes | 0 (0.0%) | 0 (0.0%) |
| 40 to 44 Minutes | 0 (0.0%) | 0 (0.0%) |
| 45 to 59 Minutes | 0 (0.0%) | 16 (20.0%) |
| 60 to 89 Minutes | 0 (0.0%) | 0 (0.0%) |
| 90 or more Minutes | 0 (0.0%) | 0 (0.0%) |
Time of Departure to Work by Sex in Lake Milton
The most frequent times of departure to work in Lake Milton are 6:00 AM to 6:29 AM (26, 32.1%) for males and 7:30 AM to 7:59 AM (45, 56.2%) for females.
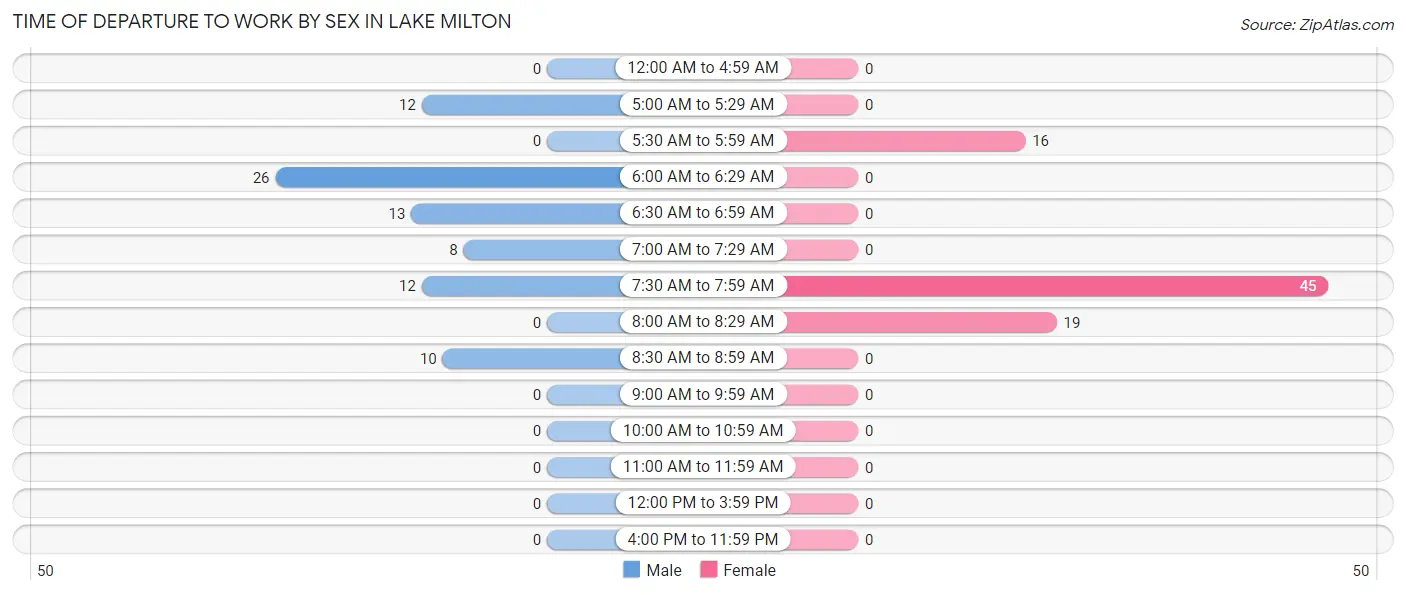
| Time of Departure | Male | Female |
| 12:00 AM to 4:59 AM | 0 (0.0%) | 0 (0.0%) |
| 5:00 AM to 5:29 AM | 12 (14.8%) | 0 (0.0%) |
| 5:30 AM to 5:59 AM | 0 (0.0%) | 16 (20.0%) |
| 6:00 AM to 6:29 AM | 26 (32.1%) | 0 (0.0%) |
| 6:30 AM to 6:59 AM | 13 (16.1%) | 0 (0.0%) |
| 7:00 AM to 7:29 AM | 8 (9.9%) | 0 (0.0%) |
| 7:30 AM to 7:59 AM | 12 (14.8%) | 45 (56.2%) |
| 8:00 AM to 8:29 AM | 0 (0.0%) | 19 (23.7%) |
| 8:30 AM to 8:59 AM | 10 (12.3%) | 0 (0.0%) |
| 9:00 AM to 9:59 AM | 0 (0.0%) | 0 (0.0%) |
| 10:00 AM to 10:59 AM | 0 (0.0%) | 0 (0.0%) |
| 11:00 AM to 11:59 AM | 0 (0.0%) | 0 (0.0%) |
| 12:00 PM to 3:59 PM | 0 (0.0%) | 0 (0.0%) |
| 4:00 PM to 11:59 PM | 0 (0.0%) | 0 (0.0%) |
| Total | 81 (100.0%) | 80 (100.0%) |
Housing Occupancy in Lake Milton
Occupancy by Ownership in Lake Milton
Of the total 208 dwellings in Lake Milton, owner-occupied units account for 174 (83.7%), while renter-occupied units make up 34 (16.4%).
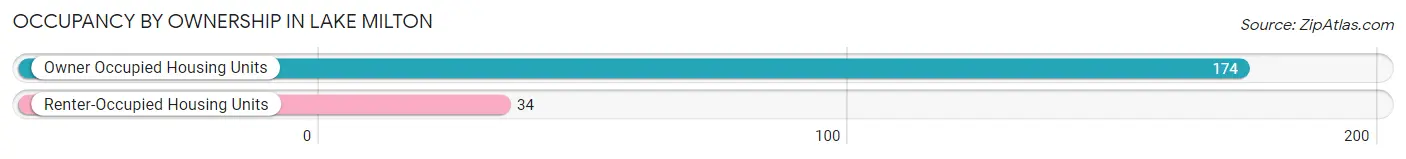
| Occupancy | # Housing Units | % Housing Units |
| Owner Occupied Housing Units | 174 | 83.7% |
| Renter-Occupied Housing Units | 34 | 16.4% |
| Total Occupied Housing Units | 208 | 100.0% |
Occupancy by Household Size in Lake Milton
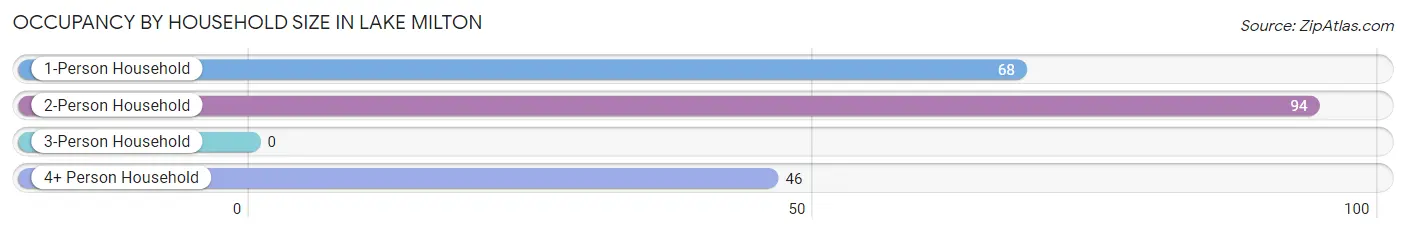
| Household Size | # Housing Units | % Housing Units |
| 1-Person Household | 68 | 32.7% |
| 2-Person Household | 94 | 45.2% |
| 3-Person Household | 0 | 0.0% |
| 4+ Person Household | 46 | 22.1% |
| Total Housing Units | 208 | 100.0% |
Occupancy by Ownership by Household Size in Lake Milton
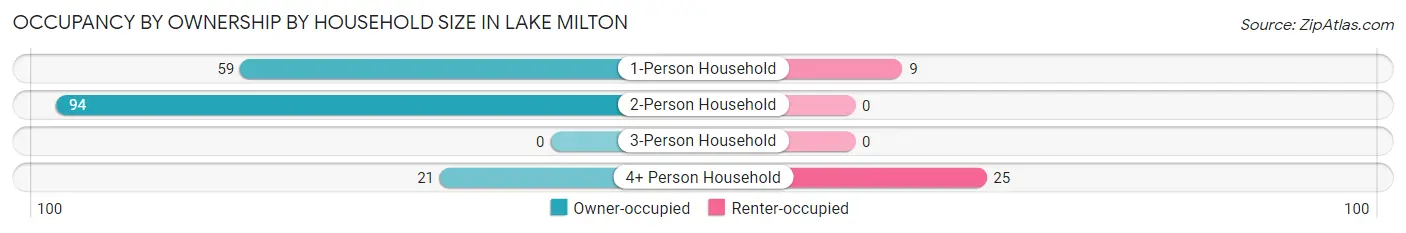
| Household Size | Owner-occupied | Renter-occupied |
| 1-Person Household | 59 (86.8%) | 9 (13.2%) |
| 2-Person Household | 94 (100.0%) | 0 (0.0%) |
| 3-Person Household | 0 (0.0%) | 0 (0.0%) |
| 4+ Person Household | 21 (45.7%) | 25 (54.3%) |
| Total Housing Units | 174 (83.7%) | 34 (16.4%) |
Occupancy by Educational Attainment in Lake Milton
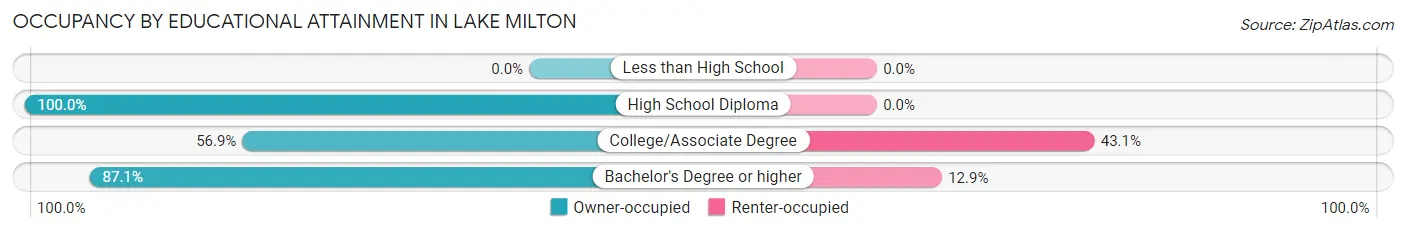
| Household Size | Owner-occupied | Renter-occupied |
| Less than High School | 0 (0.0%) | 0 (0.0%) |
| High School Diploma | 64 (100.0%) | 0 (0.0%) |
| College/Associate Degree | 29 (56.9%) | 22 (43.1%) |
| Bachelor's Degree or higher | 81 (87.1%) | 12 (12.9%) |
Occupancy by Age of Householder in Lake Milton
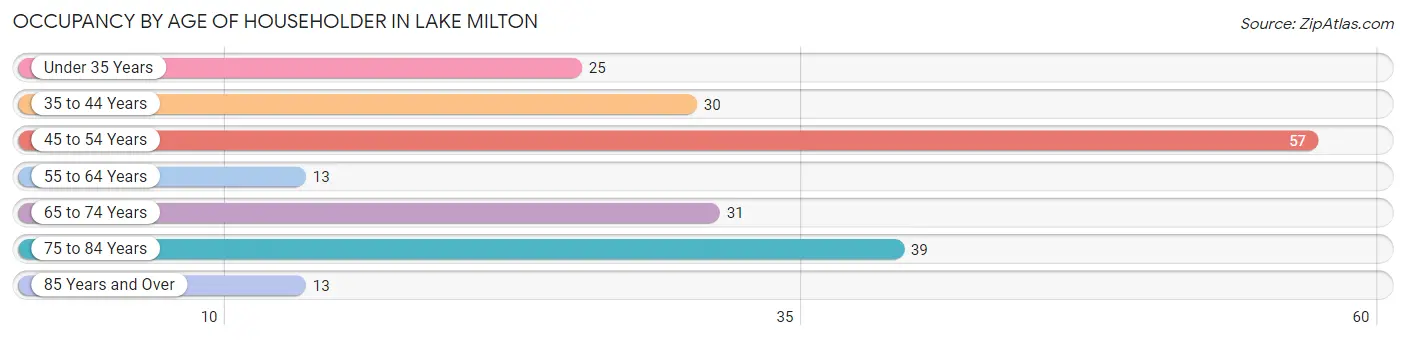
| Age Bracket | # Households | % Households |
| Under 35 Years | 25 | 12.0% |
| 35 to 44 Years | 30 | 14.4% |
| 45 to 54 Years | 57 | 27.4% |
| 55 to 64 Years | 13 | 6.2% |
| 65 to 74 Years | 31 | 14.9% |
| 75 to 84 Years | 39 | 18.8% |
| 85 Years and Over | 13 | 6.2% |
| Total | 208 | 100.0% |
Housing Finances in Lake Milton
Median Income by Occupancy in Lake Milton
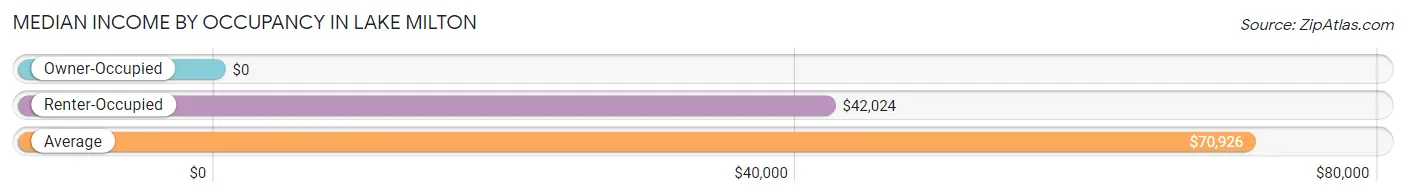
| Occupancy Type | # Households | Median Income |
| Owner-Occupied | 174 (83.7%) | $0 |
| Renter-Occupied | 34 (16.4%) | $42,024 |
| Average | 208 (100.0%) | $70,926 |
Occupancy by Householder Income Bracket in Lake Milton
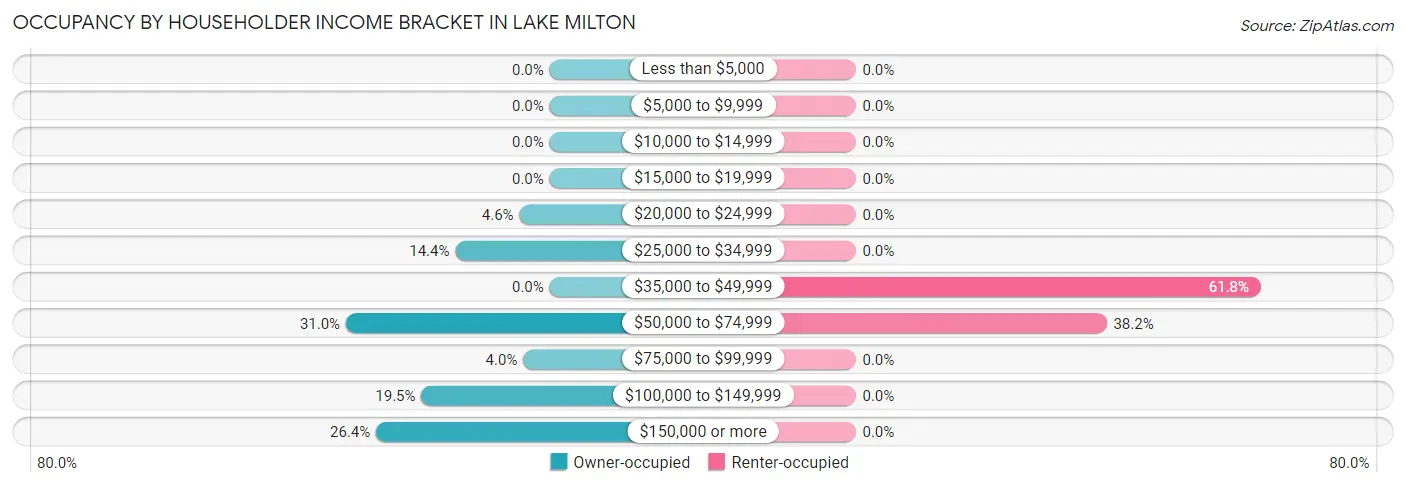
| Income Bracket | Owner-occupied | Renter-occupied |
| Less than $5,000 | 0 (0.0%) | 0 (0.0%) |
| $5,000 to $9,999 | 0 (0.0%) | 0 (0.0%) |
| $10,000 to $14,999 | 0 (0.0%) | 0 (0.0%) |
| $15,000 to $19,999 | 0 (0.0%) | 0 (0.0%) |
| $20,000 to $24,999 | 8 (4.6%) | 0 (0.0%) |
| $25,000 to $34,999 | 25 (14.4%) | 0 (0.0%) |
| $35,000 to $49,999 | 0 (0.0%) | 21 (61.8%) |
| $50,000 to $74,999 | 54 (31.0%) | 13 (38.2%) |
| $75,000 to $99,999 | 7 (4.0%) | 0 (0.0%) |
| $100,000 to $149,999 | 34 (19.5%) | 0 (0.0%) |
| $150,000 or more | 46 (26.4%) | 0 (0.0%) |
| Total | 174 (100.0%) | 34 (100.0%) |
Monthly Housing Cost Tiers in Lake Milton
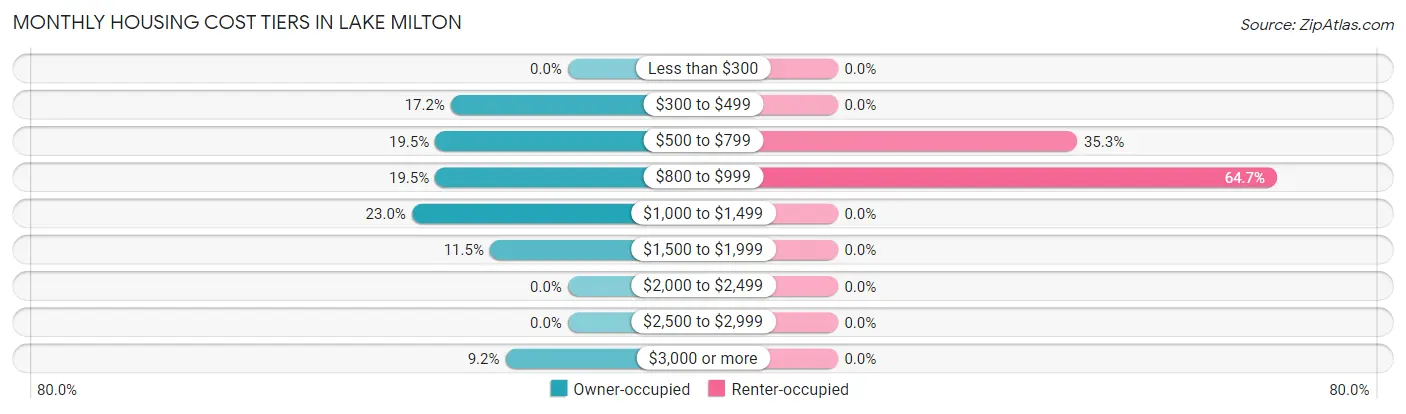
| Monthly Cost | Owner-occupied | Renter-occupied |
| Less than $300 | 0 (0.0%) | 0 (0.0%) |
| $300 to $499 | 30 (17.2%) | 0 (0.0%) |
| $500 to $799 | 34 (19.5%) | 12 (35.3%) |
| $800 to $999 | 34 (19.5%) | 22 (64.7%) |
| $1,000 to $1,499 | 40 (23.0%) | 0 (0.0%) |
| $1,500 to $1,999 | 20 (11.5%) | 0 (0.0%) |
| $2,000 to $2,499 | 0 (0.0%) | 0 (0.0%) |
| $2,500 to $2,999 | 0 (0.0%) | 0 (0.0%) |
| $3,000 or more | 16 (9.2%) | 0 (0.0%) |
| Total | 174 (100.0%) | 34 (100.0%) |
Physical Housing Characteristics in Lake Milton
Housing Structures in Lake Milton
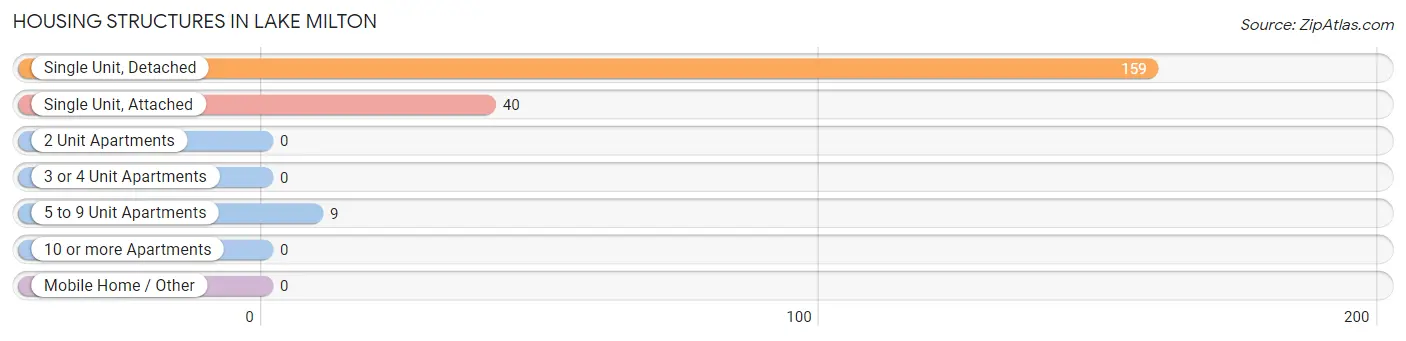
| Structure Type | # Housing Units | % Housing Units |
| Single Unit, Detached | 159 | 76.4% |
| Single Unit, Attached | 40 | 19.2% |
| 2 Unit Apartments | 0 | 0.0% |
| 3 or 4 Unit Apartments | 0 | 0.0% |
| 5 to 9 Unit Apartments | 9 | 4.3% |
| 10 or more Apartments | 0 | 0.0% |
| Mobile Home / Other | 0 | 0.0% |
| Total | 208 | 100.0% |
Housing Structures by Occupancy in Lake Milton
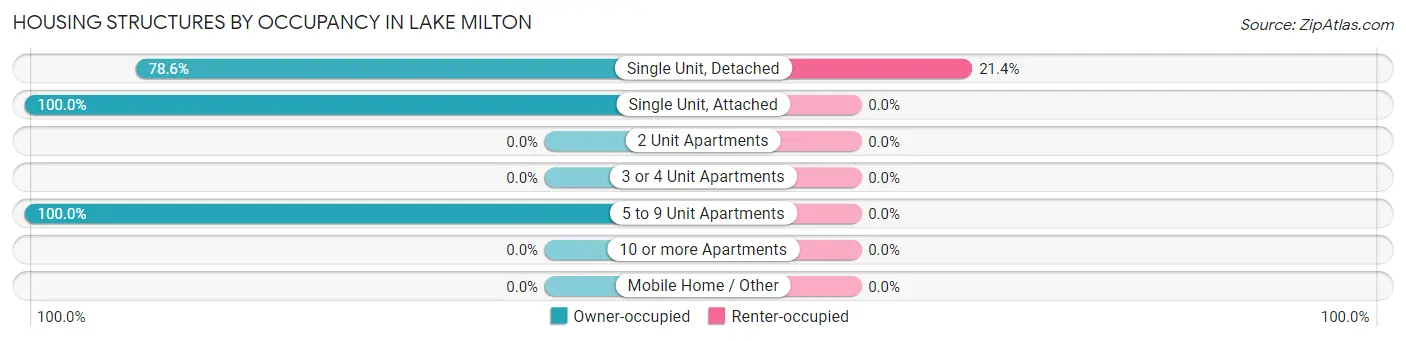
| Structure Type | Owner-occupied | Renter-occupied |
| Single Unit, Detached | 125 (78.6%) | 34 (21.4%) |
| Single Unit, Attached | 40 (100.0%) | 0 (0.0%) |
| 2 Unit Apartments | 0 (0.0%) | 0 (0.0%) |
| 3 or 4 Unit Apartments | 0 (0.0%) | 0 (0.0%) |
| 5 to 9 Unit Apartments | 9 (100.0%) | 0 (0.0%) |
| 10 or more Apartments | 0 (0.0%) | 0 (0.0%) |
| Mobile Home / Other | 0 (0.0%) | 0 (0.0%) |
| Total | 174 (83.7%) | 34 (16.4%) |
Housing Structures by Number of Rooms in Lake Milton
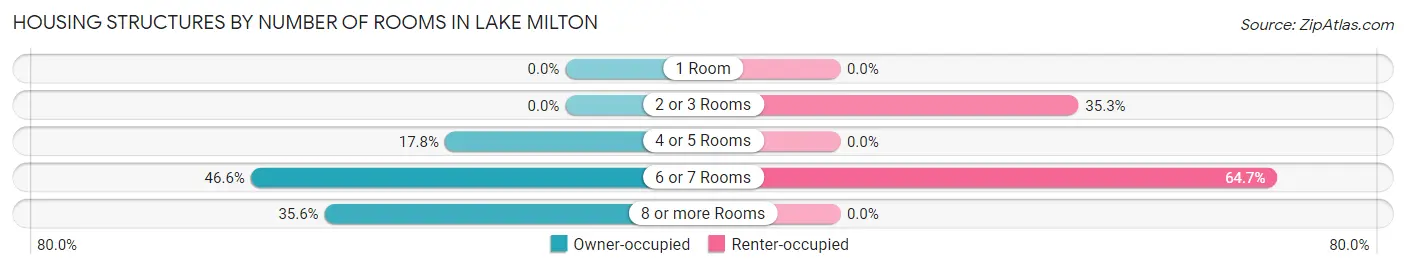
| Number of Rooms | Owner-occupied | Renter-occupied |
| 1 Room | 0 (0.0%) | 0 (0.0%) |
| 2 or 3 Rooms | 0 (0.0%) | 12 (35.3%) |
| 4 or 5 Rooms | 31 (17.8%) | 0 (0.0%) |
| 6 or 7 Rooms | 81 (46.6%) | 22 (64.7%) |
| 8 or more Rooms | 62 (35.6%) | 0 (0.0%) |
| Total | 174 (100.0%) | 34 (100.0%) |
Housing Structure by Heating Type in Lake Milton
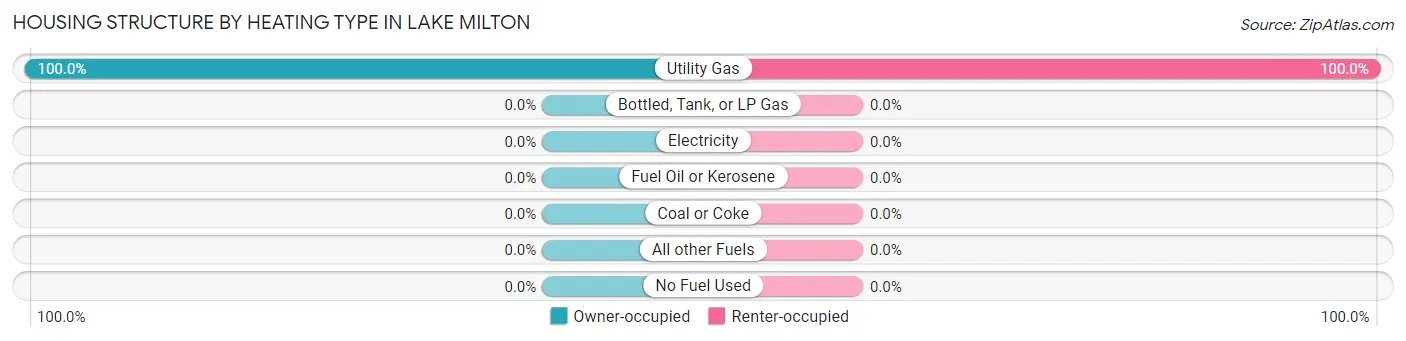
| Heating Type | Owner-occupied | Renter-occupied |
| Utility Gas | 174 (100.0%) | 34 (100.0%) |
| Bottled, Tank, or LP Gas | 0 (0.0%) | 0 (0.0%) |
| Electricity | 0 (0.0%) | 0 (0.0%) |
| Fuel Oil or Kerosene | 0 (0.0%) | 0 (0.0%) |
| Coal or Coke | 0 (0.0%) | 0 (0.0%) |
| All other Fuels | 0 (0.0%) | 0 (0.0%) |
| No Fuel Used | 0 (0.0%) | 0 (0.0%) |
| Total | 174 (100.0%) | 34 (100.0%) |
Household Vehicle Usage in Lake Milton
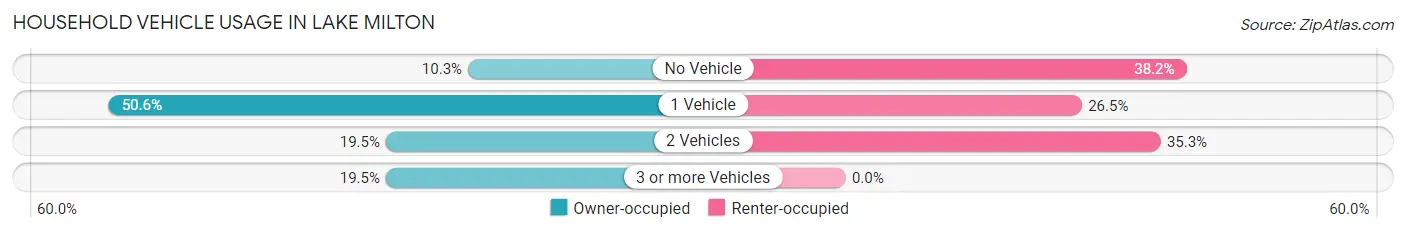
| Vehicles per Household | Owner-occupied | Renter-occupied |
| No Vehicle | 18 (10.3%) | 13 (38.2%) |
| 1 Vehicle | 88 (50.6%) | 9 (26.5%) |
| 2 Vehicles | 34 (19.5%) | 12 (35.3%) |
| 3 or more Vehicles | 34 (19.5%) | 0 (0.0%) |
| Total | 174 (100.0%) | 34 (100.0%) |
Real Estate & Mortgages in Lake Milton
Real Estate and Mortgage Overview in Lake Milton
| Characteristic | Without Mortgage | With Mortgage |
| Housing Units | 96 | 78 |
| Median Property Value | $400,000 | $323,100 |
| Median Household Income | $130,221 | $29 |
| Monthly Housing Costs | $713 | $16 |
| Real Estate Taxes | $3,047 | $0 |
Property Value by Mortgage Status in Lake Milton
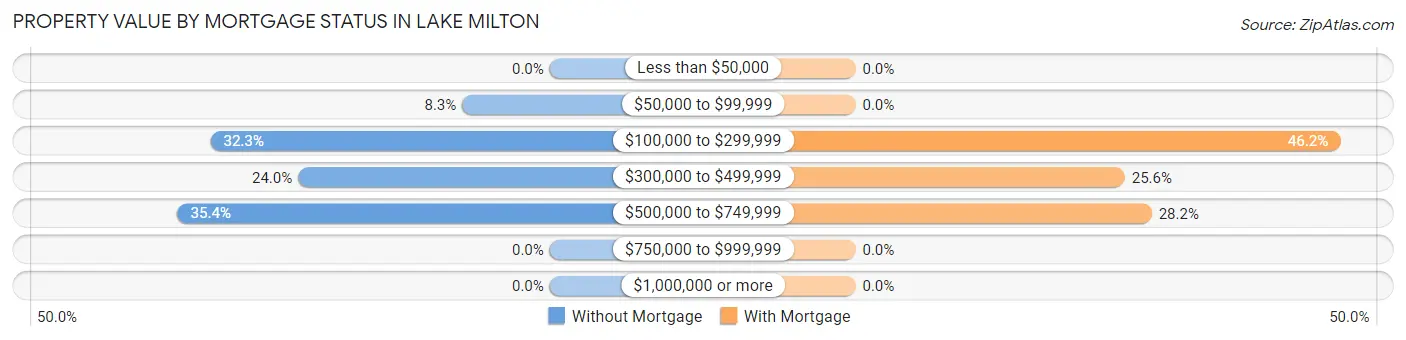
| Property Value | Without Mortgage | With Mortgage |
| Less than $50,000 | 0 (0.0%) | 0 (0.0%) |
| $50,000 to $99,999 | 8 (8.3%) | 0 (0.0%) |
| $100,000 to $299,999 | 31 (32.3%) | 36 (46.2%) |
| $300,000 to $499,999 | 23 (24.0%) | 20 (25.6%) |
| $500,000 to $749,999 | 34 (35.4%) | 22 (28.2%) |
| $750,000 to $999,999 | 0 (0.0%) | 0 (0.0%) |
| $1,000,000 or more | 0 (0.0%) | 0 (0.0%) |
| Total | 96 (100.0%) | 78 (100.0%) |
Household Income by Mortgage Status in Lake Milton
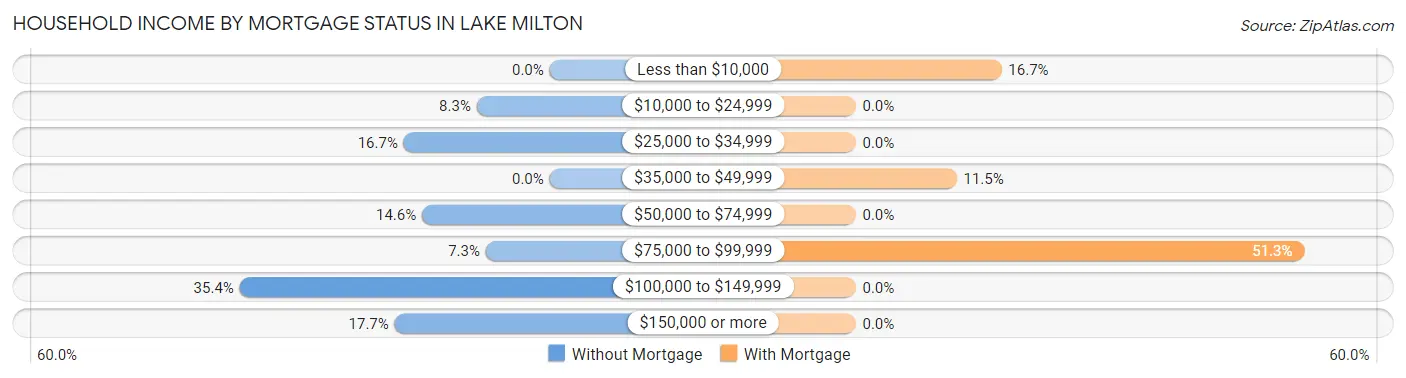
| Household Income | Without Mortgage | With Mortgage |
| Less than $10,000 | 0 (0.0%) | 13 (16.7%) |
| $10,000 to $24,999 | 8 (8.3%) | 0 (0.0%) |
| $25,000 to $34,999 | 16 (16.7%) | 0 (0.0%) |
| $35,000 to $49,999 | 0 (0.0%) | 9 (11.5%) |
| $50,000 to $74,999 | 14 (14.6%) | 0 (0.0%) |
| $75,000 to $99,999 | 7 (7.3%) | 40 (51.3%) |
| $100,000 to $149,999 | 34 (35.4%) | 0 (0.0%) |
| $150,000 or more | 17 (17.7%) | 0 (0.0%) |
| Total | 96 (100.0%) | 78 (100.0%) |
Property Value to Household Income Ratio in Lake Milton
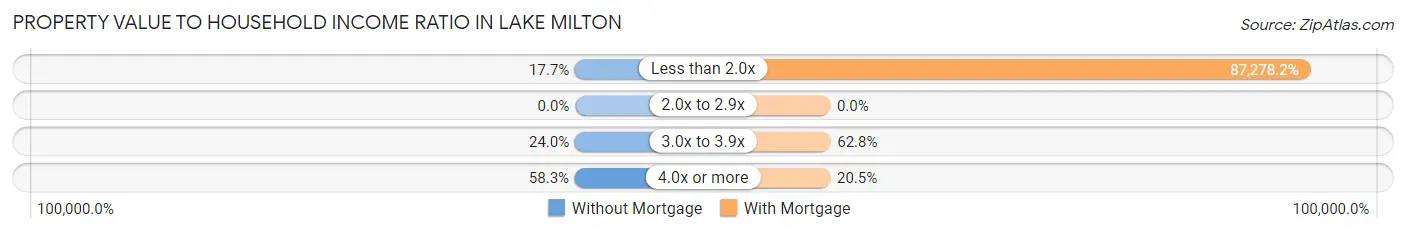
| Value-to-Income Ratio | Without Mortgage | With Mortgage |
| Less than 2.0x | 17 (17.7%) | 68,077 (87,278.2%) |
| 2.0x to 2.9x | 0 (0.0%) | 0 (0.0%) |
| 3.0x to 3.9x | 23 (24.0%) | 49 (62.8%) |
| 4.0x or more | 56 (58.3%) | 16 (20.5%) |
| Total | 96 (100.0%) | 78 (100.0%) |
Real Estate Taxes by Mortgage Status in Lake Milton
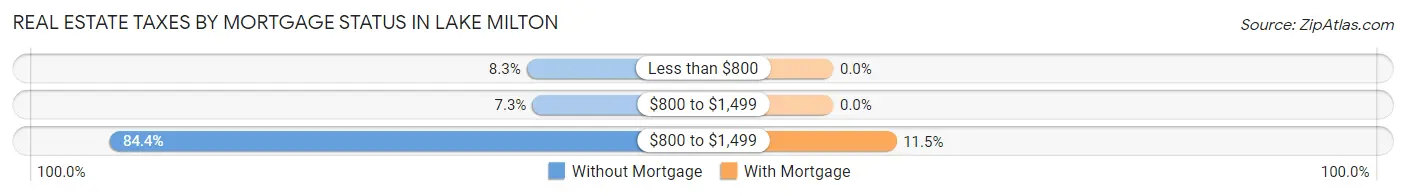
| Property Taxes | Without Mortgage | With Mortgage |
| Less than $800 | 8 (8.3%) | 0 (0.0%) |
| $800 to $1,499 | 7 (7.3%) | 0 (0.0%) |
| $800 to $1,499 | 81 (84.4%) | 9 (11.5%) |
| Total | 96 (100.0%) | 78 (100.0%) |
Health & Disability in Lake Milton
Health Insurance Coverage by Age in Lake Milton
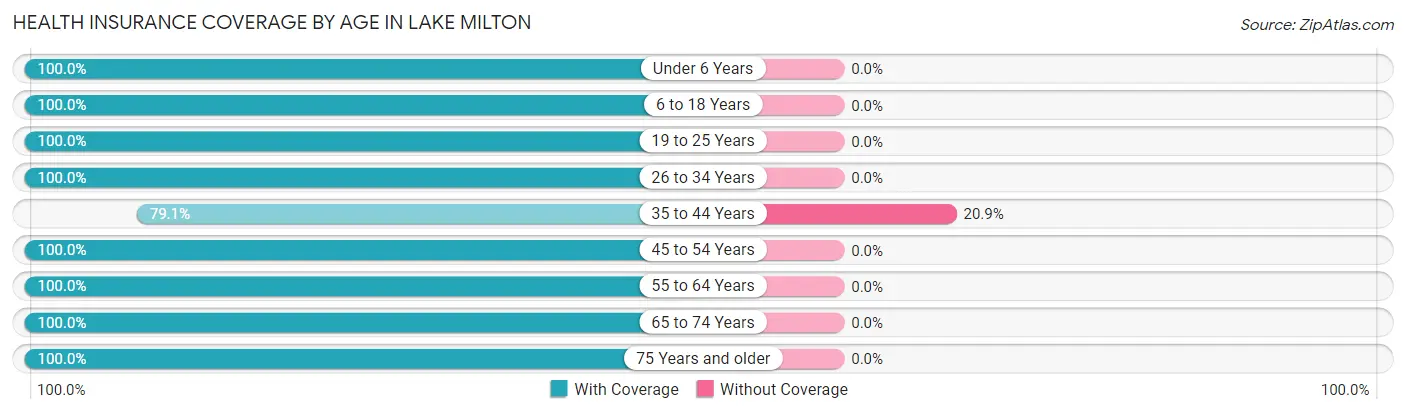
| Age Bracket | With Coverage | Without Coverage |
| Under 6 Years | 63 (100.0%) | 0 (0.0%) |
| 6 to 18 Years | 50 (100.0%) | 0 (0.0%) |
| 19 to 25 Years | 8 (100.0%) | 0 (0.0%) |
| 26 to 34 Years | 49 (100.0%) | 0 (0.0%) |
| 35 to 44 Years | 34 (79.1%) | 9 (20.9%) |
| 45 to 54 Years | 76 (100.0%) | 0 (0.0%) |
| 55 to 64 Years | 28 (100.0%) | 0 (0.0%) |
| 65 to 74 Years | 57 (100.0%) | 0 (0.0%) |
| 75 Years and older | 95 (100.0%) | 0 (0.0%) |
| Total | 460 (98.1%) | 9 (1.9%) |
Health Insurance Coverage by Citizenship Status in Lake Milton
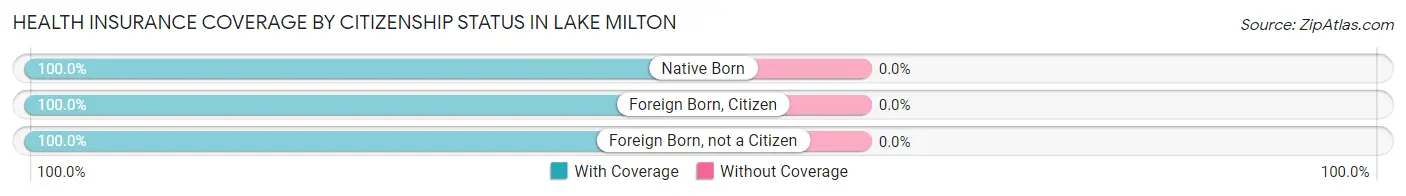
| Citizenship Status | With Coverage | Without Coverage |
| Native Born | 63 (100.0%) | 0 (0.0%) |
| Foreign Born, Citizen | 50 (100.0%) | 0 (0.0%) |
| Foreign Born, not a Citizen | 8 (100.0%) | 0 (0.0%) |
Health Insurance Coverage by Household Income in Lake Milton
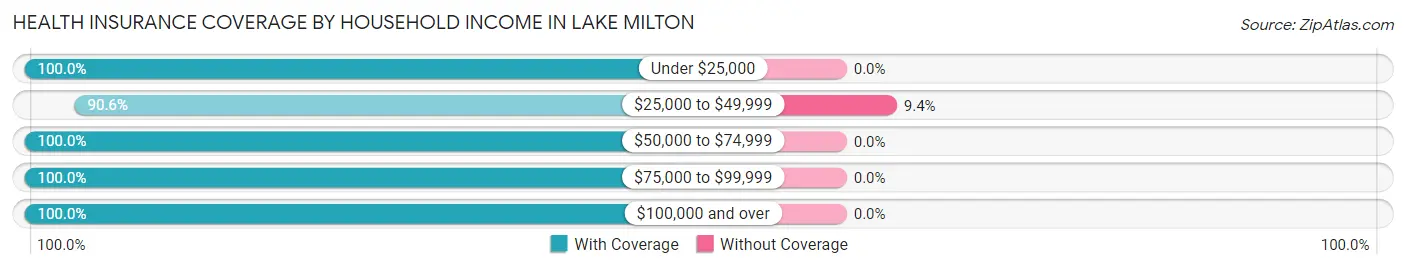
| Household Income | With Coverage | Without Coverage |
| Under $25,000 | 8 (100.0%) | 0 (0.0%) |
| $25,000 to $49,999 | 87 (90.6%) | 9 (9.4%) |
| $50,000 to $74,999 | 160 (100.0%) | 0 (0.0%) |
| $75,000 to $99,999 | 14 (100.0%) | 0 (0.0%) |
| $100,000 and over | 191 (100.0%) | 0 (0.0%) |
Public vs Private Health Insurance Coverage by Age in Lake Milton
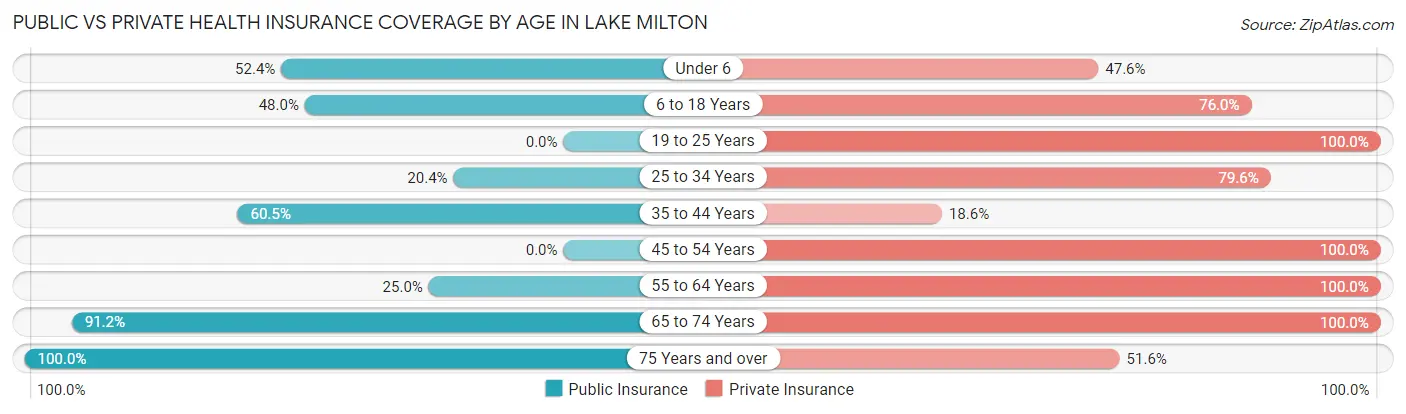
| Age Bracket | Public Insurance | Private Insurance |
| Under 6 | 33 (52.4%) | 30 (47.6%) |
| 6 to 18 Years | 24 (48.0%) | 38 (76.0%) |
| 19 to 25 Years | 0 (0.0%) | 8 (100.0%) |
| 25 to 34 Years | 10 (20.4%) | 39 (79.6%) |
| 35 to 44 Years | 26 (60.5%) | 8 (18.6%) |
| 45 to 54 Years | 0 (0.0%) | 76 (100.0%) |
| 55 to 64 Years | 7 (25.0%) | 28 (100.0%) |
| 65 to 74 Years | 52 (91.2%) | 57 (100.0%) |
| 75 Years and over | 95 (100.0%) | 49 (51.6%) |
| Total | 247 (52.7%) | 333 (71.0%) |
Disability Status by Sex by Age in Lake Milton
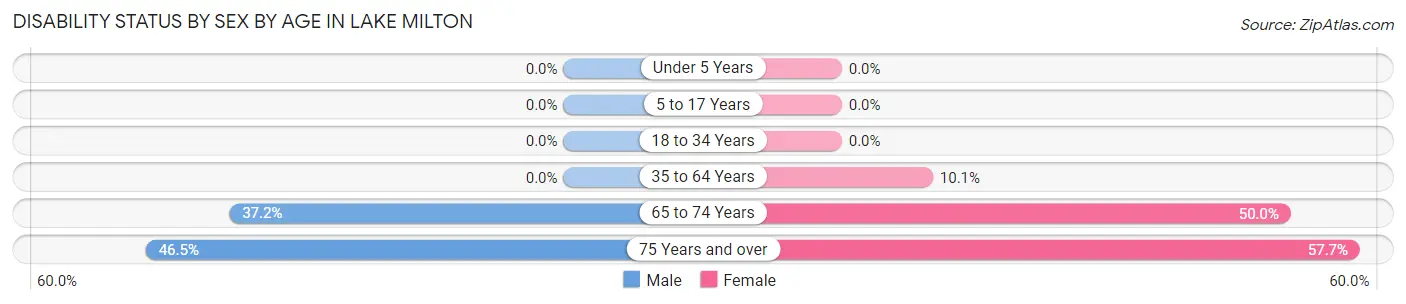
| Age Bracket | Male | Female |
| Under 5 Years | 0 (0.0%) | 0 (0.0%) |
| 5 to 17 Years | 0 (0.0%) | 0 (0.0%) |
| 18 to 34 Years | 0 (0.0%) | 0 (0.0%) |
| 35 to 64 Years | 0 (0.0%) | 7 (10.1%) |
| 65 to 74 Years | 16 (37.2%) | 7 (50.0%) |
| 75 Years and over | 20 (46.5%) | 30 (57.7%) |
Disability Class by Sex by Age in Lake Milton
Disability Class: Hearing Difficulty
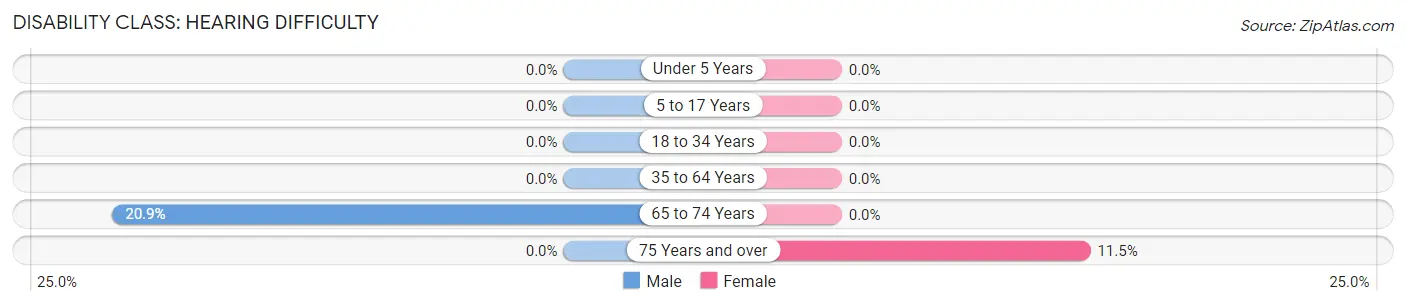
| Age Bracket | Male | Female |
| Under 5 Years | 0 (0.0%) | 0 (0.0%) |
| 5 to 17 Years | 0 (0.0%) | 0 (0.0%) |
| 18 to 34 Years | 0 (0.0%) | 0 (0.0%) |
| 35 to 64 Years | 0 (0.0%) | 0 (0.0%) |
| 65 to 74 Years | 9 (20.9%) | 0 (0.0%) |
| 75 Years and over | 0 (0.0%) | 6 (11.5%) |
Disability Class: Vision Difficulty
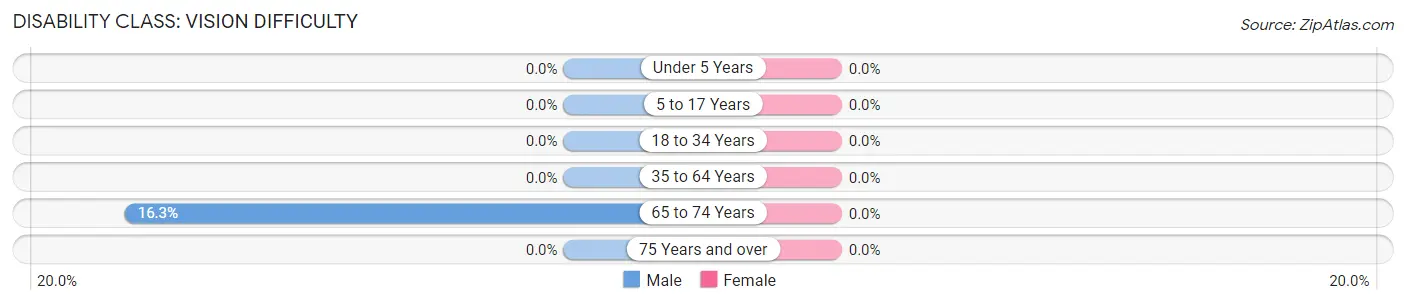
| Age Bracket | Male | Female |
| Under 5 Years | 0 (0.0%) | 0 (0.0%) |
| 5 to 17 Years | 0 (0.0%) | 0 (0.0%) |
| 18 to 34 Years | 0 (0.0%) | 0 (0.0%) |
| 35 to 64 Years | 0 (0.0%) | 0 (0.0%) |
| 65 to 74 Years | 7 (16.3%) | 0 (0.0%) |
| 75 Years and over | 0 (0.0%) | 0 (0.0%) |
Disability Class: Cognitive Difficulty
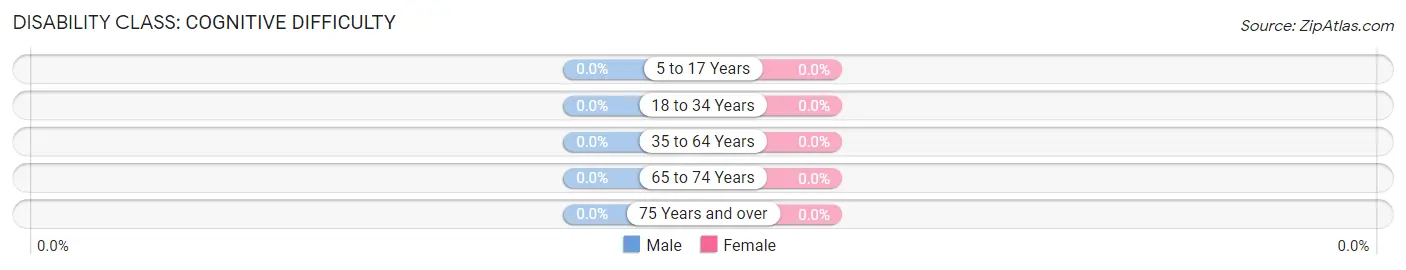
| Age Bracket | Male | Female |
| 5 to 17 Years | 0 (0.0%) | 0 (0.0%) |
| 18 to 34 Years | 0 (0.0%) | 0 (0.0%) |
| 35 to 64 Years | 0 (0.0%) | 0 (0.0%) |
| 65 to 74 Years | 0 (0.0%) | 0 (0.0%) |
| 75 Years and over | 0 (0.0%) | 0 (0.0%) |
Disability Class: Ambulatory Difficulty
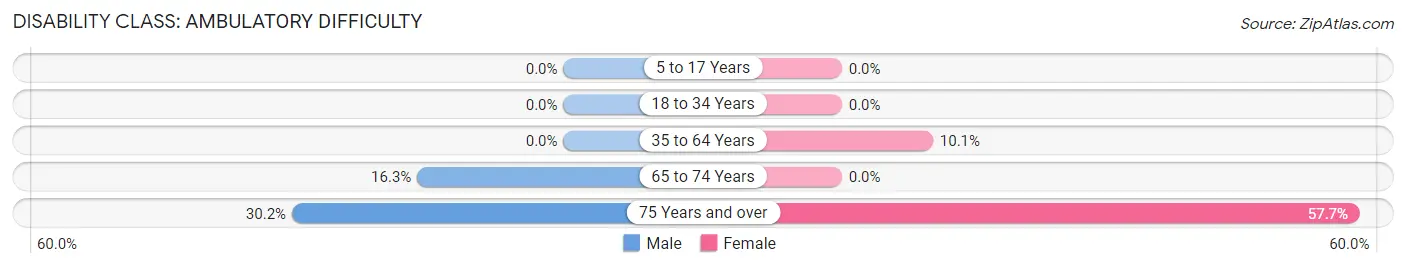
| Age Bracket | Male | Female |
| 5 to 17 Years | 0 (0.0%) | 0 (0.0%) |
| 18 to 34 Years | 0 (0.0%) | 0 (0.0%) |
| 35 to 64 Years | 0 (0.0%) | 7 (10.1%) |
| 65 to 74 Years | 7 (16.3%) | 0 (0.0%) |
| 75 Years and over | 13 (30.2%) | 30 (57.7%) |
Disability Class: Self-Care Difficulty
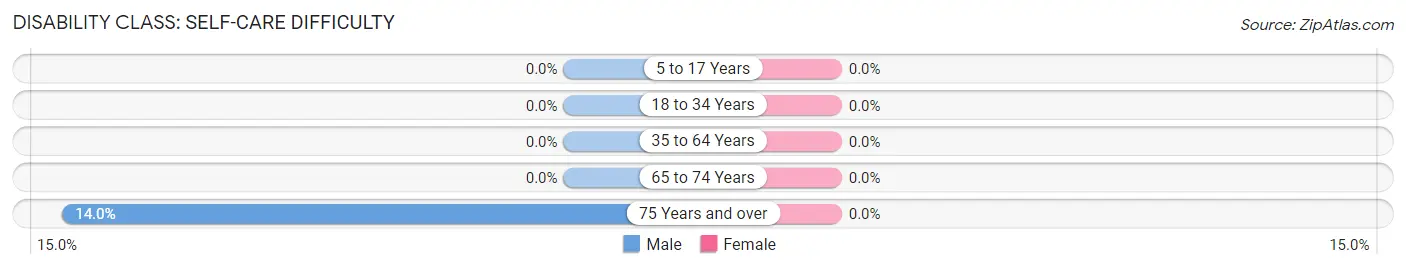
| Age Bracket | Male | Female |
| 5 to 17 Years | 0 (0.0%) | 0 (0.0%) |
| 18 to 34 Years | 0 (0.0%) | 0 (0.0%) |
| 35 to 64 Years | 0 (0.0%) | 0 (0.0%) |
| 65 to 74 Years | 0 (0.0%) | 0 (0.0%) |
| 75 Years and over | 6 (14.0%) | 0 (0.0%) |
Technology Access in Lake Milton
Computing Device Access in Lake Milton
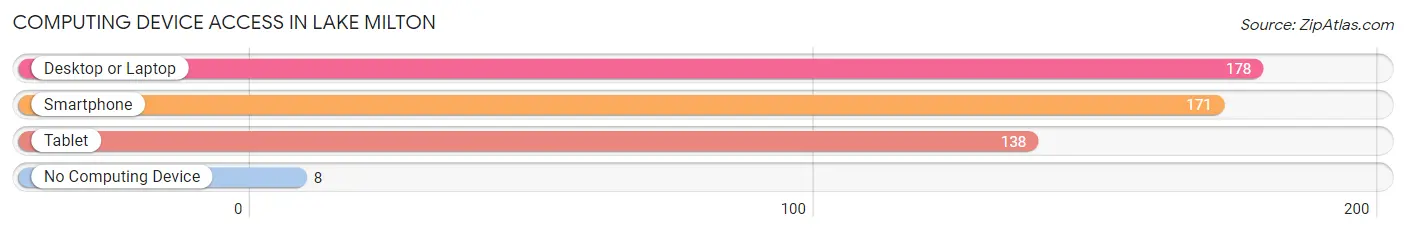
| Device Type | # Households | % Households |
| Desktop or Laptop | 178 | 85.6% |
| Smartphone | 171 | 82.2% |
| Tablet | 138 | 66.3% |
| No Computing Device | 8 | 3.8% |
| Total | 208 | 100.0% |
Internet Access in Lake Milton
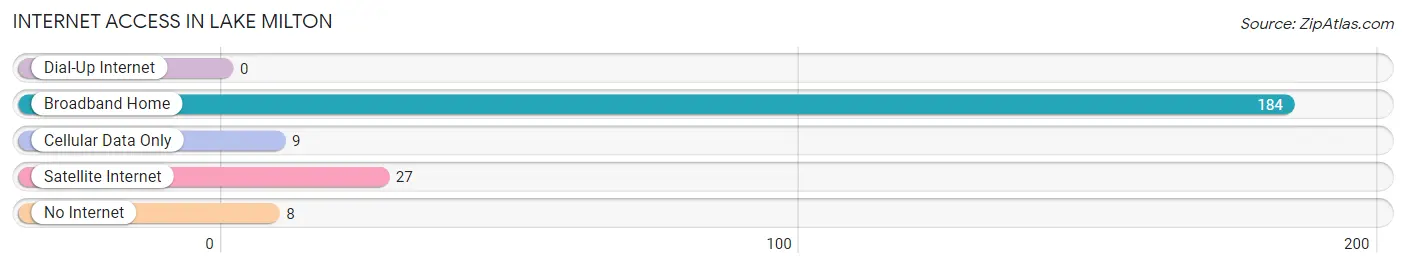
| Internet Type | # Households | % Households |
| Dial-Up Internet | 0 | 0.0% |
| Broadband Home | 184 | 88.5% |
| Cellular Data Only | 9 | 4.3% |
| Satellite Internet | 27 | 13.0% |
| No Internet | 8 | 3.8% |
| Total | 208 | 100.0% |
Lake Milton Summary
History
Lake Milton is a village located in Mahoning County, Ohio. It is situated on the western shore of Lake Milton, a reservoir created by the damming of the Mahoning River. The village was founded in 1806 and was originally known as Milton. The village was renamed Lake Milton in 1875 when the lake was created.
The area around Lake Milton was first settled by Europeans in the late 1700s. The first settlers were mostly farmers and the area was known for its fertile soil. The village of Milton was founded in 1806 and was named after the Milton family, who were among the first settlers in the area.
The village grew slowly over the next few decades, but it was not until the late 1800s that the village began to experience significant growth. In 1875, the Mahoning River was dammed to create Lake Milton, which provided the village with a new source of water and recreation. The lake also provided the village with a new source of income, as it became a popular destination for fishing and boating.
The village continued to grow throughout the late 1800s and early 1900s. In the 1920s, the village was incorporated as a village and the population grew to over 1,000 people. The village also experienced a period of economic growth during this time, as several businesses opened in the area.
The village experienced a period of decline in the mid-1900s, as many of the businesses closed and the population began to decline. However, the village has experienced a resurgence in recent years, as new businesses have opened and the population has grown.
Geography
Lake Milton is located in Mahoning County, Ohio. It is situated on the western shore of Lake Milton, a reservoir created by the damming of the Mahoning River. The village is located approximately 25 miles south of Youngstown and 40 miles east of Akron.
The village is located in a rural area, surrounded by farmland and wooded areas. The lake is a popular destination for fishing and boating, and the village is home to several parks and recreational areas.
Economy
The economy of Lake Milton is largely based on tourism and recreation. The lake is a popular destination for fishing and boating, and the village is home to several parks and recreational areas. The village also has several restaurants and shops, as well as a few small businesses.
The village is also home to several manufacturing companies, including a plastics manufacturer and a metal fabrication company. The village is also home to a few small farms, which produce a variety of crops.
Demographics
As of the 2010 census, the population of Lake Milton was 1,845. The population is largely white (94.3%), with small percentages of African American (2.2%), Asian (1.2%), and Hispanic (1.2%) residents. The median household income is $41,944, and the median age is 44.7 years.
Conclusion
Lake Milton is a village located in Mahoning County, Ohio. It is situated on the western shore of Lake Milton, a reservoir created by the damming of the Mahoning River. The village was founded in 1806 and was originally known as Milton. The village was renamed Lake Milton in 1875 when the lake was created. The village has experienced a period of growth in recent years, as new businesses have opened and the population has grown. The economy of Lake Milton is largely based on tourism and recreation, and the village is home to several manufacturing companies, restaurants, and shops. As of the 2010 census, the population of Lake Milton was 1,845. The population is largely white, with small percentages of African American, Asian, and Hispanic residents.
Common Questions
What is Per Capita Income in Lake Milton?
Per Capita income in Lake Milton is $45,280.
What is the Median Family Income in Lake Milton?
Median Family Income in Lake Milton is $70,602.
What is the Median Household income in Lake Milton?
Median Household Income in Lake Milton is $70,926.
What is Inequality or Gini Index in Lake Milton?
Inequality or Gini Index in Lake Milton is 0.38.
What is the Total Population of Lake Milton?
Total Population of Lake Milton is 469.
What is the Total Male Population of Lake Milton?
Total Male Population of Lake Milton is 259.
What is the Total Female Population of Lake Milton?
Total Female Population of Lake Milton is 210.
What is the Ratio of Males per 100 Females in Lake Milton?
There are 123.33 Males per 100 Females in Lake Milton.
What is the Ratio of Females per 100 Males in Lake Milton?
There are 81.08 Females per 100 Males in Lake Milton.
What is the Median Population Age in Lake Milton?
Median Population Age in Lake Milton is 50.4 Years.
What is the Average Family Size in Lake Milton
Average Family Size in Lake Milton is 2.8 People.
What is the Average Household Size in Lake Milton
Average Household Size in Lake Milton is 2.2 People.
How Large is the Labor Force in Lake Milton?
There are 195 People in the Labor Forcein in Lake Milton.
What is the Percentage of People in the Labor Force in Lake Milton?
53.3% of People are in the Labor Force in Lake Milton.