Kim, CO Map & Demographics
Kim Map
Kim Overview
$27,524
PER CAPITA INCOME
$28,036
AVG FAMILY INCOME
$28,750
AVG HOUSEHOLD INCOME
0.38
INEQUALITY / GINI INDEX
51
TOTAL POPULATION
30
MALE POPULATION
21
FEMALE POPULATION
142.86
MALES / 100 FEMALES
70.00
FEMALES / 100 MALES
60.5
MEDIAN AGE
2.1
AVG FAMILY SIZE
1.6
AVG HOUSEHOLD SIZE
20
LABOR FORCE [ PEOPLE ]
39.2%
PERCENT IN LABOR FORCE
Kim Zip Codes
Kim Area Codes
Income in Kim
Income Overview in Kim
Per Capita Income in Kim is $27,524, while median incomes of families and households are $28,036 and $28,750 respectively.
| Characteristic | Number | Measure |
| Per Capita Income | 51 | $27,524 |
| Median Family Income | 17 | $28,036 |
| Mean Family Income | 17 | $39,688 |
| Median Household Income | 33 | $28,750 |
| Mean Household Income | 33 | $40,609 |
| Income Deficit | 17 | $0 |
| Wage / Income Gap (%) | 51 | 0.00% |
| Wage / Income Gap ($) | 51 | 100.00¢ per $1 |
| Gini / Inequality Index | 51 | 0.38 |
Earnings by Sex in Kim
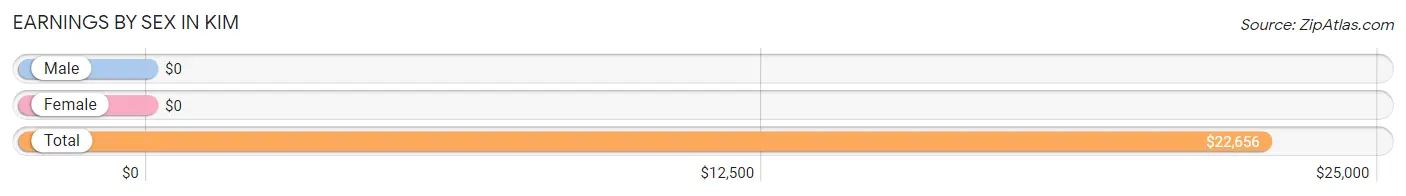
| Sex | Number | Average Earnings |
| Male | 19 (70.4%) | $0 |
| Female | 8 (29.6%) | $0 |
| Total | 27 (100.0%) | $22,656 |
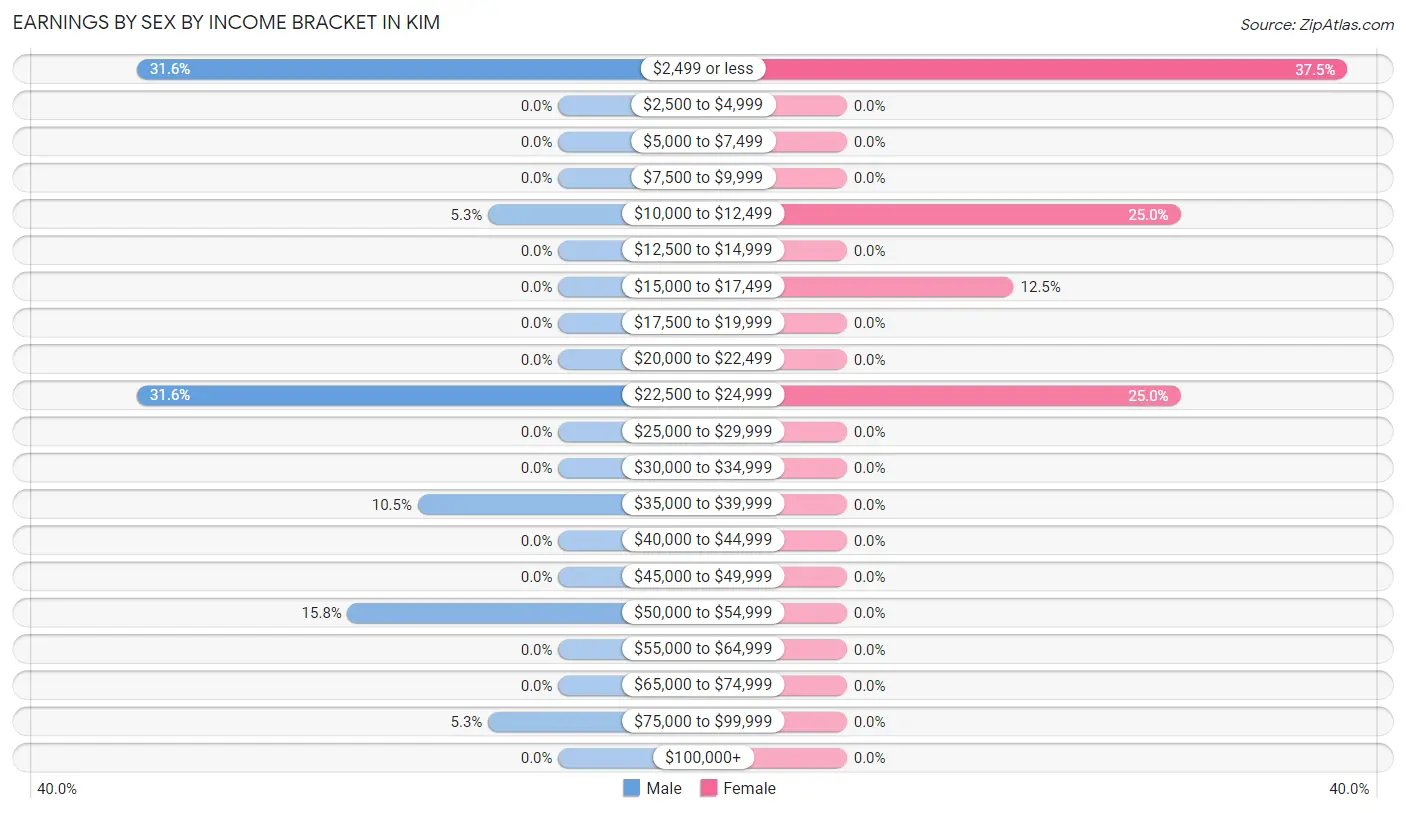
Earnings by Sex by Income Bracket in Kim
The most common earnings brackets in Kim are $2,499 or less for men (6 | 31.6%) and $2,499 or less for women (3 | 37.5%).
| Income | Male | Female |
| $2,499 or less | 6 (31.6%) | 3 (37.5%) |
| $2,500 to $4,999 | 0 (0.0%) | 0 (0.0%) |
| $5,000 to $7,499 | 0 (0.0%) | 0 (0.0%) |
| $7,500 to $9,999 | 0 (0.0%) | 0 (0.0%) |
| $10,000 to $12,499 | 1 (5.3%) | 2 (25.0%) |
| $12,500 to $14,999 | 0 (0.0%) | 0 (0.0%) |
| $15,000 to $17,499 | 0 (0.0%) | 1 (12.5%) |
| $17,500 to $19,999 | 0 (0.0%) | 0 (0.0%) |
| $20,000 to $22,499 | 0 (0.0%) | 0 (0.0%) |
| $22,500 to $24,999 | 6 (31.6%) | 2 (25.0%) |
| $25,000 to $29,999 | 0 (0.0%) | 0 (0.0%) |
| $30,000 to $34,999 | 0 (0.0%) | 0 (0.0%) |
| $35,000 to $39,999 | 2 (10.5%) | 0 (0.0%) |
| $40,000 to $44,999 | 0 (0.0%) | 0 (0.0%) |
| $45,000 to $49,999 | 0 (0.0%) | 0 (0.0%) |
| $50,000 to $54,999 | 3 (15.8%) | 0 (0.0%) |
| $55,000 to $64,999 | 0 (0.0%) | 0 (0.0%) |
| $65,000 to $74,999 | 0 (0.0%) | 0 (0.0%) |
| $75,000 to $99,999 | 1 (5.3%) | 0 (0.0%) |
| $100,000+ | 0 (0.0%) | 0 (0.0%) |
| Total | 19 (100.0%) | 8 (100.0%) |
Earnings by Sex by Educational Attainment in Kim
| Educational Attainment | Male Income | Female Income |
| Less than High School | - | - |
| High School Diploma | - | - |
| College or Associate's Degree | - | - |
| Bachelor's Degree | - | - |
| Graduate Degree | - | - |
| Total | - | - |
Family Income in Kim
Family Income Brackets in Kim
According to the Kim family income data, there are 7 families falling into the $15,000 to $24,999 income range, which is the most common income bracket and makes up 41.2% of all families.
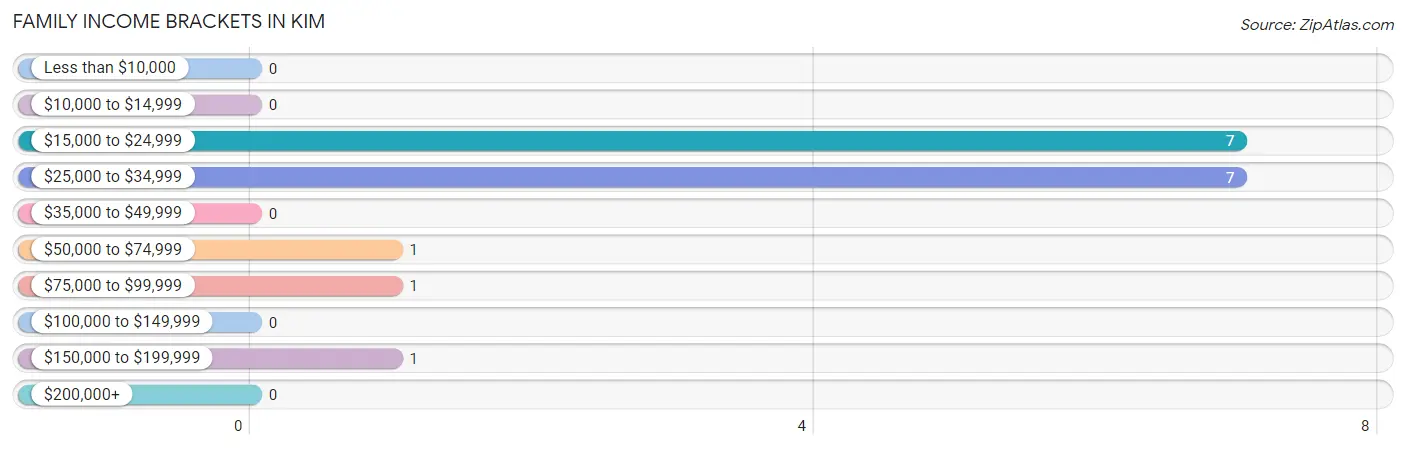
| Income Bracket | # Families | % Families |
| Less than $10,000 | 0 | 0.0% |
| $10,000 to $14,999 | 0 | 0.0% |
| $15,000 to $24,999 | 7 | 41.2% |
| $25,000 to $34,999 | 7 | 41.2% |
| $35,000 to $49,999 | 0 | 0.0% |
| $50,000 to $74,999 | 1 | 5.9% |
| $75,000 to $99,999 | 1 | 5.9% |
| $100,000 to $149,999 | 0 | 0.0% |
| $150,000 to $199,999 | 1 | 5.9% |
| $200,000+ | 0 | 0.0% |
Family Income by Famaliy Size in Kim
2-person families (17 | 100.0%) account for the highest median family income in Kim with $28,036 per family, while 2-person families (17 | 100.0%) have the highest median income of $14,018 per family member.
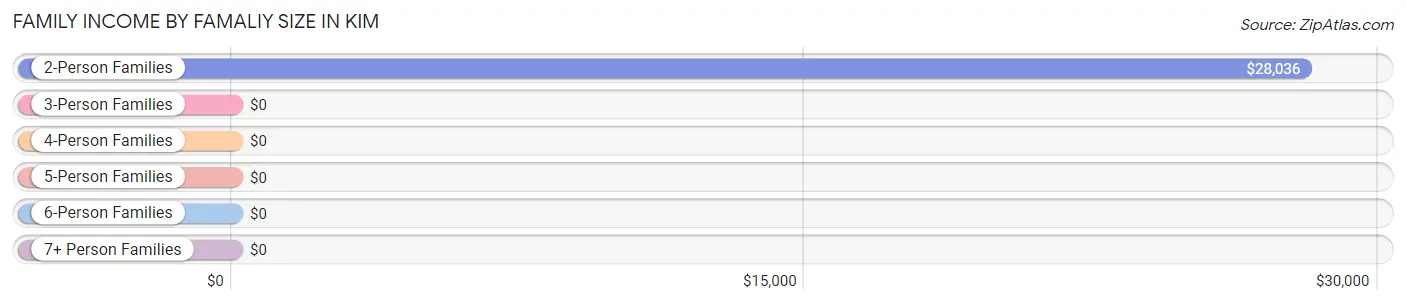
| Income Bracket | # Families | Median Income |
| 2-Person Families | 17 (100.0%) | $28,036 |
| 3-Person Families | 0 (0.0%) | $0 |
| 4-Person Families | 0 (0.0%) | $0 |
| 5-Person Families | 0 (0.0%) | $0 |
| 6-Person Families | 0 (0.0%) | $0 |
| 7+ Person Families | 0 (0.0%) | $0 |
| Total | 17 (100.0%) | $28,036 |
Family Income by Number of Earners in Kim
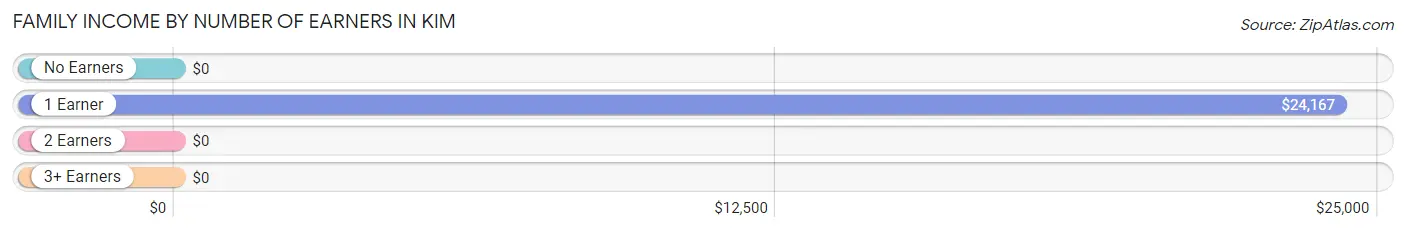
| Number of Earners | # Families | Median Income |
| No Earners | 5 (29.4%) | $0 |
| 1 Earner | 8 (47.1%) | $24,167 |
| 2 Earners | 4 (23.5%) | $0 |
| 3+ Earners | 0 (0.0%) | $0 |
| Total | 17 (100.0%) | $28,036 |
Household Income in Kim
Household Income Brackets in Kim
With 9 households falling in the category, the $15,000 to $24,999 income range is the most frequent in Kim, accounting for 27.3% of all households.
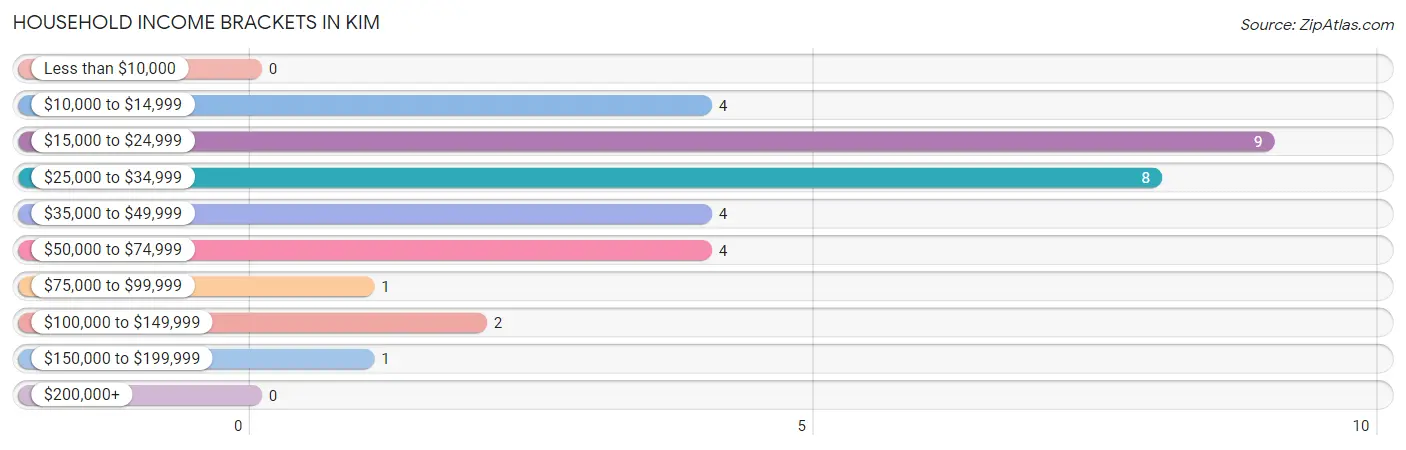
| Income Bracket | # Households | % Households |
| Less than $10,000 | 0 | 0.0% |
| $10,000 to $14,999 | 4 | 12.1% |
| $15,000 to $24,999 | 9 | 27.3% |
| $25,000 to $34,999 | 8 | 24.2% |
| $35,000 to $49,999 | 4 | 12.1% |
| $50,000 to $74,999 | 4 | 12.1% |
| $75,000 to $99,999 | 1 | 3.0% |
| $100,000 to $149,999 | 2 | 6.1% |
| $150,000 to $199,999 | 1 | 3.0% |
| $200,000+ | 0 | 0.0% |
Household Income by Householder Age in Kim
The median household income in Kim is $28,750, with the highest median household income of $38,750 found in the 45 to 64 years age bracket for the primary householder. A total of 10 households (30.3%) fall into this category.
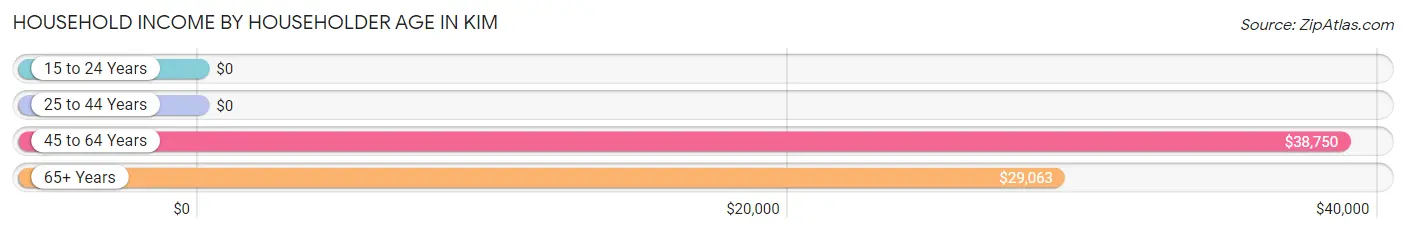
| Income Bracket | # Households | Median Income |
| 15 to 24 Years | 0 (0.0%) | $0 |
| 25 to 44 Years | 6 (18.2%) | $0 |
| 45 to 64 Years | 10 (30.3%) | $38,750 |
| 65+ Years | 17 (51.5%) | $29,063 |
| Total | 33 (100.0%) | $28,750 |
Poverty in Kim
Income Below Poverty by Sex and Age in Kim
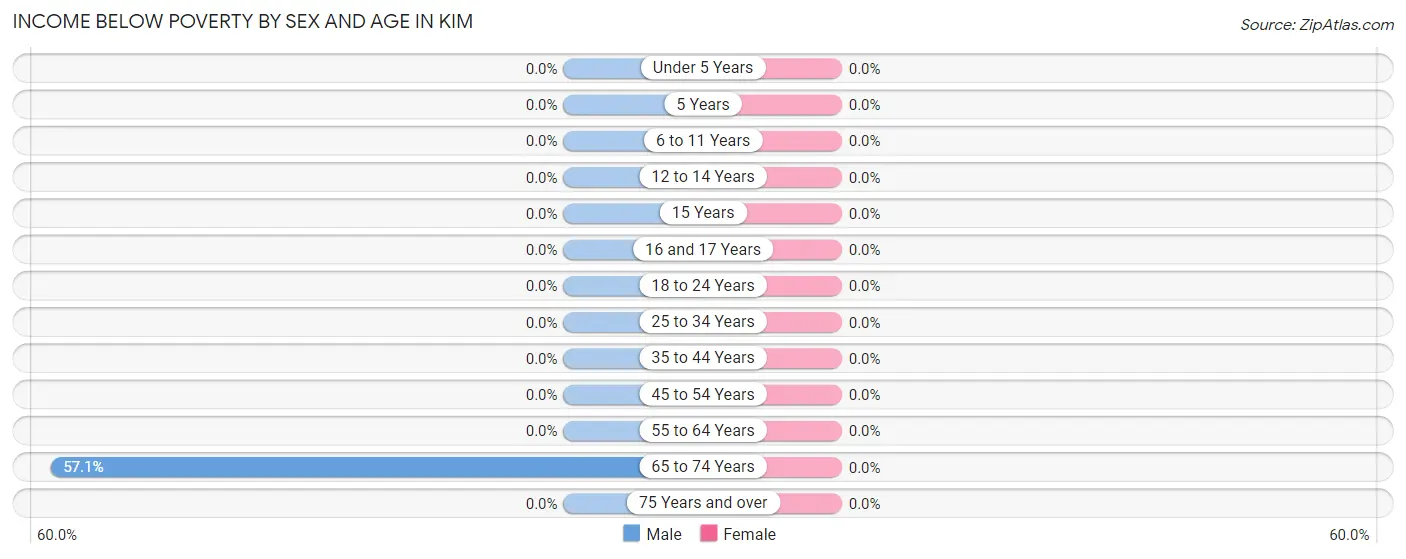
| Age Bracket | Male | Female |
| Under 5 Years | 0 (0.0%) | 0 (0.0%) |
| 5 Years | 0 (0.0%) | 0 (0.0%) |
| 6 to 11 Years | 0 (0.0%) | 0 (0.0%) |
| 12 to 14 Years | 0 (0.0%) | 0 (0.0%) |
| 15 Years | 0 (0.0%) | 0 (0.0%) |
| 16 and 17 Years | 0 (0.0%) | 0 (0.0%) |
| 18 to 24 Years | 0 (0.0%) | 0 (0.0%) |
| 25 to 34 Years | 0 (0.0%) | 0 (0.0%) |
| 35 to 44 Years | 0 (0.0%) | 0 (0.0%) |
| 45 to 54 Years | 0 (0.0%) | 0 (0.0%) |
| 55 to 64 Years | 0 (0.0%) | 0 (0.0%) |
| 65 to 74 Years | 4 (57.1%) | 0 (0.0%) |
| 75 Years and over | 0 (0.0%) | 0 (0.0%) |
| Total | 4 (13.3%) | 0 (0.0%) |
Income Above Poverty by Sex and Age in Kim
According to the poverty statistics in Kim, males aged 16 and 17 years and females aged 35 to 44 years are the age groups that are most secure financially, with 100.0% of males and 100.0% of females in these age groups living above the poverty line.
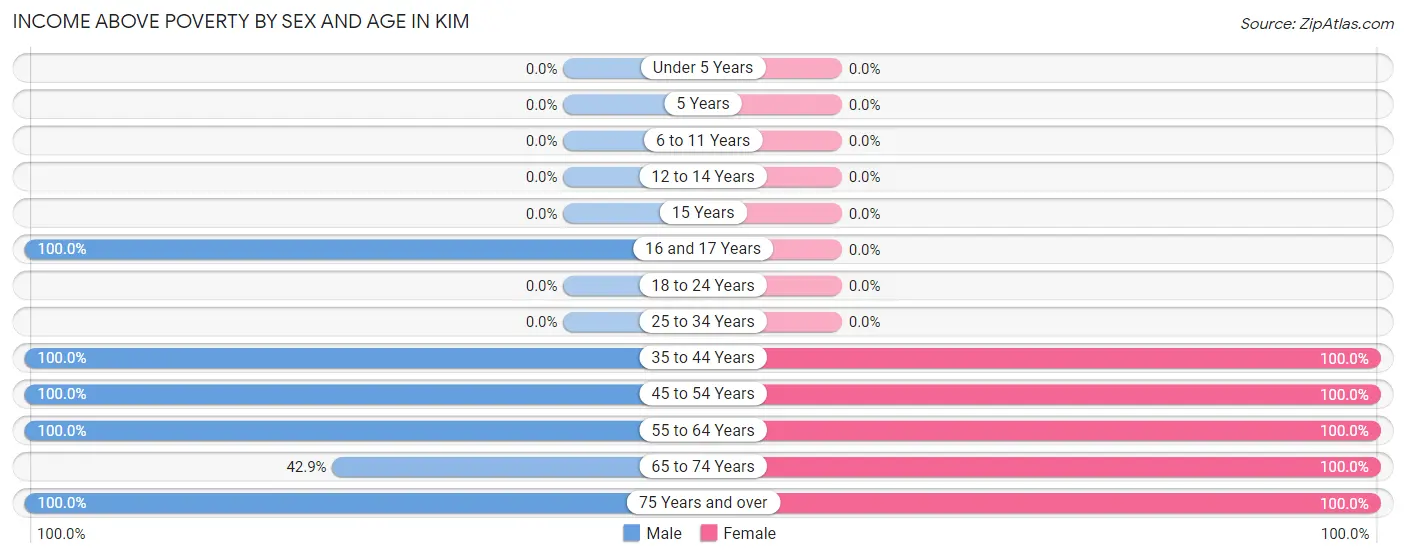
| Age Bracket | Male | Female |
| Under 5 Years | 0 (0.0%) | 0 (0.0%) |
| 5 Years | 0 (0.0%) | 0 (0.0%) |
| 6 to 11 Years | 0 (0.0%) | 0 (0.0%) |
| 12 to 14 Years | 0 (0.0%) | 0 (0.0%) |
| 15 Years | 0 (0.0%) | 0 (0.0%) |
| 16 and 17 Years | 2 (100.0%) | 0 (0.0%) |
| 18 to 24 Years | 0 (0.0%) | 0 (0.0%) |
| 25 to 34 Years | 0 (0.0%) | 0 (0.0%) |
| 35 to 44 Years | 6 (100.0%) | 5 (100.0%) |
| 45 to 54 Years | 6 (100.0%) | 2 (100.0%) |
| 55 to 64 Years | 2 (100.0%) | 3 (100.0%) |
| 65 to 74 Years | 3 (42.9%) | 8 (100.0%) |
| 75 Years and over | 7 (100.0%) | 3 (100.0%) |
| Total | 26 (86.7%) | 21 (100.0%) |
Income Below Poverty Among Married-Couple Families in Kim
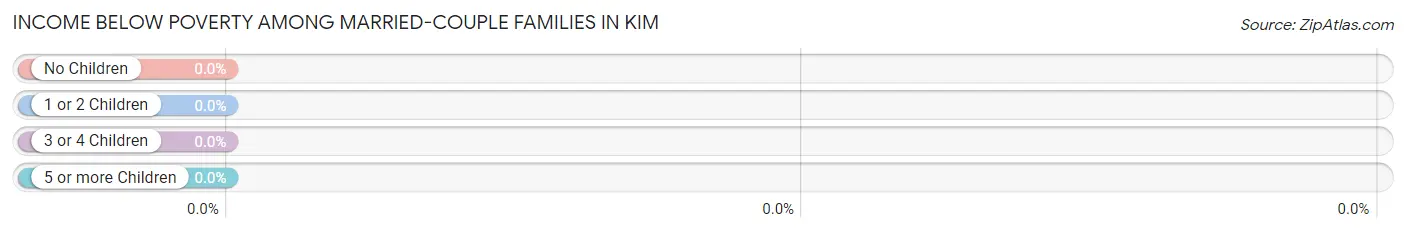
| Children | Above Poverty | Below Poverty |
| No Children | 15 (100.0%) | 0 (0.0%) |
| 1 or 2 Children | 0 (0.0%) | 0 (0.0%) |
| 3 or 4 Children | 0 (0.0%) | 0 (0.0%) |
| 5 or more Children | 0 (0.0%) | 0 (0.0%) |
| Total | 15 (100.0%) | 0 (0.0%) |
Income Below Poverty Among Single-Parent Households in Kim
| Children | Single Father | Single Mother |
| No Children | 0 (0.0%) | 0 (0.0%) |
| 1 or 2 Children | 0 (0.0%) | 0 (0.0%) |
| 3 or 4 Children | 0 (0.0%) | 0 (0.0%) |
| 5 or more Children | 0 (0.0%) | 0 (0.0%) |
| Total | 0 (0.0%) | 0 (0.0%) |
Income Below Poverty Among Married-Couple vs Single-Parent Households in Kim
| Children | Married-Couple Families | Single-Parent Households |
| No Children | 0 (0.0%) | 0 (0.0%) |
| 1 or 2 Children | 0 (0.0%) | 0 (0.0%) |
| 3 or 4 Children | 0 (0.0%) | 0 (0.0%) |
| 5 or more Children | 0 (0.0%) | 0 (0.0%) |
| Total | 0 (0.0%) | 0 (0.0%) |
Race in Kim
The most populous races in Kim are White / Caucasian (45 | 88.2%), Hispanic or Latino (19 | 37.2%), and Two or more Races (6 | 11.8%).
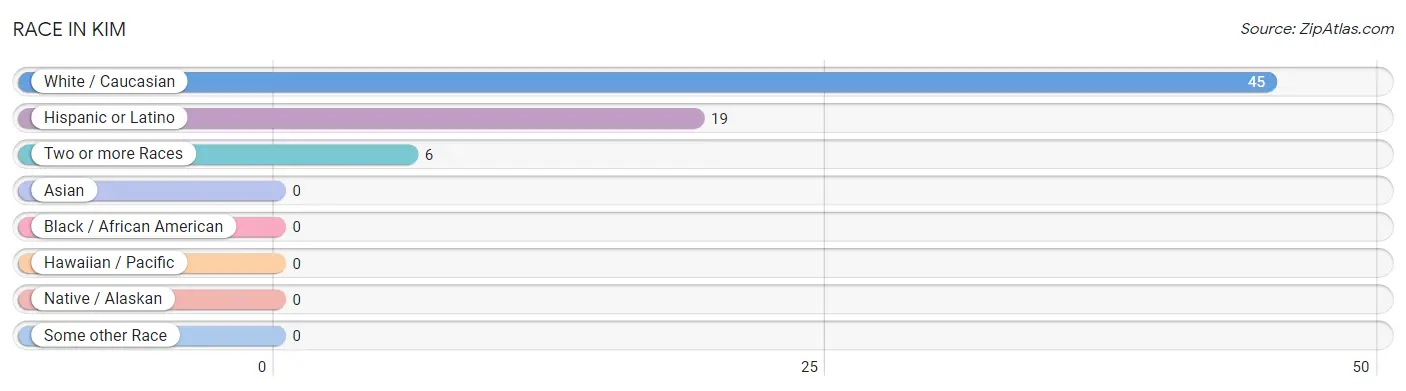
| Race | # Population | % Population |
| Asian | 0 | 0.0% |
| Black / African American | 0 | 0.0% |
| Hawaiian / Pacific | 0 | 0.0% |
| Hispanic or Latino | 19 | 37.2% |
| Native / Alaskan | 0 | 0.0% |
| White / Caucasian | 45 | 88.2% |
| Two or more Races | 6 | 11.8% |
| Some other Race | 0 | 0.0% |
| Total | 51 | 100.0% |
Ancestry in Kim
The most populous ancestries reported in Kim are English (15 | 29.4%), Mexican (9 | 17.6%), Spanish (8 | 15.7%), Basque (4 | 7.8%), and German (4 | 7.8%), together accounting for 78.4% of all Kim residents.
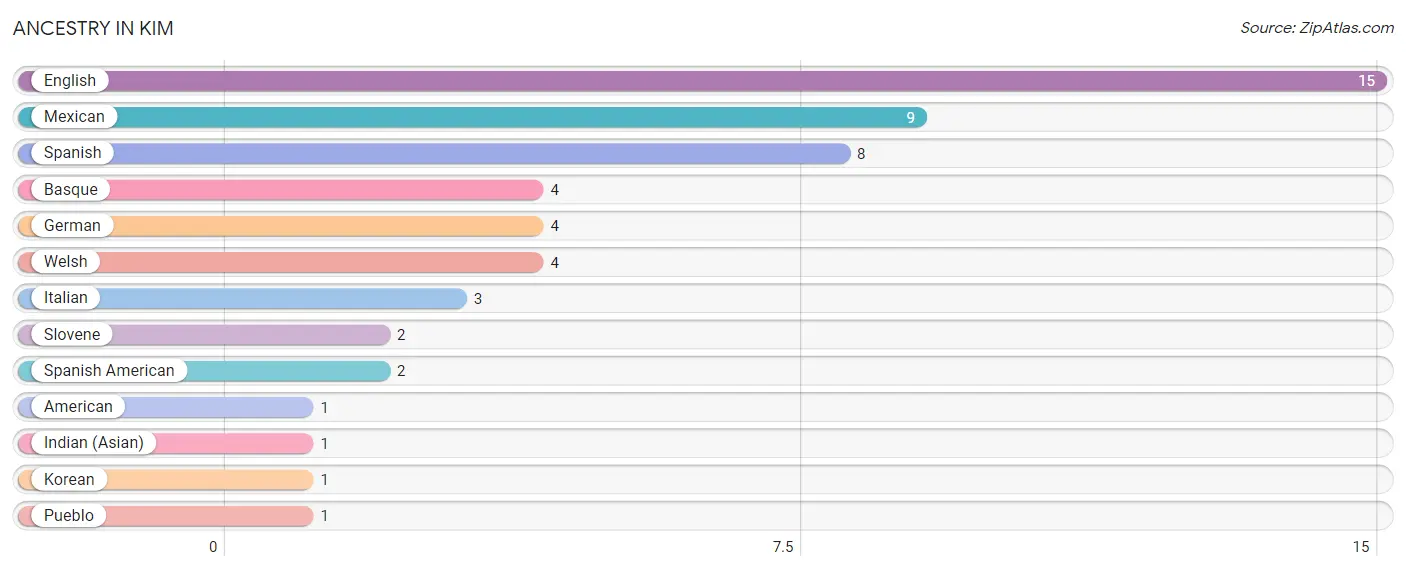
| Ancestry | # Population | % Population |
| American | 1 | 2.0% |
| Basque | 4 | 7.8% |
| English | 15 | 29.4% |
| German | 4 | 7.8% |
| Indian (Asian) | 1 | 2.0% |
| Italian | 3 | 5.9% |
| Korean | 1 | 2.0% |
| Mexican | 9 | 17.6% |
| Pueblo | 1 | 2.0% |
| Slovene | 2 | 3.9% |
| Spanish | 8 | 15.7% |
| Spanish American | 2 | 3.9% |
| Welsh | 4 | 7.8% | View All 13 Rows |
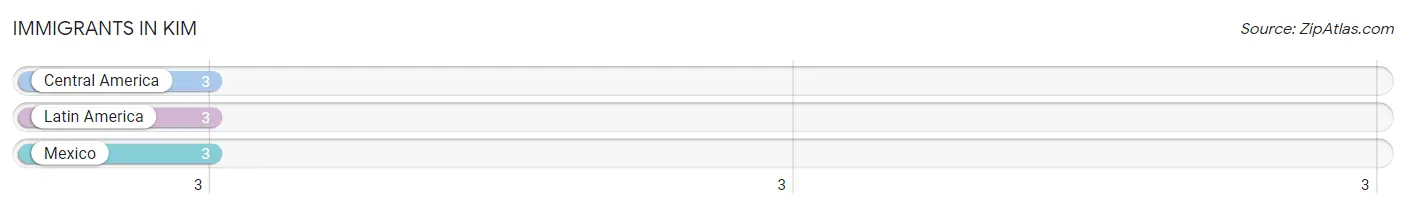
Immigrants in Kim
The most numerous immigrant groups reported in Kim came from Central America (3 | 5.9%), Latin America (3 | 5.9%), and Mexico (3 | 5.9%), together accounting for 17.6% of all Kim residents.
| Immigration Origin | # Population | % Population |
| Central America | 3 | 5.9% |
| Latin America | 3 | 5.9% |
| Mexico | 3 | 5.9% | View All 3 Rows |
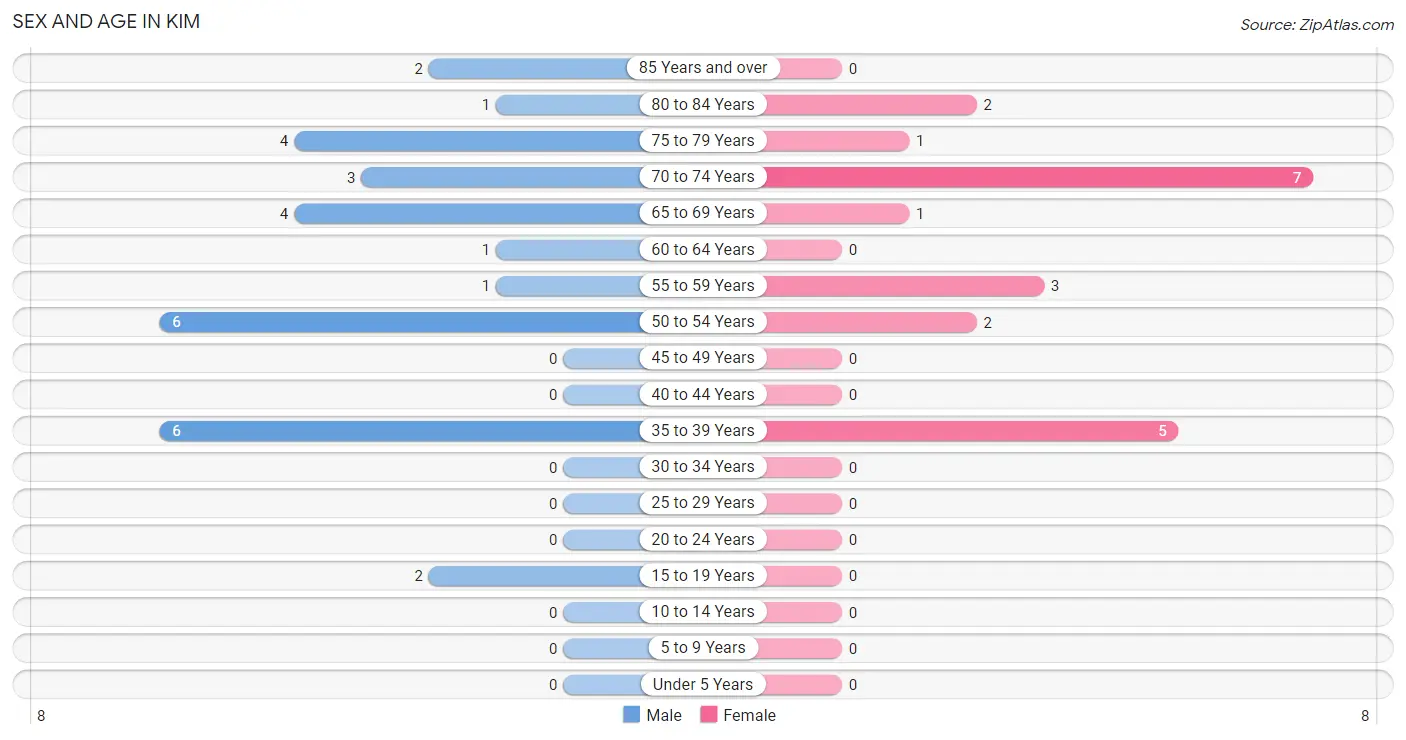
Sex and Age in Kim
Sex and Age in Kim
The most populous age groups in Kim are 35 to 39 Years (6 | 20.0%) for men and 70 to 74 Years (7 | 33.3%) for women.
| Age Bracket | Male | Female |
| Under 5 Years | 0 (0.0%) | 0 (0.0%) |
| 5 to 9 Years | 0 (0.0%) | 0 (0.0%) |
| 10 to 14 Years | 0 (0.0%) | 0 (0.0%) |
| 15 to 19 Years | 2 (6.7%) | 0 (0.0%) |
| 20 to 24 Years | 0 (0.0%) | 0 (0.0%) |
| 25 to 29 Years | 0 (0.0%) | 0 (0.0%) |
| 30 to 34 Years | 0 (0.0%) | 0 (0.0%) |
| 35 to 39 Years | 6 (20.0%) | 5 (23.8%) |
| 40 to 44 Years | 0 (0.0%) | 0 (0.0%) |
| 45 to 49 Years | 0 (0.0%) | 0 (0.0%) |
| 50 to 54 Years | 6 (20.0%) | 2 (9.5%) |
| 55 to 59 Years | 1 (3.3%) | 3 (14.3%) |
| 60 to 64 Years | 1 (3.3%) | 0 (0.0%) |
| 65 to 69 Years | 4 (13.3%) | 1 (4.8%) |
| 70 to 74 Years | 3 (10.0%) | 7 (33.3%) |
| 75 to 79 Years | 4 (13.3%) | 1 (4.8%) |
| 80 to 84 Years | 1 (3.3%) | 2 (9.5%) |
| 85 Years and over | 2 (6.7%) | 0 (0.0%) |
| Total | 30 (100.0%) | 21 (100.0%) |
Families and Households in Kim
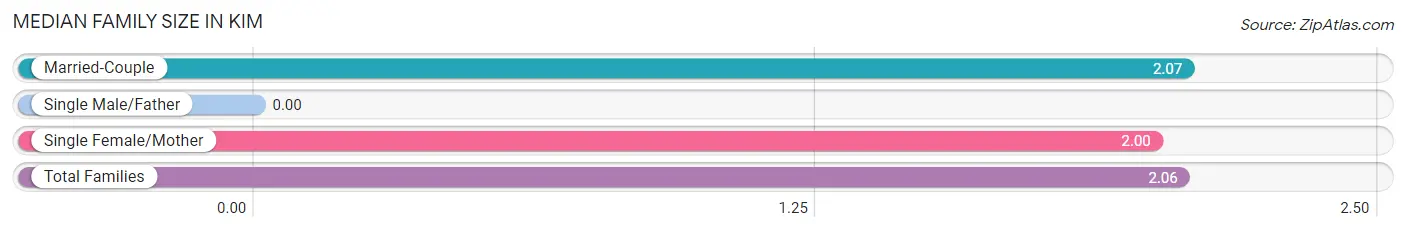
Median Family Size in Kim
| Family Type | # Families | Family Size |
| Married-Couple | 15 (88.2%) | 2.07 |
| Single Male/Father | 0 (0.0%) | - |
| Single Female/Mother | 2 (11.8%) | 2.00 |
| Total Families | 17 (100.0%) | 2.06 |
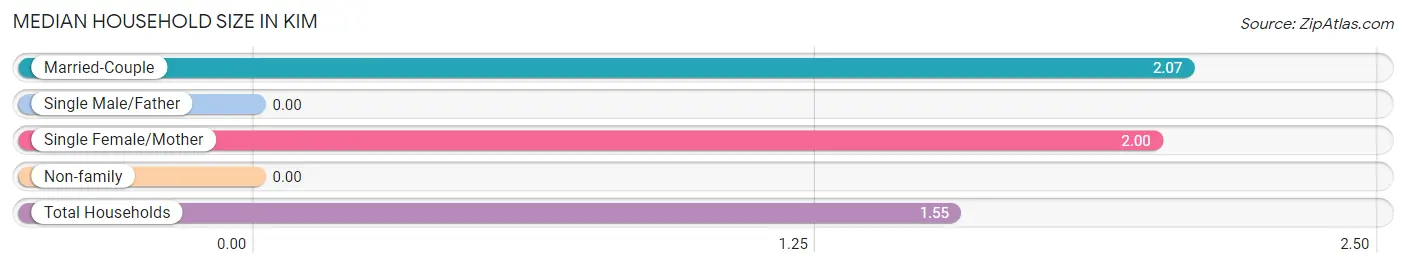
Median Household Size in Kim
| Household Type | # Households | Household Size |
| Married-Couple | 15 (45.5%) | 2.07 |
| Single Male/Father | 0 (0.0%) | - |
| Single Female/Mother | 2 (6.1%) | 2.00 |
| Non-family | 16 (48.5%) | - |
| Total Households | 33 (100.0%) | 1.55 |
Household Size by Marriage Status in Kim
Out of a total of 33 households in Kim, 17 (51.5%) are family households, while 16 (48.5%) are nonfamily households. The most numerous type of family households are 2-person households, comprising 17, and the most common type of nonfamily households are 1-person households, comprising 16.
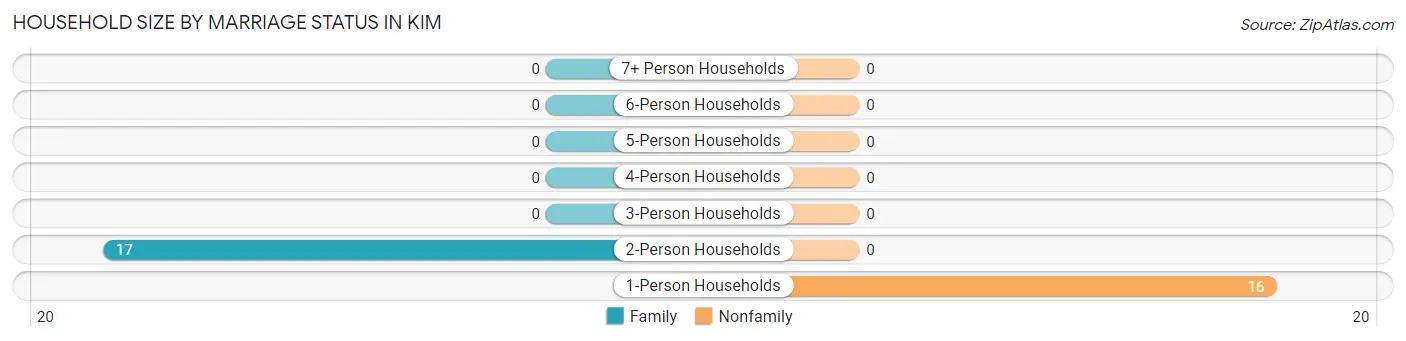
| Household Size | Family Households | Nonfamily Households |
| 1-Person Households | - | 16 (48.5%) |
| 2-Person Households | 17 (51.5%) | 0 (0.0%) |
| 3-Person Households | 0 (0.0%) | 0 (0.0%) |
| 4-Person Households | 0 (0.0%) | 0 (0.0%) |
| 5-Person Households | 0 (0.0%) | 0 (0.0%) |
| 6-Person Households | 0 (0.0%) | 0 (0.0%) |
| 7+ Person Households | 0 (0.0%) | 0 (0.0%) |
| Total | 17 (51.5%) | 16 (48.5%) |
Female Fertility in Kim
Fertility by Age in Kim
| Age Bracket | Women with Births | Births / 1,000 Women |
| 15 to 19 years | 0 (0.0%) | 0.0 |
| 20 to 34 years | 0 (0.0%) | 0.0 |
| 35 to 50 years | 0 (0.0%) | 0.0 |
| Total | 0 (0.0%) | 0.0 |
Fertility by Age by Marriage Status in Kim
| Age Bracket | Married | Unmarried |
| 15 to 19 years | 0 (0.0%) | 0 (0.0%) |
| 20 to 34 years | 0 (0.0%) | 0 (0.0%) |
| 35 to 50 years | 0 (0.0%) | 0 (0.0%) |
| Total | 0 (0.0%) | 0 (0.0%) |
Fertility by Education in Kim
| Educational Attainment | Women with Births | Births / 1,000 Women |
| Less than High School | 0 (0.0%) | 0.0 |
| High School Diploma | 0 (0.0%) | 0.0 |
| College or Associate's Degree | 0 (0.0%) | 0.0 |
| Bachelor's Degree | 0 (0.0%) | 0.0 |
| Graduate Degree | 0 (0.0%) | 0.0 |
| Total | 0 (0.0%) | 0.0 |
Fertility by Education by Marriage Status in Kim
| Educational Attainment | Married | Unmarried |
| Less than High School | 0 (0.0%) | 0 (0.0%) |
| High School Diploma | 0 (0.0%) | 0 (0.0%) |
| College or Associate's Degree | 0 (0.0%) | 0 (0.0%) |
| Bachelor's Degree | 0 (0.0%) | 0 (0.0%) |
| Graduate Degree | 0 (0.0%) | 0 (0.0%) |
| Total | 0 (0.0%) | 0 (0.0%) |
Employment Characteristics in Kim
Employment by Class of Employer in Kim
Among the 20 employed individuals in Kim, private company employees (12 | 60.0%), local government employees (4 | 20.0%), and self-employed (not incorporated) (3 | 15.0%) make up the most common classes of employment.
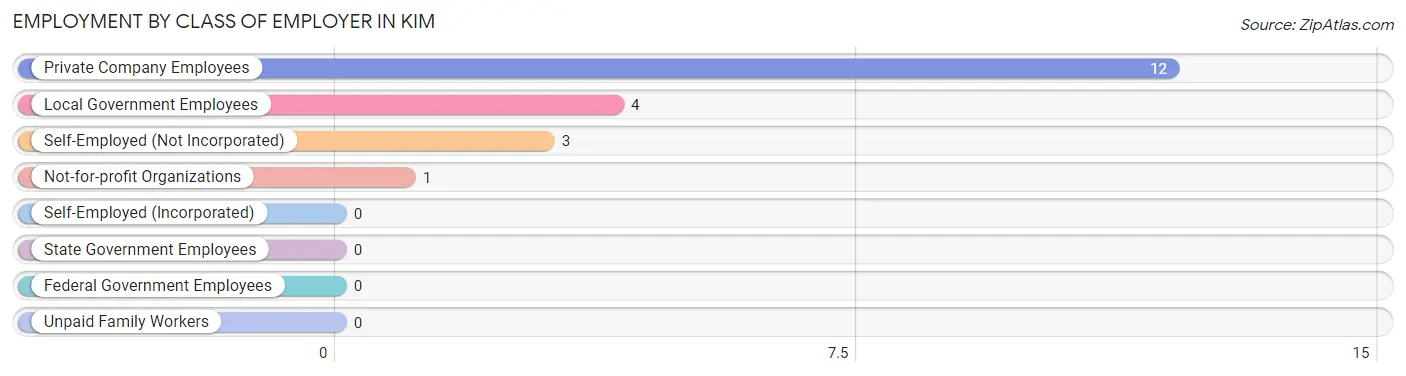
| Employer Class | # Employees | % Employees |
| Private Company Employees | 12 | 60.0% |
| Self-Employed (Incorporated) | 0 | 0.0% |
| Self-Employed (Not Incorporated) | 3 | 15.0% |
| Not-for-profit Organizations | 1 | 5.0% |
| Local Government Employees | 4 | 20.0% |
| State Government Employees | 0 | 0.0% |
| Federal Government Employees | 0 | 0.0% |
| Unpaid Family Workers | 0 | 0.0% |
| Total | 20 | 100.0% |
Employment Status by Age in Kim
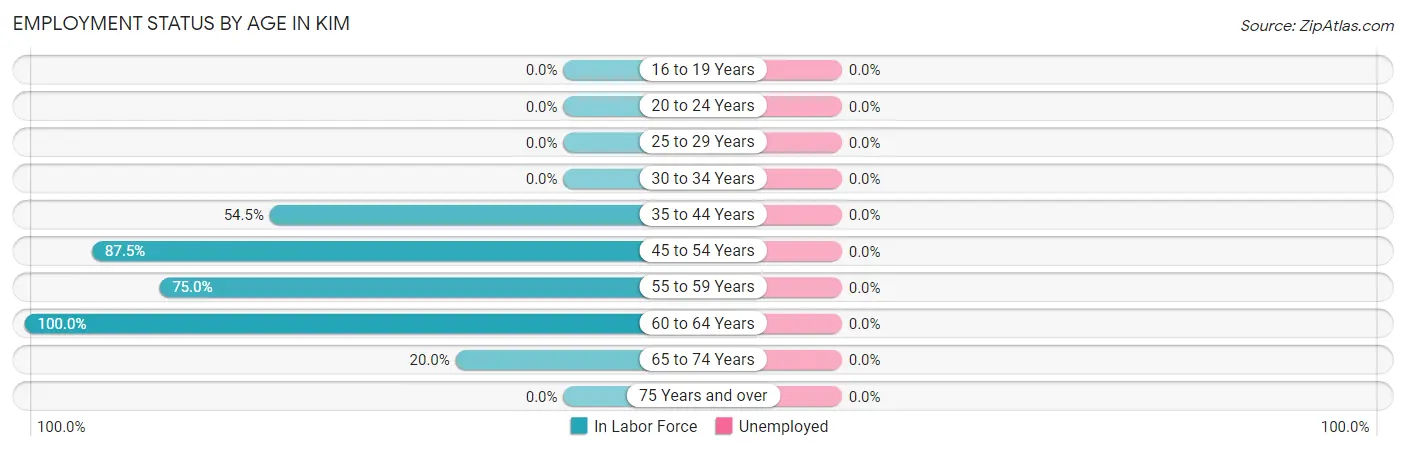
| Age Bracket | In Labor Force | Unemployed |
| 16 to 19 Years | 0 (0.0%) | 0 (0.0%) |
| 20 to 24 Years | 0 (0.0%) | 0 (0.0%) |
| 25 to 29 Years | 0 (0.0%) | 0 (0.0%) |
| 30 to 34 Years | 0 (0.0%) | 0 (0.0%) |
| 35 to 44 Years | 6 (54.5%) | 0 (0.0%) |
| 45 to 54 Years | 7 (87.5%) | 0 (0.0%) |
| 55 to 59 Years | 3 (75.0%) | 0 (0.0%) |
| 60 to 64 Years | 1 (100.0%) | 0 (0.0%) |
| 65 to 74 Years | 3 (20.0%) | 0 (0.0%) |
| 75 Years and over | 0 (0.0%) | 0 (0.0%) |
| Total | 20 (39.2%) | 0 (0.0%) |
Employment Status by Educational Attainment in Kim
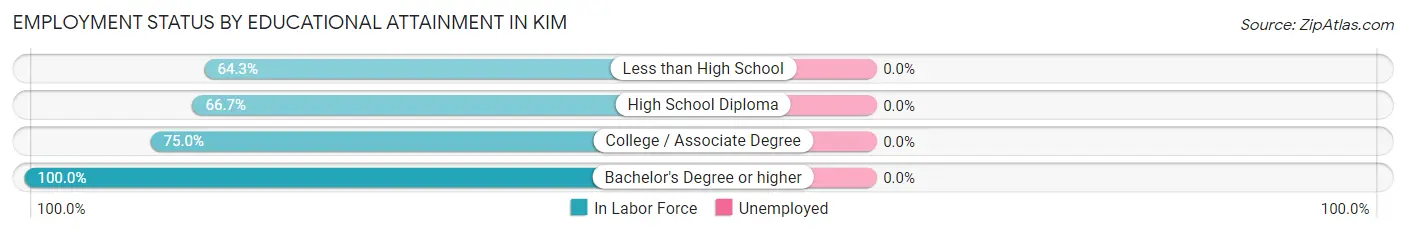
| Educational Attainment | In Labor Force | Unemployed |
| Less than High School | 9 (64.3%) | 0 (0.0%) |
| High School Diploma | 2 (66.7%) | 0 (0.0%) |
| College / Associate Degree | 3 (75.0%) | 0 (0.0%) |
| Bachelor's Degree or higher | 3 (100.0%) | 0 (0.0%) |
| Total | 17 (70.8%) | 0 (0.0%) |
Employment Occupations by Sex in Kim
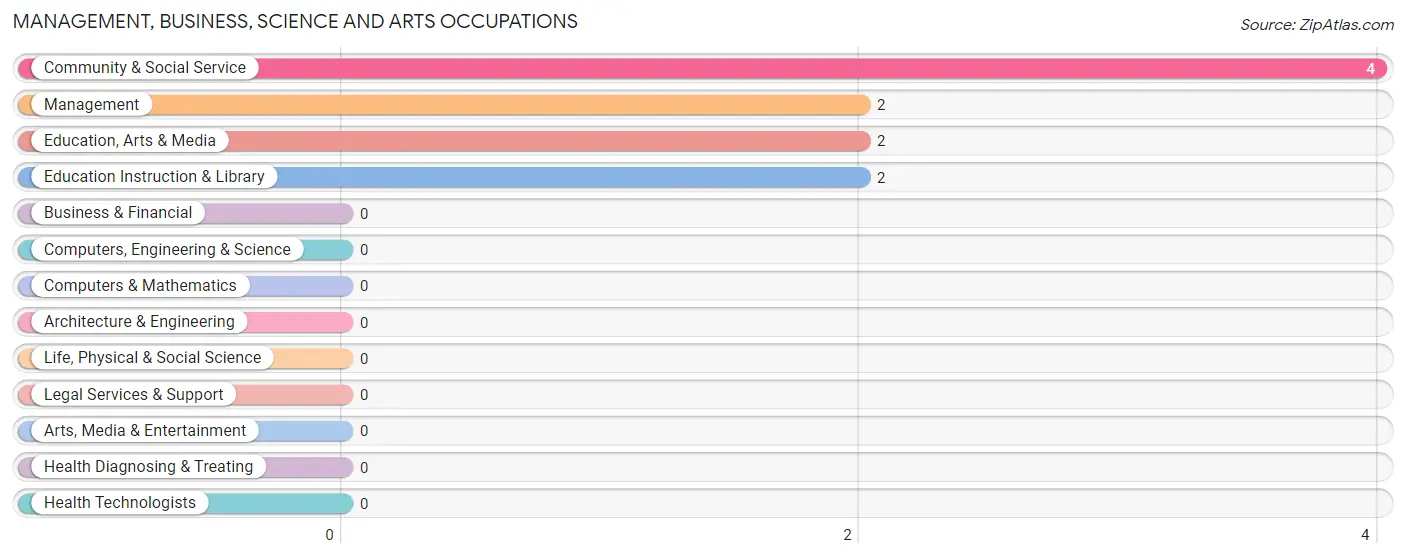
Management, Business, Science and Arts Occupations
The most common Management, Business, Science and Arts occupations in Kim are Community & Social Service (4 | 20.0%), Management (2 | 10.0%), Education, Arts & Media (2 | 10.0%), and Education Instruction & Library (2 | 10.0%).
Management, Business, Science and Arts Occupations by Sex
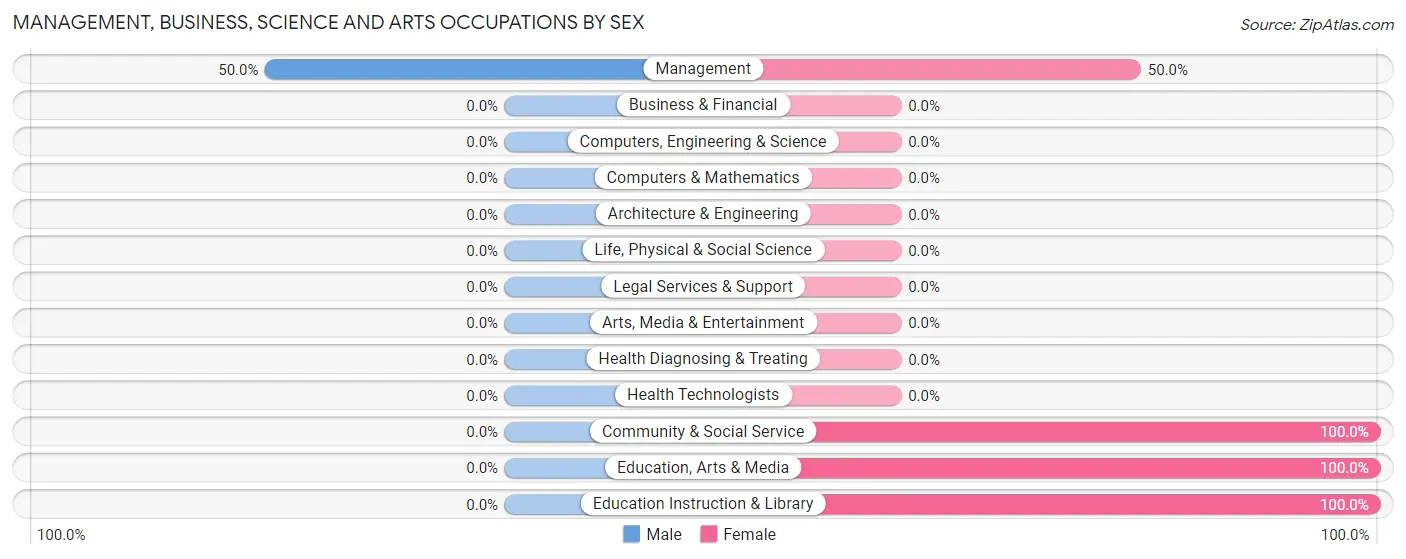
| Occupation | Male | Female |
| Management | 1 (50.0%) | 1 (50.0%) |
| Business & Financial | 0 (0.0%) | 0 (0.0%) |
| Computers, Engineering & Science | 0 (0.0%) | 0 (0.0%) |
| Computers & Mathematics | 0 (0.0%) | 0 (0.0%) |
| Architecture & Engineering | 0 (0.0%) | 0 (0.0%) |
| Life, Physical & Social Science | 0 (0.0%) | 0 (0.0%) |
| Community & Social Service | 0 (0.0%) | 4 (100.0%) |
| Education, Arts & Media | 0 (0.0%) | 2 (100.0%) |
| Legal Services & Support | 0 (0.0%) | 0 (0.0%) |
| Education Instruction & Library | 0 (0.0%) | 2 (100.0%) |
| Arts, Media & Entertainment | 0 (0.0%) | 0 (0.0%) |
| Health Diagnosing & Treating | 0 (0.0%) | 0 (0.0%) |
| Health Technologists | 0 (0.0%) | 0 (0.0%) |
| Total (Category) | 1 (16.7%) | 5 (83.3%) |
| Total (Overall) | 13 (65.0%) | 7 (35.0%) |
Services Occupations
Services Occupations by Sex
| Occupation | Male | Female |
| Healthcare Support | 0 (0.0%) | 0 (0.0%) |
| Security & Protection | 0 (0.0%) | 0 (0.0%) |
| Firefighting & Prevention | 0 (0.0%) | 0 (0.0%) |
| Law Enforcement | 0 (0.0%) | 0 (0.0%) |
| Food Preparation & Serving | 0 (0.0%) | 0 (0.0%) |
| Cleaning & Maintenance | 0 (0.0%) | 0 (0.0%) |
| Personal Care & Service | 0 (0.0%) | 0 (0.0%) |
| Total (Category) | 0 (0.0%) | 0 (0.0%) |
| Total (Overall) | 13 (65.0%) | 7 (35.0%) |
Sales and Office Occupations
Sales and Office Occupations by Sex
| Occupation | Male | Female |
| Sales & Related | 0 (0.0%) | 0 (0.0%) |
| Office & Administration | 0 (0.0%) | 0 (0.0%) |
| Total (Category) | 0 (0.0%) | 0 (0.0%) |
| Total (Overall) | 13 (65.0%) | 7 (35.0%) |
Natural Resources, Construction and Maintenance Occupations
The most common Natural Resources, Construction and Maintenance occupations in Kim are Farming, Fishing & Forestry (11 | 55.0%), and Construction & Extraction (3 | 15.0%).
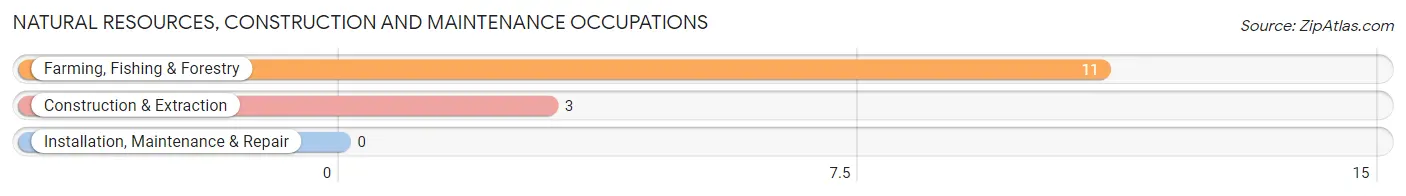
Natural Resources, Construction and Maintenance Occupations by Sex
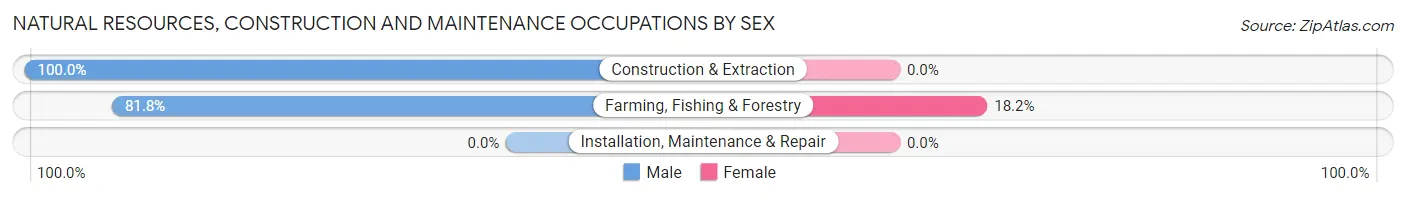
| Occupation | Male | Female |
| Farming, Fishing & Forestry | 9 (81.8%) | 2 (18.2%) |
| Construction & Extraction | 3 (100.0%) | 0 (0.0%) |
| Installation, Maintenance & Repair | 0 (0.0%) | 0 (0.0%) |
| Total (Category) | 12 (85.7%) | 2 (14.3%) |
| Total (Overall) | 13 (65.0%) | 7 (35.0%) |
Production, Transportation and Moving Occupations
Production, Transportation and Moving Occupations by Sex
| Occupation | Male | Female |
| Production | 0 (0.0%) | 0 (0.0%) |
| Transportation | 0 (0.0%) | 0 (0.0%) |
| Material Moving | 0 (0.0%) | 0 (0.0%) |
| Total (Category) | 0 (0.0%) | 0 (0.0%) |
| Total (Overall) | 13 (65.0%) | 7 (35.0%) |
Employment Industries by Sex in Kim
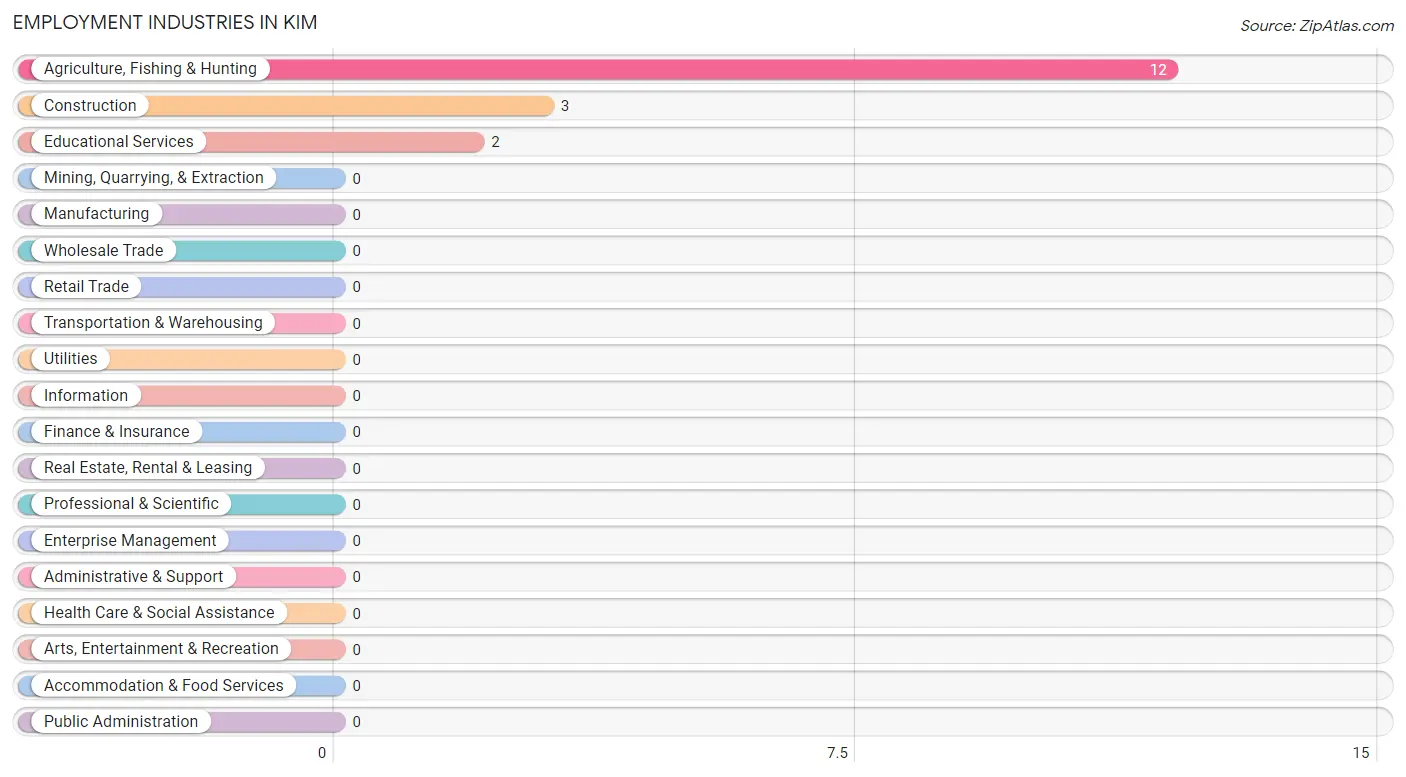
Employment Industries in Kim
The major employment industries in Kim include Agriculture, Fishing & Hunting (12 | 60.0%), Construction (3 | 15.0%), and Educational Services (2 | 10.0%).
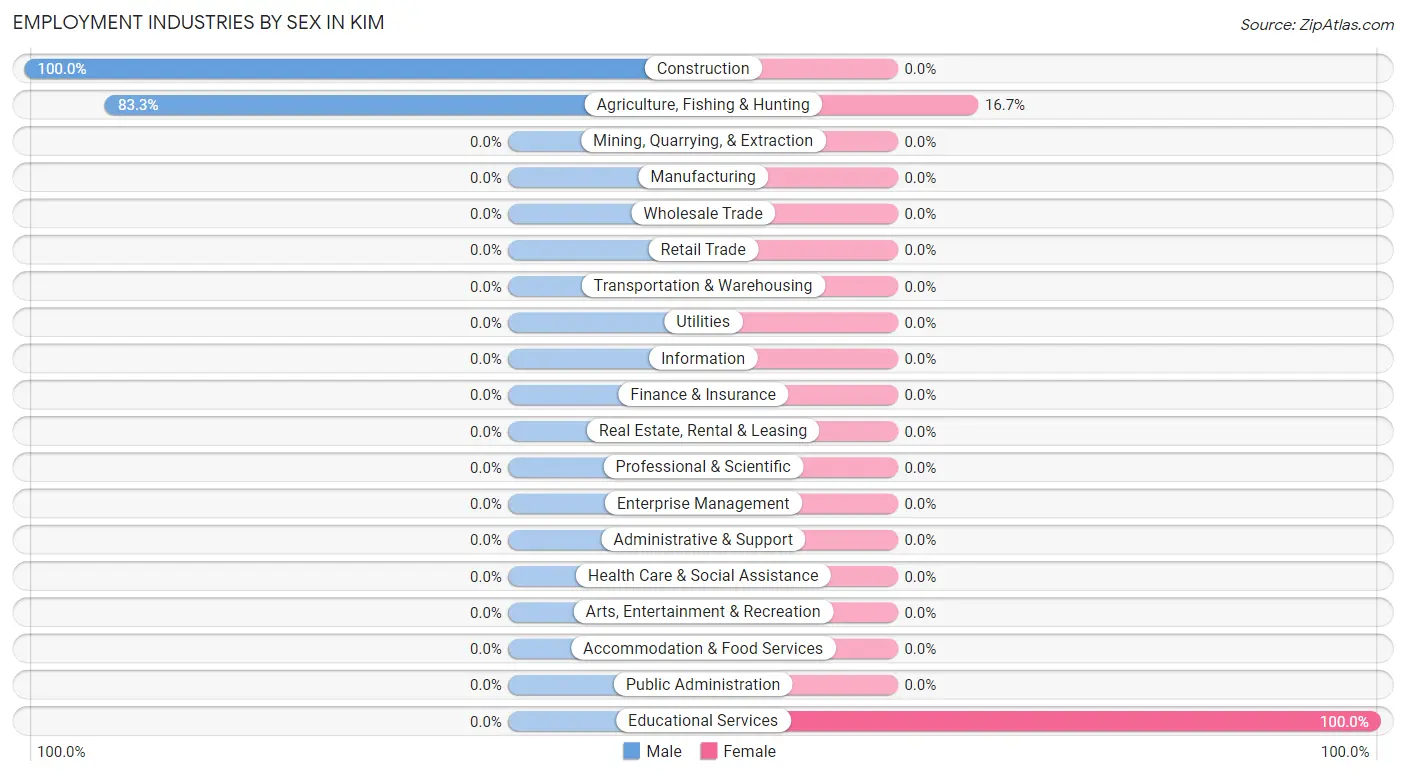
Employment Industries by Sex in Kim
The Kim industries that see more men than women are Construction (100.0%), and Agriculture, Fishing & Hunting (83.3%), whereas the industries that tend to have a higher number of women are Educational Services (100.0%), and Agriculture, Fishing & Hunting (16.7%).
| Industry | Male | Female |
| Agriculture, Fishing & Hunting | 10 (83.3%) | 2 (16.7%) |
| Mining, Quarrying, & Extraction | 0 (0.0%) | 0 (0.0%) |
| Construction | 3 (100.0%) | 0 (0.0%) |
| Manufacturing | 0 (0.0%) | 0 (0.0%) |
| Wholesale Trade | 0 (0.0%) | 0 (0.0%) |
| Retail Trade | 0 (0.0%) | 0 (0.0%) |
| Transportation & Warehousing | 0 (0.0%) | 0 (0.0%) |
| Utilities | 0 (0.0%) | 0 (0.0%) |
| Information | 0 (0.0%) | 0 (0.0%) |
| Finance & Insurance | 0 (0.0%) | 0 (0.0%) |
| Real Estate, Rental & Leasing | 0 (0.0%) | 0 (0.0%) |
| Professional & Scientific | 0 (0.0%) | 0 (0.0%) |
| Enterprise Management | 0 (0.0%) | 0 (0.0%) |
| Administrative & Support | 0 (0.0%) | 0 (0.0%) |
| Educational Services | 0 (0.0%) | 2 (100.0%) |
| Health Care & Social Assistance | 0 (0.0%) | 0 (0.0%) |
| Arts, Entertainment & Recreation | 0 (0.0%) | 0 (0.0%) |
| Accommodation & Food Services | 0 (0.0%) | 0 (0.0%) |
| Public Administration | 0 (0.0%) | 0 (0.0%) |
| Total | 13 (65.0%) | 7 (35.0%) |
Education in Kim
School Enrollment in Kim
The most common levels of schooling among the 3 students in Kim are high school (2 | 66.7%), and college / undergraduate (1 | 33.3%).
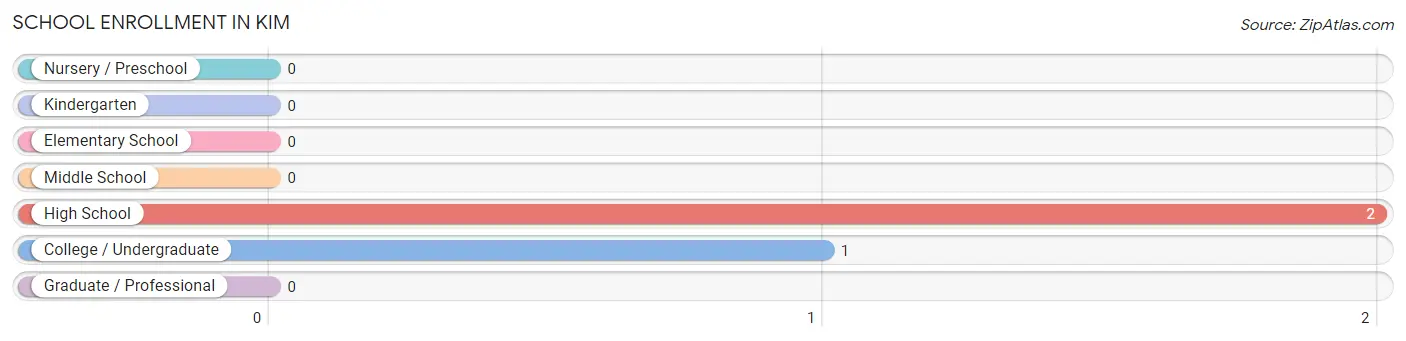
| School Level | # Students | % Students |
| Nursery / Preschool | 0 | 0.0% |
| Kindergarten | 0 | 0.0% |
| Elementary School | 0 | 0.0% |
| Middle School | 0 | 0.0% |
| High School | 2 | 66.7% |
| College / Undergraduate | 1 | 33.3% |
| Graduate / Professional | 0 | 0.0% |
| Total | 3 | 100.0% |
School Enrollment by Age by Funding Source in Kim
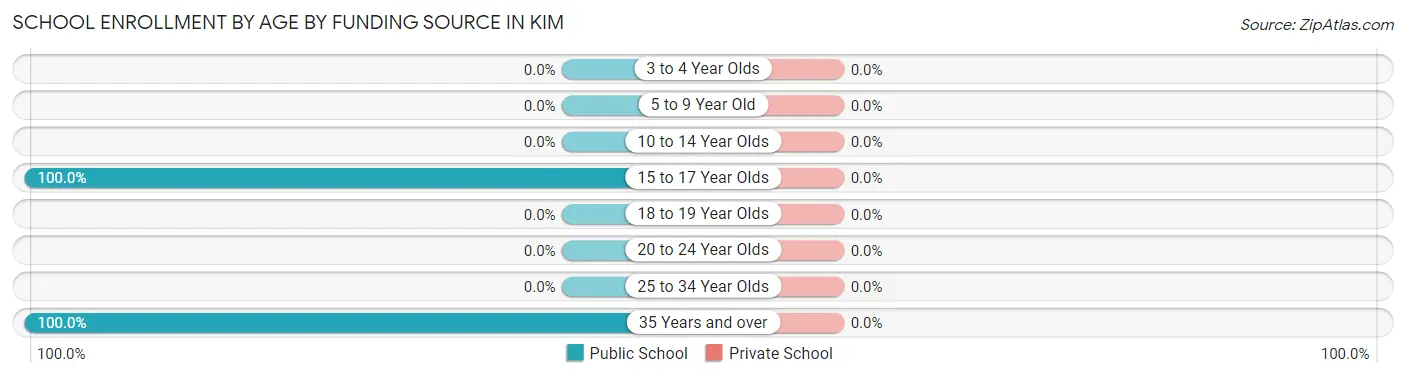
| Age Bracket | Public School | Private School |
| 3 to 4 Year Olds | 0 (0.0%) | 0 (0.0%) |
| 5 to 9 Year Old | 0 (0.0%) | 0 (0.0%) |
| 10 to 14 Year Olds | 0 (0.0%) | 0 (0.0%) |
| 15 to 17 Year Olds | 2 (100.0%) | 0 (0.0%) |
| 18 to 19 Year Olds | 0 (0.0%) | 0 (0.0%) |
| 20 to 24 Year Olds | 0 (0.0%) | 0 (0.0%) |
| 25 to 34 Year Olds | 0 (0.0%) | 0 (0.0%) |
| 35 Years and over | 1 (100.0%) | 0 (0.0%) |
| Total | 3 (100.0%) | 0 (0.0%) |
Educational Attainment by Field of Study in Kim
Business (3 | 50.0%), education (2 | 33.3%), and bio, nature & agricultural (1 | 16.7%) are the most common fields of study among 6 individuals in Kim who have obtained a bachelor's degree or higher.
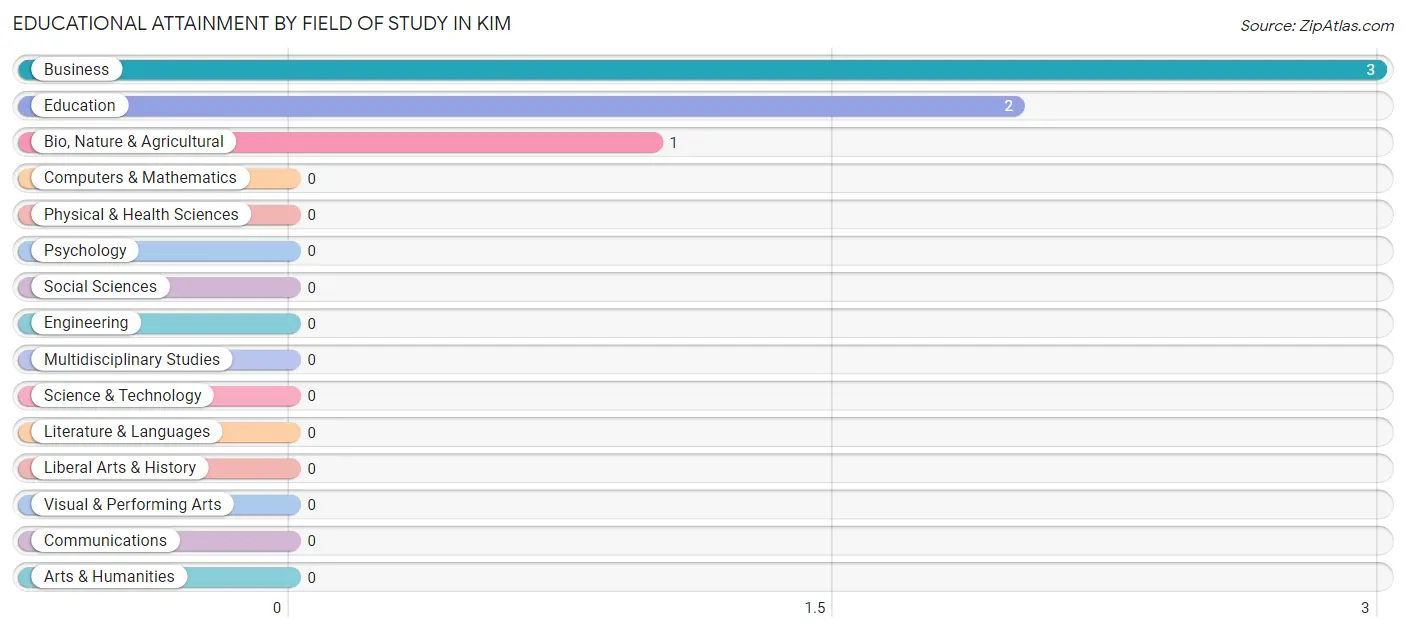
| Field of Study | # Graduates | % Graduates |
| Computers & Mathematics | 0 | 0.0% |
| Bio, Nature & Agricultural | 1 | 16.7% |
| Physical & Health Sciences | 0 | 0.0% |
| Psychology | 0 | 0.0% |
| Social Sciences | 0 | 0.0% |
| Engineering | 0 | 0.0% |
| Multidisciplinary Studies | 0 | 0.0% |
| Science & Technology | 0 | 0.0% |
| Business | 3 | 50.0% |
| Education | 2 | 33.3% |
| Literature & Languages | 0 | 0.0% |
| Liberal Arts & History | 0 | 0.0% |
| Visual & Performing Arts | 0 | 0.0% |
| Communications | 0 | 0.0% |
| Arts & Humanities | 0 | 0.0% |
| Total | 6 | 100.0% |
Transportation & Commute in Kim
Vehicle Availability by Sex in Kim
The most prevalent vehicle ownership categories in Kim are males with 1 vehicle (9, accounting for 69.2%) and females with 1 vehicle (2, making up 128.6%).
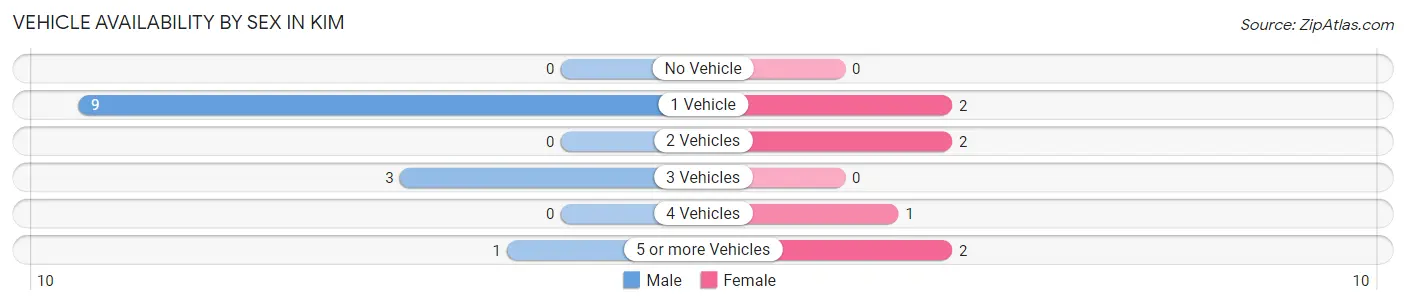
| Vehicles Available | Male | Female |
| No Vehicle | 0 (0.0%) | 0 (0.0%) |
| 1 Vehicle | 9 (69.2%) | 2 (28.6%) |
| 2 Vehicles | 0 (0.0%) | 2 (28.6%) |
| 3 Vehicles | 3 (23.1%) | 0 (0.0%) |
| 4 Vehicles | 0 (0.0%) | 1 (14.3%) |
| 5 or more Vehicles | 1 (7.7%) | 2 (28.6%) |
| Total | 13 (100.0%) | 7 (100.0%) |
Commute Time in Kim
The most frequently occuring commute durations in Kim are 30 to 34 minutes (9 commuters, 50.0%), less than 5 minutes (5 commuters, 27.8%), and 10 to 14 minutes (2 commuters, 11.1%).
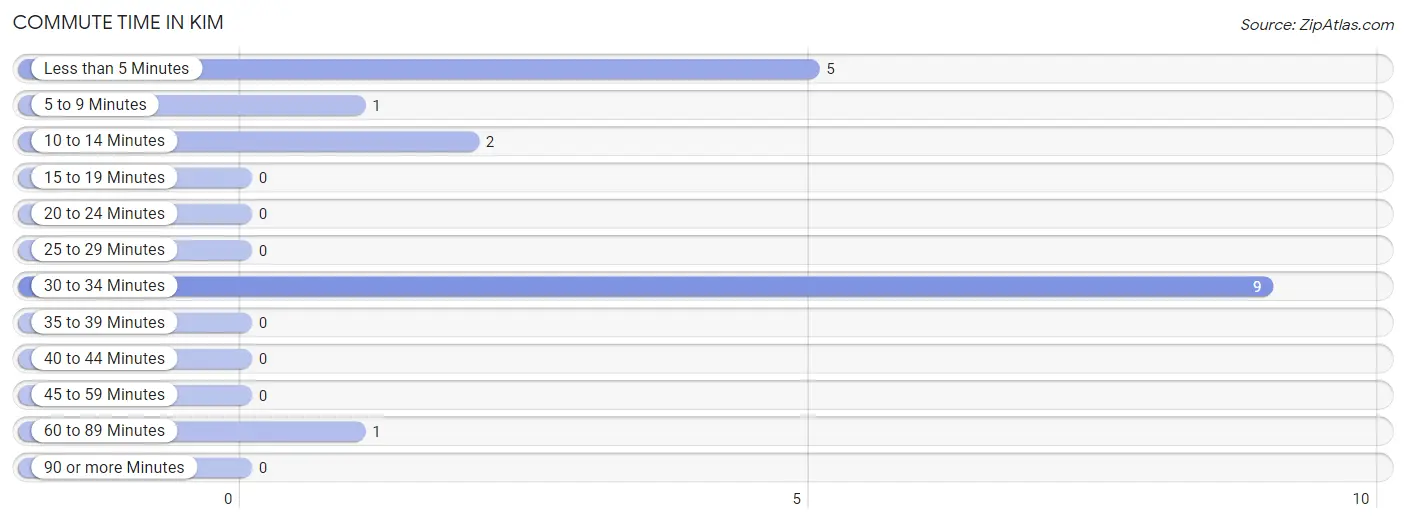
| Commute Time | # Commuters | % Commuters |
| Less than 5 Minutes | 5 | 27.8% |
| 5 to 9 Minutes | 1 | 5.6% |
| 10 to 14 Minutes | 2 | 11.1% |
| 15 to 19 Minutes | 0 | 0.0% |
| 20 to 24 Minutes | 0 | 0.0% |
| 25 to 29 Minutes | 0 | 0.0% |
| 30 to 34 Minutes | 9 | 50.0% |
| 35 to 39 Minutes | 0 | 0.0% |
| 40 to 44 Minutes | 0 | 0.0% |
| 45 to 59 Minutes | 0 | 0.0% |
| 60 to 89 Minutes | 1 | 5.6% |
| 90 or more Minutes | 0 | 0.0% |
Commute Time by Sex in Kim
The most common commute times in Kim are 30 to 34 minutes (9 commuters, 69.2%) for males and less than 5 minutes (2 commuters, 40.0%) for females.
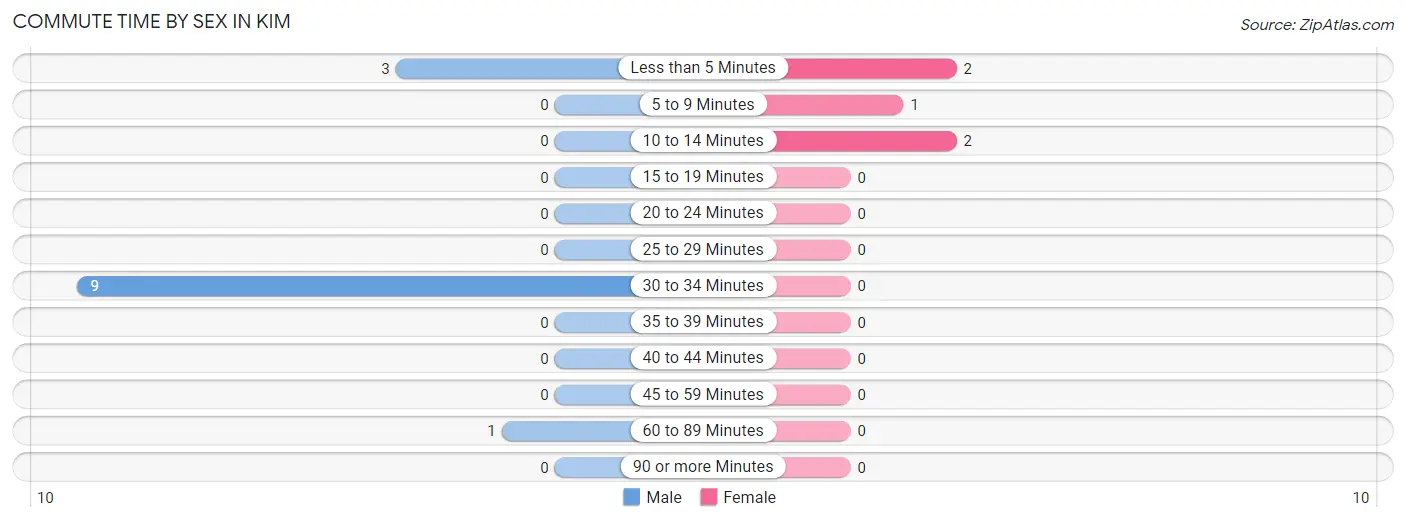
| Commute Time | Male | Female |
| Less than 5 Minutes | 3 (23.1%) | 2 (40.0%) |
| 5 to 9 Minutes | 0 (0.0%) | 1 (20.0%) |
| 10 to 14 Minutes | 0 (0.0%) | 2 (40.0%) |
| 15 to 19 Minutes | 0 (0.0%) | 0 (0.0%) |
| 20 to 24 Minutes | 0 (0.0%) | 0 (0.0%) |
| 25 to 29 Minutes | 0 (0.0%) | 0 (0.0%) |
| 30 to 34 Minutes | 9 (69.2%) | 0 (0.0%) |
| 35 to 39 Minutes | 0 (0.0%) | 0 (0.0%) |
| 40 to 44 Minutes | 0 (0.0%) | 0 (0.0%) |
| 45 to 59 Minutes | 0 (0.0%) | 0 (0.0%) |
| 60 to 89 Minutes | 1 (7.7%) | 0 (0.0%) |
| 90 or more Minutes | 0 (0.0%) | 0 (0.0%) |
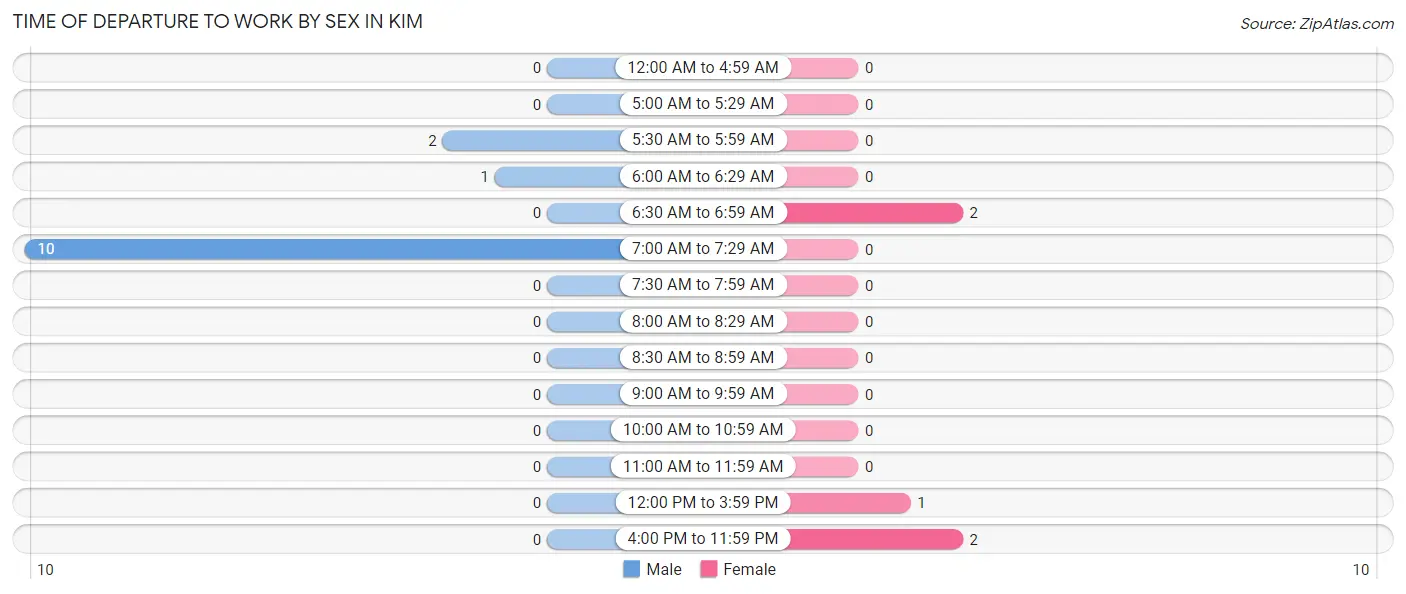
Time of Departure to Work by Sex in Kim
The most frequent times of departure to work in Kim are 7:00 AM to 7:29 AM (10, 76.9%) for males and 6:30 AM to 6:59 AM (2, 40.0%) for females.
| Time of Departure | Male | Female |
| 12:00 AM to 4:59 AM | 0 (0.0%) | 0 (0.0%) |
| 5:00 AM to 5:29 AM | 0 (0.0%) | 0 (0.0%) |
| 5:30 AM to 5:59 AM | 2 (15.4%) | 0 (0.0%) |
| 6:00 AM to 6:29 AM | 1 (7.7%) | 0 (0.0%) |
| 6:30 AM to 6:59 AM | 0 (0.0%) | 2 (40.0%) |
| 7:00 AM to 7:29 AM | 10 (76.9%) | 0 (0.0%) |
| 7:30 AM to 7:59 AM | 0 (0.0%) | 0 (0.0%) |
| 8:00 AM to 8:29 AM | 0 (0.0%) | 0 (0.0%) |
| 8:30 AM to 8:59 AM | 0 (0.0%) | 0 (0.0%) |
| 9:00 AM to 9:59 AM | 0 (0.0%) | 0 (0.0%) |
| 10:00 AM to 10:59 AM | 0 (0.0%) | 0 (0.0%) |
| 11:00 AM to 11:59 AM | 0 (0.0%) | 0 (0.0%) |
| 12:00 PM to 3:59 PM | 0 (0.0%) | 1 (20.0%) |
| 4:00 PM to 11:59 PM | 0 (0.0%) | 2 (40.0%) |
| Total | 13 (100.0%) | 5 (100.0%) |
Housing Occupancy in Kim
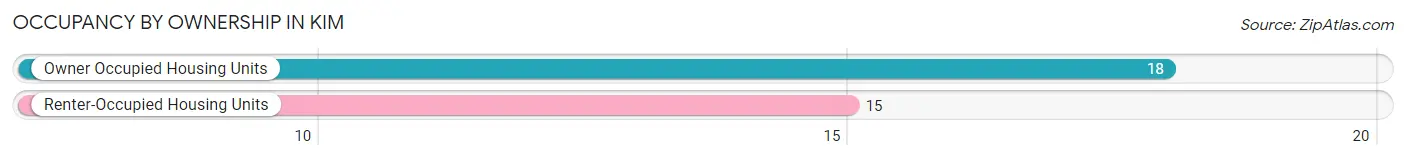
Occupancy by Ownership in Kim
Of the total 33 dwellings in Kim, owner-occupied units account for 18 (54.5%), while renter-occupied units make up 15 (45.5%).
| Occupancy | # Housing Units | % Housing Units |
| Owner Occupied Housing Units | 18 | 54.5% |
| Renter-Occupied Housing Units | 15 | 45.5% |
| Total Occupied Housing Units | 33 | 100.0% |
Occupancy by Household Size in Kim
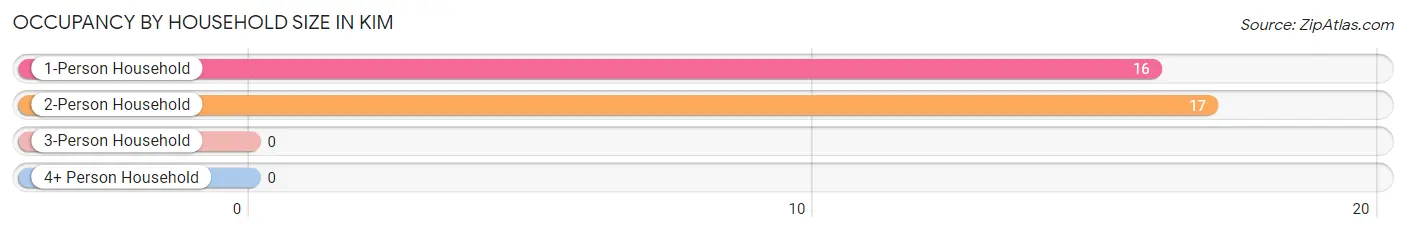
| Household Size | # Housing Units | % Housing Units |
| 1-Person Household | 16 | 48.5% |
| 2-Person Household | 17 | 51.5% |
| 3-Person Household | 0 | 0.0% |
| 4+ Person Household | 0 | 0.0% |
| Total Housing Units | 33 | 100.0% |
Occupancy by Ownership by Household Size in Kim
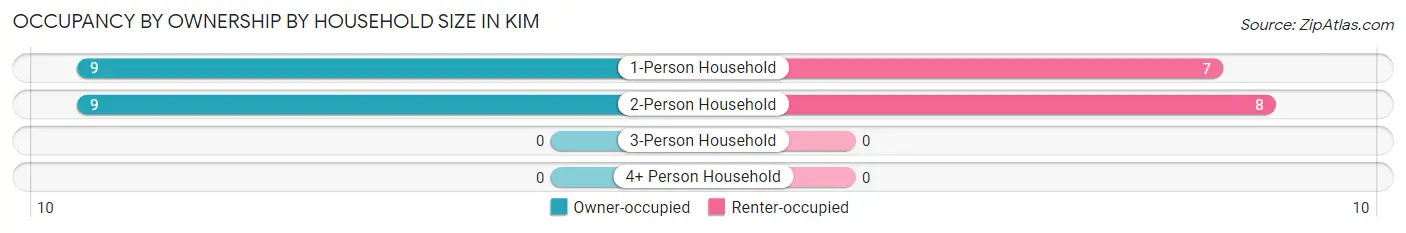
| Household Size | Owner-occupied | Renter-occupied |
| 1-Person Household | 9 (56.2%) | 7 (43.8%) |
| 2-Person Household | 9 (52.9%) | 8 (47.1%) |
| 3-Person Household | 0 (0.0%) | 0 (0.0%) |
| 4+ Person Household | 0 (0.0%) | 0 (0.0%) |
| Total Housing Units | 18 (54.5%) | 15 (45.5%) |
Occupancy by Educational Attainment in Kim
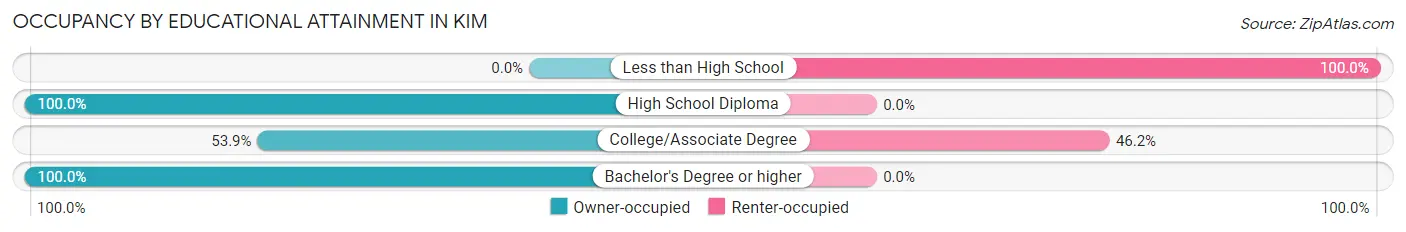
| Household Size | Owner-occupied | Renter-occupied |
| Less than High School | 0 (0.0%) | 9 (100.0%) |
| High School Diploma | 9 (100.0%) | 0 (0.0%) |
| College/Associate Degree | 7 (53.8%) | 6 (46.2%) |
| Bachelor's Degree or higher | 2 (100.0%) | 0 (0.0%) |
Occupancy by Age of Householder in Kim
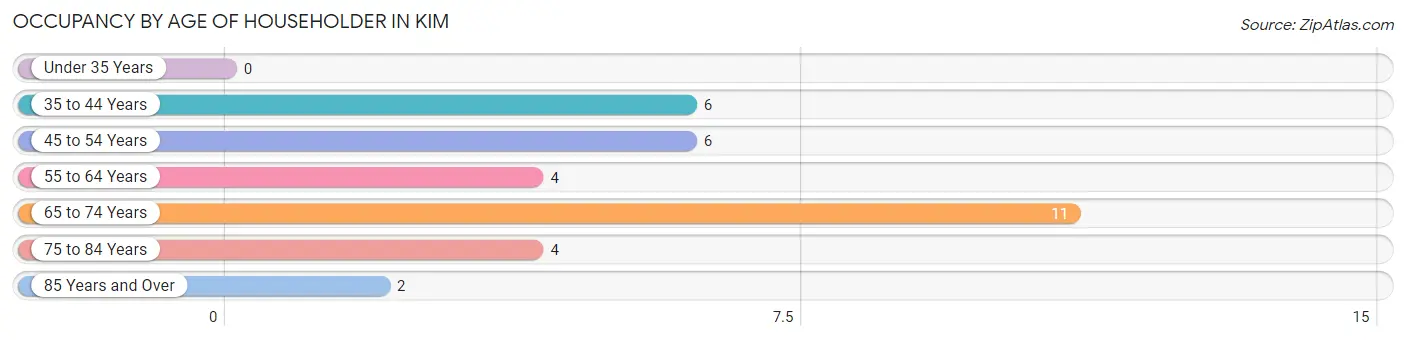
| Age Bracket | # Households | % Households |
| Under 35 Years | 0 | 0.0% |
| 35 to 44 Years | 6 | 18.2% |
| 45 to 54 Years | 6 | 18.2% |
| 55 to 64 Years | 4 | 12.1% |
| 65 to 74 Years | 11 | 33.3% |
| 75 to 84 Years | 4 | 12.1% |
| 85 Years and Over | 2 | 6.1% |
| Total | 33 | 100.0% |
Housing Finances in Kim
Median Income by Occupancy in Kim
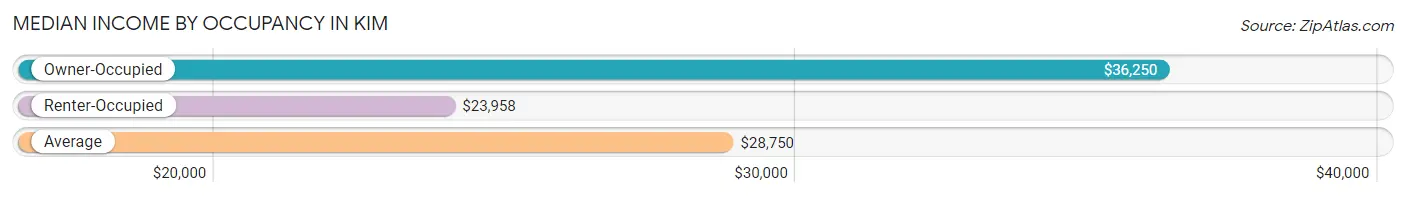
| Occupancy Type | # Households | Median Income |
| Owner-Occupied | 18 (54.5%) | $36,250 |
| Renter-Occupied | 15 (45.5%) | $23,958 |
| Average | 33 (100.0%) | $28,750 |
Occupancy by Householder Income Bracket in Kim
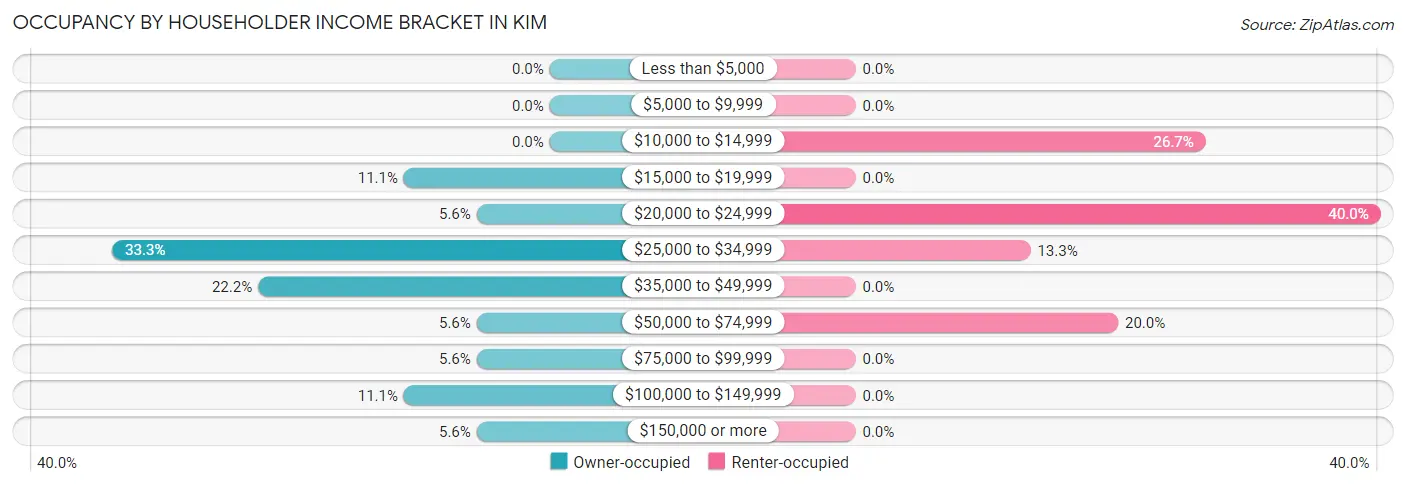
| Income Bracket | Owner-occupied | Renter-occupied |
| Less than $5,000 | 0 (0.0%) | 0 (0.0%) |
| $5,000 to $9,999 | 0 (0.0%) | 0 (0.0%) |
| $10,000 to $14,999 | 0 (0.0%) | 4 (26.7%) |
| $15,000 to $19,999 | 2 (11.1%) | 0 (0.0%) |
| $20,000 to $24,999 | 1 (5.6%) | 6 (40.0%) |
| $25,000 to $34,999 | 6 (33.3%) | 2 (13.3%) |
| $35,000 to $49,999 | 4 (22.2%) | 0 (0.0%) |
| $50,000 to $74,999 | 1 (5.6%) | 3 (20.0%) |
| $75,000 to $99,999 | 1 (5.6%) | 0 (0.0%) |
| $100,000 to $149,999 | 2 (11.1%) | 0 (0.0%) |
| $150,000 or more | 1 (5.6%) | 0 (0.0%) |
| Total | 18 (100.0%) | 15 (100.0%) |
Monthly Housing Cost Tiers in Kim
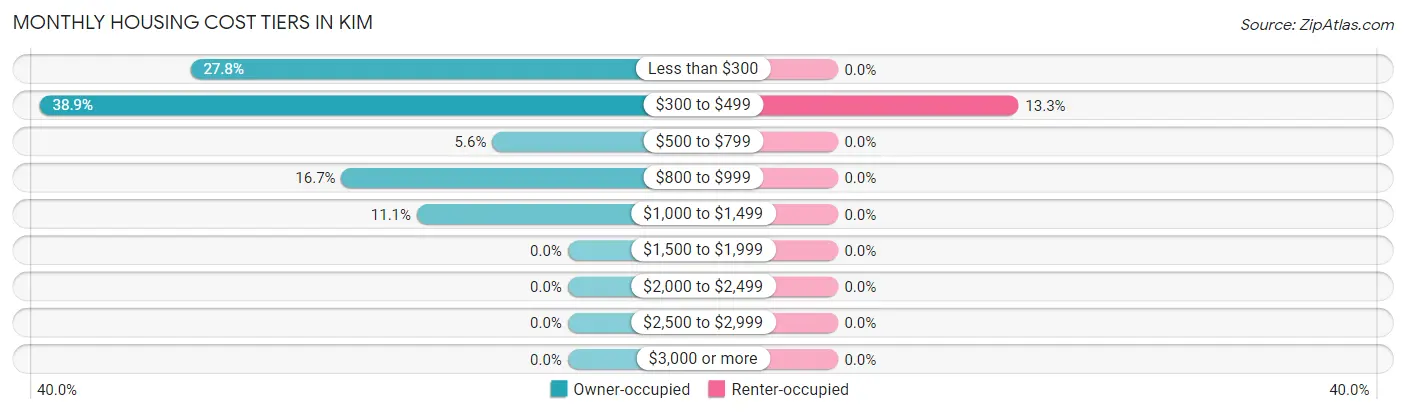
| Monthly Cost | Owner-occupied | Renter-occupied |
| Less than $300 | 5 (27.8%) | 0 (0.0%) |
| $300 to $499 | 7 (38.9%) | 2 (13.3%) |
| $500 to $799 | 1 (5.6%) | 0 (0.0%) |
| $800 to $999 | 3 (16.7%) | 0 (0.0%) |
| $1,000 to $1,499 | 2 (11.1%) | 0 (0.0%) |
| $1,500 to $1,999 | 0 (0.0%) | 0 (0.0%) |
| $2,000 to $2,499 | 0 (0.0%) | 0 (0.0%) |
| $2,500 to $2,999 | 0 (0.0%) | 0 (0.0%) |
| $3,000 or more | 0 (0.0%) | 0 (0.0%) |
| Total | 18 (100.0%) | 15 (100.0%) |
Physical Housing Characteristics in Kim
Housing Structures in Kim
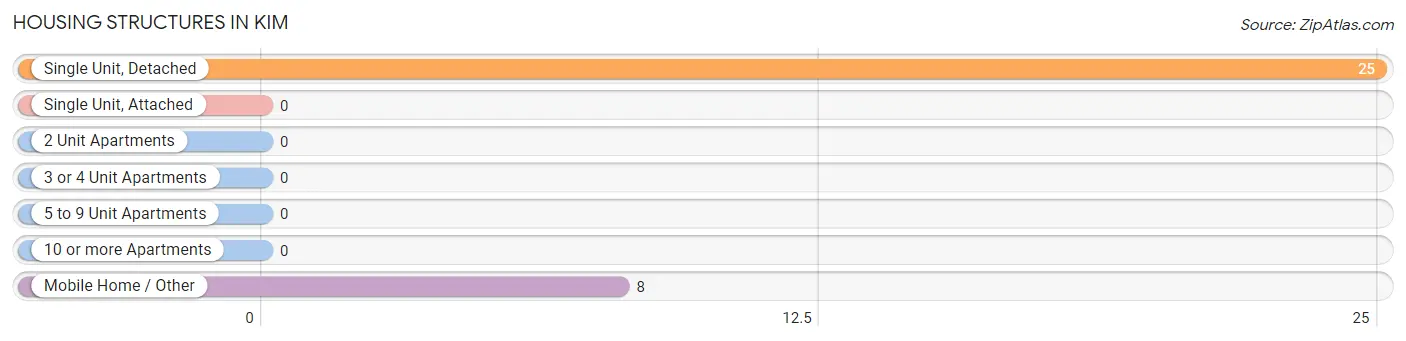
| Structure Type | # Housing Units | % Housing Units |
| Single Unit, Detached | 25 | 75.8% |
| Single Unit, Attached | 0 | 0.0% |
| 2 Unit Apartments | 0 | 0.0% |
| 3 or 4 Unit Apartments | 0 | 0.0% |
| 5 to 9 Unit Apartments | 0 | 0.0% |
| 10 or more Apartments | 0 | 0.0% |
| Mobile Home / Other | 8 | 24.2% |
| Total | 33 | 100.0% |
Housing Structures by Occupancy in Kim
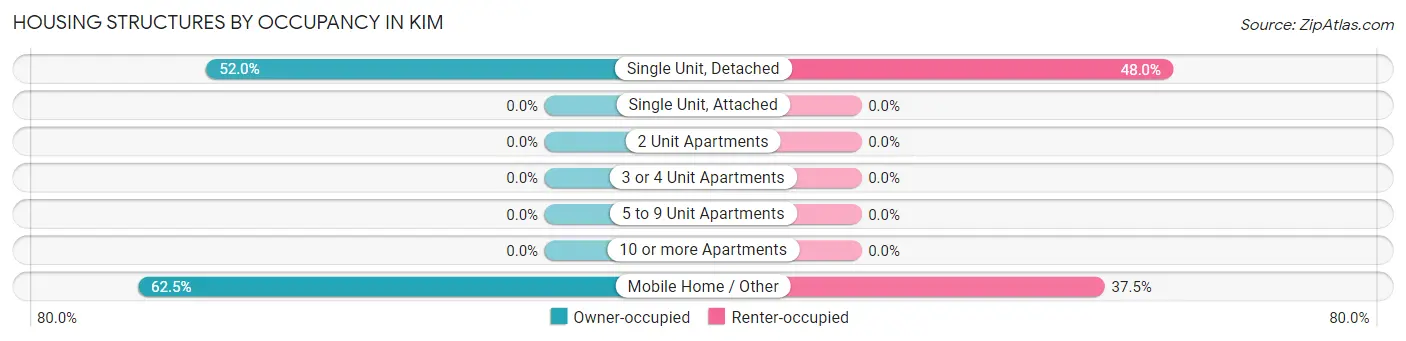
| Structure Type | Owner-occupied | Renter-occupied |
| Single Unit, Detached | 13 (52.0%) | 12 (48.0%) |
| Single Unit, Attached | 0 (0.0%) | 0 (0.0%) |
| 2 Unit Apartments | 0 (0.0%) | 0 (0.0%) |
| 3 or 4 Unit Apartments | 0 (0.0%) | 0 (0.0%) |
| 5 to 9 Unit Apartments | 0 (0.0%) | 0 (0.0%) |
| 10 or more Apartments | 0 (0.0%) | 0 (0.0%) |
| Mobile Home / Other | 5 (62.5%) | 3 (37.5%) |
| Total | 18 (54.5%) | 15 (45.5%) |
Housing Structures by Number of Rooms in Kim
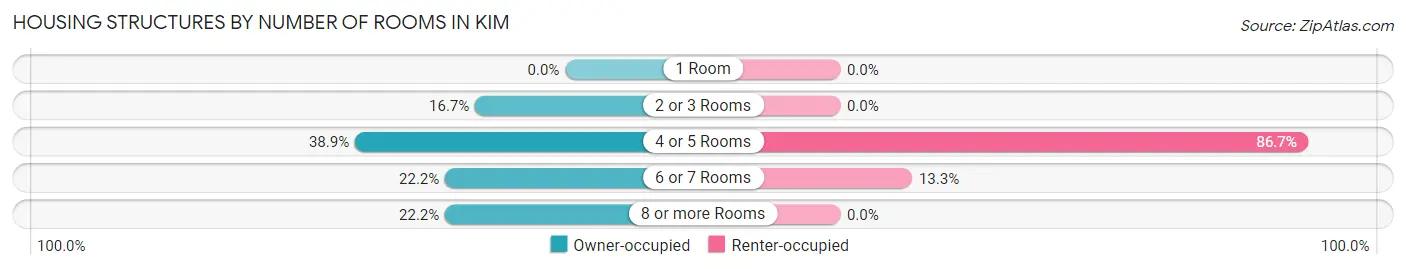
| Number of Rooms | Owner-occupied | Renter-occupied |
| 1 Room | 0 (0.0%) | 0 (0.0%) |
| 2 or 3 Rooms | 3 (16.7%) | 0 (0.0%) |
| 4 or 5 Rooms | 7 (38.9%) | 13 (86.7%) |
| 6 or 7 Rooms | 4 (22.2%) | 2 (13.3%) |
| 8 or more Rooms | 4 (22.2%) | 0 (0.0%) |
| Total | 18 (100.0%) | 15 (100.0%) |
Housing Structure by Heating Type in Kim
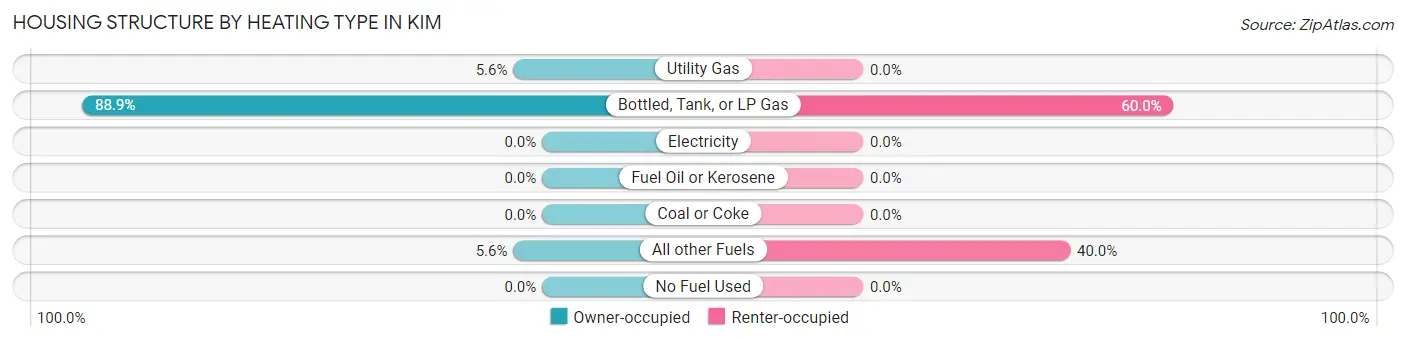
| Heating Type | Owner-occupied | Renter-occupied |
| Utility Gas | 1 (5.6%) | 0 (0.0%) |
| Bottled, Tank, or LP Gas | 16 (88.9%) | 9 (60.0%) |
| Electricity | 0 (0.0%) | 0 (0.0%) |
| Fuel Oil or Kerosene | 0 (0.0%) | 0 (0.0%) |
| Coal or Coke | 0 (0.0%) | 0 (0.0%) |
| All other Fuels | 1 (5.6%) | 6 (40.0%) |
| No Fuel Used | 0 (0.0%) | 0 (0.0%) |
| Total | 18 (100.0%) | 15 (100.0%) |
Household Vehicle Usage in Kim
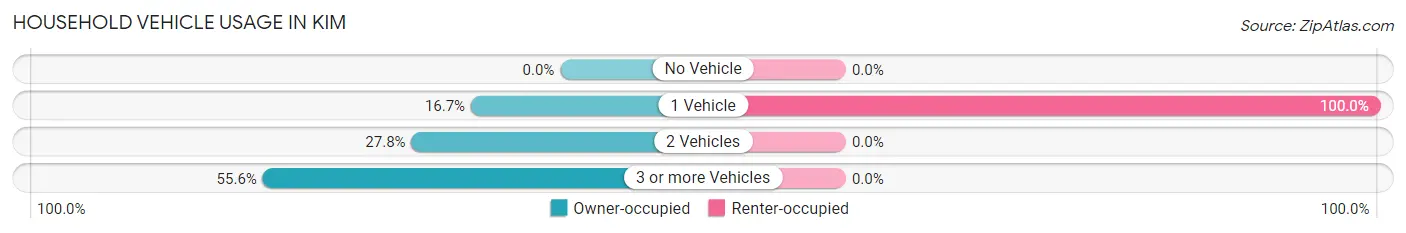
| Vehicles per Household | Owner-occupied | Renter-occupied |
| No Vehicle | 0 (0.0%) | 0 (0.0%) |
| 1 Vehicle | 3 (16.7%) | 15 (100.0%) |
| 2 Vehicles | 5 (27.8%) | 0 (0.0%) |
| 3 or more Vehicles | 10 (55.6%) | 0 (0.0%) |
| Total | 18 (100.0%) | 15 (100.0%) |
Real Estate & Mortgages in Kim
Real Estate and Mortgage Overview in Kim
| Characteristic | Without Mortgage | With Mortgage |
| Housing Units | 17 | 1 |
| Median Property Value | - | - |
| Median Household Income | $38,125 | $0 |
| Monthly Housing Costs | $385 | $0 |
| Real Estate Taxes | $199 | $0 |
Property Value by Mortgage Status in Kim
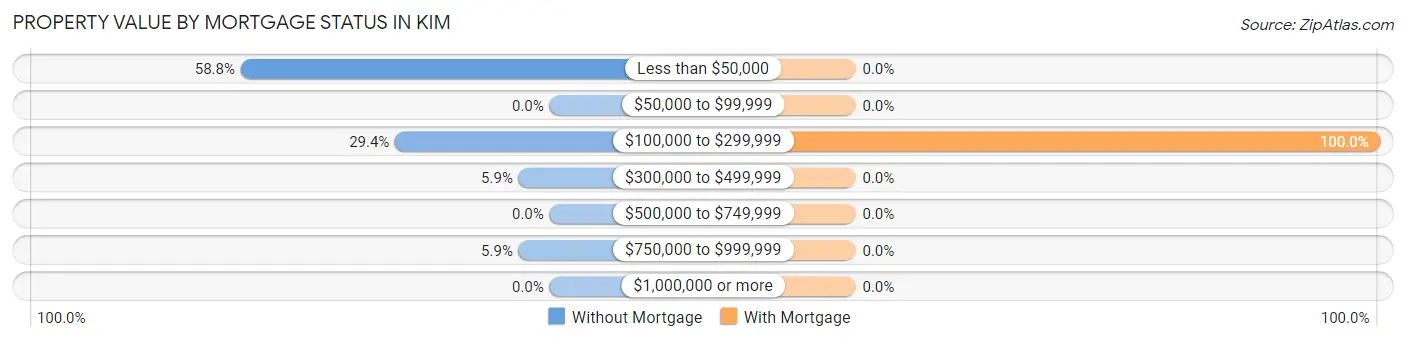
| Property Value | Without Mortgage | With Mortgage |
| Less than $50,000 | 10 (58.8%) | 0 (0.0%) |
| $50,000 to $99,999 | 0 (0.0%) | 0 (0.0%) |
| $100,000 to $299,999 | 5 (29.4%) | 1 (100.0%) |
| $300,000 to $499,999 | 1 (5.9%) | 0 (0.0%) |
| $500,000 to $749,999 | 0 (0.0%) | 0 (0.0%) |
| $750,000 to $999,999 | 1 (5.9%) | 0 (0.0%) |
| $1,000,000 or more | 0 (0.0%) | 0 (0.0%) |
| Total | 17 (100.0%) | 1 (100.0%) |
Household Income by Mortgage Status in Kim
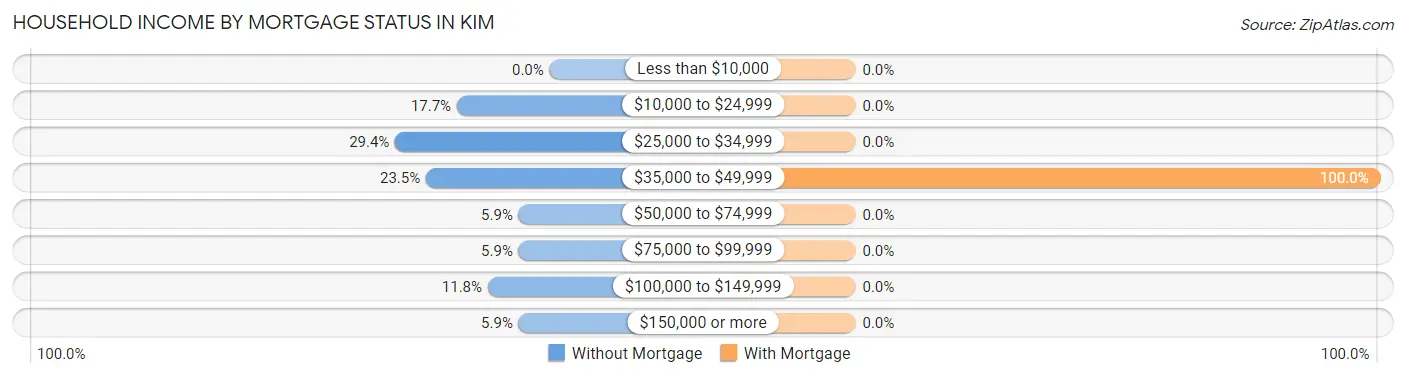
| Household Income | Without Mortgage | With Mortgage |
| Less than $10,000 | 0 (0.0%) | 0 (0.0%) |
| $10,000 to $24,999 | 3 (17.6%) | 0 (0.0%) |
| $25,000 to $34,999 | 5 (29.4%) | 0 (0.0%) |
| $35,000 to $49,999 | 4 (23.5%) | 1 (100.0%) |
| $50,000 to $74,999 | 1 (5.9%) | 0 (0.0%) |
| $75,000 to $99,999 | 1 (5.9%) | 0 (0.0%) |
| $100,000 to $149,999 | 2 (11.8%) | 0 (0.0%) |
| $150,000 or more | 1 (5.9%) | 0 (0.0%) |
| Total | 17 (100.0%) | 1 (100.0%) |
Property Value to Household Income Ratio in Kim
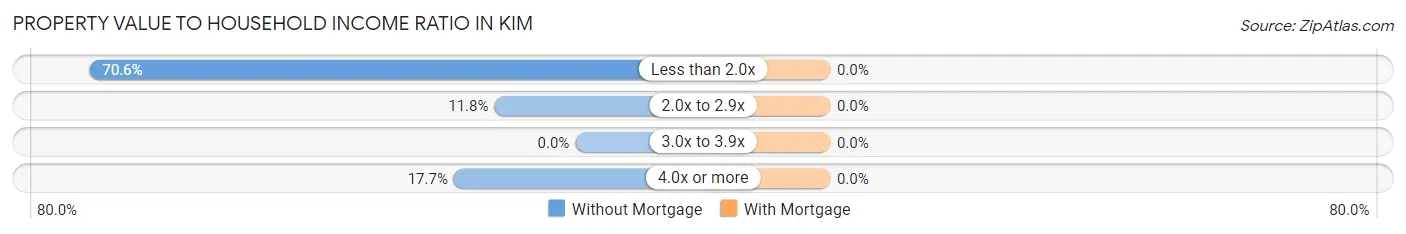
| Value-to-Income Ratio | Without Mortgage | With Mortgage |
| Less than 2.0x | 12 (70.6%) | 0 (0.0%) |
| 2.0x to 2.9x | 2 (11.8%) | 0 (0.0%) |
| 3.0x to 3.9x | 0 (0.0%) | 0 (0.0%) |
| 4.0x or more | 3 (17.6%) | 0 (0.0%) |
| Total | 17 (100.0%) | 1 (100.0%) |
Real Estate Taxes by Mortgage Status in Kim
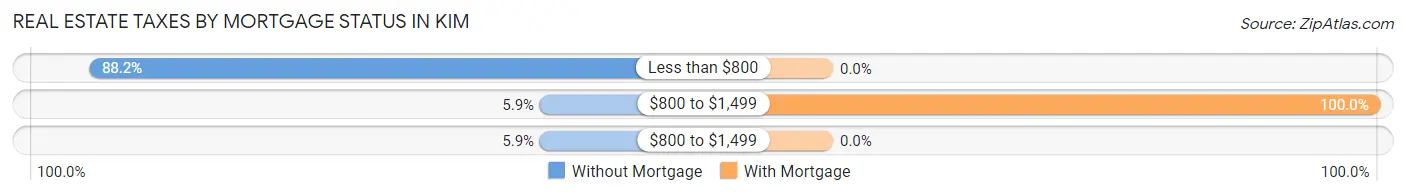
| Property Taxes | Without Mortgage | With Mortgage |
| Less than $800 | 15 (88.2%) | 0 (0.0%) |
| $800 to $1,499 | 1 (5.9%) | 1 (100.0%) |
| $800 to $1,499 | 1 (5.9%) | 0 (0.0%) |
| Total | 17 (100.0%) | 1 (100.0%) |
Health & Disability in Kim
Health Insurance Coverage by Age in Kim
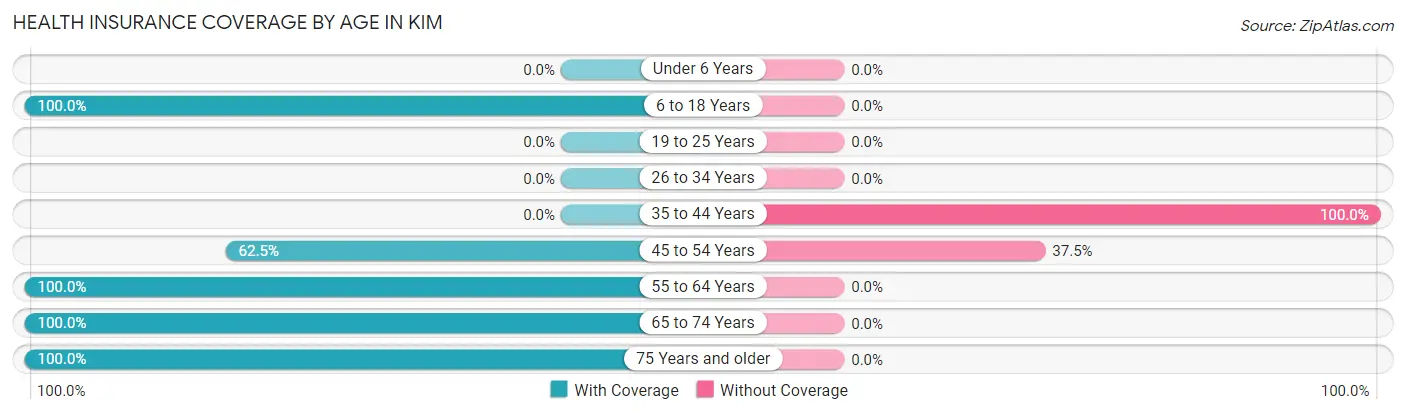
| Age Bracket | With Coverage | Without Coverage |
| Under 6 Years | 0 (0.0%) | 0 (0.0%) |
| 6 to 18 Years | 2 (100.0%) | 0 (0.0%) |
| 19 to 25 Years | 0 (0.0%) | 0 (0.0%) |
| 26 to 34 Years | 0 (0.0%) | 0 (0.0%) |
| 35 to 44 Years | 0 (0.0%) | 11 (100.0%) |
| 45 to 54 Years | 5 (62.5%) | 3 (37.5%) |
| 55 to 64 Years | 5 (100.0%) | 0 (0.0%) |
| 65 to 74 Years | 15 (100.0%) | 0 (0.0%) |
| 75 Years and older | 10 (100.0%) | 0 (0.0%) |
| Total | 37 (72.6%) | 14 (27.5%) |
Health Insurance Coverage by Citizenship Status in Kim
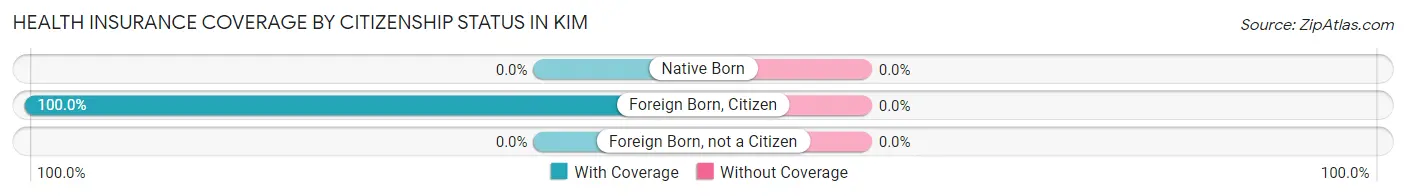
| Citizenship Status | With Coverage | Without Coverage |
| Native Born | 0 (0.0%) | 0 (0.0%) |
| Foreign Born, Citizen | 2 (100.0%) | 0 (0.0%) |
| Foreign Born, not a Citizen | 0 (0.0%) | 0 (0.0%) |
Health Insurance Coverage by Household Income in Kim
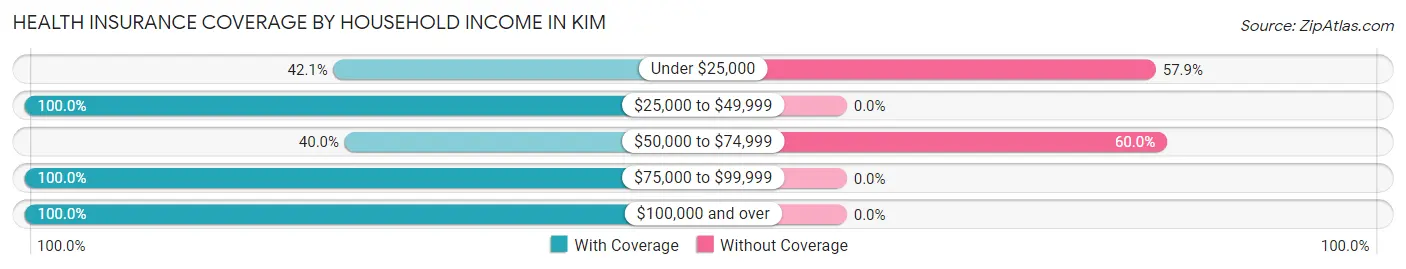
| Household Income | With Coverage | Without Coverage |
| Under $25,000 | 8 (42.1%) | 11 (57.9%) |
| $25,000 to $49,999 | 19 (100.0%) | 0 (0.0%) |
| $50,000 to $74,999 | 2 (40.0%) | 3 (60.0%) |
| $75,000 to $99,999 | 3 (100.0%) | 0 (0.0%) |
| $100,000 and over | 5 (100.0%) | 0 (0.0%) |
Public vs Private Health Insurance Coverage by Age in Kim
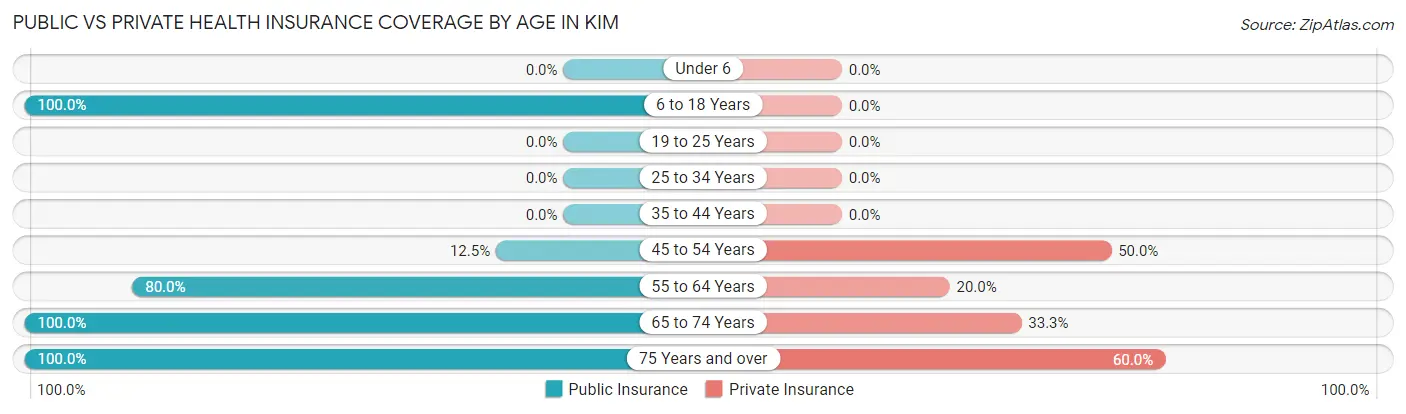
| Age Bracket | Public Insurance | Private Insurance |
| Under 6 | 0 (0.0%) | 0 (0.0%) |
| 6 to 18 Years | 2 (100.0%) | 0 (0.0%) |
| 19 to 25 Years | 0 (0.0%) | 0 (0.0%) |
| 25 to 34 Years | 0 (0.0%) | 0 (0.0%) |
| 35 to 44 Years | 0 (0.0%) | 0 (0.0%) |
| 45 to 54 Years | 1 (12.5%) | 4 (50.0%) |
| 55 to 64 Years | 4 (80.0%) | 1 (20.0%) |
| 65 to 74 Years | 15 (100.0%) | 5 (33.3%) |
| 75 Years and over | 10 (100.0%) | 6 (60.0%) |
| Total | 32 (62.7%) | 16 (31.4%) |
Disability Status by Sex by Age in Kim

| Age Bracket | Male | Female |
| Under 5 Years | 0 (0.0%) | 0 (0.0%) |
| 5 to 17 Years | 0 (0.0%) | 0 (0.0%) |
| 18 to 34 Years | 0 (0.0%) | 0 (0.0%) |
| 35 to 64 Years | 4 (28.6%) | 0 (0.0%) |
| 65 to 74 Years | 0 (0.0%) | 0 (0.0%) |
| 75 Years and over | 0 (0.0%) | 0 (0.0%) |
Disability Class by Sex by Age in Kim
Disability Class: Hearing Difficulty
| Age Bracket | Male | Female |
| Under 5 Years | 0 (0.0%) | 0 (0.0%) |
| 5 to 17 Years | 0 (0.0%) | 0 (0.0%) |
| 18 to 34 Years | 0 (0.0%) | 0 (0.0%) |
| 35 to 64 Years | 0 (0.0%) | 0 (0.0%) |
| 65 to 74 Years | 0 (0.0%) | 0 (0.0%) |
| 75 Years and over | 0 (0.0%) | 0 (0.0%) |
Disability Class: Vision Difficulty
| Age Bracket | Male | Female |
| Under 5 Years | 0 (0.0%) | 0 (0.0%) |
| 5 to 17 Years | 0 (0.0%) | 0 (0.0%) |
| 18 to 34 Years | 0 (0.0%) | 0 (0.0%) |
| 35 to 64 Years | 2 (14.3%) | 0 (0.0%) |
| 65 to 74 Years | 0 (0.0%) | 0 (0.0%) |
| 75 Years and over | 0 (0.0%) | 0 (0.0%) |
Disability Class: Cognitive Difficulty
| Age Bracket | Male | Female |
| 5 to 17 Years | 0 (0.0%) | 0 (0.0%) |
| 18 to 34 Years | 0 (0.0%) | 0 (0.0%) |
| 35 to 64 Years | 0 (0.0%) | 0 (0.0%) |
| 65 to 74 Years | 0 (0.0%) | 0 (0.0%) |
| 75 Years and over | 0 (0.0%) | 0 (0.0%) |
Disability Class: Ambulatory Difficulty
| Age Bracket | Male | Female |
| 5 to 17 Years | 0 (0.0%) | 0 (0.0%) |
| 18 to 34 Years | 0 (0.0%) | 0 (0.0%) |
| 35 to 64 Years | 2 (14.3%) | 0 (0.0%) |
| 65 to 74 Years | 0 (0.0%) | 0 (0.0%) |
| 75 Years and over | 0 (0.0%) | 0 (0.0%) |
Disability Class: Self-Care Difficulty
| Age Bracket | Male | Female |
| 5 to 17 Years | 0 (0.0%) | 0 (0.0%) |
| 18 to 34 Years | 0 (0.0%) | 0 (0.0%) |
| 35 to 64 Years | 0 (0.0%) | 0 (0.0%) |
| 65 to 74 Years | 0 (0.0%) | 0 (0.0%) |
| 75 Years and over | 0 (0.0%) | 0 (0.0%) |
Technology Access in Kim
Computing Device Access in Kim
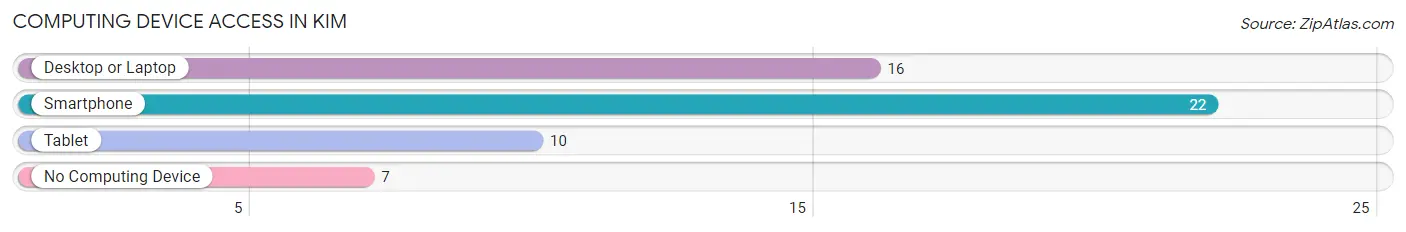
| Device Type | # Households | % Households |
| Desktop or Laptop | 16 | 48.5% |
| Smartphone | 22 | 66.7% |
| Tablet | 10 | 30.3% |
| No Computing Device | 7 | 21.2% |
| Total | 33 | 100.0% |
Internet Access in Kim
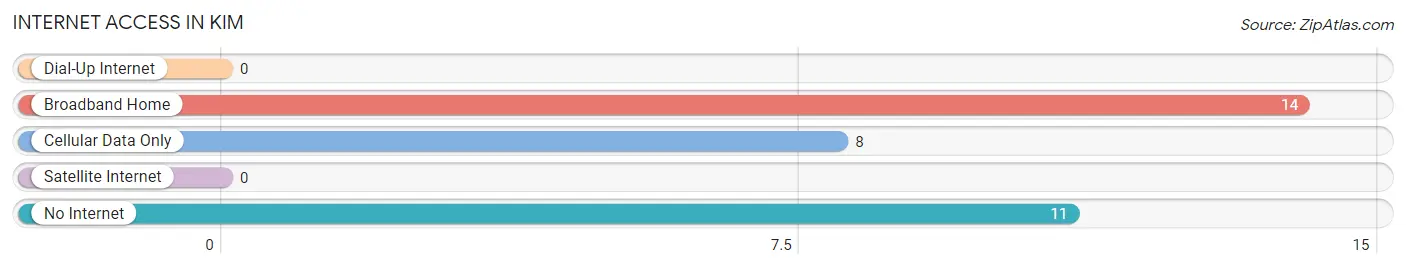
| Internet Type | # Households | % Households |
| Dial-Up Internet | 0 | 0.0% |
| Broadband Home | 14 | 42.4% |
| Cellular Data Only | 8 | 24.2% |
| Satellite Internet | 0 | 0.0% |
| No Internet | 11 | 33.3% |
| Total | 33 | 100.0% |
Kim Summary
CO History
Colorado is a state located in the western United States. It is the 8th most populous state in the country and the 21st largest by area. Colorado was admitted to the Union on August 1, 1876, becoming the 38th state. The state was named after the Colorado River, which Spanish explorers named the Río Colorado for the red colored silt the river carried from the mountains.
Prior to the arrival of Europeans, the area that is now Colorado was inhabited by Native American tribes, including the Ute, Arapaho, and Cheyenne. The first Europeans to explore the area were Spanish conquistadors, who arrived in the late 1500s. The first permanent European settlement in Colorado was established in 1858 by William Green Russell, a prospector who discovered gold in the area.
The Colorado Gold Rush of 1859 brought thousands of prospectors to the area, and the population of the state quickly grew. The discovery of gold also led to the creation of the Colorado Territory in 1861. Colorado was admitted to the Union in 1876, becoming the 38th state.
Geography
Colorado is located in the western United States, bordered by Wyoming to the north, Nebraska to the northeast, Kansas to the east, Oklahoma to the southeast, New Mexico to the south, Utah to the west, and Arizona to the southwest. Colorado is the 8th largest state in the country, with an area of 104,093 square miles.
The state is divided into four distinct geographic regions: the Rocky Mountains, the Great Plains, the Colorado Plateau, and the Southwest. The Rocky Mountains, which run through the center of the state, are the highest mountain range in the United States. The highest peak in the state is Mount Elbert, which stands at 14,440 feet.
The Great Plains are located in the eastern part of the state, and are characterized by rolling hills and prairies. The Colorado Plateau is located in the western part of the state, and is characterized by high plateaus and deep canyons. The Southwest region is located in the southwestern corner of the state, and is characterized by desert landscapes.
Economy
The economy of Colorado is driven by a diverse mix of industries, including agriculture, mining, manufacturing, tourism, and technology. The state is the largest producer of molybdenum, a metal used in steel production, and is also a major producer of coal, oil, and natural gas.
Agriculture is an important part of the state’s economy, with the production of wheat, corn, hay, and other crops. Livestock production, including cattle, sheep, and hogs, is also an important part of the state’s agricultural sector.
Manufacturing is an important part of the state’s economy, with the production of food products, machinery, chemicals, and other goods. Tourism is also an important part of the state’s economy, with millions of visitors coming to the state each year to enjoy its natural beauty and outdoor recreation opportunities.
Demographics
As of 2019, the population of Colorado was estimated to be 5,758,736, making it the 8th most populous state in the country. The state has a population density of 52.3 people per square mile.
The largest city in Colorado is Denver, with a population of 716,492. Other major cities in the state include Colorado Springs, Aurora, Fort Collins, and Lakewood.
The racial makeup of Colorado is 79.2% White, 4.3% Black or African American, 1.2% American Indian or Alaska Native, 4.7% Asian, 0.2% Native Hawaiian or Pacific Islander, and 10.4% from two or more races. The state also has a large Hispanic or Latino population, making up 21.2% of the population.
The median household income in Colorado is $68,907, and the median home value is $372,400. The state’s unemployment rate is 3.2%.
Common Questions
What is Per Capita Income in Kim?
Per Capita income in Kim is $27,524.
What is the Median Family Income in Kim?
Median Family Income in Kim is $28,036.
What is the Median Household income in Kim?
Median Household Income in Kim is $28,750.
What is Inequality or Gini Index in Kim?
Inequality or Gini Index in Kim is 0.38.
What is the Total Population of Kim?
Total Population of Kim is 51.
What is the Total Male Population of Kim?
Total Male Population of Kim is 30.
What is the Total Female Population of Kim?
Total Female Population of Kim is 21.
What is the Ratio of Males per 100 Females in Kim?
There are 142.86 Males per 100 Females in Kim.
What is the Ratio of Females per 100 Males in Kim?
There are 70.00 Females per 100 Males in Kim.
What is the Median Population Age in Kim?
Median Population Age in Kim is 60.5 Years.
What is the Average Family Size in Kim
Average Family Size in Kim is 2.1 People.
What is the Average Household Size in Kim
Average Household Size in Kim is 1.6 People.
How Large is the Labor Force in Kim?
There are 20 People in the Labor Forcein in Kim.
What is the Percentage of People in the Labor Force in Kim?
39.2% of People are in the Labor Force in Kim.