Roosevelt, WA Map & Demographics
Roosevelt Map
Roosevelt Overview
$17,226
PER CAPITA INCOME
$51,458
AVG FAMILY INCOME
$44,000
AVG HOUSEHOLD INCOME
0.47
INEQUALITY / GINI INDEX
192
TOTAL POPULATION
93
MALE POPULATION
99
FEMALE POPULATION
93.94
MALES / 100 FEMALES
106.45
FEMALES / 100 MALES
24.8
MEDIAN AGE
4.7
AVG FAMILY SIZE
3.7
AVG HOUSEHOLD SIZE
70
LABOR FORCE [ PEOPLE ]
49.0%
PERCENT IN LABOR FORCE
17.1%
UNEMPLOYMENT RATE
Roosevelt Zip Codes
Roosevelt Area Codes
Income in Roosevelt
Income Overview in Roosevelt
Per Capita Income in Roosevelt is $17,226, while median incomes of families and households are $51,458 and $44,000 respectively.
| Characteristic | Number | Measure |
| Per Capita Income | 192 | $17,226 |
| Median Family Income | 37 | $51,458 |
| Mean Family Income | 37 | $72,892 |
| Median Household Income | 52 | $44,000 |
| Mean Household Income | 52 | $57,188 |
| Income Deficit | 37 | $0 |
| Wage / Income Gap (%) | 192 | 0.00% |
| Wage / Income Gap ($) | 192 | 100.00¢ per $1 |
| Gini / Inequality Index | 192 | 0.47 |
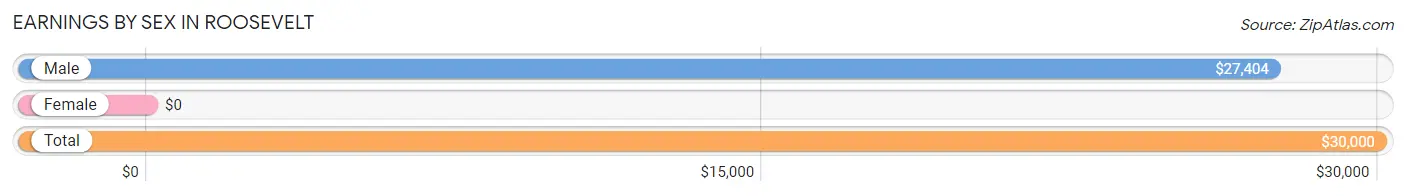
Earnings by Sex in Roosevelt
| Sex | Number | Average Earnings |
| Male | 51 (87.9%) | $27,404 |
| Female | 7 (12.1%) | $0 |
| Total | 58 (100.0%) | $30,000 |
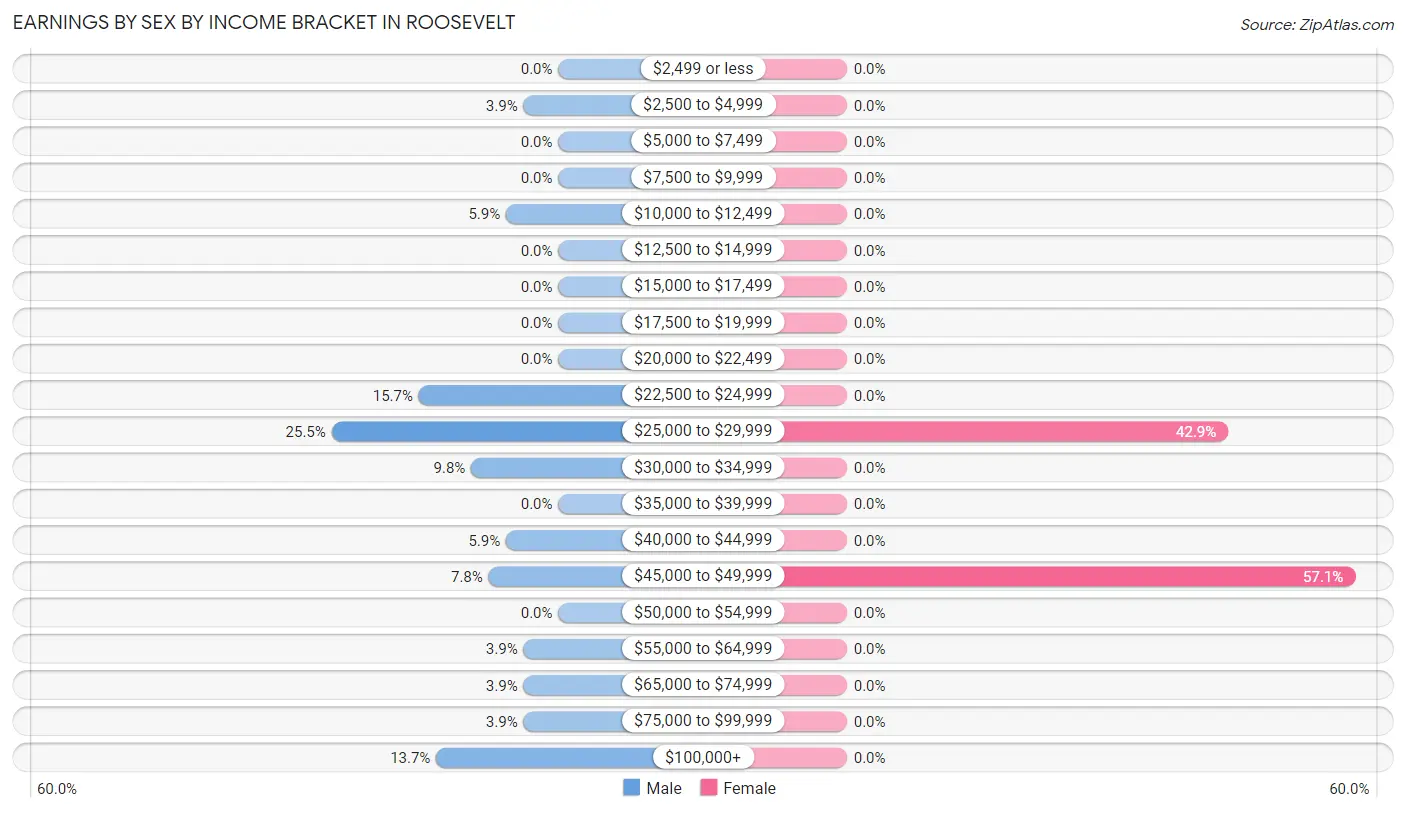
Earnings by Sex by Income Bracket in Roosevelt
The most common earnings brackets in Roosevelt are $25,000 to $29,999 for men (13 | 25.5%) and $45,000 to $49,999 for women (4 | 57.1%).
| Income | Male | Female |
| $2,499 or less | 0 (0.0%) | 0 (0.0%) |
| $2,500 to $4,999 | 2 (3.9%) | 0 (0.0%) |
| $5,000 to $7,499 | 0 (0.0%) | 0 (0.0%) |
| $7,500 to $9,999 | 0 (0.0%) | 0 (0.0%) |
| $10,000 to $12,499 | 3 (5.9%) | 0 (0.0%) |
| $12,500 to $14,999 | 0 (0.0%) | 0 (0.0%) |
| $15,000 to $17,499 | 0 (0.0%) | 0 (0.0%) |
| $17,500 to $19,999 | 0 (0.0%) | 0 (0.0%) |
| $20,000 to $22,499 | 0 (0.0%) | 0 (0.0%) |
| $22,500 to $24,999 | 8 (15.7%) | 0 (0.0%) |
| $25,000 to $29,999 | 13 (25.5%) | 3 (42.9%) |
| $30,000 to $34,999 | 5 (9.8%) | 0 (0.0%) |
| $35,000 to $39,999 | 0 (0.0%) | 0 (0.0%) |
| $40,000 to $44,999 | 3 (5.9%) | 0 (0.0%) |
| $45,000 to $49,999 | 4 (7.8%) | 4 (57.1%) |
| $50,000 to $54,999 | 0 (0.0%) | 0 (0.0%) |
| $55,000 to $64,999 | 2 (3.9%) | 0 (0.0%) |
| $65,000 to $74,999 | 2 (3.9%) | 0 (0.0%) |
| $75,000 to $99,999 | 2 (3.9%) | 0 (0.0%) |
| $100,000+ | 7 (13.7%) | 0 (0.0%) |
| Total | 51 (100.0%) | 7 (100.0%) |
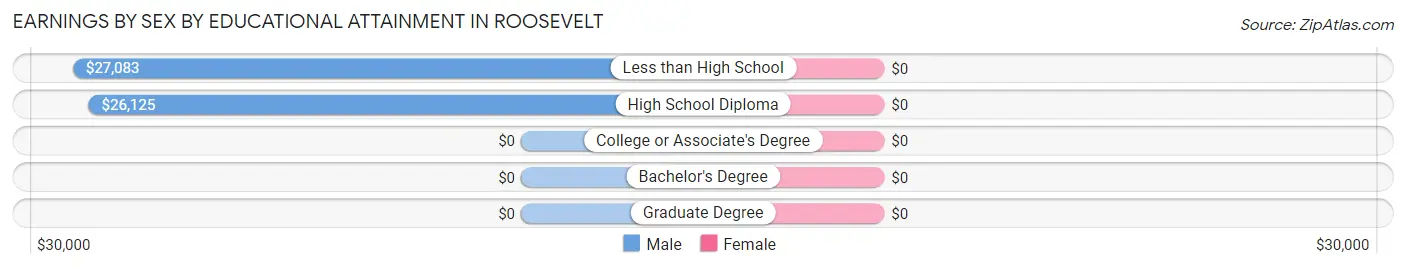
Earnings by Sex by Educational Attainment in Roosevelt
| Educational Attainment | Male Income | Female Income |
| Less than High School | $27,083 | $0 |
| High School Diploma | $26,125 | $0 |
| College or Associate's Degree | - | - |
| Bachelor's Degree | - | - |
| Graduate Degree | - | - |
| Total | $26,538 | $0 |
Family Income in Roosevelt
Family Income Brackets in Roosevelt
According to the Roosevelt family income data, there are 13 families falling into the $50,000 to $74,999 income range, which is the most common income bracket and makes up 35.1% of all families.
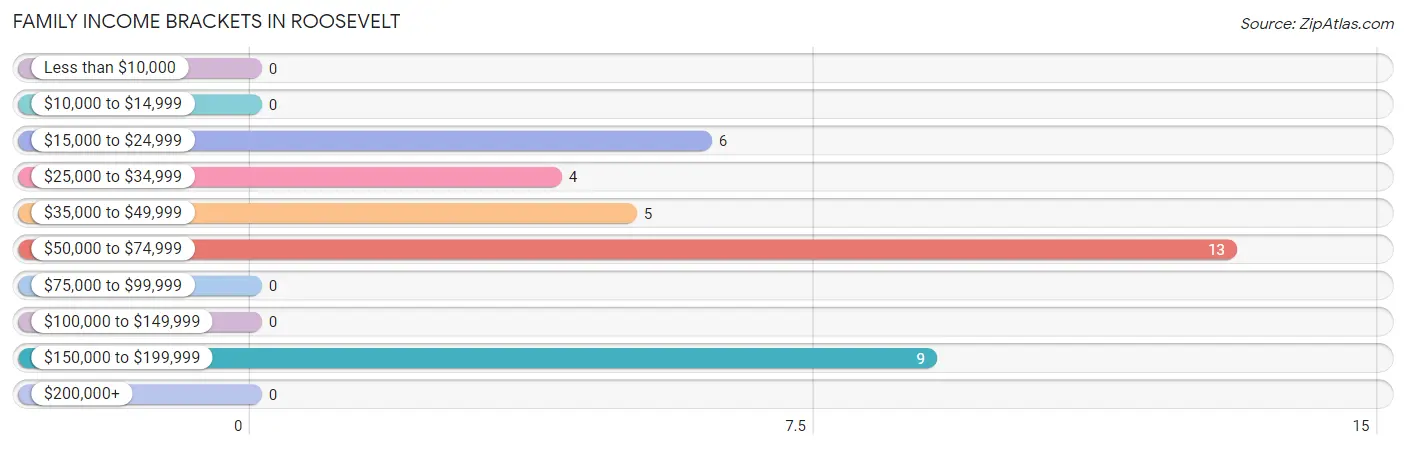
| Income Bracket | # Families | % Families |
| Less than $10,000 | 0 | 0.0% |
| $10,000 to $14,999 | 0 | 0.0% |
| $15,000 to $24,999 | 6 | 16.2% |
| $25,000 to $34,999 | 4 | 10.8% |
| $35,000 to $49,999 | 5 | 13.5% |
| $50,000 to $74,999 | 13 | 35.1% |
| $75,000 to $99,999 | 0 | 0.0% |
| $100,000 to $149,999 | 0 | 0.0% |
| $150,000 to $199,999 | 9 | 24.3% |
| $200,000+ | 0 | 0.0% |
Family Income by Famaliy Size in Roosevelt
2-person families (18 | 48.6%) account for the highest median family income in Roosevelt with $65,000 per family, while 2-person families (18 | 48.6%) have the highest median income of $32,500 per family member.
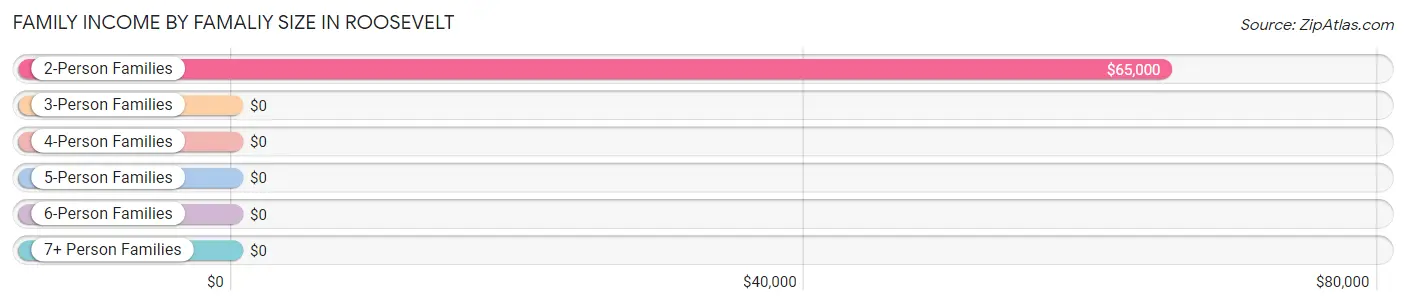
| Income Bracket | # Families | Median Income |
| 2-Person Families | 18 (48.6%) | $65,000 |
| 3-Person Families | 0 (0.0%) | $0 |
| 4-Person Families | 4 (10.8%) | $0 |
| 5-Person Families | 0 (0.0%) | $0 |
| 6-Person Families | 11 (29.7%) | $0 |
| 7+ Person Families | 4 (10.8%) | $0 |
| Total | 37 (100.0%) | $51,458 |
Family Income by Number of Earners in Roosevelt
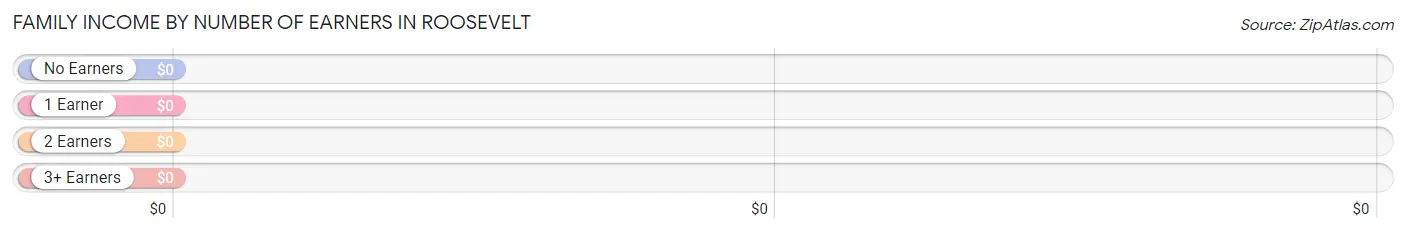
| Number of Earners | # Families | Median Income |
| No Earners | 9 (24.3%) | $0 |
| 1 Earner | 18 (48.6%) | $0 |
| 2 Earners | 8 (21.6%) | $0 |
| 3+ Earners | 2 (5.4%) | $0 |
| Total | 37 (100.0%) | $51,458 |
Household Income in Roosevelt
Household Income Brackets in Roosevelt
With 15 households falling in the category, the $50,000 to $74,999 income range is the most frequent in Roosevelt, accounting for 28.8% of all households.
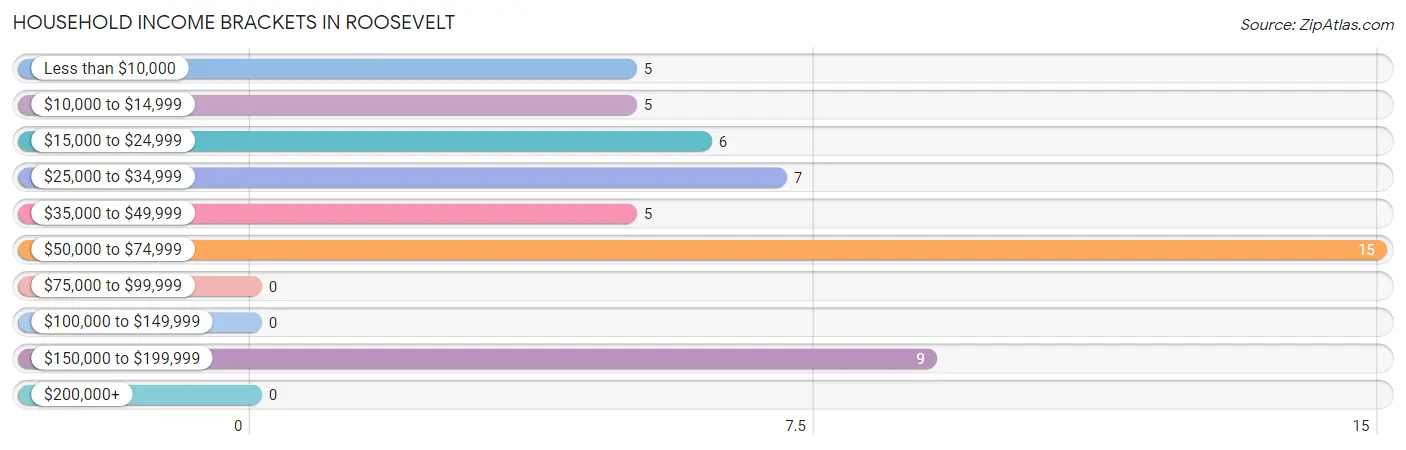
| Income Bracket | # Households | % Households |
| Less than $10,000 | 5 | 9.6% |
| $10,000 to $14,999 | 5 | 9.6% |
| $15,000 to $24,999 | 6 | 11.5% |
| $25,000 to $34,999 | 7 | 13.5% |
| $35,000 to $49,999 | 5 | 9.6% |
| $50,000 to $74,999 | 15 | 28.8% |
| $75,000 to $99,999 | 0 | 0.0% |
| $100,000 to $149,999 | 0 | 0.0% |
| $150,000 to $199,999 | 9 | 17.3% |
| $200,000+ | 0 | 0.0% |
Household Income by Householder Age in Roosevelt
The median household income in Roosevelt is $44,000, with the highest median household income of $50,625 found in the 25 to 44 years age bracket for the primary householder. A total of 13 households (25.0%) fall into this category. Meanwhile, the 15 to 24 years age bracket for the primary householder has the lowest median household income of $0, with 5 households (9.6%) in this group.
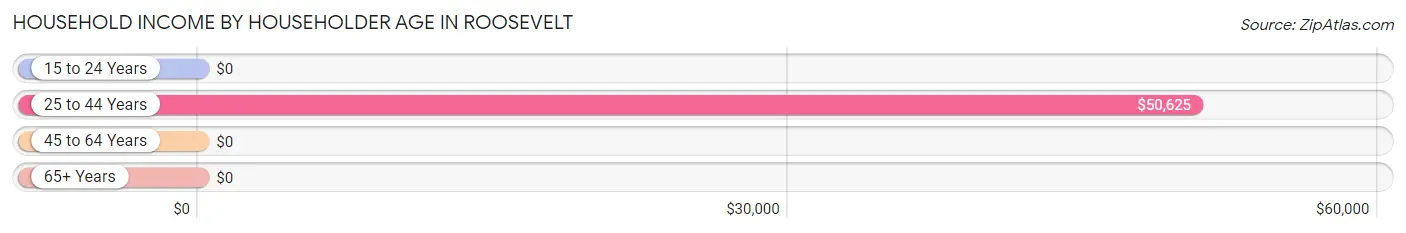
| Income Bracket | # Households | Median Income |
| 15 to 24 Years | 5 (9.6%) | $0 |
| 25 to 44 Years | 13 (25.0%) | $50,625 |
| 45 to 64 Years | 21 (40.4%) | $0 |
| 65+ Years | 13 (25.0%) | $0 |
| Total | 52 (100.0%) | $44,000 |
Poverty in Roosevelt
Income Below Poverty by Sex and Age in Roosevelt
With 11.8% poverty level for males and 14.1% for females among the residents of Roosevelt, 15 year old males and 18 to 24 year old females are the most vulnerable to poverty, with 3 males (100.0%) and 5 females (100.0%) in their respective age groups living below the poverty level.
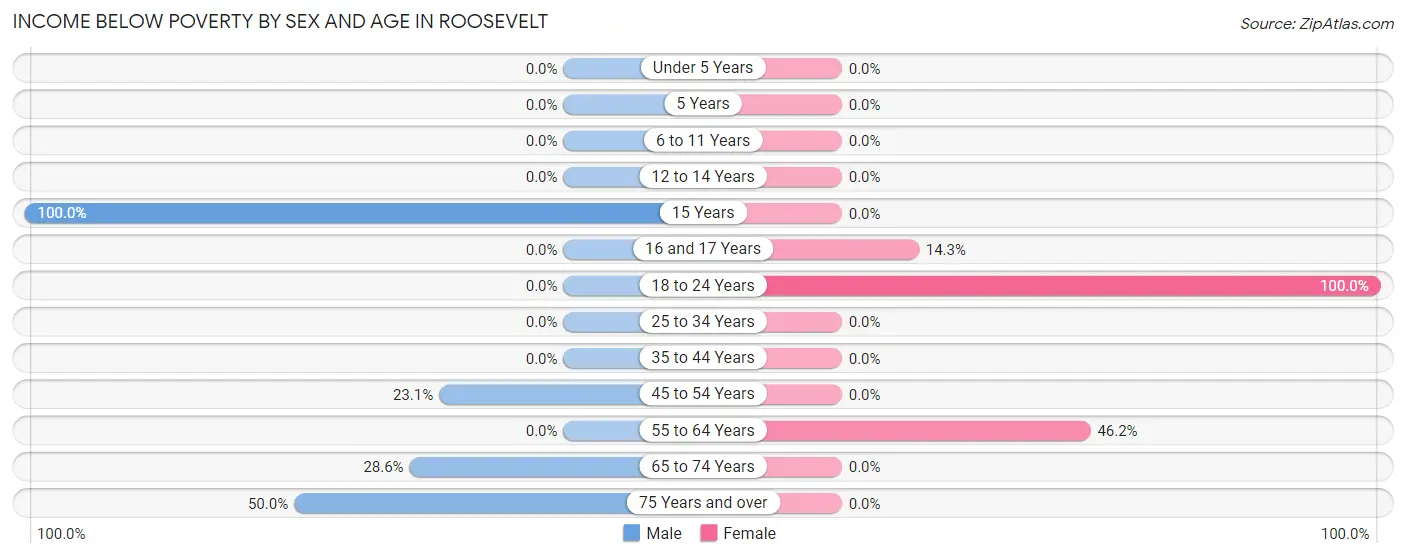
| Age Bracket | Male | Female |
| Under 5 Years | 0 (0.0%) | 0 (0.0%) |
| 5 Years | 0 (0.0%) | 0 (0.0%) |
| 6 to 11 Years | 0 (0.0%) | 0 (0.0%) |
| 12 to 14 Years | 0 (0.0%) | 0 (0.0%) |
| 15 Years | 3 (100.0%) | 0 (0.0%) |
| 16 and 17 Years | 0 (0.0%) | 3 (14.3%) |
| 18 to 24 Years | 0 (0.0%) | 5 (100.0%) |
| 25 to 34 Years | 0 (0.0%) | 0 (0.0%) |
| 35 to 44 Years | 0 (0.0%) | 0 (0.0%) |
| 45 to 54 Years | 3 (23.1%) | 0 (0.0%) |
| 55 to 64 Years | 0 (0.0%) | 6 (46.2%) |
| 65 to 74 Years | 2 (28.6%) | 0 (0.0%) |
| 75 Years and over | 3 (50.0%) | 0 (0.0%) |
| Total | 11 (11.8%) | 14 (14.1%) |
Income Above Poverty by Sex and Age in Roosevelt
According to the poverty statistics in Roosevelt, males aged under 5 years and females aged 6 to 11 years are the age groups that are most secure financially, with 100.0% of males and 100.0% of females in these age groups living above the poverty line.
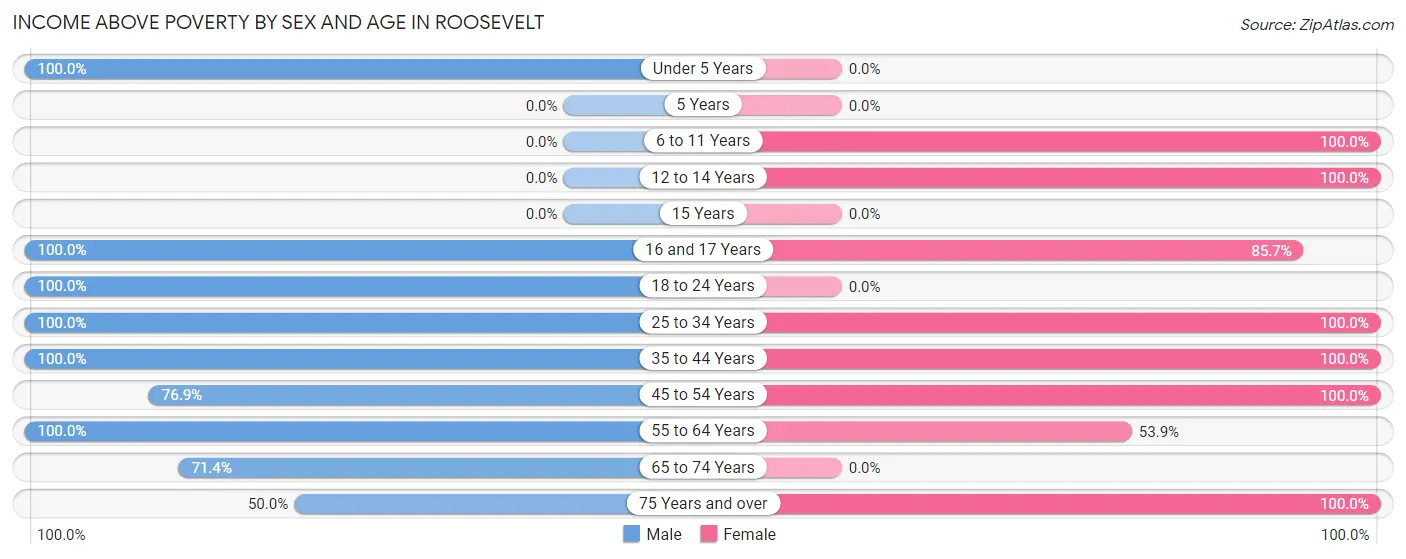
| Age Bracket | Male | Female |
| Under 5 Years | 17 (100.0%) | 0 (0.0%) |
| 5 Years | 0 (0.0%) | 0 (0.0%) |
| 6 to 11 Years | 0 (0.0%) | 17 (100.0%) |
| 12 to 14 Years | 0 (0.0%) | 12 (100.0%) |
| 15 Years | 0 (0.0%) | 0 (0.0%) |
| 16 and 17 Years | 3 (100.0%) | 18 (85.7%) |
| 18 to 24 Years | 20 (100.0%) | 0 (0.0%) |
| 25 to 34 Years | 13 (100.0%) | 5 (100.0%) |
| 35 to 44 Years | 8 (100.0%) | 11 (100.0%) |
| 45 to 54 Years | 10 (76.9%) | 11 (100.0%) |
| 55 to 64 Years | 3 (100.0%) | 7 (53.8%) |
| 65 to 74 Years | 5 (71.4%) | 0 (0.0%) |
| 75 Years and over | 3 (50.0%) | 4 (100.0%) |
| Total | 82 (88.2%) | 85 (85.9%) |
Income Below Poverty Among Married-Couple Families in Roosevelt
The poverty statistics for married-couple families in Roosevelt show that 14.3% or 4 of the total 28 families live below the poverty line. Families with 1 or 2 children have the highest poverty rate of 66.7%, comprising of 4 families. On the other hand, families with no children have the lowest poverty rate of 0.0%, which includes 0 families.
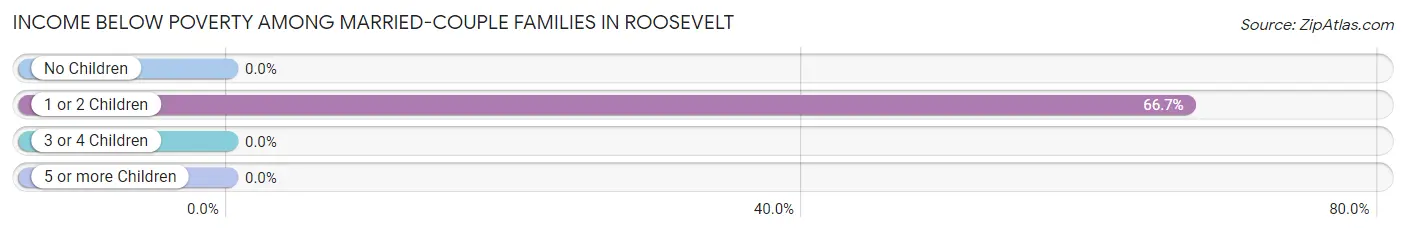
| Children | Above Poverty | Below Poverty |
| No Children | 9 (100.0%) | 0 (0.0%) |
| 1 or 2 Children | 2 (33.3%) | 4 (66.7%) |
| 3 or 4 Children | 13 (100.0%) | 0 (0.0%) |
| 5 or more Children | 0 (0.0%) | 0 (0.0%) |
| Total | 24 (85.7%) | 4 (14.3%) |
Income Below Poverty Among Single-Parent Households in Roosevelt
| Children | Single Father | Single Mother |
| No Children | 0 (0.0%) | 0 (0.0%) |
| 1 or 2 Children | 0 (0.0%) | 0 (0.0%) |
| 3 or 4 Children | 0 (0.0%) | 0 (0.0%) |
| 5 or more Children | 0 (0.0%) | 0 (0.0%) |
| Total | 0 (0.0%) | 0 (0.0%) |
Income Below Poverty Among Married-Couple vs Single-Parent Households in Roosevelt
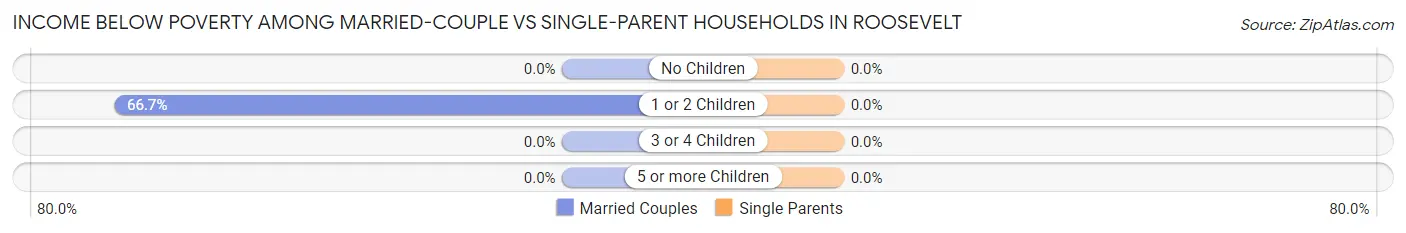
| Children | Married-Couple Families | Single-Parent Households |
| No Children | 0 (0.0%) | 0 (0.0%) |
| 1 or 2 Children | 4 (66.7%) | 0 (0.0%) |
| 3 or 4 Children | 0 (0.0%) | 0 (0.0%) |
| 5 or more Children | 0 (0.0%) | 0 (0.0%) |
| Total | 4 (14.3%) | 0 (0.0%) |
Race in Roosevelt
The most populous races in Roosevelt are White / Caucasian (120 | 62.5%), Hispanic or Latino (97 | 50.5%), and Two or more Races (56 | 29.2%).
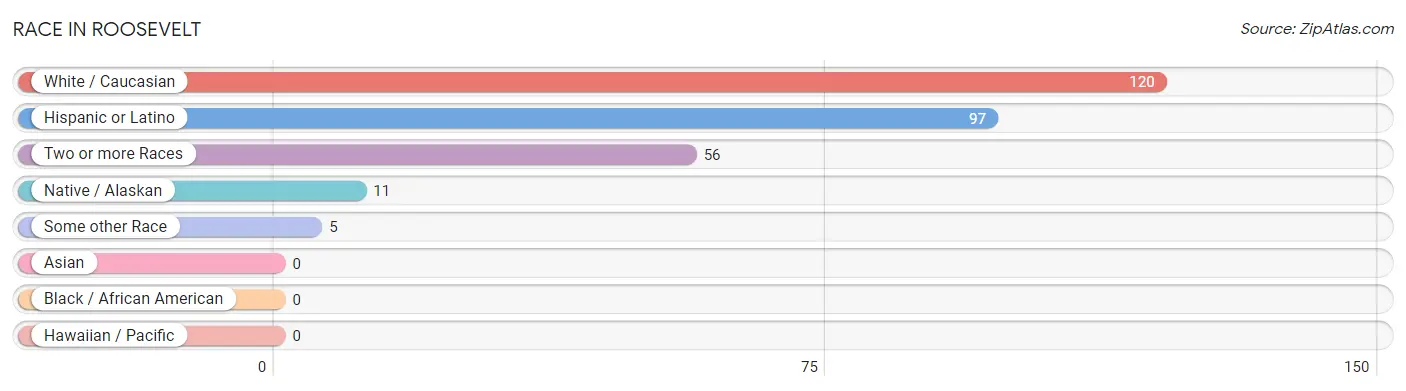
| Race | # Population | % Population |
| Asian | 0 | 0.0% |
| Black / African American | 0 | 0.0% |
| Hawaiian / Pacific | 0 | 0.0% |
| Hispanic or Latino | 97 | 50.5% |
| Native / Alaskan | 11 | 5.7% |
| White / Caucasian | 120 | 62.5% |
| Two or more Races | 56 | 29.2% |
| Some other Race | 5 | 2.6% |
| Total | 192 | 100.0% |
Ancestry in Roosevelt
The most populous ancestries reported in Roosevelt are Mexican (97 | 50.5%), German (69 | 35.9%), Irish (67 | 34.9%), French Canadian (15 | 7.8%), and Pueblo (11 | 5.7%), together accounting for 134.9% of all Roosevelt residents.
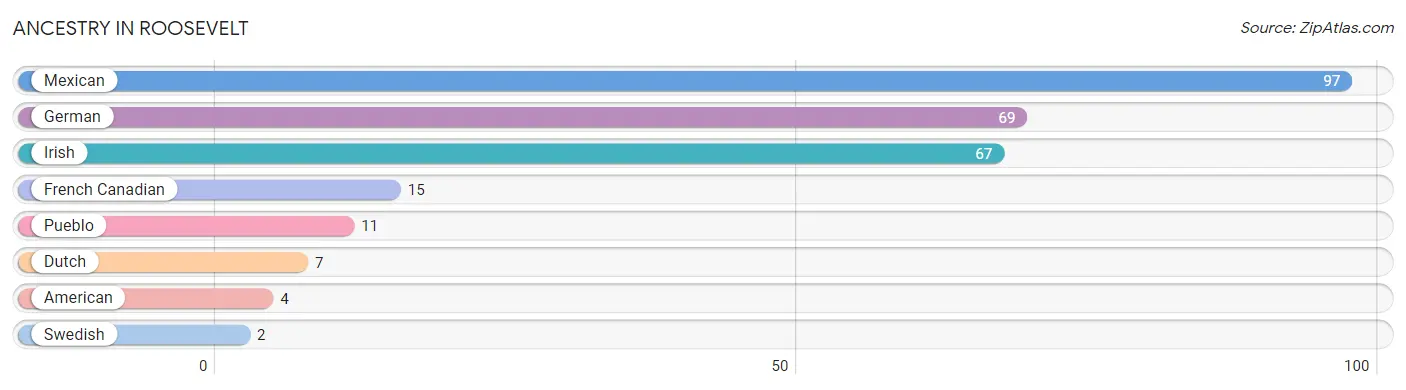
| Ancestry | # Population | % Population |
| American | 4 | 2.1% |
| Dutch | 7 | 3.6% |
| French Canadian | 15 | 7.8% |
| German | 69 | 35.9% |
| Irish | 67 | 34.9% |
| Mexican | 97 | 50.5% |
| Pueblo | 11 | 5.7% |
| Swedish | 2 | 1.0% | View All 8 Rows |
Immigrants in Roosevelt
The most numerous immigrant groups reported in Roosevelt came from Central America (46 | 24.0%), Latin America (46 | 24.0%), and Mexico (46 | 24.0%), together accounting for 71.9% of all Roosevelt residents.
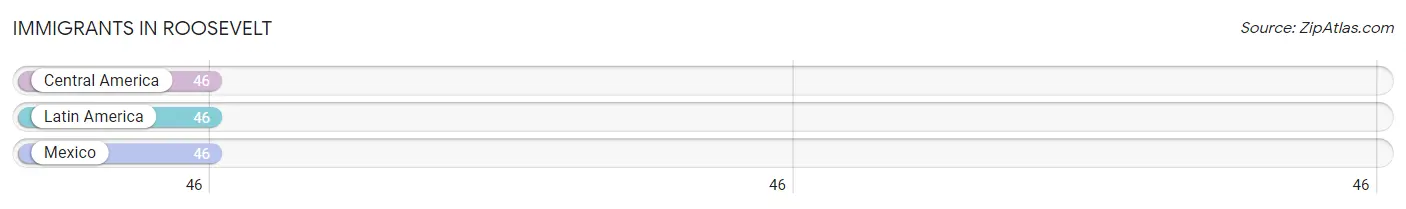
| Immigration Origin | # Population | % Population |
| Central America | 46 | 24.0% |
| Latin America | 46 | 24.0% |
| Mexico | 46 | 24.0% | View All 3 Rows |
Sex and Age in Roosevelt
Sex and Age in Roosevelt
The most populous age groups in Roosevelt are Under 5 Years (17 | 18.3%) for men and 15 to 19 Years (21 | 21.2%) for women.
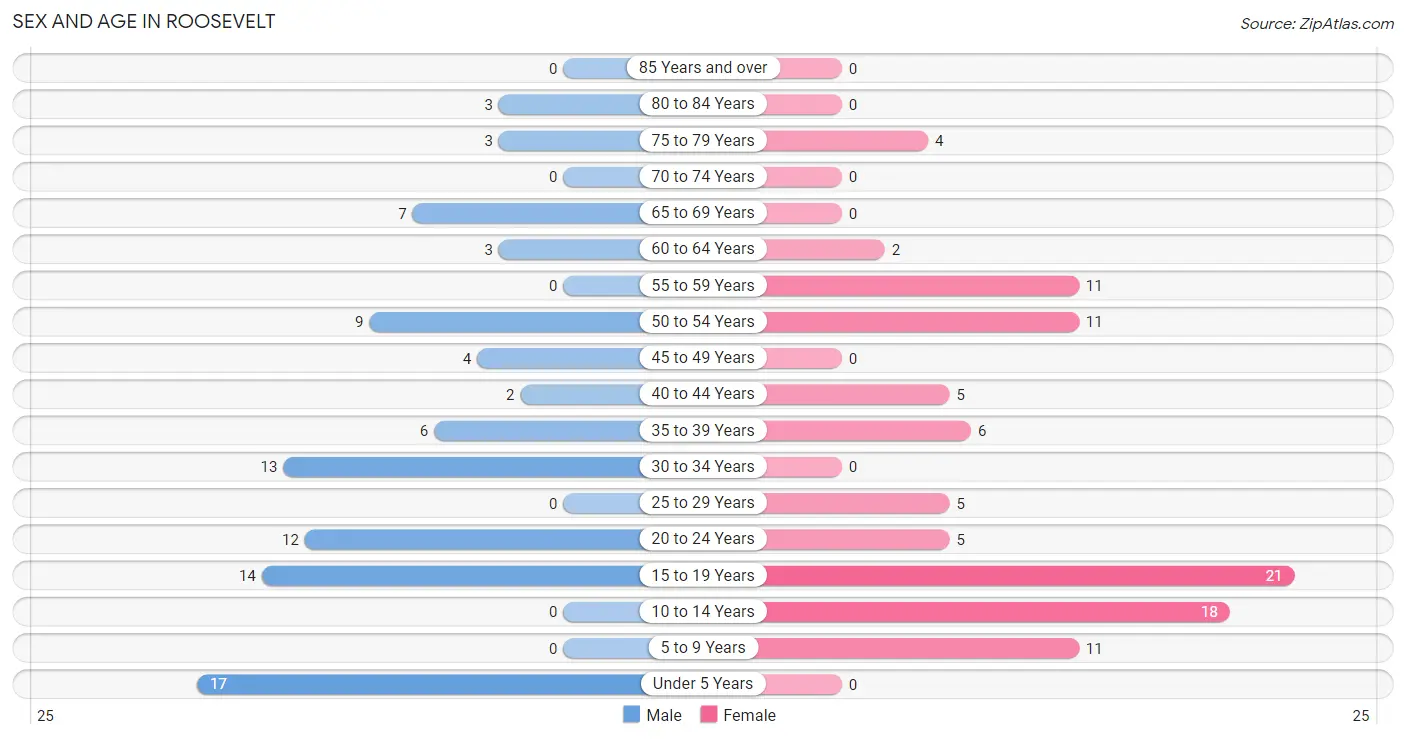
| Age Bracket | Male | Female |
| Under 5 Years | 17 (18.3%) | 0 (0.0%) |
| 5 to 9 Years | 0 (0.0%) | 11 (11.1%) |
| 10 to 14 Years | 0 (0.0%) | 18 (18.2%) |
| 15 to 19 Years | 14 (15.0%) | 21 (21.2%) |
| 20 to 24 Years | 12 (12.9%) | 5 (5.1%) |
| 25 to 29 Years | 0 (0.0%) | 5 (5.1%) |
| 30 to 34 Years | 13 (14.0%) | 0 (0.0%) |
| 35 to 39 Years | 6 (6.5%) | 6 (6.1%) |
| 40 to 44 Years | 2 (2.1%) | 5 (5.1%) |
| 45 to 49 Years | 4 (4.3%) | 0 (0.0%) |
| 50 to 54 Years | 9 (9.7%) | 11 (11.1%) |
| 55 to 59 Years | 0 (0.0%) | 11 (11.1%) |
| 60 to 64 Years | 3 (3.2%) | 2 (2.0%) |
| 65 to 69 Years | 7 (7.5%) | 0 (0.0%) |
| 70 to 74 Years | 0 (0.0%) | 0 (0.0%) |
| 75 to 79 Years | 3 (3.2%) | 4 (4.0%) |
| 80 to 84 Years | 3 (3.2%) | 0 (0.0%) |
| 85 Years and over | 0 (0.0%) | 0 (0.0%) |
| Total | 93 (100.0%) | 99 (100.0%) |
Families and Households in Roosevelt
Median Family Size in Roosevelt
The median family size in Roosevelt is 4.73 persons per family, with married-couple families (28 | 75.7%) accounting for the largest median family size of 5.43 persons per family. On the other hand, single male/father families (5 | 13.5%) represent the smallest median family size with 2.40 persons per family.
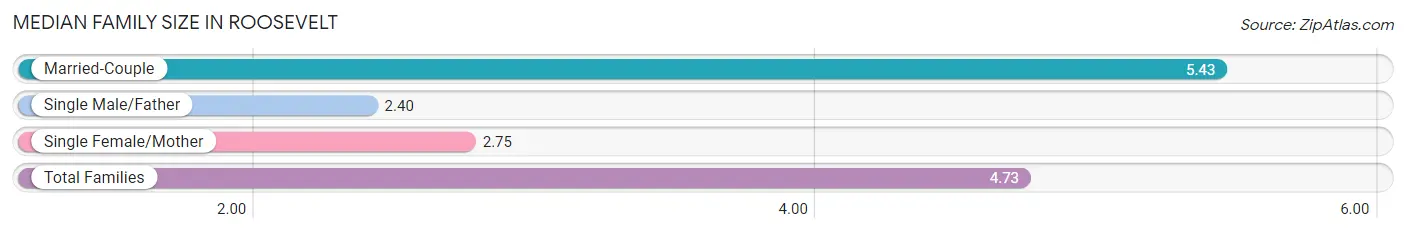
| Family Type | # Families | Family Size |
| Married-Couple | 28 (75.7%) | 5.43 |
| Single Male/Father | 5 (13.5%) | 2.40 |
| Single Female/Mother | 4 (10.8%) | 2.75 |
| Total Families | 37 (100.0%) | 4.73 |
Median Household Size in Roosevelt
The median household size in Roosevelt is 3.69 persons per household, with married-couple households (28 | 53.8%) accounting for the largest median household size of 5.43 persons per household. non-family households (15 | 28.8%) represent the smallest median household size with 1.13 persons per household.
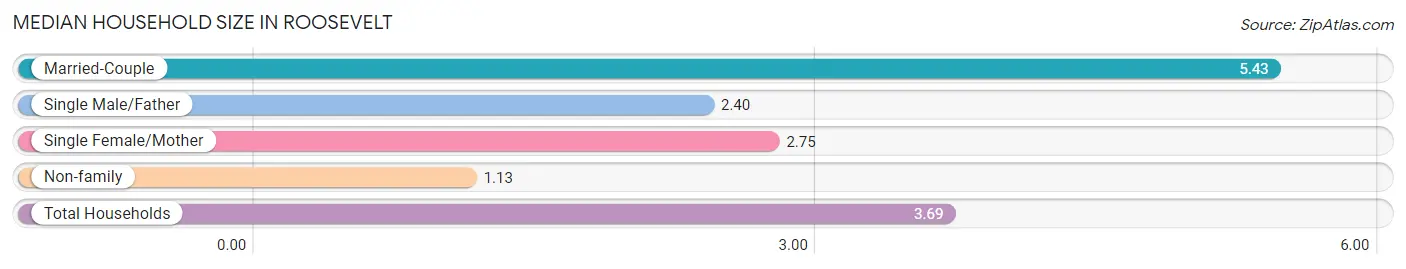
| Household Type | # Households | Household Size |
| Married-Couple | 28 (53.8%) | 5.43 |
| Single Male/Father | 5 (9.6%) | 2.40 |
| Single Female/Mother | 4 (7.7%) | 2.75 |
| Non-family | 15 (28.8%) | 1.13 |
| Total Households | 52 (100.0%) | 3.69 |
Household Size by Marriage Status in Roosevelt
Out of a total of 52 households in Roosevelt, 37 (71.2%) are family households, while 15 (28.8%) are nonfamily households. The most numerous type of family households are 2-person households, comprising 18, and the most common type of nonfamily households are 1-person households, comprising 13.
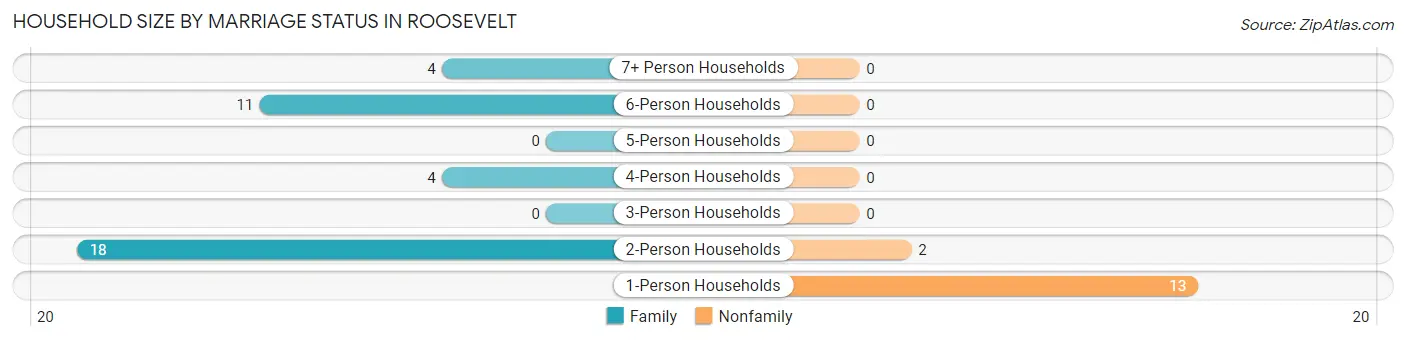
| Household Size | Family Households | Nonfamily Households |
| 1-Person Households | - | 13 (25.0%) |
| 2-Person Households | 18 (34.6%) | 2 (3.8%) |
| 3-Person Households | 0 (0.0%) | 0 (0.0%) |
| 4-Person Households | 4 (7.7%) | 0 (0.0%) |
| 5-Person Households | 0 (0.0%) | 0 (0.0%) |
| 6-Person Households | 11 (21.1%) | 0 (0.0%) |
| 7+ Person Households | 4 (7.7%) | 0 (0.0%) |
| Total | 37 (71.2%) | 15 (28.8%) |
Female Fertility in Roosevelt
Fertility by Age in Roosevelt
Average fertility rate in Roosevelt is 167.0 births per 1,000 women. Women in the age bracket of 20 to 34 years have the highest fertility rate with 500.0 births per 1,000 women. Women in the age bracket of 20 to 34 years acount for 71.4% of all women with births.
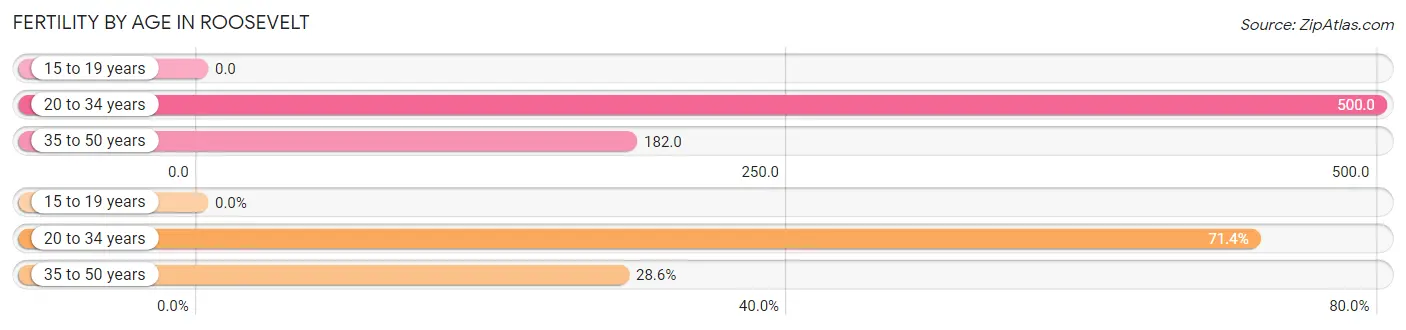
| Age Bracket | Women with Births | Births / 1,000 Women |
| 15 to 19 years | 0 (0.0%) | 0.0 |
| 20 to 34 years | 5 (71.4%) | 500.0 |
| 35 to 50 years | 2 (28.6%) | 182.0 |
| Total | 7 (100.0%) | 167.0 |
Fertility by Age by Marriage Status in Roosevelt
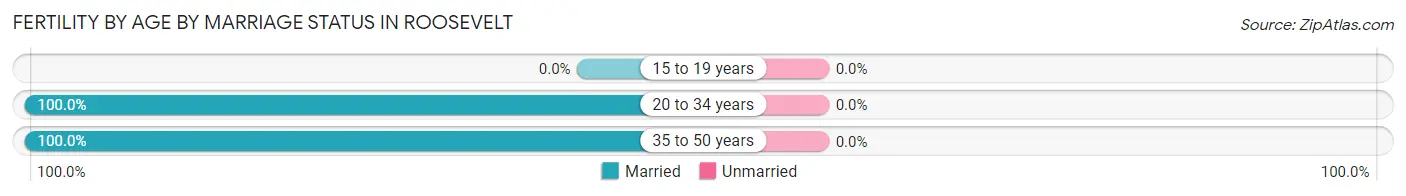
| Age Bracket | Married | Unmarried |
| 15 to 19 years | 0 (0.0%) | 0 (0.0%) |
| 20 to 34 years | 5 (100.0%) | 0 (0.0%) |
| 35 to 50 years | 2 (100.0%) | 0 (0.0%) |
| Total | 7 (100.0%) | 0 (0.0%) |
Fertility by Education in Roosevelt
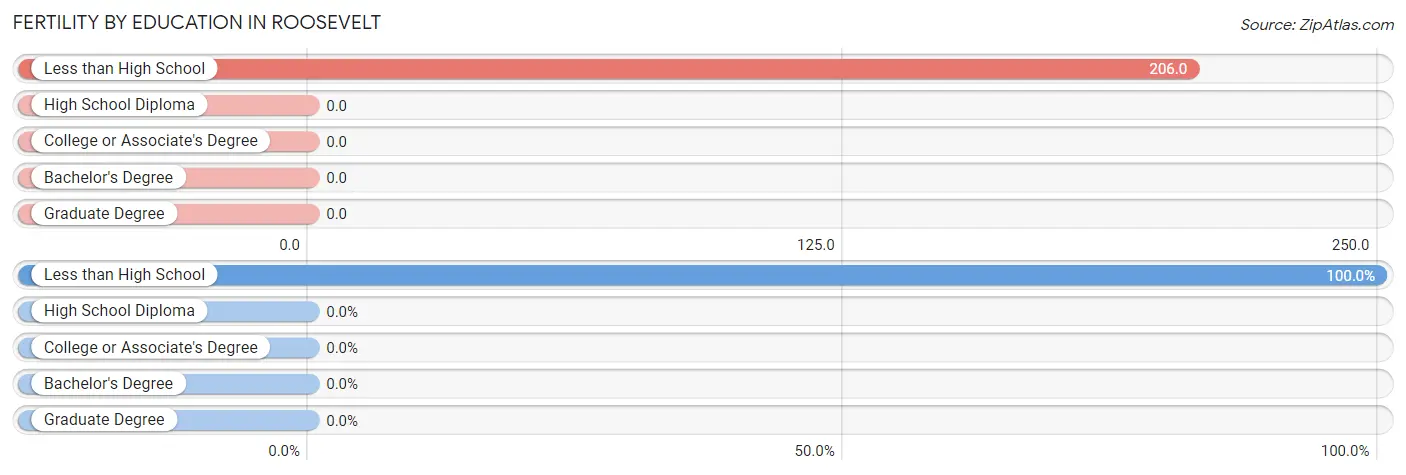
| Educational Attainment | Women with Births | Births / 1,000 Women |
| Less than High School | 7 (100.0%) | 206.0 |
| High School Diploma | 0 (0.0%) | 0.0 |
| College or Associate's Degree | 0 (0.0%) | 0.0 |
| Bachelor's Degree | 0 (0.0%) | 0.0 |
| Graduate Degree | 0 (0.0%) | 0.0 |
| Total | 7 (100.0%) | 167.0 |
Fertility by Education by Marriage Status in Roosevelt
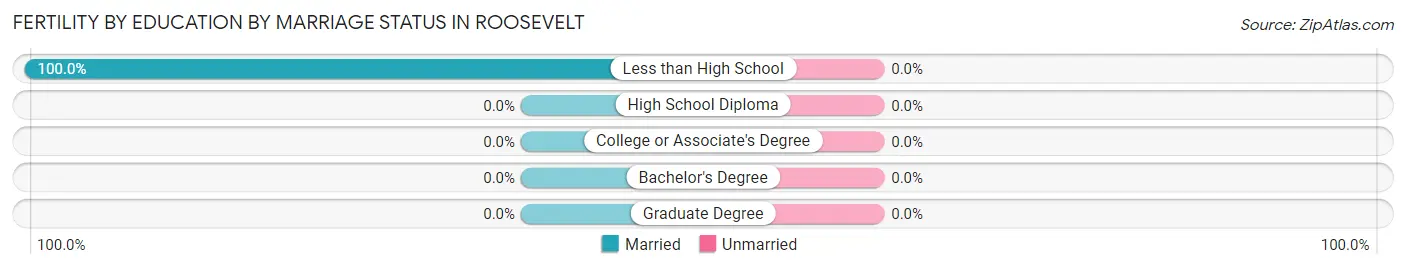
| Educational Attainment | Married | Unmarried |
| Less than High School | 7 (100.0%) | 0 (0.0%) |
| High School Diploma | 0 (0.0%) | 0 (0.0%) |
| College or Associate's Degree | 0 (0.0%) | 0 (0.0%) |
| Bachelor's Degree | 0 (0.0%) | 0 (0.0%) |
| Graduate Degree | 0 (0.0%) | 0 (0.0%) |
| Total | 7 (100.0%) | 0 (0.0%) |
Employment Characteristics in Roosevelt
Employment by Class of Employer in Roosevelt
Among the 58 employed individuals in Roosevelt, , and private company employees (58 | 100.0%) make up the most common classes of employment.
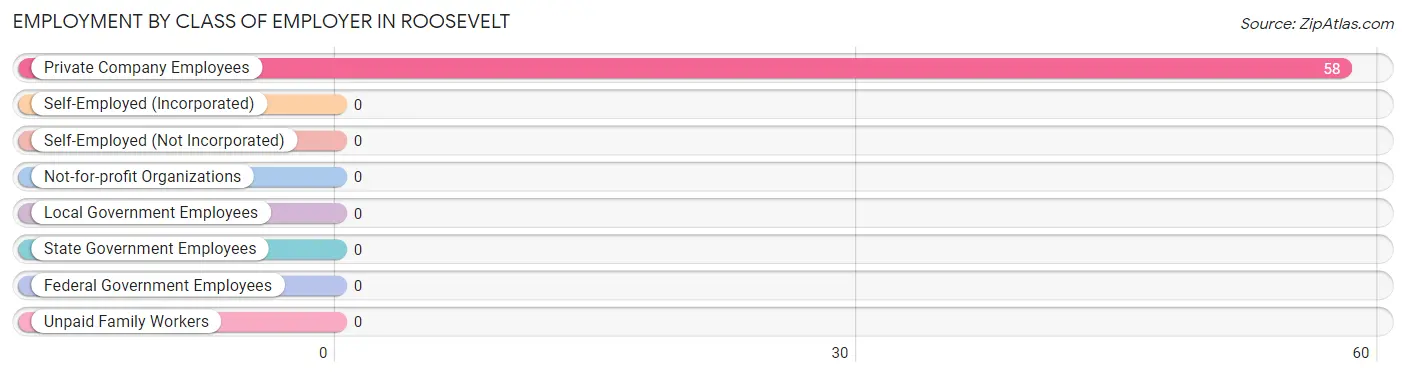
| Employer Class | # Employees | % Employees |
| Private Company Employees | 58 | 100.0% |
| Self-Employed (Incorporated) | 0 | 0.0% |
| Self-Employed (Not Incorporated) | 0 | 0.0% |
| Not-for-profit Organizations | 0 | 0.0% |
| Local Government Employees | 0 | 0.0% |
| State Government Employees | 0 | 0.0% |
| Federal Government Employees | 0 | 0.0% |
| Unpaid Family Workers | 0 | 0.0% |
| Total | 58 | 100.0% |
Employment Status by Age in Roosevelt
According to the labor force statistics for Roosevelt, out of the total population over 16 years of age (143), 49.0% or 70 individuals are in the labor force, with 17.1% or 12 of them unemployed. The age group with the highest labor force participation rate is 25 to 29 years, with 100.0% or 5 individuals in the labor force. Within the labor force, the 25 to 29 years age range has the highest percentage of unemployed individuals, with 100.0% or 5 of them being unemployed.
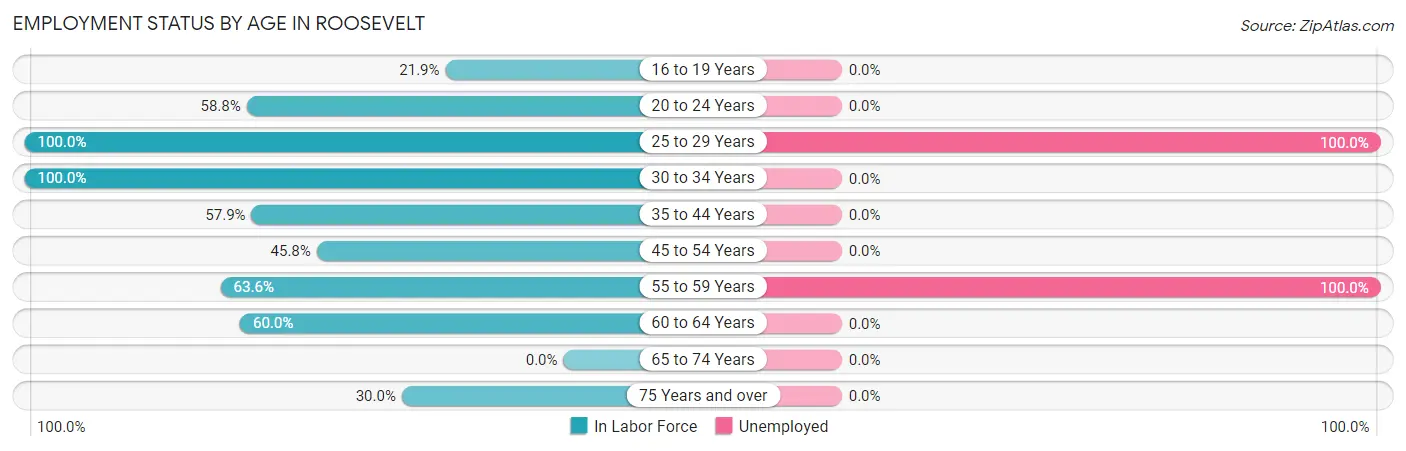
| Age Bracket | In Labor Force | Unemployed |
| 16 to 19 Years | 7 (21.9%) | 0 (0.0%) |
| 20 to 24 Years | 10 (58.8%) | 0 (0.0%) |
| 25 to 29 Years | 5 (100.0%) | 5 (100.0%) |
| 30 to 34 Years | 13 (100.0%) | 0 (0.0%) |
| 35 to 44 Years | 11 (57.9%) | 0 (0.0%) |
| 45 to 54 Years | 11 (45.8%) | 0 (0.0%) |
| 55 to 59 Years | 7 (63.6%) | 7 (100.0%) |
| 60 to 64 Years | 3 (60.0%) | 0 (0.0%) |
| 65 to 74 Years | 0 (0.0%) | 0 (0.0%) |
| 75 Years and over | 3 (30.0%) | 0 (0.0%) |
| Total | 70 (49.0%) | 12 (17.1%) |
Employment Status by Educational Attainment in Roosevelt
According to labor force statistics for Roosevelt, 64.9% of individuals (50) out of the total population between 25 and 64 years of age (77) are in the labor force, with 24.0% or 12 of them being unemployed. The group with the highest labor force participation rate are those with the educational attainment of bachelor's degree or higher, with 100.0% or 9 individuals in the labor force. Within the labor force, individuals with college / associate degree education have the highest percentage of unemployment, with 77.8% or 7 of them being unemployed.
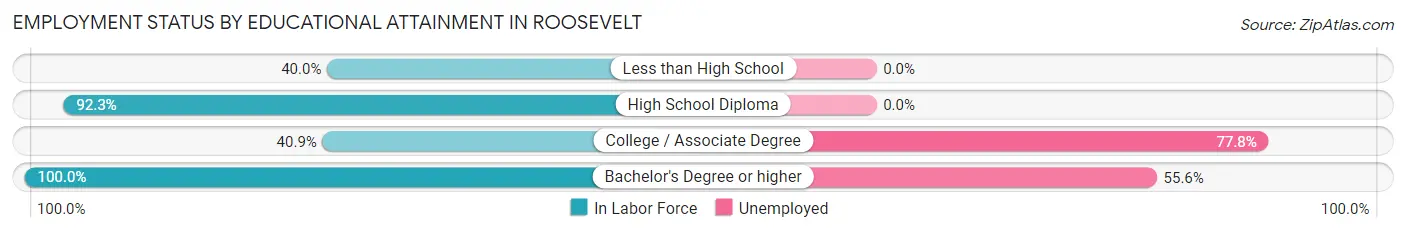
| Educational Attainment | In Labor Force | Unemployed |
| Less than High School | 8 (40.0%) | 0 (0.0%) |
| High School Diploma | 24 (92.3%) | 0 (0.0%) |
| College / Associate Degree | 9 (40.9%) | 17 (77.8%) |
| Bachelor's Degree or higher | 9 (100.0%) | 5 (55.6%) |
| Total | 50 (64.9%) | 18 (24.0%) |
Employment Occupations by Sex in Roosevelt
Management, Business, Science and Arts Occupations
The most common Management, Business, Science and Arts occupations in Roosevelt are , and Management (7 | 12.1%).
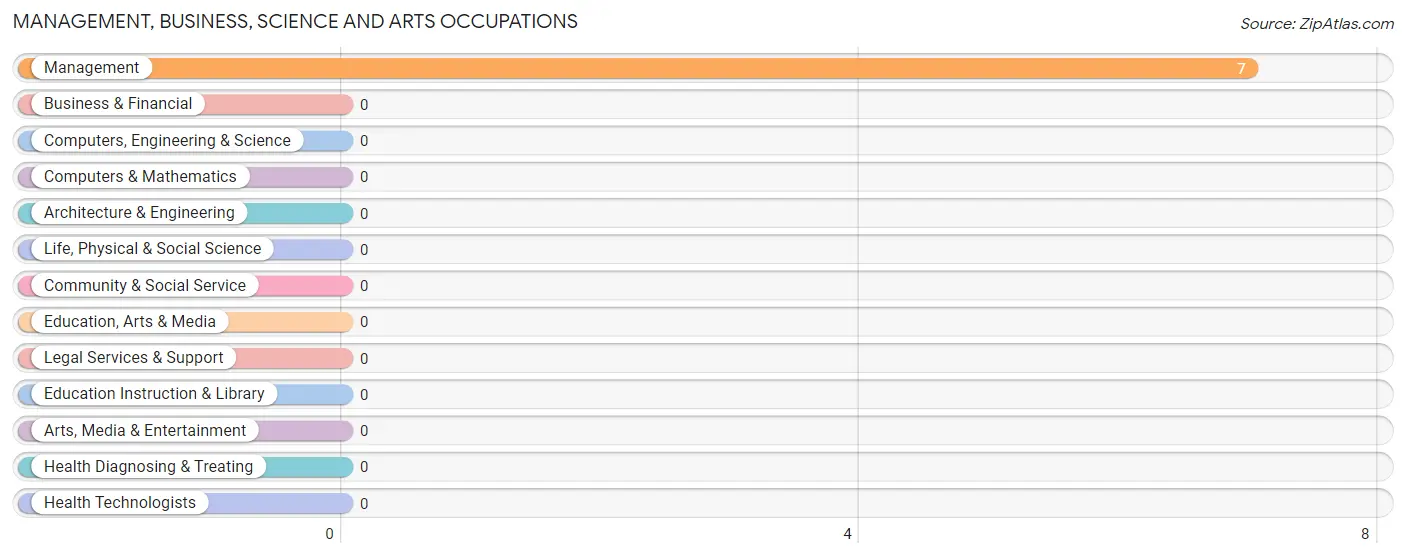
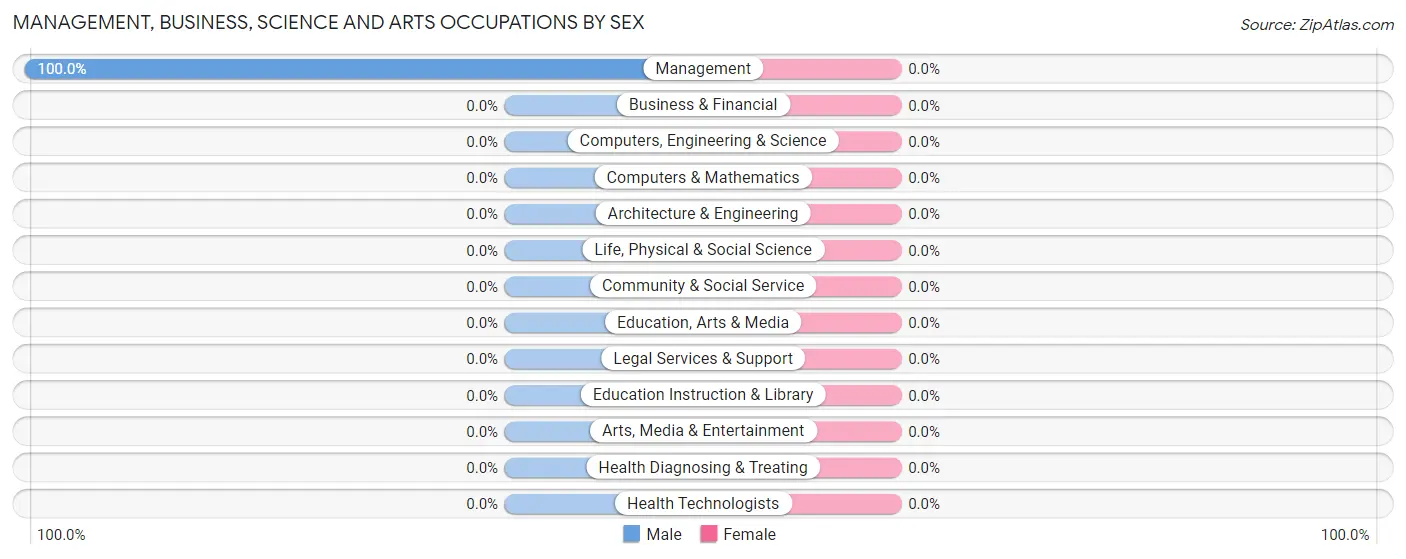
Management, Business, Science and Arts Occupations by Sex
| Occupation | Male | Female |
| Management | 7 (100.0%) | 0 (0.0%) |
| Business & Financial | 0 (0.0%) | 0 (0.0%) |
| Computers, Engineering & Science | 0 (0.0%) | 0 (0.0%) |
| Computers & Mathematics | 0 (0.0%) | 0 (0.0%) |
| Architecture & Engineering | 0 (0.0%) | 0 (0.0%) |
| Life, Physical & Social Science | 0 (0.0%) | 0 (0.0%) |
| Community & Social Service | 0 (0.0%) | 0 (0.0%) |
| Education, Arts & Media | 0 (0.0%) | 0 (0.0%) |
| Legal Services & Support | 0 (0.0%) | 0 (0.0%) |
| Education Instruction & Library | 0 (0.0%) | 0 (0.0%) |
| Arts, Media & Entertainment | 0 (0.0%) | 0 (0.0%) |
| Health Diagnosing & Treating | 0 (0.0%) | 0 (0.0%) |
| Health Technologists | 0 (0.0%) | 0 (0.0%) |
| Total (Category) | 7 (100.0%) | 0 (0.0%) |
| Total (Overall) | 51 (87.9%) | 7 (12.1%) |
Services Occupations
The most common Services occupations in Roosevelt are , and Food Preparation & Serving (6 | 10.3%).
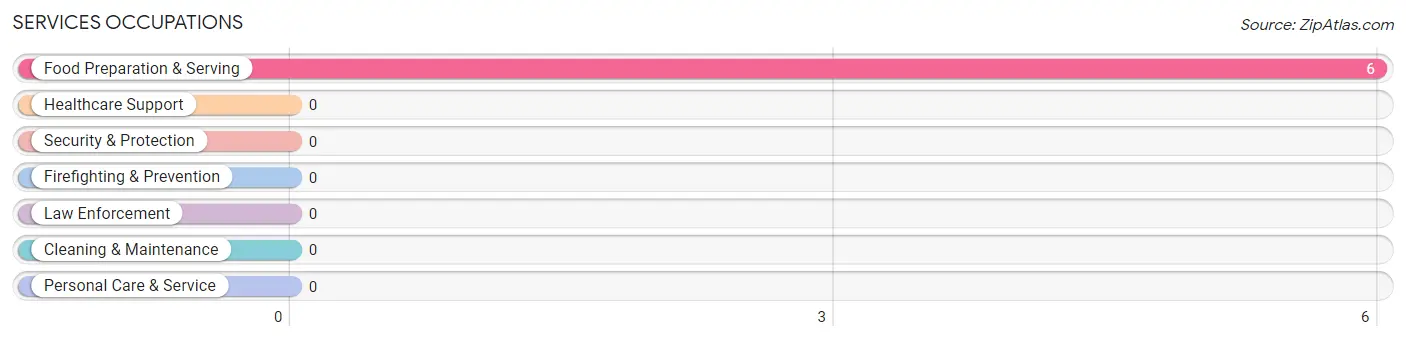
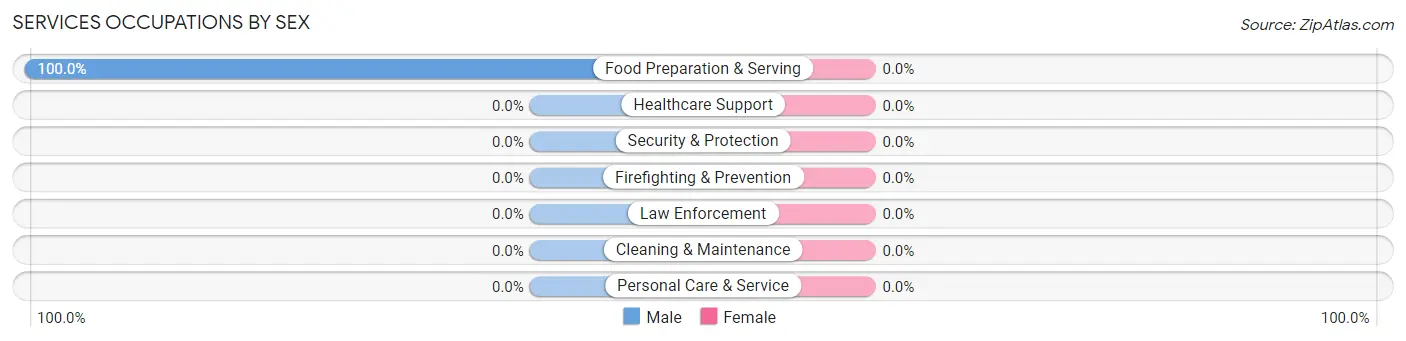
Services Occupations by Sex
| Occupation | Male | Female |
| Healthcare Support | 0 (0.0%) | 0 (0.0%) |
| Security & Protection | 0 (0.0%) | 0 (0.0%) |
| Firefighting & Prevention | 0 (0.0%) | 0 (0.0%) |
| Law Enforcement | 0 (0.0%) | 0 (0.0%) |
| Food Preparation & Serving | 6 (100.0%) | 0 (0.0%) |
| Cleaning & Maintenance | 0 (0.0%) | 0 (0.0%) |
| Personal Care & Service | 0 (0.0%) | 0 (0.0%) |
| Total (Category) | 6 (100.0%) | 0 (0.0%) |
| Total (Overall) | 51 (87.9%) | 7 (12.1%) |
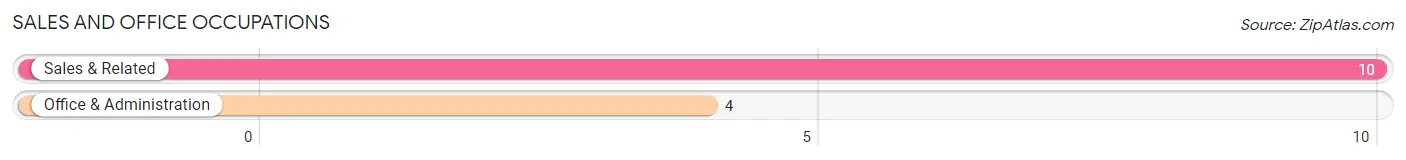
Sales and Office Occupations
The most common Sales and Office occupations in Roosevelt are Sales & Related (10 | 17.2%), and Office & Administration (4 | 6.9%).
Sales and Office Occupations by Sex
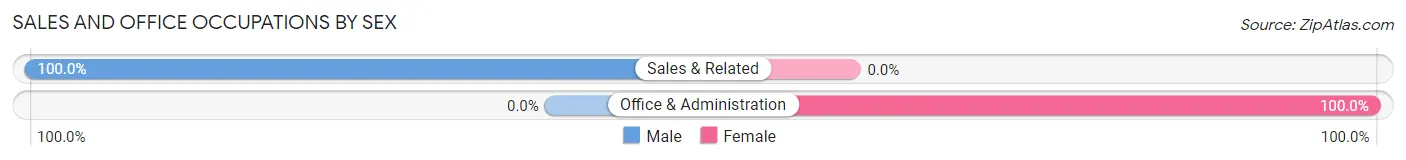
| Occupation | Male | Female |
| Sales & Related | 10 (100.0%) | 0 (0.0%) |
| Office & Administration | 0 (0.0%) | 4 (100.0%) |
| Total (Category) | 10 (71.4%) | 4 (28.6%) |
| Total (Overall) | 51 (87.9%) | 7 (12.1%) |
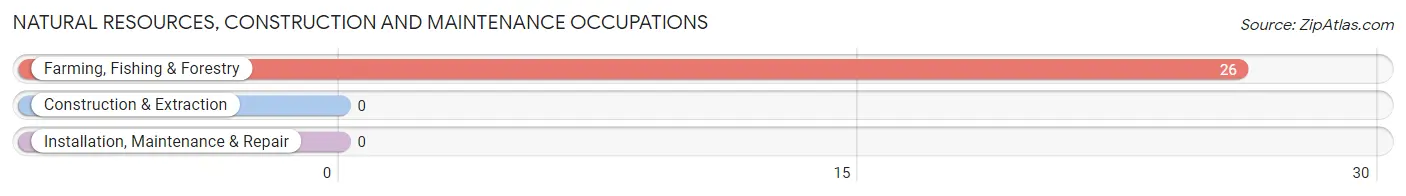
Natural Resources, Construction and Maintenance Occupations
The most common Natural Resources, Construction and Maintenance occupations in Roosevelt are , and Farming, Fishing & Forestry (26 | 44.8%).
Natural Resources, Construction and Maintenance Occupations by Sex
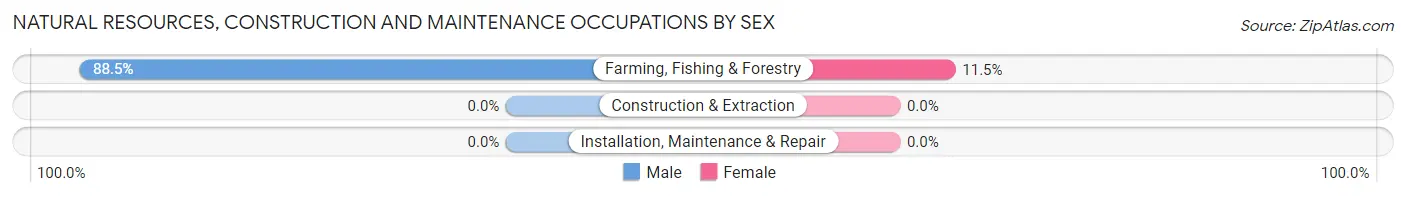
| Occupation | Male | Female |
| Farming, Fishing & Forestry | 23 (88.5%) | 3 (11.5%) |
| Construction & Extraction | 0 (0.0%) | 0 (0.0%) |
| Installation, Maintenance & Repair | 0 (0.0%) | 0 (0.0%) |
| Total (Category) | 23 (88.5%) | 3 (11.5%) |
| Total (Overall) | 51 (87.9%) | 7 (12.1%) |
Production, Transportation and Moving Occupations
The most common Production, Transportation and Moving occupations in Roosevelt are , and Transportation (5 | 8.6%).
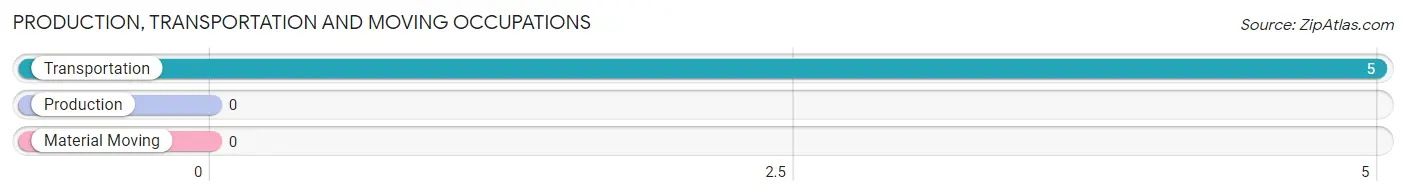
Production, Transportation and Moving Occupations by Sex
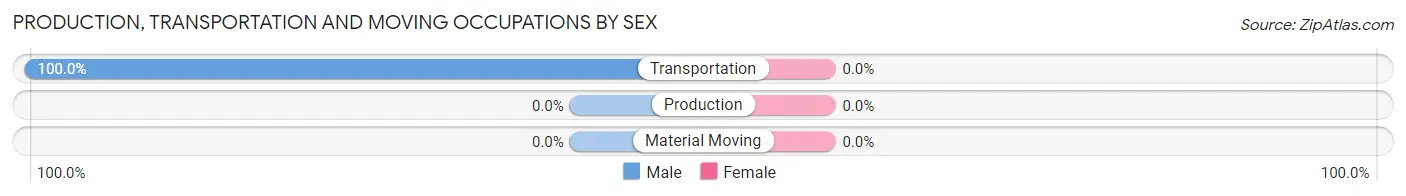
| Occupation | Male | Female |
| Production | 0 (0.0%) | 0 (0.0%) |
| Transportation | 5 (100.0%) | 0 (0.0%) |
| Material Moving | 0 (0.0%) | 0 (0.0%) |
| Total (Category) | 5 (100.0%) | 0 (0.0%) |
| Total (Overall) | 51 (87.9%) | 7 (12.1%) |
Employment Industries by Sex in Roosevelt
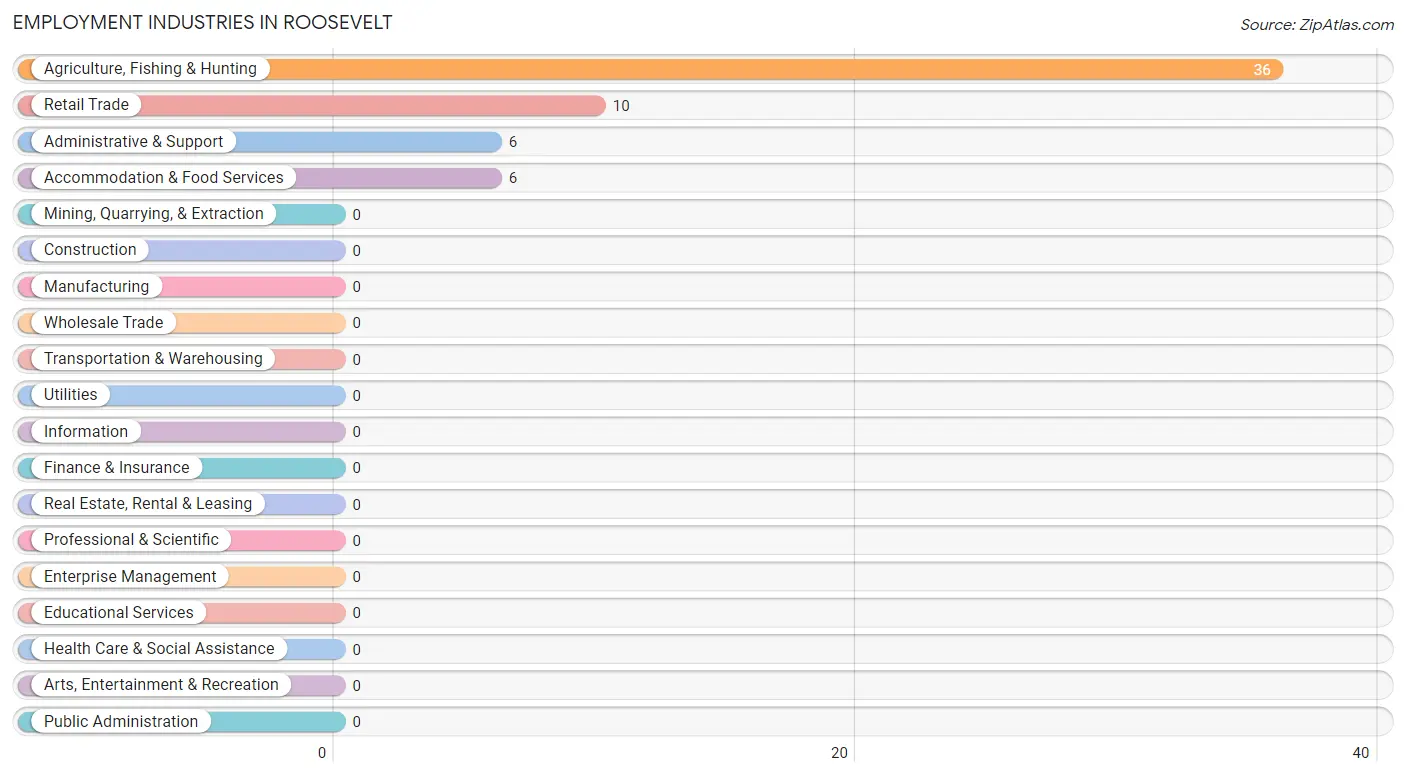
Employment Industries in Roosevelt
The major employment industries in Roosevelt include Agriculture, Fishing & Hunting (36 | 62.1%), Retail Trade (10 | 17.2%), Administrative & Support (6 | 10.3%), and Accommodation & Food Services (6 | 10.3%).
Employment Industries by Sex in Roosevelt
The Roosevelt industries that see more men than women are Retail Trade (100.0%), Accommodation & Food Services (100.0%), and Agriculture, Fishing & Hunting (91.7%), whereas the industries that tend to have a higher number of women are Administrative & Support (66.7%), and Agriculture, Fishing & Hunting (8.3%).
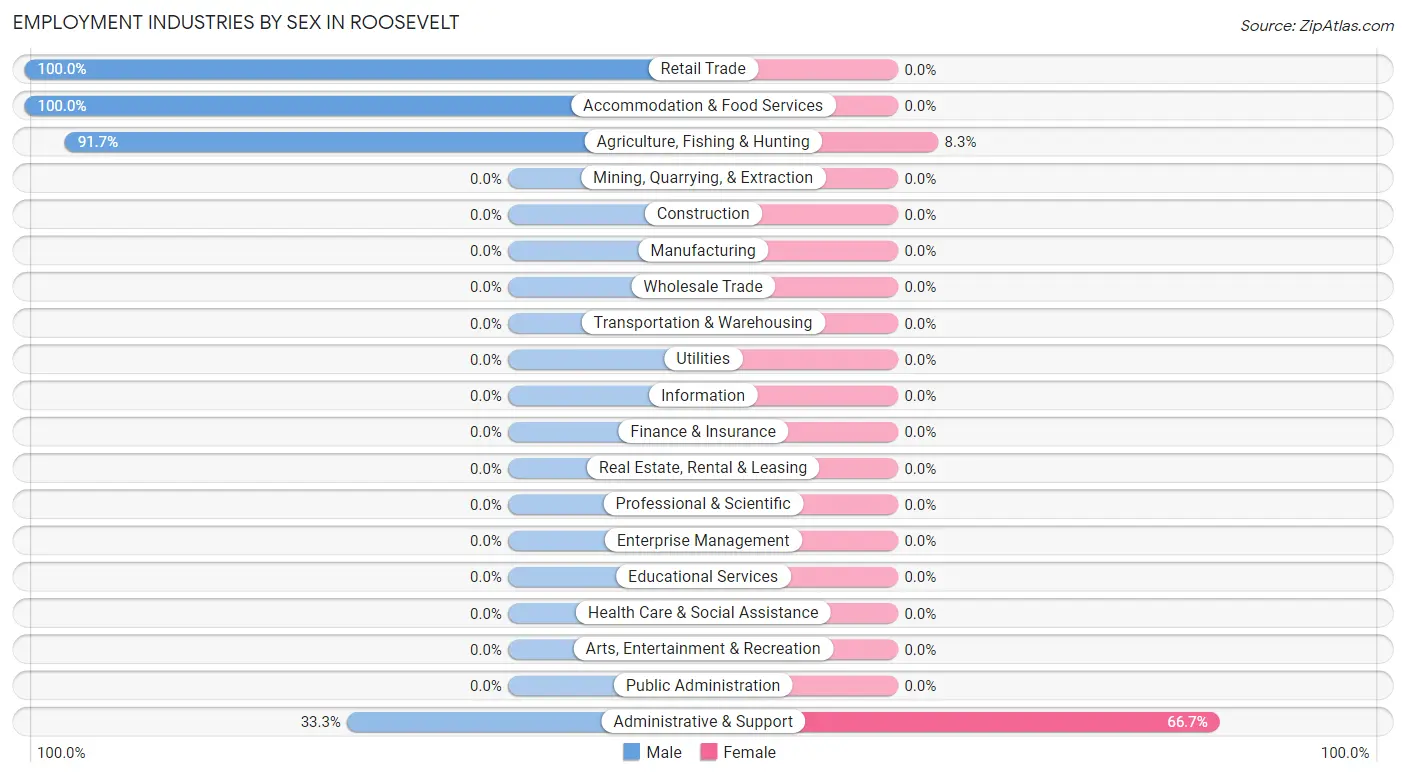
| Industry | Male | Female |
| Agriculture, Fishing & Hunting | 33 (91.7%) | 3 (8.3%) |
| Mining, Quarrying, & Extraction | 0 (0.0%) | 0 (0.0%) |
| Construction | 0 (0.0%) | 0 (0.0%) |
| Manufacturing | 0 (0.0%) | 0 (0.0%) |
| Wholesale Trade | 0 (0.0%) | 0 (0.0%) |
| Retail Trade | 10 (100.0%) | 0 (0.0%) |
| Transportation & Warehousing | 0 (0.0%) | 0 (0.0%) |
| Utilities | 0 (0.0%) | 0 (0.0%) |
| Information | 0 (0.0%) | 0 (0.0%) |
| Finance & Insurance | 0 (0.0%) | 0 (0.0%) |
| Real Estate, Rental & Leasing | 0 (0.0%) | 0 (0.0%) |
| Professional & Scientific | 0 (0.0%) | 0 (0.0%) |
| Enterprise Management | 0 (0.0%) | 0 (0.0%) |
| Administrative & Support | 2 (33.3%) | 4 (66.7%) |
| Educational Services | 0 (0.0%) | 0 (0.0%) |
| Health Care & Social Assistance | 0 (0.0%) | 0 (0.0%) |
| Arts, Entertainment & Recreation | 0 (0.0%) | 0 (0.0%) |
| Accommodation & Food Services | 6 (100.0%) | 0 (0.0%) |
| Public Administration | 0 (0.0%) | 0 (0.0%) |
| Total | 51 (87.9%) | 7 (12.1%) |
Education in Roosevelt
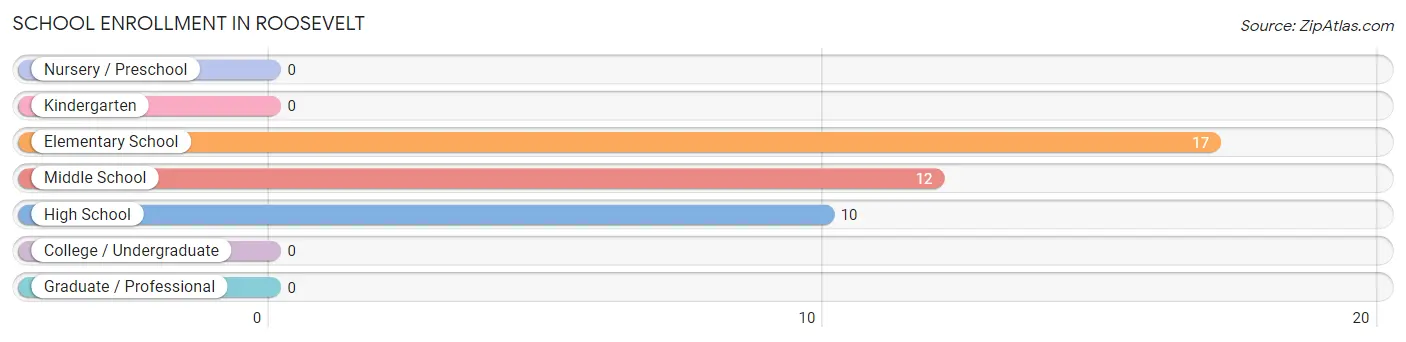
School Enrollment in Roosevelt
The most common levels of schooling among the 39 students in Roosevelt are elementary school (17 | 43.6%), middle school (12 | 30.8%), and high school (10 | 25.6%).
| School Level | # Students | % Students |
| Nursery / Preschool | 0 | 0.0% |
| Kindergarten | 0 | 0.0% |
| Elementary School | 17 | 43.6% |
| Middle School | 12 | 30.8% |
| High School | 10 | 25.6% |
| College / Undergraduate | 0 | 0.0% |
| Graduate / Professional | 0 | 0.0% |
| Total | 39 | 100.0% |
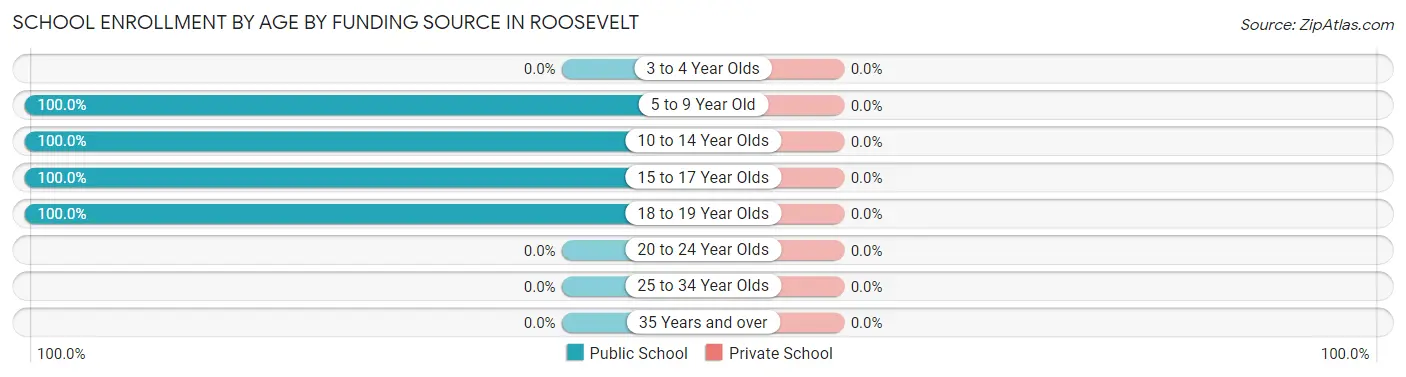
School Enrollment by Age by Funding Source in Roosevelt
| Age Bracket | Public School | Private School |
| 3 to 4 Year Olds | 0 (0.0%) | 0 (0.0%) |
| 5 to 9 Year Old | 11 (100.0%) | 0 (0.0%) |
| 10 to 14 Year Olds | 18 (100.0%) | 0 (0.0%) |
| 15 to 17 Year Olds | 9 (100.0%) | 0 (0.0%) |
| 18 to 19 Year Olds | 1 (100.0%) | 0 (0.0%) |
| 20 to 24 Year Olds | 0 (0.0%) | 0 (0.0%) |
| 25 to 34 Year Olds | 0 (0.0%) | 0 (0.0%) |
| 35 Years and over | 0 (0.0%) | 0 (0.0%) |
| Total | 39 (100.0%) | 0 (0.0%) |
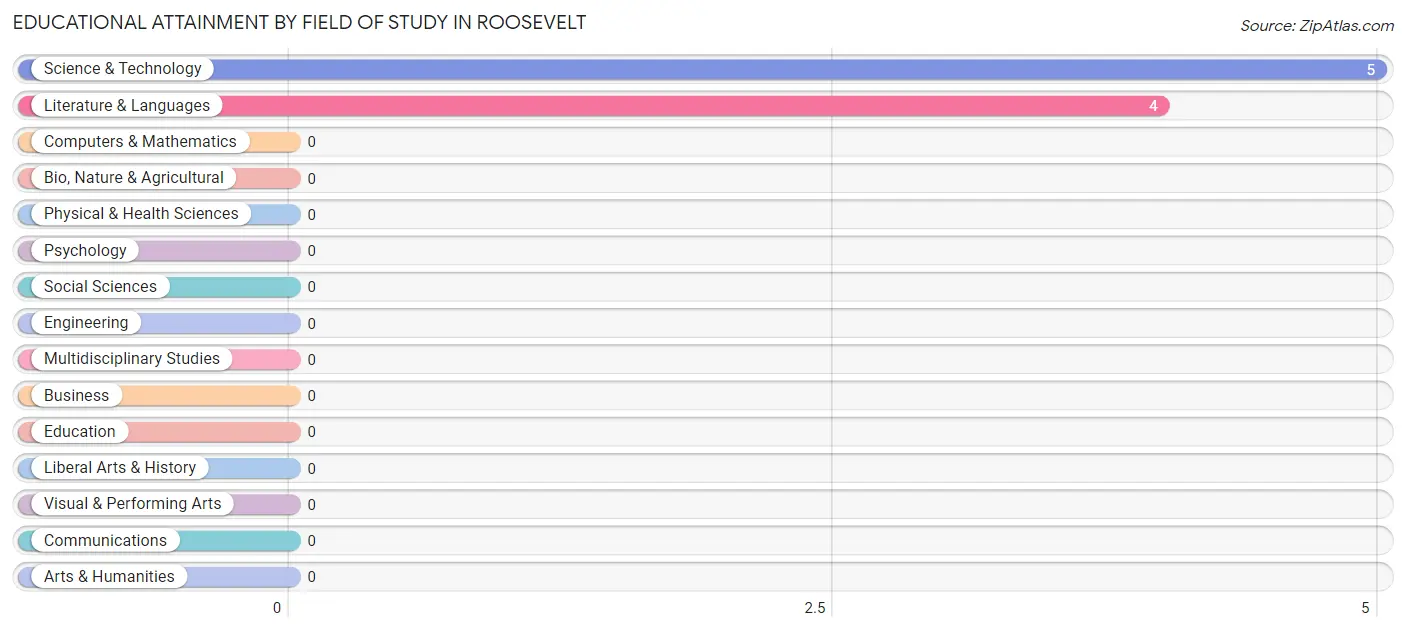
Educational Attainment by Field of Study in Roosevelt
Science & technology (5 | 55.6%), and literature & languages (4 | 44.4%) are the most common fields of study among 9 individuals in Roosevelt who have obtained a bachelor's degree or higher.
| Field of Study | # Graduates | % Graduates |
| Computers & Mathematics | 0 | 0.0% |
| Bio, Nature & Agricultural | 0 | 0.0% |
| Physical & Health Sciences | 0 | 0.0% |
| Psychology | 0 | 0.0% |
| Social Sciences | 0 | 0.0% |
| Engineering | 0 | 0.0% |
| Multidisciplinary Studies | 0 | 0.0% |
| Science & Technology | 5 | 55.6% |
| Business | 0 | 0.0% |
| Education | 0 | 0.0% |
| Literature & Languages | 4 | 44.4% |
| Liberal Arts & History | 0 | 0.0% |
| Visual & Performing Arts | 0 | 0.0% |
| Communications | 0 | 0.0% |
| Arts & Humanities | 0 | 0.0% |
| Total | 9 | 100.0% |
Transportation & Commute in Roosevelt
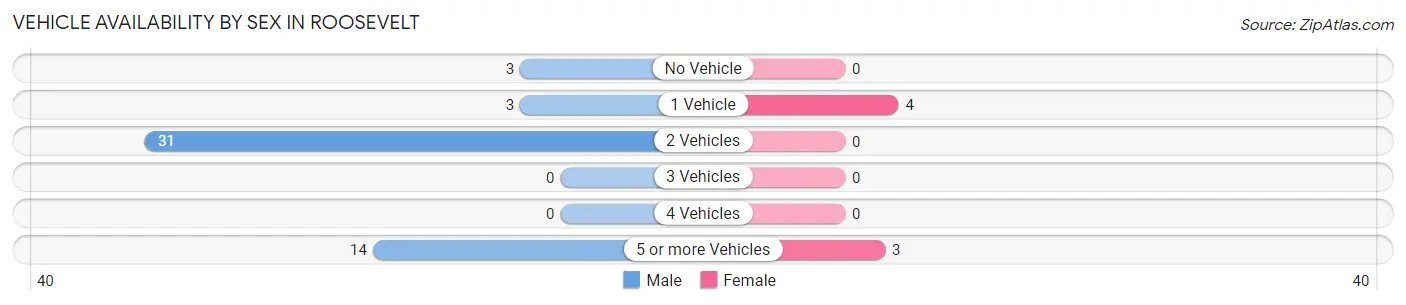
Vehicle Availability by Sex in Roosevelt
The most prevalent vehicle ownership categories in Roosevelt are males with 2 vehicles (31, accounting for 60.8%) and females with 2 vehicles (0, making up 442.9%).
| Vehicles Available | Male | Female |
| No Vehicle | 3 (5.9%) | 0 (0.0%) |
| 1 Vehicle | 3 (5.9%) | 4 (57.1%) |
| 2 Vehicles | 31 (60.8%) | 0 (0.0%) |
| 3 Vehicles | 0 (0.0%) | 0 (0.0%) |
| 4 Vehicles | 0 (0.0%) | 0 (0.0%) |
| 5 or more Vehicles | 14 (27.5%) | 3 (42.9%) |
| Total | 51 (100.0%) | 7 (100.0%) |
Commute Time in Roosevelt
The most frequently occuring commute durations in Roosevelt are 5 to 9 minutes (21 commuters, 36.2%), 45 to 59 minutes (19 commuters, 32.8%), and less than 5 minutes (6 commuters, 10.3%).
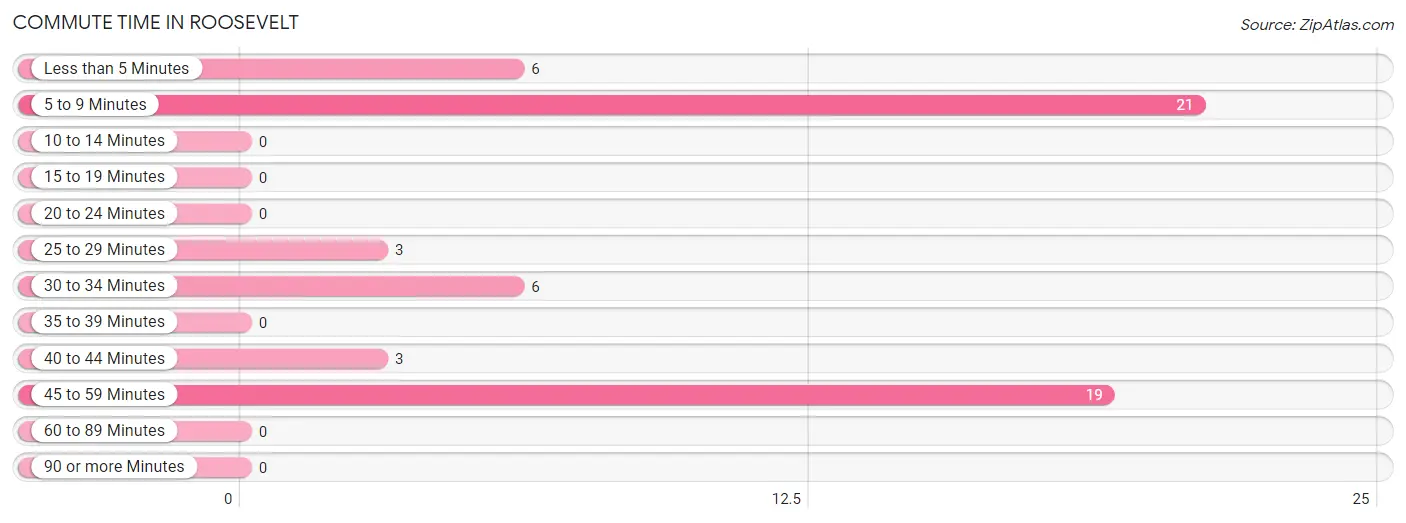
| Commute Time | # Commuters | % Commuters |
| Less than 5 Minutes | 6 | 10.3% |
| 5 to 9 Minutes | 21 | 36.2% |
| 10 to 14 Minutes | 0 | 0.0% |
| 15 to 19 Minutes | 0 | 0.0% |
| 20 to 24 Minutes | 0 | 0.0% |
| 25 to 29 Minutes | 3 | 5.2% |
| 30 to 34 Minutes | 6 | 10.3% |
| 35 to 39 Minutes | 0 | 0.0% |
| 40 to 44 Minutes | 3 | 5.2% |
| 45 to 59 Minutes | 19 | 32.8% |
| 60 to 89 Minutes | 0 | 0.0% |
| 90 or more Minutes | 0 | 0.0% |
Commute Time by Sex in Roosevelt
The most common commute times in Roosevelt are 5 to 9 minutes (17 commuters, 33.3%) for males and 5 to 9 minutes (4 commuters, 57.1%) for females.
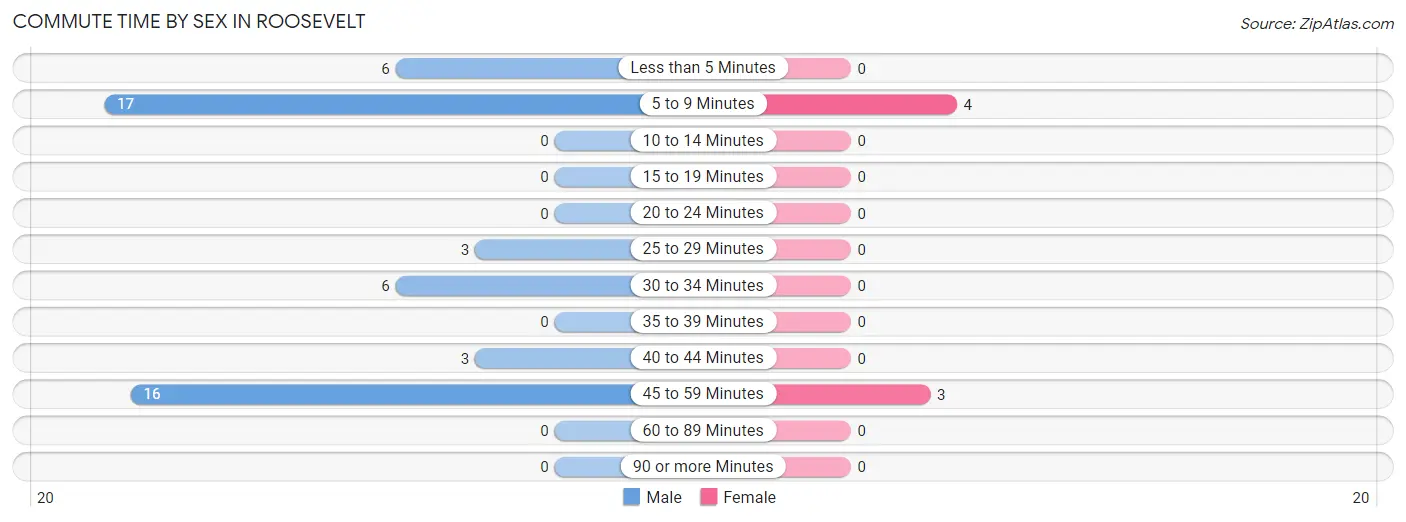
| Commute Time | Male | Female |
| Less than 5 Minutes | 6 (11.8%) | 0 (0.0%) |
| 5 to 9 Minutes | 17 (33.3%) | 4 (57.1%) |
| 10 to 14 Minutes | 0 (0.0%) | 0 (0.0%) |
| 15 to 19 Minutes | 0 (0.0%) | 0 (0.0%) |
| 20 to 24 Minutes | 0 (0.0%) | 0 (0.0%) |
| 25 to 29 Minutes | 3 (5.9%) | 0 (0.0%) |
| 30 to 34 Minutes | 6 (11.8%) | 0 (0.0%) |
| 35 to 39 Minutes | 0 (0.0%) | 0 (0.0%) |
| 40 to 44 Minutes | 3 (5.9%) | 0 (0.0%) |
| 45 to 59 Minutes | 16 (31.4%) | 3 (42.9%) |
| 60 to 89 Minutes | 0 (0.0%) | 0 (0.0%) |
| 90 or more Minutes | 0 (0.0%) | 0 (0.0%) |
Time of Departure to Work by Sex in Roosevelt
The most frequent times of departure to work in Roosevelt are 12:00 PM to 3:59 PM (16, 31.4%) for males and 12:00 AM to 4:59 AM (4, 57.1%) for females.
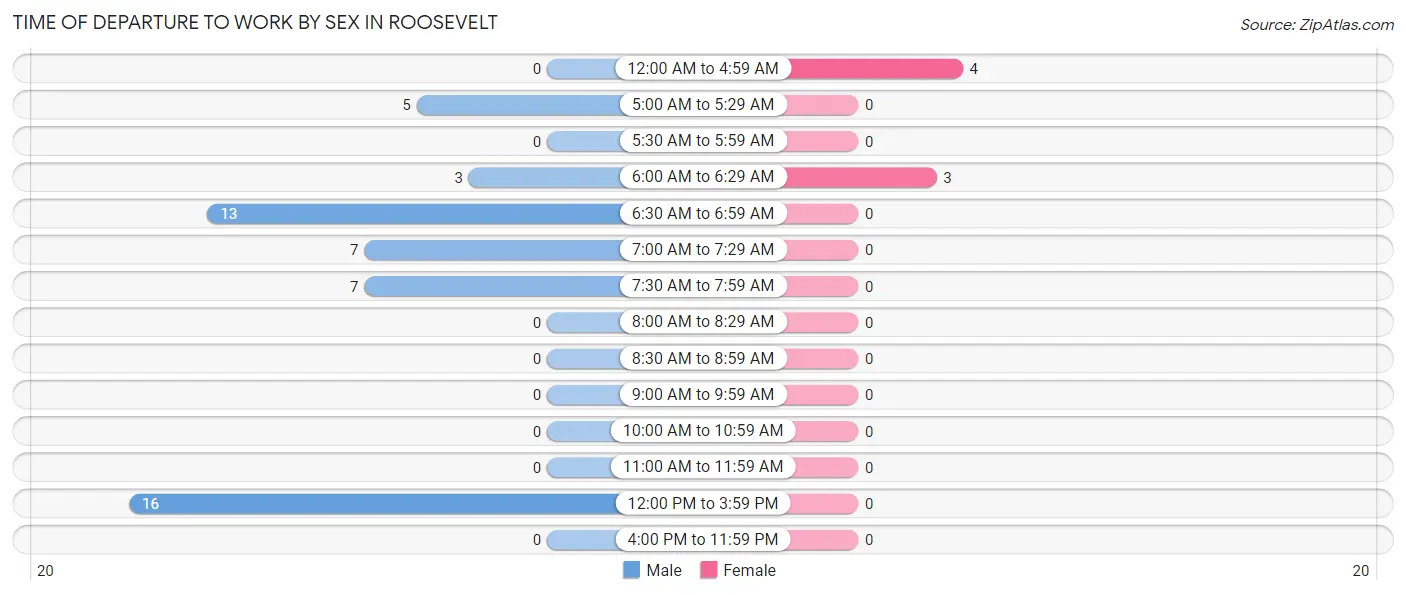
| Time of Departure | Male | Female |
| 12:00 AM to 4:59 AM | 0 (0.0%) | 4 (57.1%) |
| 5:00 AM to 5:29 AM | 5 (9.8%) | 0 (0.0%) |
| 5:30 AM to 5:59 AM | 0 (0.0%) | 0 (0.0%) |
| 6:00 AM to 6:29 AM | 3 (5.9%) | 3 (42.9%) |
| 6:30 AM to 6:59 AM | 13 (25.5%) | 0 (0.0%) |
| 7:00 AM to 7:29 AM | 7 (13.7%) | 0 (0.0%) |
| 7:30 AM to 7:59 AM | 7 (13.7%) | 0 (0.0%) |
| 8:00 AM to 8:29 AM | 0 (0.0%) | 0 (0.0%) |
| 8:30 AM to 8:59 AM | 0 (0.0%) | 0 (0.0%) |
| 9:00 AM to 9:59 AM | 0 (0.0%) | 0 (0.0%) |
| 10:00 AM to 10:59 AM | 0 (0.0%) | 0 (0.0%) |
| 11:00 AM to 11:59 AM | 0 (0.0%) | 0 (0.0%) |
| 12:00 PM to 3:59 PM | 16 (31.4%) | 0 (0.0%) |
| 4:00 PM to 11:59 PM | 0 (0.0%) | 0 (0.0%) |
| Total | 51 (100.0%) | 7 (100.0%) |
Housing Occupancy in Roosevelt
Occupancy by Ownership in Roosevelt
Of the total 52 dwellings in Roosevelt, owner-occupied units account for 16 (30.8%), while renter-occupied units make up 36 (69.2%).
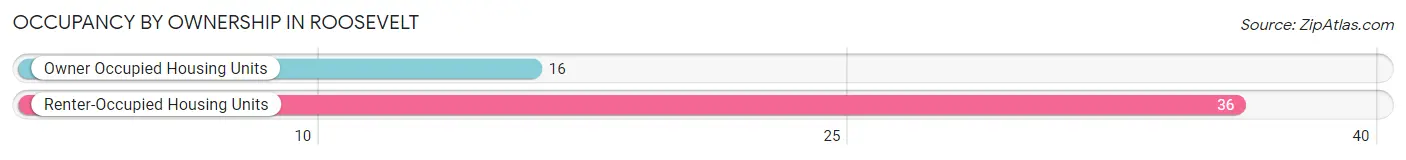
| Occupancy | # Housing Units | % Housing Units |
| Owner Occupied Housing Units | 16 | 30.8% |
| Renter-Occupied Housing Units | 36 | 69.2% |
| Total Occupied Housing Units | 52 | 100.0% |
Occupancy by Household Size in Roosevelt
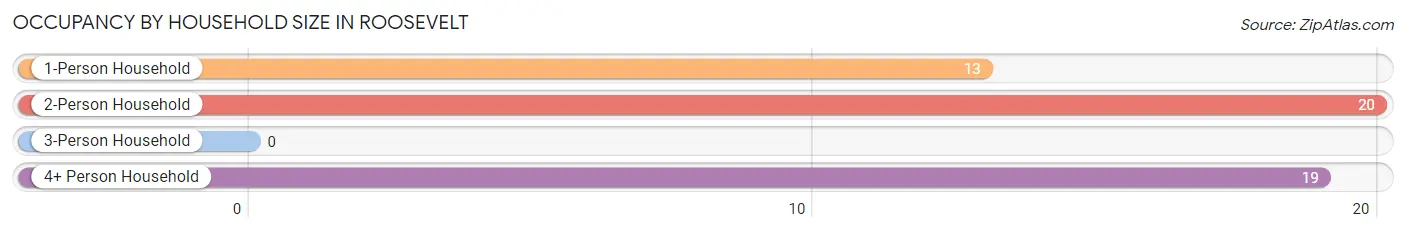
| Household Size | # Housing Units | % Housing Units |
| 1-Person Household | 13 | 25.0% |
| 2-Person Household | 20 | 38.5% |
| 3-Person Household | 0 | 0.0% |
| 4+ Person Household | 19 | 36.5% |
| Total Housing Units | 52 | 100.0% |
Occupancy by Ownership by Household Size in Roosevelt
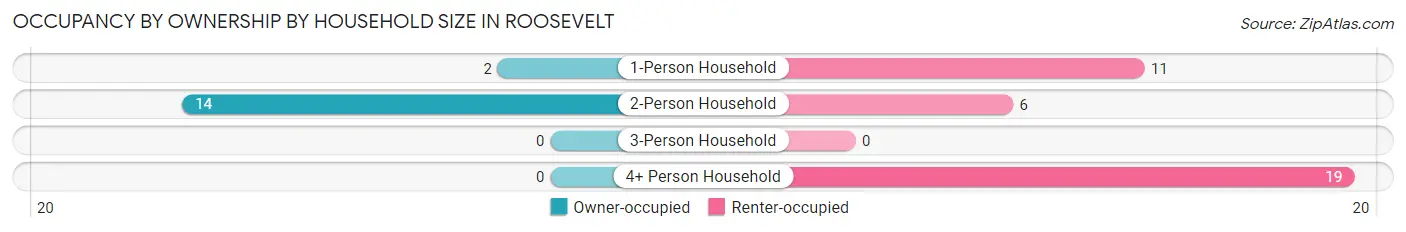
| Household Size | Owner-occupied | Renter-occupied |
| 1-Person Household | 2 (15.4%) | 11 (84.6%) |
| 2-Person Household | 14 (70.0%) | 6 (30.0%) |
| 3-Person Household | 0 (0.0%) | 0 (0.0%) |
| 4+ Person Household | 0 (0.0%) | 19 (100.0%) |
| Total Housing Units | 16 (30.8%) | 36 (69.2%) |
Occupancy by Educational Attainment in Roosevelt
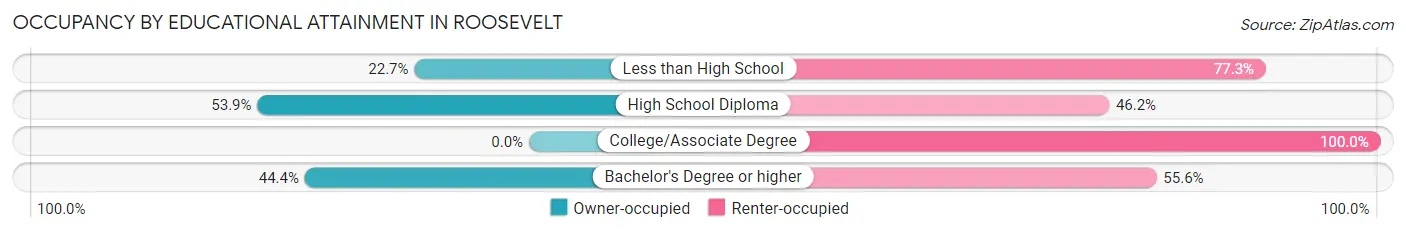
| Household Size | Owner-occupied | Renter-occupied |
| Less than High School | 5 (22.7%) | 17 (77.3%) |
| High School Diploma | 7 (53.8%) | 6 (46.2%) |
| College/Associate Degree | 0 (0.0%) | 8 (100.0%) |
| Bachelor's Degree or higher | 4 (44.4%) | 5 (55.6%) |
Occupancy by Age of Householder in Roosevelt
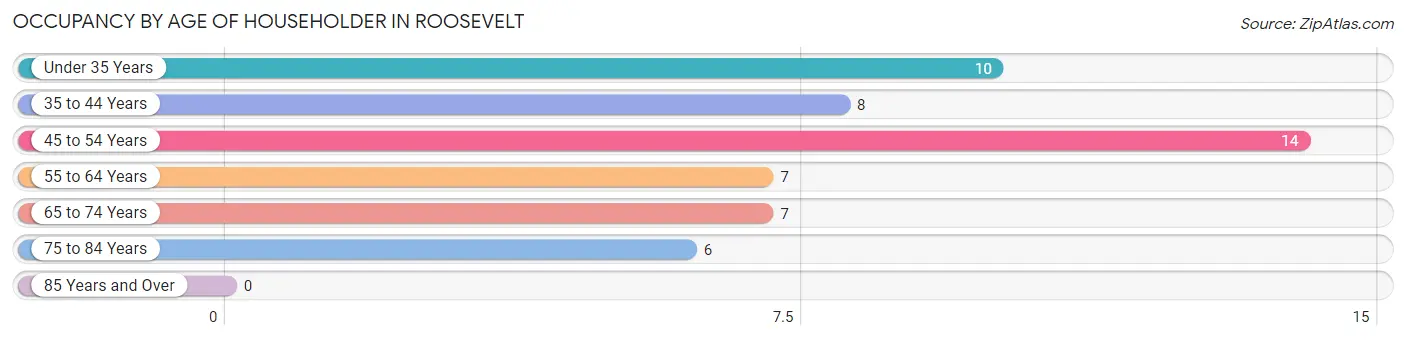
| Age Bracket | # Households | % Households |
| Under 35 Years | 10 | 19.2% |
| 35 to 44 Years | 8 | 15.4% |
| 45 to 54 Years | 14 | 26.9% |
| 55 to 64 Years | 7 | 13.5% |
| 65 to 74 Years | 7 | 13.5% |
| 75 to 84 Years | 6 | 11.5% |
| 85 Years and Over | 0 | 0.0% |
| Total | 52 | 100.0% |
Housing Finances in Roosevelt
Median Income by Occupancy in Roosevelt
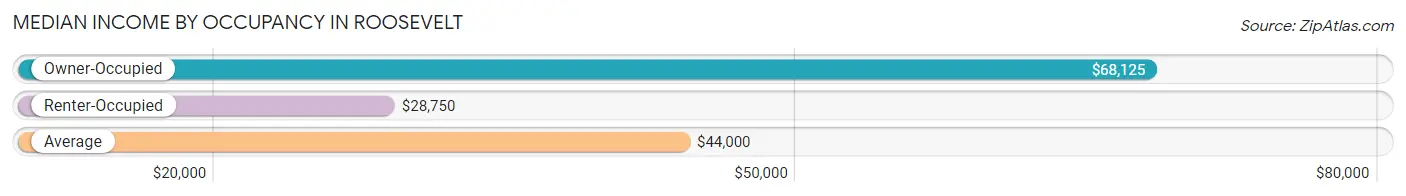
| Occupancy Type | # Households | Median Income |
| Owner-Occupied | 16 (30.8%) | $68,125 |
| Renter-Occupied | 36 (69.2%) | $28,750 |
| Average | 52 (100.0%) | $44,000 |
Occupancy by Householder Income Bracket in Roosevelt
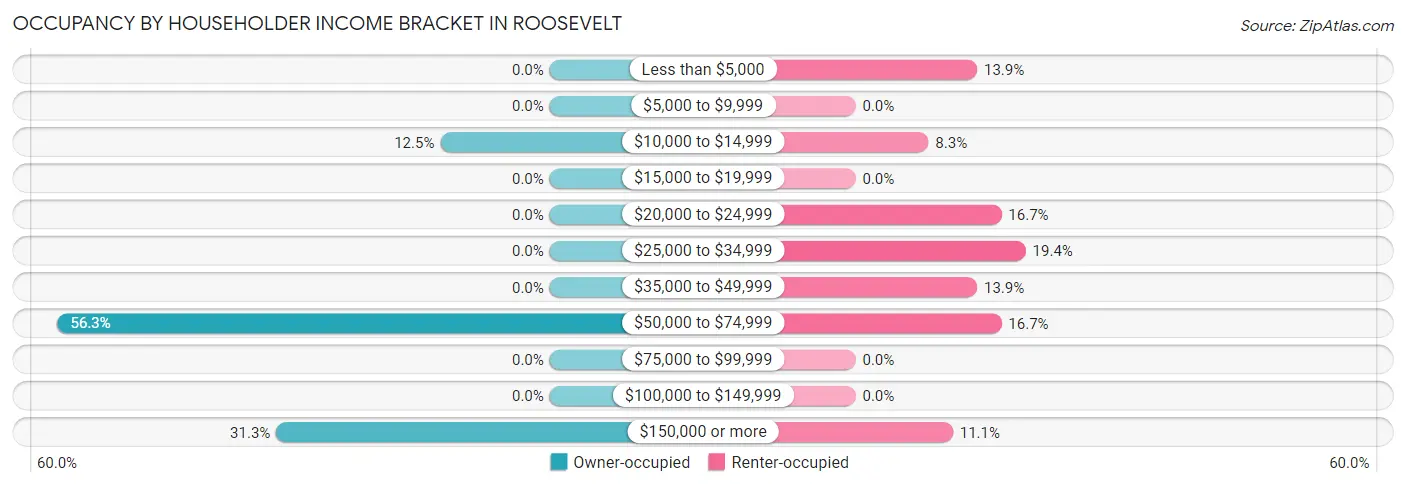
| Income Bracket | Owner-occupied | Renter-occupied |
| Less than $5,000 | 0 (0.0%) | 5 (13.9%) |
| $5,000 to $9,999 | 0 (0.0%) | 0 (0.0%) |
| $10,000 to $14,999 | 2 (12.5%) | 3 (8.3%) |
| $15,000 to $19,999 | 0 (0.0%) | 0 (0.0%) |
| $20,000 to $24,999 | 0 (0.0%) | 6 (16.7%) |
| $25,000 to $34,999 | 0 (0.0%) | 7 (19.4%) |
| $35,000 to $49,999 | 0 (0.0%) | 5 (13.9%) |
| $50,000 to $74,999 | 9 (56.2%) | 6 (16.7%) |
| $75,000 to $99,999 | 0 (0.0%) | 0 (0.0%) |
| $100,000 to $149,999 | 0 (0.0%) | 0 (0.0%) |
| $150,000 or more | 5 (31.2%) | 4 (11.1%) |
| Total | 16 (100.0%) | 36 (100.0%) |
Monthly Housing Cost Tiers in Roosevelt
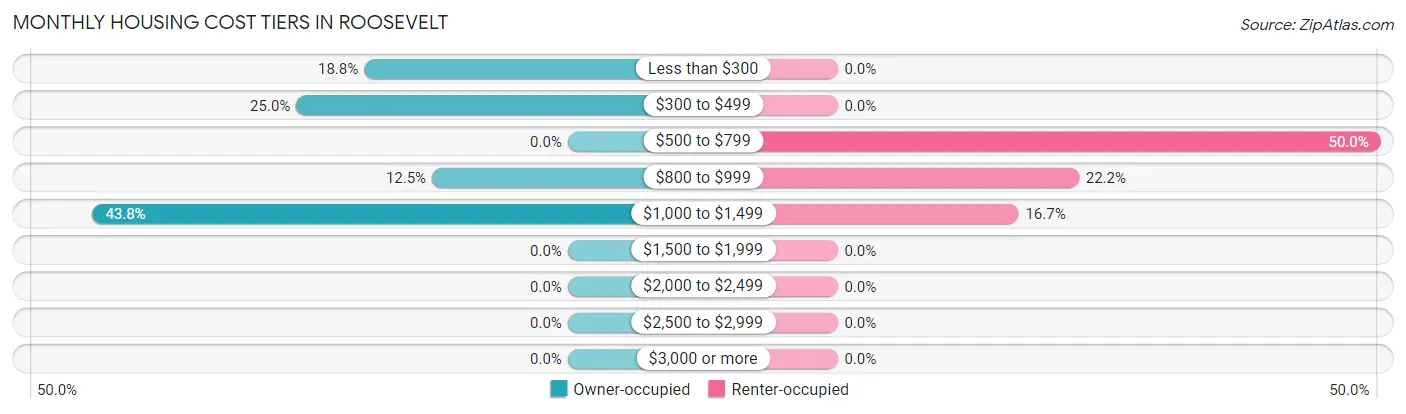
| Monthly Cost | Owner-occupied | Renter-occupied |
| Less than $300 | 3 (18.8%) | 0 (0.0%) |
| $300 to $499 | 4 (25.0%) | 0 (0.0%) |
| $500 to $799 | 0 (0.0%) | 18 (50.0%) |
| $800 to $999 | 2 (12.5%) | 8 (22.2%) |
| $1,000 to $1,499 | 7 (43.8%) | 6 (16.7%) |
| $1,500 to $1,999 | 0 (0.0%) | 0 (0.0%) |
| $2,000 to $2,499 | 0 (0.0%) | 0 (0.0%) |
| $2,500 to $2,999 | 0 (0.0%) | 0 (0.0%) |
| $3,000 or more | 0 (0.0%) | 0 (0.0%) |
| Total | 16 (100.0%) | 36 (100.0%) |
Physical Housing Characteristics in Roosevelt
Housing Structures in Roosevelt
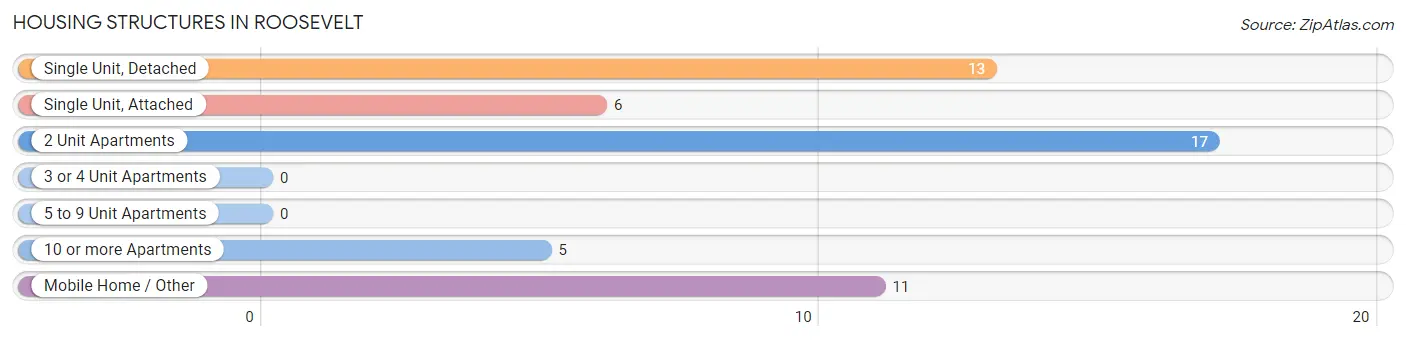
| Structure Type | # Housing Units | % Housing Units |
| Single Unit, Detached | 13 | 25.0% |
| Single Unit, Attached | 6 | 11.5% |
| 2 Unit Apartments | 17 | 32.7% |
| 3 or 4 Unit Apartments | 0 | 0.0% |
| 5 to 9 Unit Apartments | 0 | 0.0% |
| 10 or more Apartments | 5 | 9.6% |
| Mobile Home / Other | 11 | 21.1% |
| Total | 52 | 100.0% |
Housing Structures by Occupancy in Roosevelt
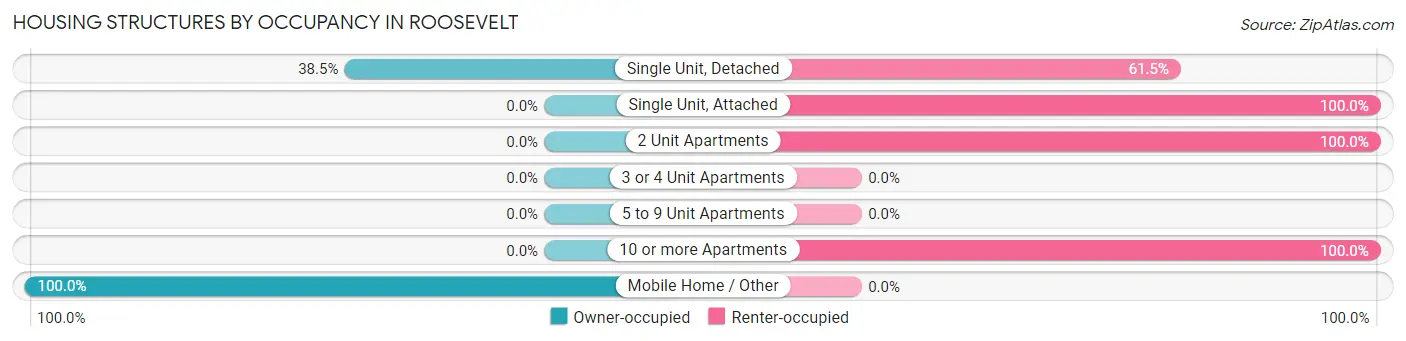
| Structure Type | Owner-occupied | Renter-occupied |
| Single Unit, Detached | 5 (38.5%) | 8 (61.5%) |
| Single Unit, Attached | 0 (0.0%) | 6 (100.0%) |
| 2 Unit Apartments | 0 (0.0%) | 17 (100.0%) |
| 3 or 4 Unit Apartments | 0 (0.0%) | 0 (0.0%) |
| 5 to 9 Unit Apartments | 0 (0.0%) | 0 (0.0%) |
| 10 or more Apartments | 0 (0.0%) | 5 (100.0%) |
| Mobile Home / Other | 11 (100.0%) | 0 (0.0%) |
| Total | 16 (30.8%) | 36 (69.2%) |
Housing Structures by Number of Rooms in Roosevelt
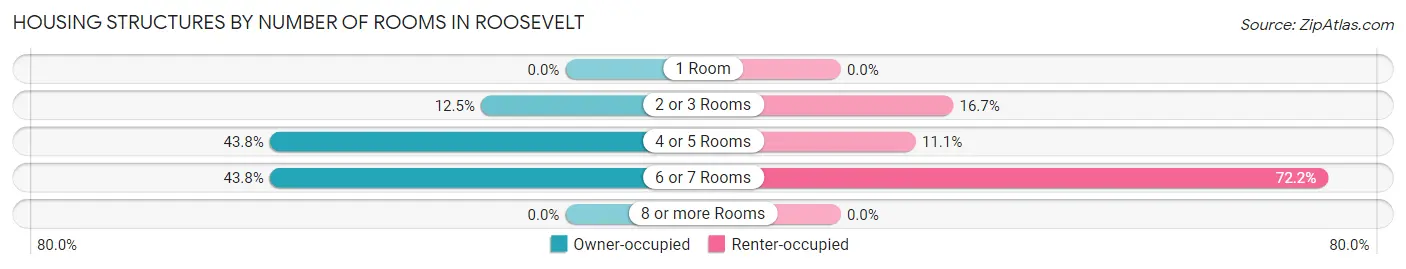
| Number of Rooms | Owner-occupied | Renter-occupied |
| 1 Room | 0 (0.0%) | 0 (0.0%) |
| 2 or 3 Rooms | 2 (12.5%) | 6 (16.7%) |
| 4 or 5 Rooms | 7 (43.8%) | 4 (11.1%) |
| 6 or 7 Rooms | 7 (43.8%) | 26 (72.2%) |
| 8 or more Rooms | 0 (0.0%) | 0 (0.0%) |
| Total | 16 (100.0%) | 36 (100.0%) |
Housing Structure by Heating Type in Roosevelt
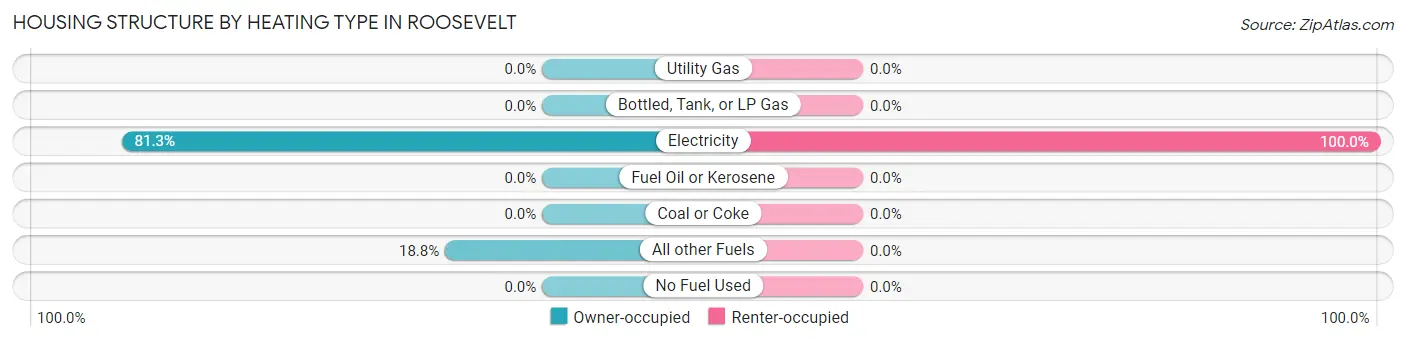
| Heating Type | Owner-occupied | Renter-occupied |
| Utility Gas | 0 (0.0%) | 0 (0.0%) |
| Bottled, Tank, or LP Gas | 0 (0.0%) | 0 (0.0%) |
| Electricity | 13 (81.2%) | 36 (100.0%) |
| Fuel Oil or Kerosene | 0 (0.0%) | 0 (0.0%) |
| Coal or Coke | 0 (0.0%) | 0 (0.0%) |
| All other Fuels | 3 (18.8%) | 0 (0.0%) |
| No Fuel Used | 0 (0.0%) | 0 (0.0%) |
| Total | 16 (100.0%) | 36 (100.0%) |
Household Vehicle Usage in Roosevelt
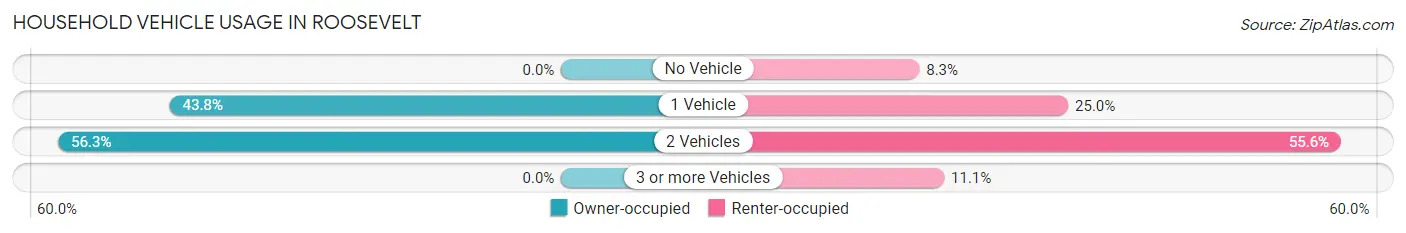
| Vehicles per Household | Owner-occupied | Renter-occupied |
| No Vehicle | 0 (0.0%) | 3 (8.3%) |
| 1 Vehicle | 7 (43.8%) | 9 (25.0%) |
| 2 Vehicles | 9 (56.2%) | 20 (55.6%) |
| 3 or more Vehicles | 0 (0.0%) | 4 (11.1%) |
| Total | 16 (100.0%) | 36 (100.0%) |
Real Estate & Mortgages in Roosevelt
Real Estate and Mortgage Overview in Roosevelt
| Characteristic | Without Mortgage | With Mortgage |
| Housing Units | 7 | 9 |
| Median Property Value | - | - |
| Median Household Income | - | - |
| Monthly Housing Costs | - | - |
| Real Estate Taxes | - | - |
Property Value by Mortgage Status in Roosevelt
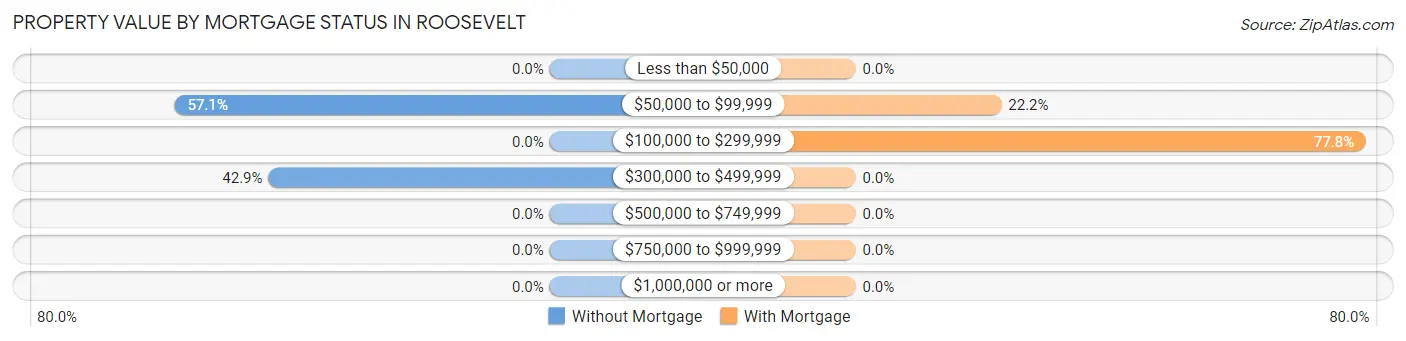
| Property Value | Without Mortgage | With Mortgage |
| Less than $50,000 | 0 (0.0%) | 0 (0.0%) |
| $50,000 to $99,999 | 4 (57.1%) | 2 (22.2%) |
| $100,000 to $299,999 | 0 (0.0%) | 7 (77.8%) |
| $300,000 to $499,999 | 3 (42.9%) | 0 (0.0%) |
| $500,000 to $749,999 | 0 (0.0%) | 0 (0.0%) |
| $750,000 to $999,999 | 0 (0.0%) | 0 (0.0%) |
| $1,000,000 or more | 0 (0.0%) | 0 (0.0%) |
| Total | 7 (100.0%) | 9 (100.0%) |
Household Income by Mortgage Status in Roosevelt
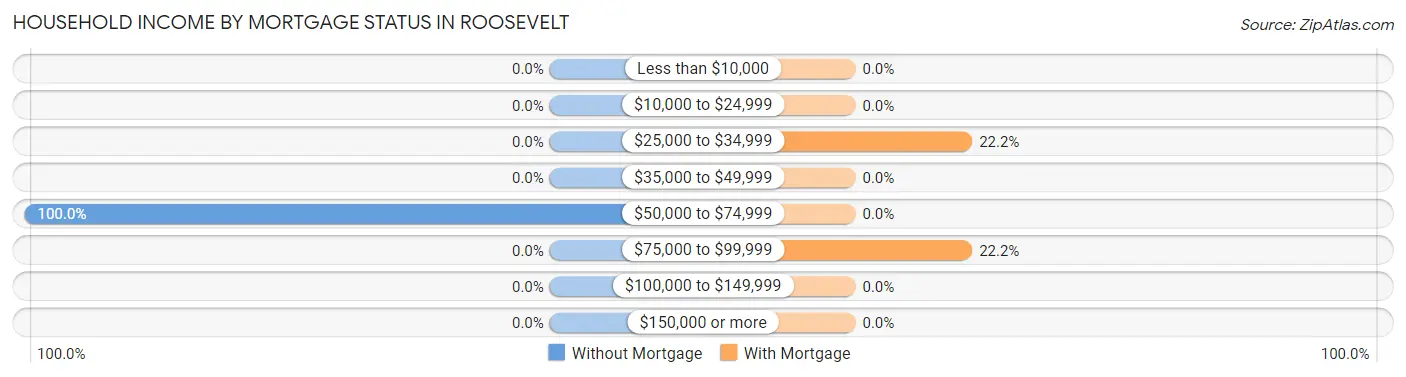
| Household Income | Without Mortgage | With Mortgage |
| Less than $10,000 | 0 (0.0%) | 0 (0.0%) |
| $10,000 to $24,999 | 0 (0.0%) | 0 (0.0%) |
| $25,000 to $34,999 | 0 (0.0%) | 2 (22.2%) |
| $35,000 to $49,999 | 0 (0.0%) | 0 (0.0%) |
| $50,000 to $74,999 | 7 (100.0%) | 0 (0.0%) |
| $75,000 to $99,999 | 0 (0.0%) | 2 (22.2%) |
| $100,000 to $149,999 | 0 (0.0%) | 0 (0.0%) |
| $150,000 or more | 0 (0.0%) | 0 (0.0%) |
| Total | 7 (100.0%) | 9 (100.0%) |
Property Value to Household Income Ratio in Roosevelt
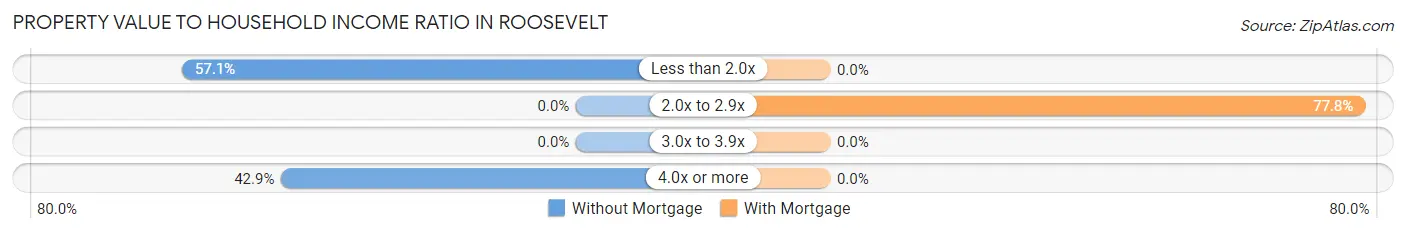
| Value-to-Income Ratio | Without Mortgage | With Mortgage |
| Less than 2.0x | 4 (57.1%) | 0 (0.0%) |
| 2.0x to 2.9x | 0 (0.0%) | 7 (77.8%) |
| 3.0x to 3.9x | 0 (0.0%) | 0 (0.0%) |
| 4.0x or more | 3 (42.9%) | 0 (0.0%) |
| Total | 7 (100.0%) | 9 (100.0%) |
Real Estate Taxes by Mortgage Status in Roosevelt
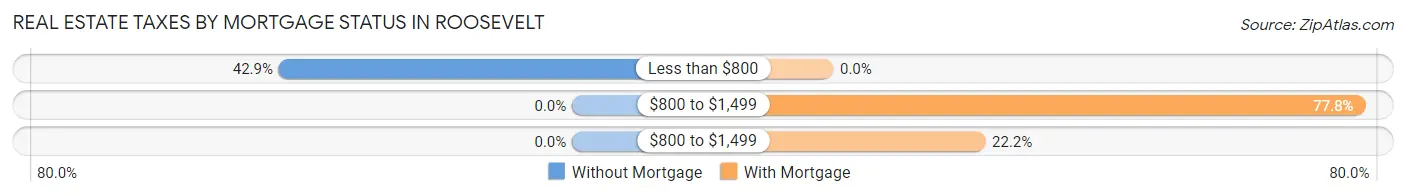
| Property Taxes | Without Mortgage | With Mortgage |
| Less than $800 | 3 (42.9%) | 0 (0.0%) |
| $800 to $1,499 | 0 (0.0%) | 7 (77.8%) |
| $800 to $1,499 | 0 (0.0%) | 2 (22.2%) |
| Total | 7 (100.0%) | 9 (100.0%) |
Health & Disability in Roosevelt
Health Insurance Coverage by Age in Roosevelt
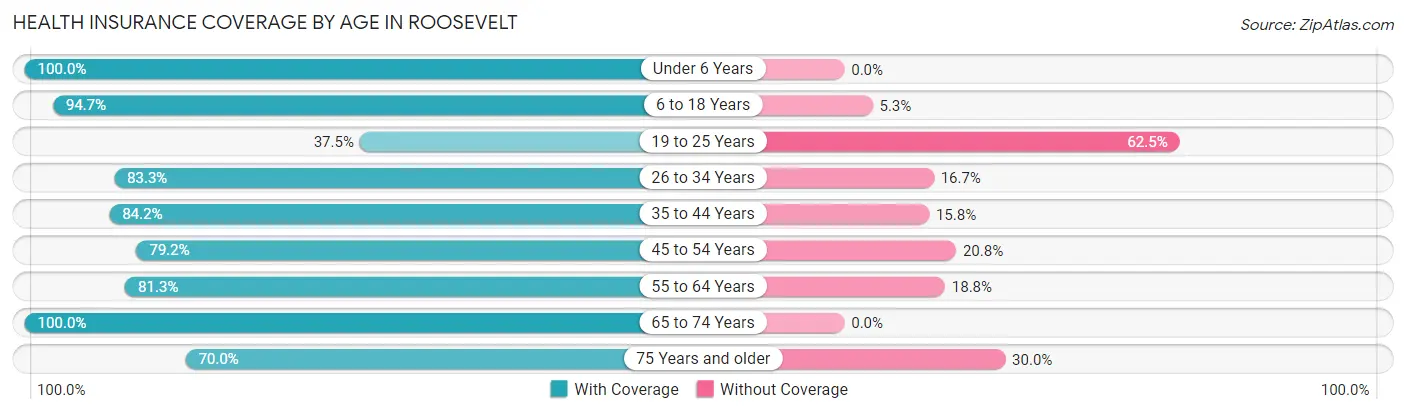
| Age Bracket | With Coverage | Without Coverage |
| Under 6 Years | 17 (100.0%) | 0 (0.0%) |
| 6 to 18 Years | 54 (94.7%) | 3 (5.3%) |
| 19 to 25 Years | 9 (37.5%) | 15 (62.5%) |
| 26 to 34 Years | 15 (83.3%) | 3 (16.7%) |
| 35 to 44 Years | 16 (84.2%) | 3 (15.8%) |
| 45 to 54 Years | 19 (79.2%) | 5 (20.8%) |
| 55 to 64 Years | 13 (81.2%) | 3 (18.8%) |
| 65 to 74 Years | 7 (100.0%) | 0 (0.0%) |
| 75 Years and older | 7 (70.0%) | 3 (30.0%) |
| Total | 157 (81.8%) | 35 (18.2%) |
Health Insurance Coverage by Citizenship Status in Roosevelt
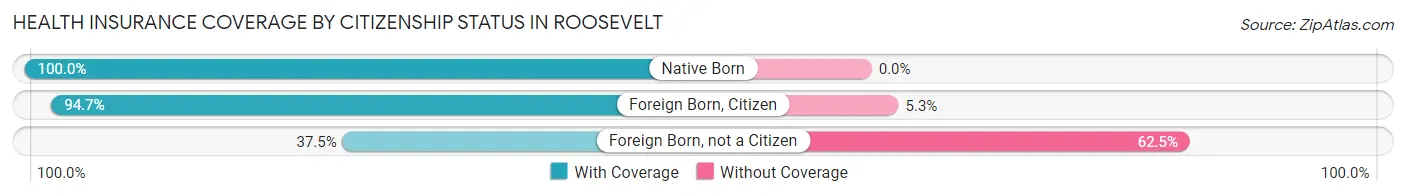
| Citizenship Status | With Coverage | Without Coverage |
| Native Born | 17 (100.0%) | 0 (0.0%) |
| Foreign Born, Citizen | 54 (94.7%) | 3 (5.3%) |
| Foreign Born, not a Citizen | 9 (37.5%) | 15 (62.5%) |
Health Insurance Coverage by Household Income in Roosevelt
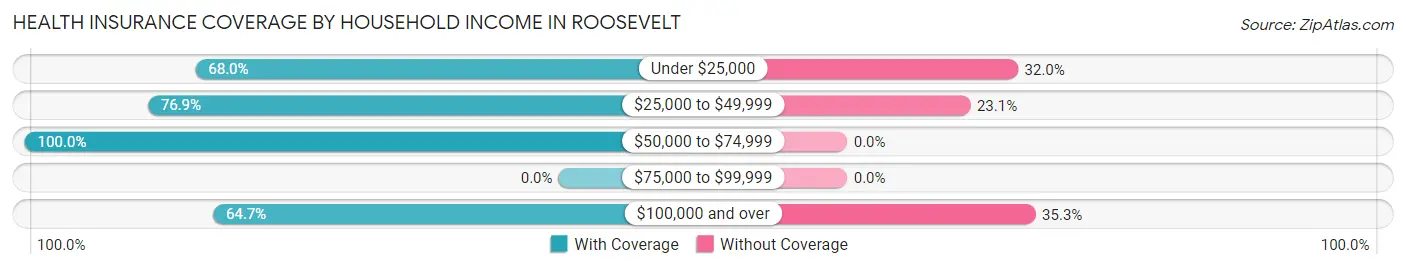
| Household Income | With Coverage | Without Coverage |
| Under $25,000 | 17 (68.0%) | 8 (32.0%) |
| $25,000 to $49,999 | 30 (76.9%) | 9 (23.1%) |
| $50,000 to $74,999 | 77 (100.0%) | 0 (0.0%) |
| $75,000 to $99,999 | 0 (0.0%) | 0 (0.0%) |
| $100,000 and over | 33 (64.7%) | 18 (35.3%) |
Public vs Private Health Insurance Coverage by Age in Roosevelt
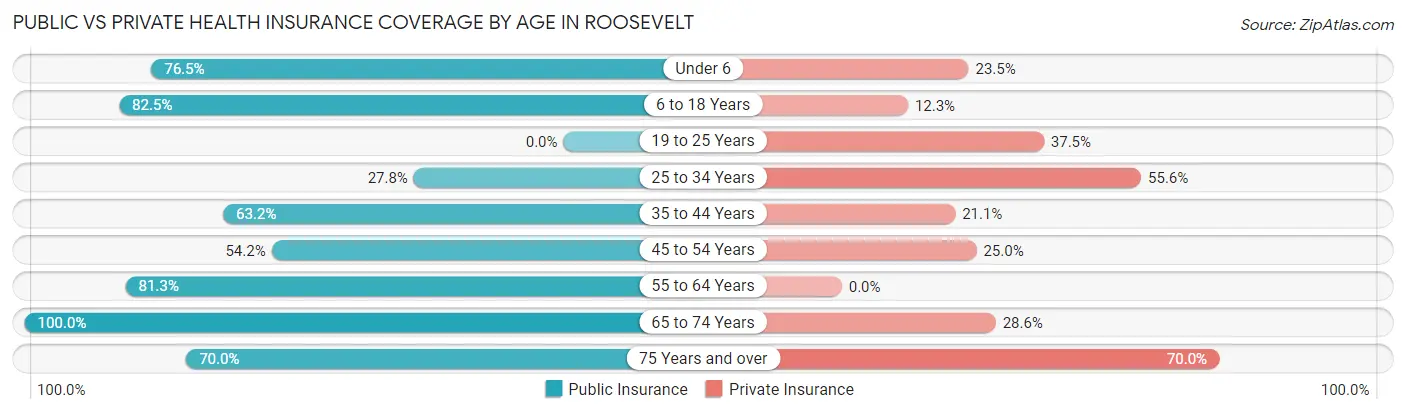
| Age Bracket | Public Insurance | Private Insurance |
| Under 6 | 13 (76.5%) | 4 (23.5%) |
| 6 to 18 Years | 47 (82.5%) | 7 (12.3%) |
| 19 to 25 Years | 0 (0.0%) | 9 (37.5%) |
| 25 to 34 Years | 5 (27.8%) | 10 (55.6%) |
| 35 to 44 Years | 12 (63.2%) | 4 (21.0%) |
| 45 to 54 Years | 13 (54.2%) | 6 (25.0%) |
| 55 to 64 Years | 13 (81.2%) | 0 (0.0%) |
| 65 to 74 Years | 7 (100.0%) | 2 (28.6%) |
| 75 Years and over | 7 (70.0%) | 7 (70.0%) |
| Total | 117 (60.9%) | 49 (25.5%) |
Disability Status by Sex by Age in Roosevelt
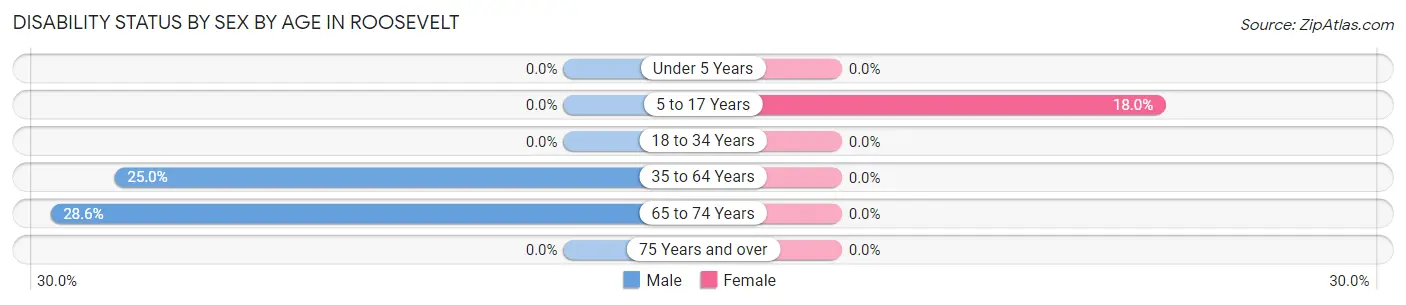
| Age Bracket | Male | Female |
| Under 5 Years | 0 (0.0%) | 0 (0.0%) |
| 5 to 17 Years | 0 (0.0%) | 9 (18.0%) |
| 18 to 34 Years | 0 (0.0%) | 0 (0.0%) |
| 35 to 64 Years | 6 (25.0%) | 0 (0.0%) |
| 65 to 74 Years | 2 (28.6%) | 0 (0.0%) |
| 75 Years and over | 0 (0.0%) | 0 (0.0%) |
Disability Class by Sex by Age in Roosevelt
Disability Class: Hearing Difficulty
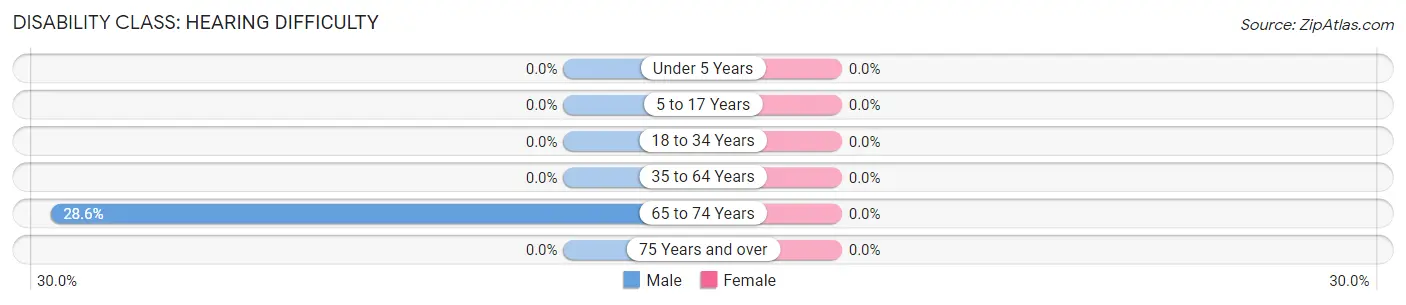
| Age Bracket | Male | Female |
| Under 5 Years | 0 (0.0%) | 0 (0.0%) |
| 5 to 17 Years | 0 (0.0%) | 0 (0.0%) |
| 18 to 34 Years | 0 (0.0%) | 0 (0.0%) |
| 35 to 64 Years | 0 (0.0%) | 0 (0.0%) |
| 65 to 74 Years | 2 (28.6%) | 0 (0.0%) |
| 75 Years and over | 0 (0.0%) | 0 (0.0%) |
Disability Class: Vision Difficulty
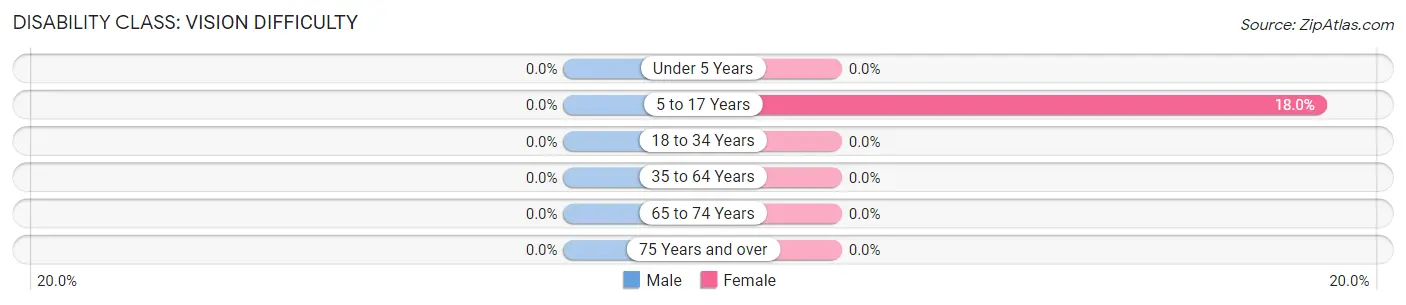
| Age Bracket | Male | Female |
| Under 5 Years | 0 (0.0%) | 0 (0.0%) |
| 5 to 17 Years | 0 (0.0%) | 9 (18.0%) |
| 18 to 34 Years | 0 (0.0%) | 0 (0.0%) |
| 35 to 64 Years | 0 (0.0%) | 0 (0.0%) |
| 65 to 74 Years | 0 (0.0%) | 0 (0.0%) |
| 75 Years and over | 0 (0.0%) | 0 (0.0%) |
Disability Class: Cognitive Difficulty
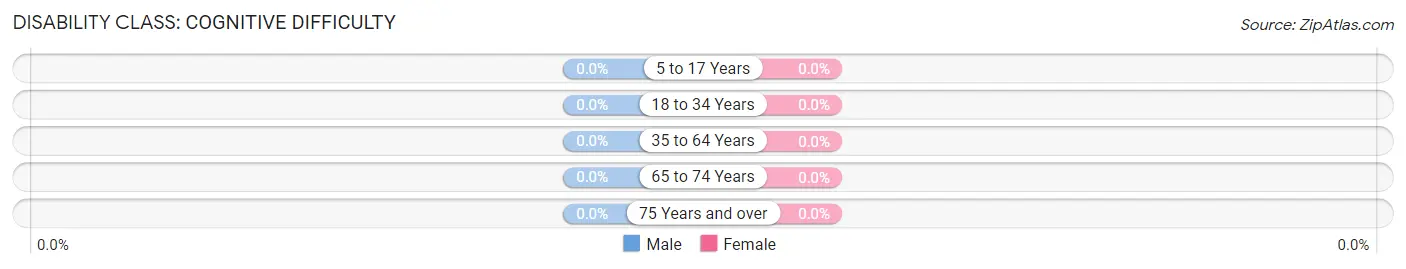
| Age Bracket | Male | Female |
| 5 to 17 Years | 0 (0.0%) | 0 (0.0%) |
| 18 to 34 Years | 0 (0.0%) | 0 (0.0%) |
| 35 to 64 Years | 0 (0.0%) | 0 (0.0%) |
| 65 to 74 Years | 0 (0.0%) | 0 (0.0%) |
| 75 Years and over | 0 (0.0%) | 0 (0.0%) |
Disability Class: Ambulatory Difficulty
| Age Bracket | Male | Female |
| 5 to 17 Years | 0 (0.0%) | 0 (0.0%) |
| 18 to 34 Years | 0 (0.0%) | 0 (0.0%) |
| 35 to 64 Years | 0 (0.0%) | 0 (0.0%) |
| 65 to 74 Years | 0 (0.0%) | 0 (0.0%) |
| 75 Years and over | 0 (0.0%) | 0 (0.0%) |
Disability Class: Self-Care Difficulty
| Age Bracket | Male | Female |
| 5 to 17 Years | 0 (0.0%) | 0 (0.0%) |
| 18 to 34 Years | 0 (0.0%) | 0 (0.0%) |
| 35 to 64 Years | 0 (0.0%) | 0 (0.0%) |
| 65 to 74 Years | 0 (0.0%) | 0 (0.0%) |
| 75 Years and over | 0 (0.0%) | 0 (0.0%) |
Technology Access in Roosevelt
Computing Device Access in Roosevelt
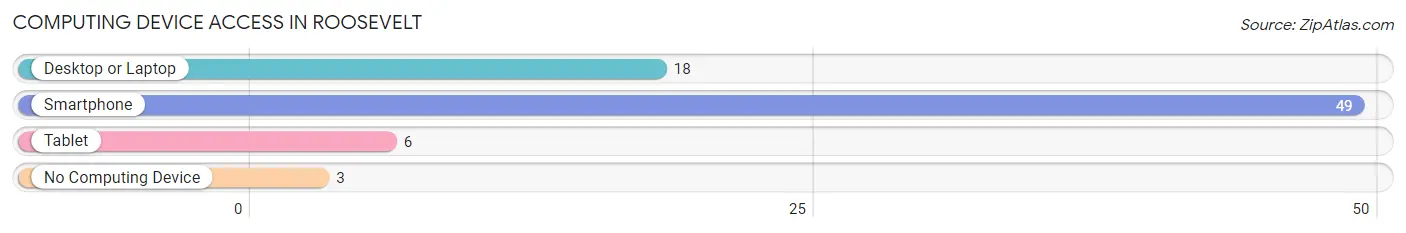
| Device Type | # Households | % Households |
| Desktop or Laptop | 18 | 34.6% |
| Smartphone | 49 | 94.2% |
| Tablet | 6 | 11.5% |
| No Computing Device | 3 | 5.8% |
| Total | 52 | 100.0% |
Internet Access in Roosevelt
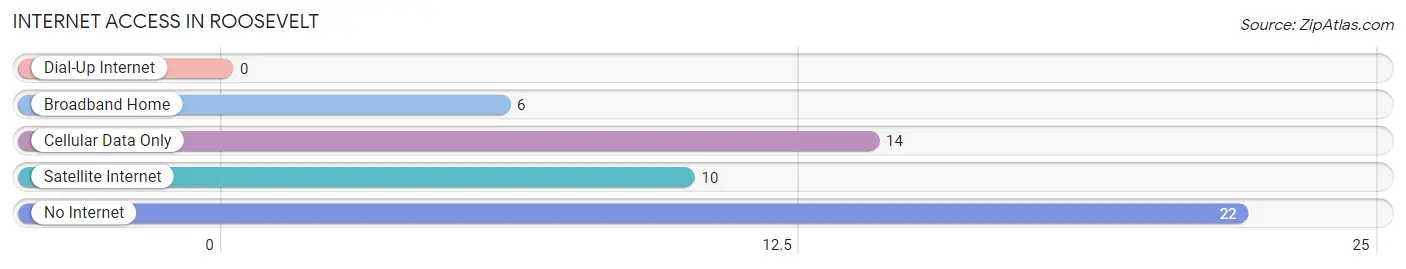
| Internet Type | # Households | % Households |
| Dial-Up Internet | 0 | 0.0% |
| Broadband Home | 6 | 11.5% |
| Cellular Data Only | 14 | 26.9% |
| Satellite Internet | 10 | 19.2% |
| No Internet | 22 | 42.3% |
| Total | 52 | 100.0% |
Roosevelt Summary
Roosevelt, Washington is a small town located in the northeastern corner of the state, near the Canadian border. It is part of the Okanogan County, and is situated in the Okanogan Valley, which is surrounded by the Cascade Mountains. The town was founded in the late 1800s and has a population of approximately 1,000 people.
Geography
Roosevelt is located in the Okanogan Valley, which is surrounded by the Cascade Mountains. The town is situated at an elevation of 1,890 feet and is located at the confluence of the Okanogan and Similkameen Rivers. The area is characterized by rolling hills, open meadows, and dense forests. The climate is semi-arid, with hot summers and cold winters.
Economy
The economy of Roosevelt is largely based on agriculture and tourism. The town is home to several farms, which produce a variety of crops, including apples, cherries, and hay. The area is also known for its wineries, which produce a variety of wines. Tourism is also an important part of the local economy, with visitors coming to the area to enjoy the natural beauty of the Okanogan Valley.
Demographics
As of the 2010 census, the population of Roosevelt was 1,000 people. The racial makeup of the town was 94.2% White, 0.7% Native American, 0.3% Asian, 0.1% Pacific Islander, 0.1% from other races, and 4.7% from two or more races. The median household income was $37,500, and the median family income was $41,250.
History
The area around Roosevelt was first settled by Native Americans, who lived in the area for thousands of years before the arrival of European settlers. The town was founded in the late 1800s and was named after President Theodore Roosevelt. The town was originally a farming community, but in the early 1900s, the area began to develop into a tourist destination. The town was incorporated in 1909 and has remained a small, rural community ever since.
Roosevelt has a rich history and is home to several historic sites, including the Roosevelt Hotel, which was built in the early 1900s and is now listed on the National Register of Historic Places. The town is also home to the Roosevelt Historical Museum, which houses artifacts and exhibits related to the town's history.
Conclusion
Roosevelt, Washington is a small town located in the northeastern corner of the state, near the Canadian border. It is part of the Okanogan County, and is situated in the Okanogan Valley, which is surrounded by the Cascade Mountains. The town was founded in the late 1800s and has a population of approximately 1,000 people. The economy of Roosevelt is largely based on agriculture and tourism, and the town is home to several farms, wineries, and historic sites. The racial makeup of the town is 94.2% White, 0.7% Native American, 0.3% Asian, 0.1% Pacific Islander, 0.1% from other races, and 4.7% from two or more races. The median household income was $37,500, and the median family income was $41,250. Roosevelt has a rich history and is a great place to visit for those looking to explore the natural beauty of the Okanogan Valley.
Common Questions
What is Per Capita Income in Roosevelt?
Per Capita income in Roosevelt is $17,226.
What is the Median Family Income in Roosevelt?
Median Family Income in Roosevelt is $51,458.
What is the Median Household income in Roosevelt?
Median Household Income in Roosevelt is $44,000.
What is Inequality or Gini Index in Roosevelt?
Inequality or Gini Index in Roosevelt is 0.47.
What is the Total Population of Roosevelt?
Total Population of Roosevelt is 192.
What is the Total Male Population of Roosevelt?
Total Male Population of Roosevelt is 93.
What is the Total Female Population of Roosevelt?
Total Female Population of Roosevelt is 99.
What is the Ratio of Males per 100 Females in Roosevelt?
There are 93.94 Males per 100 Females in Roosevelt.
What is the Ratio of Females per 100 Males in Roosevelt?
There are 106.45 Females per 100 Males in Roosevelt.
What is the Median Population Age in Roosevelt?
Median Population Age in Roosevelt is 24.8 Years.
What is the Average Family Size in Roosevelt
Average Family Size in Roosevelt is 4.7 People.
What is the Average Household Size in Roosevelt
Average Household Size in Roosevelt is 3.7 People.
How Large is the Labor Force in Roosevelt?
There are 70 People in the Labor Forcein in Roosevelt.
What is the Percentage of People in the Labor Force in Roosevelt?
49.0% of People are in the Labor Force in Roosevelt.
What is the Unemployment Rate in Roosevelt?
Unemployment Rate in Roosevelt is 17.1%.