Cities with the Highest Percentage of Population Employed in Farming, Fishing & Forestry in Washington
RELATED REPORTS & OPTIONS
Farming, Fishing & Forestry
Washington
Compare Cities
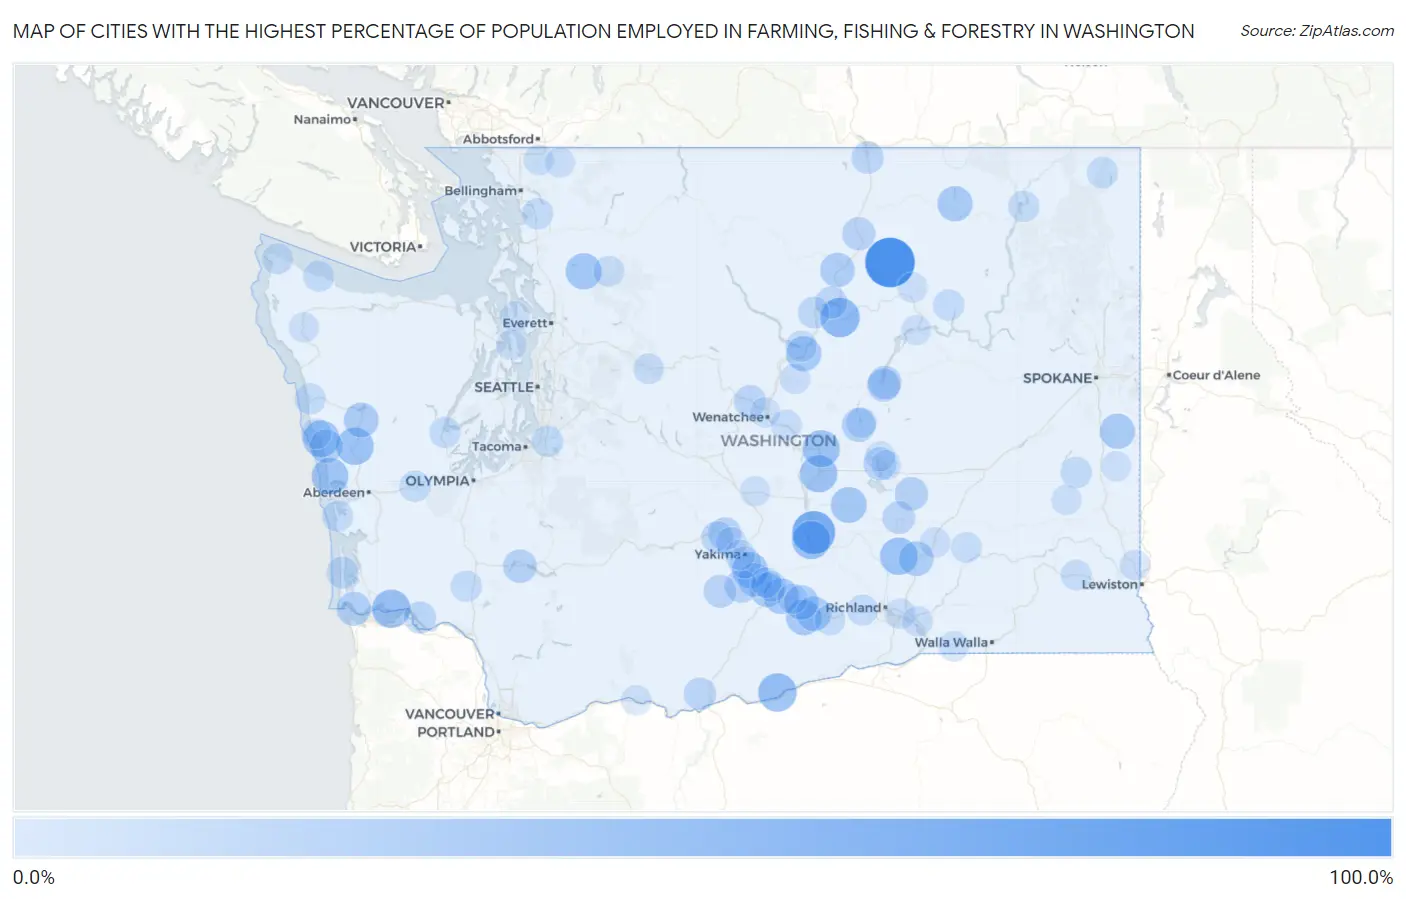
Map of Cities with the Highest Percentage of Population Employed in Farming, Fishing & Forestry in Washington
0.0%
100.0%
Cities with the Highest Percentage of Population Employed in Farming, Fishing & Forestry in Washington
| City | % Employed | vs State | vs National | |
| 1. | Disautel | 100.0% | 1.5%(+98.5)#1 | 0.61%(+99.4)#16 |
| 2. | Mattawa | 67.0% | 1.5%(+65.5)#2 | 0.61%(+66.4)#36 |
| 3. | Bridgeport | 49.3% | 1.5%(+47.8)#3 | 0.61%(+48.7)#85 |
| 4. | Roosevelt | 44.8% | 1.5%(+43.3)#4 | 0.61%(+44.2)#98 |
| 5. | Desert Aire | 43.9% | 1.5%(+42.4)#5 | 0.61%(+43.3)#105 |
| 6. | Altoona | 43.8% | 1.5%(+42.2)#6 | 0.61%(+43.1)#106 |
| 7. | Basin City | 40.0% | 1.5%(+38.5)#7 | 0.61%(+39.4)#124 |
| 8. | Humptulips | 39.7% | 1.5%(+38.2)#8 | 0.61%(+39.1)#129 |
| 9. | George | 39.3% | 1.5%(+37.8)#9 | 0.61%(+38.7)#130 |
| 10. | Quincy | 38.4% | 1.5%(+36.9)#10 | 0.61%(+37.8)#135 |
| 11. | Santiago | 37.5% | 1.5%(+36.0)#11 | 0.61%(+36.9)#141 |
| 12. | Ocean City | 37.0% | 1.5%(+35.4)#12 | 0.61%(+36.4)#147 |
| 13. | Beverly | 35.7% | 1.5%(+34.2)#13 | 0.61%(+35.1)#158 |
| 14. | Oso | 33.3% | 1.5%(+31.8)#14 | 0.61%(+32.7)#175 |
| 15. | Royal City | 32.6% | 1.5%(+31.1)#15 | 0.61%(+32.0)#187 |
| 16. | Parker | 32.3% | 1.5%(+30.7)#16 | 0.61%(+31.7)#189 |
| 17. | Mabton | 30.9% | 1.5%(+29.4)#17 | 0.61%(+30.3)#205 |
| 18. | Granger | 30.6% | 1.5%(+29.1)#18 | 0.61%(+30.0)#216 |
| 19. | Chelan Falls | 29.5% | 1.5%(+28.0)#19 | 0.61%(+28.9)#229 |
| 20. | Waverly | 29.2% | 1.5%(+27.7)#20 | 0.61%(+28.6)#231 |
| 21. | Torboy | 29.0% | 1.5%(+27.5)#21 | 0.61%(+28.4)#237 |
| 22. | Grandview | 27.3% | 1.5%(+25.8)#22 | 0.61%(+26.7)#270 |
| 23. | Neilton | 27.2% | 1.5%(+25.7)#23 | 0.61%(+26.6)#273 |
| 24. | Sunnyside | 26.7% | 1.5%(+25.2)#24 | 0.61%(+26.1)#286 |
| 25. | Schwana | 26.7% | 1.5%(+25.2)#25 | 0.61%(+26.1)#287 |
| 26. | Mesa | 26.2% | 1.5%(+24.7)#26 | 0.61%(+25.6)#297 |
| 27. | Toppenish | 26.1% | 1.5%(+24.6)#27 | 0.61%(+25.5)#299 |
| 28. | Malott | 25.7% | 1.5%(+24.2)#28 | 0.61%(+25.1)#310 |
| 29. | Chinook | 23.8% | 1.5%(+22.3)#29 | 0.61%(+23.2)#342 |
| 30. | Wapato | 22.9% | 1.5%(+21.4)#30 | 0.61%(+22.3)#365 |
| 31. | Lakeview | 22.6% | 1.5%(+21.1)#31 | 0.61%(+22.0)#369 |
| 32. | Mossyrock | 21.9% | 1.5%(+20.4)#32 | 0.61%(+21.3)#389 |
| 33. | Qui Nai Elt Village | 21.4% | 1.5%(+19.9)#33 | 0.61%(+20.8)#397 |
| 34. | Warden | 20.7% | 1.5%(+19.2)#34 | 0.61%(+20.1)#419 |
| 35. | Banks Lake South | 20.0% | 1.5%(+18.5)#35 | 0.61%(+19.4)#444 |
| 36. | Coulee City | 19.9% | 1.5%(+18.4)#36 | 0.61%(+19.3)#450 |
| 37. | Harrah | 19.0% | 1.5%(+17.4)#37 | 0.61%(+18.3)#474 |
| 38. | Riverside | 18.9% | 1.5%(+17.4)#38 | 0.61%(+18.3)#475 |
| 39. | Cascade Valley | 18.6% | 1.5%(+17.1)#39 | 0.61%(+18.0)#489 |
| 40. | White Swan | 18.3% | 1.5%(+16.8)#40 | 0.61%(+17.7)#496 |
| 41. | Naches | 18.0% | 1.5%(+16.5)#41 | 0.61%(+17.4)#512 |
| 42. | Othello | 17.3% | 1.5%(+15.8)#42 | 0.61%(+16.7)#545 |
| 43. | Tieton | 16.5% | 1.5%(+15.0)#43 | 0.61%(+15.9)#573 |
| 44. | Centerville | 16.4% | 1.5%(+14.9)#44 | 0.61%(+15.8)#575 |
| 45. | Oroville | 15.8% | 1.5%(+14.3)#45 | 0.61%(+15.2)#598 |
| 46. | Cashmere | 15.4% | 1.5%(+13.9)#46 | 0.61%(+14.8)#615 |
| 47. | Brewster | 15.2% | 1.5%(+13.7)#47 | 0.61%(+14.6)#633 |
| 48. | Lower Elochoman | 14.9% | 1.5%(+13.4)#48 | 0.61%(+14.3)#649 |
| 49. | Union Gap | 14.1% | 1.5%(+12.6)#49 | 0.61%(+13.5)#705 |
| 50. | Ocean Park | 13.8% | 1.5%(+12.3)#50 | 0.61%(+13.2)#725 |
| 51. | Pateros | 13.0% | 1.5%(+11.5)#51 | 0.61%(+12.4)#786 |
| 52. | Ocosta | 11.9% | 1.5%(+10.4)#52 | 0.61%(+11.3)#878 |
| 53. | St John | 11.7% | 1.5%(+10.2)#53 | 0.61%(+11.1)#891 |
| 54. | Algona | 11.5% | 1.5%(+10.00)#54 | 0.61%(+10.9)#908 |
| 55. | Keller | 11.0% | 1.5%(+9.49)#55 | 0.61%(+10.4)#953 |
| 56. | Alger | 11.0% | 1.5%(+9.46)#56 | 0.61%(+10.4)#957 |
| 57. | Metaline Falls | 10.9% | 1.5%(+9.36)#57 | 0.61%(+10.3)#968 |
| 58. | Skokomish | 10.7% | 1.5%(+9.20)#58 | 0.61%(+10.1)#990 |
| 59. | Marcus | 10.6% | 1.5%(+9.13)#59 | 0.61%(+10.0)#1,001 |
| 60. | Elma | 10.6% | 1.5%(+9.06)#60 | 0.61%(+9.96)#1,003 |
| 61. | Vader | 10.4% | 1.5%(+8.88)#61 | 0.61%(+9.79)#1,022 |
| 62. | Queets | 10.3% | 1.5%(+8.83)#62 | 0.61%(+9.74)#1,029 |
| 63. | Chelan | 10.2% | 1.5%(+8.65)#63 | 0.61%(+9.56)#1,053 |
| 64. | Benton City | 9.7% | 1.5%(+8.20)#64 | 0.61%(+9.11)#1,113 |
| 65. | Grayland | 9.7% | 1.5%(+8.14)#65 | 0.61%(+9.05)#1,121 |
| 66. | Clallam Bay | 9.6% | 1.5%(+8.11)#66 | 0.61%(+9.01)#1,127 |
| 67. | Swede Heaven | 9.4% | 1.5%(+7.90)#67 | 0.61%(+8.80)#1,166 |
| 68. | Neah Bay | 9.3% | 1.5%(+7.79)#68 | 0.61%(+8.69)#1,178 |
| 69. | Eschbach | 9.2% | 1.5%(+7.72)#69 | 0.61%(+8.63)#1,189 |
| 70. | Soap Lake | 8.6% | 1.5%(+7.06)#70 | 0.61%(+7.97)#1,304 |
| 71. | Kahlotus | 8.5% | 1.5%(+6.96)#71 | 0.61%(+7.87)#1,327 |
| 72. | Pomeroy | 8.4% | 1.5%(+6.90)#72 | 0.61%(+7.80)#1,340 |
| 73. | Skykomish | 8.3% | 1.5%(+6.82)#73 | 0.61%(+7.73)#1,355 |
| 74. | Rock Island | 8.3% | 1.5%(+6.80)#74 | 0.61%(+7.71)#1,367 |
| 75. | Zillah | 8.3% | 1.5%(+6.79)#75 | 0.61%(+7.70)#1,370 |
| 76. | Prosser | 8.0% | 1.5%(+6.49)#76 | 0.61%(+7.40)#1,428 |
| 77. | Pasco | 7.9% | 1.5%(+6.41)#77 | 0.61%(+7.32)#1,451 |
| 78. | Yakima | 7.9% | 1.5%(+6.38)#78 | 0.61%(+7.29)#1,456 |
| 79. | Buena | 7.9% | 1.5%(+6.35)#79 | 0.61%(+7.26)#1,459 |
| 80. | Connell | 7.8% | 1.5%(+6.30)#80 | 0.61%(+7.21)#1,470 |
| 81. | Burbank | 7.2% | 1.5%(+5.73)#81 | 0.61%(+6.64)#1,607 |
| 82. | Uniontown | 7.1% | 1.5%(+5.63)#82 | 0.61%(+6.54)#1,623 |
| 83. | Taholah | 6.9% | 1.5%(+5.41)#83 | 0.61%(+6.31)#1,684 |
| 84. | Nooksack | 6.7% | 1.5%(+5.15)#84 | 0.61%(+6.05)#1,752 |
| 85. | Touchet | 6.6% | 1.5%(+5.07)#85 | 0.61%(+5.97)#1,765 |
| 86. | Waterville | 6.5% | 1.5%(+5.03)#86 | 0.61%(+5.93)#1,771 |
| 87. | Forks | 6.4% | 1.5%(+4.89)#87 | 0.61%(+5.79)#1,811 |
| 88. | Nespelem Community | 6.4% | 1.5%(+4.85)#88 | 0.61%(+5.76)#1,816 |
| 89. | Moses Lake North | 6.3% | 1.5%(+4.84)#89 | 0.61%(+5.74)#1,821 |
| 90. | Port Gamble Tribal Community | 6.3% | 1.5%(+4.83)#90 | 0.61%(+5.73)#1,823 |
| 91. | Wenatchee | 6.1% | 1.5%(+4.62)#91 | 0.61%(+5.52)#1,882 |
| 92. | Kendall | 6.1% | 1.5%(+4.56)#92 | 0.61%(+5.47)#1,897 |
| 93. | Bingen | 6.1% | 1.5%(+4.55)#93 | 0.61%(+5.46)#1,903 |
| 94. | Freeland | 6.0% | 1.5%(+4.46)#94 | 0.61%(+5.37)#1,930 |
| 95. | Grand Coulee | 5.8% | 1.5%(+4.26)#95 | 0.61%(+5.16)#1,998 |
| 96. | Outlook | 5.7% | 1.5%(+4.19)#96 | 0.61%(+5.10)#2,020 |
| 97. | Endicott | 5.6% | 1.5%(+4.13)#97 | 0.61%(+5.04)#2,036 |
| 98. | Moses Lake | 5.6% | 1.5%(+4.12)#98 | 0.61%(+5.03)#2,044 |
| 99. | Kittitas | 5.6% | 1.5%(+4.12)#99 | 0.61%(+5.03)#2,045 |
| 100. | Oakesdale | 5.6% | 1.5%(+4.11)#100 | 0.61%(+5.02)#2,046 |
Common Questions
What are the Top 10 Cities with the Highest Percentage of Population Employed in Farming, Fishing & Forestry in Washington?
Top 10 Cities with the Highest Percentage of Population Employed in Farming, Fishing & Forestry in Washington are:
#1
100.0%
#2
67.0%
#3
49.3%
#4
44.8%
#5
43.9%
#6
43.8%
#7
40.0%
#8
39.7%
#9
39.3%
#10
38.4%
What city has the Highest Percentage of Population Employed in Farming, Fishing & Forestry in Washington?
Disautel has the Highest Percentage of Population Employed in Farming, Fishing & Forestry in Washington with 100.0%.
What is the Percentage of Population Employed in Farming, Fishing & Forestry in the State of Washington?
Percentage of Population Employed in Farming, Fishing & Forestry in Washington is 1.5%.
What is the Percentage of Population Employed in Farming, Fishing & Forestry in the United States?
Percentage of Population Employed in Farming, Fishing & Forestry in the United States is 0.61%.