Cities with the Highest Percentage of Population Employed in Farming, Fishing & Forestry in New York
RELATED REPORTS & OPTIONS
Farming, Fishing & Forestry
New York
Compare Cities
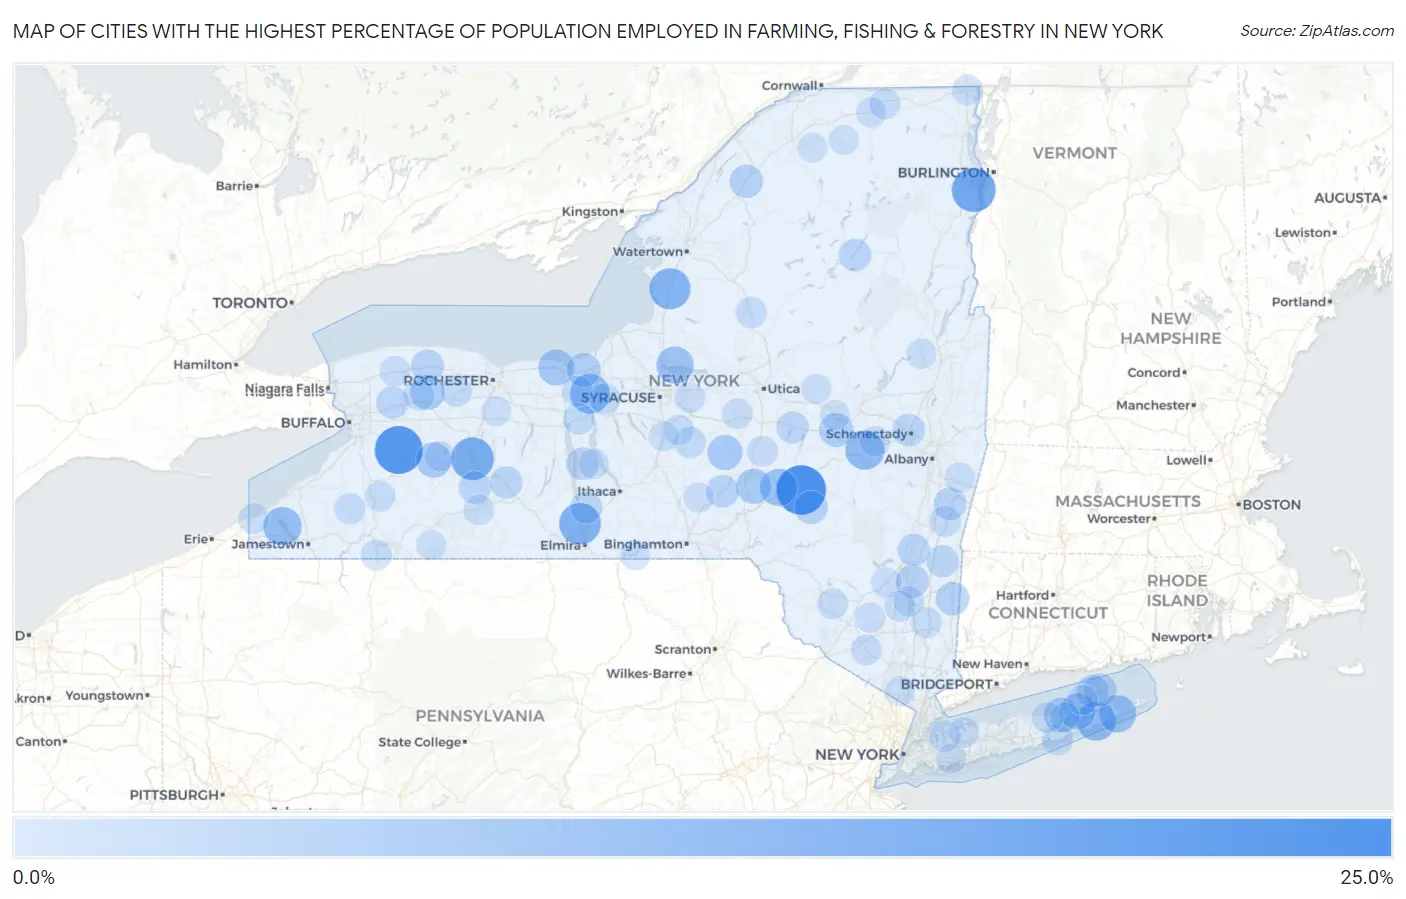
Map of Cities with the Highest Percentage of Population Employed in Farming, Fishing & Forestry in New York
0.0%
25.0%
Cities with the Highest Percentage of Population Employed in Farming, Fishing & Forestry in New York
| City | % Employed | vs State | vs National | |
| 1. | Davenport Center | 25.0% | 0.24%(+24.8)#1 | 0.61%(+24.4)#322 |
| 2. | Strykersville | 23.1% | 0.24%(+22.8)#2 | 0.61%(+22.4)#361 |
| 3. | Willsboro | 18.0% | 0.24%(+17.8)#3 | 0.61%(+17.4)#515 |
| 4. | Kysorville | 16.7% | 0.24%(+16.4)#4 | 0.61%(+16.1)#570 |
| 5. | Pine Valley | 15.4% | 0.24%(+15.1)#5 | 0.61%(+14.8)#617 |
| 6. | Pierrepont Manor | 14.6% | 0.24%(+14.4)#6 | 0.61%(+14.0)#663 |
| 7. | Savannah | 13.3% | 0.24%(+13.1)#7 | 0.61%(+12.7)#756 |
| 8. | Central Bridge | 12.5% | 0.24%(+12.3)#8 | 0.61%(+11.9)#818 |
| 9. | Bridgehampton | 12.3% | 0.24%(+12.0)#9 | 0.61%(+11.7)#844 |
| 10. | Chautauqua | 11.5% | 0.24%(+11.3)#10 | 0.61%(+10.9)#904 |
| 11. | Amagansett | 10.3% | 0.24%(+10.0)#11 | 0.61%(+9.67)#1,036 |
| 12. | West End | 10.1% | 0.24%(+9.88)#12 | 0.61%(+9.51)#1,057 |
| 13. | Constantia | 9.9% | 0.24%(+9.71)#13 | 0.61%(+9.34)#1,081 |
| 14. | New Suffolk | 8.7% | 0.24%(+8.42)#14 | 0.61%(+8.06)#1,289 |
| 15. | Sodus | 8.4% | 0.24%(+8.18)#15 | 0.61%(+7.81)#1,338 |
| 16. | Gainesville | 7.8% | 0.24%(+7.59)#16 | 0.61%(+7.22)#1,469 |
| 17. | Gilbertsville | 7.7% | 0.24%(+7.46)#17 | 0.61%(+7.09)#1,491 |
| 18. | Smyrna | 7.5% | 0.24%(+7.26)#18 | 0.61%(+6.89)#1,545 |
| 19. | Northville | 7.2% | 0.24%(+6.94)#19 | 0.61%(+6.57)#1,615 |
| 20. | Elba | 7.0% | 0.24%(+6.74)#20 | 0.61%(+6.37)#1,672 |
| 21. | Newfield | 6.8% | 0.24%(+6.57)#21 | 0.61%(+6.20)#1,710 |
| 22. | Ames | 6.5% | 0.24%(+6.22)#22 | 0.61%(+5.85)#1,796 |
| 23. | Wolcott | 6.4% | 0.24%(+6.20)#23 | 0.61%(+5.84)#1,799 |
| 24. | Dover Plains | 5.5% | 0.24%(+5.30)#24 | 0.61%(+4.93)#2,082 |
| 25. | Richville | 5.5% | 0.24%(+5.22)#25 | 0.61%(+4.85)#2,121 |
| 26. | Bloomville | 5.2% | 0.24%(+4.97)#26 | 0.61%(+4.60)#2,222 |
| 27. | Orient | 5.2% | 0.24%(+4.92)#27 | 0.61%(+4.55)#2,240 |
| 28. | Staatsburg | 5.1% | 0.24%(+4.89)#28 | 0.61%(+4.52)#2,253 |
| 29. | Albion | 5.1% | 0.24%(+4.88)#29 | 0.61%(+4.51)#2,258 |
| 30. | Lodi | 4.8% | 0.24%(+4.60)#30 | 0.61%(+4.23)#2,380 |
| 31. | Hurleyville | 4.8% | 0.24%(+4.59)#31 | 0.61%(+4.22)#2,386 |
| 32. | Chatham | 4.8% | 0.24%(+4.54)#32 | 0.61%(+4.17)#2,404 |
| 33. | Oxford | 4.8% | 0.24%(+4.53)#33 | 0.61%(+4.16)#2,408 |
| 34. | East Marion | 4.7% | 0.24%(+4.46)#34 | 0.61%(+4.09)#2,446 |
| 35. | Scotia | 4.6% | 0.24%(+4.39)#35 | 0.61%(+4.03)#2,472 |
| 36. | Canaseraga | 4.6% | 0.24%(+4.34)#36 | 0.61%(+3.97)#2,499 |
| 37. | Tivoli | 4.5% | 0.24%(+4.30)#37 | 0.61%(+3.93)#2,524 |
| 38. | Akron | 4.5% | 0.24%(+4.28)#38 | 0.61%(+3.91)#2,537 |
| 39. | Long Lake | 4.5% | 0.24%(+4.26)#39 | 0.61%(+3.89)#2,544 |
| 40. | Cohocton | 4.5% | 0.24%(+4.22)#40 | 0.61%(+3.85)#2,562 |
| 41. | East Worcester | 4.3% | 0.24%(+4.11)#41 | 0.61%(+3.74)#2,621 |
| 42. | Odessa | 4.2% | 0.24%(+3.93)#42 | 0.61%(+3.56)#2,719 |
| 43. | Richfield Springs | 4.2% | 0.24%(+3.92)#43 | 0.61%(+3.55)#2,732 |
| 44. | Pine Plains | 4.1% | 0.24%(+3.88)#44 | 0.61%(+3.51)#2,754 |
| 45. | Brooktondale | 3.8% | 0.24%(+3.54)#45 | 0.61%(+3.17)#2,977 |
| 46. | Jacksonville | 3.7% | 0.24%(+3.42)#46 | 0.61%(+3.05)#3,073 |
| 47. | York | 3.4% | 0.24%(+3.19)#47 | 0.61%(+2.82)#3,268 |
| 48. | Deruyter | 3.4% | 0.24%(+3.12)#48 | 0.61%(+2.75)#3,323 |
| 49. | Waterloo | 3.2% | 0.24%(+3.00)#49 | 0.61%(+2.63)#3,425 |
| 50. | Round Top | 3.1% | 0.24%(+2.88)#50 | 0.61%(+2.51)#3,540 |
| 51. | Port Leyden | 3.0% | 0.24%(+2.79)#51 | 0.61%(+2.42)#3,610 |
| 52. | Philmont | 3.0% | 0.24%(+2.78)#52 | 0.61%(+2.41)#3,629 |
| 53. | Port Byron | 3.0% | 0.24%(+2.73)#53 | 0.61%(+2.36)#3,672 |
| 54. | Glenwood Landing | 2.9% | 0.24%(+2.70)#54 | 0.61%(+2.33)#3,709 |
| 55. | Cattaraugus | 2.9% | 0.24%(+2.69)#55 | 0.61%(+2.32)#3,713 |
| 56. | Bergen | 2.8% | 0.24%(+2.59)#56 | 0.61%(+2.22)#3,814 |
| 57. | Oakfield | 2.8% | 0.24%(+2.54)#57 | 0.61%(+2.18)#3,860 |
| 58. | Westhampton Beach | 2.7% | 0.24%(+2.48)#58 | 0.61%(+2.11)#3,940 |
| 59. | South Fallsburg | 2.7% | 0.24%(+2.47)#59 | 0.61%(+2.10)#3,950 |
| 60. | Baiting Hollow | 2.7% | 0.24%(+2.45)#60 | 0.61%(+2.09)#3,974 |
| 61. | Limestone | 2.7% | 0.24%(+2.45)#61 | 0.61%(+2.08)#3,981 |
| 62. | Hopewell Junction | 2.7% | 0.24%(+2.43)#62 | 0.61%(+2.06)#4,006 |
| 63. | Ripley | 2.6% | 0.24%(+2.38)#63 | 0.61%(+2.01)#4,065 |
| 64. | Burke | 2.6% | 0.24%(+2.36)#64 | 0.61%(+1.99)#4,082 |
| 65. | Clyde | 2.5% | 0.24%(+2.31)#65 | 0.61%(+1.94)#4,144 |
| 66. | Clintondale | 2.5% | 0.24%(+2.30)#66 | 0.61%(+1.93)#4,160 |
| 67. | Oriskany Falls | 2.5% | 0.24%(+2.29)#67 | 0.61%(+1.92)#4,181 |
| 68. | Champlain | 2.5% | 0.24%(+2.25)#68 | 0.61%(+1.88)#4,237 |
| 69. | West Valley | 2.5% | 0.24%(+2.24)#69 | 0.61%(+1.87)#4,245 |
| 70. | Highland | 2.4% | 0.24%(+2.21)#70 | 0.61%(+1.84)#4,265 |
| 71. | Middleport | 2.4% | 0.24%(+2.18)#71 | 0.61%(+1.81)#4,302 |
| 72. | Edmeston | 2.4% | 0.24%(+2.16)#72 | 0.61%(+1.79)#4,321 |
| 73. | Goshen | 2.4% | 0.24%(+2.16)#73 | 0.61%(+1.79)#4,326 |
| 74. | Stone Ridge | 2.2% | 0.24%(+2.01)#74 | 0.61%(+1.64)#4,505 |
| 75. | Esperance | 2.2% | 0.24%(+1.97)#75 | 0.61%(+1.60)#4,568 |
| 76. | Almond | 2.2% | 0.24%(+1.95)#76 | 0.61%(+1.58)#4,588 |
| 77. | Chittenango | 2.2% | 0.24%(+1.92)#77 | 0.61%(+1.55)#4,637 |
| 78. | Fabius | 2.1% | 0.24%(+1.90)#78 | 0.61%(+1.53)#4,657 |
| 79. | Walworth | 2.1% | 0.24%(+1.89)#79 | 0.61%(+1.52)#4,673 |
| 80. | Malone | 2.1% | 0.24%(+1.89)#80 | 0.61%(+1.52)#4,683 |
| 81. | Pine Bush | 2.1% | 0.24%(+1.86)#81 | 0.61%(+1.49)#4,722 |
| 82. | East Nassau | 2.1% | 0.24%(+1.82)#82 | 0.61%(+1.45)#4,775 |
| 83. | Laurel Hollow | 2.0% | 0.24%(+1.80)#83 | 0.61%(+1.44)#4,799 |
| 84. | Lake Luzerne | 2.0% | 0.24%(+1.80)#84 | 0.61%(+1.44)#4,800 |
| 85. | Tully | 2.0% | 0.24%(+1.78)#85 | 0.61%(+1.41)#4,855 |
| 86. | Silver Springs | 2.0% | 0.24%(+1.76)#86 | 0.61%(+1.39)#4,872 |
| 87. | Interlaken | 2.0% | 0.24%(+1.75)#87 | 0.61%(+1.38)#4,898 |
| 88. | Nichols | 2.0% | 0.24%(+1.74)#88 | 0.61%(+1.37)#4,905 |
| 89. | Dolgeville | 1.9% | 0.24%(+1.66)#89 | 0.61%(+1.29)#5,037 |
| 90. | Nelliston | 1.9% | 0.24%(+1.66)#90 | 0.61%(+1.29)#5,038 |
| 91. | Hillcrest | 1.9% | 0.24%(+1.65)#91 | 0.61%(+1.28)#5,062 |
| 92. | Jamesport | 1.9% | 0.24%(+1.64)#92 | 0.61%(+1.27)#5,073 |
| 93. | St Regis Falls | 1.9% | 0.24%(+1.62)#93 | 0.61%(+1.25)#5,117 |
| 94. | Springfield Center | 1.8% | 0.24%(+1.59)#94 | 0.61%(+1.22)#5,144 |
| 95. | Roosevelt | 1.8% | 0.24%(+1.58)#95 | 0.61%(+1.21)#5,154 |
| 96. | Honeoye Falls | 1.8% | 0.24%(+1.55)#96 | 0.61%(+1.18)#5,207 |
| 97. | Richburg | 1.8% | 0.24%(+1.53)#97 | 0.61%(+1.16)#5,256 |
| 98. | Southold | 1.8% | 0.24%(+1.52)#98 | 0.61%(+1.15)#5,277 |
| 99. | Smithville Flats | 1.7% | 0.24%(+1.51)#99 | 0.61%(+1.14)#5,288 |
| 100. | Parishville | 1.7% | 0.24%(+1.51)#100 | 0.61%(+1.14)#5,292 |
Common Questions
What are the Top 10 Cities with the Highest Percentage of Population Employed in Farming, Fishing & Forestry in New York?
Top 10 Cities with the Highest Percentage of Population Employed in Farming, Fishing & Forestry in New York are:
#1
25.0%
#2
23.1%
#3
18.0%
#4
16.7%
#5
15.4%
#6
14.6%
#7
13.3%
#8
12.5%
#9
12.3%
#10
11.5%
What city has the Highest Percentage of Population Employed in Farming, Fishing & Forestry in New York?
Davenport Center has the Highest Percentage of Population Employed in Farming, Fishing & Forestry in New York with 25.0%.
What is the Percentage of Population Employed in Farming, Fishing & Forestry in the State of New York?
Percentage of Population Employed in Farming, Fishing & Forestry in New York is 0.24%.
What is the Percentage of Population Employed in Farming, Fishing & Forestry in the United States?
Percentage of Population Employed in Farming, Fishing & Forestry in the United States is 0.61%.