Cantua Creek, CA Map & Demographics
Cantua Creek Map
Cantua Creek Overview
$11,780
PER CAPITA INCOME
$41,306
AVG FAMILY INCOME
$41,306
AVG HOUSEHOLD INCOME
$6,773
FAMILY INCOME DEFICIT
0.35
INEQUALITY / GINI INDEX
522
TOTAL POPULATION
235
MALE POPULATION
287
FEMALE POPULATION
81.88
MALES / 100 FEMALES
122.13
FEMALES / 100 MALES
21.9
MEDIAN AGE
4.3
AVG FAMILY SIZE
4.3
AVG HOUSEHOLD SIZE
154
LABOR FORCE [ PEOPLE ]
48.4%
PERCENT IN LABOR FORCE
Cantua Creek Zip Codes
Income in Cantua Creek
Income Overview in Cantua Creek
Per Capita Income in Cantua Creek is $11,780, while median incomes of families and households are $41,306 and $41,306 respectively.
| Characteristic | Number | Measure |
| Per Capita Income | 522 | $11,780 |
| Median Family Income | 115 | $41,306 |
| Mean Family Income | 115 | $48,076 |
| Median Household Income | 115 | $41,306 |
| Mean Household Income | 115 | $48,076 |
| Income Deficit | 115 | $6,773 |
| Wage / Income Gap (%) | 522 | 0.00% |
| Wage / Income Gap ($) | 522 | 100.00¢ per $1 |
| Gini / Inequality Index | 522 | 0.35 |
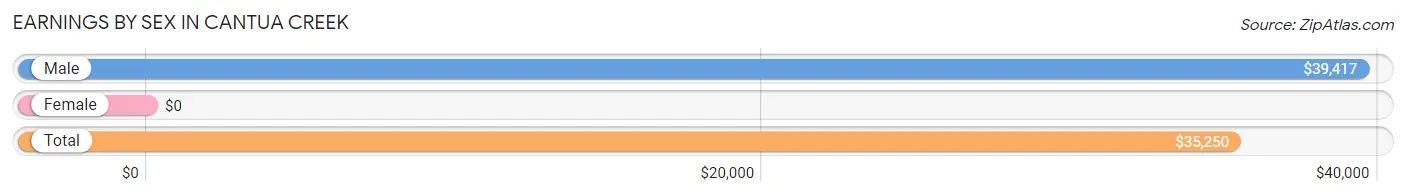
Earnings by Sex in Cantua Creek
| Sex | Number | Average Earnings |
| Male | 104 (58.8%) | $39,417 |
| Female | 73 (41.2%) | $0 |
| Total | 177 (100.0%) | $35,250 |
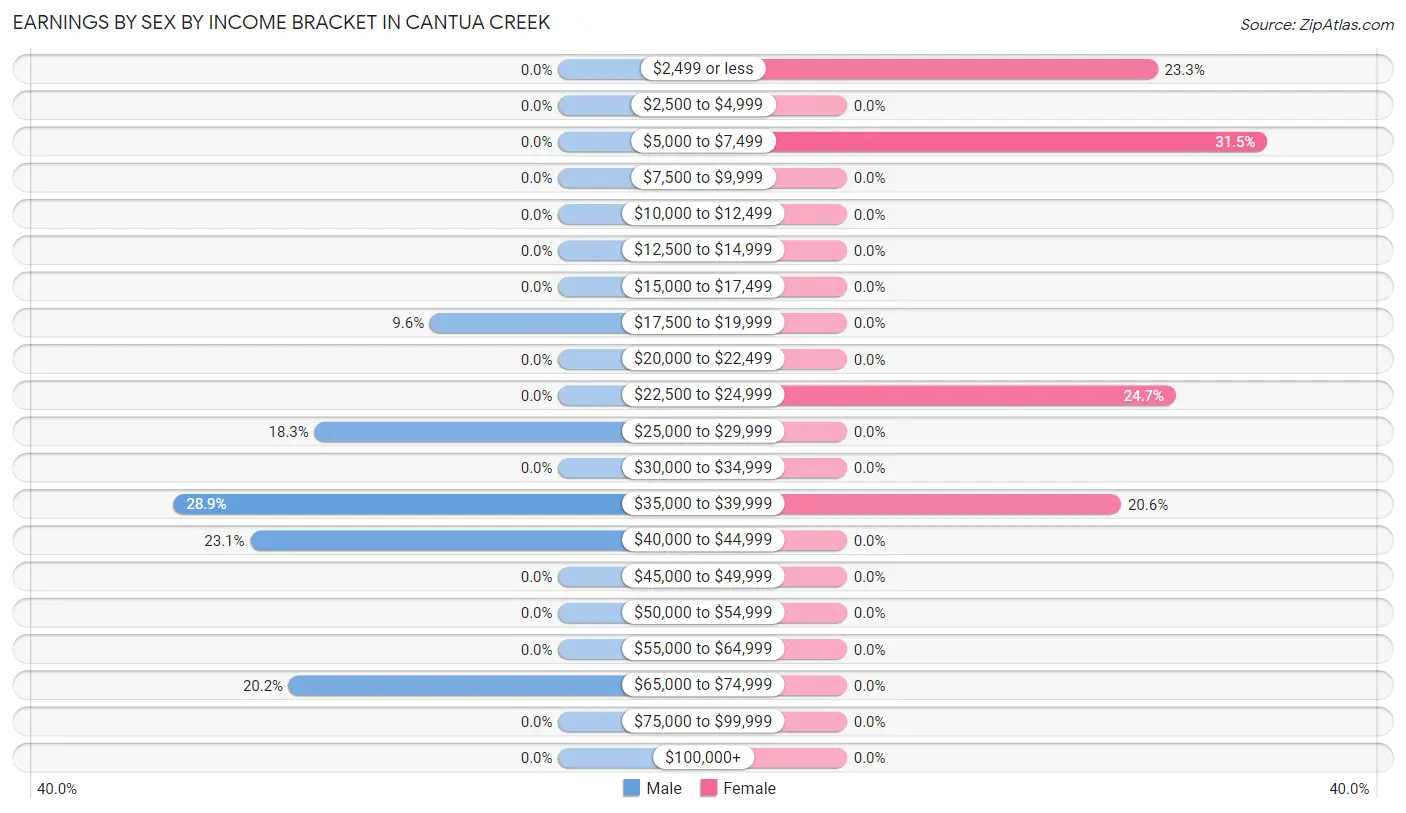
Earnings by Sex by Income Bracket in Cantua Creek
The most common earnings brackets in Cantua Creek are $35,000 to $39,999 for men (30 | 28.8%) and $5,000 to $7,499 for women (23 | 31.5%).
| Income | Male | Female |
| $2,499 or less | 0 (0.0%) | 17 (23.3%) |
| $2,500 to $4,999 | 0 (0.0%) | 0 (0.0%) |
| $5,000 to $7,499 | 0 (0.0%) | 23 (31.5%) |
| $7,500 to $9,999 | 0 (0.0%) | 0 (0.0%) |
| $10,000 to $12,499 | 0 (0.0%) | 0 (0.0%) |
| $12,500 to $14,999 | 0 (0.0%) | 0 (0.0%) |
| $15,000 to $17,499 | 0 (0.0%) | 0 (0.0%) |
| $17,500 to $19,999 | 10 (9.6%) | 0 (0.0%) |
| $20,000 to $22,499 | 0 (0.0%) | 0 (0.0%) |
| $22,500 to $24,999 | 0 (0.0%) | 18 (24.7%) |
| $25,000 to $29,999 | 19 (18.3%) | 0 (0.0%) |
| $30,000 to $34,999 | 0 (0.0%) | 0 (0.0%) |
| $35,000 to $39,999 | 30 (28.8%) | 15 (20.5%) |
| $40,000 to $44,999 | 24 (23.1%) | 0 (0.0%) |
| $45,000 to $49,999 | 0 (0.0%) | 0 (0.0%) |
| $50,000 to $54,999 | 0 (0.0%) | 0 (0.0%) |
| $55,000 to $64,999 | 0 (0.0%) | 0 (0.0%) |
| $65,000 to $74,999 | 21 (20.2%) | 0 (0.0%) |
| $75,000 to $99,999 | 0 (0.0%) | 0 (0.0%) |
| $100,000+ | 0 (0.0%) | 0 (0.0%) |
| Total | 104 (100.0%) | 73 (100.0%) |
Earnings by Sex by Educational Attainment in Cantua Creek
| Educational Attainment | Male Income | Female Income |
| Less than High School | - | - |
| High School Diploma | - | - |
| College or Associate's Degree | - | - |
| Bachelor's Degree | - | - |
| Graduate Degree | - | - |
| Total | $39,702 | $0 |
Family Income in Cantua Creek
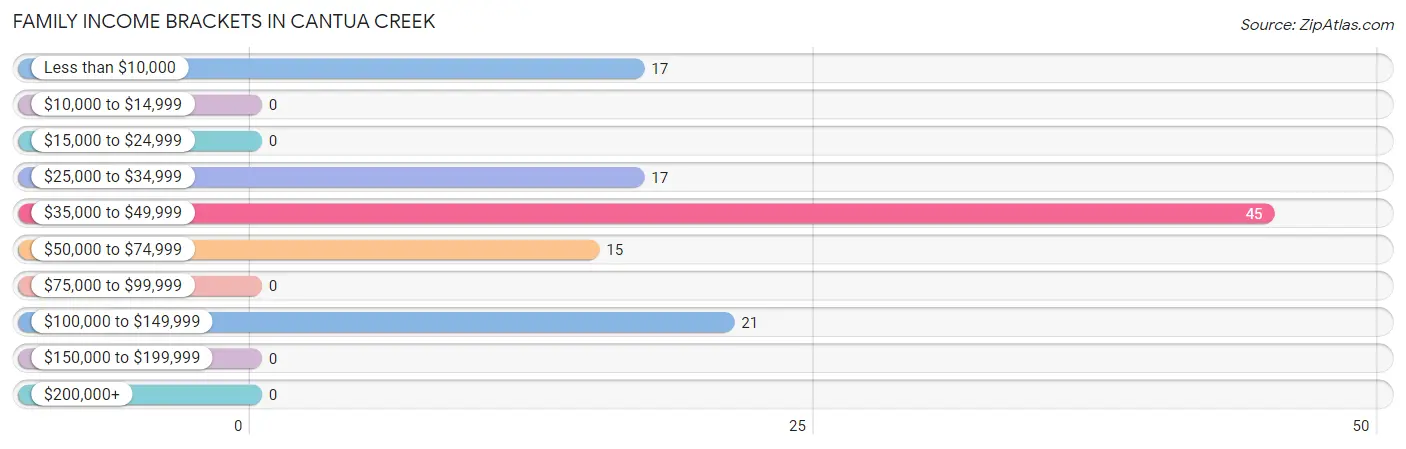
Family Income Brackets in Cantua Creek
According to the Cantua Creek family income data, there are 45 families falling into the $35,000 to $49,999 income range, which is the most common income bracket and makes up 39.1% of all families.
| Income Bracket | # Families | % Families |
| Less than $10,000 | 17 | 14.8% |
| $10,000 to $14,999 | 0 | 0.0% |
| $15,000 to $24,999 | 0 | 0.0% |
| $25,000 to $34,999 | 17 | 14.8% |
| $35,000 to $49,999 | 45 | 39.1% |
| $50,000 to $74,999 | 15 | 13.0% |
| $75,000 to $99,999 | 0 | 0.0% |
| $100,000 to $149,999 | 21 | 18.3% |
| $150,000 to $199,999 | 0 | 0.0% |
| $200,000+ | 0 | 0.0% |
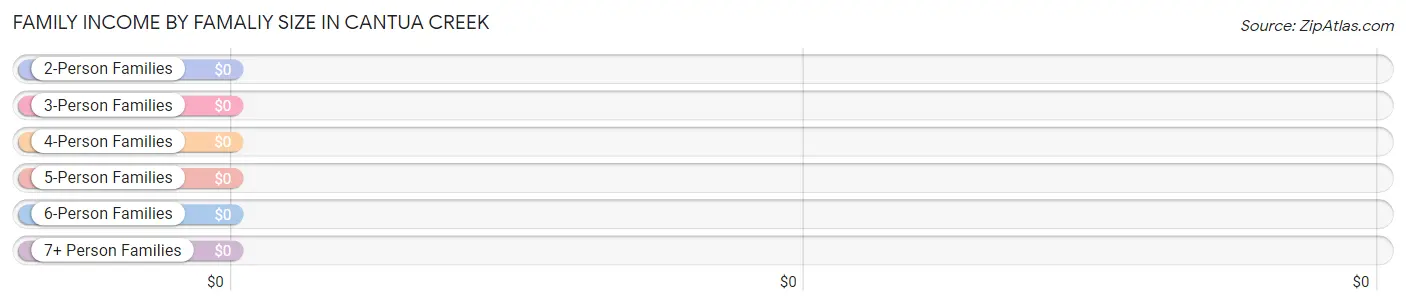
Family Income by Famaliy Size in Cantua Creek
| Income Bracket | # Families | Median Income |
| 2-Person Families | 32 (27.8%) | $0 |
| 3-Person Families | 0 (0.0%) | $0 |
| 4-Person Families | 24 (20.9%) | $0 |
| 5-Person Families | 21 (18.3%) | $0 |
| 6-Person Families | 38 (33.0%) | $0 |
| 7+ Person Families | 0 (0.0%) | $0 |
| Total | 115 (100.0%) | $41,306 |
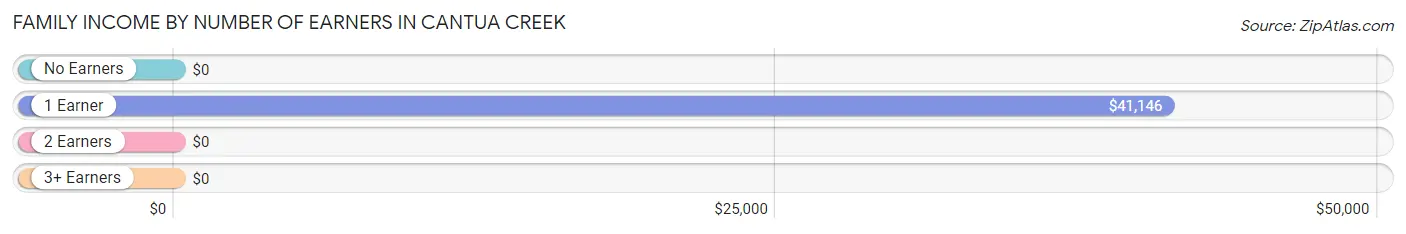
Family Income by Number of Earners in Cantua Creek
| Number of Earners | # Families | Median Income |
| No Earners | 17 (14.8%) | $0 |
| 1 Earner | 56 (48.7%) | $41,146 |
| 2 Earners | 21 (18.3%) | $0 |
| 3+ Earners | 21 (18.3%) | $0 |
| Total | 115 (100.0%) | $41,306 |
Household Income in Cantua Creek
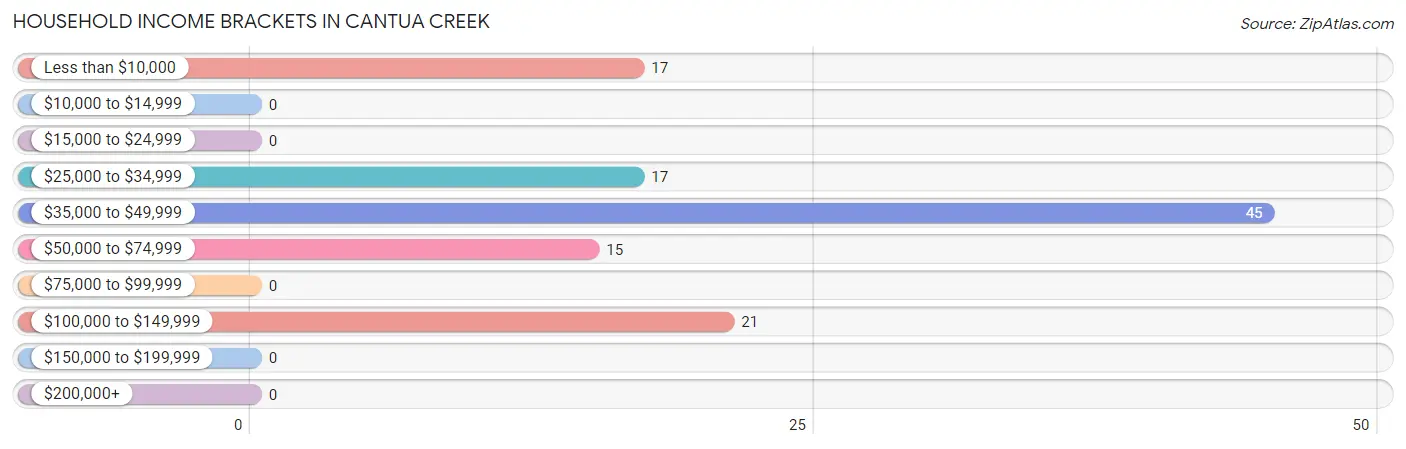
Household Income Brackets in Cantua Creek
With 45 households falling in the category, the $35,000 to $49,999 income range is the most frequent in Cantua Creek, accounting for 39.1% of all households.
| Income Bracket | # Households | % Households |
| Less than $10,000 | 17 | 14.8% |
| $10,000 to $14,999 | 0 | 0.0% |
| $15,000 to $24,999 | 0 | 0.0% |
| $25,000 to $34,999 | 17 | 14.8% |
| $35,000 to $49,999 | 45 | 39.1% |
| $50,000 to $74,999 | 15 | 13.0% |
| $75,000 to $99,999 | 0 | 0.0% |
| $100,000 to $149,999 | 21 | 18.3% |
| $150,000 to $199,999 | 0 | 0.0% |
| $200,000+ | 0 | 0.0% |
Household Income by Householder Age in Cantua Creek
| Income Bracket | # Households | Median Income |
| 15 to 24 Years | 0 (0.0%) | $0 |
| 25 to 44 Years | 62 (53.9%) | $0 |
| 45 to 64 Years | 53 (46.1%) | $0 |
| 65+ Years | 0 (0.0%) | $0 |
| Total | 115 (100.0%) | $41,306 |
Poverty in Cantua Creek
Income Below Poverty by Sex and Age in Cantua Creek
With 64.7% poverty level for males and 39.0% for females among the residents of Cantua Creek, under 5 year old males and under 5 year old females are the most vulnerable to poverty, with 19 males (100.0%) and 19 females (100.0%) in their respective age groups living below the poverty level.
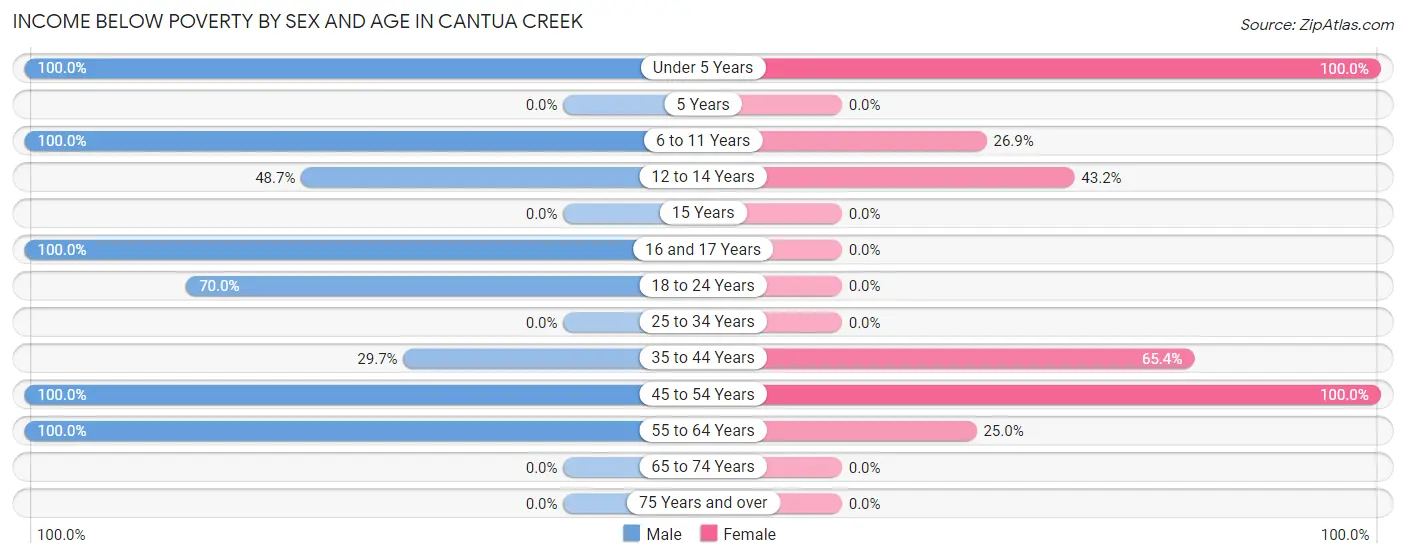
| Age Bracket | Male | Female |
| Under 5 Years | 19 (100.0%) | 19 (100.0%) |
| 5 Years | 0 (0.0%) | 0 (0.0%) |
| 6 to 11 Years | 18 (100.0%) | 18 (26.9%) |
| 12 to 14 Years | 18 (48.6%) | 19 (43.2%) |
| 15 Years | 0 (0.0%) | 0 (0.0%) |
| 16 and 17 Years | 19 (100.0%) | 0 (0.0%) |
| 18 to 24 Years | 21 (70.0%) | 0 (0.0%) |
| 25 to 34 Years | 0 (0.0%) | 0 (0.0%) |
| 35 to 44 Years | 19 (29.7%) | 34 (65.4%) |
| 45 to 54 Years | 21 (100.0%) | 17 (100.0%) |
| 55 to 64 Years | 17 (100.0%) | 5 (25.0%) |
| 65 to 74 Years | 0 (0.0%) | 0 (0.0%) |
| 75 Years and over | 0 (0.0%) | 0 (0.0%) |
| Total | 152 (64.7%) | 112 (39.0%) |
Income Above Poverty by Sex and Age in Cantua Creek
According to the poverty statistics in Cantua Creek, males aged 25 to 34 years and females aged 18 to 24 years are the age groups that are most secure financially, with 100.0% of males and 100.0% of females in these age groups living above the poverty line.
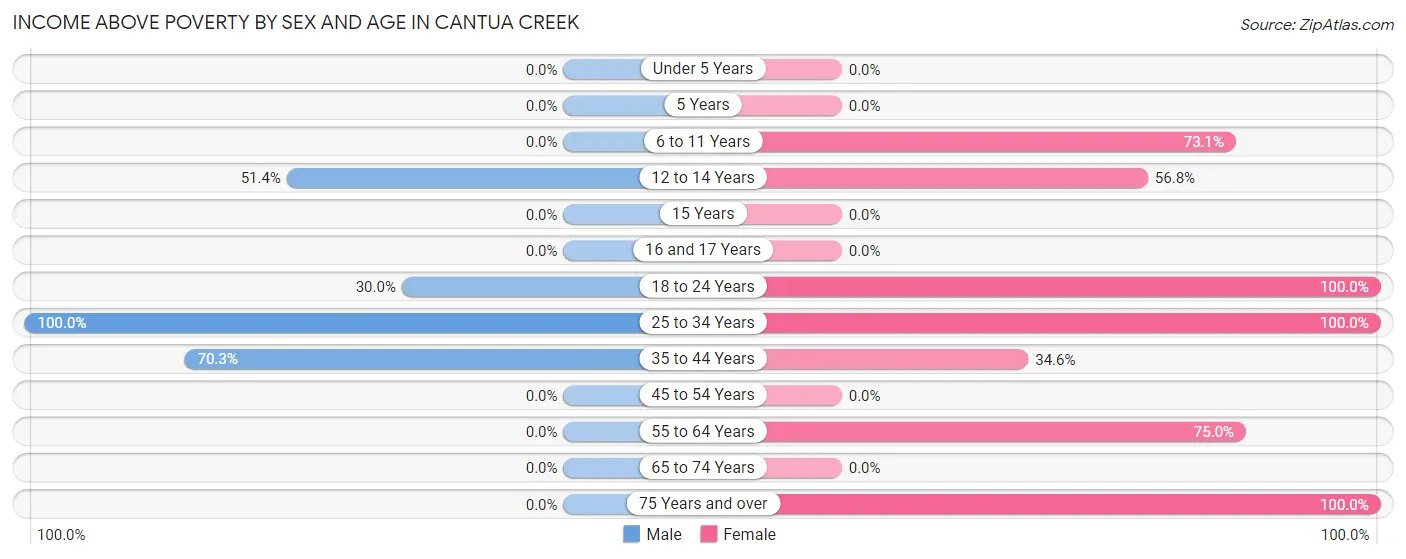
| Age Bracket | Male | Female |
| Under 5 Years | 0 (0.0%) | 0 (0.0%) |
| 5 Years | 0 (0.0%) | 0 (0.0%) |
| 6 to 11 Years | 0 (0.0%) | 49 (73.1%) |
| 12 to 14 Years | 19 (51.3%) | 25 (56.8%) |
| 15 Years | 0 (0.0%) | 0 (0.0%) |
| 16 and 17 Years | 0 (0.0%) | 0 (0.0%) |
| 18 to 24 Years | 9 (30.0%) | 23 (100.0%) |
| 25 to 34 Years | 10 (100.0%) | 26 (100.0%) |
| 35 to 44 Years | 45 (70.3%) | 18 (34.6%) |
| 45 to 54 Years | 0 (0.0%) | 0 (0.0%) |
| 55 to 64 Years | 0 (0.0%) | 15 (75.0%) |
| 65 to 74 Years | 0 (0.0%) | 0 (0.0%) |
| 75 Years and over | 0 (0.0%) | 19 (100.0%) |
| Total | 83 (35.3%) | 175 (61.0%) |
Income Below Poverty Among Married-Couple Families in Cantua Creek
The poverty statistics for married-couple families in Cantua Creek show that 55.0% or 55 of the total 100 families live below the poverty line. Families with no children have the highest poverty rate of 100.0%, comprising of 17 families. On the other hand, families with 1 or 2 children have the lowest poverty rate of 0.0%, which includes 0 families.
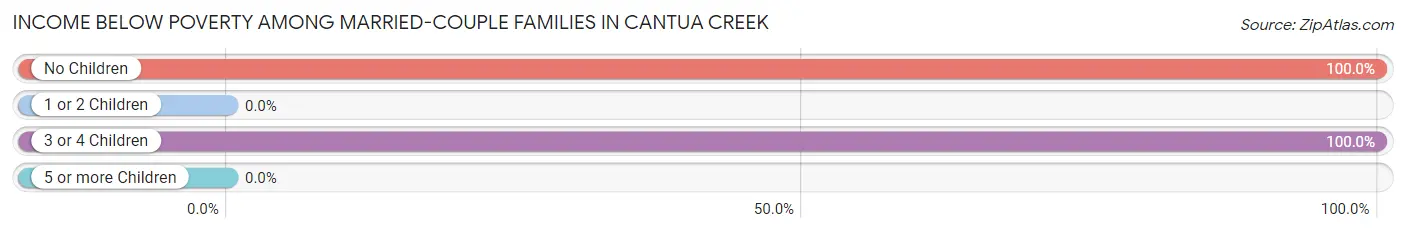
| Children | Above Poverty | Below Poverty |
| No Children | 0 (0.0%) | 17 (100.0%) |
| 1 or 2 Children | 45 (100.0%) | 0 (0.0%) |
| 3 or 4 Children | 0 (0.0%) | 38 (100.0%) |
| 5 or more Children | 0 (0.0%) | 0 (0.0%) |
| Total | 45 (45.0%) | 55 (55.0%) |
Income Below Poverty Among Single-Parent Households in Cantua Creek
| Children | Single Father | Single Mother |
| No Children | 0 (0.0%) | 0 (0.0%) |
| 1 or 2 Children | 0 (0.0%) | 0 (0.0%) |
| 3 or 4 Children | 0 (0.0%) | 0 (0.0%) |
| 5 or more Children | 0 (0.0%) | 0 (0.0%) |
| Total | 0 (0.0%) | 0 (0.0%) |
Income Below Poverty Among Married-Couple vs Single-Parent Households in Cantua Creek
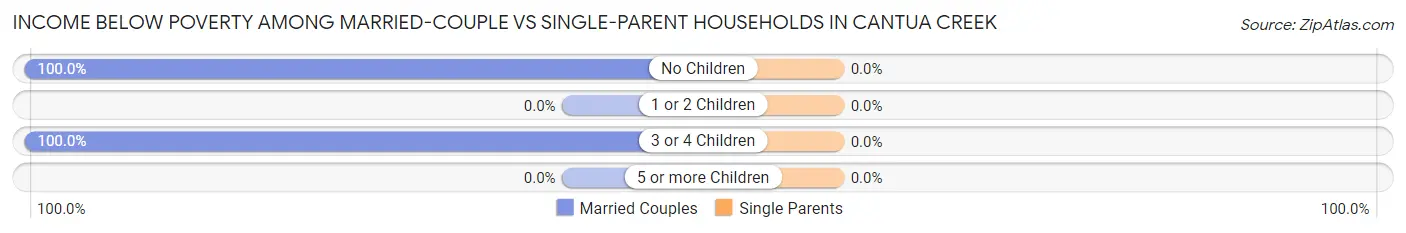
| Children | Married-Couple Families | Single-Parent Households |
| No Children | 17 (100.0%) | 0 (0.0%) |
| 1 or 2 Children | 0 (0.0%) | 0 (0.0%) |
| 3 or 4 Children | 38 (100.0%) | 0 (0.0%) |
| 5 or more Children | 0 (0.0%) | 0 (0.0%) |
| Total | 55 (55.0%) | 0 (0.0%) |
Race in Cantua Creek
The most populous races in Cantua Creek are Hispanic or Latino (522 | 100.0%), White / Caucasian (220 | 42.1%), and Some other Race (202 | 38.7%).
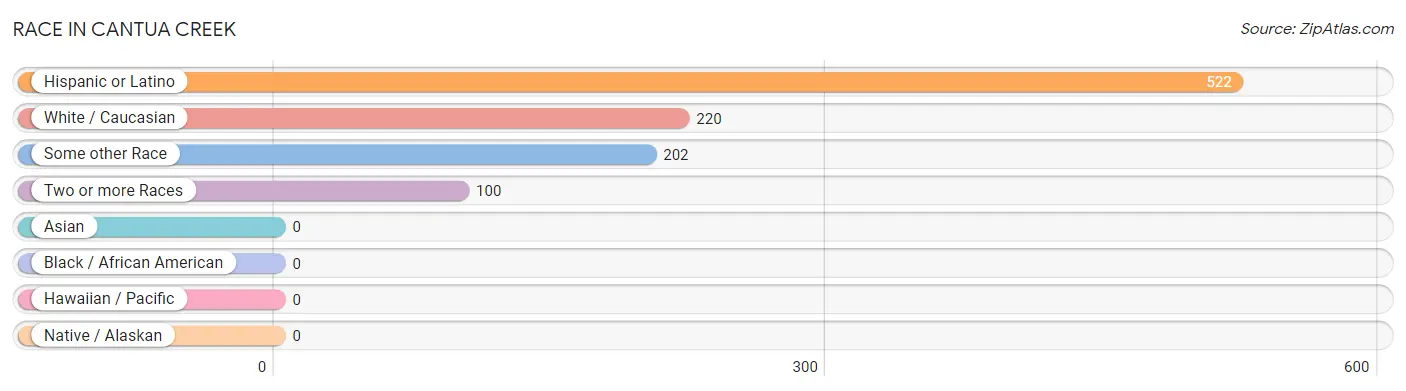
| Race | # Population | % Population |
| Asian | 0 | 0.0% |
| Black / African American | 0 | 0.0% |
| Hawaiian / Pacific | 0 | 0.0% |
| Hispanic or Latino | 522 | 100.0% |
| Native / Alaskan | 0 | 0.0% |
| White / Caucasian | 220 | 42.1% |
| Two or more Races | 100 | 19.2% |
| Some other Race | 202 | 38.7% |
| Total | 522 | 100.0% |
Ancestry in Cantua Creek
The most populous ancestries reported in Cantua Creek are , and Mexican (522 | 100.0%), together accounting for 100.0% of all Cantua Creek residents.

| Ancestry | # Population | % Population |
| Mexican | 522 | 100.0% | View All 1 Rows |
Immigrants in Cantua Creek
The most numerous immigrant groups reported in Cantua Creek came from Central America (186 | 35.6%), Latin America (186 | 35.6%), and Mexico (186 | 35.6%), together accounting for 106.9% of all Cantua Creek residents.
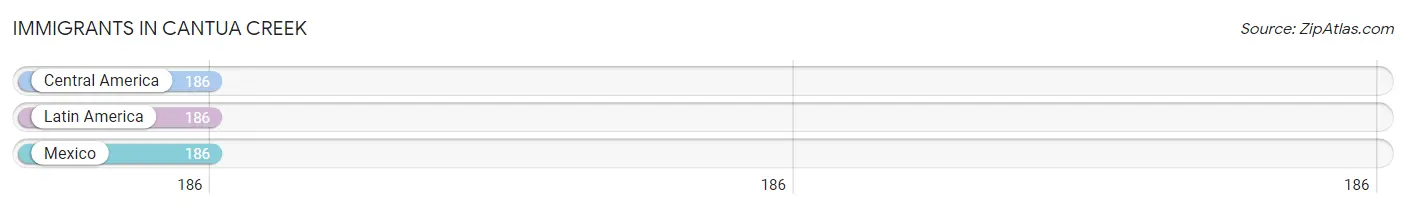
| Immigration Origin | # Population | % Population |
| Central America | 186 | 35.6% |
| Latin America | 186 | 35.6% |
| Mexico | 186 | 35.6% | View All 3 Rows |
Sex and Age in Cantua Creek
Sex and Age in Cantua Creek
The most populous age groups in Cantua Creek are 35 to 39 Years (40 | 17.0%) for men and 5 to 9 Years (67 | 23.3%) for women.
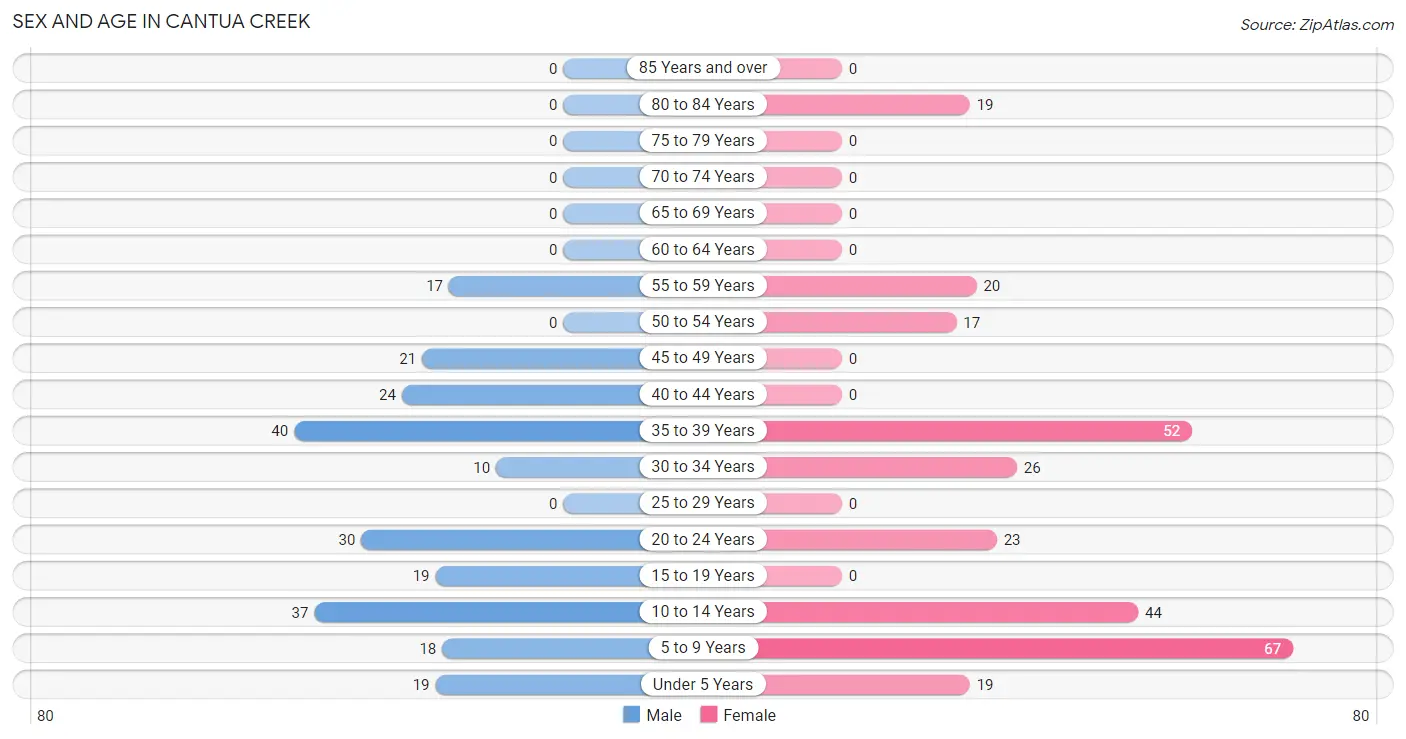
| Age Bracket | Male | Female |
| Under 5 Years | 19 (8.1%) | 19 (6.6%) |
| 5 to 9 Years | 18 (7.7%) | 67 (23.3%) |
| 10 to 14 Years | 37 (15.7%) | 44 (15.3%) |
| 15 to 19 Years | 19 (8.1%) | 0 (0.0%) |
| 20 to 24 Years | 30 (12.8%) | 23 (8.0%) |
| 25 to 29 Years | 0 (0.0%) | 0 (0.0%) |
| 30 to 34 Years | 10 (4.3%) | 26 (9.1%) |
| 35 to 39 Years | 40 (17.0%) | 52 (18.1%) |
| 40 to 44 Years | 24 (10.2%) | 0 (0.0%) |
| 45 to 49 Years | 21 (8.9%) | 0 (0.0%) |
| 50 to 54 Years | 0 (0.0%) | 17 (5.9%) |
| 55 to 59 Years | 17 (7.2%) | 20 (7.0%) |
| 60 to 64 Years | 0 (0.0%) | 0 (0.0%) |
| 65 to 69 Years | 0 (0.0%) | 0 (0.0%) |
| 70 to 74 Years | 0 (0.0%) | 0 (0.0%) |
| 75 to 79 Years | 0 (0.0%) | 0 (0.0%) |
| 80 to 84 Years | 0 (0.0%) | 19 (6.6%) |
| 85 Years and over | 0 (0.0%) | 0 (0.0%) |
| Total | 235 (100.0%) | 287 (100.0%) |
Families and Households in Cantua Creek
Median Family Size in Cantua Creek
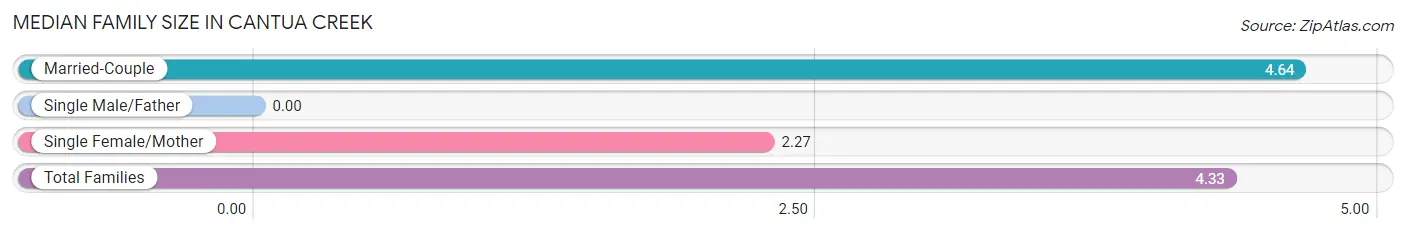
| Family Type | # Families | Family Size |
| Married-Couple | 100 (87.0%) | 4.64 |
| Single Male/Father | 0 (0.0%) | - |
| Single Female/Mother | 15 (13.0%) | 2.27 |
| Total Families | 115 (100.0%) | 4.33 |
Median Household Size in Cantua Creek
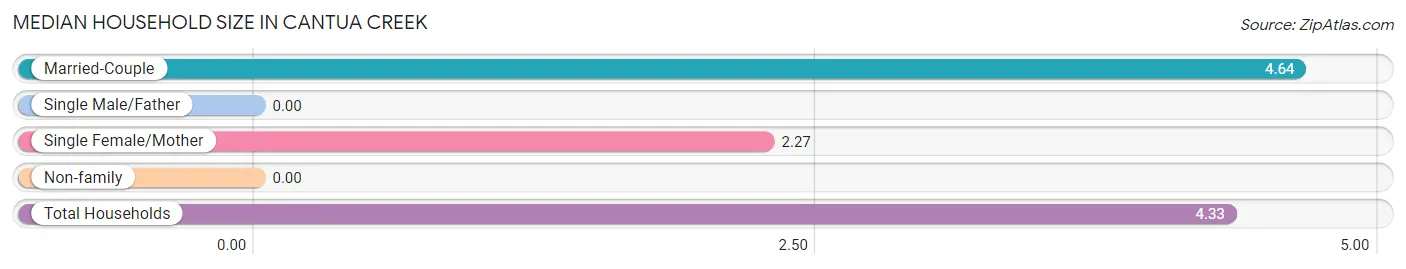
| Household Type | # Households | Household Size |
| Married-Couple | 100 (87.0%) | 4.64 |
| Single Male/Father | 0 (0.0%) | - |
| Single Female/Mother | 15 (13.0%) | 2.27 |
| Non-family | 0 (0.0%) | - |
| Total Households | 115 (100.0%) | 4.33 |
Household Size by Marriage Status in Cantua Creek
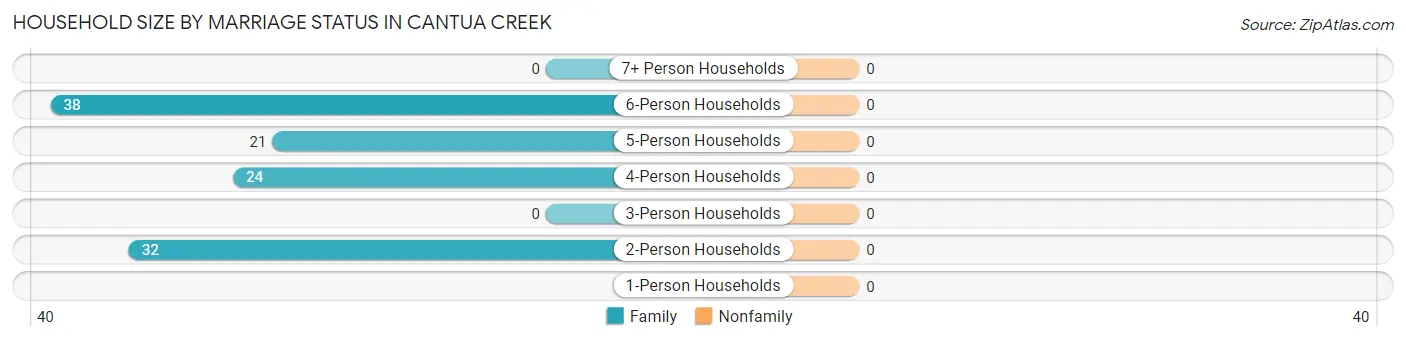
| Household Size | Family Households | Nonfamily Households |
| 1-Person Households | - | 0 (0.0%) |
| 2-Person Households | 32 (27.8%) | 0 (0.0%) |
| 3-Person Households | 0 (0.0%) | 0 (0.0%) |
| 4-Person Households | 24 (20.9%) | 0 (0.0%) |
| 5-Person Households | 21 (18.3%) | 0 (0.0%) |
| 6-Person Households | 38 (33.0%) | 0 (0.0%) |
| 7+ Person Households | 0 (0.0%) | 0 (0.0%) |
| Total | 115 (100.0%) | 0 (0.0%) |
Female Fertility in Cantua Creek
Fertility by Age in Cantua Creek
| Age Bracket | Women with Births | Births / 1,000 Women |
| 15 to 19 years | 0 (0.0%) | 0.0 |
| 20 to 34 years | 0 (0.0%) | 0.0 |
| 35 to 50 years | 0 (0.0%) | 0.0 |
| Total | 0 (0.0%) | 0.0 |
Fertility by Age by Marriage Status in Cantua Creek
| Age Bracket | Married | Unmarried |
| 15 to 19 years | 0 (0.0%) | 0 (0.0%) |
| 20 to 34 years | 0 (0.0%) | 0 (0.0%) |
| 35 to 50 years | 0 (0.0%) | 0 (0.0%) |
| Total | 0 (0.0%) | 0 (0.0%) |
Fertility by Education in Cantua Creek
| Educational Attainment | Women with Births | Births / 1,000 Women |
| Less than High School | 0 (0.0%) | 0.0 |
| High School Diploma | 0 (0.0%) | 0.0 |
| College or Associate's Degree | 0 (0.0%) | 0.0 |
| Bachelor's Degree | 0 (0.0%) | 0.0 |
| Graduate Degree | 0 (0.0%) | 0.0 |
| Total | 0 (0.0%) | 0.0 |
Fertility by Education by Marriage Status in Cantua Creek
| Educational Attainment | Married | Unmarried |
| Less than High School | 0 (0.0%) | 0 (0.0%) |
| High School Diploma | 0 (0.0%) | 0 (0.0%) |
| College or Associate's Degree | 0 (0.0%) | 0 (0.0%) |
| Bachelor's Degree | 0 (0.0%) | 0 (0.0%) |
| Graduate Degree | 0 (0.0%) | 0 (0.0%) |
| Total | 0 (0.0%) | 0 (0.0%) |
Employment Characteristics in Cantua Creek
Employment by Class of Employer in Cantua Creek
Among the 115 employed individuals in Cantua Creek, private company employees (106 | 92.2%), and state government employees (9 | 7.8%) make up the most common classes of employment.
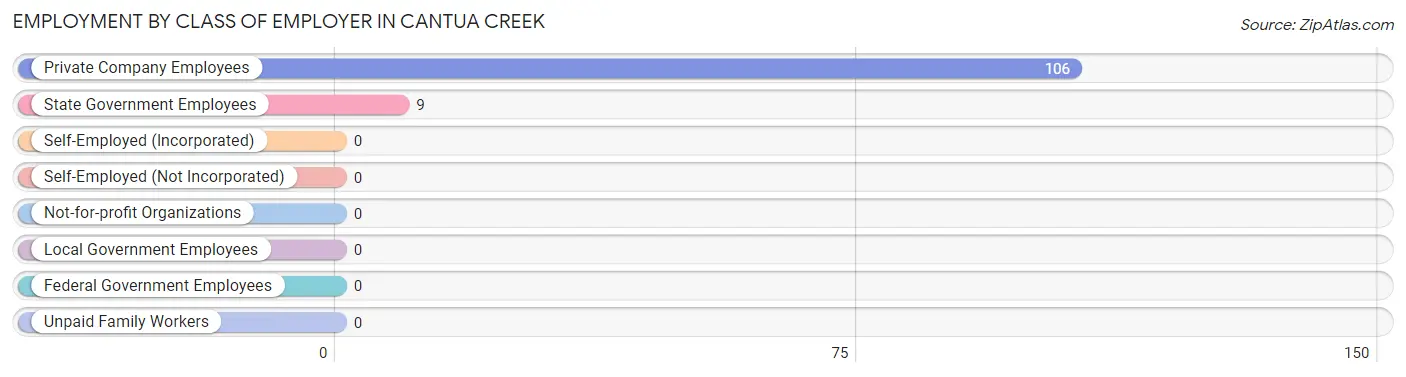
| Employer Class | # Employees | % Employees |
| Private Company Employees | 106 | 92.2% |
| Self-Employed (Incorporated) | 0 | 0.0% |
| Self-Employed (Not Incorporated) | 0 | 0.0% |
| Not-for-profit Organizations | 0 | 0.0% |
| Local Government Employees | 0 | 0.0% |
| State Government Employees | 9 | 7.8% |
| Federal Government Employees | 0 | 0.0% |
| Unpaid Family Workers | 0 | 0.0% |
| Total | 115 | 100.0% |
Employment Status by Age in Cantua Creek
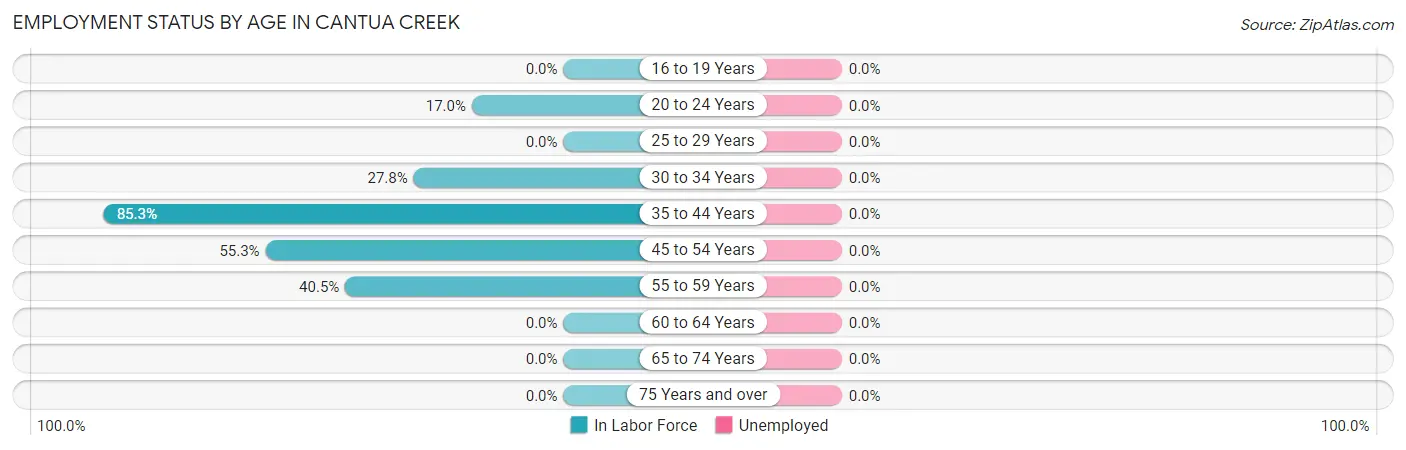
| Age Bracket | In Labor Force | Unemployed |
| 16 to 19 Years | 0 (0.0%) | 0 (0.0%) |
| 20 to 24 Years | 9 (17.0%) | 0 (0.0%) |
| 25 to 29 Years | 0 (0.0%) | 0 (0.0%) |
| 30 to 34 Years | 10 (27.8%) | 0 (0.0%) |
| 35 to 44 Years | 99 (85.3%) | 0 (0.0%) |
| 45 to 54 Years | 21 (55.3%) | 0 (0.0%) |
| 55 to 59 Years | 15 (40.5%) | 0 (0.0%) |
| 60 to 64 Years | 0 (0.0%) | 0 (0.0%) |
| 65 to 74 Years | 0 (0.0%) | 0 (0.0%) |
| 75 Years and over | 0 (0.0%) | 0 (0.0%) |
| Total | 154 (48.4%) | 0 (0.0%) |
Employment Status by Educational Attainment in Cantua Creek
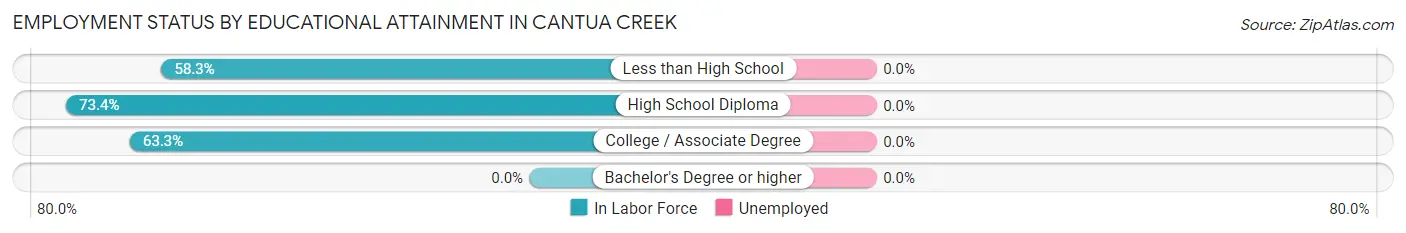
| Educational Attainment | In Labor Force | Unemployed |
| Less than High School | 60 (58.3%) | 0 (0.0%) |
| High School Diploma | 47 (73.4%) | 0 (0.0%) |
| College / Associate Degree | 38 (63.3%) | 0 (0.0%) |
| Bachelor's Degree or higher | 0 (0.0%) | 0 (0.0%) |
| Total | 145 (63.9%) | 0 (0.0%) |
Employment Occupations by Sex in Cantua Creek
Management, Business, Science and Arts Occupations
The most common Management, Business, Science and Arts occupations in Cantua Creek are , and Management (21 | 13.6%).
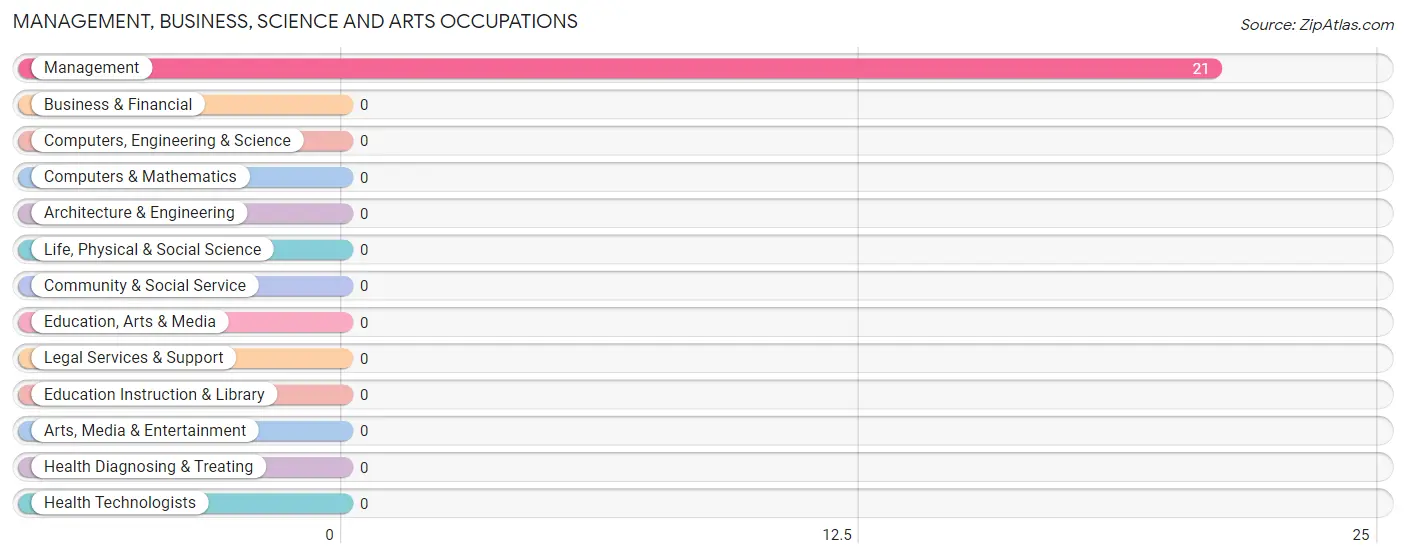
Management, Business, Science and Arts Occupations by Sex
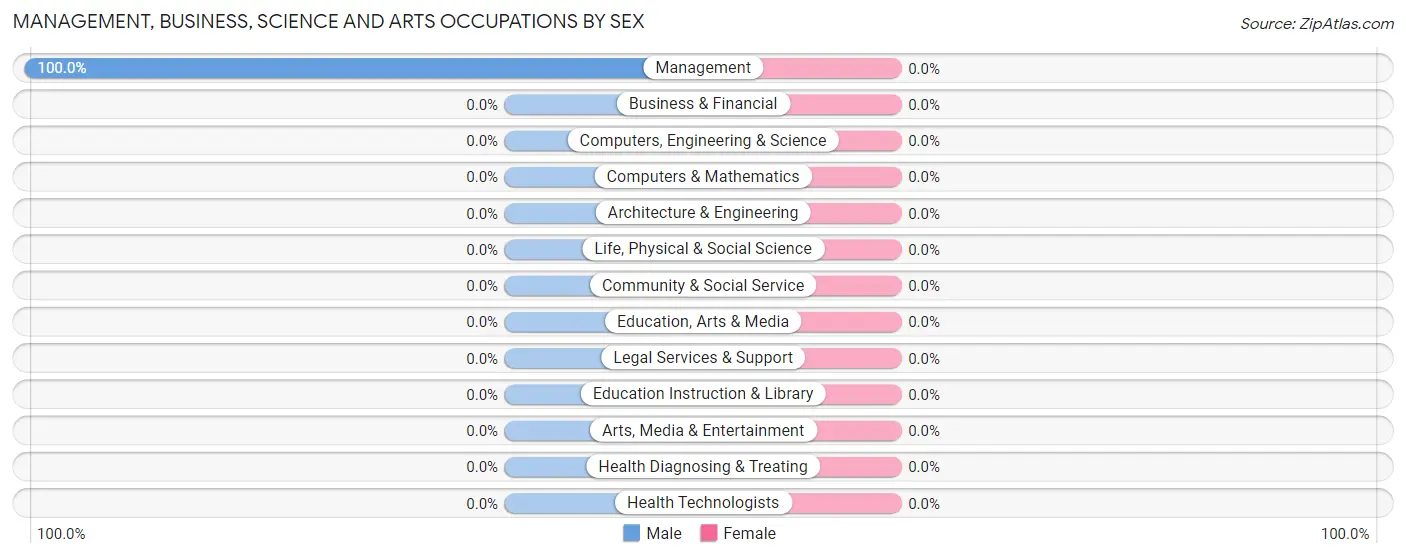
| Occupation | Male | Female |
| Management | 21 (100.0%) | 0 (0.0%) |
| Business & Financial | 0 (0.0%) | 0 (0.0%) |
| Computers, Engineering & Science | 0 (0.0%) | 0 (0.0%) |
| Computers & Mathematics | 0 (0.0%) | 0 (0.0%) |
| Architecture & Engineering | 0 (0.0%) | 0 (0.0%) |
| Life, Physical & Social Science | 0 (0.0%) | 0 (0.0%) |
| Community & Social Service | 0 (0.0%) | 0 (0.0%) |
| Education, Arts & Media | 0 (0.0%) | 0 (0.0%) |
| Legal Services & Support | 0 (0.0%) | 0 (0.0%) |
| Education Instruction & Library | 0 (0.0%) | 0 (0.0%) |
| Arts, Media & Entertainment | 0 (0.0%) | 0 (0.0%) |
| Health Diagnosing & Treating | 0 (0.0%) | 0 (0.0%) |
| Health Technologists | 0 (0.0%) | 0 (0.0%) |
| Total (Category) | 21 (100.0%) | 0 (0.0%) |
| Total (Overall) | 104 (67.5%) | 50 (32.5%) |
Services Occupations
The most common Services occupations in Cantua Creek are Security & Protection (9 | 5.8%), and Law Enforcement (9 | 5.8%).
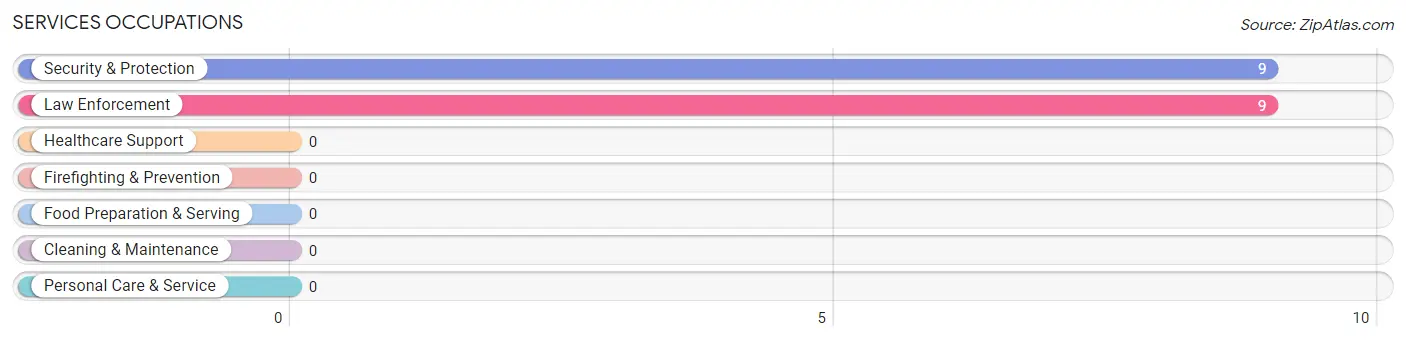
Services Occupations by Sex
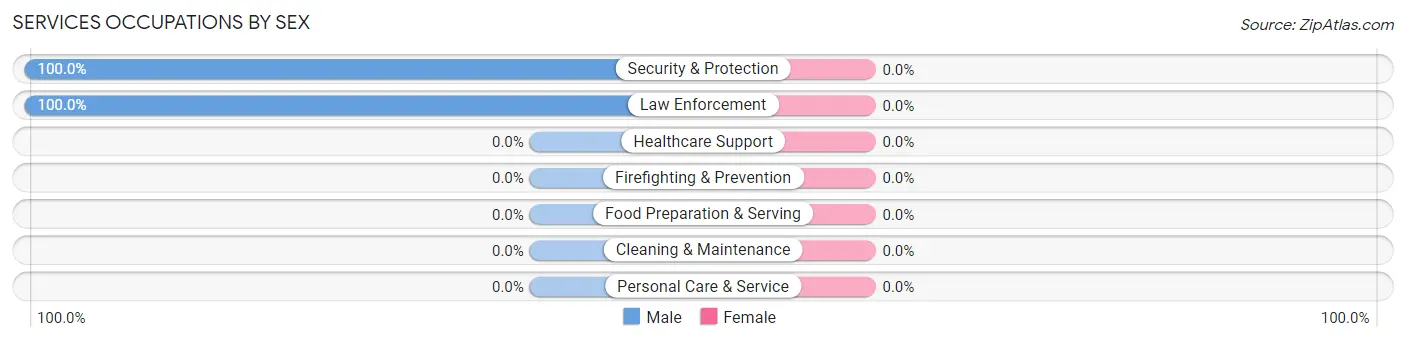
| Occupation | Male | Female |
| Healthcare Support | 0 (0.0%) | 0 (0.0%) |
| Security & Protection | 9 (100.0%) | 0 (0.0%) |
| Firefighting & Prevention | 0 (0.0%) | 0 (0.0%) |
| Law Enforcement | 9 (100.0%) | 0 (0.0%) |
| Food Preparation & Serving | 0 (0.0%) | 0 (0.0%) |
| Cleaning & Maintenance | 0 (0.0%) | 0 (0.0%) |
| Personal Care & Service | 0 (0.0%) | 0 (0.0%) |
| Total (Category) | 9 (100.0%) | 0 (0.0%) |
| Total (Overall) | 104 (67.5%) | 50 (32.5%) |
Sales and Office Occupations
Sales and Office Occupations by Sex
| Occupation | Male | Female |
| Sales & Related | 0 (0.0%) | 0 (0.0%) |
| Office & Administration | 0 (0.0%) | 0 (0.0%) |
| Total (Category) | 0 (0.0%) | 0 (0.0%) |
| Total (Overall) | 104 (67.5%) | 50 (32.5%) |
Natural Resources, Construction and Maintenance Occupations
The most common Natural Resources, Construction and Maintenance occupations in Cantua Creek are , and Farming, Fishing & Forestry (100 | 64.9%).
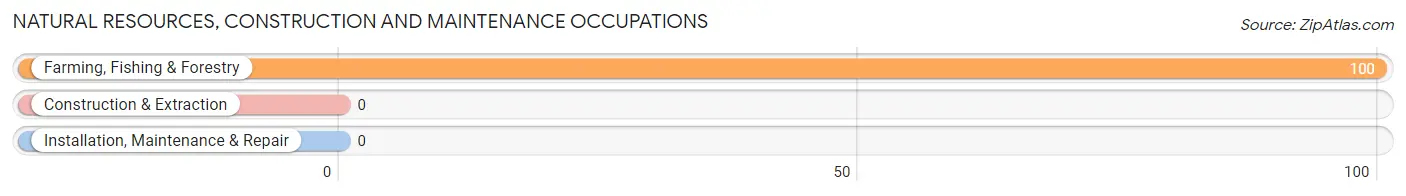
Natural Resources, Construction and Maintenance Occupations by Sex
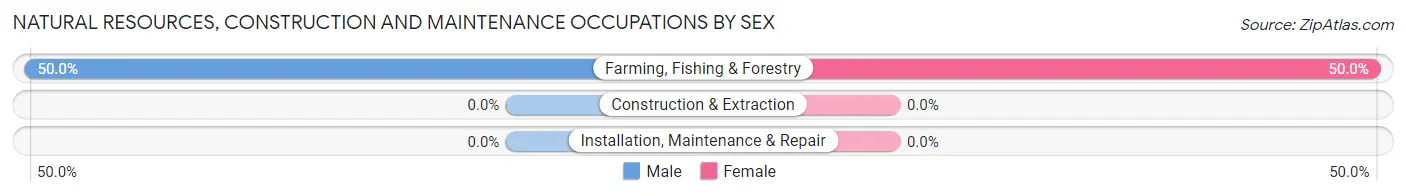
| Occupation | Male | Female |
| Farming, Fishing & Forestry | 50 (50.0%) | 50 (50.0%) |
| Construction & Extraction | 0 (0.0%) | 0 (0.0%) |
| Installation, Maintenance & Repair | 0 (0.0%) | 0 (0.0%) |
| Total (Category) | 50 (50.0%) | 50 (50.0%) |
| Total (Overall) | 104 (67.5%) | 50 (32.5%) |
Production, Transportation and Moving Occupations
The most common Production, Transportation and Moving occupations in Cantua Creek are , and Production (24 | 15.6%).
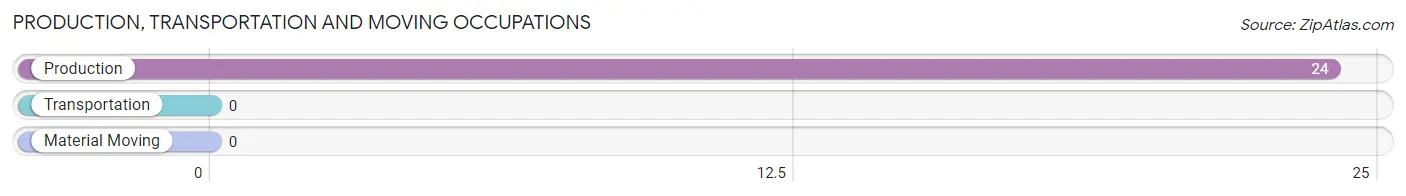
Production, Transportation and Moving Occupations by Sex
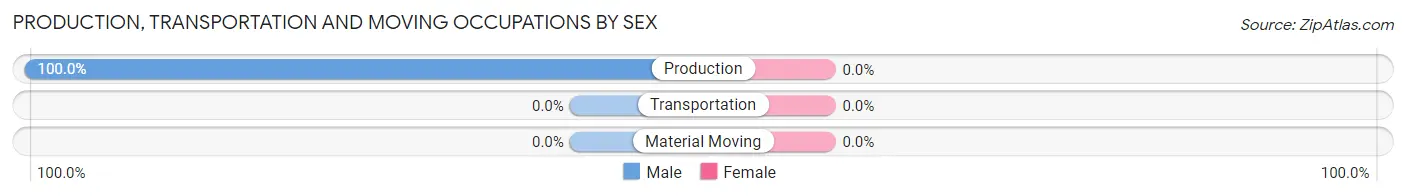
| Occupation | Male | Female |
| Production | 24 (100.0%) | 0 (0.0%) |
| Transportation | 0 (0.0%) | 0 (0.0%) |
| Material Moving | 0 (0.0%) | 0 (0.0%) |
| Total (Category) | 24 (100.0%) | 0 (0.0%) |
| Total (Overall) | 104 (67.5%) | 50 (32.5%) |
Employment Industries by Sex in Cantua Creek
Employment Industries in Cantua Creek
The major employment industries in Cantua Creek include Agriculture, Fishing & Hunting (121 | 78.6%), Manufacturing (24 | 15.6%), and Public Administration (9 | 5.8%).
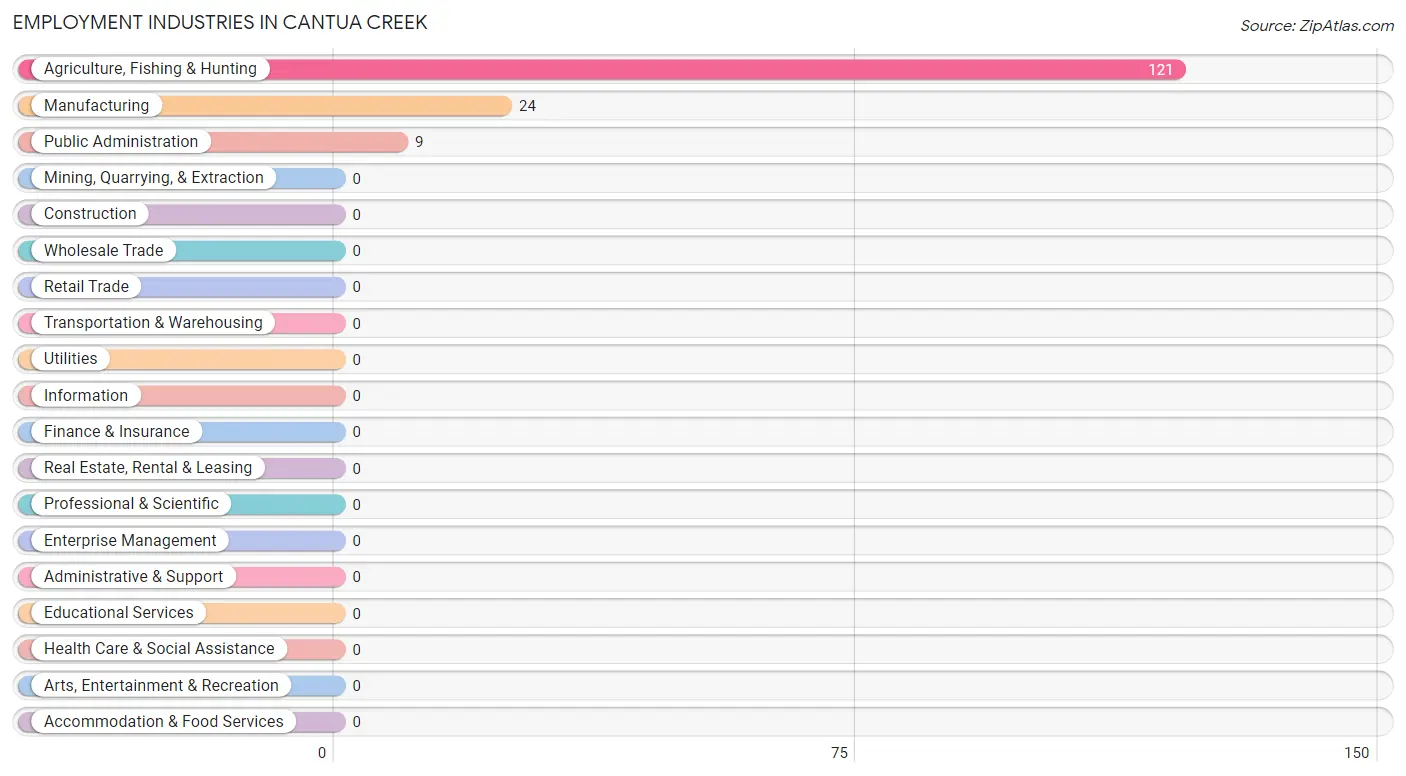
Employment Industries by Sex in Cantua Creek
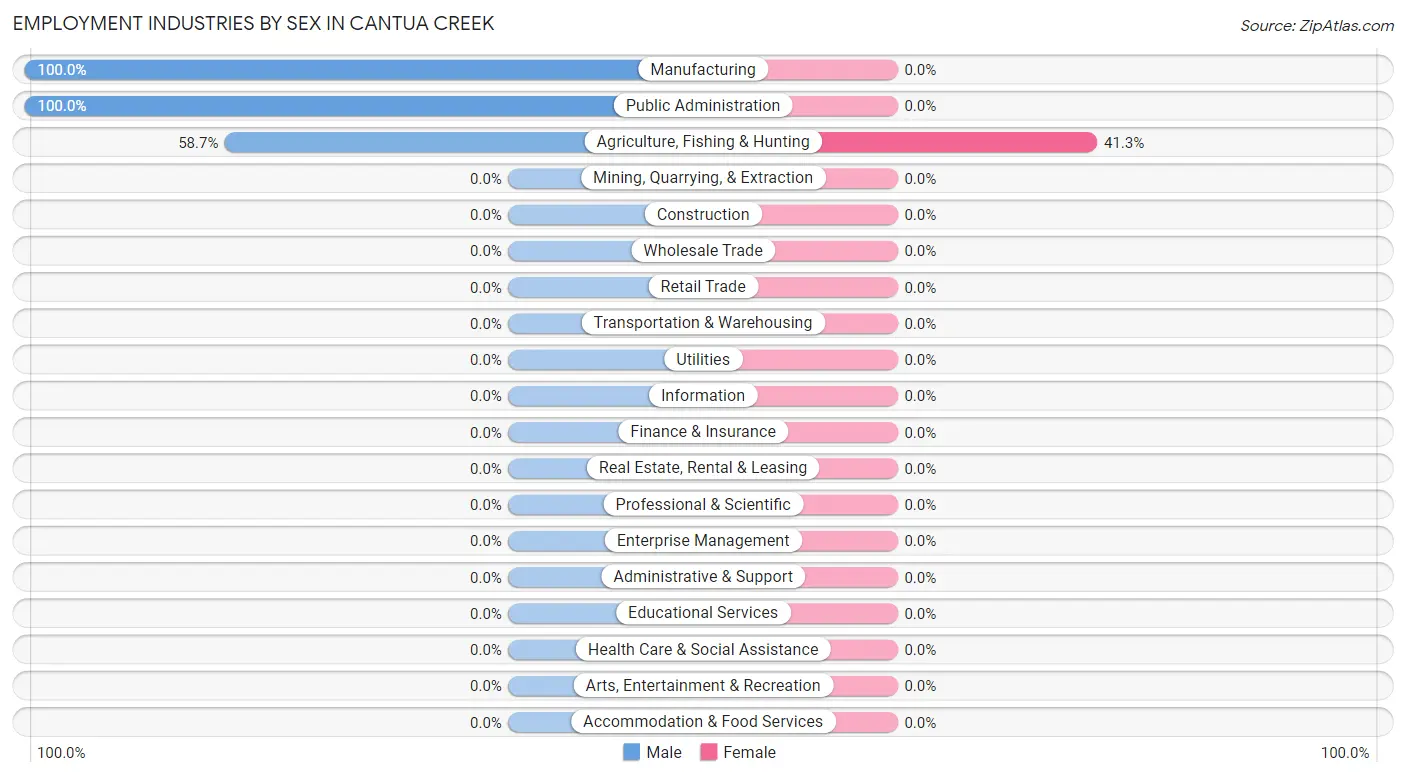
| Industry | Male | Female |
| Agriculture, Fishing & Hunting | 71 (58.7%) | 50 (41.3%) |
| Mining, Quarrying, & Extraction | 0 (0.0%) | 0 (0.0%) |
| Construction | 0 (0.0%) | 0 (0.0%) |
| Manufacturing | 24 (100.0%) | 0 (0.0%) |
| Wholesale Trade | 0 (0.0%) | 0 (0.0%) |
| Retail Trade | 0 (0.0%) | 0 (0.0%) |
| Transportation & Warehousing | 0 (0.0%) | 0 (0.0%) |
| Utilities | 0 (0.0%) | 0 (0.0%) |
| Information | 0 (0.0%) | 0 (0.0%) |
| Finance & Insurance | 0 (0.0%) | 0 (0.0%) |
| Real Estate, Rental & Leasing | 0 (0.0%) | 0 (0.0%) |
| Professional & Scientific | 0 (0.0%) | 0 (0.0%) |
| Enterprise Management | 0 (0.0%) | 0 (0.0%) |
| Administrative & Support | 0 (0.0%) | 0 (0.0%) |
| Educational Services | 0 (0.0%) | 0 (0.0%) |
| Health Care & Social Assistance | 0 (0.0%) | 0 (0.0%) |
| Arts, Entertainment & Recreation | 0 (0.0%) | 0 (0.0%) |
| Accommodation & Food Services | 0 (0.0%) | 0 (0.0%) |
| Public Administration | 9 (100.0%) | 0 (0.0%) |
| Total | 104 (67.5%) | 50 (32.5%) |
Education in Cantua Creek
School Enrollment in Cantua Creek
The most common levels of schooling among the 244 students in Cantua Creek are elementary school (67 | 27.5%), middle school (62 | 25.4%), and high school (56 | 23.0%).
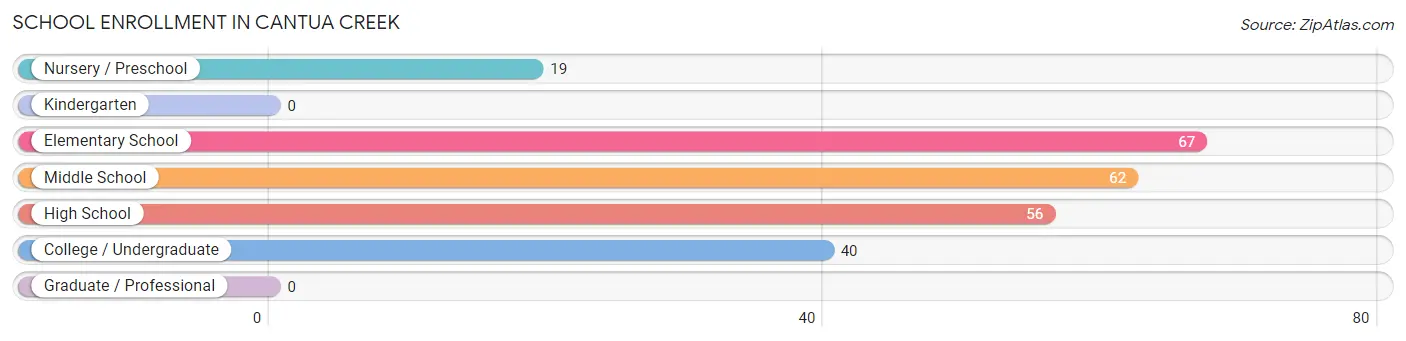
| School Level | # Students | % Students |
| Nursery / Preschool | 19 | 7.8% |
| Kindergarten | 0 | 0.0% |
| Elementary School | 67 | 27.5% |
| Middle School | 62 | 25.4% |
| High School | 56 | 23.0% |
| College / Undergraduate | 40 | 16.4% |
| Graduate / Professional | 0 | 0.0% |
| Total | 244 | 100.0% |
School Enrollment by Age by Funding Source in Cantua Creek
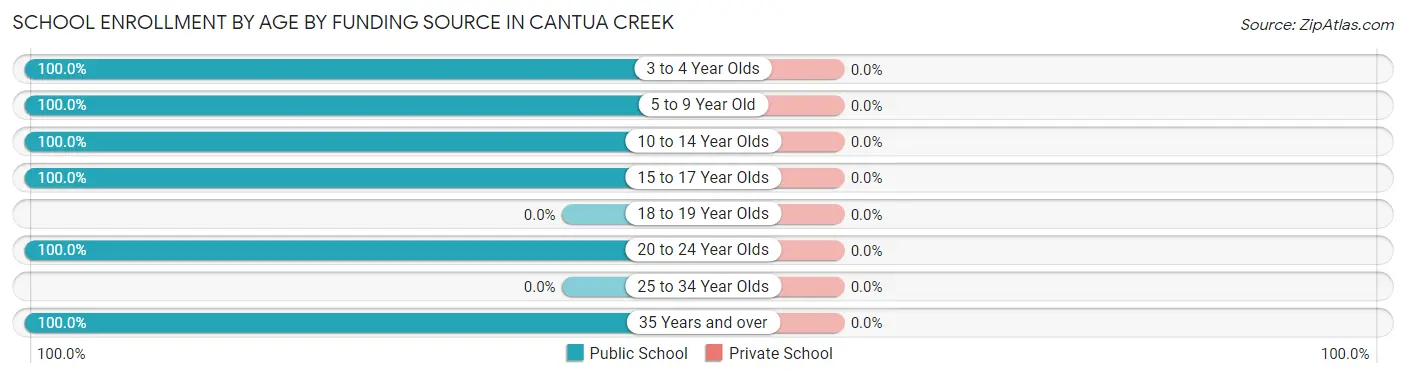
| Age Bracket | Public School | Private School |
| 3 to 4 Year Olds | 19 (100.0%) | 0 (0.0%) |
| 5 to 9 Year Old | 85 (100.0%) | 0 (0.0%) |
| 10 to 14 Year Olds | 81 (100.0%) | 0 (0.0%) |
| 15 to 17 Year Olds | 19 (100.0%) | 0 (0.0%) |
| 18 to 19 Year Olds | 0 (0.0%) | 0 (0.0%) |
| 20 to 24 Year Olds | 23 (100.0%) | 0 (0.0%) |
| 25 to 34 Year Olds | 0 (0.0%) | 0 (0.0%) |
| 35 Years and over | 17 (100.0%) | 0 (0.0%) |
| Total | 244 (100.0%) | 0 (0.0%) |
Educational Attainment by Field of Study in Cantua Creek
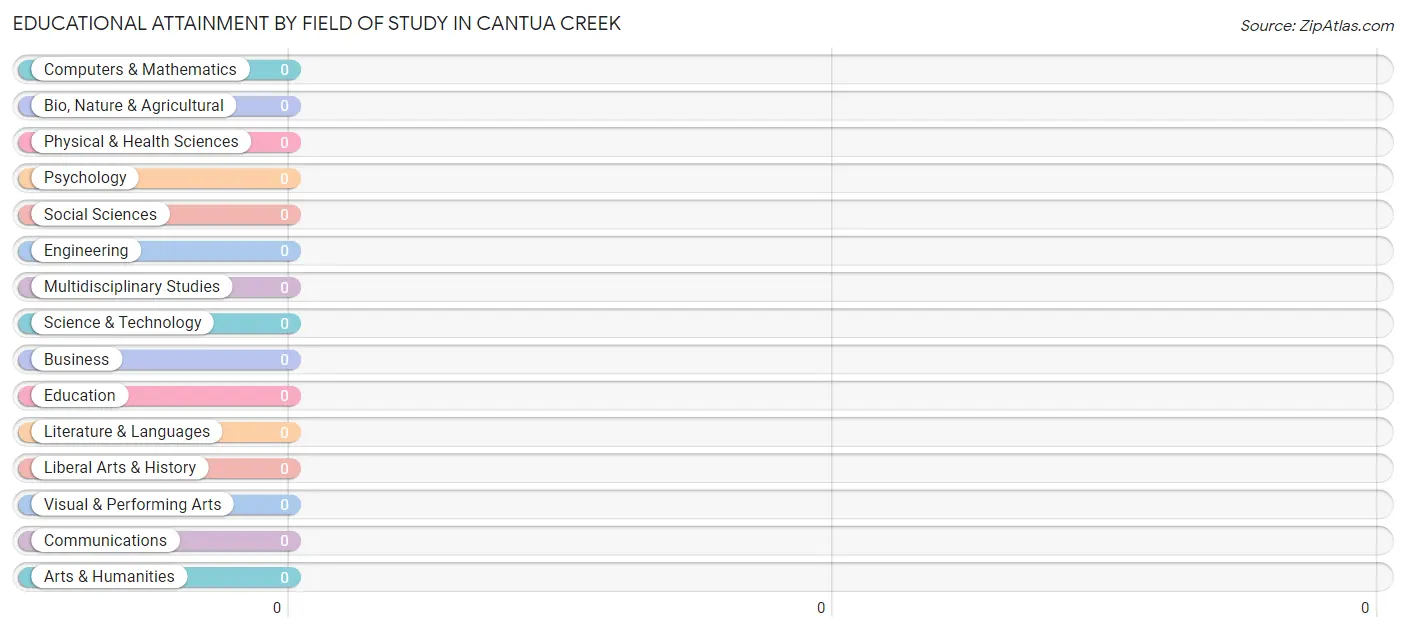
| Field of Study | # Graduates | % Graduates |
| Computers & Mathematics | 0 | 0.0% |
| Bio, Nature & Agricultural | 0 | 0.0% |
| Physical & Health Sciences | 0 | 0.0% |
| Psychology | 0 | 0.0% |
| Social Sciences | 0 | 0.0% |
| Engineering | 0 | 0.0% |
| Multidisciplinary Studies | 0 | 0.0% |
| Science & Technology | 0 | 0.0% |
| Business | 0 | 0.0% |
| Education | 0 | 0.0% |
| Literature & Languages | 0 | 0.0% |
| Liberal Arts & History | 0 | 0.0% |
| Visual & Performing Arts | 0 | 0.0% |
| Communications | 0 | 0.0% |
| Arts & Humanities | 0 | 0.0% |
| Total | 0 | 0.0% |
Transportation & Commute in Cantua Creek
Vehicle Availability by Sex in Cantua Creek
The most prevalent vehicle ownership categories in Cantua Creek are males with 2 vehicles (61, accounting for 100.0%) and females with 2 vehicles (35, making up 174.3%).
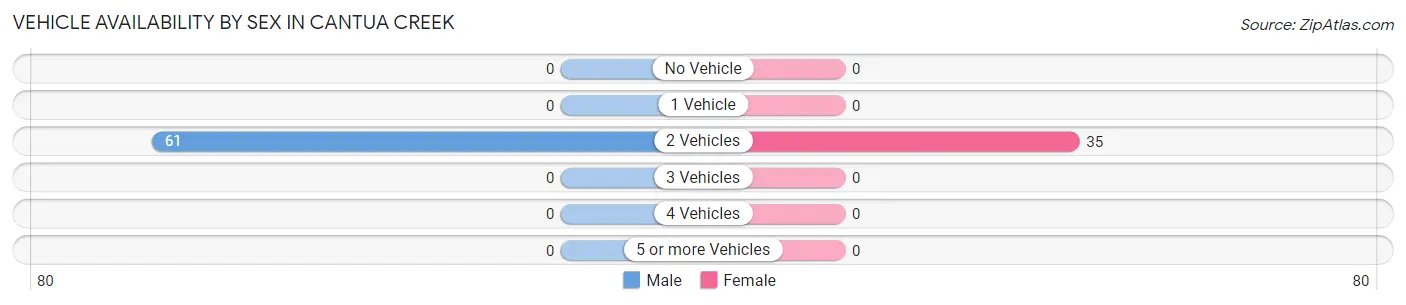
| Vehicles Available | Male | Female |
| No Vehicle | 0 (0.0%) | 0 (0.0%) |
| 1 Vehicle | 0 (0.0%) | 0 (0.0%) |
| 2 Vehicles | 61 (100.0%) | 35 (100.0%) |
| 3 Vehicles | 0 (0.0%) | 0 (0.0%) |
| 4 Vehicles | 0 (0.0%) | 0 (0.0%) |
| 5 or more Vehicles | 0 (0.0%) | 0 (0.0%) |
| Total | 61 (100.0%) | 35 (100.0%) |
Commute Time in Cantua Creek
The most frequently occuring commute durations in Cantua Creek are less than 5 minutes (48 commuters, 41.7%), 15 to 19 minutes (27 commuters, 23.5%), and 25 to 29 minutes (21 commuters, 18.3%).
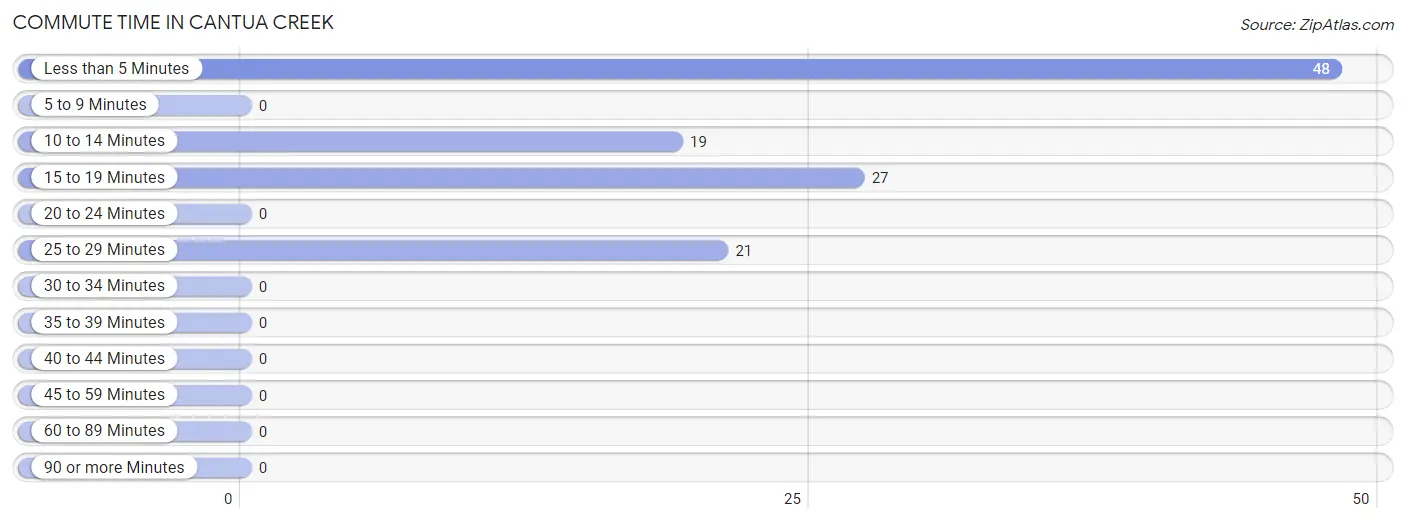
| Commute Time | # Commuters | % Commuters |
| Less than 5 Minutes | 48 | 41.7% |
| 5 to 9 Minutes | 0 | 0.0% |
| 10 to 14 Minutes | 19 | 16.5% |
| 15 to 19 Minutes | 27 | 23.5% |
| 20 to 24 Minutes | 0 | 0.0% |
| 25 to 29 Minutes | 21 | 18.3% |
| 30 to 34 Minutes | 0 | 0.0% |
| 35 to 39 Minutes | 0 | 0.0% |
| 40 to 44 Minutes | 0 | 0.0% |
| 45 to 59 Minutes | 0 | 0.0% |
| 60 to 89 Minutes | 0 | 0.0% |
| 90 or more Minutes | 0 | 0.0% |
Commute Time by Sex in Cantua Creek
The most common commute times in Cantua Creek are less than 5 minutes (30 commuters, 37.5%) for males and less than 5 minutes (18 commuters, 51.4%) for females.
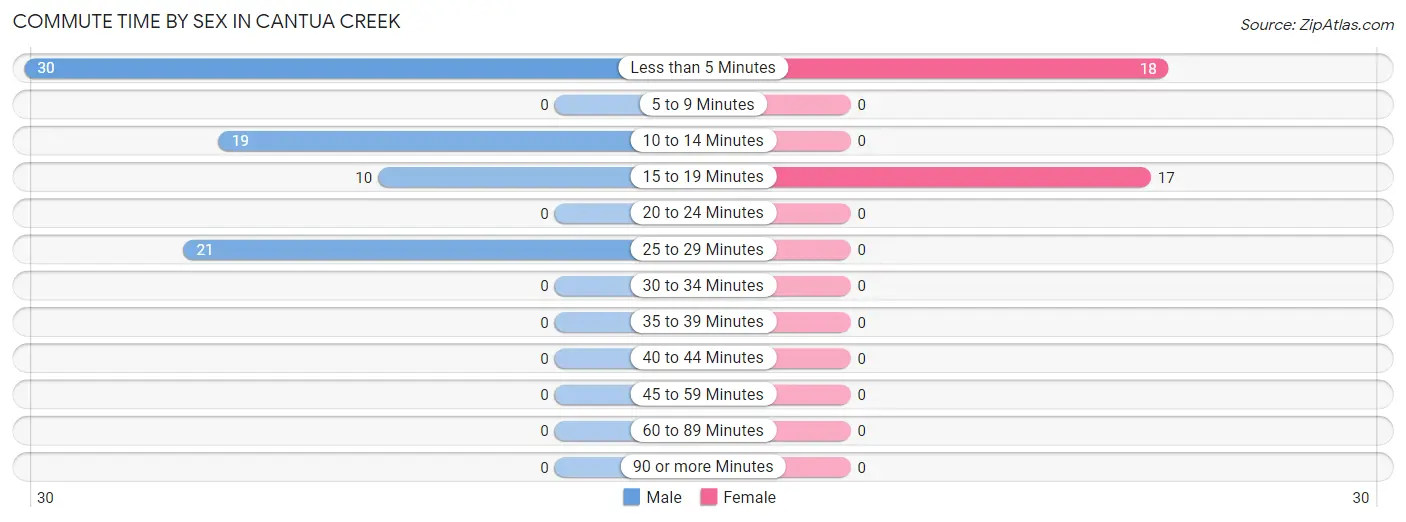
| Commute Time | Male | Female |
| Less than 5 Minutes | 30 (37.5%) | 18 (51.4%) |
| 5 to 9 Minutes | 0 (0.0%) | 0 (0.0%) |
| 10 to 14 Minutes | 19 (23.7%) | 0 (0.0%) |
| 15 to 19 Minutes | 10 (12.5%) | 17 (48.6%) |
| 20 to 24 Minutes | 0 (0.0%) | 0 (0.0%) |
| 25 to 29 Minutes | 21 (26.3%) | 0 (0.0%) |
| 30 to 34 Minutes | 0 (0.0%) | 0 (0.0%) |
| 35 to 39 Minutes | 0 (0.0%) | 0 (0.0%) |
| 40 to 44 Minutes | 0 (0.0%) | 0 (0.0%) |
| 45 to 59 Minutes | 0 (0.0%) | 0 (0.0%) |
| 60 to 89 Minutes | 0 (0.0%) | 0 (0.0%) |
| 90 or more Minutes | 0 (0.0%) | 0 (0.0%) |
Time of Departure to Work by Sex in Cantua Creek
The most frequent times of departure to work in Cantua Creek are 6:00 AM to 6:29 AM (42, 52.5%) for males and 4:00 PM to 11:59 PM (18, 51.4%) for females.
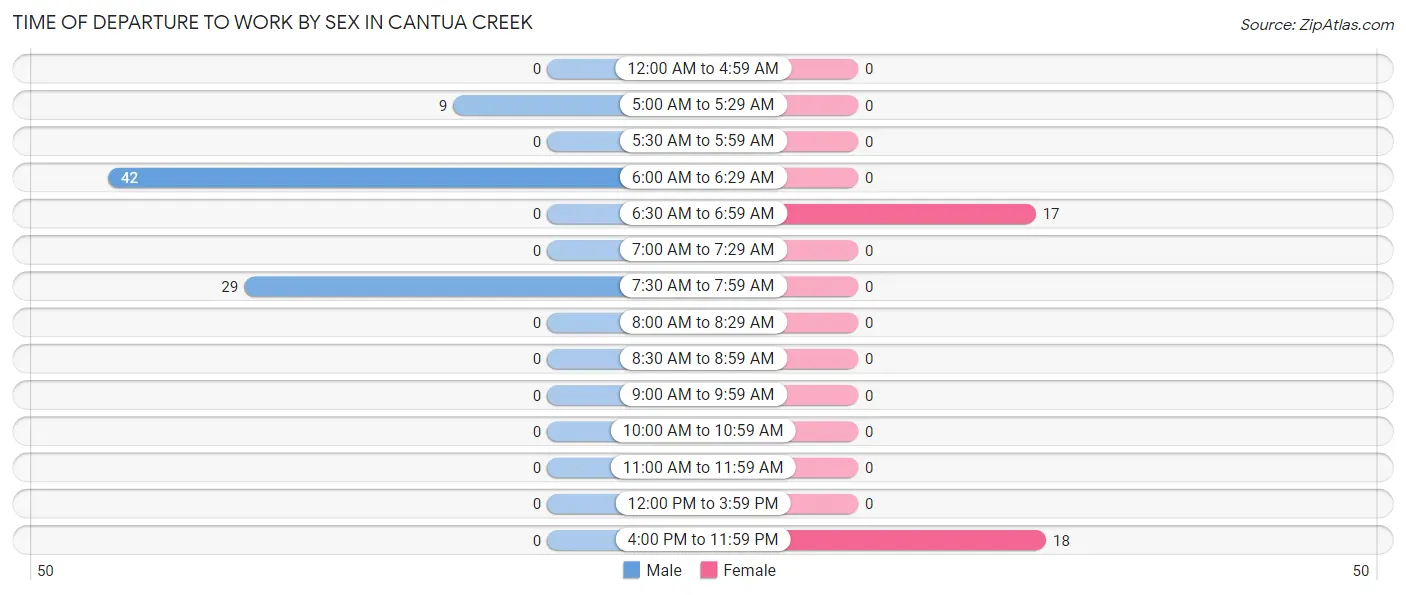
| Time of Departure | Male | Female |
| 12:00 AM to 4:59 AM | 0 (0.0%) | 0 (0.0%) |
| 5:00 AM to 5:29 AM | 9 (11.3%) | 0 (0.0%) |
| 5:30 AM to 5:59 AM | 0 (0.0%) | 0 (0.0%) |
| 6:00 AM to 6:29 AM | 42 (52.5%) | 0 (0.0%) |
| 6:30 AM to 6:59 AM | 0 (0.0%) | 17 (48.6%) |
| 7:00 AM to 7:29 AM | 0 (0.0%) | 0 (0.0%) |
| 7:30 AM to 7:59 AM | 29 (36.2%) | 0 (0.0%) |
| 8:00 AM to 8:29 AM | 0 (0.0%) | 0 (0.0%) |
| 8:30 AM to 8:59 AM | 0 (0.0%) | 0 (0.0%) |
| 9:00 AM to 9:59 AM | 0 (0.0%) | 0 (0.0%) |
| 10:00 AM to 10:59 AM | 0 (0.0%) | 0 (0.0%) |
| 11:00 AM to 11:59 AM | 0 (0.0%) | 0 (0.0%) |
| 12:00 PM to 3:59 PM | 0 (0.0%) | 0 (0.0%) |
| 4:00 PM to 11:59 PM | 0 (0.0%) | 18 (51.4%) |
| Total | 80 (100.0%) | 35 (100.0%) |
Housing Occupancy in Cantua Creek
Occupancy by Ownership in Cantua Creek
Of the total 115 dwellings in Cantua Creek, owner-occupied units account for 15 (13.0%), while renter-occupied units make up 100 (87.0%).
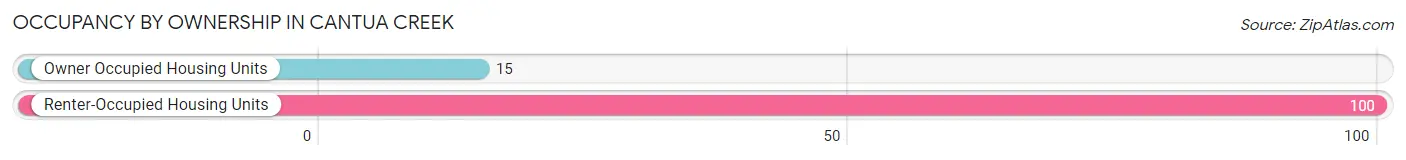
| Occupancy | # Housing Units | % Housing Units |
| Owner Occupied Housing Units | 15 | 13.0% |
| Renter-Occupied Housing Units | 100 | 87.0% |
| Total Occupied Housing Units | 115 | 100.0% |
Occupancy by Household Size in Cantua Creek
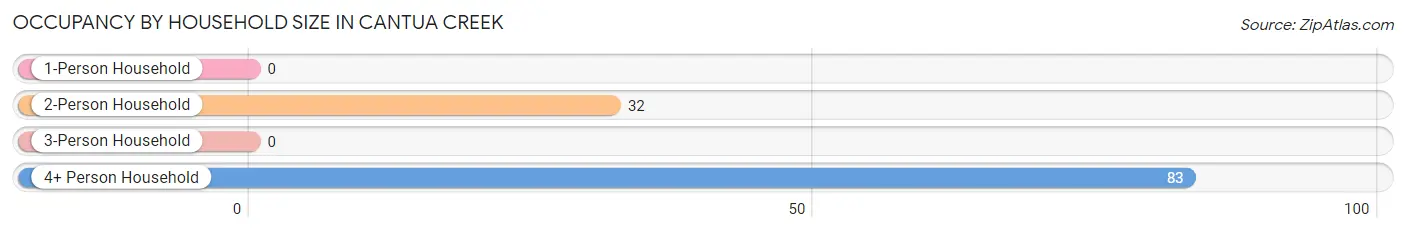
| Household Size | # Housing Units | % Housing Units |
| 1-Person Household | 0 | 0.0% |
| 2-Person Household | 32 | 27.8% |
| 3-Person Household | 0 | 0.0% |
| 4+ Person Household | 83 | 72.2% |
| Total Housing Units | 115 | 100.0% |
Occupancy by Ownership by Household Size in Cantua Creek
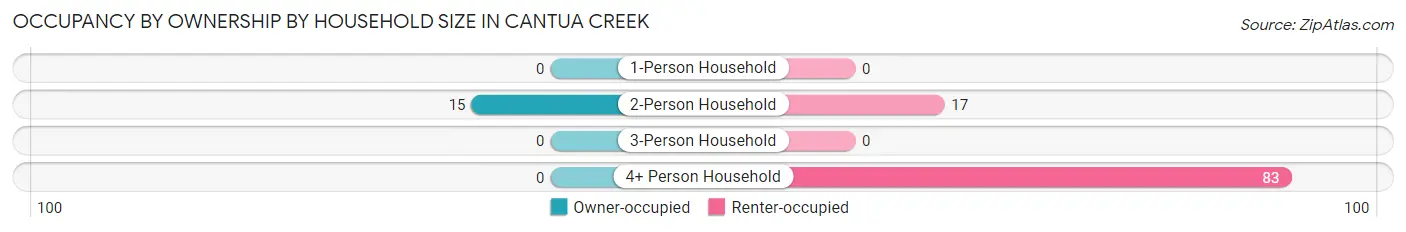
| Household Size | Owner-occupied | Renter-occupied |
| 1-Person Household | 0 (0.0%) | 0 (0.0%) |
| 2-Person Household | 15 (46.9%) | 17 (53.1%) |
| 3-Person Household | 0 (0.0%) | 0 (0.0%) |
| 4+ Person Household | 0 (0.0%) | 83 (100.0%) |
| Total Housing Units | 15 (13.0%) | 100 (87.0%) |
Occupancy by Educational Attainment in Cantua Creek
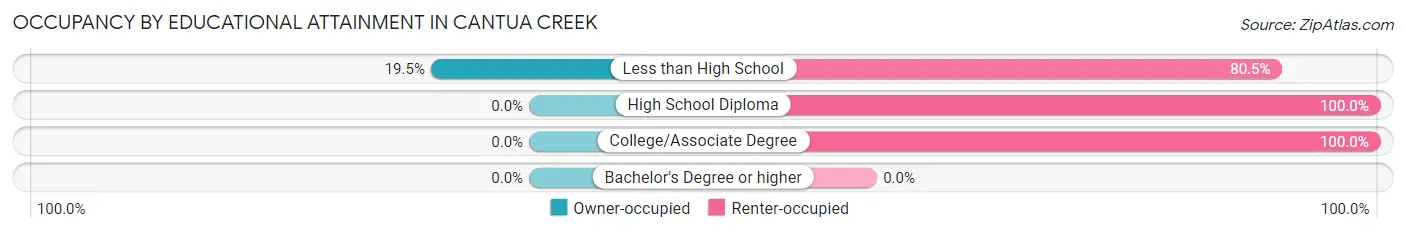
| Household Size | Owner-occupied | Renter-occupied |
| Less than High School | 15 (19.5%) | 62 (80.5%) |
| High School Diploma | 0 (0.0%) | 17 (100.0%) |
| College/Associate Degree | 0 (0.0%) | 21 (100.0%) |
| Bachelor's Degree or higher | 0 (0.0%) | 0 (0.0%) |
Occupancy by Age of Householder in Cantua Creek
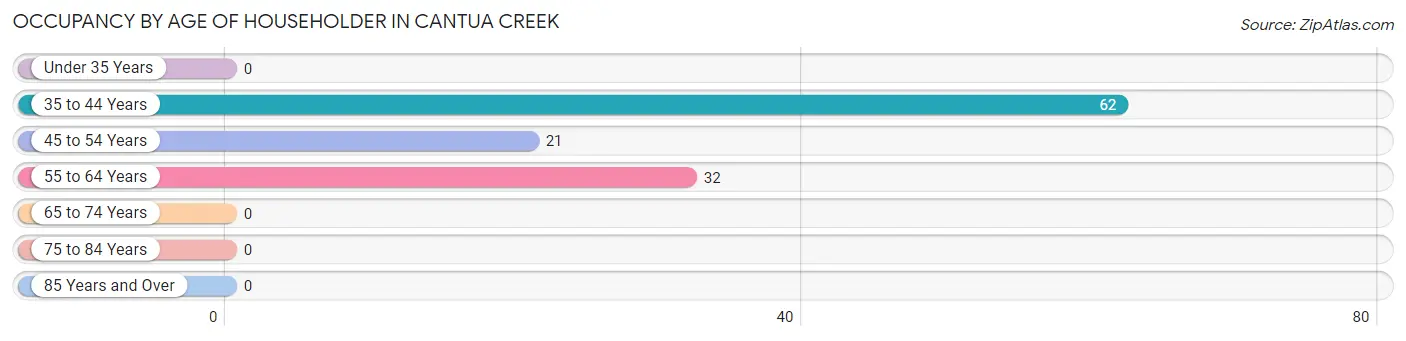
| Age Bracket | # Households | % Households |
| Under 35 Years | 0 | 0.0% |
| 35 to 44 Years | 62 | 53.9% |
| 45 to 54 Years | 21 | 18.3% |
| 55 to 64 Years | 32 | 27.8% |
| 65 to 74 Years | 0 | 0.0% |
| 75 to 84 Years | 0 | 0.0% |
| 85 Years and Over | 0 | 0.0% |
| Total | 115 | 100.0% |
Housing Finances in Cantua Creek
Median Income by Occupancy in Cantua Creek
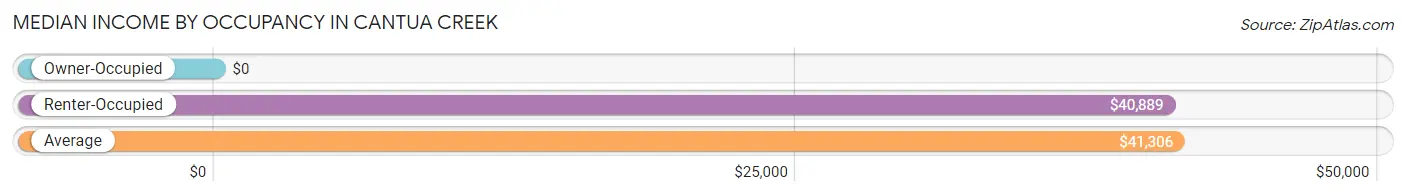
| Occupancy Type | # Households | Median Income |
| Owner-Occupied | 15 (13.0%) | $0 |
| Renter-Occupied | 100 (87.0%) | $40,889 |
| Average | 115 (100.0%) | $41,306 |
Occupancy by Householder Income Bracket in Cantua Creek
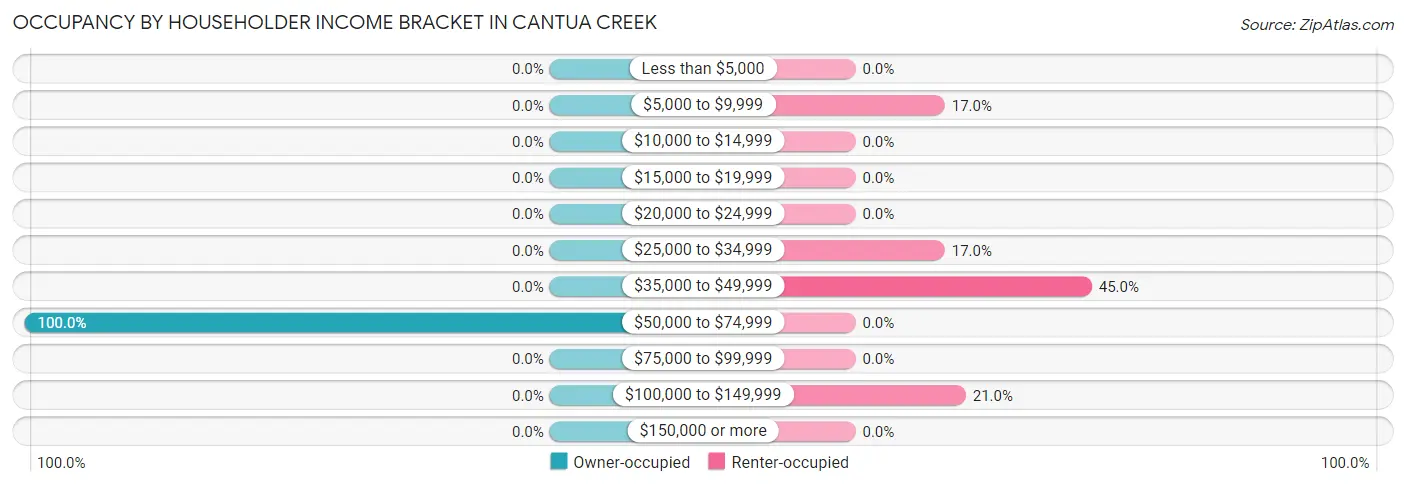
| Income Bracket | Owner-occupied | Renter-occupied |
| Less than $5,000 | 0 (0.0%) | 0 (0.0%) |
| $5,000 to $9,999 | 0 (0.0%) | 17 (17.0%) |
| $10,000 to $14,999 | 0 (0.0%) | 0 (0.0%) |
| $15,000 to $19,999 | 0 (0.0%) | 0 (0.0%) |
| $20,000 to $24,999 | 0 (0.0%) | 0 (0.0%) |
| $25,000 to $34,999 | 0 (0.0%) | 17 (17.0%) |
| $35,000 to $49,999 | 0 (0.0%) | 45 (45.0%) |
| $50,000 to $74,999 | 15 (100.0%) | 0 (0.0%) |
| $75,000 to $99,999 | 0 (0.0%) | 0 (0.0%) |
| $100,000 to $149,999 | 0 (0.0%) | 21 (21.0%) |
| $150,000 or more | 0 (0.0%) | 0 (0.0%) |
| Total | 15 (100.0%) | 100 (100.0%) |
Monthly Housing Cost Tiers in Cantua Creek
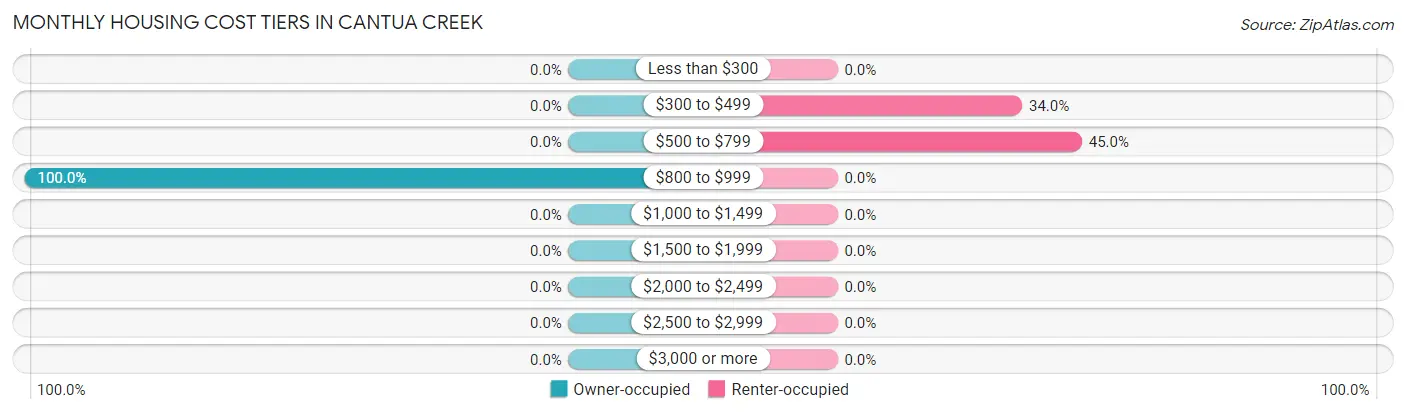
| Monthly Cost | Owner-occupied | Renter-occupied |
| Less than $300 | 0 (0.0%) | 0 (0.0%) |
| $300 to $499 | 0 (0.0%) | 34 (34.0%) |
| $500 to $799 | 0 (0.0%) | 45 (45.0%) |
| $800 to $999 | 15 (100.0%) | 0 (0.0%) |
| $1,000 to $1,499 | 0 (0.0%) | 0 (0.0%) |
| $1,500 to $1,999 | 0 (0.0%) | 0 (0.0%) |
| $2,000 to $2,499 | 0 (0.0%) | 0 (0.0%) |
| $2,500 to $2,999 | 0 (0.0%) | 0 (0.0%) |
| $3,000 or more | 0 (0.0%) | 0 (0.0%) |
| Total | 15 (100.0%) | 100 (100.0%) |
Physical Housing Characteristics in Cantua Creek
Housing Structures in Cantua Creek
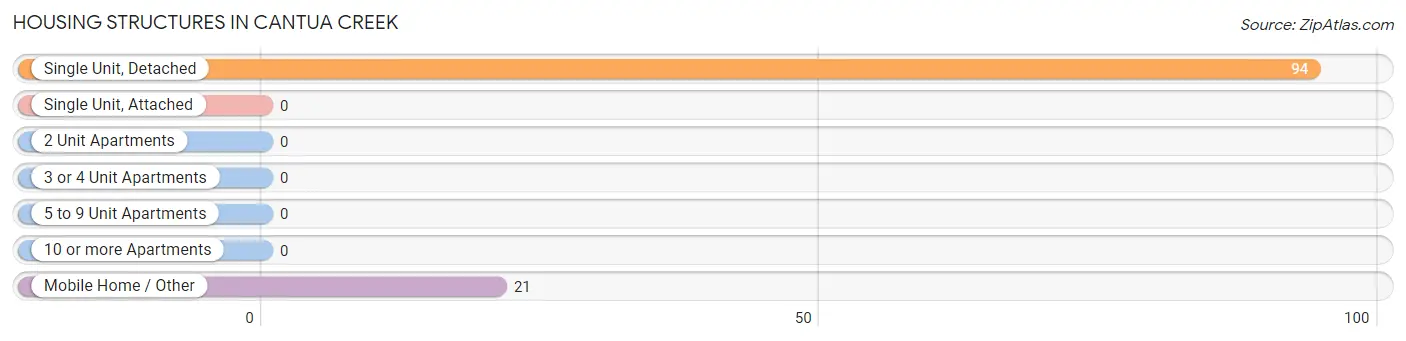
| Structure Type | # Housing Units | % Housing Units |
| Single Unit, Detached | 94 | 81.7% |
| Single Unit, Attached | 0 | 0.0% |
| 2 Unit Apartments | 0 | 0.0% |
| 3 or 4 Unit Apartments | 0 | 0.0% |
| 5 to 9 Unit Apartments | 0 | 0.0% |
| 10 or more Apartments | 0 | 0.0% |
| Mobile Home / Other | 21 | 18.3% |
| Total | 115 | 100.0% |
Housing Structures by Occupancy in Cantua Creek
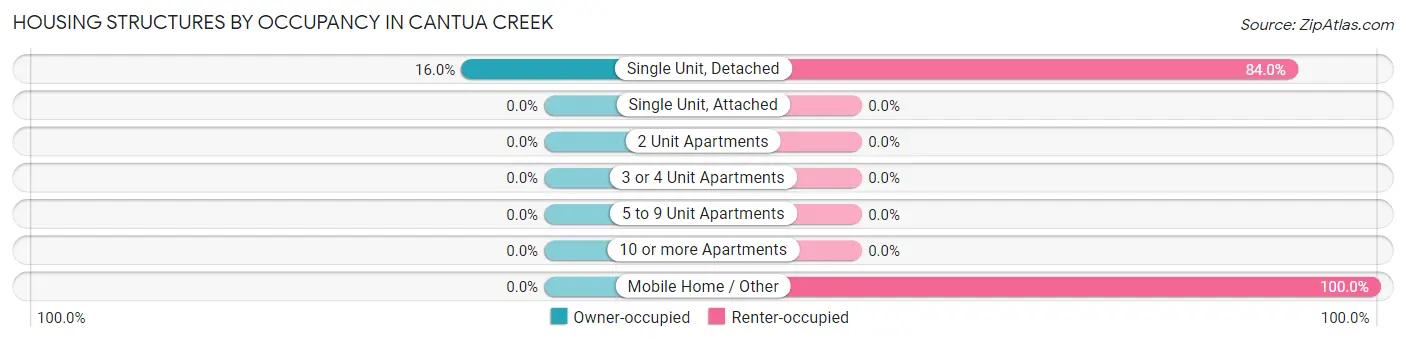
| Structure Type | Owner-occupied | Renter-occupied |
| Single Unit, Detached | 15 (16.0%) | 79 (84.0%) |
| Single Unit, Attached | 0 (0.0%) | 0 (0.0%) |
| 2 Unit Apartments | 0 (0.0%) | 0 (0.0%) |
| 3 or 4 Unit Apartments | 0 (0.0%) | 0 (0.0%) |
| 5 to 9 Unit Apartments | 0 (0.0%) | 0 (0.0%) |
| 10 or more Apartments | 0 (0.0%) | 0 (0.0%) |
| Mobile Home / Other | 0 (0.0%) | 21 (100.0%) |
| Total | 15 (13.0%) | 100 (87.0%) |
Housing Structures by Number of Rooms in Cantua Creek
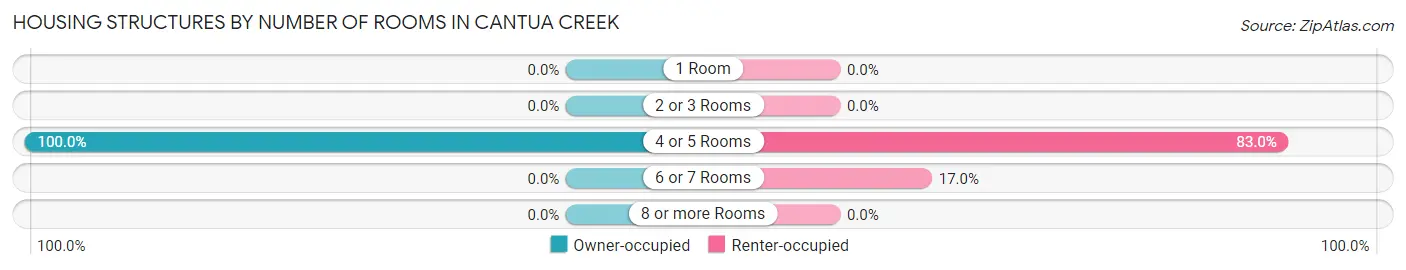
| Number of Rooms | Owner-occupied | Renter-occupied |
| 1 Room | 0 (0.0%) | 0 (0.0%) |
| 2 or 3 Rooms | 0 (0.0%) | 0 (0.0%) |
| 4 or 5 Rooms | 15 (100.0%) | 83 (83.0%) |
| 6 or 7 Rooms | 0 (0.0%) | 17 (17.0%) |
| 8 or more Rooms | 0 (0.0%) | 0 (0.0%) |
| Total | 15 (100.0%) | 100 (100.0%) |
Housing Structure by Heating Type in Cantua Creek
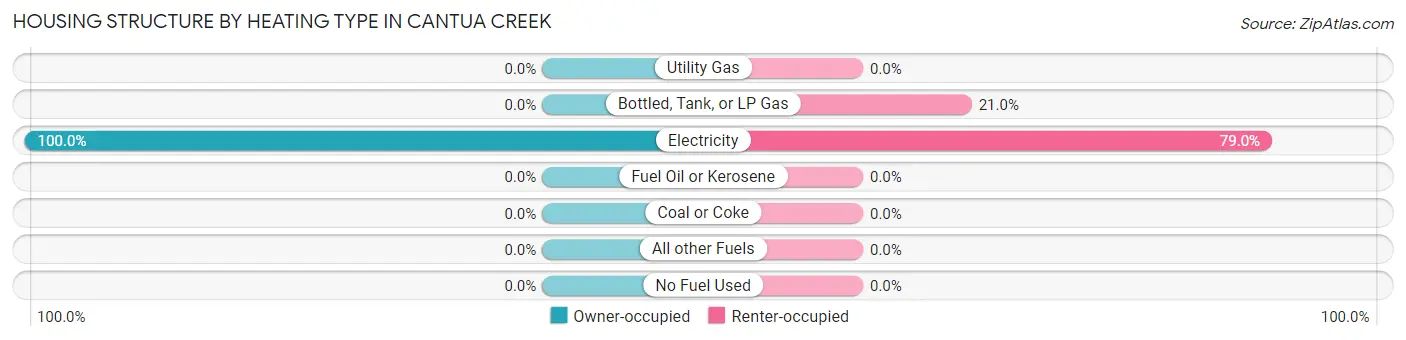
| Heating Type | Owner-occupied | Renter-occupied |
| Utility Gas | 0 (0.0%) | 0 (0.0%) |
| Bottled, Tank, or LP Gas | 0 (0.0%) | 21 (21.0%) |
| Electricity | 15 (100.0%) | 79 (79.0%) |
| Fuel Oil or Kerosene | 0 (0.0%) | 0 (0.0%) |
| Coal or Coke | 0 (0.0%) | 0 (0.0%) |
| All other Fuels | 0 (0.0%) | 0 (0.0%) |
| No Fuel Used | 0 (0.0%) | 0 (0.0%) |
| Total | 15 (100.0%) | 100 (100.0%) |
Household Vehicle Usage in Cantua Creek
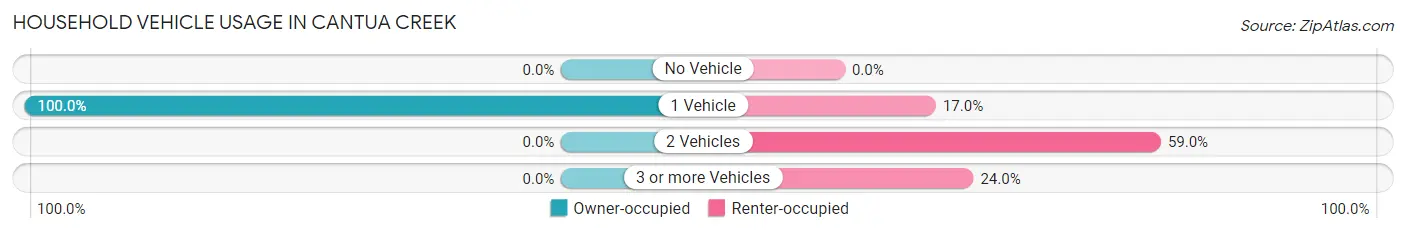
| Vehicles per Household | Owner-occupied | Renter-occupied |
| No Vehicle | 0 (0.0%) | 0 (0.0%) |
| 1 Vehicle | 15 (100.0%) | 17 (17.0%) |
| 2 Vehicles | 0 (0.0%) | 59 (59.0%) |
| 3 or more Vehicles | 0 (0.0%) | 24 (24.0%) |
| Total | 15 (100.0%) | 100 (100.0%) |
Real Estate & Mortgages in Cantua Creek
Real Estate and Mortgage Overview in Cantua Creek
| Characteristic | Without Mortgage | With Mortgage |
| Housing Units | 0 | 15 |
| Median Property Value | - | - |
| Median Household Income | - | - |
| Monthly Housing Costs | - | - |
| Real Estate Taxes | - | - |
Property Value by Mortgage Status in Cantua Creek
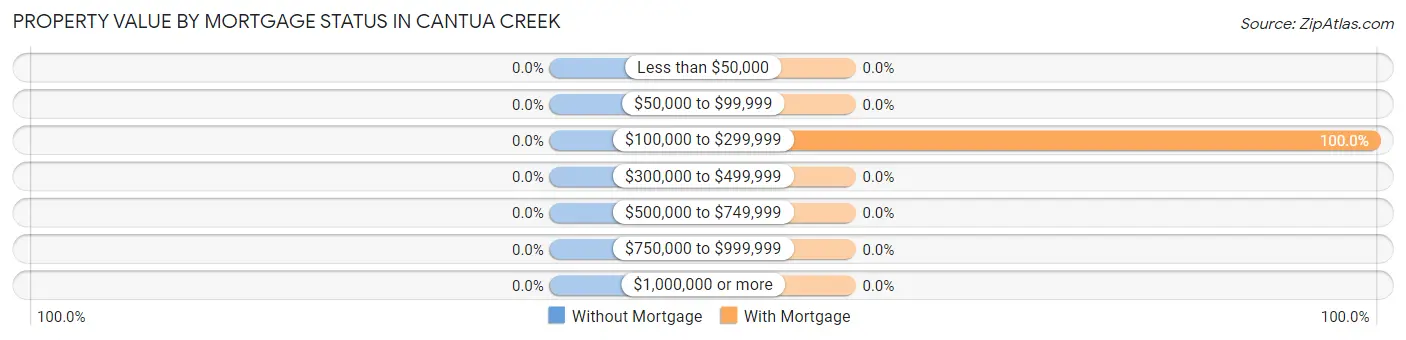
| Property Value | Without Mortgage | With Mortgage |
| Less than $50,000 | 0 (0.0%) | 0 (0.0%) |
| $50,000 to $99,999 | 0 (0.0%) | 0 (0.0%) |
| $100,000 to $299,999 | 0 (0.0%) | 15 (100.0%) |
| $300,000 to $499,999 | 0 (0.0%) | 0 (0.0%) |
| $500,000 to $749,999 | 0 (0.0%) | 0 (0.0%) |
| $750,000 to $999,999 | 0 (0.0%) | 0 (0.0%) |
| $1,000,000 or more | 0 (0.0%) | 0 (0.0%) |
| Total | 0 (0.0%) | 15 (100.0%) |
Household Income by Mortgage Status in Cantua Creek
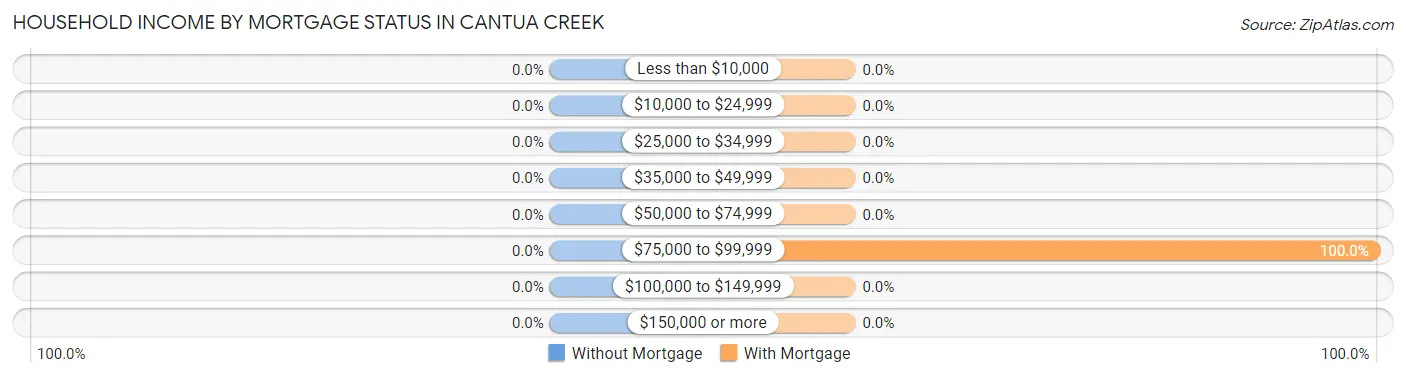
| Household Income | Without Mortgage | With Mortgage |
| Less than $10,000 | 0 (0.0%) | 0 (0.0%) |
| $10,000 to $24,999 | 0 (0.0%) | 0 (0.0%) |
| $25,000 to $34,999 | 0 (0.0%) | 0 (0.0%) |
| $35,000 to $49,999 | 0 (0.0%) | 0 (0.0%) |
| $50,000 to $74,999 | 0 (0.0%) | 0 (0.0%) |
| $75,000 to $99,999 | 0 (0.0%) | 15 (100.0%) |
| $100,000 to $149,999 | 0 (0.0%) | 0 (0.0%) |
| $150,000 or more | 0 (0.0%) | 0 (0.0%) |
| Total | 0 (0.0%) | 15 (100.0%) |
Property Value to Household Income Ratio in Cantua Creek
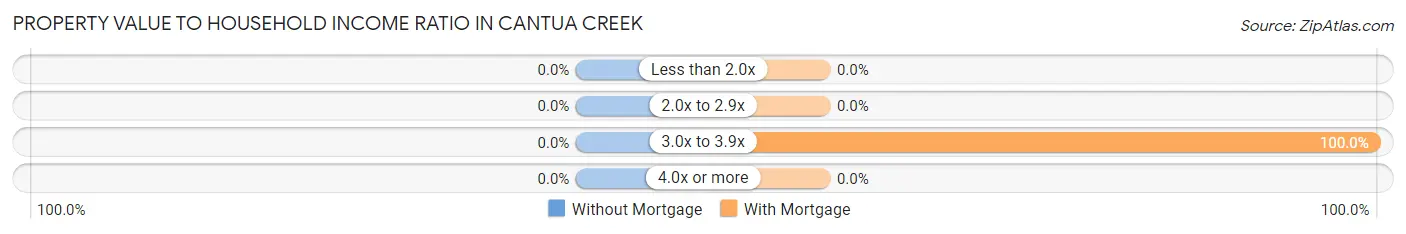
| Value-to-Income Ratio | Without Mortgage | With Mortgage |
| Less than 2.0x | 0 (0.0%) | 0 (0.0%) |
| 2.0x to 2.9x | 0 (0.0%) | 0 (0.0%) |
| 3.0x to 3.9x | 0 (0.0%) | 15 (100.0%) |
| 4.0x or more | 0 (0.0%) | 0 (0.0%) |
| Total | 0 (0.0%) | 15 (100.0%) |
Real Estate Taxes by Mortgage Status in Cantua Creek
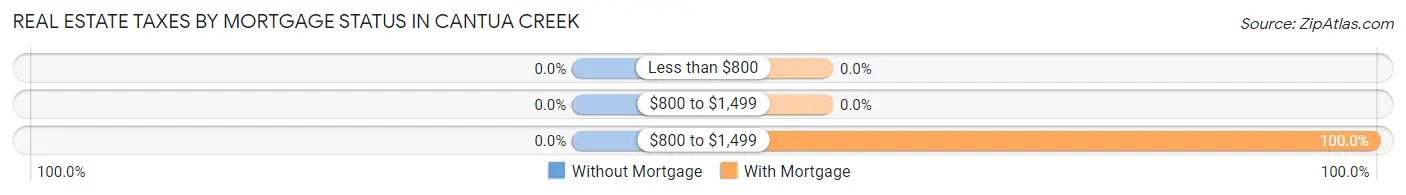
| Property Taxes | Without Mortgage | With Mortgage |
| Less than $800 | 0 (0.0%) | 0 (0.0%) |
| $800 to $1,499 | 0 (0.0%) | 0 (0.0%) |
| $800 to $1,499 | 0 (0.0%) | 15 (100.0%) |
| Total | 0 (0.0%) | 15 (100.0%) |
Health & Disability in Cantua Creek
Health Insurance Coverage by Age in Cantua Creek
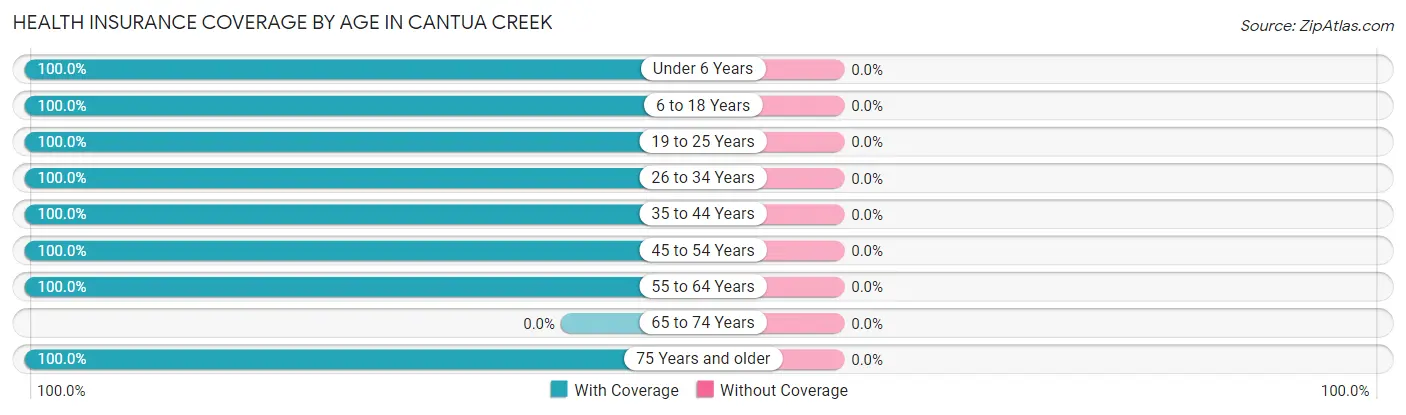
| Age Bracket | With Coverage | Without Coverage |
| Under 6 Years | 38 (100.0%) | 0 (0.0%) |
| 6 to 18 Years | 185 (100.0%) | 0 (0.0%) |
| 19 to 25 Years | 53 (100.0%) | 0 (0.0%) |
| 26 to 34 Years | 36 (100.0%) | 0 (0.0%) |
| 35 to 44 Years | 116 (100.0%) | 0 (0.0%) |
| 45 to 54 Years | 38 (100.0%) | 0 (0.0%) |
| 55 to 64 Years | 37 (100.0%) | 0 (0.0%) |
| 65 to 74 Years | 0 (0.0%) | 0 (0.0%) |
| 75 Years and older | 19 (100.0%) | 0 (0.0%) |
| Total | 522 (100.0%) | 0 (0.0%) |
Health Insurance Coverage by Citizenship Status in Cantua Creek
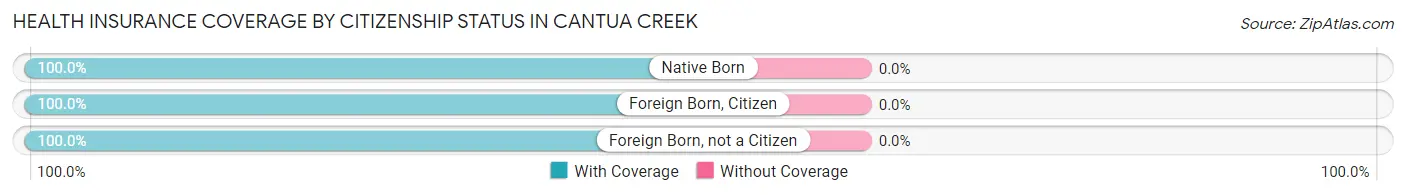
| Citizenship Status | With Coverage | Without Coverage |
| Native Born | 38 (100.0%) | 0 (0.0%) |
| Foreign Born, Citizen | 185 (100.0%) | 0 (0.0%) |
| Foreign Born, not a Citizen | 53 (100.0%) | 0 (0.0%) |
Health Insurance Coverage by Household Income in Cantua Creek
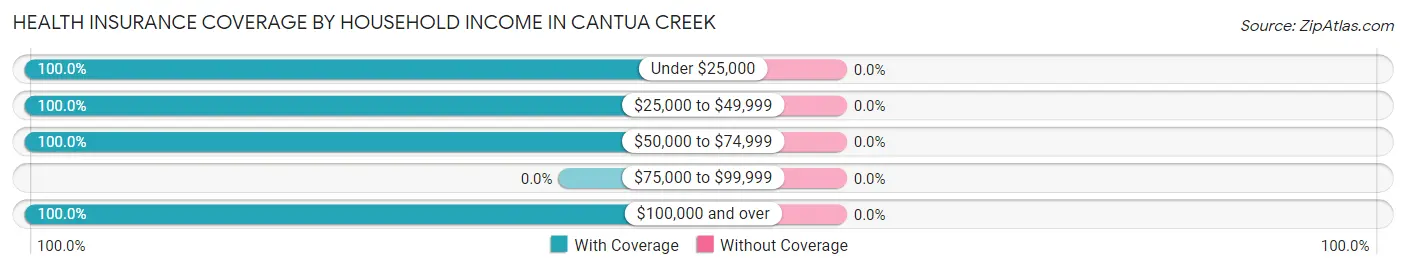
| Household Income | With Coverage | Without Coverage |
| Under $25,000 | 34 (100.0%) | 0 (0.0%) |
| $25,000 to $49,999 | 330 (100.0%) | 0 (0.0%) |
| $50,000 to $74,999 | 34 (100.0%) | 0 (0.0%) |
| $75,000 to $99,999 | 0 (0.0%) | 0 (0.0%) |
| $100,000 and over | 100 (100.0%) | 0 (0.0%) |
Public vs Private Health Insurance Coverage by Age in Cantua Creek
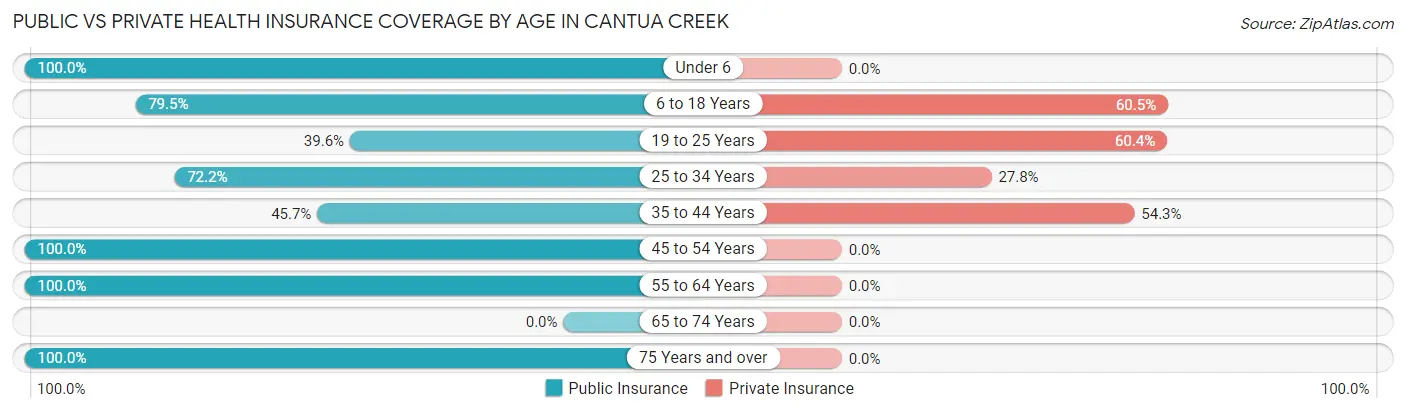
| Age Bracket | Public Insurance | Private Insurance |
| Under 6 | 38 (100.0%) | 0 (0.0%) |
| 6 to 18 Years | 147 (79.5%) | 112 (60.5%) |
| 19 to 25 Years | 21 (39.6%) | 32 (60.4%) |
| 25 to 34 Years | 26 (72.2%) | 10 (27.8%) |
| 35 to 44 Years | 53 (45.7%) | 63 (54.3%) |
| 45 to 54 Years | 38 (100.0%) | 0 (0.0%) |
| 55 to 64 Years | 37 (100.0%) | 0 (0.0%) |
| 65 to 74 Years | 0 (0.0%) | 0 (0.0%) |
| 75 Years and over | 19 (100.0%) | 0 (0.0%) |
| Total | 379 (72.6%) | 217 (41.6%) |
Disability Status by Sex by Age in Cantua Creek
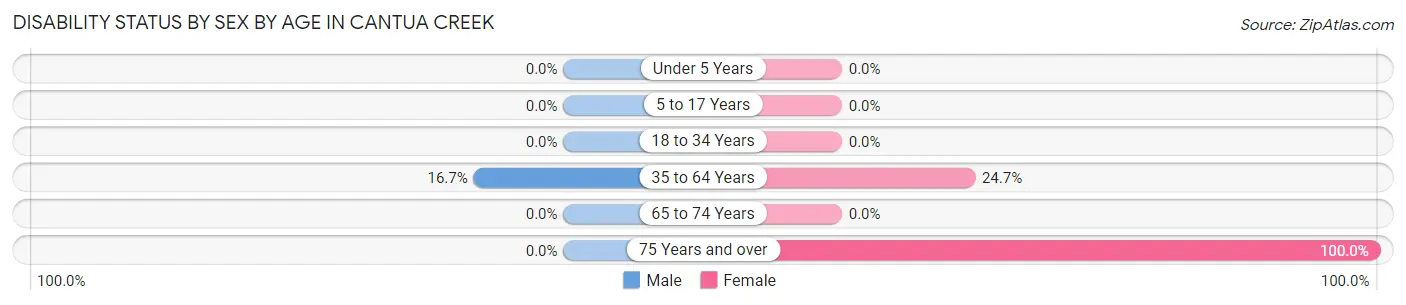
| Age Bracket | Male | Female |
| Under 5 Years | 0 (0.0%) | 0 (0.0%) |
| 5 to 17 Years | 0 (0.0%) | 0 (0.0%) |
| 18 to 34 Years | 0 (0.0%) | 0 (0.0%) |
| 35 to 64 Years | 17 (16.7%) | 22 (24.7%) |
| 65 to 74 Years | 0 (0.0%) | 0 (0.0%) |
| 75 Years and over | 0 (0.0%) | 19 (100.0%) |
Disability Class by Sex by Age in Cantua Creek
Disability Class: Hearing Difficulty
| Age Bracket | Male | Female |
| Under 5 Years | 0 (0.0%) | 0 (0.0%) |
| 5 to 17 Years | 0 (0.0%) | 0 (0.0%) |
| 18 to 34 Years | 0 (0.0%) | 0 (0.0%) |
| 35 to 64 Years | 0 (0.0%) | 0 (0.0%) |
| 65 to 74 Years | 0 (0.0%) | 0 (0.0%) |
| 75 Years and over | 0 (0.0%) | 0 (0.0%) |
Disability Class: Vision Difficulty
| Age Bracket | Male | Female |
| Under 5 Years | 0 (0.0%) | 0 (0.0%) |
| 5 to 17 Years | 0 (0.0%) | 0 (0.0%) |
| 18 to 34 Years | 0 (0.0%) | 0 (0.0%) |
| 35 to 64 Years | 0 (0.0%) | 0 (0.0%) |
| 65 to 74 Years | 0 (0.0%) | 0 (0.0%) |
| 75 Years and over | 0 (0.0%) | 0 (0.0%) |
Disability Class: Cognitive Difficulty
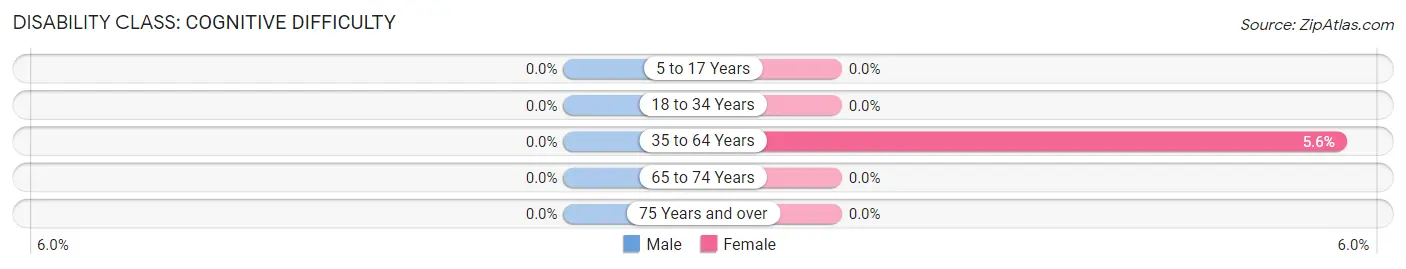
| Age Bracket | Male | Female |
| 5 to 17 Years | 0 (0.0%) | 0 (0.0%) |
| 18 to 34 Years | 0 (0.0%) | 0 (0.0%) |
| 35 to 64 Years | 0 (0.0%) | 5 (5.6%) |
| 65 to 74 Years | 0 (0.0%) | 0 (0.0%) |
| 75 Years and over | 0 (0.0%) | 0 (0.0%) |
Disability Class: Ambulatory Difficulty
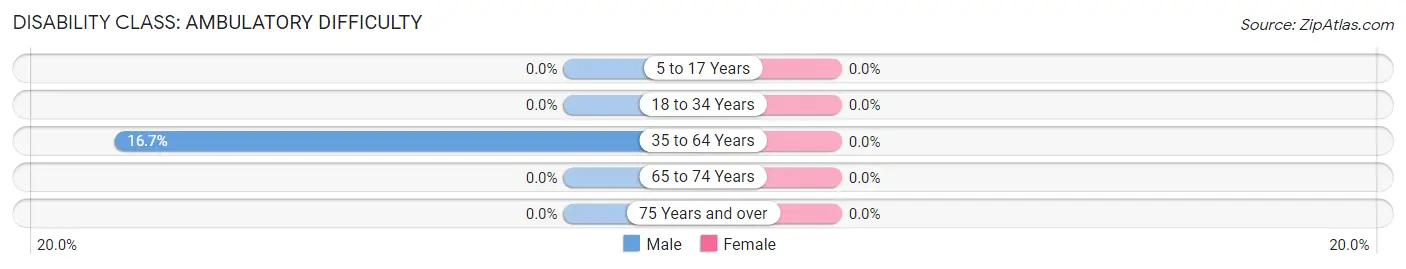
| Age Bracket | Male | Female |
| 5 to 17 Years | 0 (0.0%) | 0 (0.0%) |
| 18 to 34 Years | 0 (0.0%) | 0 (0.0%) |
| 35 to 64 Years | 17 (16.7%) | 0 (0.0%) |
| 65 to 74 Years | 0 (0.0%) | 0 (0.0%) |
| 75 Years and over | 0 (0.0%) | 0 (0.0%) |
Disability Class: Self-Care Difficulty
| Age Bracket | Male | Female |
| 5 to 17 Years | 0 (0.0%) | 0 (0.0%) |
| 18 to 34 Years | 0 (0.0%) | 0 (0.0%) |
| 35 to 64 Years | 0 (0.0%) | 0 (0.0%) |
| 65 to 74 Years | 0 (0.0%) | 0 (0.0%) |
| 75 Years and over | 0 (0.0%) | 0 (0.0%) |
Technology Access in Cantua Creek
Computing Device Access in Cantua Creek
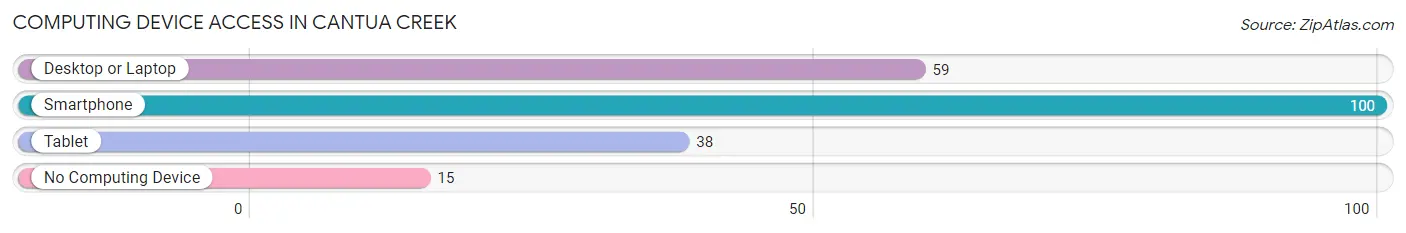
| Device Type | # Households | % Households |
| Desktop or Laptop | 59 | 51.3% |
| Smartphone | 100 | 87.0% |
| Tablet | 38 | 33.0% |
| No Computing Device | 15 | 13.0% |
| Total | 115 | 100.0% |
Internet Access in Cantua Creek
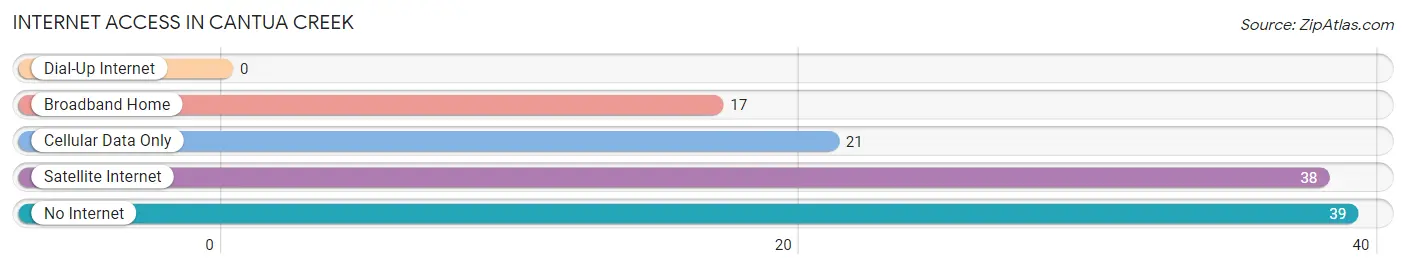
| Internet Type | # Households | % Households |
| Dial-Up Internet | 0 | 0.0% |
| Broadband Home | 17 | 14.8% |
| Cellular Data Only | 21 | 18.3% |
| Satellite Internet | 38 | 33.0% |
| No Internet | 39 | 33.9% |
| Total | 115 | 100.0% |
Cantua Creek Summary
Cantua Creek is a small unincorporated community located in Fresno County, California. It is situated in the San Joaquin Valley, approximately 25 miles west of Fresno. The population of Cantua Creek was estimated to be around 1,000 in 2020.
History
Cantua Creek was originally inhabited by the Yokuts Indians, who were the first people to settle in the area. The Yokuts were a semi-nomadic tribe that lived in the San Joaquin Valley and surrounding areas. They were known for their basket weaving and other crafts.
In the late 1800s, the area was settled by Mexican and American settlers. The first post office in Cantua Creek was established in 1891. The town was named after the nearby Cantua Creek, which was named after a local Indian chief.
In the early 1900s, Cantua Creek was a thriving agricultural community. The town was home to several farms, ranches, and dairies. The town also had a general store, a blacksmith shop, and a school.
Geography
Cantua Creek is located in the San Joaquin Valley, approximately 25 miles west of Fresno. The town is situated at an elevation of approximately 300 feet above sea level. The climate in Cantua Creek is hot and dry in the summer, and mild and wet in the winter.
The town is surrounded by rolling hills and farmland. The nearby Cantua Creek flows through the area, providing a source of water for the local farms and ranches.
Economy
The economy of Cantua Creek is largely based on agriculture. The town is home to several farms and ranches, which produce a variety of crops, including grapes, almonds, and cotton. The town also has a few small businesses, including a general store and a gas station.
Demographics
As of 2020, the population of Cantua Creek was estimated to be around 1,000. The town is predominantly Hispanic, with a large percentage of the population being of Mexican descent. The median household income in Cantua Creek is approximately $30,000.
Conclusion
Cantua Creek is a small unincorporated community located in Fresno County, California. It is situated in the San Joaquin Valley, approximately 25 miles west of Fresno. The town is home to several farms and ranches, which produce a variety of crops. The population of Cantua Creek is predominantly Hispanic, with a large percentage of the population being of Mexican descent. The median household income in Cantua Creek is approximately $30,000.
Common Questions
What is Per Capita Income in Cantua Creek?
Per Capita income in Cantua Creek is $11,780.
What is the Median Family Income in Cantua Creek?
Median Family Income in Cantua Creek is $41,306.
What is the Median Household income in Cantua Creek?
Median Household Income in Cantua Creek is $41,306.
What is Family Income Deficit in Cantua Creek?
Family Income Deficit in Cantua Creek is $6,773.
Families that are below poverty line in Cantua Creek earn $6,773 less on average than the poverty threshold level.
What is Inequality or Gini Index in Cantua Creek?
Inequality or Gini Index in Cantua Creek is 0.35.
What is the Total Population of Cantua Creek?
Total Population of Cantua Creek is 522.
What is the Total Male Population of Cantua Creek?
Total Male Population of Cantua Creek is 235.
What is the Total Female Population of Cantua Creek?
Total Female Population of Cantua Creek is 287.
What is the Ratio of Males per 100 Females in Cantua Creek?
There are 81.88 Males per 100 Females in Cantua Creek.
What is the Ratio of Females per 100 Males in Cantua Creek?
There are 122.13 Females per 100 Males in Cantua Creek.
What is the Median Population Age in Cantua Creek?
Median Population Age in Cantua Creek is 21.9 Years.
What is the Average Family Size in Cantua Creek
Average Family Size in Cantua Creek is 4.3 People.
What is the Average Household Size in Cantua Creek
Average Household Size in Cantua Creek is 4.3 People.
How Large is the Labor Force in Cantua Creek?
There are 154 People in the Labor Forcein in Cantua Creek.
What is the Percentage of People in the Labor Force in Cantua Creek?
48.4% of People are in the Labor Force in Cantua Creek.