San Lucas, CA Map & Demographics
San Lucas Map
San Lucas Overview
$12,468
PER CAPITA INCOME
$64,250
AVG FAMILY INCOME
$64,750
AVG HOUSEHOLD INCOME
30.7%
WAGE / INCOME GAP [ % ]
69.3¢/ $1
WAGE / INCOME GAP [ $ ]
0.26
INEQUALITY / GINI INDEX
377
TOTAL POPULATION
175
MALE POPULATION
202
FEMALE POPULATION
86.63
MALES / 100 FEMALES
115.43
FEMALES / 100 MALES
19.8
MEDIAN AGE
6.0
AVG FAMILY SIZE
6.0
AVG HOUSEHOLD SIZE
126
LABOR FORCE [ PEOPLE ]
57.8%
PERCENT IN LABOR FORCE
San Lucas Zip Codes
Income in San Lucas
Income Overview in San Lucas
Per Capita Income in San Lucas is $12,468, while median incomes of families and households are $64,250 and $64,750 respectively.
| Characteristic | Number | Measure |
| Per Capita Income | 377 | $12,468 |
| Median Family Income | 61 | $64,250 |
| Mean Family Income | 61 | $68,807 |
| Median Household Income | 63 | $64,750 |
| Mean Household Income | 63 | $73,744 |
| Income Deficit | 61 | $0 |
| Wage / Income Gap (%) | 377 | 30.73% |
| Wage / Income Gap ($) | 377 | 69.27¢ per $1 |
| Gini / Inequality Index | 377 | 0.26 |
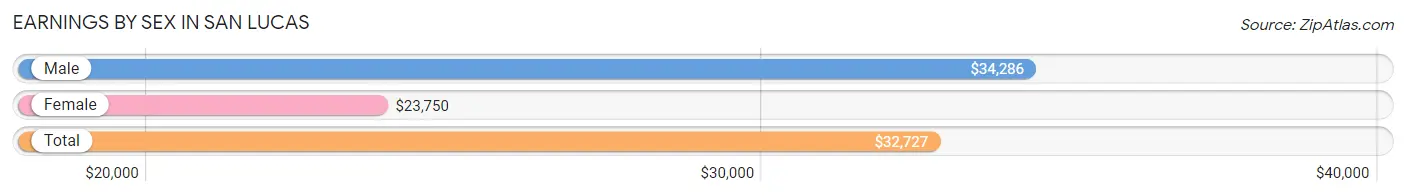
Earnings by Sex in San Lucas
Average Earnings in San Lucas are $32,727, $34,286 for men and $23,750 for women, a difference of 30.7%.
| Sex | Number | Average Earnings |
| Male | 90 (71.4%) | $34,286 |
| Female | 36 (28.6%) | $23,750 |
| Total | 126 (100.0%) | $32,727 |
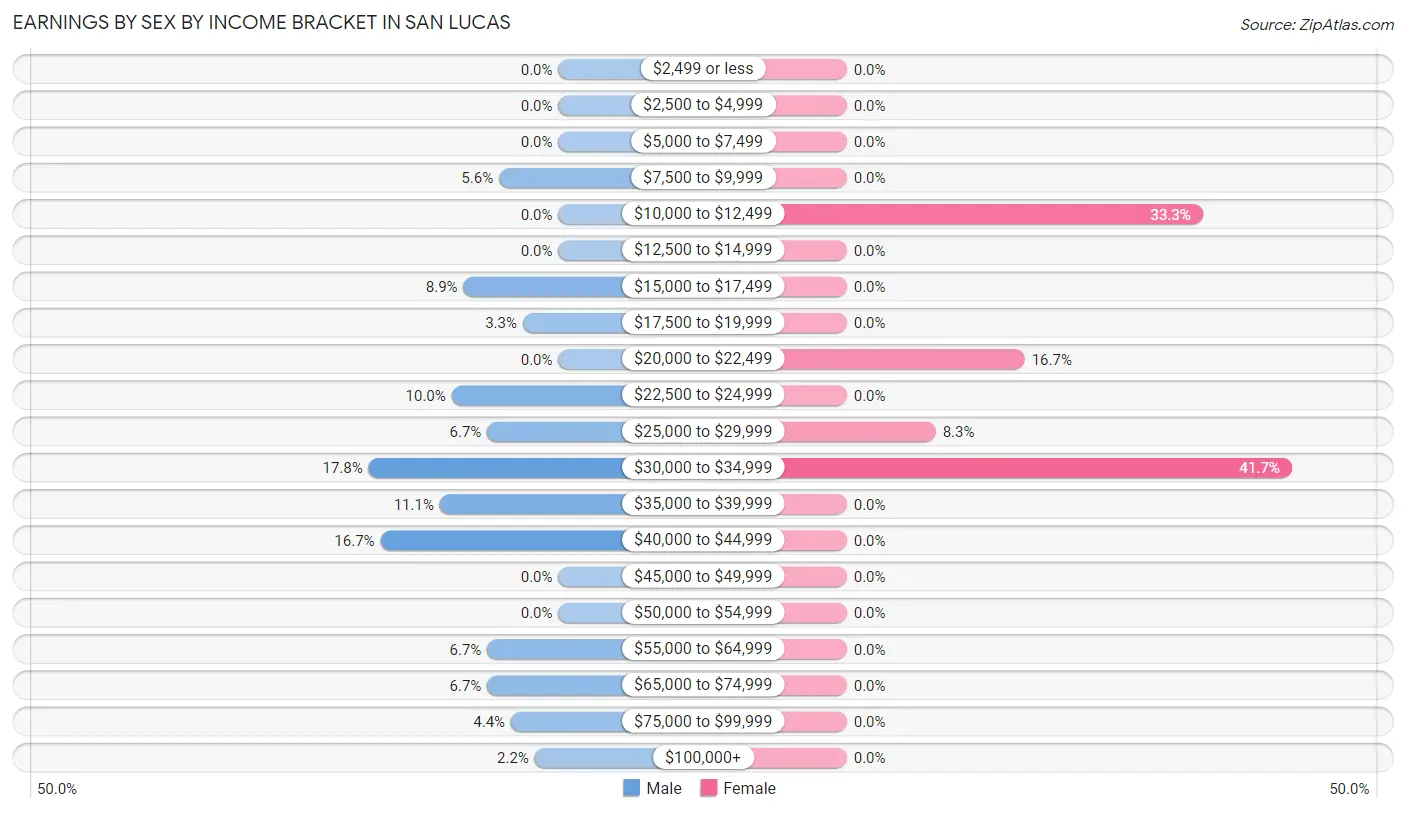
Earnings by Sex by Income Bracket in San Lucas
The most common earnings brackets in San Lucas are $30,000 to $34,999 for men (16 | 17.8%) and $30,000 to $34,999 for women (15 | 41.7%).
| Income | Male | Female |
| $2,499 or less | 0 (0.0%) | 0 (0.0%) |
| $2,500 to $4,999 | 0 (0.0%) | 0 (0.0%) |
| $5,000 to $7,499 | 0 (0.0%) | 0 (0.0%) |
| $7,500 to $9,999 | 5 (5.6%) | 0 (0.0%) |
| $10,000 to $12,499 | 0 (0.0%) | 12 (33.3%) |
| $12,500 to $14,999 | 0 (0.0%) | 0 (0.0%) |
| $15,000 to $17,499 | 8 (8.9%) | 0 (0.0%) |
| $17,500 to $19,999 | 3 (3.3%) | 0 (0.0%) |
| $20,000 to $22,499 | 0 (0.0%) | 6 (16.7%) |
| $22,500 to $24,999 | 9 (10.0%) | 0 (0.0%) |
| $25,000 to $29,999 | 6 (6.7%) | 3 (8.3%) |
| $30,000 to $34,999 | 16 (17.8%) | 15 (41.7%) |
| $35,000 to $39,999 | 10 (11.1%) | 0 (0.0%) |
| $40,000 to $44,999 | 15 (16.7%) | 0 (0.0%) |
| $45,000 to $49,999 | 0 (0.0%) | 0 (0.0%) |
| $50,000 to $54,999 | 0 (0.0%) | 0 (0.0%) |
| $55,000 to $64,999 | 6 (6.7%) | 0 (0.0%) |
| $65,000 to $74,999 | 6 (6.7%) | 0 (0.0%) |
| $75,000 to $99,999 | 4 (4.4%) | 0 (0.0%) |
| $100,000+ | 2 (2.2%) | 0 (0.0%) |
| Total | 90 (100.0%) | 36 (100.0%) |
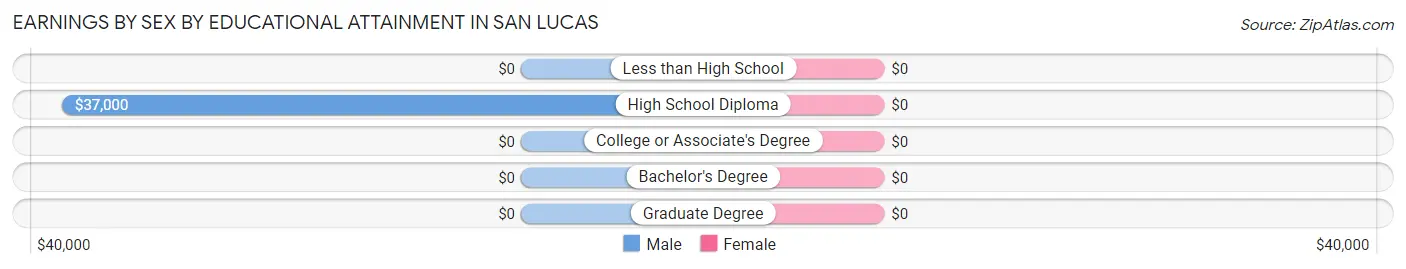
Earnings by Sex by Educational Attainment in San Lucas
| Educational Attainment | Male Income | Female Income |
| Less than High School | - | - |
| High School Diploma | $37,000 | $0 |
| College or Associate's Degree | - | - |
| Bachelor's Degree | - | - |
| Graduate Degree | - | - |
| Total | $36,125 | $32,583 |
Family Income in San Lucas
Family Income Brackets in San Lucas
According to the San Lucas family income data, there are 17 families falling into the $25,000 to $34,999 income range, which is the most common income bracket and makes up 27.9% of all families.
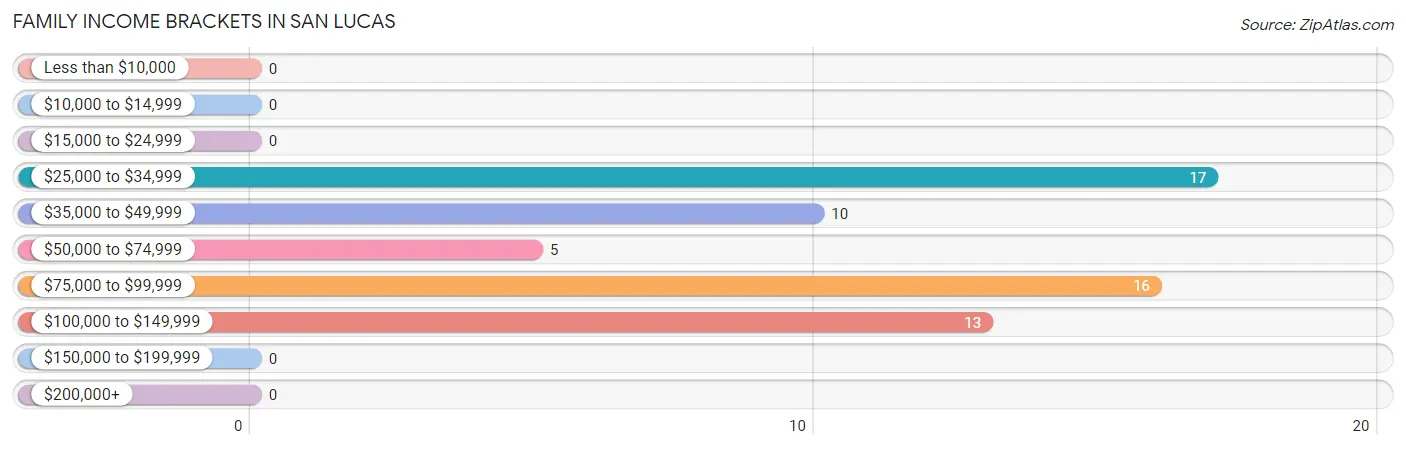
| Income Bracket | # Families | % Families |
| Less than $10,000 | 0 | 0.0% |
| $10,000 to $14,999 | 0 | 0.0% |
| $15,000 to $24,999 | 0 | 0.0% |
| $25,000 to $34,999 | 17 | 27.9% |
| $35,000 to $49,999 | 10 | 16.4% |
| $50,000 to $74,999 | 5 | 8.2% |
| $75,000 to $99,999 | 16 | 26.2% |
| $100,000 to $149,999 | 13 | 21.3% |
| $150,000 to $199,999 | 0 | 0.0% |
| $200,000+ | 0 | 0.0% |
Family Income by Famaliy Size in San Lucas
7+ person families (24 | 39.3%) account for the highest median family income in San Lucas with $63,500 per family, while 7+ person families (24 | 39.3%) have the highest median income of $9,071 per family member.
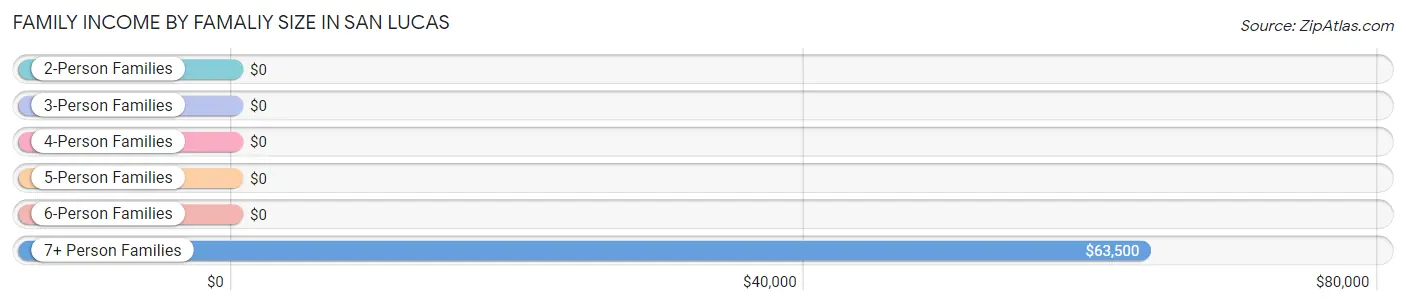
| Income Bracket | # Families | Median Income |
| 2-Person Families | 10 (16.4%) | $0 |
| 3-Person Families | 6 (9.8%) | $0 |
| 4-Person Families | 3 (4.9%) | $0 |
| 5-Person Families | 0 (0.0%) | $0 |
| 6-Person Families | 18 (29.5%) | $0 |
| 7+ Person Families | 24 (39.3%) | $63,500 |
| Total | 61 (100.0%) | $64,250 |
Family Income by Number of Earners in San Lucas
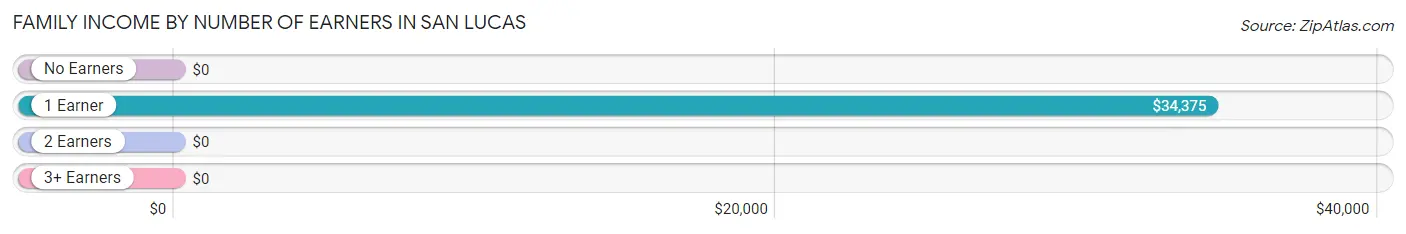
| Number of Earners | # Families | Median Income |
| No Earners | 0 (0.0%) | $0 |
| 1 Earner | 31 (50.8%) | $34,375 |
| 2 Earners | 15 (24.6%) | $0 |
| 3+ Earners | 15 (24.6%) | $0 |
| Total | 61 (100.0%) | $64,250 |
Household Income in San Lucas
Household Income Brackets in San Lucas
With 16 households falling in the category, the $75,000 to $99,999 income range is the most frequent in San Lucas, accounting for 25.4% of all households.
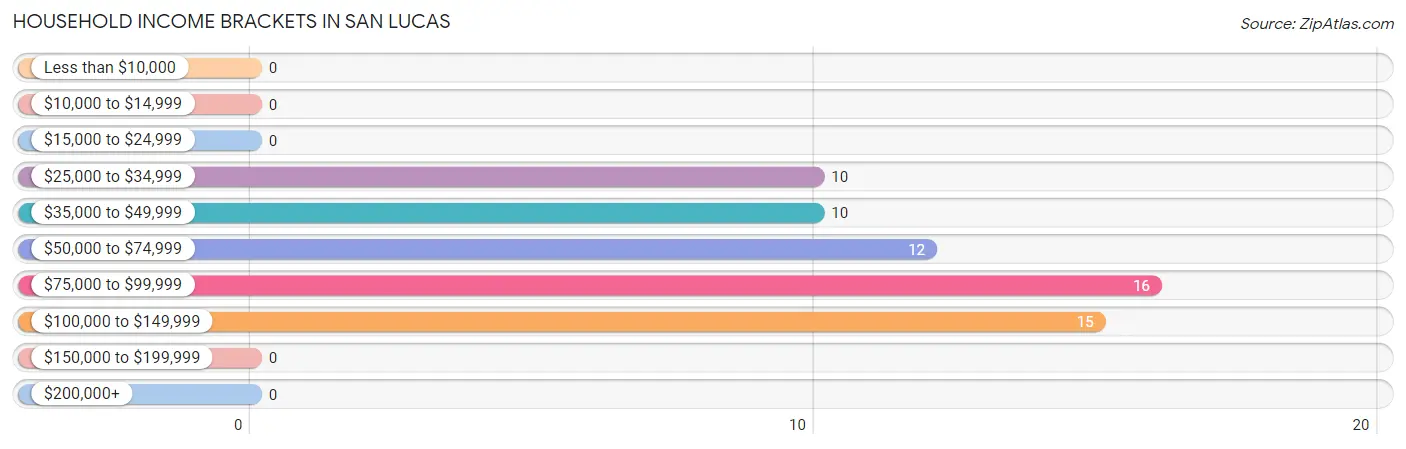
| Income Bracket | # Households | % Households |
| Less than $10,000 | 0 | 0.0% |
| $10,000 to $14,999 | 0 | 0.0% |
| $15,000 to $24,999 | 0 | 0.0% |
| $25,000 to $34,999 | 10 | 15.9% |
| $35,000 to $49,999 | 10 | 15.9% |
| $50,000 to $74,999 | 12 | 19.0% |
| $75,000 to $99,999 | 16 | 25.4% |
| $100,000 to $149,999 | 15 | 23.8% |
| $150,000 to $199,999 | 0 | 0.0% |
| $200,000+ | 0 | 0.0% |
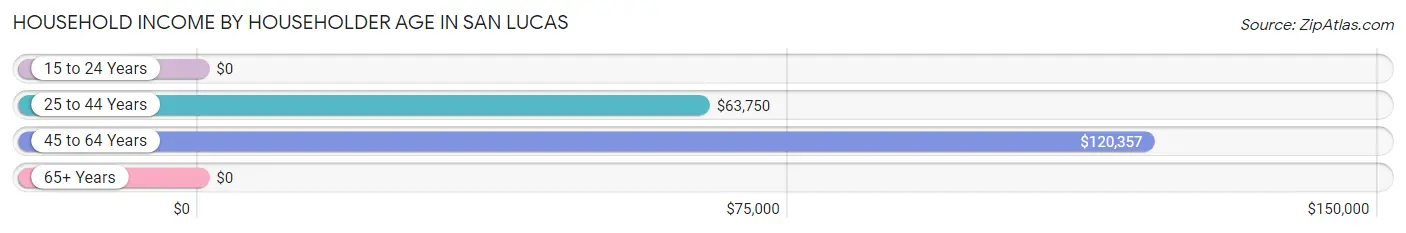
Household Income by Householder Age in San Lucas
The median household income in San Lucas is $64,750, with the highest median household income of $120,357 found in the 45 to 64 years age bracket for the primary householder. A total of 28 households (44.4%) fall into this category.
| Income Bracket | # Households | Median Income |
| 15 to 24 Years | 0 (0.0%) | $0 |
| 25 to 44 Years | 31 (49.2%) | $63,750 |
| 45 to 64 Years | 28 (44.4%) | $120,357 |
| 65+ Years | 4 (6.4%) | $0 |
| Total | 63 (100.0%) | $64,750 |
Poverty in San Lucas
Income Below Poverty by Sex and Age in San Lucas
With 14.3% poverty level for males and 25.3% for females among the residents of San Lucas, 65 to 74 year old males and 18 to 24 year old females are the most vulnerable to poverty, with 8 males (100.0%) and 11 females (50.0%) in their respective age groups living below the poverty level.
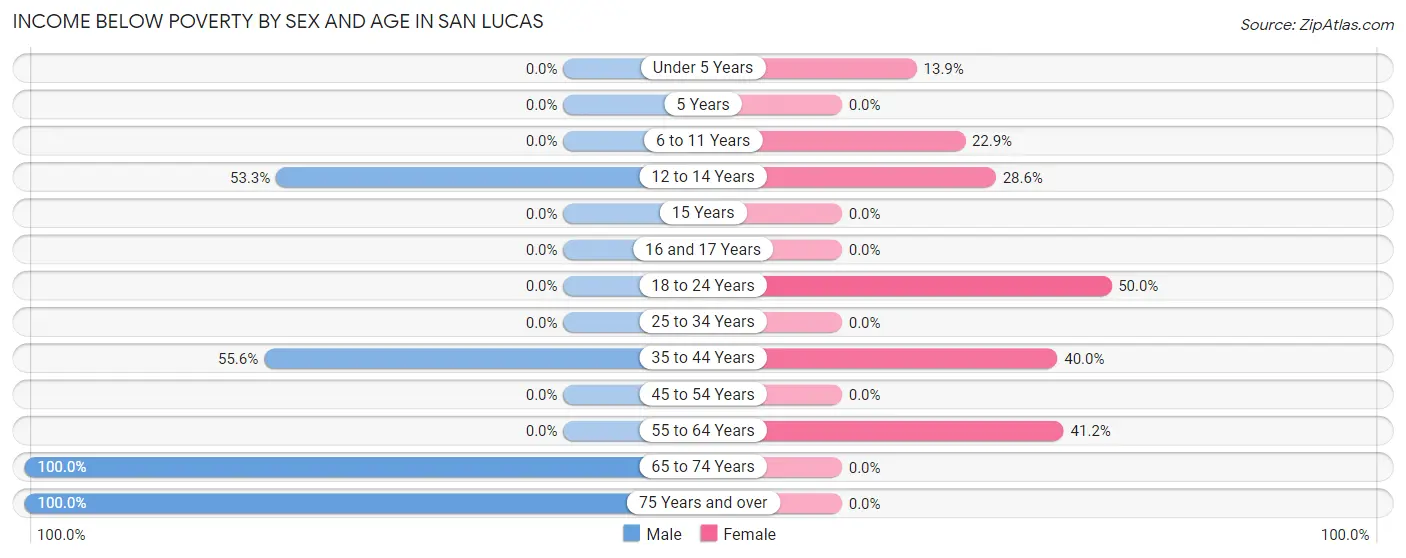
| Age Bracket | Male | Female |
| Under 5 Years | 0 (0.0%) | 5 (13.9%) |
| 5 Years | 0 (0.0%) | 0 (0.0%) |
| 6 to 11 Years | 0 (0.0%) | 8 (22.9%) |
| 12 to 14 Years | 8 (53.3%) | 8 (28.6%) |
| 15 Years | 0 (0.0%) | 0 (0.0%) |
| 16 and 17 Years | 0 (0.0%) | 0 (0.0%) |
| 18 to 24 Years | 0 (0.0%) | 11 (50.0%) |
| 25 to 34 Years | 0 (0.0%) | 0 (0.0%) |
| 35 to 44 Years | 5 (55.6%) | 12 (40.0%) |
| 45 to 54 Years | 0 (0.0%) | 0 (0.0%) |
| 55 to 64 Years | 0 (0.0%) | 7 (41.2%) |
| 65 to 74 Years | 8 (100.0%) | 0 (0.0%) |
| 75 Years and over | 4 (100.0%) | 0 (0.0%) |
| Total | 25 (14.3%) | 51 (25.3%) |
Income Above Poverty by Sex and Age in San Lucas
According to the poverty statistics in San Lucas, males aged 6 to 11 years and females aged 16 and 17 years are the age groups that are most secure financially, with 100.0% of males and 100.0% of females in these age groups living above the poverty line.
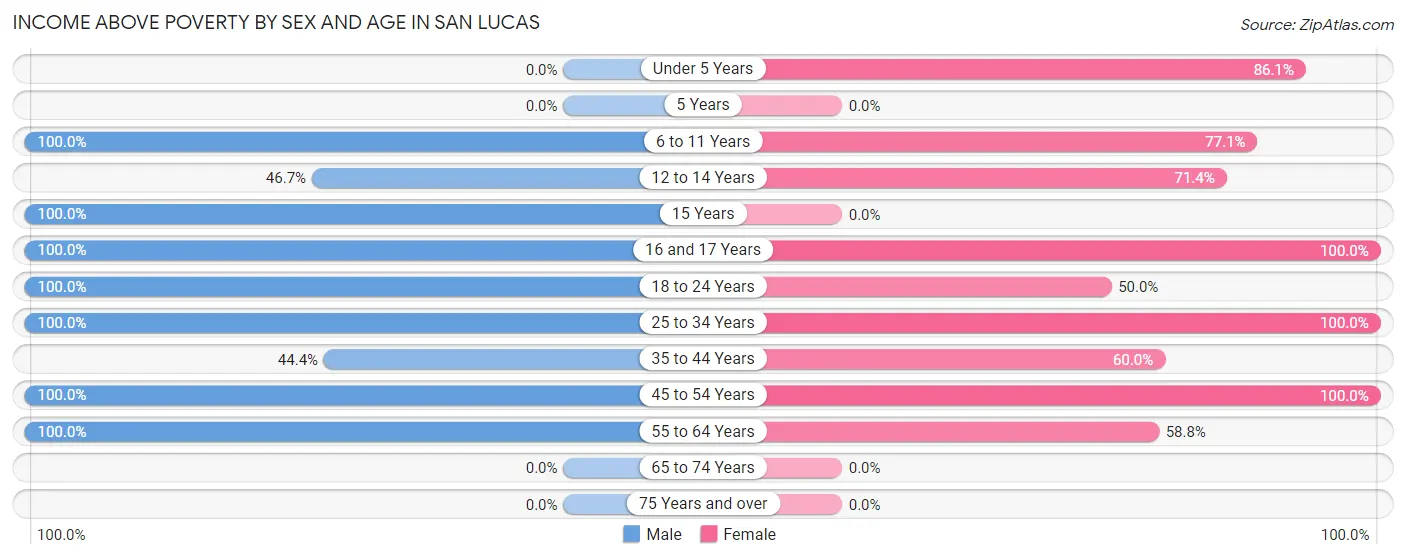
| Age Bracket | Male | Female |
| Under 5 Years | 0 (0.0%) | 31 (86.1%) |
| 5 Years | 0 (0.0%) | 0 (0.0%) |
| 6 to 11 Years | 41 (100.0%) | 27 (77.1%) |
| 12 to 14 Years | 7 (46.7%) | 20 (71.4%) |
| 15 Years | 4 (100.0%) | 0 (0.0%) |
| 16 and 17 Years | 10 (100.0%) | 5 (100.0%) |
| 18 to 24 Years | 13 (100.0%) | 11 (50.0%) |
| 25 to 34 Years | 33 (100.0%) | 20 (100.0%) |
| 35 to 44 Years | 4 (44.4%) | 18 (60.0%) |
| 45 to 54 Years | 19 (100.0%) | 9 (100.0%) |
| 55 to 64 Years | 19 (100.0%) | 10 (58.8%) |
| 65 to 74 Years | 0 (0.0%) | 0 (0.0%) |
| 75 Years and over | 0 (0.0%) | 0 (0.0%) |
| Total | 150 (85.7%) | 151 (74.8%) |
Income Below Poverty Among Married-Couple Families in San Lucas
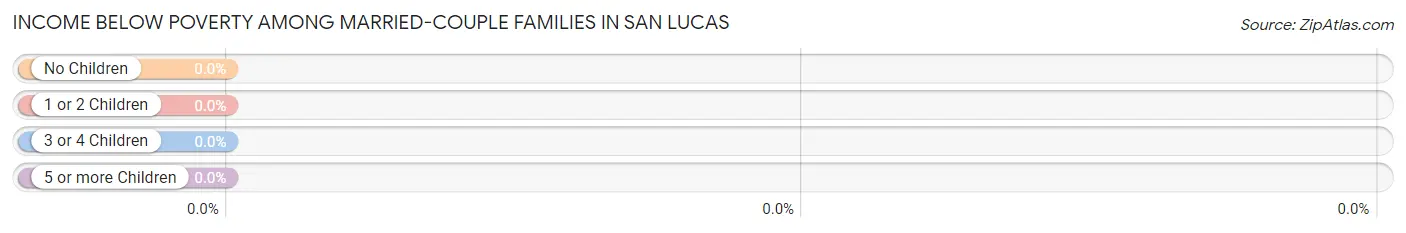
| Children | Above Poverty | Below Poverty |
| No Children | 0 (0.0%) | 0 (0.0%) |
| 1 or 2 Children | 7 (100.0%) | 0 (0.0%) |
| 3 or 4 Children | 10 (100.0%) | 0 (0.0%) |
| 5 or more Children | 9 (100.0%) | 0 (0.0%) |
| Total | 26 (100.0%) | 0 (0.0%) |
Income Below Poverty Among Single-Parent Households in San Lucas
According to the poverty data in San Lucas, 28.6% or 4 single-father households and 33.3% or 7 single-mother households are living below the poverty line. Among single-father households, those with 1 or 2 children have the highest poverty rate, with 4 households (50.0%) experiencing poverty. Likewise, among single-mother households, those with 3 or 4 children have the highest poverty rate, with 7 households (58.3%) falling below the poverty line.
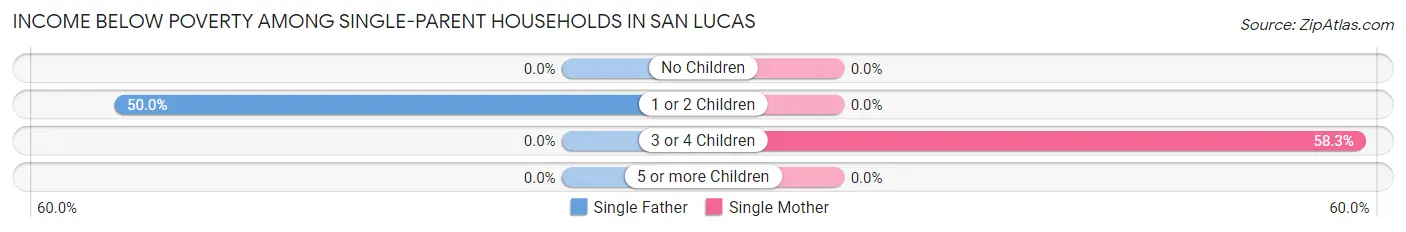
| Children | Single Father | Single Mother |
| No Children | 0 (0.0%) | 0 (0.0%) |
| 1 or 2 Children | 4 (50.0%) | 0 (0.0%) |
| 3 or 4 Children | 0 (0.0%) | 7 (58.3%) |
| 5 or more Children | 0 (0.0%) | 0 (0.0%) |
| Total | 4 (28.6%) | 7 (33.3%) |
Income Below Poverty Among Married-Couple vs Single-Parent Households in San Lucas
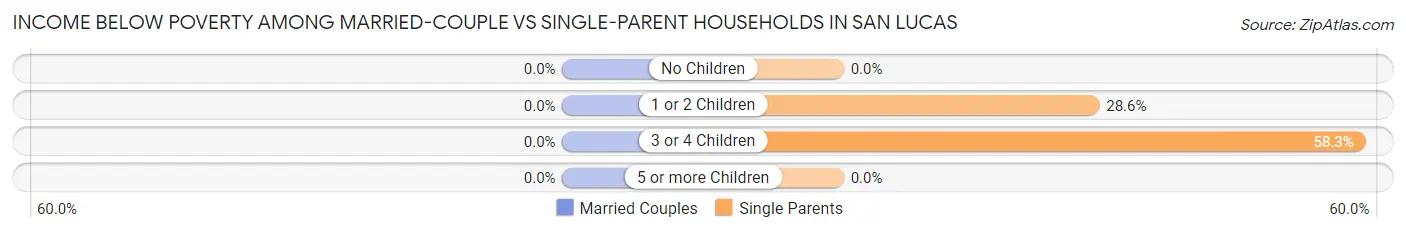
| Children | Married-Couple Families | Single-Parent Households |
| No Children | 0 (0.0%) | 0 (0.0%) |
| 1 or 2 Children | 0 (0.0%) | 4 (28.6%) |
| 3 or 4 Children | 0 (0.0%) | 7 (58.3%) |
| 5 or more Children | 0 (0.0%) | 0 (0.0%) |
| Total | 0 (0.0%) | 11 (31.4%) |
Race in San Lucas
The most populous races in San Lucas are Hispanic or Latino (377 | 100.0%), Some other Race (369 | 97.9%), and White / Caucasian (8 | 2.1%).
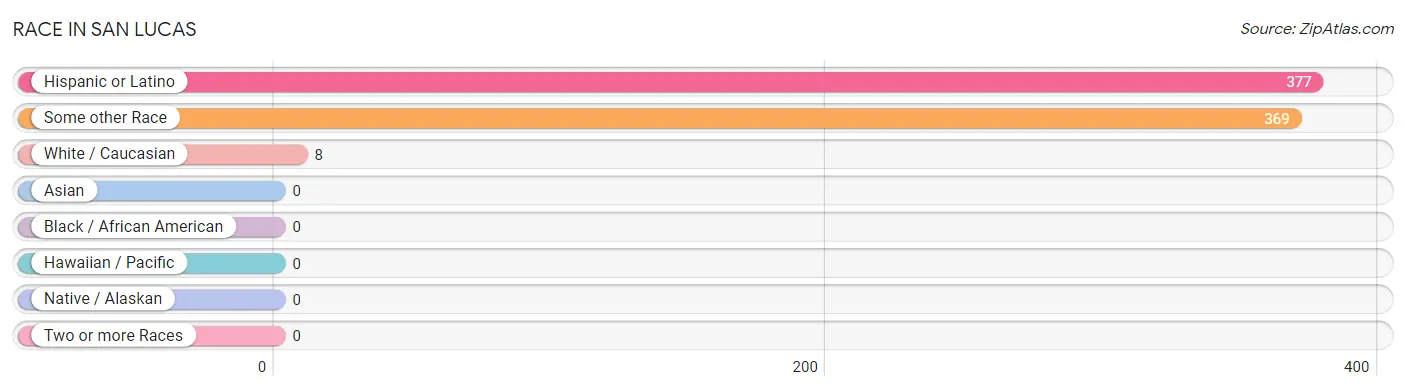
| Race | # Population | % Population |
| Asian | 0 | 0.0% |
| Black / African American | 0 | 0.0% |
| Hawaiian / Pacific | 0 | 0.0% |
| Hispanic or Latino | 377 | 100.0% |
| Native / Alaskan | 0 | 0.0% |
| White / Caucasian | 8 | 2.1% |
| Two or more Races | 0 | 0.0% |
| Some other Race | 369 | 97.9% |
| Total | 377 | 100.0% |
Ancestry in San Lucas
The most populous ancestries reported in San Lucas are , and Mexican (377 | 100.0%), together accounting for 100.0% of all San Lucas residents.

| Ancestry | # Population | % Population |
| Mexican | 377 | 100.0% | View All 1 Rows |
Immigrants in San Lucas
The most numerous immigrant groups reported in San Lucas came from Central America (118 | 31.3%), Latin America (118 | 31.3%), and Mexico (118 | 31.3%), together accounting for 93.9% of all San Lucas residents.
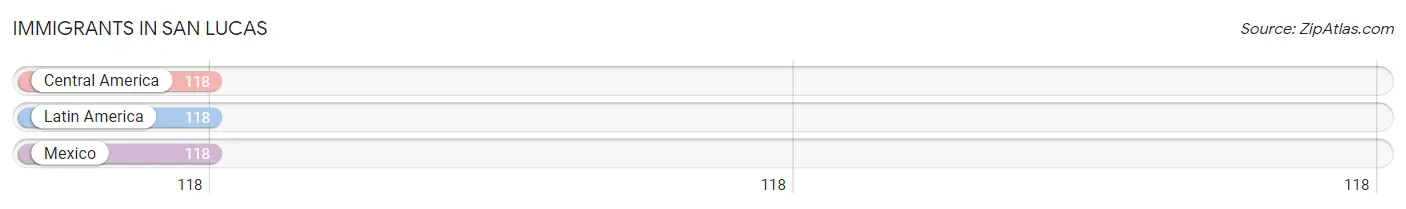
| Immigration Origin | # Population | % Population |
| Central America | 118 | 31.3% |
| Latin America | 118 | 31.3% |
| Mexico | 118 | 31.3% | View All 3 Rows |
Sex and Age in San Lucas
Sex and Age in San Lucas
The most populous age groups in San Lucas are 10 to 14 Years (40 | 22.9%) for men and Under 5 Years (36 | 17.8%) for women.
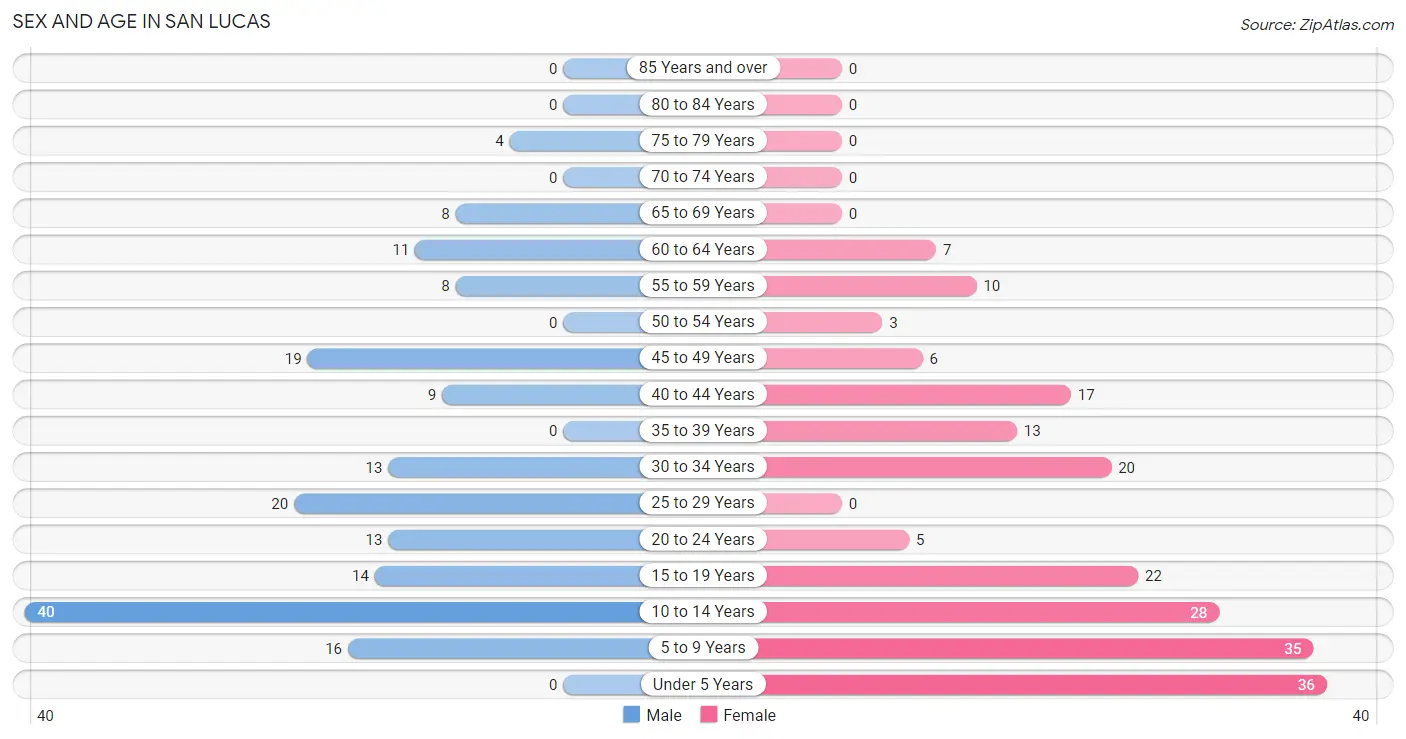
| Age Bracket | Male | Female |
| Under 5 Years | 0 (0.0%) | 36 (17.8%) |
| 5 to 9 Years | 16 (9.1%) | 35 (17.3%) |
| 10 to 14 Years | 40 (22.9%) | 28 (13.9%) |
| 15 to 19 Years | 14 (8.0%) | 22 (10.9%) |
| 20 to 24 Years | 13 (7.4%) | 5 (2.5%) |
| 25 to 29 Years | 20 (11.4%) | 0 (0.0%) |
| 30 to 34 Years | 13 (7.4%) | 20 (9.9%) |
| 35 to 39 Years | 0 (0.0%) | 13 (6.4%) |
| 40 to 44 Years | 9 (5.1%) | 17 (8.4%) |
| 45 to 49 Years | 19 (10.9%) | 6 (3.0%) |
| 50 to 54 Years | 0 (0.0%) | 3 (1.5%) |
| 55 to 59 Years | 8 (4.6%) | 10 (5.0%) |
| 60 to 64 Years | 11 (6.3%) | 7 (3.5%) |
| 65 to 69 Years | 8 (4.6%) | 0 (0.0%) |
| 70 to 74 Years | 0 (0.0%) | 0 (0.0%) |
| 75 to 79 Years | 4 (2.3%) | 0 (0.0%) |
| 80 to 84 Years | 0 (0.0%) | 0 (0.0%) |
| 85 Years and over | 0 (0.0%) | 0 (0.0%) |
| Total | 175 (100.0%) | 202 (100.0%) |
Families and Households in San Lucas
Median Family Size in San Lucas
The median family size in San Lucas is 6.00 persons per family, with married-couple families (26 | 42.6%) accounting for the largest median family size of 7.5 persons per family. On the other hand, single male/father families (14 | 23.0%) represent the smallest median family size with 3.57 persons per family.
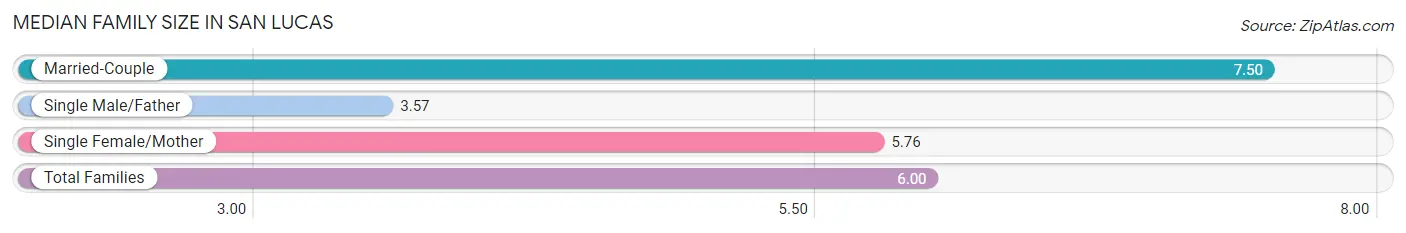
| Family Type | # Families | Family Size |
| Married-Couple | 26 (42.6%) | 7.50 |
| Single Male/Father | 14 (23.0%) | 3.57 |
| Single Female/Mother | 21 (34.4%) | 5.76 |
| Total Families | 61 (100.0%) | 6.00 |
Median Household Size in San Lucas
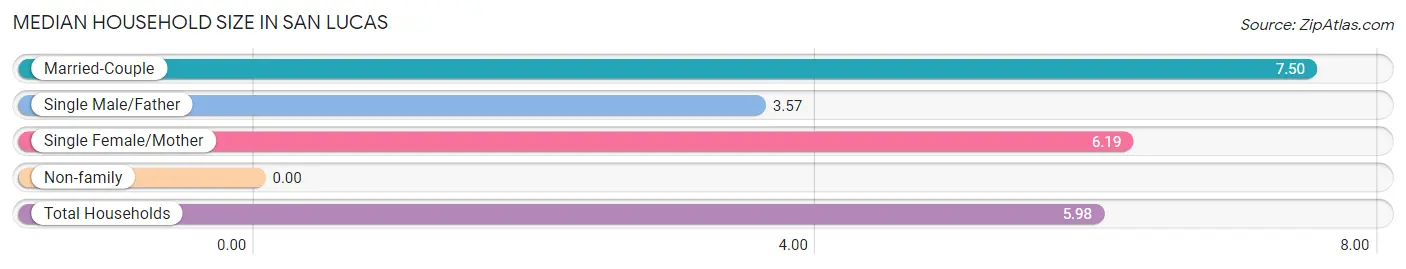
| Household Type | # Households | Household Size |
| Married-Couple | 26 (41.3%) | 7.50 |
| Single Male/Father | 14 (22.2%) | 3.57 |
| Single Female/Mother | 21 (33.3%) | 6.19 |
| Non-family | 2 (3.2%) | - |
| Total Households | 63 (100.0%) | 5.98 |
Household Size by Marriage Status in San Lucas
Out of a total of 63 households in San Lucas, 61 (96.8%) are family households, while 2 (3.2%) are nonfamily households. The most numerous type of family households are 7+ person households, comprising 31, and the most common type of nonfamily households are 1-person households, comprising 2.
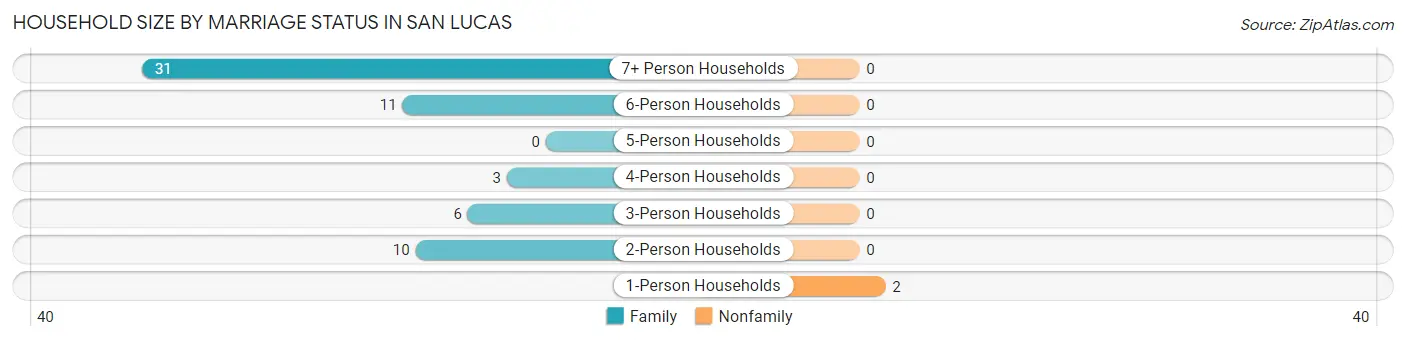
| Household Size | Family Households | Nonfamily Households |
| 1-Person Households | - | 2 (3.2%) |
| 2-Person Households | 10 (15.9%) | 0 (0.0%) |
| 3-Person Households | 6 (9.5%) | 0 (0.0%) |
| 4-Person Households | 3 (4.8%) | 0 (0.0%) |
| 5-Person Households | 0 (0.0%) | 0 (0.0%) |
| 6-Person Households | 11 (17.5%) | 0 (0.0%) |
| 7+ Person Households | 31 (49.2%) | 0 (0.0%) |
| Total | 61 (96.8%) | 2 (3.2%) |
Female Fertility in San Lucas
Fertility by Age in San Lucas
| Age Bracket | Women with Births | Births / 1,000 Women |
| 15 to 19 years | 0 (0.0%) | 0.0 |
| 20 to 34 years | 0 (0.0%) | 0.0 |
| 35 to 50 years | 0 (0.0%) | 0.0 |
| Total | 0 (0.0%) | 0.0 |
Fertility by Age by Marriage Status in San Lucas
| Age Bracket | Married | Unmarried |
| 15 to 19 years | 0 (0.0%) | 0 (0.0%) |
| 20 to 34 years | 0 (0.0%) | 0 (0.0%) |
| 35 to 50 years | 0 (0.0%) | 0 (0.0%) |
| Total | 0 (0.0%) | 0 (0.0%) |
Fertility by Education in San Lucas
| Educational Attainment | Women with Births | Births / 1,000 Women |
| Less than High School | 0 (0.0%) | 0.0 |
| High School Diploma | 0 (0.0%) | 0.0 |
| College or Associate's Degree | 0 (0.0%) | 0.0 |
| Bachelor's Degree | 0 (0.0%) | 0.0 |
| Graduate Degree | 0 (0.0%) | 0.0 |
| Total | 0 (0.0%) | 0.0 |
Fertility by Education by Marriage Status in San Lucas
| Educational Attainment | Married | Unmarried |
| Less than High School | 0 (0.0%) | 0 (0.0%) |
| High School Diploma | 0 (0.0%) | 0 (0.0%) |
| College or Associate's Degree | 0 (0.0%) | 0 (0.0%) |
| Bachelor's Degree | 0 (0.0%) | 0 (0.0%) |
| Graduate Degree | 0 (0.0%) | 0 (0.0%) |
| Total | 0 (0.0%) | 0 (0.0%) |
Employment Characteristics in San Lucas
Employment by Class of Employer in San Lucas
Among the 126 employed individuals in San Lucas, private company employees (124 | 98.4%), and self-employed (incorporated) (2 | 1.6%) make up the most common classes of employment.
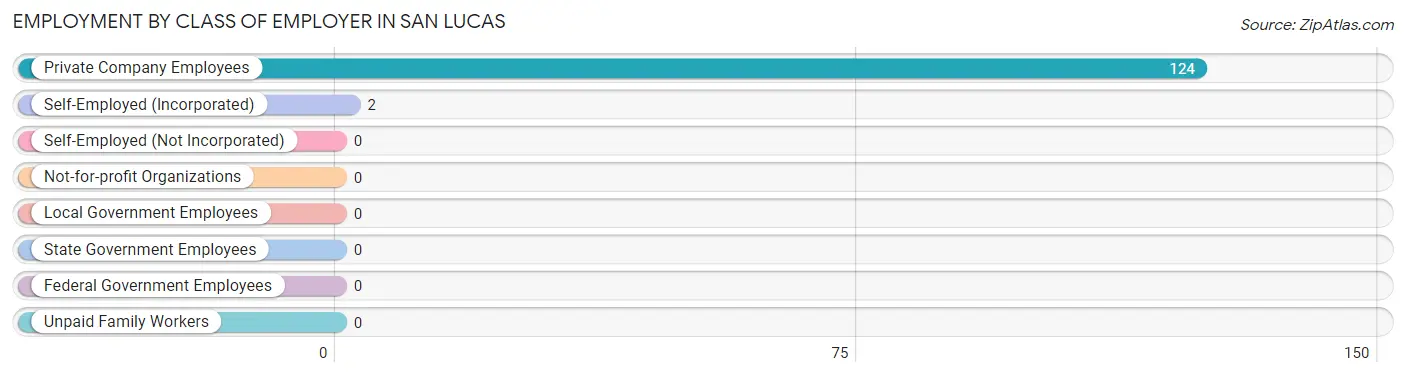
| Employer Class | # Employees | % Employees |
| Private Company Employees | 124 | 98.4% |
| Self-Employed (Incorporated) | 2 | 1.6% |
| Self-Employed (Not Incorporated) | 0 | 0.0% |
| Not-for-profit Organizations | 0 | 0.0% |
| Local Government Employees | 0 | 0.0% |
| State Government Employees | 0 | 0.0% |
| Federal Government Employees | 0 | 0.0% |
| Unpaid Family Workers | 0 | 0.0% |
| Total | 126 | 100.0% |
Employment Status by Age in San Lucas
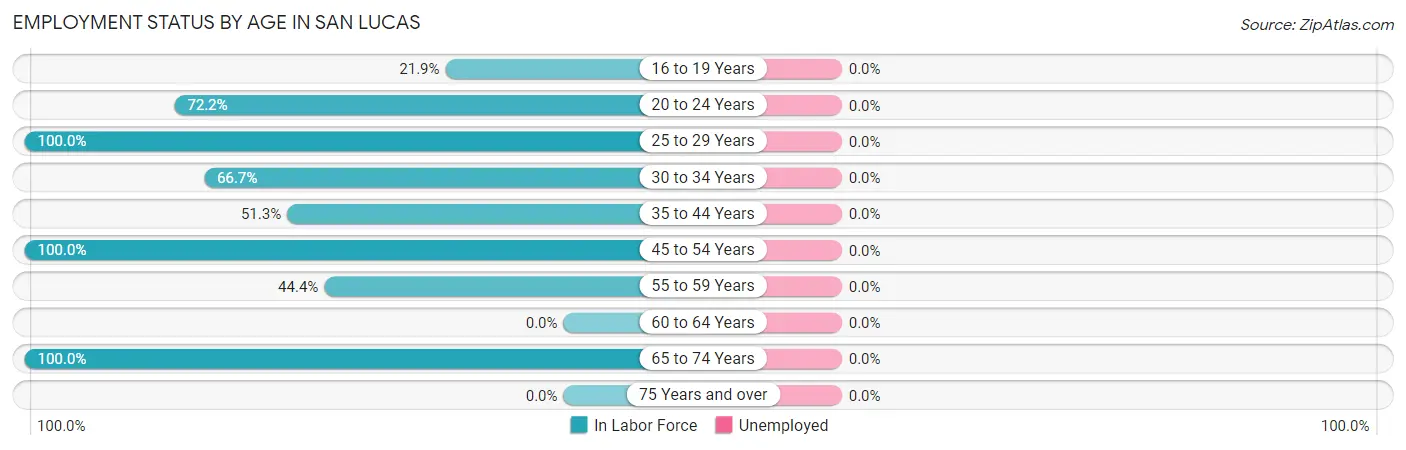
| Age Bracket | In Labor Force | Unemployed |
| 16 to 19 Years | 7 (21.9%) | 0 (0.0%) |
| 20 to 24 Years | 13 (72.2%) | 0 (0.0%) |
| 25 to 29 Years | 20 (100.0%) | 0 (0.0%) |
| 30 to 34 Years | 22 (66.7%) | 0 (0.0%) |
| 35 to 44 Years | 20 (51.3%) | 0 (0.0%) |
| 45 to 54 Years | 28 (100.0%) | 0 (0.0%) |
| 55 to 59 Years | 8 (44.4%) | 0 (0.0%) |
| 60 to 64 Years | 0 (0.0%) | 0 (0.0%) |
| 65 to 74 Years | 8 (100.0%) | 0 (0.0%) |
| 75 Years and over | 0 (0.0%) | 0 (0.0%) |
| Total | 126 (57.8%) | 0 (0.0%) |
Employment Status by Educational Attainment in San Lucas
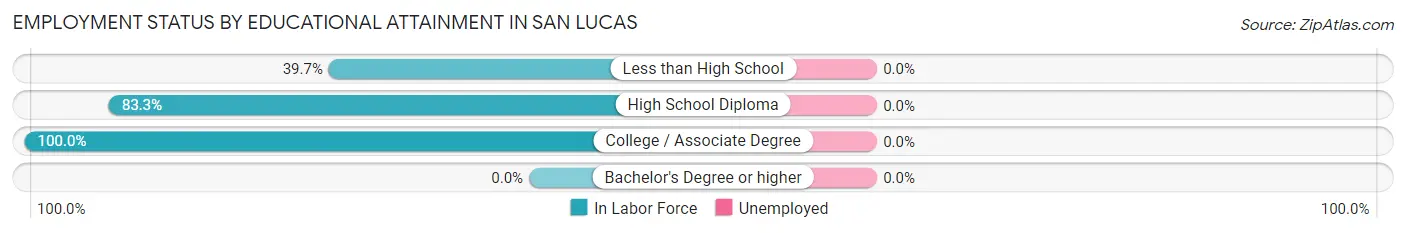
| Educational Attainment | In Labor Force | Unemployed |
| Less than High School | 31 (39.7%) | 0 (0.0%) |
| High School Diploma | 55 (83.3%) | 0 (0.0%) |
| College / Associate Degree | 12 (100.0%) | 0 (0.0%) |
| Bachelor's Degree or higher | 0 (0.0%) | 0 (0.0%) |
| Total | 98 (62.8%) | 0 (0.0%) |
Employment Occupations by Sex in San Lucas
Management, Business, Science and Arts Occupations
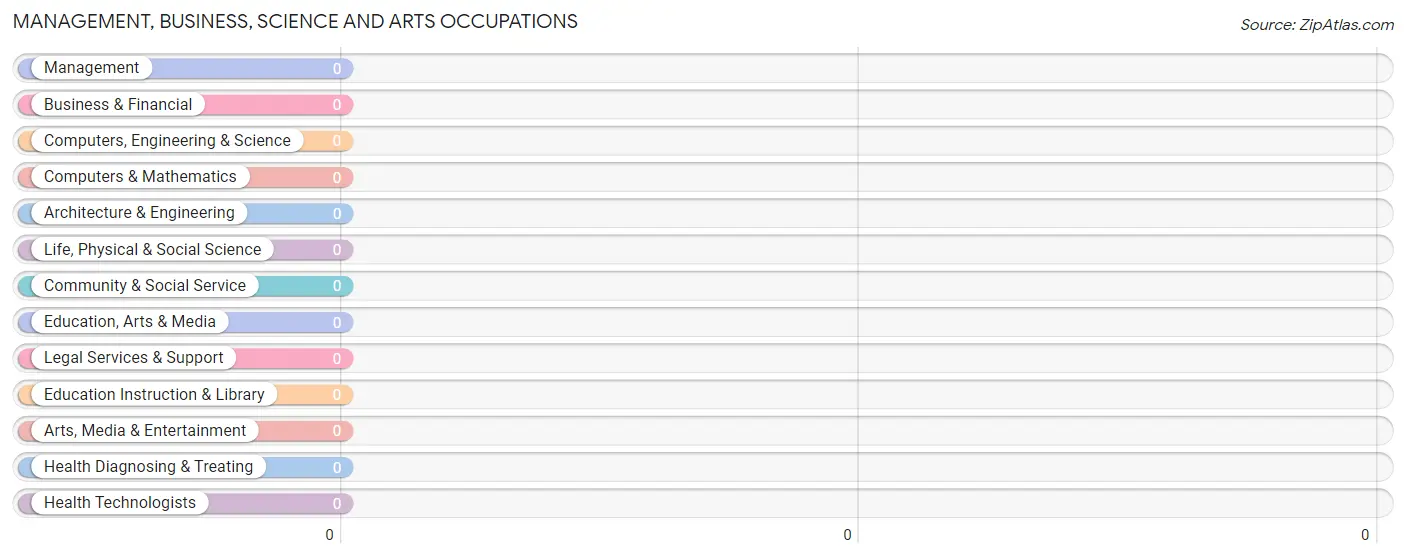
Management, Business, Science and Arts Occupations by Sex
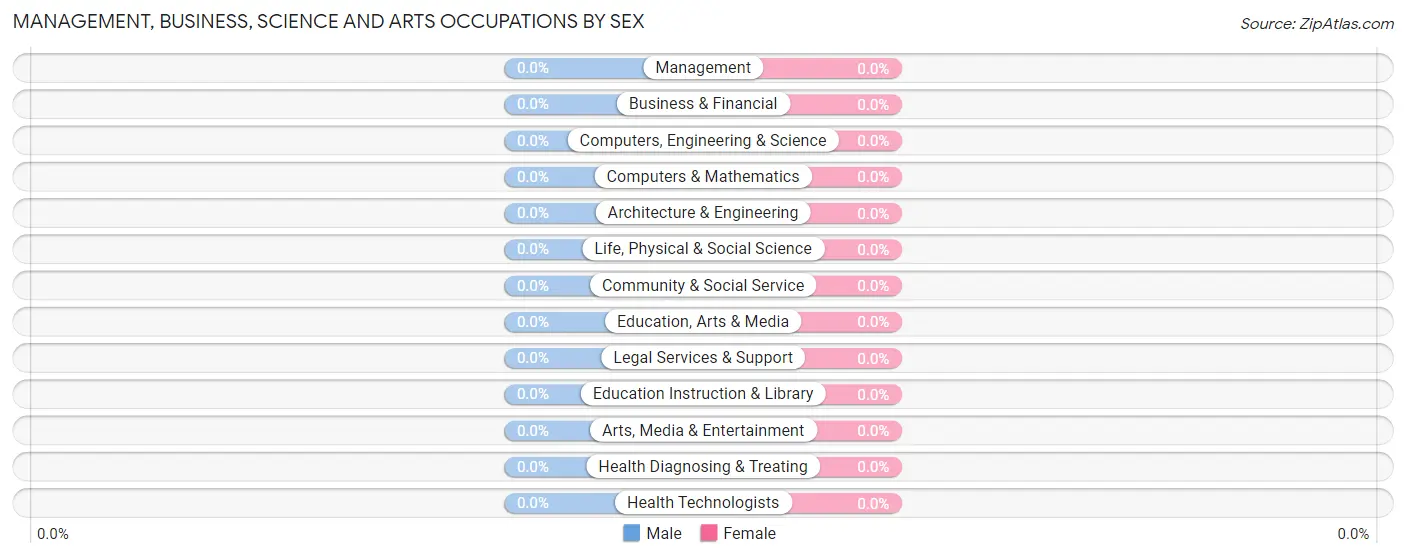
| Occupation | Male | Female |
| Management | 0 (0.0%) | 0 (0.0%) |
| Business & Financial | 0 (0.0%) | 0 (0.0%) |
| Computers, Engineering & Science | 0 (0.0%) | 0 (0.0%) |
| Computers & Mathematics | 0 (0.0%) | 0 (0.0%) |
| Architecture & Engineering | 0 (0.0%) | 0 (0.0%) |
| Life, Physical & Social Science | 0 (0.0%) | 0 (0.0%) |
| Community & Social Service | 0 (0.0%) | 0 (0.0%) |
| Education, Arts & Media | 0 (0.0%) | 0 (0.0%) |
| Legal Services & Support | 0 (0.0%) | 0 (0.0%) |
| Education Instruction & Library | 0 (0.0%) | 0 (0.0%) |
| Arts, Media & Entertainment | 0 (0.0%) | 0 (0.0%) |
| Health Diagnosing & Treating | 0 (0.0%) | 0 (0.0%) |
| Health Technologists | 0 (0.0%) | 0 (0.0%) |
| Total (Category) | 0 (0.0%) | 0 (0.0%) |
| Total (Overall) | 90 (71.4%) | 36 (28.6%) |
Services Occupations
The most common Services occupations in San Lucas are Healthcare Support (6 | 4.8%), Food Preparation & Serving (3 | 2.4%), and Cleaning & Maintenance (3 | 2.4%).
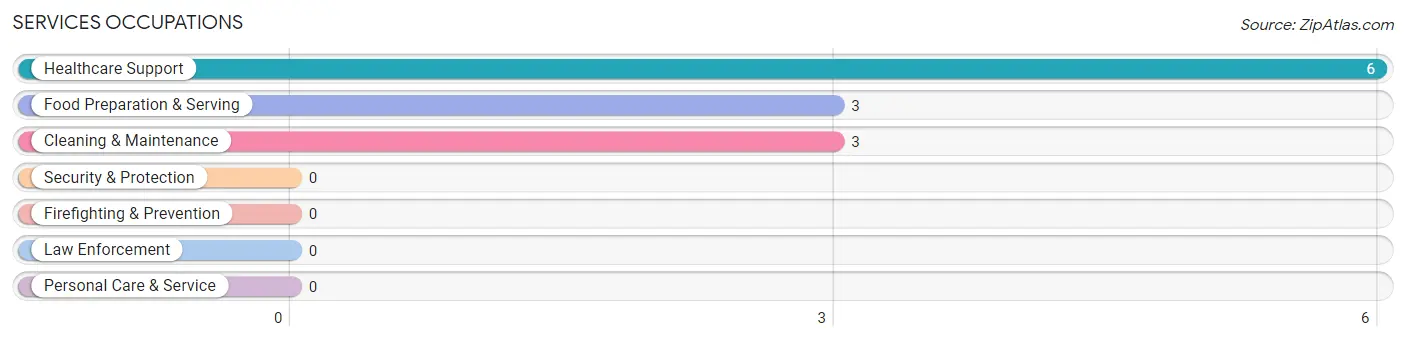
Services Occupations by Sex
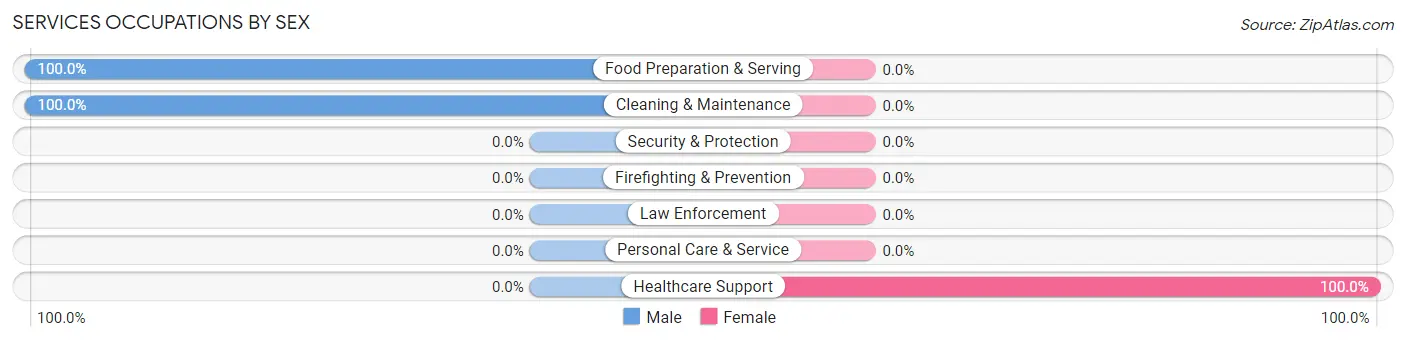
| Occupation | Male | Female |
| Healthcare Support | 0 (0.0%) | 6 (100.0%) |
| Security & Protection | 0 (0.0%) | 0 (0.0%) |
| Firefighting & Prevention | 0 (0.0%) | 0 (0.0%) |
| Law Enforcement | 0 (0.0%) | 0 (0.0%) |
| Food Preparation & Serving | 3 (100.0%) | 0 (0.0%) |
| Cleaning & Maintenance | 3 (100.0%) | 0 (0.0%) |
| Personal Care & Service | 0 (0.0%) | 0 (0.0%) |
| Total (Category) | 6 (50.0%) | 6 (50.0%) |
| Total (Overall) | 90 (71.4%) | 36 (28.6%) |
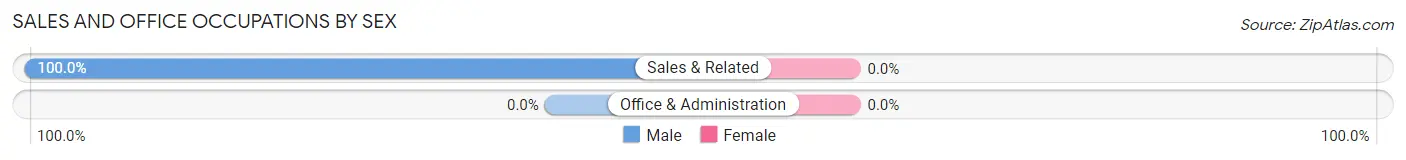
Sales and Office Occupations
The most common Sales and Office occupations in San Lucas are , and Sales & Related (11 | 8.7%).
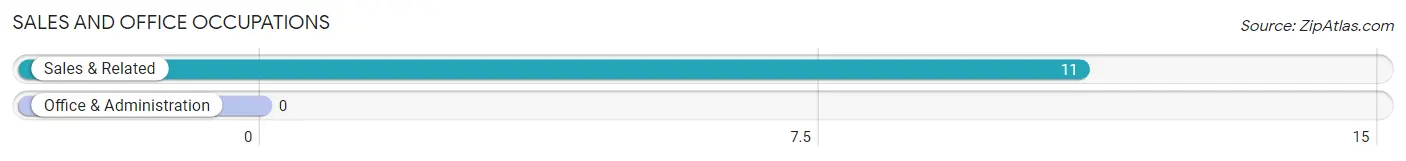
Sales and Office Occupations by Sex
| Occupation | Male | Female |
| Sales & Related | 11 (100.0%) | 0 (0.0%) |
| Office & Administration | 0 (0.0%) | 0 (0.0%) |
| Total (Category) | 11 (100.0%) | 0 (0.0%) |
| Total (Overall) | 90 (71.4%) | 36 (28.6%) |
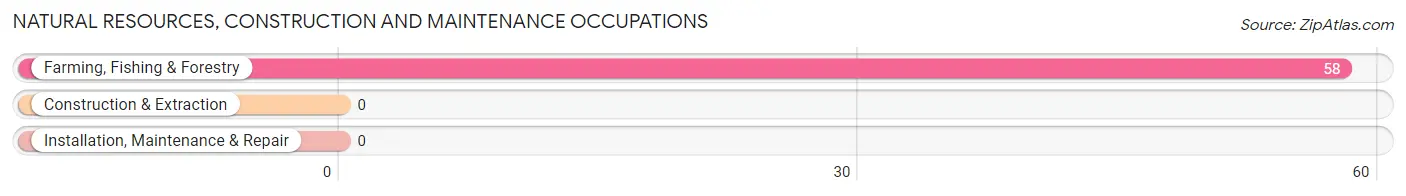
Natural Resources, Construction and Maintenance Occupations
The most common Natural Resources, Construction and Maintenance occupations in San Lucas are , and Farming, Fishing & Forestry (58 | 46.0%).
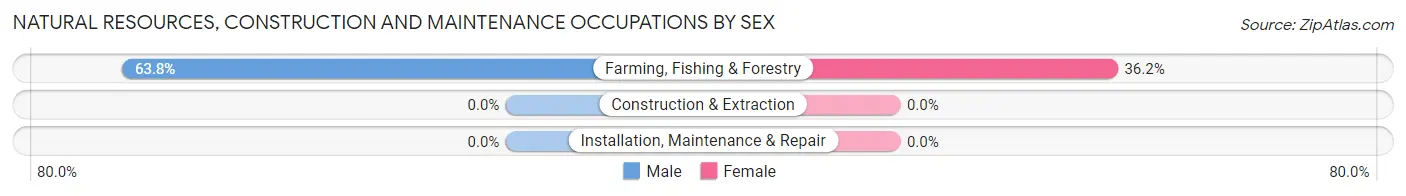
Natural Resources, Construction and Maintenance Occupations by Sex
| Occupation | Male | Female |
| Farming, Fishing & Forestry | 37 (63.8%) | 21 (36.2%) |
| Construction & Extraction | 0 (0.0%) | 0 (0.0%) |
| Installation, Maintenance & Repair | 0 (0.0%) | 0 (0.0%) |
| Total (Category) | 37 (63.8%) | 21 (36.2%) |
| Total (Overall) | 90 (71.4%) | 36 (28.6%) |
Production, Transportation and Moving Occupations
The most common Production, Transportation and Moving occupations in San Lucas are Transportation (32 | 25.4%), and Production (13 | 10.3%).
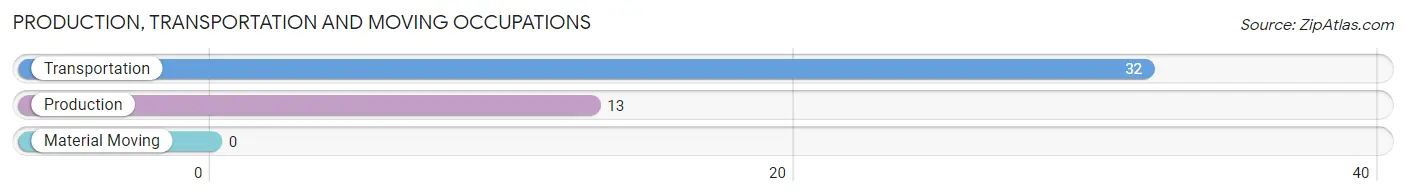
Production, Transportation and Moving Occupations by Sex
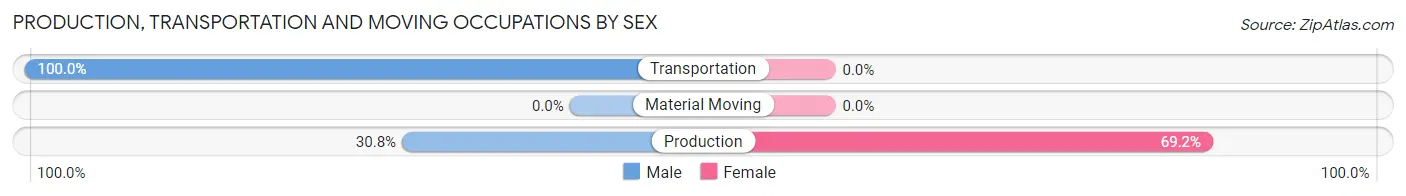
| Occupation | Male | Female |
| Production | 4 (30.8%) | 9 (69.2%) |
| Transportation | 32 (100.0%) | 0 (0.0%) |
| Material Moving | 0 (0.0%) | 0 (0.0%) |
| Total (Category) | 36 (80.0%) | 9 (20.0%) |
| Total (Overall) | 90 (71.4%) | 36 (28.6%) |
Employment Industries by Sex in San Lucas
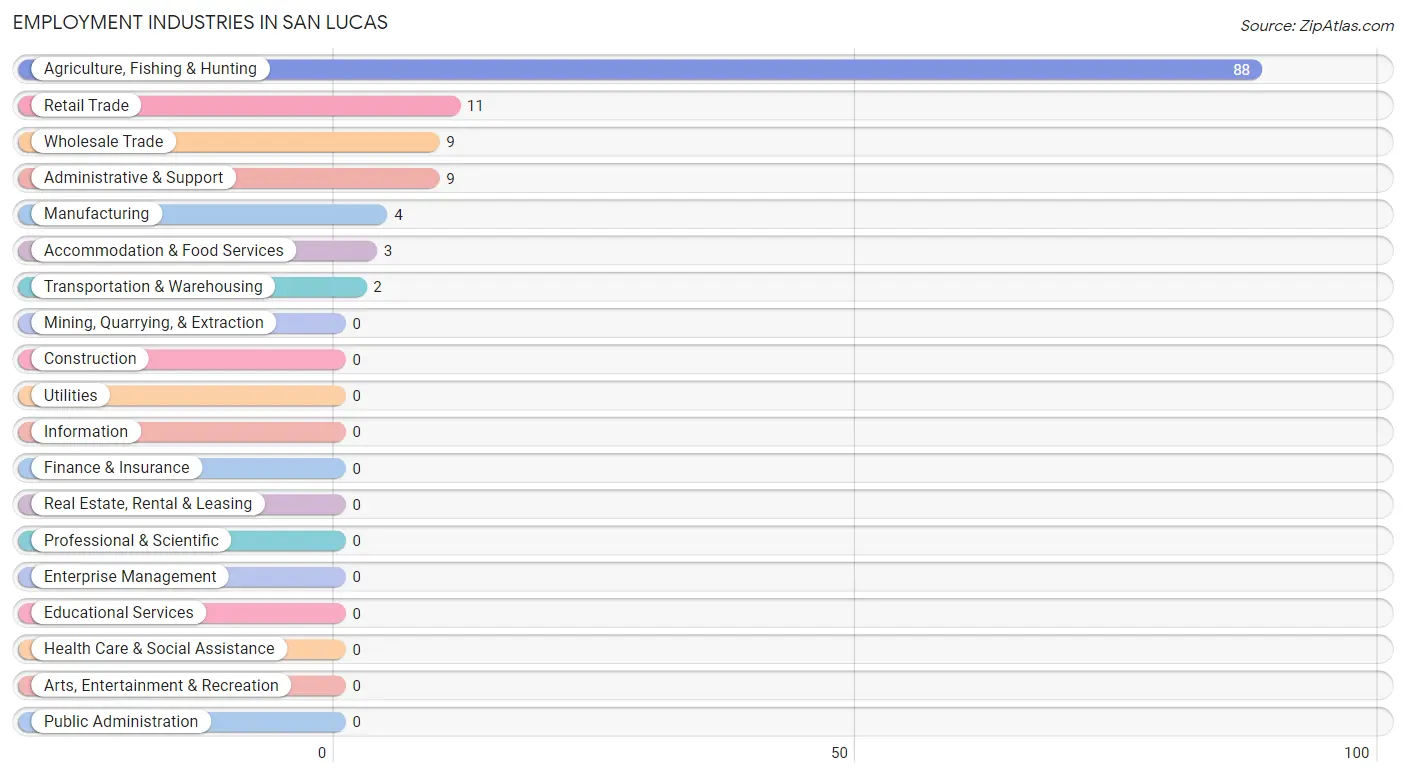
Employment Industries in San Lucas
The major employment industries in San Lucas include Agriculture, Fishing & Hunting (88 | 69.8%), Retail Trade (11 | 8.7%), Wholesale Trade (9 | 7.1%), Administrative & Support (9 | 7.1%), and Manufacturing (4 | 3.2%).
Employment Industries by Sex in San Lucas
The San Lucas industries that see more men than women are Manufacturing (100.0%), Retail Trade (100.0%), and Transportation & Warehousing (100.0%), whereas the industries that tend to have a higher number of women are Wholesale Trade (100.0%), Administrative & Support (66.7%), and Agriculture, Fishing & Hunting (23.9%).
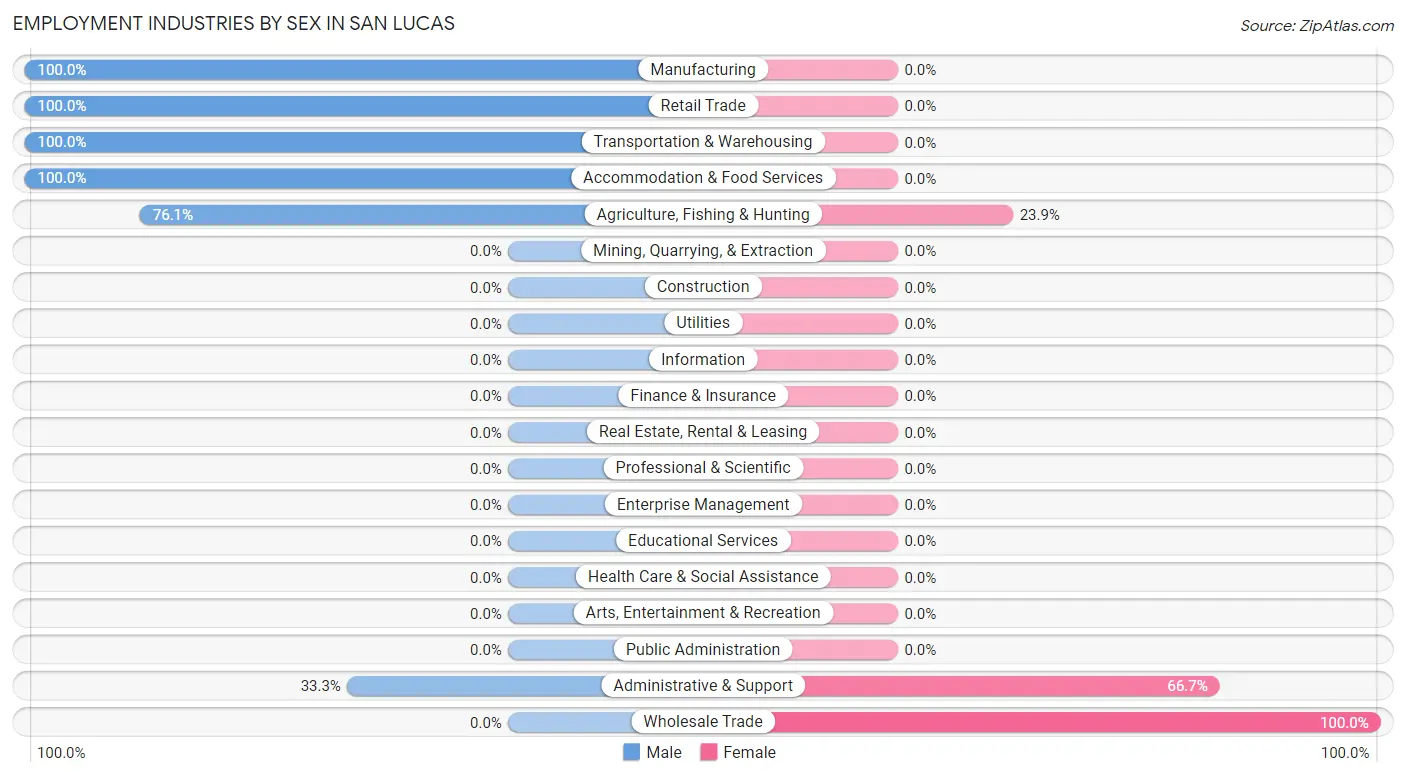
| Industry | Male | Female |
| Agriculture, Fishing & Hunting | 67 (76.1%) | 21 (23.9%) |
| Mining, Quarrying, & Extraction | 0 (0.0%) | 0 (0.0%) |
| Construction | 0 (0.0%) | 0 (0.0%) |
| Manufacturing | 4 (100.0%) | 0 (0.0%) |
| Wholesale Trade | 0 (0.0%) | 9 (100.0%) |
| Retail Trade | 11 (100.0%) | 0 (0.0%) |
| Transportation & Warehousing | 2 (100.0%) | 0 (0.0%) |
| Utilities | 0 (0.0%) | 0 (0.0%) |
| Information | 0 (0.0%) | 0 (0.0%) |
| Finance & Insurance | 0 (0.0%) | 0 (0.0%) |
| Real Estate, Rental & Leasing | 0 (0.0%) | 0 (0.0%) |
| Professional & Scientific | 0 (0.0%) | 0 (0.0%) |
| Enterprise Management | 0 (0.0%) | 0 (0.0%) |
| Administrative & Support | 3 (33.3%) | 6 (66.7%) |
| Educational Services | 0 (0.0%) | 0 (0.0%) |
| Health Care & Social Assistance | 0 (0.0%) | 0 (0.0%) |
| Arts, Entertainment & Recreation | 0 (0.0%) | 0 (0.0%) |
| Accommodation & Food Services | 3 (100.0%) | 0 (0.0%) |
| Public Administration | 0 (0.0%) | 0 (0.0%) |
| Total | 90 (71.4%) | 36 (28.6%) |
Education in San Lucas
School Enrollment in San Lucas
The most common levels of schooling among the 146 students in San Lucas are elementary school (51 | 34.9%), middle school (50 | 34.3%), and kindergarten (22 | 15.1%).
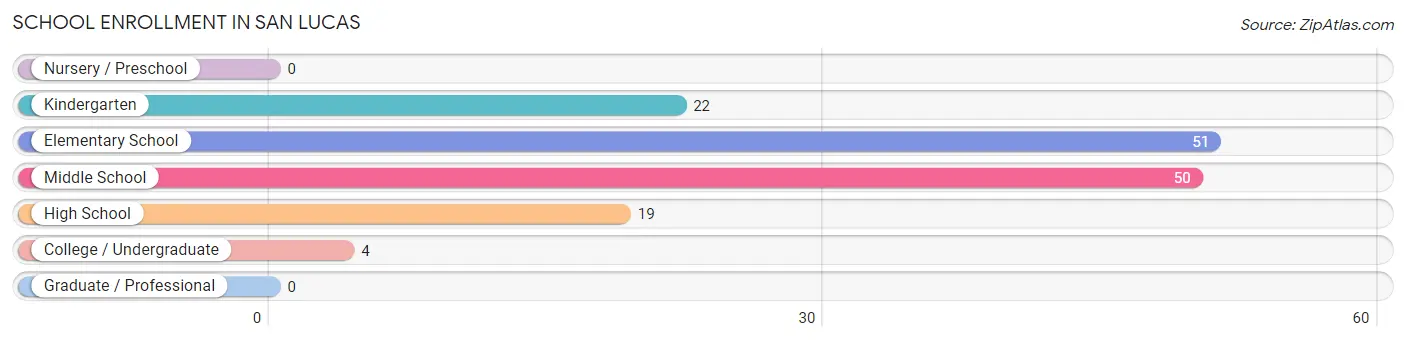
| School Level | # Students | % Students |
| Nursery / Preschool | 0 | 0.0% |
| Kindergarten | 22 | 15.1% |
| Elementary School | 51 | 34.9% |
| Middle School | 50 | 34.3% |
| High School | 19 | 13.0% |
| College / Undergraduate | 4 | 2.7% |
| Graduate / Professional | 0 | 0.0% |
| Total | 146 | 100.0% |
School Enrollment by Age by Funding Source in San Lucas
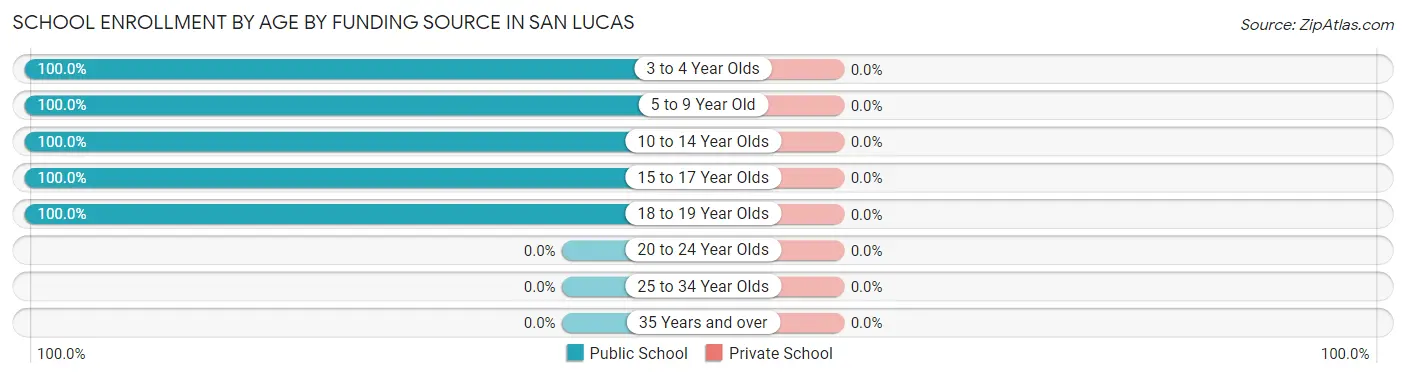
| Age Bracket | Public School | Private School |
| 3 to 4 Year Olds | 12 (100.0%) | 0 (0.0%) |
| 5 to 9 Year Old | 51 (100.0%) | 0 (0.0%) |
| 10 to 14 Year Olds | 60 (100.0%) | 0 (0.0%) |
| 15 to 17 Year Olds | 19 (100.0%) | 0 (0.0%) |
| 18 to 19 Year Olds | 4 (100.0%) | 0 (0.0%) |
| 20 to 24 Year Olds | 0 (0.0%) | 0 (0.0%) |
| 25 to 34 Year Olds | 0 (0.0%) | 0 (0.0%) |
| 35 Years and over | 0 (0.0%) | 0 (0.0%) |
| Total | 146 (100.0%) | 0 (0.0%) |
Educational Attainment by Field of Study in San Lucas
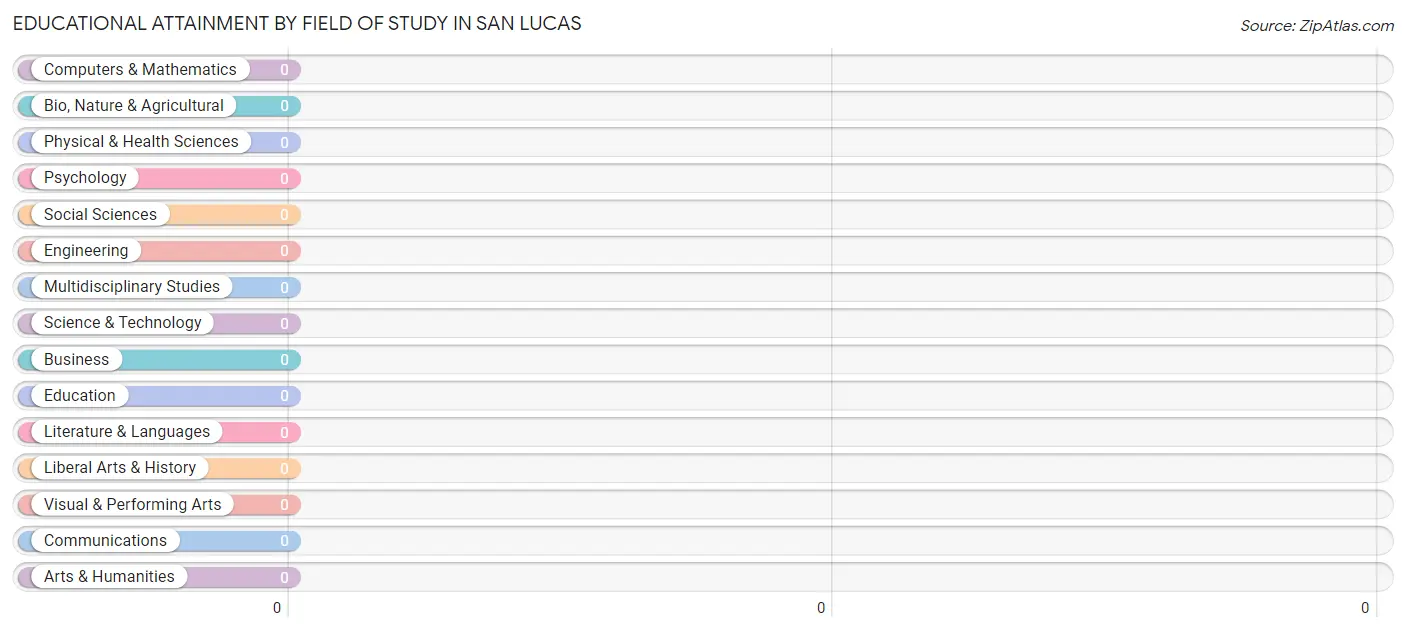
| Field of Study | # Graduates | % Graduates |
| Computers & Mathematics | 0 | 0.0% |
| Bio, Nature & Agricultural | 0 | 0.0% |
| Physical & Health Sciences | 0 | 0.0% |
| Psychology | 0 | 0.0% |
| Social Sciences | 0 | 0.0% |
| Engineering | 0 | 0.0% |
| Multidisciplinary Studies | 0 | 0.0% |
| Science & Technology | 0 | 0.0% |
| Business | 0 | 0.0% |
| Education | 0 | 0.0% |
| Literature & Languages | 0 | 0.0% |
| Liberal Arts & History | 0 | 0.0% |
| Visual & Performing Arts | 0 | 0.0% |
| Communications | 0 | 0.0% |
| Arts & Humanities | 0 | 0.0% |
| Total | 0 | 0.0% |
Transportation & Commute in San Lucas
Vehicle Availability by Sex in San Lucas
The most prevalent vehicle ownership categories in San Lucas are males with 3 vehicles (60, accounting for 66.7%) and females with 3 vehicles (18, making up 166.7%).
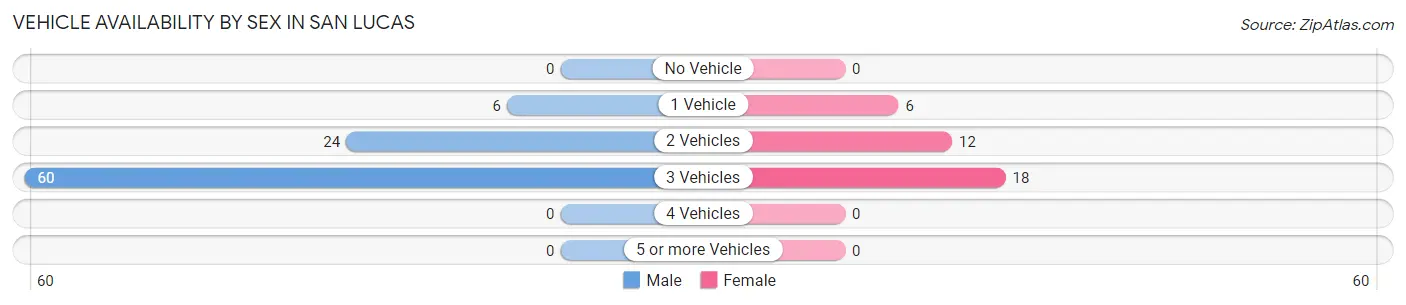
| Vehicles Available | Male | Female |
| No Vehicle | 0 (0.0%) | 0 (0.0%) |
| 1 Vehicle | 6 (6.7%) | 6 (16.7%) |
| 2 Vehicles | 24 (26.7%) | 12 (33.3%) |
| 3 Vehicles | 60 (66.7%) | 18 (50.0%) |
| 4 Vehicles | 0 (0.0%) | 0 (0.0%) |
| 5 or more Vehicles | 0 (0.0%) | 0 (0.0%) |
| Total | 90 (100.0%) | 36 (100.0%) |
Commute Time in San Lucas
The most frequently occuring commute durations in San Lucas are 20 to 24 minutes (41 commuters, 32.5%), 15 to 19 minutes (24 commuters, 19.1%), and 30 to 34 minutes (22 commuters, 17.5%).
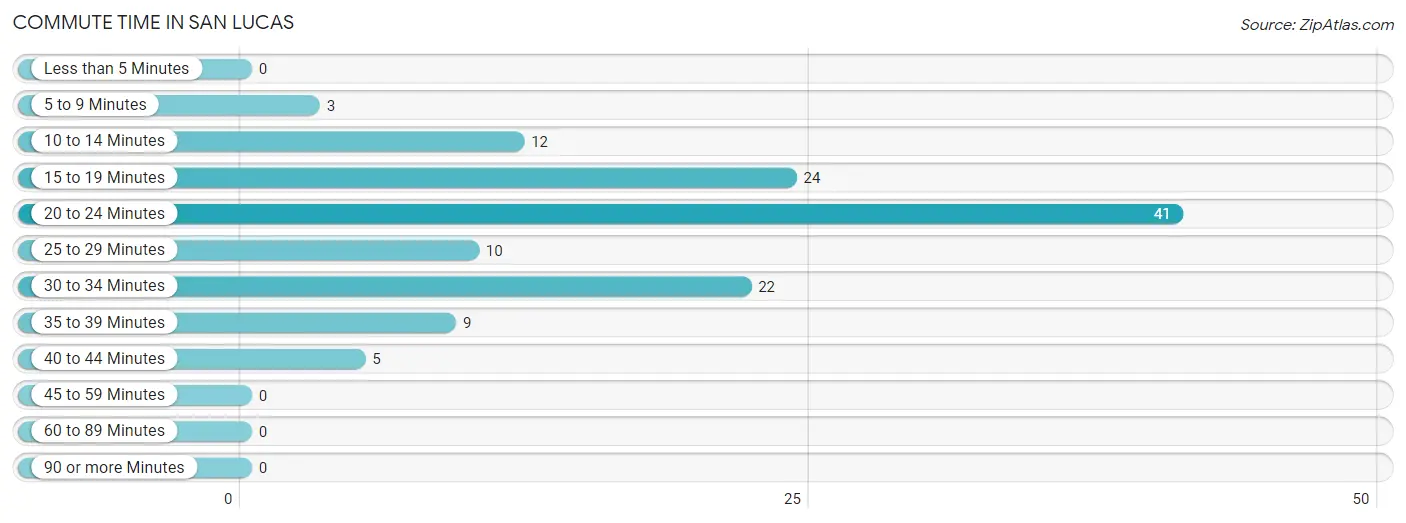
| Commute Time | # Commuters | % Commuters |
| Less than 5 Minutes | 0 | 0.0% |
| 5 to 9 Minutes | 3 | 2.4% |
| 10 to 14 Minutes | 12 | 9.5% |
| 15 to 19 Minutes | 24 | 19.1% |
| 20 to 24 Minutes | 41 | 32.5% |
| 25 to 29 Minutes | 10 | 7.9% |
| 30 to 34 Minutes | 22 | 17.5% |
| 35 to 39 Minutes | 9 | 7.1% |
| 40 to 44 Minutes | 5 | 4.0% |
| 45 to 59 Minutes | 0 | 0.0% |
| 60 to 89 Minutes | 0 | 0.0% |
| 90 or more Minutes | 0 | 0.0% |
Commute Time by Sex in San Lucas
The most common commute times in San Lucas are 15 to 19 minutes (24 commuters, 26.7%) for males and 20 to 24 minutes (21 commuters, 58.3%) for females.
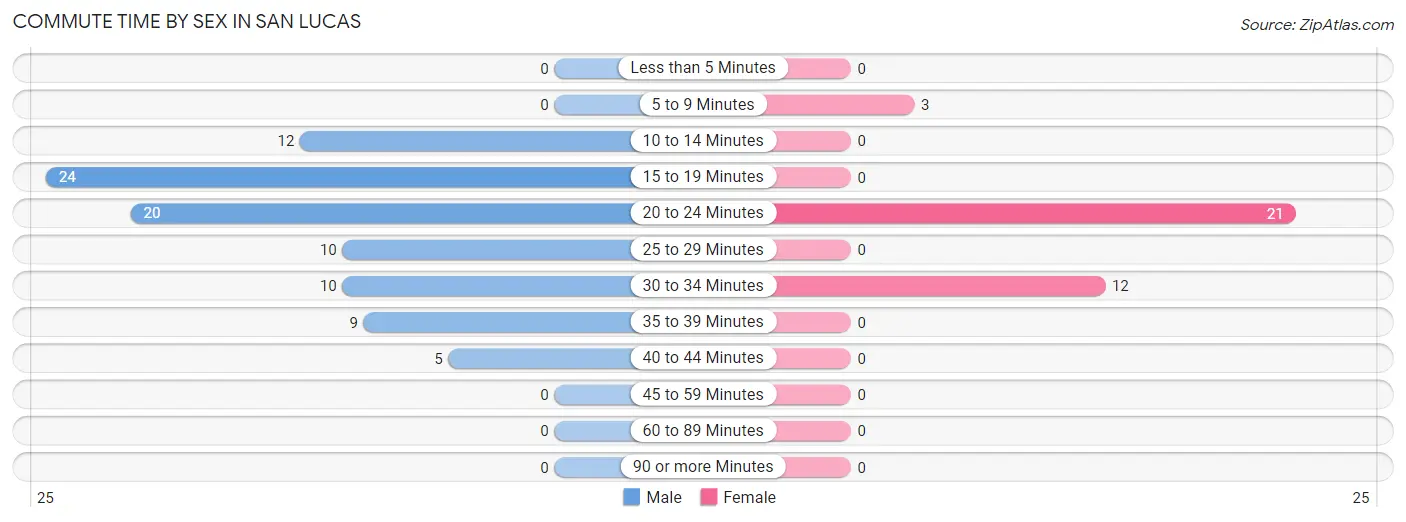
| Commute Time | Male | Female |
| Less than 5 Minutes | 0 (0.0%) | 0 (0.0%) |
| 5 to 9 Minutes | 0 (0.0%) | 3 (8.3%) |
| 10 to 14 Minutes | 12 (13.3%) | 0 (0.0%) |
| 15 to 19 Minutes | 24 (26.7%) | 0 (0.0%) |
| 20 to 24 Minutes | 20 (22.2%) | 21 (58.3%) |
| 25 to 29 Minutes | 10 (11.1%) | 0 (0.0%) |
| 30 to 34 Minutes | 10 (11.1%) | 12 (33.3%) |
| 35 to 39 Minutes | 9 (10.0%) | 0 (0.0%) |
| 40 to 44 Minutes | 5 (5.6%) | 0 (0.0%) |
| 45 to 59 Minutes | 0 (0.0%) | 0 (0.0%) |
| 60 to 89 Minutes | 0 (0.0%) | 0 (0.0%) |
| 90 or more Minutes | 0 (0.0%) | 0 (0.0%) |
Time of Departure to Work by Sex in San Lucas
The most frequent times of departure to work in San Lucas are 7:00 AM to 7:29 AM (24, 26.7%) for males and 7:00 AM to 7:29 AM (15, 41.7%) for females.
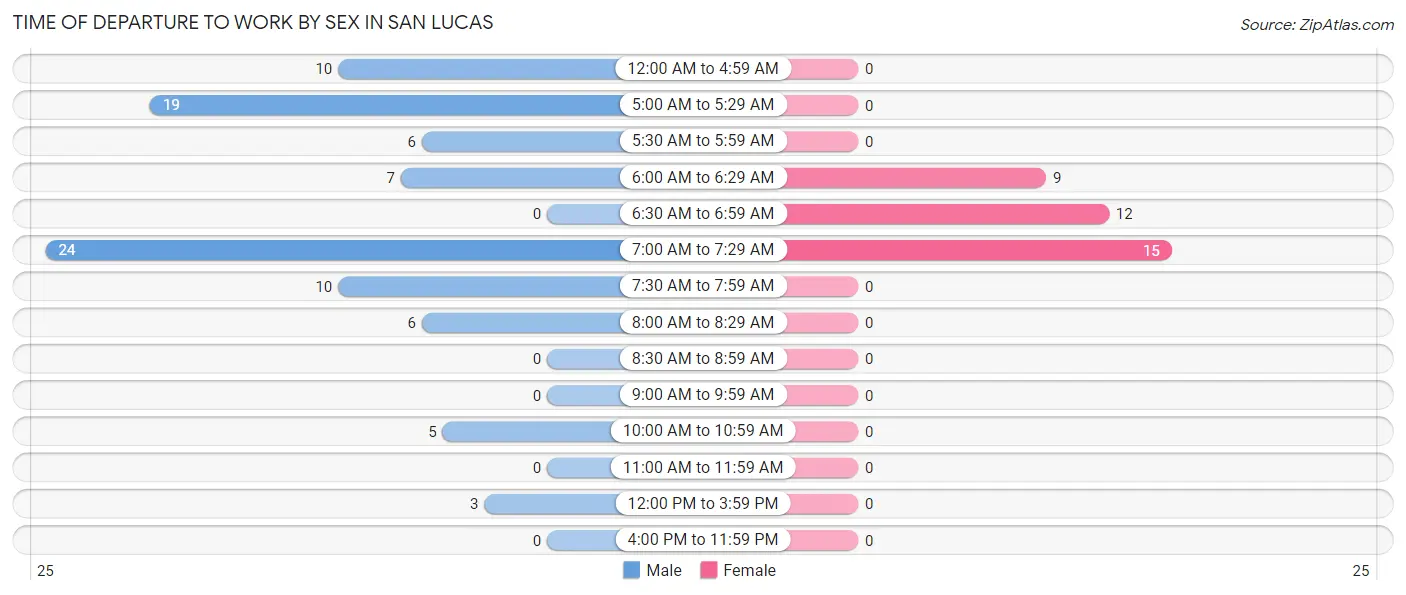
| Time of Departure | Male | Female |
| 12:00 AM to 4:59 AM | 10 (11.1%) | 0 (0.0%) |
| 5:00 AM to 5:29 AM | 19 (21.1%) | 0 (0.0%) |
| 5:30 AM to 5:59 AM | 6 (6.7%) | 0 (0.0%) |
| 6:00 AM to 6:29 AM | 7 (7.8%) | 9 (25.0%) |
| 6:30 AM to 6:59 AM | 0 (0.0%) | 12 (33.3%) |
| 7:00 AM to 7:29 AM | 24 (26.7%) | 15 (41.7%) |
| 7:30 AM to 7:59 AM | 10 (11.1%) | 0 (0.0%) |
| 8:00 AM to 8:29 AM | 6 (6.7%) | 0 (0.0%) |
| 8:30 AM to 8:59 AM | 0 (0.0%) | 0 (0.0%) |
| 9:00 AM to 9:59 AM | 0 (0.0%) | 0 (0.0%) |
| 10:00 AM to 10:59 AM | 5 (5.6%) | 0 (0.0%) |
| 11:00 AM to 11:59 AM | 0 (0.0%) | 0 (0.0%) |
| 12:00 PM to 3:59 PM | 3 (3.3%) | 0 (0.0%) |
| 4:00 PM to 11:59 PM | 0 (0.0%) | 0 (0.0%) |
| Total | 90 (100.0%) | 36 (100.0%) |
Housing Occupancy in San Lucas
Occupancy by Ownership in San Lucas
Of the total 63 dwellings in San Lucas, owner-occupied units account for 26 (41.3%), while renter-occupied units make up 37 (58.7%).
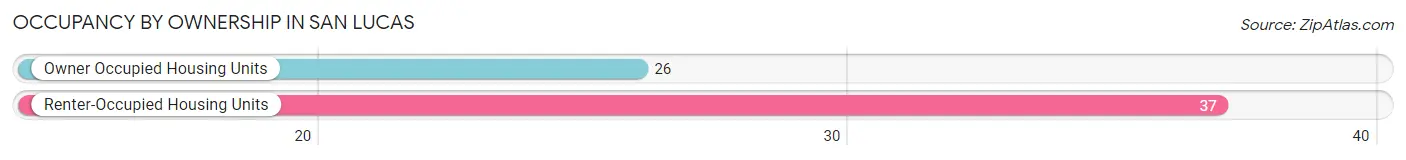
| Occupancy | # Housing Units | % Housing Units |
| Owner Occupied Housing Units | 26 | 41.3% |
| Renter-Occupied Housing Units | 37 | 58.7% |
| Total Occupied Housing Units | 63 | 100.0% |
Occupancy by Household Size in San Lucas
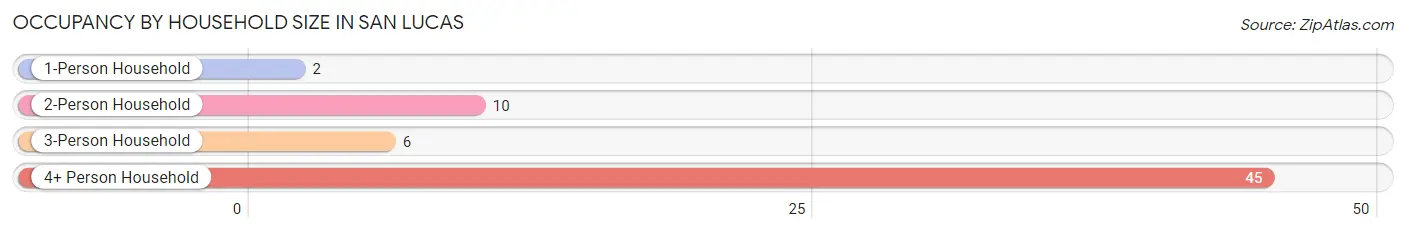
| Household Size | # Housing Units | % Housing Units |
| 1-Person Household | 2 | 3.2% |
| 2-Person Household | 10 | 15.9% |
| 3-Person Household | 6 | 9.5% |
| 4+ Person Household | 45 | 71.4% |
| Total Housing Units | 63 | 100.0% |
Occupancy by Ownership by Household Size in San Lucas
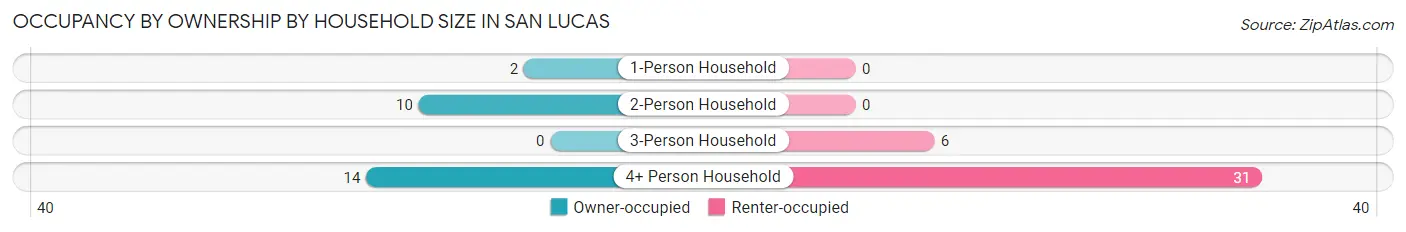
| Household Size | Owner-occupied | Renter-occupied |
| 1-Person Household | 2 (100.0%) | 0 (0.0%) |
| 2-Person Household | 10 (100.0%) | 0 (0.0%) |
| 3-Person Household | 0 (0.0%) | 6 (100.0%) |
| 4+ Person Household | 14 (31.1%) | 31 (68.9%) |
| Total Housing Units | 26 (41.3%) | 37 (58.7%) |
Occupancy by Educational Attainment in San Lucas
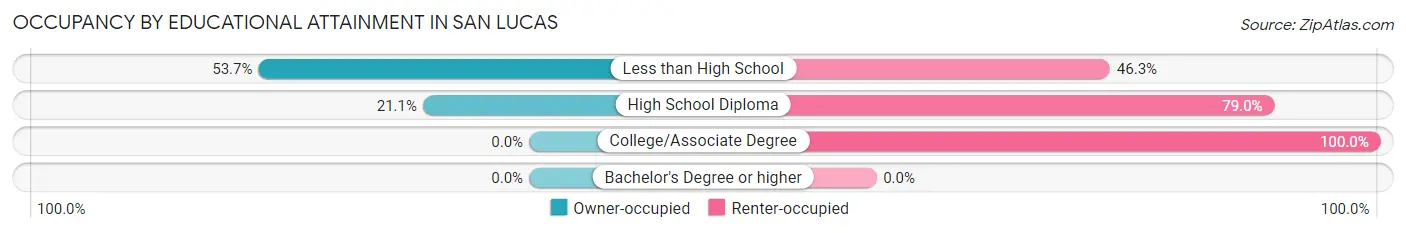
| Household Size | Owner-occupied | Renter-occupied |
| Less than High School | 22 (53.7%) | 19 (46.3%) |
| High School Diploma | 4 (21.0%) | 15 (78.9%) |
| College/Associate Degree | 0 (0.0%) | 3 (100.0%) |
| Bachelor's Degree or higher | 0 (0.0%) | 0 (0.0%) |
Occupancy by Age of Householder in San Lucas
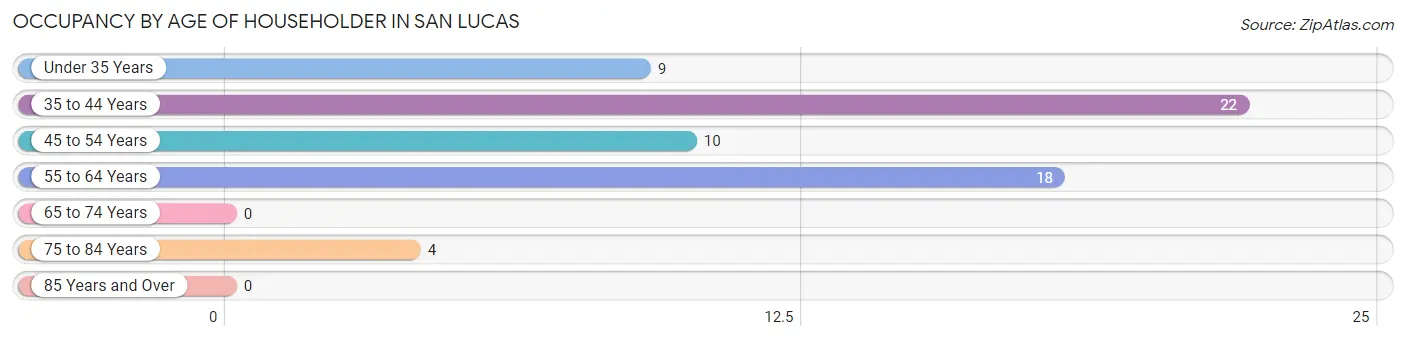
| Age Bracket | # Households | % Households |
| Under 35 Years | 9 | 14.3% |
| 35 to 44 Years | 22 | 34.9% |
| 45 to 54 Years | 10 | 15.9% |
| 55 to 64 Years | 18 | 28.6% |
| 65 to 74 Years | 0 | 0.0% |
| 75 to 84 Years | 4 | 6.4% |
| 85 Years and Over | 0 | 0.0% |
| Total | 63 | 100.0% |
Housing Finances in San Lucas
Median Income by Occupancy in San Lucas
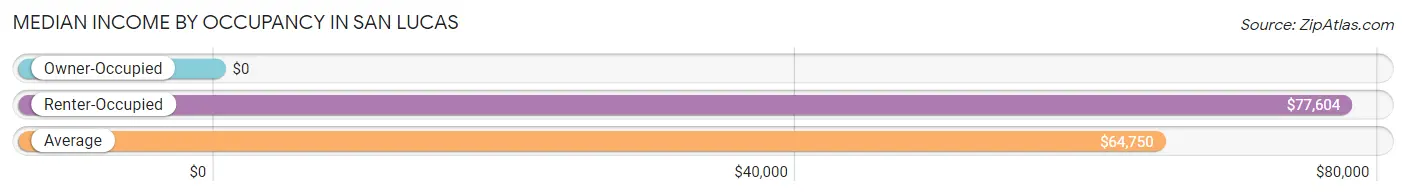
| Occupancy Type | # Households | Median Income |
| Owner-Occupied | 26 (41.3%) | $0 |
| Renter-Occupied | 37 (58.7%) | $77,604 |
| Average | 63 (100.0%) | $64,750 |
Occupancy by Householder Income Bracket in San Lucas
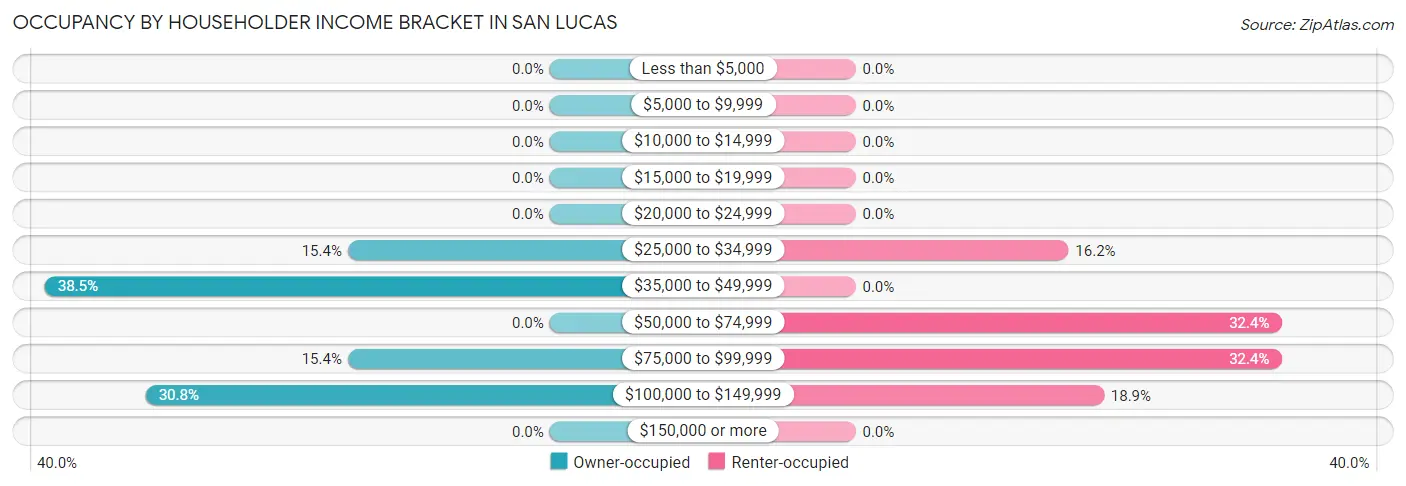
| Income Bracket | Owner-occupied | Renter-occupied |
| Less than $5,000 | 0 (0.0%) | 0 (0.0%) |
| $5,000 to $9,999 | 0 (0.0%) | 0 (0.0%) |
| $10,000 to $14,999 | 0 (0.0%) | 0 (0.0%) |
| $15,000 to $19,999 | 0 (0.0%) | 0 (0.0%) |
| $20,000 to $24,999 | 0 (0.0%) | 0 (0.0%) |
| $25,000 to $34,999 | 4 (15.4%) | 6 (16.2%) |
| $35,000 to $49,999 | 10 (38.5%) | 0 (0.0%) |
| $50,000 to $74,999 | 0 (0.0%) | 12 (32.4%) |
| $75,000 to $99,999 | 4 (15.4%) | 12 (32.4%) |
| $100,000 to $149,999 | 8 (30.8%) | 7 (18.9%) |
| $150,000 or more | 0 (0.0%) | 0 (0.0%) |
| Total | 26 (100.0%) | 37 (100.0%) |
Monthly Housing Cost Tiers in San Lucas
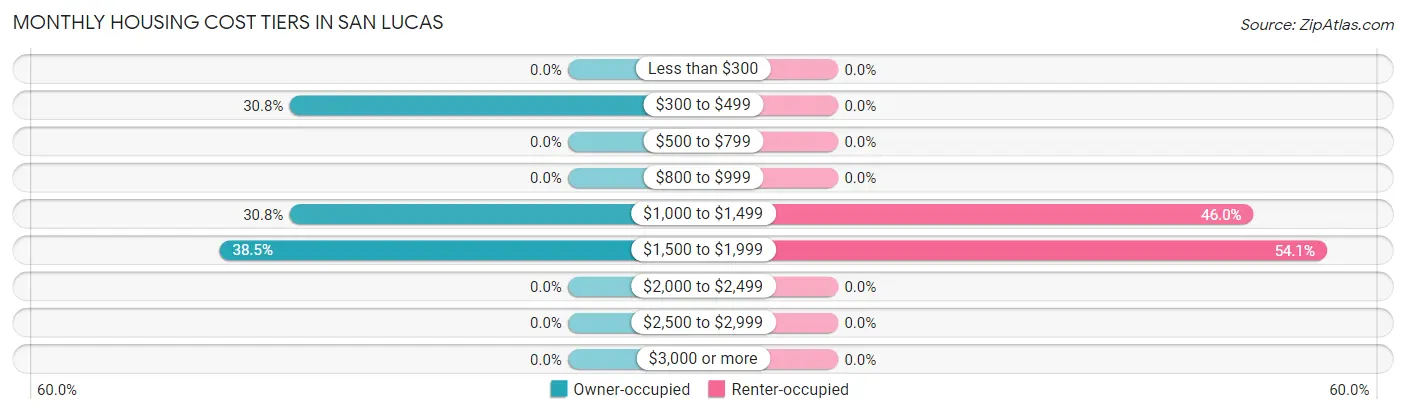
| Monthly Cost | Owner-occupied | Renter-occupied |
| Less than $300 | 0 (0.0%) | 0 (0.0%) |
| $300 to $499 | 8 (30.8%) | 0 (0.0%) |
| $500 to $799 | 0 (0.0%) | 0 (0.0%) |
| $800 to $999 | 0 (0.0%) | 0 (0.0%) |
| $1,000 to $1,499 | 8 (30.8%) | 17 (46.0%) |
| $1,500 to $1,999 | 10 (38.5%) | 20 (54.0%) |
| $2,000 to $2,499 | 0 (0.0%) | 0 (0.0%) |
| $2,500 to $2,999 | 0 (0.0%) | 0 (0.0%) |
| $3,000 or more | 0 (0.0%) | 0 (0.0%) |
| Total | 26 (100.0%) | 37 (100.0%) |
Physical Housing Characteristics in San Lucas
Housing Structures in San Lucas
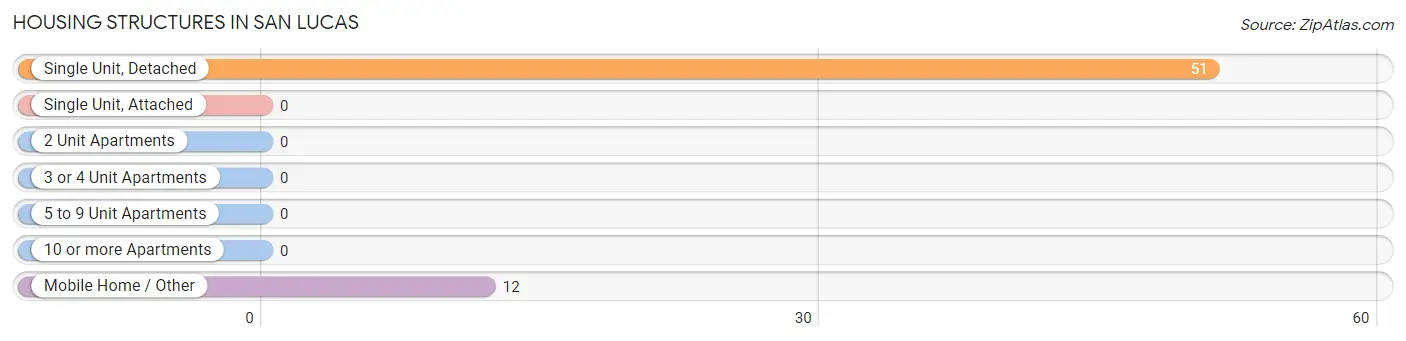
| Structure Type | # Housing Units | % Housing Units |
| Single Unit, Detached | 51 | 80.9% |
| Single Unit, Attached | 0 | 0.0% |
| 2 Unit Apartments | 0 | 0.0% |
| 3 or 4 Unit Apartments | 0 | 0.0% |
| 5 to 9 Unit Apartments | 0 | 0.0% |
| 10 or more Apartments | 0 | 0.0% |
| Mobile Home / Other | 12 | 19.1% |
| Total | 63 | 100.0% |
Housing Structures by Occupancy in San Lucas
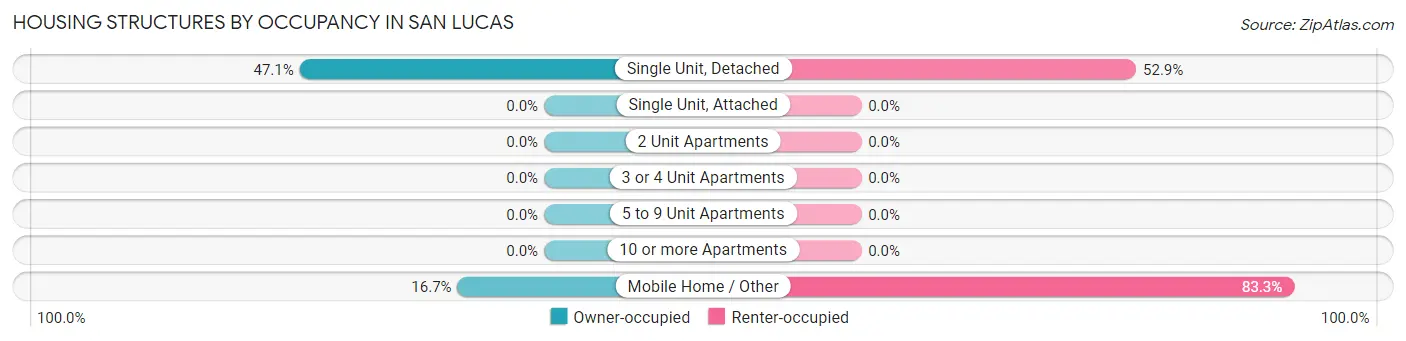
| Structure Type | Owner-occupied | Renter-occupied |
| Single Unit, Detached | 24 (47.1%) | 27 (52.9%) |
| Single Unit, Attached | 0 (0.0%) | 0 (0.0%) |
| 2 Unit Apartments | 0 (0.0%) | 0 (0.0%) |
| 3 or 4 Unit Apartments | 0 (0.0%) | 0 (0.0%) |
| 5 to 9 Unit Apartments | 0 (0.0%) | 0 (0.0%) |
| 10 or more Apartments | 0 (0.0%) | 0 (0.0%) |
| Mobile Home / Other | 2 (16.7%) | 10 (83.3%) |
| Total | 26 (41.3%) | 37 (58.7%) |
Housing Structures by Number of Rooms in San Lucas
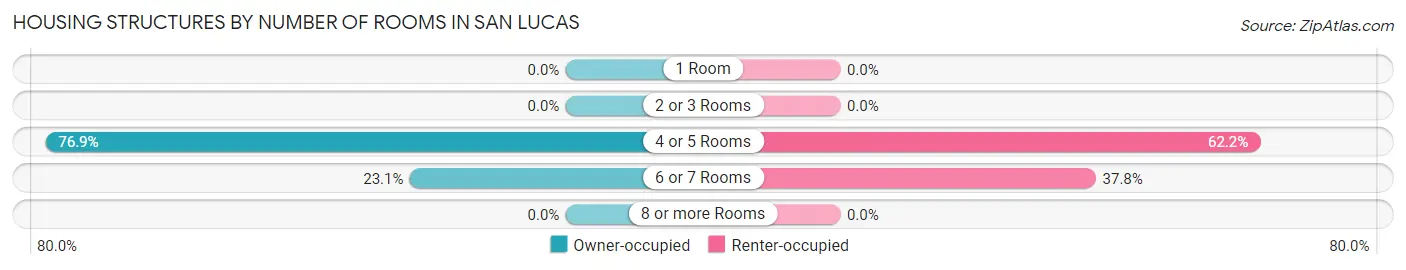
| Number of Rooms | Owner-occupied | Renter-occupied |
| 1 Room | 0 (0.0%) | 0 (0.0%) |
| 2 or 3 Rooms | 0 (0.0%) | 0 (0.0%) |
| 4 or 5 Rooms | 20 (76.9%) | 23 (62.2%) |
| 6 or 7 Rooms | 6 (23.1%) | 14 (37.8%) |
| 8 or more Rooms | 0 (0.0%) | 0 (0.0%) |
| Total | 26 (100.0%) | 37 (100.0%) |
Housing Structure by Heating Type in San Lucas
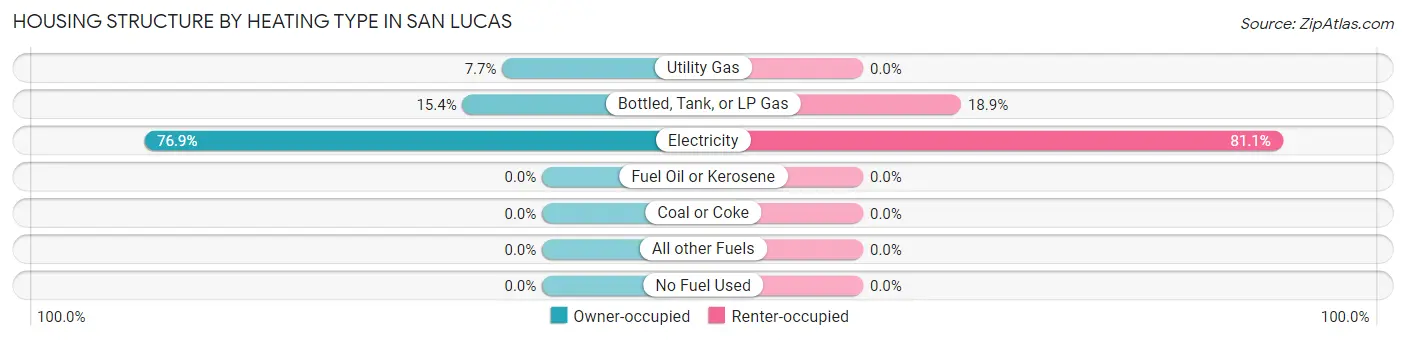
| Heating Type | Owner-occupied | Renter-occupied |
| Utility Gas | 2 (7.7%) | 0 (0.0%) |
| Bottled, Tank, or LP Gas | 4 (15.4%) | 7 (18.9%) |
| Electricity | 20 (76.9%) | 30 (81.1%) |
| Fuel Oil or Kerosene | 0 (0.0%) | 0 (0.0%) |
| Coal or Coke | 0 (0.0%) | 0 (0.0%) |
| All other Fuels | 0 (0.0%) | 0 (0.0%) |
| No Fuel Used | 0 (0.0%) | 0 (0.0%) |
| Total | 26 (100.0%) | 37 (100.0%) |
Household Vehicle Usage in San Lucas
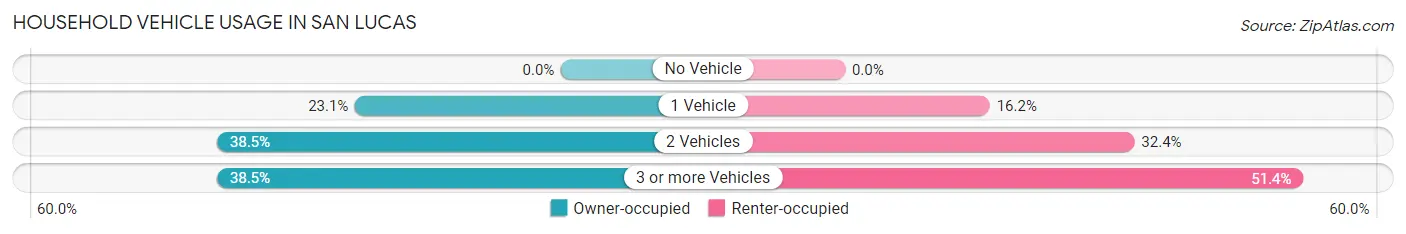
| Vehicles per Household | Owner-occupied | Renter-occupied |
| No Vehicle | 0 (0.0%) | 0 (0.0%) |
| 1 Vehicle | 6 (23.1%) | 6 (16.2%) |
| 2 Vehicles | 10 (38.5%) | 12 (32.4%) |
| 3 or more Vehicles | 10 (38.5%) | 19 (51.3%) |
| Total | 26 (100.0%) | 37 (100.0%) |
Real Estate & Mortgages in San Lucas
Real Estate and Mortgage Overview in San Lucas
| Characteristic | Without Mortgage | With Mortgage |
| Housing Units | 8 | 18 |
| Median Property Value | - | - |
| Median Household Income | - | - |
| Monthly Housing Costs | - | - |
| Real Estate Taxes | - | - |
Property Value by Mortgage Status in San Lucas
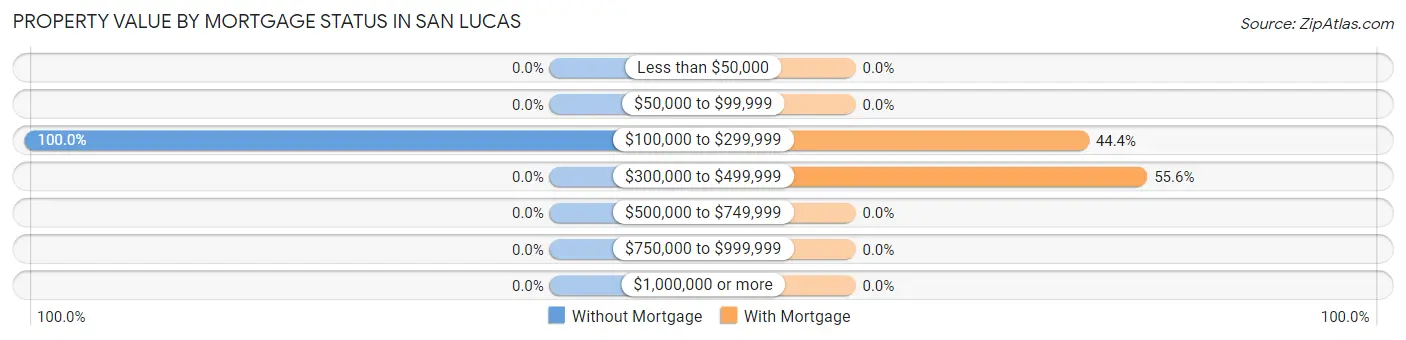
| Property Value | Without Mortgage | With Mortgage |
| Less than $50,000 | 0 (0.0%) | 0 (0.0%) |
| $50,000 to $99,999 | 0 (0.0%) | 0 (0.0%) |
| $100,000 to $299,999 | 8 (100.0%) | 8 (44.4%) |
| $300,000 to $499,999 | 0 (0.0%) | 10 (55.6%) |
| $500,000 to $749,999 | 0 (0.0%) | 0 (0.0%) |
| $750,000 to $999,999 | 0 (0.0%) | 0 (0.0%) |
| $1,000,000 or more | 0 (0.0%) | 0 (0.0%) |
| Total | 8 (100.0%) | 18 (100.0%) |
Household Income by Mortgage Status in San Lucas
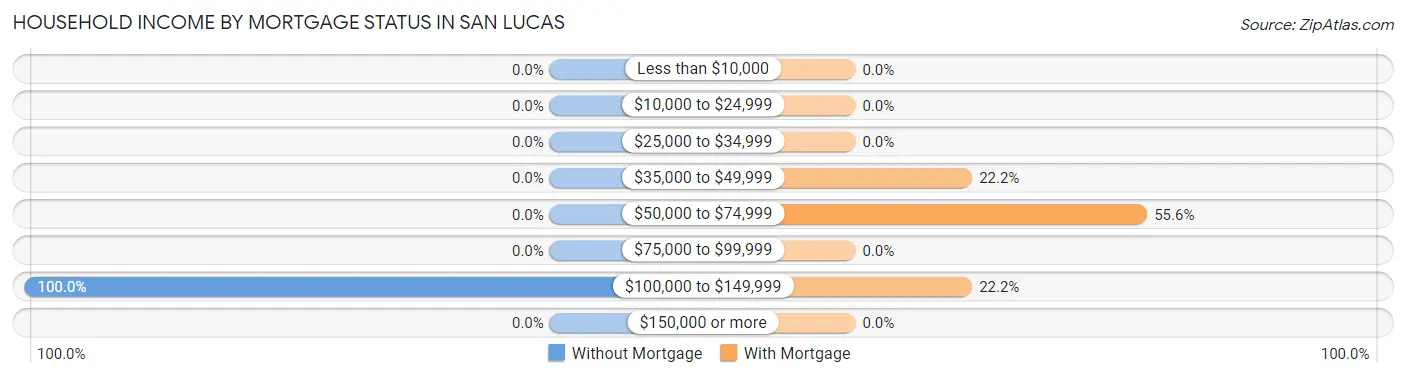
| Household Income | Without Mortgage | With Mortgage |
| Less than $10,000 | 0 (0.0%) | 0 (0.0%) |
| $10,000 to $24,999 | 0 (0.0%) | 0 (0.0%) |
| $25,000 to $34,999 | 0 (0.0%) | 0 (0.0%) |
| $35,000 to $49,999 | 0 (0.0%) | 4 (22.2%) |
| $50,000 to $74,999 | 0 (0.0%) | 10 (55.6%) |
| $75,000 to $99,999 | 0 (0.0%) | 0 (0.0%) |
| $100,000 to $149,999 | 8 (100.0%) | 4 (22.2%) |
| $150,000 or more | 0 (0.0%) | 0 (0.0%) |
| Total | 8 (100.0%) | 18 (100.0%) |
Property Value to Household Income Ratio in San Lucas
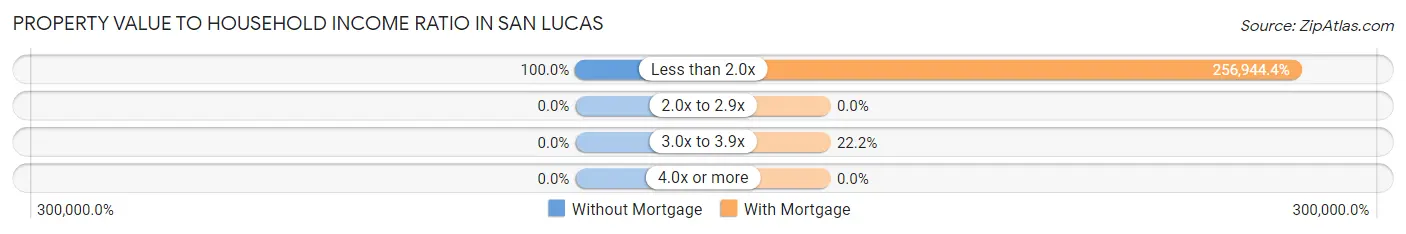
| Value-to-Income Ratio | Without Mortgage | With Mortgage |
| Less than 2.0x | 8 (100.0%) | 46,250 (256,944.4%) |
| 2.0x to 2.9x | 0 (0.0%) | 0 (0.0%) |
| 3.0x to 3.9x | 0 (0.0%) | 4 (22.2%) |
| 4.0x or more | 0 (0.0%) | 0 (0.0%) |
| Total | 8 (100.0%) | 18 (100.0%) |
Real Estate Taxes by Mortgage Status in San Lucas
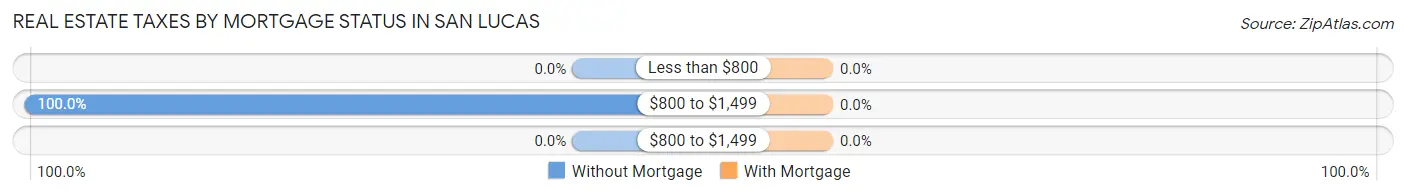
| Property Taxes | Without Mortgage | With Mortgage |
| Less than $800 | 0 (0.0%) | 0 (0.0%) |
| $800 to $1,499 | 8 (100.0%) | 0 (0.0%) |
| $800 to $1,499 | 0 (0.0%) | 0 (0.0%) |
| Total | 8 (100.0%) | 18 (100.0%) |
Health & Disability in San Lucas
Health Insurance Coverage by Age in San Lucas
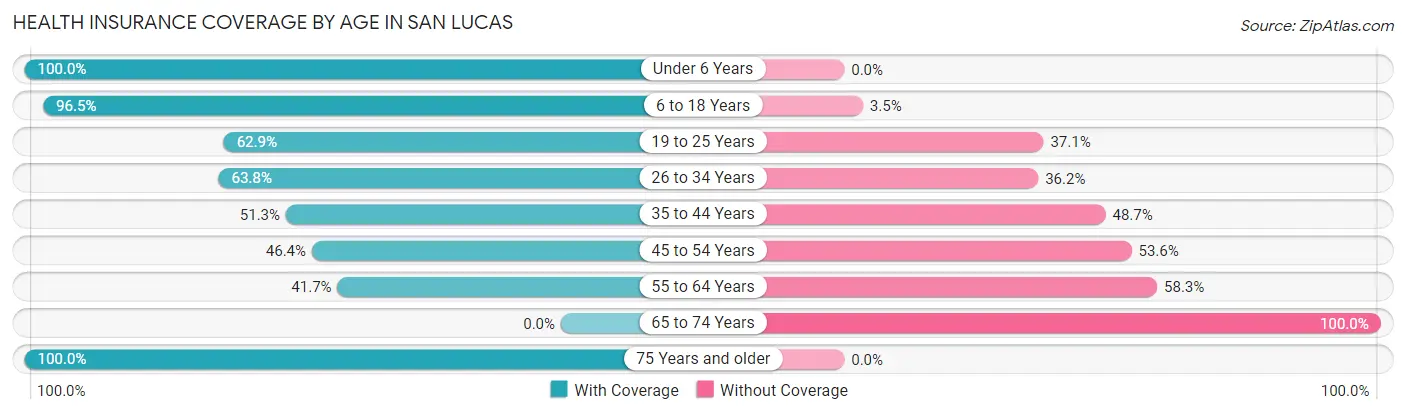
| Age Bracket | With Coverage | Without Coverage |
| Under 6 Years | 36 (100.0%) | 0 (0.0%) |
| 6 to 18 Years | 139 (96.5%) | 5 (3.5%) |
| 19 to 25 Years | 22 (62.9%) | 13 (37.1%) |
| 26 to 34 Years | 30 (63.8%) | 17 (36.2%) |
| 35 to 44 Years | 20 (51.3%) | 19 (48.7%) |
| 45 to 54 Years | 13 (46.4%) | 15 (53.6%) |
| 55 to 64 Years | 15 (41.7%) | 21 (58.3%) |
| 65 to 74 Years | 0 (0.0%) | 8 (100.0%) |
| 75 Years and older | 4 (100.0%) | 0 (0.0%) |
| Total | 279 (74.0%) | 98 (26.0%) |
Health Insurance Coverage by Citizenship Status in San Lucas
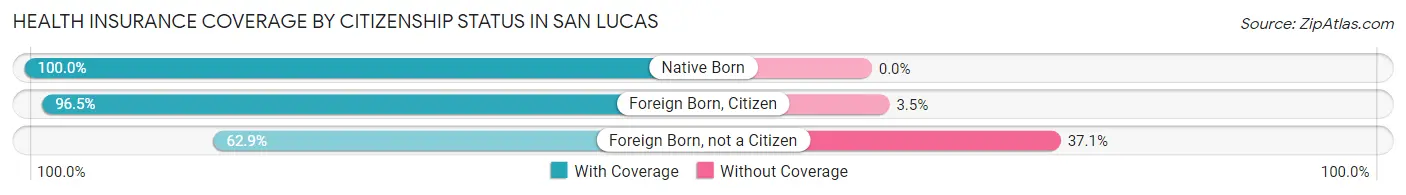
| Citizenship Status | With Coverage | Without Coverage |
| Native Born | 36 (100.0%) | 0 (0.0%) |
| Foreign Born, Citizen | 139 (96.5%) | 5 (3.5%) |
| Foreign Born, not a Citizen | 22 (62.9%) | 13 (37.1%) |
Health Insurance Coverage by Household Income in San Lucas
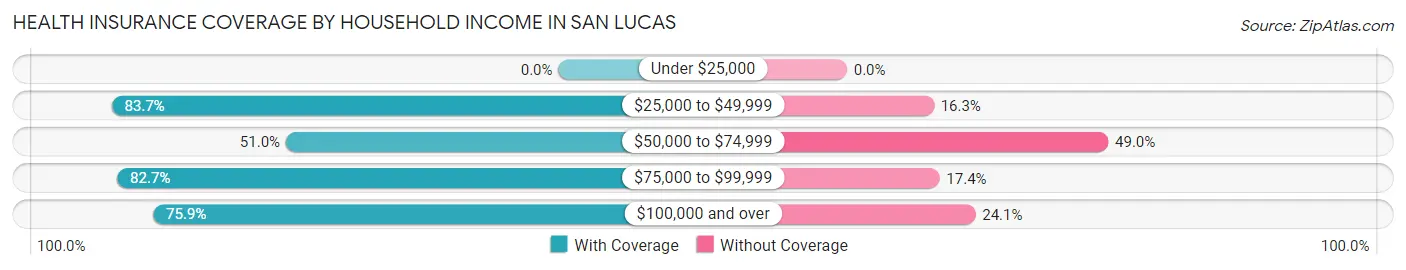
| Household Income | With Coverage | Without Coverage |
| Under $25,000 | 0 (0.0%) | 0 (0.0%) |
| $25,000 to $49,999 | 108 (83.7%) | 21 (16.3%) |
| $50,000 to $74,999 | 49 (51.0%) | 47 (49.0%) |
| $75,000 to $99,999 | 81 (82.7%) | 17 (17.3%) |
| $100,000 and over | 41 (75.9%) | 13 (24.1%) |
Public vs Private Health Insurance Coverage by Age in San Lucas
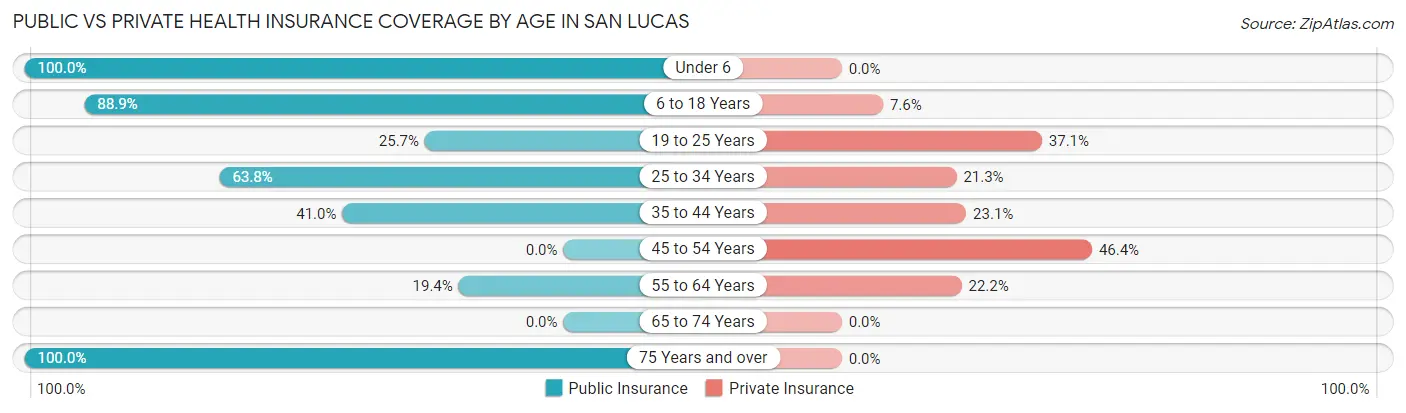
| Age Bracket | Public Insurance | Private Insurance |
| Under 6 | 36 (100.0%) | 0 (0.0%) |
| 6 to 18 Years | 128 (88.9%) | 11 (7.6%) |
| 19 to 25 Years | 9 (25.7%) | 13 (37.1%) |
| 25 to 34 Years | 30 (63.8%) | 10 (21.3%) |
| 35 to 44 Years | 16 (41.0%) | 9 (23.1%) |
| 45 to 54 Years | 0 (0.0%) | 13 (46.4%) |
| 55 to 64 Years | 7 (19.4%) | 8 (22.2%) |
| 65 to 74 Years | 0 (0.0%) | 0 (0.0%) |
| 75 Years and over | 4 (100.0%) | 0 (0.0%) |
| Total | 230 (61.0%) | 64 (17.0%) |
Disability Status by Sex by Age in San Lucas
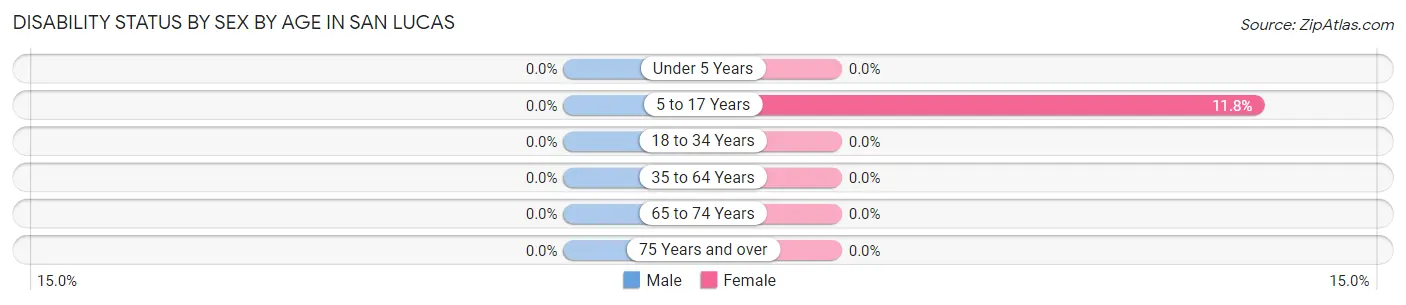
| Age Bracket | Male | Female |
| Under 5 Years | 0 (0.0%) | 0 (0.0%) |
| 5 to 17 Years | 0 (0.0%) | 8 (11.8%) |
| 18 to 34 Years | 0 (0.0%) | 0 (0.0%) |
| 35 to 64 Years | 0 (0.0%) | 0 (0.0%) |
| 65 to 74 Years | 0 (0.0%) | 0 (0.0%) |
| 75 Years and over | 0 (0.0%) | 0 (0.0%) |
Disability Class by Sex by Age in San Lucas
Disability Class: Hearing Difficulty
| Age Bracket | Male | Female |
| Under 5 Years | 0 (0.0%) | 0 (0.0%) |
| 5 to 17 Years | 0 (0.0%) | 0 (0.0%) |
| 18 to 34 Years | 0 (0.0%) | 0 (0.0%) |
| 35 to 64 Years | 0 (0.0%) | 0 (0.0%) |
| 65 to 74 Years | 0 (0.0%) | 0 (0.0%) |
| 75 Years and over | 0 (0.0%) | 0 (0.0%) |
Disability Class: Vision Difficulty
| Age Bracket | Male | Female |
| Under 5 Years | 0 (0.0%) | 0 (0.0%) |
| 5 to 17 Years | 0 (0.0%) | 0 (0.0%) |
| 18 to 34 Years | 0 (0.0%) | 0 (0.0%) |
| 35 to 64 Years | 0 (0.0%) | 0 (0.0%) |
| 65 to 74 Years | 0 (0.0%) | 0 (0.0%) |
| 75 Years and over | 0 (0.0%) | 0 (0.0%) |
Disability Class: Cognitive Difficulty
| Age Bracket | Male | Female |
| 5 to 17 Years | 0 (0.0%) | 8 (11.8%) |
| 18 to 34 Years | 0 (0.0%) | 0 (0.0%) |
| 35 to 64 Years | 0 (0.0%) | 0 (0.0%) |
| 65 to 74 Years | 0 (0.0%) | 0 (0.0%) |
| 75 Years and over | 0 (0.0%) | 0 (0.0%) |
Disability Class: Ambulatory Difficulty
| Age Bracket | Male | Female |
| 5 to 17 Years | 0 (0.0%) | 0 (0.0%) |
| 18 to 34 Years | 0 (0.0%) | 0 (0.0%) |
| 35 to 64 Years | 0 (0.0%) | 0 (0.0%) |
| 65 to 74 Years | 0 (0.0%) | 0 (0.0%) |
| 75 Years and over | 0 (0.0%) | 0 (0.0%) |
Disability Class: Self-Care Difficulty
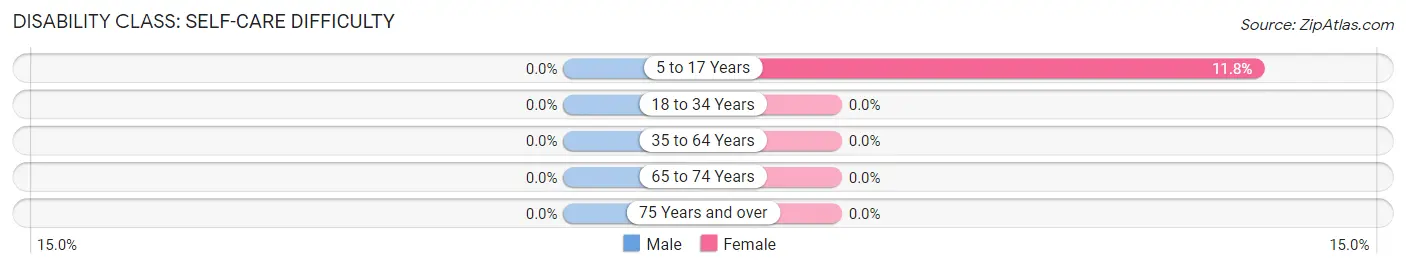
| Age Bracket | Male | Female |
| 5 to 17 Years | 0 (0.0%) | 8 (11.8%) |
| 18 to 34 Years | 0 (0.0%) | 0 (0.0%) |
| 35 to 64 Years | 0 (0.0%) | 0 (0.0%) |
| 65 to 74 Years | 0 (0.0%) | 0 (0.0%) |
| 75 Years and over | 0 (0.0%) | 0 (0.0%) |
Technology Access in San Lucas
Computing Device Access in San Lucas
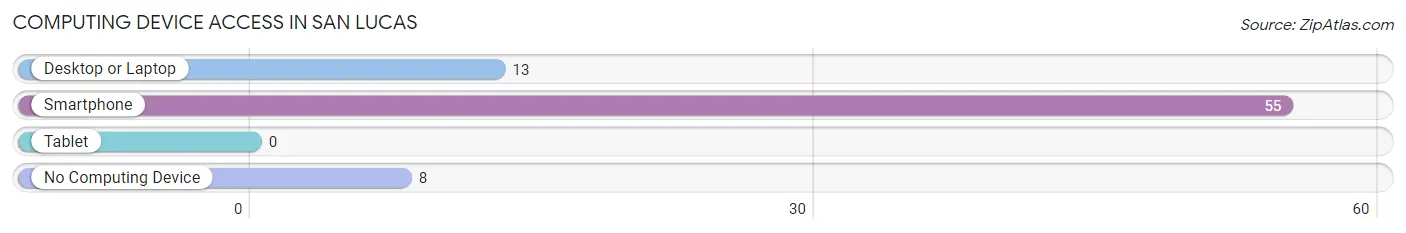
| Device Type | # Households | % Households |
| Desktop or Laptop | 13 | 20.6% |
| Smartphone | 55 | 87.3% |
| Tablet | 0 | 0.0% |
| No Computing Device | 8 | 12.7% |
| Total | 63 | 100.0% |
Internet Access in San Lucas
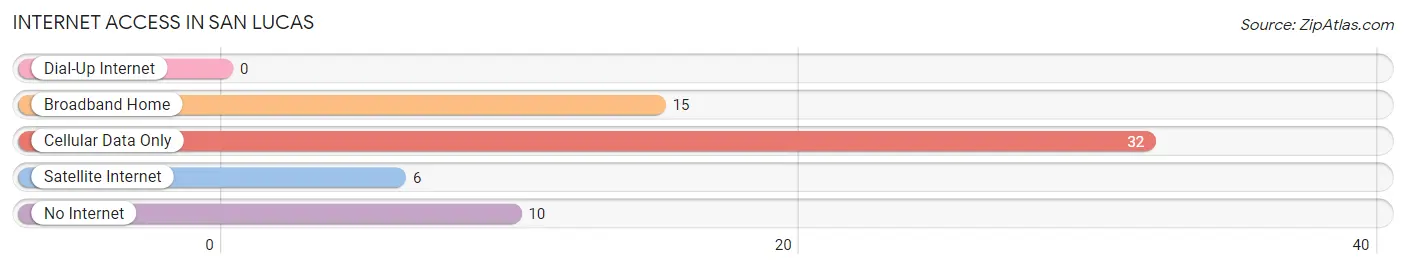
| Internet Type | # Households | % Households |
| Dial-Up Internet | 0 | 0.0% |
| Broadband Home | 15 | 23.8% |
| Cellular Data Only | 32 | 50.8% |
| Satellite Internet | 6 | 9.5% |
| No Internet | 10 | 15.9% |
| Total | 63 | 100.0% |
San Lucas Summary
Lucas, California is a small unincorporated community located in the San Joaquin Valley of California. It is situated in the northern part of Fresno County, approximately 20 miles south of Fresno. The population of San Lucas was estimated to be 1,845 in the year 2000.
History
San Lucas was founded in 1871 by a group of settlers from the nearby town of Coalinga. The settlers were looking for a place to settle and farm, and they chose the area around San Lucas because of its fertile soil and abundant water supply. The town was named after the nearby San Lucas Creek, which was named after the Spanish mission of San Lucas de Tolimán.
The town grew quickly, and by the early 1900s it had become a thriving agricultural center. The main crops grown in the area were cotton, wheat, and barley. The town also had a number of businesses, including a general store, a blacksmith shop, and a hotel.
In the early 1900s, the town was also home to a number of Chinese immigrants who had come to work in the area’s agricultural industry. The Chinese immigrants were instrumental in the development of the town, and they established a number of businesses, including a laundry, a grocery store, and a restaurant.
Geography
San Lucas is located in the northern part of Fresno County, approximately 20 miles south of Fresno. The town is situated in the San Joaquin Valley, which is a large agricultural region in central California. The valley is surrounded by the Sierra Nevada Mountains to the east and the Coast Range to the west.
The climate in San Lucas is generally mild, with hot summers and cool winters. The average annual temperature is around 65 degrees Fahrenheit. The area receives an average of 10 inches of rain per year.
Economy
The economy of San Lucas is largely based on agriculture. The main crops grown in the area are cotton, wheat, and barley. The town also has a number of businesses, including a general store, a blacksmith shop, and a hotel.
The town is also home to a number of small manufacturing businesses, including a furniture factory and a cannery. The town also has a number of restaurants and bars.
Demographics
The population of San Lucas was estimated to be 1,845 in the year 2000. The racial makeup of the town was 75.3% White, 0.7% African American, 0.3% Native American, 0.2% Asian, 0.1% Pacific Islander, and 22.4% from other races. The median household income was $25,938.
Conclusion
San Lucas is a small unincorporated community located in the San Joaquin Valley of California. It is situated in the northern part of Fresno County, approximately 20 miles south of Fresno. The population of San Lucas was estimated to be 1,845 in the year 2000. The economy of San Lucas is largely based on agriculture, and the town also has a number of businesses, including a general store, a blacksmith shop, and a hotel. The racial makeup of the town was 75.3% White, 0.7% African American, 0.3% Native American, 0.2% Asian, 0.1% Pacific Islander, and 22.4% from other races. The median household income was $25,938. San Lucas is a small but vibrant community that has a rich history and a bright future.
Common Questions
What is Per Capita Income in San Lucas?
Per Capita income in San Lucas is $12,468.
What is the Median Family Income in San Lucas?
Median Family Income in San Lucas is $64,250.
What is the Median Household income in San Lucas?
Median Household Income in San Lucas is $64,750.
What is Income or Wage Gap in San Lucas?
Income or Wage Gap in San Lucas is 30.7%.
Women in San Lucas earn 69.3 cents for every dollar earned by a man.
What is Inequality or Gini Index in San Lucas?
Inequality or Gini Index in San Lucas is 0.26.
What is the Total Population of San Lucas?
Total Population of San Lucas is 377.
What is the Total Male Population of San Lucas?
Total Male Population of San Lucas is 175.
What is the Total Female Population of San Lucas?
Total Female Population of San Lucas is 202.
What is the Ratio of Males per 100 Females in San Lucas?
There are 86.63 Males per 100 Females in San Lucas.
What is the Ratio of Females per 100 Males in San Lucas?
There are 115.43 Females per 100 Males in San Lucas.
What is the Median Population Age in San Lucas?
Median Population Age in San Lucas is 19.8 Years.
What is the Average Family Size in San Lucas
Average Family Size in San Lucas is 6.0 People.
What is the Average Household Size in San Lucas
Average Household Size in San Lucas is 6.0 People.
How Large is the Labor Force in San Lucas?
There are 126 People in the Labor Forcein in San Lucas.
What is the Percentage of People in the Labor Force in San Lucas?
57.8% of People are in the Labor Force in San Lucas.