Bigfoot, TX Map & Demographics
Bigfoot Map
Bigfoot Overview
$34,172
PER CAPITA INCOME
$66,213
AVG FAMILY INCOME
$65,669
AVG HOUSEHOLD INCOME
51.2%
WAGE / INCOME GAP [ % ]
48.8¢/ $1
WAGE / INCOME GAP [ $ ]
0.36
INEQUALITY / GINI INDEX
1,012
TOTAL POPULATION
631
MALE POPULATION
381
FEMALE POPULATION
165.62
MALES / 100 FEMALES
60.38
FEMALES / 100 MALES
41.3
MEDIAN AGE
2.6
AVG FAMILY SIZE
2.3
AVG HOUSEHOLD SIZE
735
LABOR FORCE [ PEOPLE ]
72.6%
PERCENT IN LABOR FORCE
Bigfoot Zip Codes
Bigfoot Area Codes
Income in Bigfoot
Income Overview in Bigfoot
Per Capita Income in Bigfoot is $34,172, while median incomes of families and households are $66,213 and $65,669 respectively.
| Characteristic | Number | Measure |
| Per Capita Income | 1,012 | $34,172 |
| Median Family Income | 361 | $66,213 |
| Mean Family Income | 361 | $65,417 |
| Median Household Income | 435 | $65,669 |
| Mean Household Income | 435 | $56,876 |
| Income Deficit | 361 | $0 |
| Wage / Income Gap (%) | 1,012 | 51.20% |
| Wage / Income Gap ($) | 1,012 | 48.80¢ per $1 |
| Gini / Inequality Index | 1,012 | 0.36 |
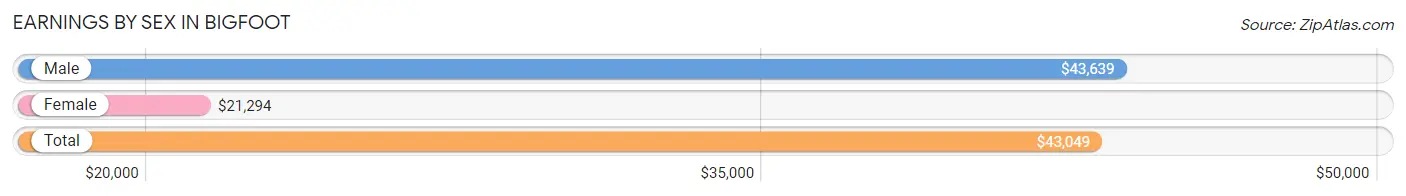
Earnings by Sex in Bigfoot
Average Earnings in Bigfoot are $43,049, $43,639 for men and $21,294 for women, a difference of 51.2%.
| Sex | Number | Average Earnings |
| Male | 536 (72.6%) | $43,639 |
| Female | 202 (27.4%) | $21,294 |
| Total | 738 (100.0%) | $43,049 |
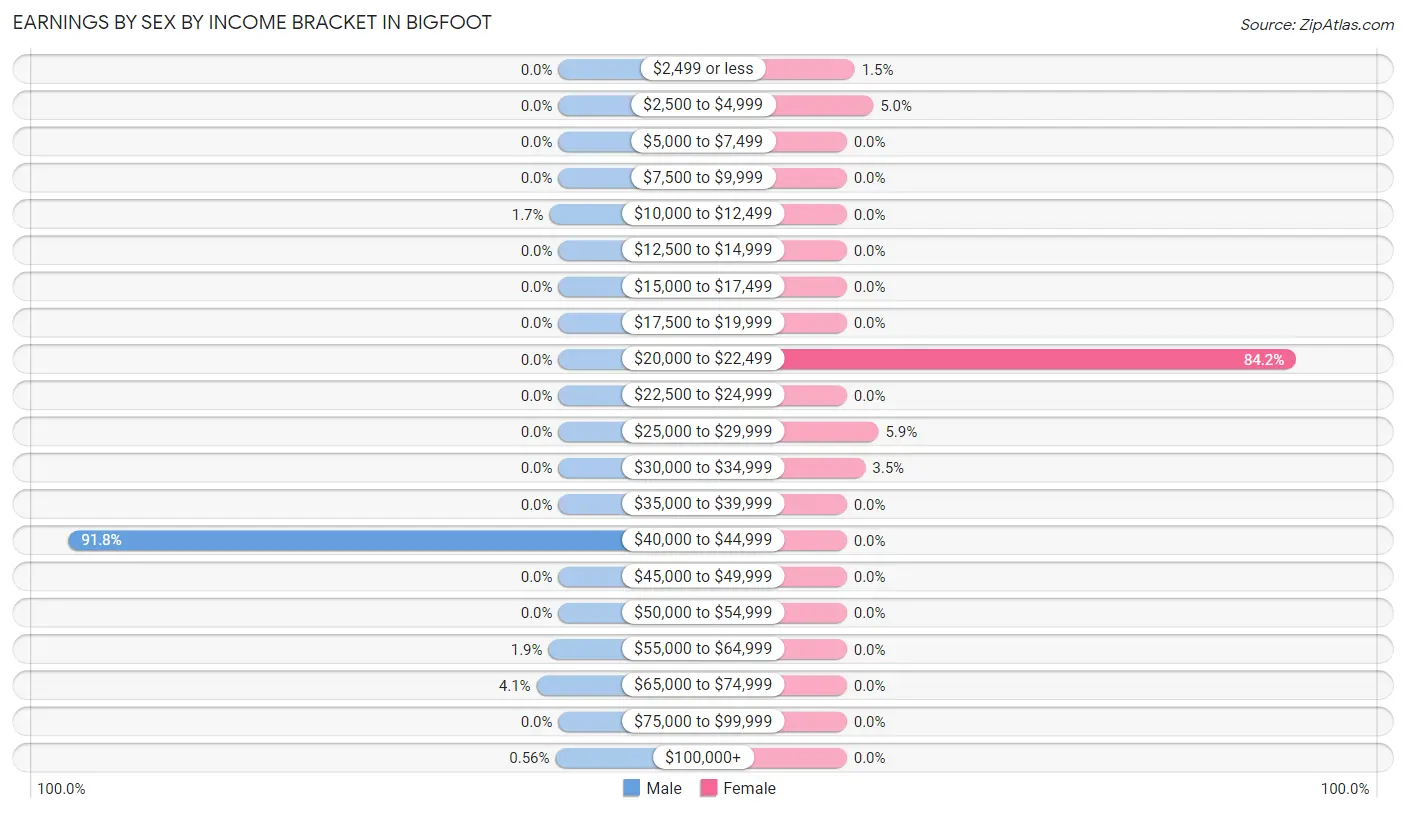
Earnings by Sex by Income Bracket in Bigfoot
The most common earnings brackets in Bigfoot are $40,000 to $44,999 for men (492 | 91.8%) and $20,000 to $22,499 for women (170 | 84.2%).
| Income | Male | Female |
| $2,499 or less | 0 (0.0%) | 3 (1.5%) |
| $2,500 to $4,999 | 0 (0.0%) | 10 (5.0%) |
| $5,000 to $7,499 | 0 (0.0%) | 0 (0.0%) |
| $7,500 to $9,999 | 0 (0.0%) | 0 (0.0%) |
| $10,000 to $12,499 | 9 (1.7%) | 0 (0.0%) |
| $12,500 to $14,999 | 0 (0.0%) | 0 (0.0%) |
| $15,000 to $17,499 | 0 (0.0%) | 0 (0.0%) |
| $17,500 to $19,999 | 0 (0.0%) | 0 (0.0%) |
| $20,000 to $22,499 | 0 (0.0%) | 170 (84.2%) |
| $22,500 to $24,999 | 0 (0.0%) | 0 (0.0%) |
| $25,000 to $29,999 | 0 (0.0%) | 12 (5.9%) |
| $30,000 to $34,999 | 0 (0.0%) | 7 (3.5%) |
| $35,000 to $39,999 | 0 (0.0%) | 0 (0.0%) |
| $40,000 to $44,999 | 492 (91.8%) | 0 (0.0%) |
| $45,000 to $49,999 | 0 (0.0%) | 0 (0.0%) |
| $50,000 to $54,999 | 0 (0.0%) | 0 (0.0%) |
| $55,000 to $64,999 | 10 (1.9%) | 0 (0.0%) |
| $65,000 to $74,999 | 22 (4.1%) | 0 (0.0%) |
| $75,000 to $99,999 | 0 (0.0%) | 0 (0.0%) |
| $100,000+ | 3 (0.6%) | 0 (0.0%) |
| Total | 536 (100.0%) | 202 (100.0%) |
Earnings by Sex by Educational Attainment in Bigfoot
| Educational Attainment | Male Income | Female Income |
| Less than High School | - | - |
| High School Diploma | - | - |
| College or Associate's Degree | - | - |
| Bachelor's Degree | - | - |
| Graduate Degree | - | - |
| Total | $43,665 | $21,368 |
Family Income in Bigfoot
Family Income Brackets in Bigfoot
According to the Bigfoot family income data, there are 180 families falling into the $50,000 to $74,999 income range, which is the most common income bracket and makes up 49.9% of all families.
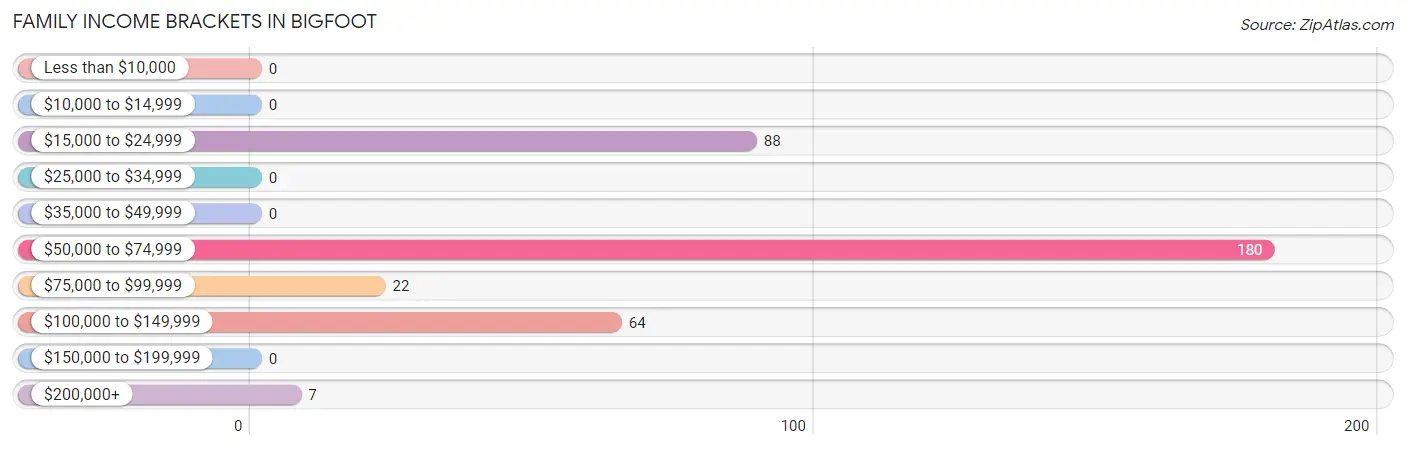
| Income Bracket | # Families | % Families |
| Less than $10,000 | 0 | 0.0% |
| $10,000 to $14,999 | 0 | 0.0% |
| $15,000 to $24,999 | 88 | 24.4% |
| $25,000 to $34,999 | 0 | 0.0% |
| $35,000 to $49,999 | 0 | 0.0% |
| $50,000 to $74,999 | 180 | 49.9% |
| $75,000 to $99,999 | 22 | 6.1% |
| $100,000 to $149,999 | 64 | 17.7% |
| $150,000 to $199,999 | 0 | 0.0% |
| $200,000+ | 7 | 1.9% |
Family Income by Famaliy Size in Bigfoot
2-person families (349 | 96.7%) account for the highest median family income in Bigfoot with $66,125 per family, while 2-person families (349 | 96.7%) have the highest median income of $33,062 per family member.
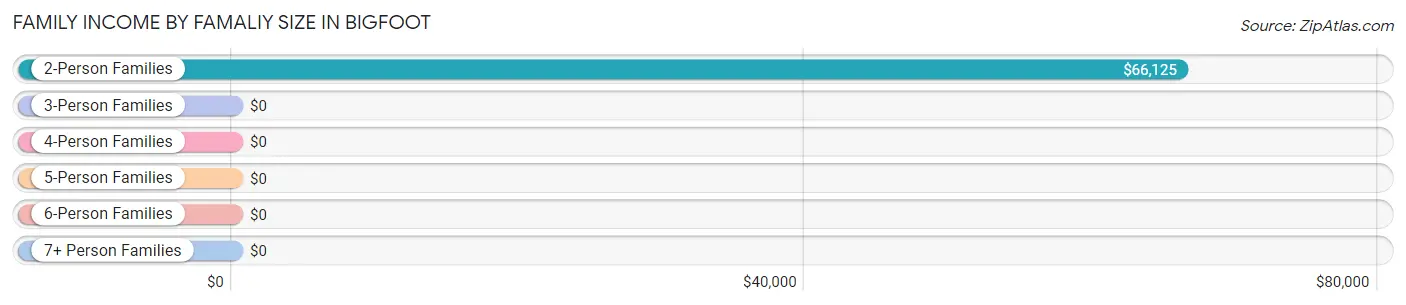
| Income Bracket | # Families | Median Income |
| 2-Person Families | 349 (96.7%) | $66,125 |
| 3-Person Families | 5 (1.4%) | $0 |
| 4-Person Families | 7 (1.9%) | $0 |
| 5-Person Families | 0 (0.0%) | $0 |
| 6-Person Families | 0 (0.0%) | $0 |
| 7+ Person Families | 0 (0.0%) | $0 |
| Total | 361 (100.0%) | $66,213 |
Family Income by Number of Earners in Bigfoot
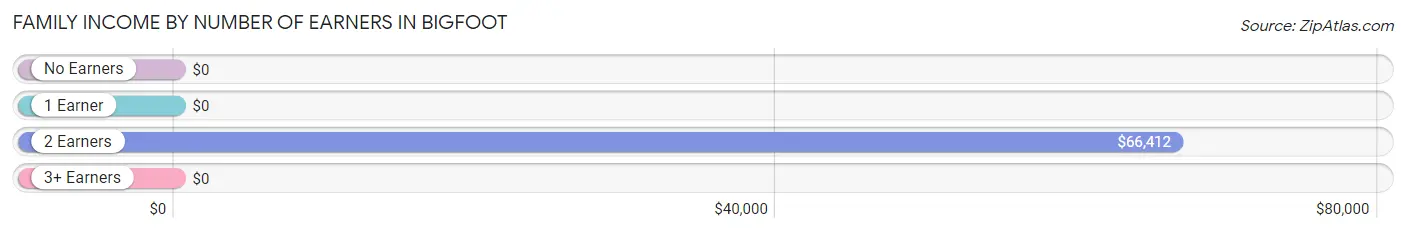
| Number of Earners | # Families | Median Income |
| No Earners | 88 (24.4%) | $0 |
| 1 Earner | 74 (20.5%) | $0 |
| 2 Earners | 192 (53.2%) | $66,412 |
| 3+ Earners | 7 (1.9%) | $0 |
| Total | 361 (100.0%) | $66,213 |
Household Income in Bigfoot
Household Income Brackets in Bigfoot
With 180 households falling in the category, the $50,000 to $74,999 income range is the most frequent in Bigfoot, accounting for 41.4% of all households.
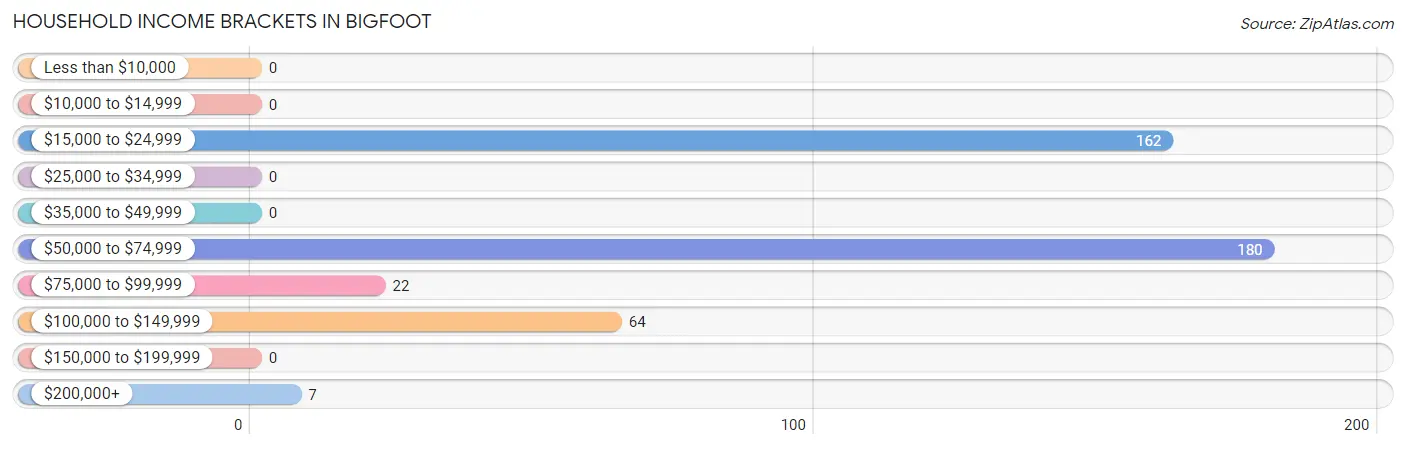
| Income Bracket | # Households | % Households |
| Less than $10,000 | 0 | 0.0% |
| $10,000 to $14,999 | 0 | 0.0% |
| $15,000 to $24,999 | 162 | 37.2% |
| $25,000 to $34,999 | 0 | 0.0% |
| $35,000 to $49,999 | 0 | 0.0% |
| $50,000 to $74,999 | 180 | 41.4% |
| $75,000 to $99,999 | 22 | 5.1% |
| $100,000 to $149,999 | 64 | 14.7% |
| $150,000 to $199,999 | 0 | 0.0% |
| $200,000+ | 7 | 1.6% |
Household Income by Householder Age in Bigfoot
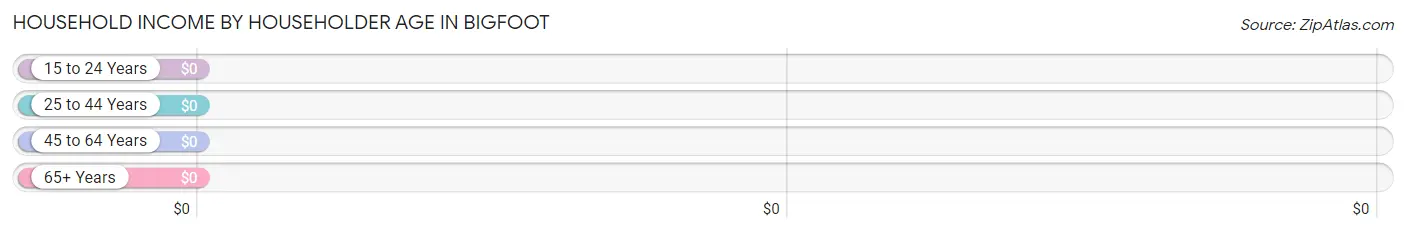
| Income Bracket | # Households | Median Income |
| 15 to 24 Years | 0 (0.0%) | $0 |
| 25 to 44 Years | 170 (39.1%) | $0 |
| 45 to 64 Years | 29 (6.7%) | $0 |
| 65+ Years | 236 (54.2%) | $0 |
| Total | 435 (100.0%) | $65,669 |
Poverty in Bigfoot
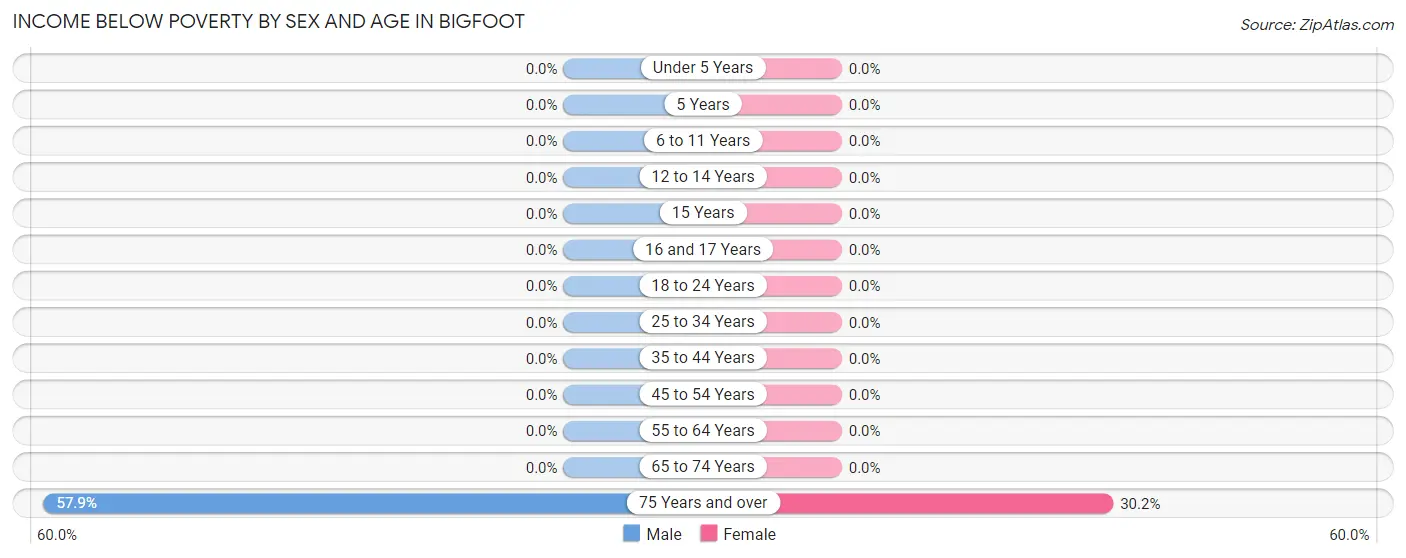
Income Below Poverty by Sex and Age in Bigfoot
With 14.0% poverty level for males and 13.7% for females among the residents of Bigfoot, 75 year old and over males and 75 year old and over females are the most vulnerable to poverty, with 88 males (57.9%) and 52 females (30.2%) in their respective age groups living below the poverty level.
| Age Bracket | Male | Female |
| Under 5 Years | 0 (0.0%) | 0 (0.0%) |
| 5 Years | 0 (0.0%) | 0 (0.0%) |
| 6 to 11 Years | 0 (0.0%) | 0 (0.0%) |
| 12 to 14 Years | 0 (0.0%) | 0 (0.0%) |
| 15 Years | 0 (0.0%) | 0 (0.0%) |
| 16 and 17 Years | 0 (0.0%) | 0 (0.0%) |
| 18 to 24 Years | 0 (0.0%) | 0 (0.0%) |
| 25 to 34 Years | 0 (0.0%) | 0 (0.0%) |
| 35 to 44 Years | 0 (0.0%) | 0 (0.0%) |
| 45 to 54 Years | 0 (0.0%) | 0 (0.0%) |
| 55 to 64 Years | 0 (0.0%) | 0 (0.0%) |
| 65 to 74 Years | 0 (0.0%) | 0 (0.0%) |
| 75 Years and over | 88 (57.9%) | 52 (30.2%) |
| Total | 88 (14.0%) | 52 (13.7%) |
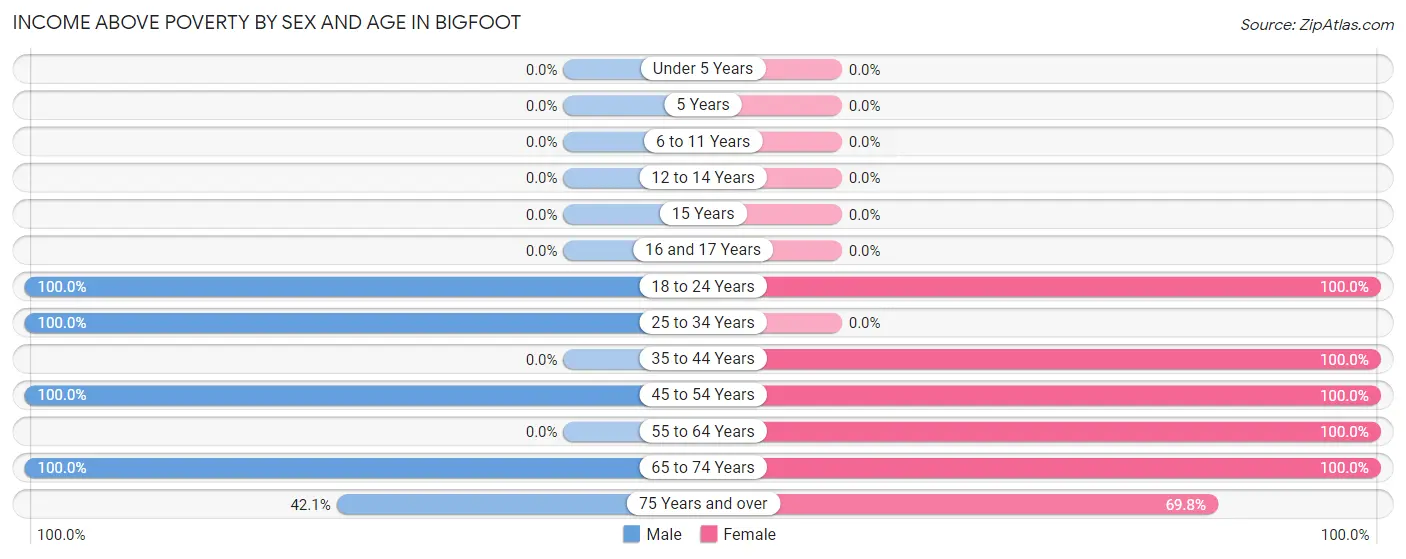
Income Above Poverty by Sex and Age in Bigfoot
According to the poverty statistics in Bigfoot, males aged 18 to 24 years and females aged 18 to 24 years are the age groups that are most secure financially, with 100.0% of males and 100.0% of females in these age groups living above the poverty line.
| Age Bracket | Male | Female |
| Under 5 Years | 0 (0.0%) | 0 (0.0%) |
| 5 Years | 0 (0.0%) | 0 (0.0%) |
| 6 to 11 Years | 0 (0.0%) | 0 (0.0%) |
| 12 to 14 Years | 0 (0.0%) | 0 (0.0%) |
| 15 Years | 0 (0.0%) | 0 (0.0%) |
| 16 and 17 Years | 0 (0.0%) | 0 (0.0%) |
| 18 to 24 Years | 16 (100.0%) | 10 (100.0%) |
| 25 to 34 Years | 428 (100.0%) | 0 (0.0%) |
| 35 to 44 Years | 0 (0.0%) | 170 (100.0%) |
| 45 to 54 Years | 25 (100.0%) | 10 (100.0%) |
| 55 to 64 Years | 0 (0.0%) | 12 (100.0%) |
| 65 to 74 Years | 10 (100.0%) | 7 (100.0%) |
| 75 Years and over | 64 (42.1%) | 120 (69.8%) |
| Total | 543 (86.1%) | 329 (86.4%) |
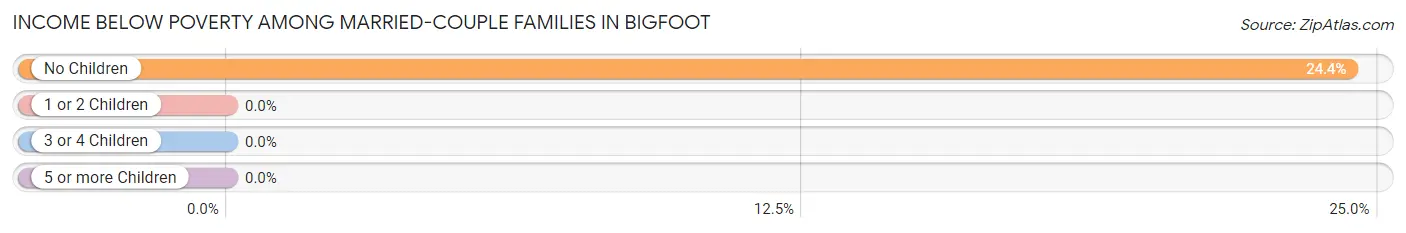
Income Below Poverty Among Married-Couple Families in Bigfoot
The poverty statistics for married-couple families in Bigfoot show that 24.4% or 88 of the total 361 families live below the poverty line. Families with no children have the highest poverty rate of 24.4%, comprising of 88 families. On the other hand, families with no children have the lowest poverty rate of 24.4%, which includes 88 families.
| Children | Above Poverty | Below Poverty |
| No Children | 273 (75.6%) | 88 (24.4%) |
| 1 or 2 Children | 0 (0.0%) | 0 (0.0%) |
| 3 or 4 Children | 0 (0.0%) | 0 (0.0%) |
| 5 or more Children | 0 (0.0%) | 0 (0.0%) |
| Total | 273 (75.6%) | 88 (24.4%) |
Income Below Poverty Among Single-Parent Households in Bigfoot
| Children | Single Father | Single Mother |
| No Children | 0 (0.0%) | 0 (0.0%) |
| 1 or 2 Children | 0 (0.0%) | 0 (0.0%) |
| 3 or 4 Children | 0 (0.0%) | 0 (0.0%) |
| 5 or more Children | 0 (0.0%) | 0 (0.0%) |
| Total | 0 (0.0%) | 0 (0.0%) |
Income Below Poverty Among Married-Couple vs Single-Parent Households in Bigfoot
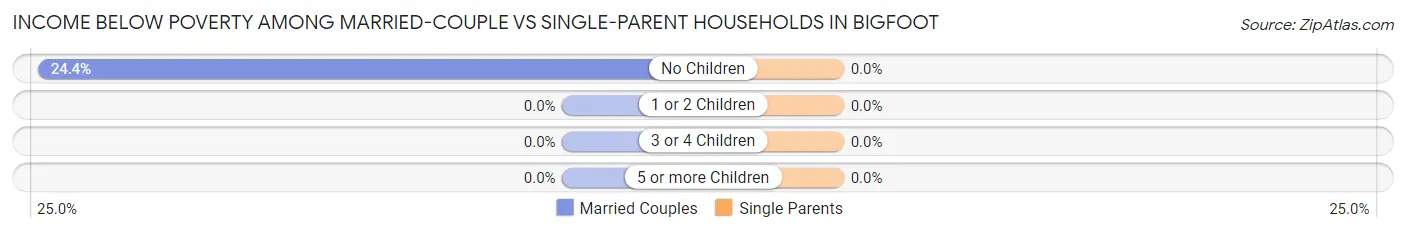
| Children | Married-Couple Families | Single-Parent Households |
| No Children | 88 (24.4%) | 0 (0.0%) |
| 1 or 2 Children | 0 (0.0%) | 0 (0.0%) |
| 3 or 4 Children | 0 (0.0%) | 0 (0.0%) |
| 5 or more Children | 0 (0.0%) | 0 (0.0%) |
| Total | 88 (24.4%) | 0 (0.0%) |
Race in Bigfoot
The most populous races in Bigfoot are White / Caucasian (983 | 97.1%), Hispanic or Latino (767 | 75.8%), and Two or more Races (29 | 2.9%).
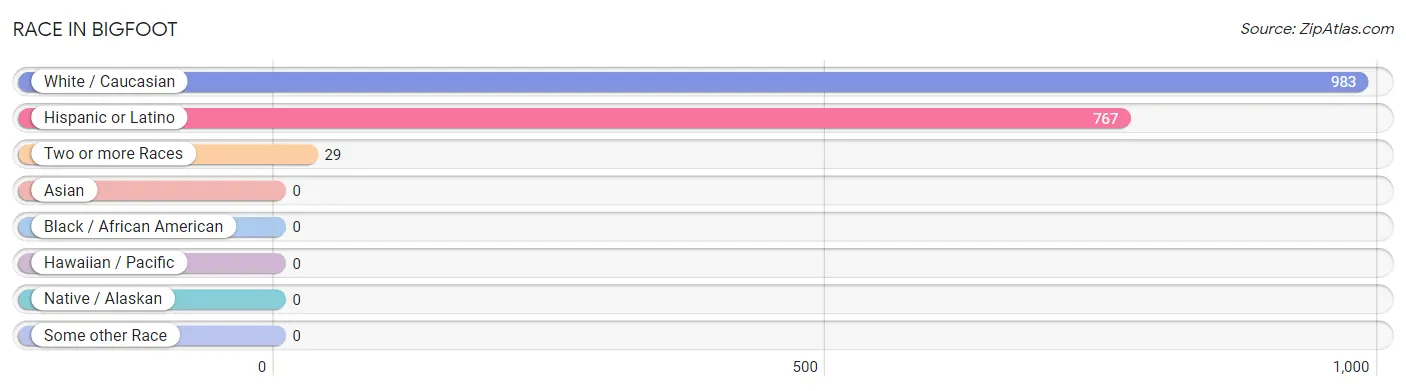
| Race | # Population | % Population |
| Asian | 0 | 0.0% |
| Black / African American | 0 | 0.0% |
| Hawaiian / Pacific | 0 | 0.0% |
| Hispanic or Latino | 767 | 75.8% |
| Native / Alaskan | 0 | 0.0% |
| White / Caucasian | 983 | 97.1% |
| Two or more Races | 29 | 2.9% |
| Some other Race | 0 | 0.0% |
| Total | 1,012 | 100.0% |
Ancestry in Bigfoot
The most populous ancestries reported in Bigfoot are Mexican (767 | 75.8%), English (10 | 1.0%), German (10 | 1.0%), American (7 | 0.7%), and Dutch (7 | 0.7%), together accounting for 79.2% of all Bigfoot residents.
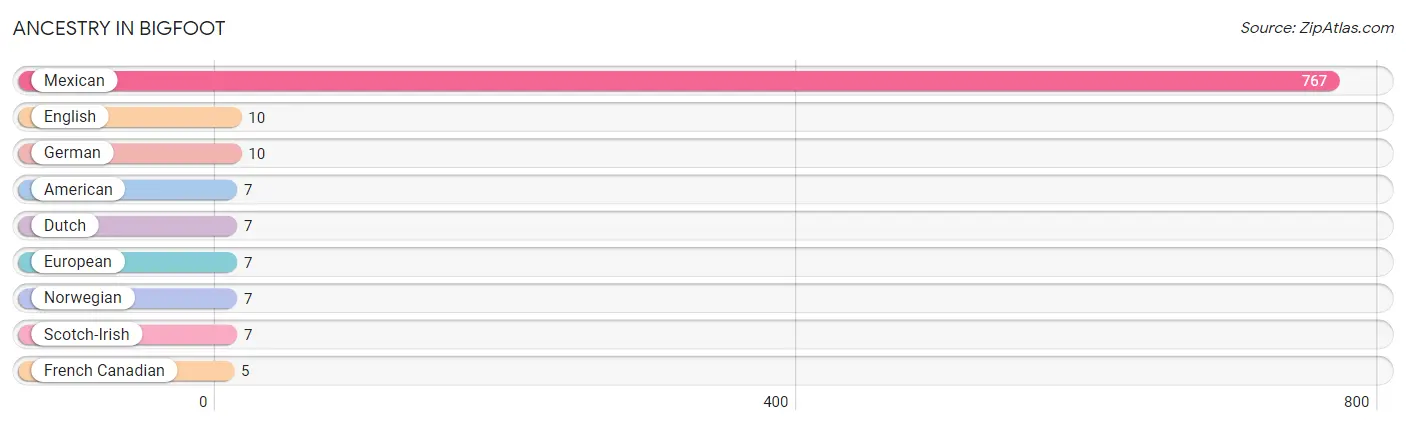
| Ancestry | # Population | % Population |
| American | 7 | 0.7% |
| Dutch | 7 | 0.7% |
| English | 10 | 1.0% |
| European | 7 | 0.7% |
| French Canadian | 5 | 0.5% |
| German | 10 | 1.0% |
| Mexican | 767 | 75.8% |
| Norwegian | 7 | 0.7% |
| Scotch-Irish | 7 | 0.7% | View All 9 Rows |
Immigrants in Bigfoot
The most numerous immigrant groups reported in Bigfoot came from Central America (428 | 42.3%), Latin America (428 | 42.3%), and Mexico (428 | 42.3%), together accounting for 126.9% of all Bigfoot residents.
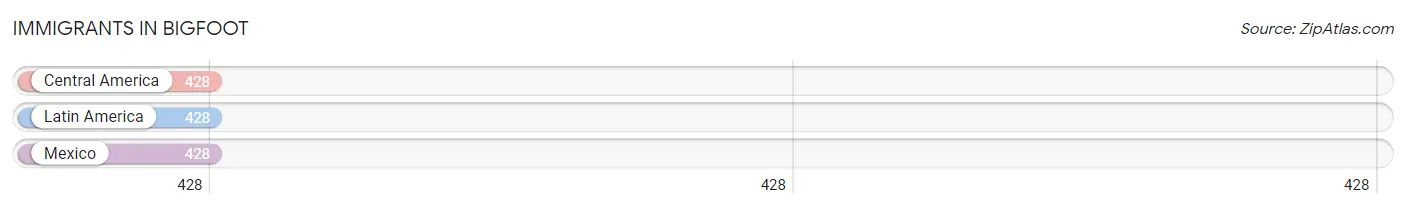
| Immigration Origin | # Population | % Population |
| Central America | 428 | 42.3% |
| Latin America | 428 | 42.3% |
| Mexico | 428 | 42.3% | View All 3 Rows |
Sex and Age in Bigfoot
Sex and Age in Bigfoot
The most populous age groups in Bigfoot are 25 to 29 Years (428 | 67.8%) for men and 40 to 44 Years (170 | 44.6%) for women.
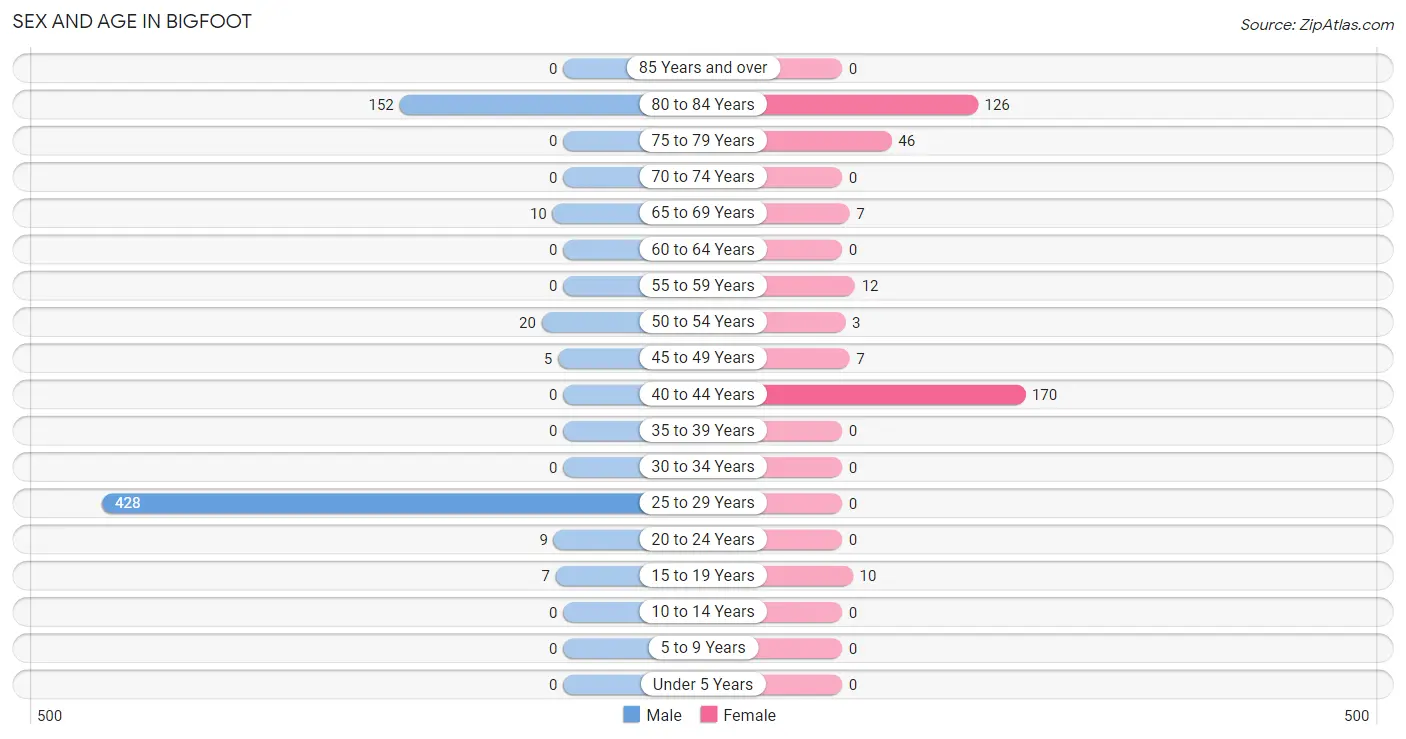
| Age Bracket | Male | Female |
| Under 5 Years | 0 (0.0%) | 0 (0.0%) |
| 5 to 9 Years | 0 (0.0%) | 0 (0.0%) |
| 10 to 14 Years | 0 (0.0%) | 0 (0.0%) |
| 15 to 19 Years | 7 (1.1%) | 10 (2.6%) |
| 20 to 24 Years | 9 (1.4%) | 0 (0.0%) |
| 25 to 29 Years | 428 (67.8%) | 0 (0.0%) |
| 30 to 34 Years | 0 (0.0%) | 0 (0.0%) |
| 35 to 39 Years | 0 (0.0%) | 0 (0.0%) |
| 40 to 44 Years | 0 (0.0%) | 170 (44.6%) |
| 45 to 49 Years | 5 (0.8%) | 7 (1.8%) |
| 50 to 54 Years | 20 (3.2%) | 3 (0.8%) |
| 55 to 59 Years | 0 (0.0%) | 12 (3.2%) |
| 60 to 64 Years | 0 (0.0%) | 0 (0.0%) |
| 65 to 69 Years | 10 (1.6%) | 7 (1.8%) |
| 70 to 74 Years | 0 (0.0%) | 0 (0.0%) |
| 75 to 79 Years | 0 (0.0%) | 46 (12.1%) |
| 80 to 84 Years | 152 (24.1%) | 126 (33.1%) |
| 85 Years and over | 0 (0.0%) | 0 (0.0%) |
| Total | 631 (100.0%) | 381 (100.0%) |
Families and Households in Bigfoot
Median Family Size in Bigfoot
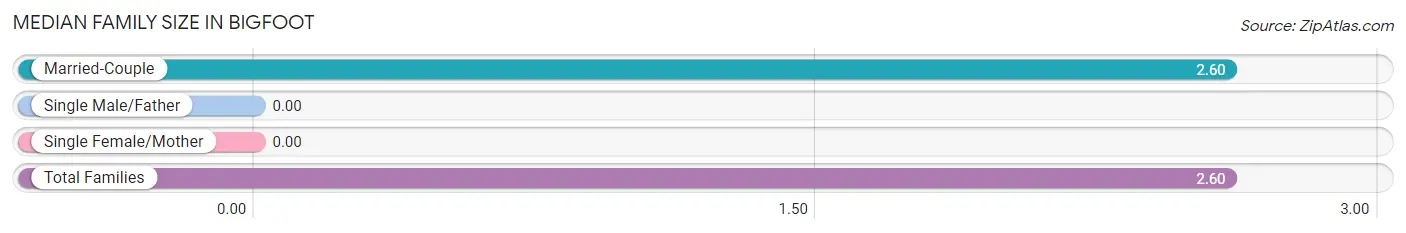
| Family Type | # Families | Family Size |
| Married-Couple | 361 (100.0%) | 2.60 |
| Single Male/Father | 0 (0.0%) | - |
| Single Female/Mother | 0 (0.0%) | - |
| Total Families | 361 (100.0%) | 2.60 |
Median Household Size in Bigfoot
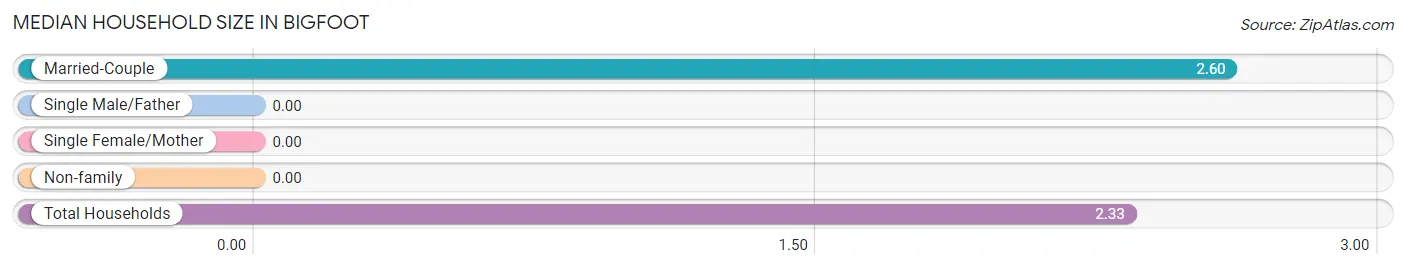
| Household Type | # Households | Household Size |
| Married-Couple | 361 (83.0%) | 2.60 |
| Single Male/Father | 0 (0.0%) | - |
| Single Female/Mother | 0 (0.0%) | - |
| Non-family | 74 (17.0%) | - |
| Total Households | 435 (100.0%) | 2.33 |
Household Size by Marriage Status in Bigfoot
Out of a total of 435 households in Bigfoot, 361 (83.0%) are family households, while 74 (17.0%) are nonfamily households. The most numerous type of family households are 2-person households, comprising 349, and the most common type of nonfamily households are 1-person households, comprising 74.
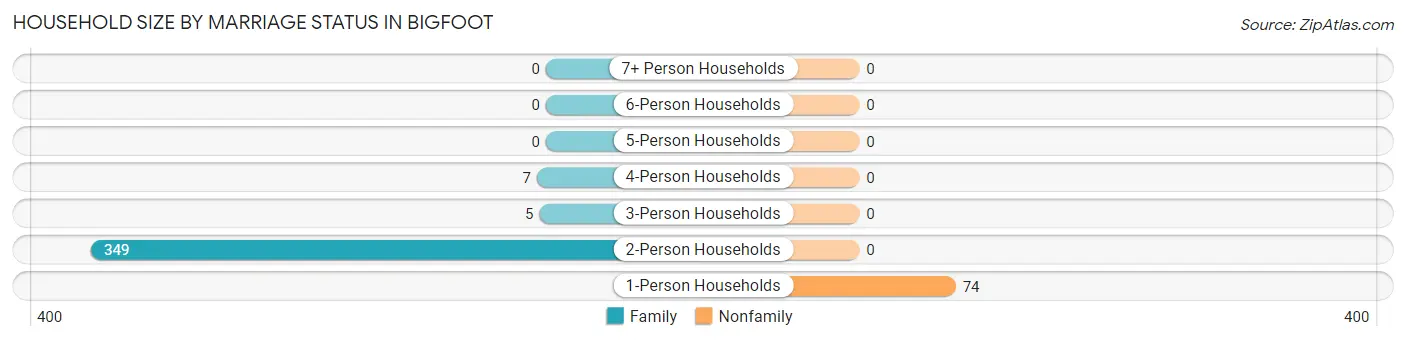
| Household Size | Family Households | Nonfamily Households |
| 1-Person Households | - | 74 (17.0%) |
| 2-Person Households | 349 (80.2%) | 0 (0.0%) |
| 3-Person Households | 5 (1.1%) | 0 (0.0%) |
| 4-Person Households | 7 (1.6%) | 0 (0.0%) |
| 5-Person Households | 0 (0.0%) | 0 (0.0%) |
| 6-Person Households | 0 (0.0%) | 0 (0.0%) |
| 7+ Person Households | 0 (0.0%) | 0 (0.0%) |
| Total | 361 (83.0%) | 74 (17.0%) |
Female Fertility in Bigfoot
Fertility by Age in Bigfoot
| Age Bracket | Women with Births | Births / 1,000 Women |
| 15 to 19 years | 0 (0.0%) | 0.0 |
| 20 to 34 years | 0 (0.0%) | 0.0 |
| 35 to 50 years | 0 (0.0%) | 0.0 |
| Total | 0 (0.0%) | 0.0 |
Fertility by Age by Marriage Status in Bigfoot
| Age Bracket | Married | Unmarried |
| 15 to 19 years | 0 (0.0%) | 0 (0.0%) |
| 20 to 34 years | 0 (0.0%) | 0 (0.0%) |
| 35 to 50 years | 0 (0.0%) | 0 (0.0%) |
| Total | 0 (0.0%) | 0 (0.0%) |
Fertility by Education in Bigfoot
| Educational Attainment | Women with Births | Births / 1,000 Women |
| Less than High School | 0 (0.0%) | 0.0 |
| High School Diploma | 0 (0.0%) | 0.0 |
| College or Associate's Degree | 0 (0.0%) | 0.0 |
| Bachelor's Degree | 0 (0.0%) | 0.0 |
| Graduate Degree | 0 (0.0%) | 0.0 |
| Total | 0 (0.0%) | 0.0 |
Fertility by Education by Marriage Status in Bigfoot
| Educational Attainment | Married | Unmarried |
| Less than High School | 0 (0.0%) | 0 (0.0%) |
| High School Diploma | 0 (0.0%) | 0 (0.0%) |
| College or Associate's Degree | 0 (0.0%) | 0 (0.0%) |
| Bachelor's Degree | 0 (0.0%) | 0 (0.0%) |
| Graduate Degree | 0 (0.0%) | 0 (0.0%) |
| Total | 0 (0.0%) | 0 (0.0%) |
Employment Characteristics in Bigfoot
Employment by Class of Employer in Bigfoot
Among the 735 employed individuals in Bigfoot, private company employees (664 | 90.3%), and not-for-profit organizations (71 | 9.7%) make up the most common classes of employment.
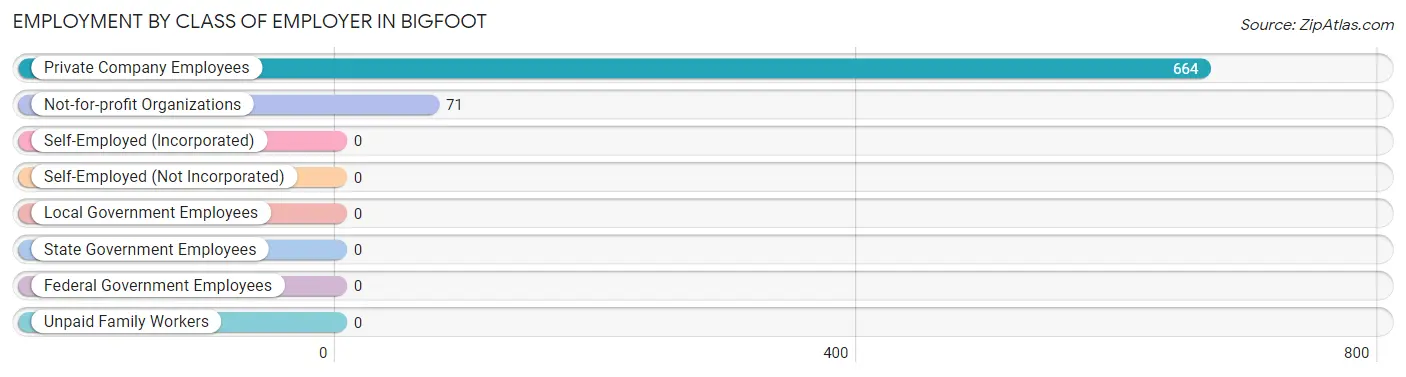
| Employer Class | # Employees | % Employees |
| Private Company Employees | 664 | 90.3% |
| Self-Employed (Incorporated) | 0 | 0.0% |
| Self-Employed (Not Incorporated) | 0 | 0.0% |
| Not-for-profit Organizations | 71 | 9.7% |
| Local Government Employees | 0 | 0.0% |
| State Government Employees | 0 | 0.0% |
| Federal Government Employees | 0 | 0.0% |
| Unpaid Family Workers | 0 | 0.0% |
| Total | 735 | 100.0% |
Employment Status by Age in Bigfoot
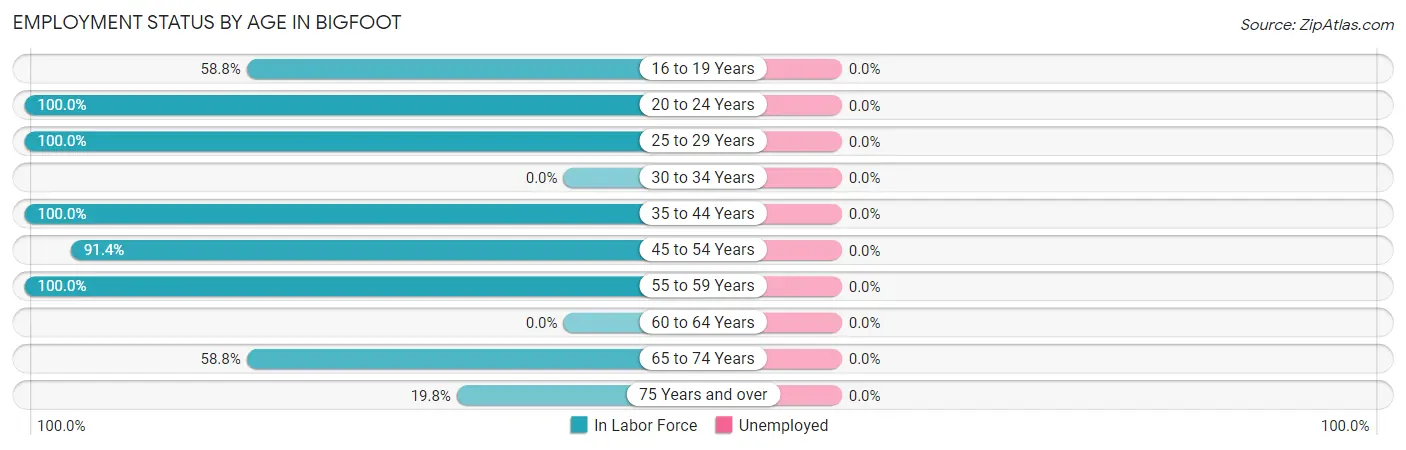
| Age Bracket | In Labor Force | Unemployed |
| 16 to 19 Years | 10 (58.8%) | 0 (0.0%) |
| 20 to 24 Years | 9 (100.0%) | 0 (0.0%) |
| 25 to 29 Years | 428 (100.0%) | 0 (0.0%) |
| 30 to 34 Years | 0 (0.0%) | 0 (0.0%) |
| 35 to 44 Years | 170 (100.0%) | 0 (0.0%) |
| 45 to 54 Years | 32 (91.4%) | 0 (0.0%) |
| 55 to 59 Years | 12 (100.0%) | 0 (0.0%) |
| 60 to 64 Years | 0 (0.0%) | 0 (0.0%) |
| 65 to 74 Years | 10 (58.8%) | 0 (0.0%) |
| 75 Years and over | 64 (19.8%) | 0 (0.0%) |
| Total | 735 (72.6%) | 0 (0.0%) |
Employment Status by Educational Attainment in Bigfoot
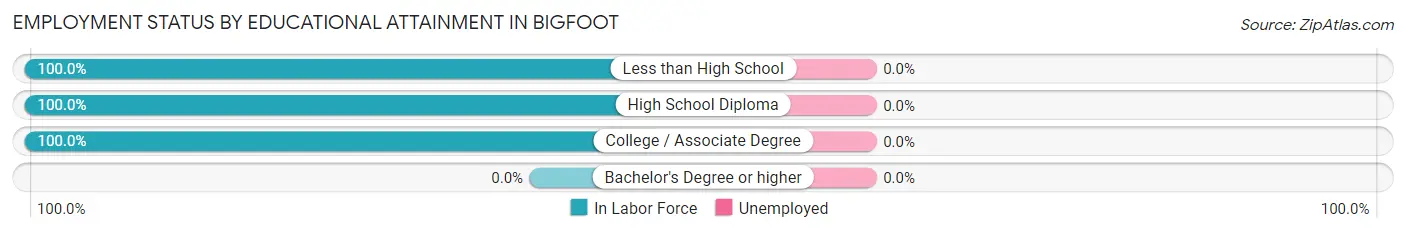
| Educational Attainment | In Labor Force | Unemployed |
| Less than High School | 428 (100.0%) | 0 (0.0%) |
| High School Diploma | 202 (100.0%) | 0 (0.0%) |
| College / Associate Degree | 12 (100.0%) | 0 (0.0%) |
| Bachelor's Degree or higher | 0 (0.0%) | 0 (0.0%) |
| Total | 642 (99.5%) | 0 (0.0%) |
Employment Occupations by Sex in Bigfoot
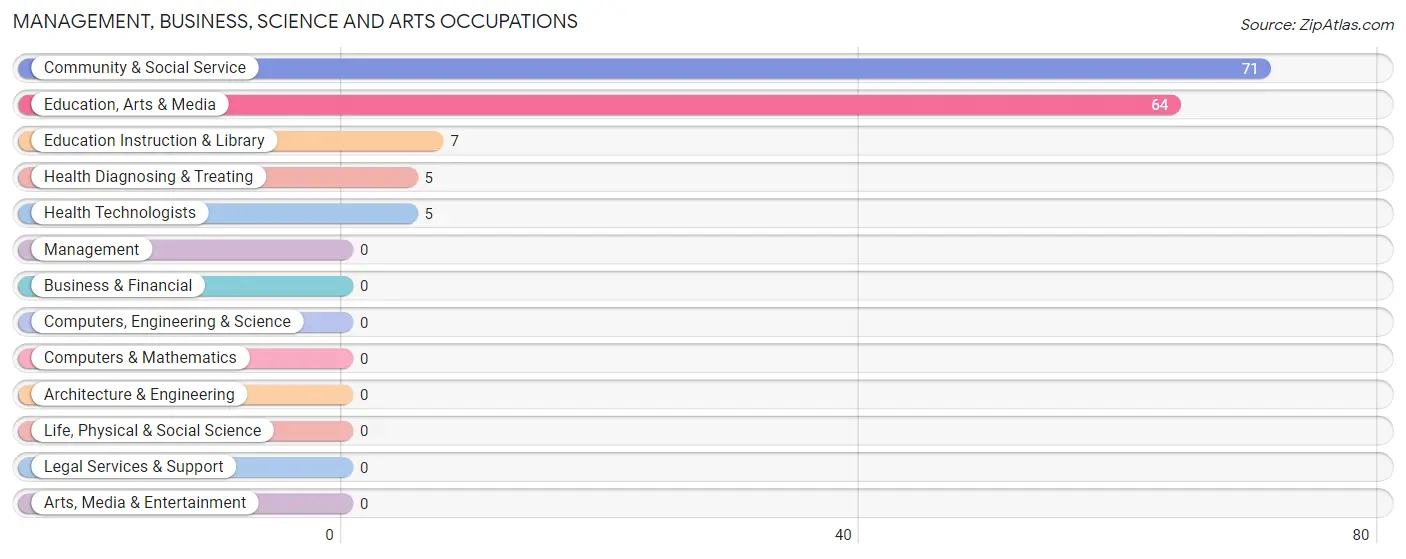
Management, Business, Science and Arts Occupations
The most common Management, Business, Science and Arts occupations in Bigfoot are Community & Social Service (71 | 9.7%), Education, Arts & Media (64 | 8.7%), Education Instruction & Library (7 | 0.9%), Health Diagnosing & Treating (5 | 0.7%), and Health Technologists (5 | 0.7%).
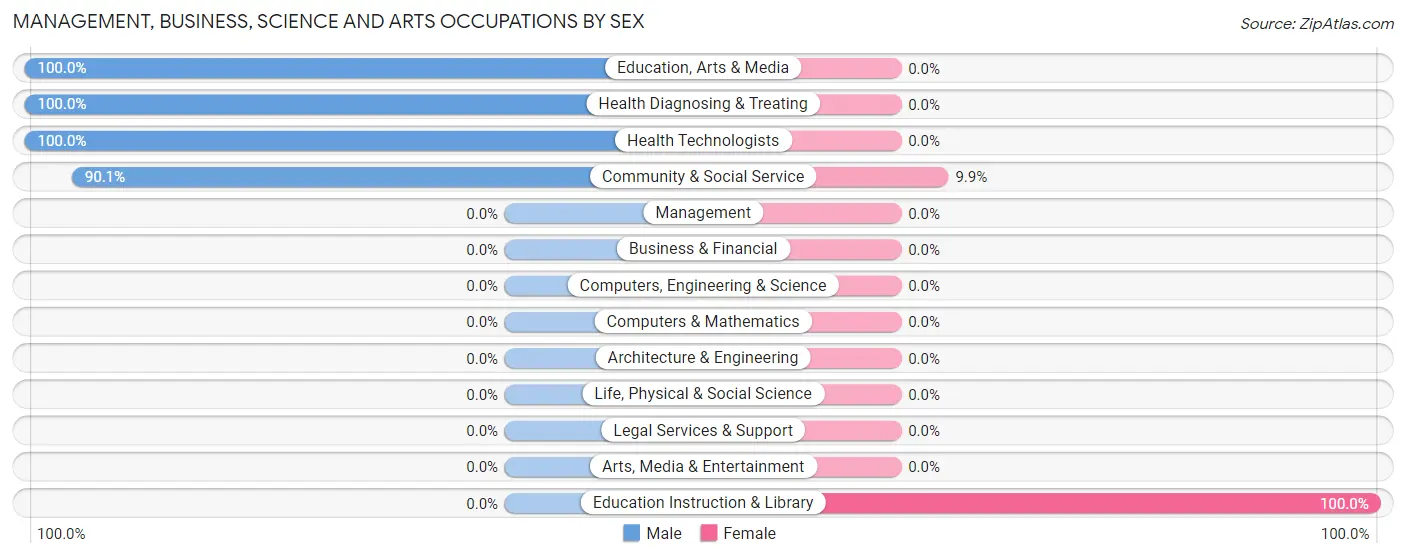
Management, Business, Science and Arts Occupations by Sex
Within the Management, Business, Science and Arts occupations in Bigfoot, the most male-oriented occupations are Education, Arts & Media (100.0%), Health Diagnosing & Treating (100.0%), and Health Technologists (100.0%), while the most female-oriented occupations are Education Instruction & Library (100.0%), and Community & Social Service (9.9%).
| Occupation | Male | Female |
| Management | 0 (0.0%) | 0 (0.0%) |
| Business & Financial | 0 (0.0%) | 0 (0.0%) |
| Computers, Engineering & Science | 0 (0.0%) | 0 (0.0%) |
| Computers & Mathematics | 0 (0.0%) | 0 (0.0%) |
| Architecture & Engineering | 0 (0.0%) | 0 (0.0%) |
| Life, Physical & Social Science | 0 (0.0%) | 0 (0.0%) |
| Community & Social Service | 64 (90.1%) | 7 (9.9%) |
| Education, Arts & Media | 64 (100.0%) | 0 (0.0%) |
| Legal Services & Support | 0 (0.0%) | 0 (0.0%) |
| Education Instruction & Library | 0 (0.0%) | 7 (100.0%) |
| Arts, Media & Entertainment | 0 (0.0%) | 0 (0.0%) |
| Health Diagnosing & Treating | 5 (100.0%) | 0 (0.0%) |
| Health Technologists | 5 (100.0%) | 0 (0.0%) |
| Total (Category) | 69 (90.8%) | 7 (9.2%) |
| Total (Overall) | 536 (72.9%) | 199 (27.1%) |
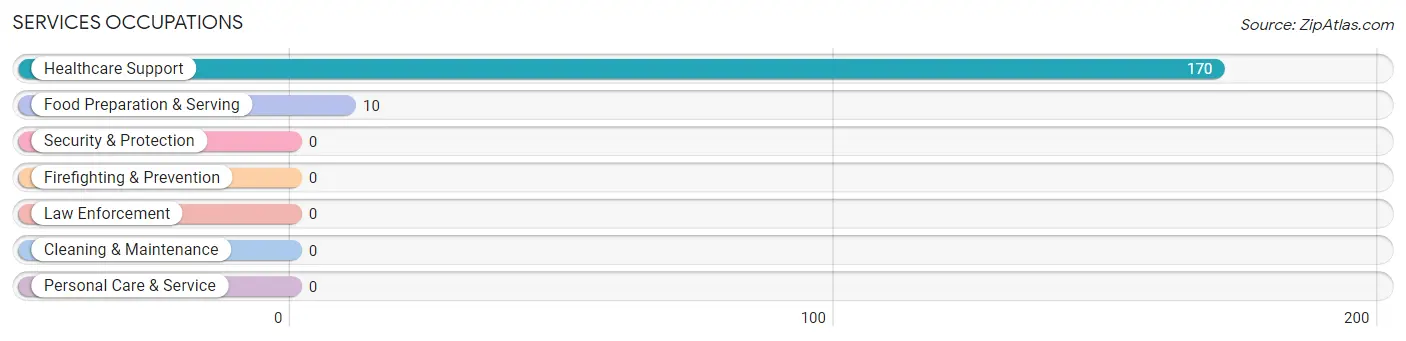
Services Occupations
The most common Services occupations in Bigfoot are Healthcare Support (170 | 23.1%), and Food Preparation & Serving (10 | 1.4%).
Services Occupations by Sex
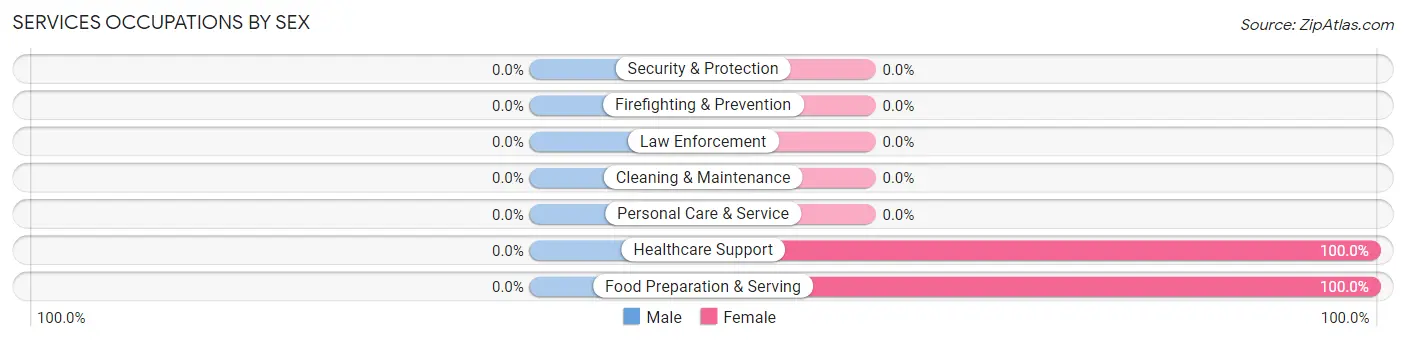
| Occupation | Male | Female |
| Healthcare Support | 0 (0.0%) | 170 (100.0%) |
| Security & Protection | 0 (0.0%) | 0 (0.0%) |
| Firefighting & Prevention | 0 (0.0%) | 0 (0.0%) |
| Law Enforcement | 0 (0.0%) | 0 (0.0%) |
| Food Preparation & Serving | 0 (0.0%) | 10 (100.0%) |
| Cleaning & Maintenance | 0 (0.0%) | 0 (0.0%) |
| Personal Care & Service | 0 (0.0%) | 0 (0.0%) |
| Total (Category) | 0 (0.0%) | 180 (100.0%) |
| Total (Overall) | 536 (72.9%) | 199 (27.1%) |
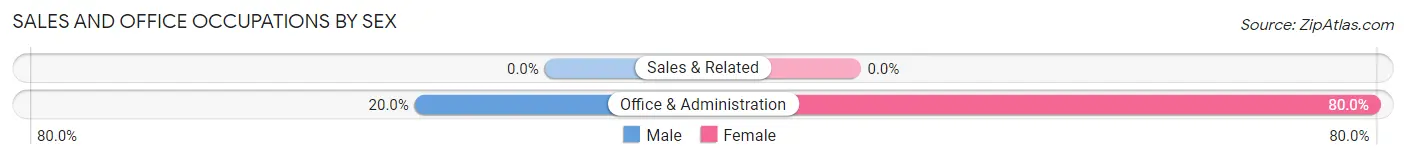
Sales and Office Occupations
The most common Sales and Office occupations in Bigfoot are , and Office & Administration (15 | 2.0%).
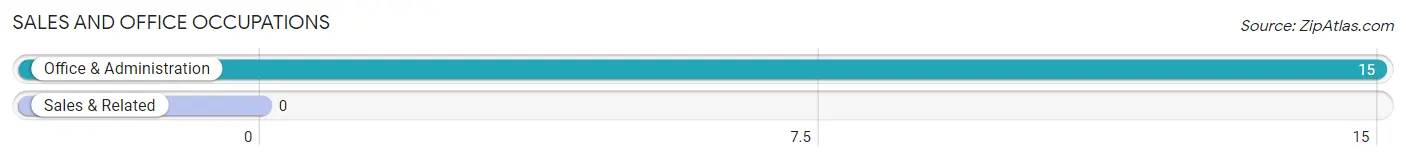
Sales and Office Occupations by Sex
| Occupation | Male | Female |
| Sales & Related | 0 (0.0%) | 0 (0.0%) |
| Office & Administration | 3 (20.0%) | 12 (80.0%) |
| Total (Category) | 3 (20.0%) | 12 (80.0%) |
| Total (Overall) | 536 (72.9%) | 199 (27.1%) |
Natural Resources, Construction and Maintenance Occupations
The most common Natural Resources, Construction and Maintenance occupations in Bigfoot are , and Farming, Fishing & Forestry (438 | 59.6%).
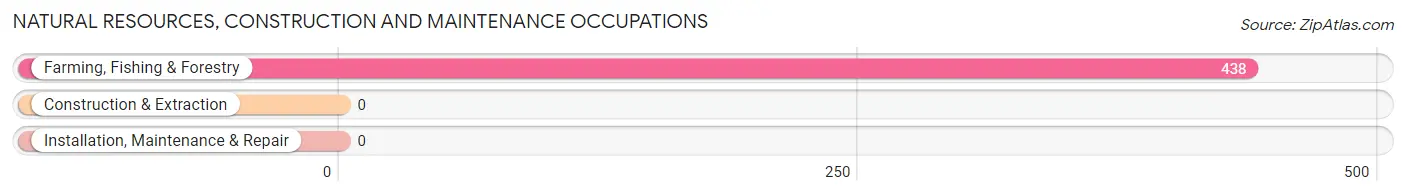
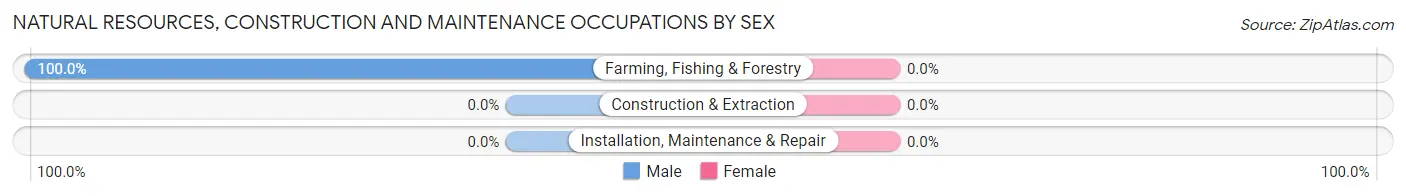
Natural Resources, Construction and Maintenance Occupations by Sex
| Occupation | Male | Female |
| Farming, Fishing & Forestry | 438 (100.0%) | 0 (0.0%) |
| Construction & Extraction | 0 (0.0%) | 0 (0.0%) |
| Installation, Maintenance & Repair | 0 (0.0%) | 0 (0.0%) |
| Total (Category) | 438 (100.0%) | 0 (0.0%) |
| Total (Overall) | 536 (72.9%) | 199 (27.1%) |
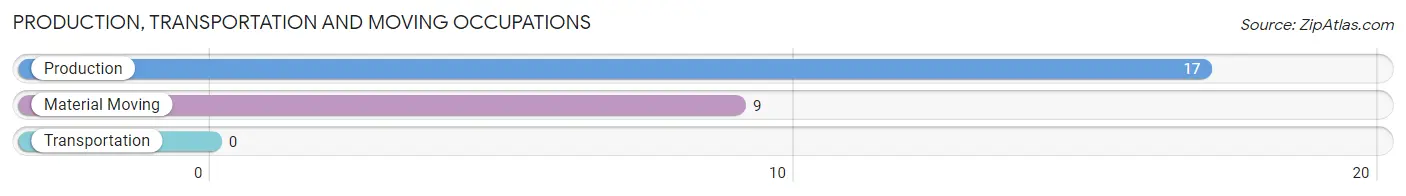
Production, Transportation and Moving Occupations
The most common Production, Transportation and Moving occupations in Bigfoot are Production (17 | 2.3%), and Material Moving (9 | 1.2%).
Production, Transportation and Moving Occupations by Sex
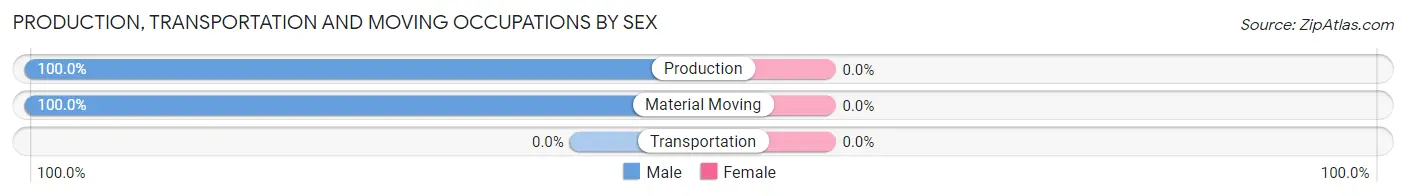
| Occupation | Male | Female |
| Production | 17 (100.0%) | 0 (0.0%) |
| Transportation | 0 (0.0%) | 0 (0.0%) |
| Material Moving | 9 (100.0%) | 0 (0.0%) |
| Total (Category) | 26 (100.0%) | 0 (0.0%) |
| Total (Overall) | 536 (72.9%) | 199 (27.1%) |
Employment Industries by Sex in Bigfoot
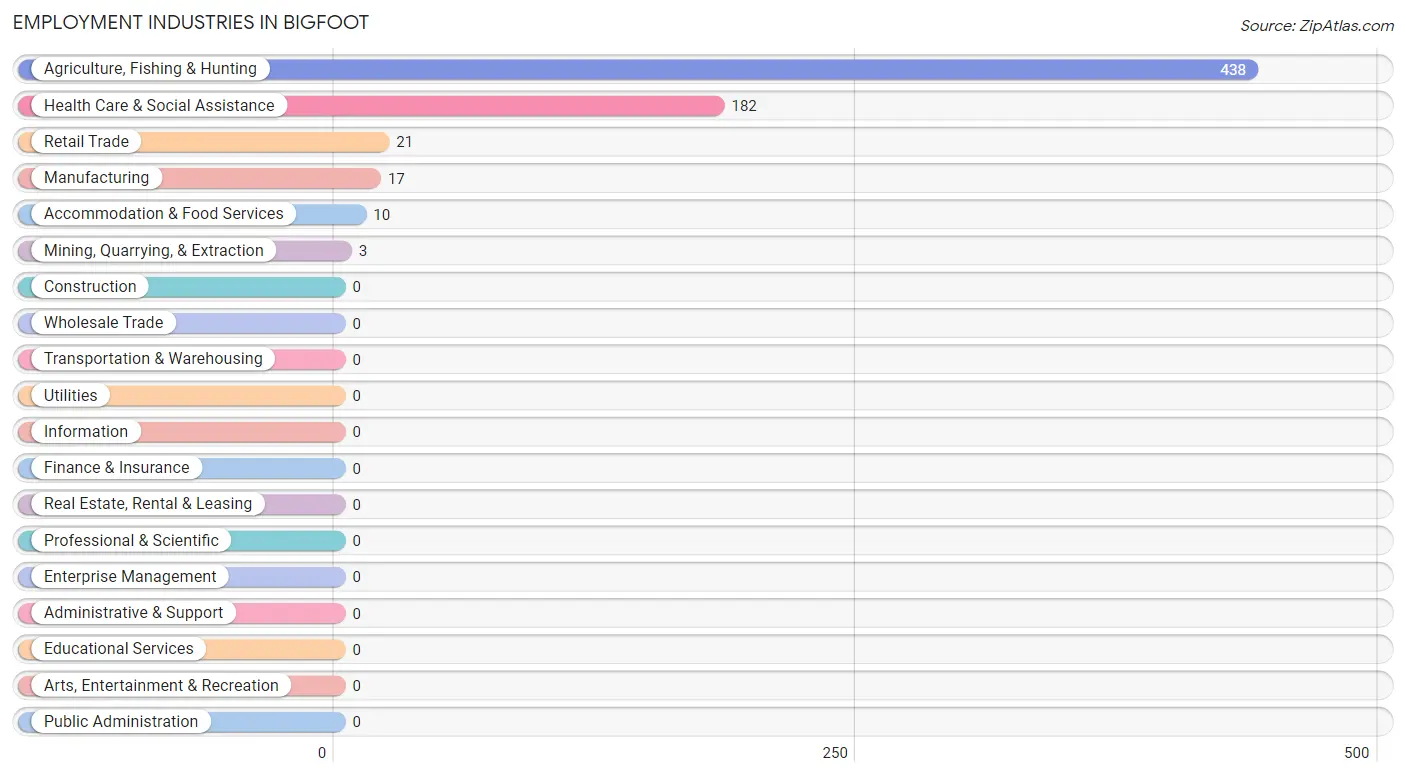
Employment Industries in Bigfoot
The major employment industries in Bigfoot include Agriculture, Fishing & Hunting (438 | 59.6%), Health Care & Social Assistance (182 | 24.8%), Retail Trade (21 | 2.9%), Manufacturing (17 | 2.3%), and Accommodation & Food Services (10 | 1.4%).
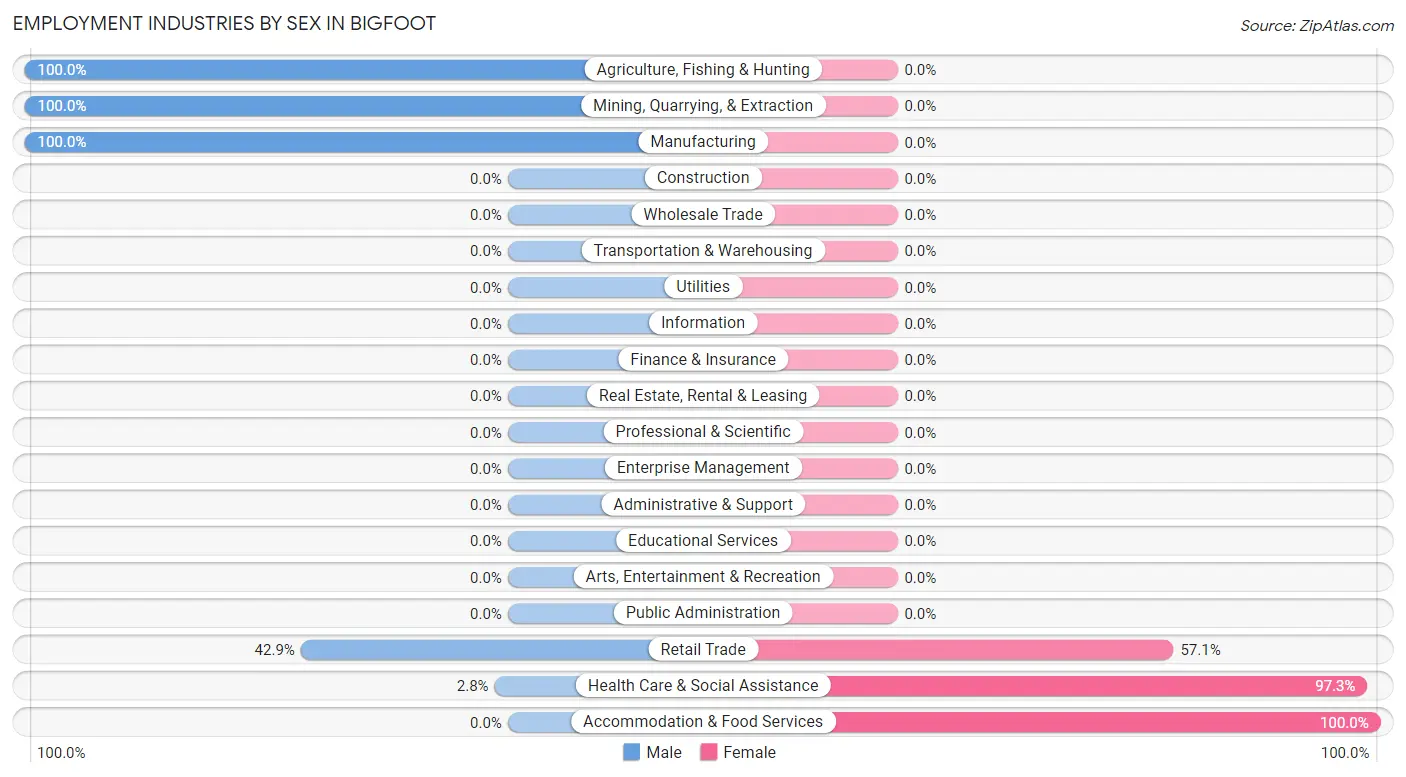
Employment Industries by Sex in Bigfoot
The Bigfoot industries that see more men than women are Agriculture, Fishing & Hunting (100.0%), Mining, Quarrying, & Extraction (100.0%), and Manufacturing (100.0%), whereas the industries that tend to have a higher number of women are Accommodation & Food Services (100.0%), Health Care & Social Assistance (97.3%), and Retail Trade (57.1%).
| Industry | Male | Female |
| Agriculture, Fishing & Hunting | 438 (100.0%) | 0 (0.0%) |
| Mining, Quarrying, & Extraction | 3 (100.0%) | 0 (0.0%) |
| Construction | 0 (0.0%) | 0 (0.0%) |
| Manufacturing | 17 (100.0%) | 0 (0.0%) |
| Wholesale Trade | 0 (0.0%) | 0 (0.0%) |
| Retail Trade | 9 (42.9%) | 12 (57.1%) |
| Transportation & Warehousing | 0 (0.0%) | 0 (0.0%) |
| Utilities | 0 (0.0%) | 0 (0.0%) |
| Information | 0 (0.0%) | 0 (0.0%) |
| Finance & Insurance | 0 (0.0%) | 0 (0.0%) |
| Real Estate, Rental & Leasing | 0 (0.0%) | 0 (0.0%) |
| Professional & Scientific | 0 (0.0%) | 0 (0.0%) |
| Enterprise Management | 0 (0.0%) | 0 (0.0%) |
| Administrative & Support | 0 (0.0%) | 0 (0.0%) |
| Educational Services | 0 (0.0%) | 0 (0.0%) |
| Health Care & Social Assistance | 5 (2.8%) | 177 (97.3%) |
| Arts, Entertainment & Recreation | 0 (0.0%) | 0 (0.0%) |
| Accommodation & Food Services | 0 (0.0%) | 10 (100.0%) |
| Public Administration | 0 (0.0%) | 0 (0.0%) |
| Total | 536 (72.9%) | 199 (27.1%) |
Education in Bigfoot
School Enrollment in Bigfoot
The most common levels of schooling among the 17 students in Bigfoot are high school (10 | 58.8%), and college / undergraduate (7 | 41.2%).
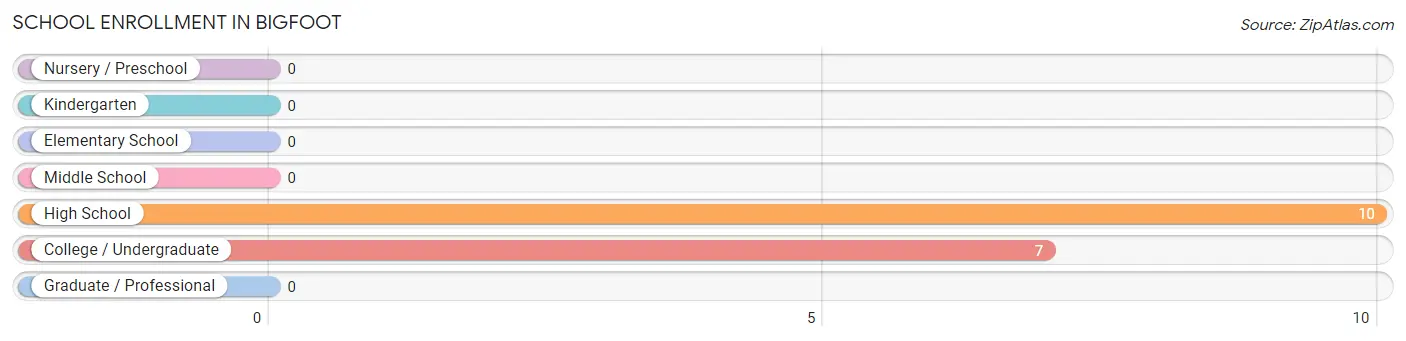
| School Level | # Students | % Students |
| Nursery / Preschool | 0 | 0.0% |
| Kindergarten | 0 | 0.0% |
| Elementary School | 0 | 0.0% |
| Middle School | 0 | 0.0% |
| High School | 10 | 58.8% |
| College / Undergraduate | 7 | 41.2% |
| Graduate / Professional | 0 | 0.0% |
| Total | 17 | 100.0% |
School Enrollment by Age by Funding Source in Bigfoot
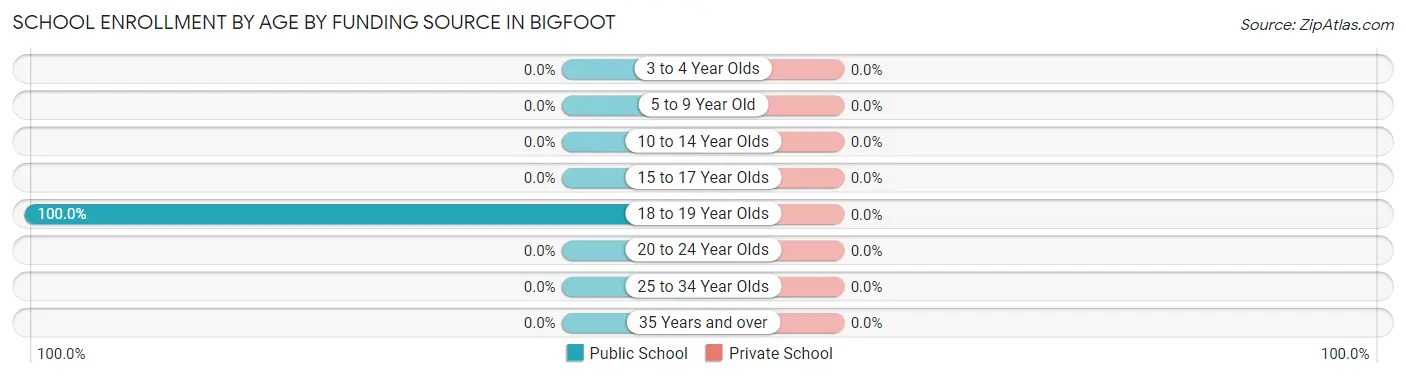
| Age Bracket | Public School | Private School |
| 3 to 4 Year Olds | 0 (0.0%) | 0 (0.0%) |
| 5 to 9 Year Old | 0 (0.0%) | 0 (0.0%) |
| 10 to 14 Year Olds | 0 (0.0%) | 0 (0.0%) |
| 15 to 17 Year Olds | 0 (0.0%) | 0 (0.0%) |
| 18 to 19 Year Olds | 17 (100.0%) | 0 (0.0%) |
| 20 to 24 Year Olds | 0 (0.0%) | 0 (0.0%) |
| 25 to 34 Year Olds | 0 (0.0%) | 0 (0.0%) |
| 35 Years and over | 0 (0.0%) | 0 (0.0%) |
| Total | 17 (100.0%) | 0 (0.0%) |
Educational Attainment by Field of Study in Bigfoot
Liberal arts & history (64 | 95.5%), and science & technology (3 | 4.5%) are the most common fields of study among 67 individuals in Bigfoot who have obtained a bachelor's degree or higher.
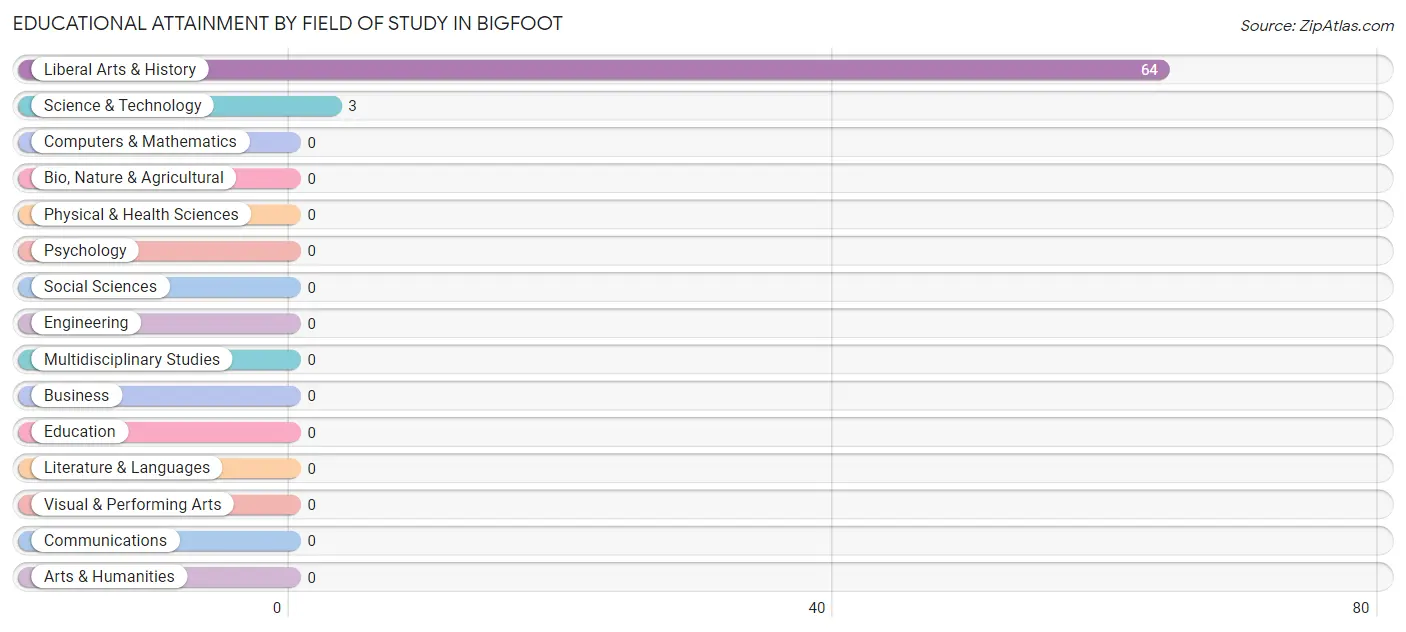
| Field of Study | # Graduates | % Graduates |
| Computers & Mathematics | 0 | 0.0% |
| Bio, Nature & Agricultural | 0 | 0.0% |
| Physical & Health Sciences | 0 | 0.0% |
| Psychology | 0 | 0.0% |
| Social Sciences | 0 | 0.0% |
| Engineering | 0 | 0.0% |
| Multidisciplinary Studies | 0 | 0.0% |
| Science & Technology | 3 | 4.5% |
| Business | 0 | 0.0% |
| Education | 0 | 0.0% |
| Literature & Languages | 0 | 0.0% |
| Liberal Arts & History | 64 | 95.5% |
| Visual & Performing Arts | 0 | 0.0% |
| Communications | 0 | 0.0% |
| Arts & Humanities | 0 | 0.0% |
| Total | 67 | 100.0% |
Transportation & Commute in Bigfoot
Vehicle Availability by Sex in Bigfoot
The most prevalent vehicle ownership categories in Bigfoot are males with 2 vehicles (507, accounting for 94.6%) and females with 2 vehicles (170, making up 254.8%).
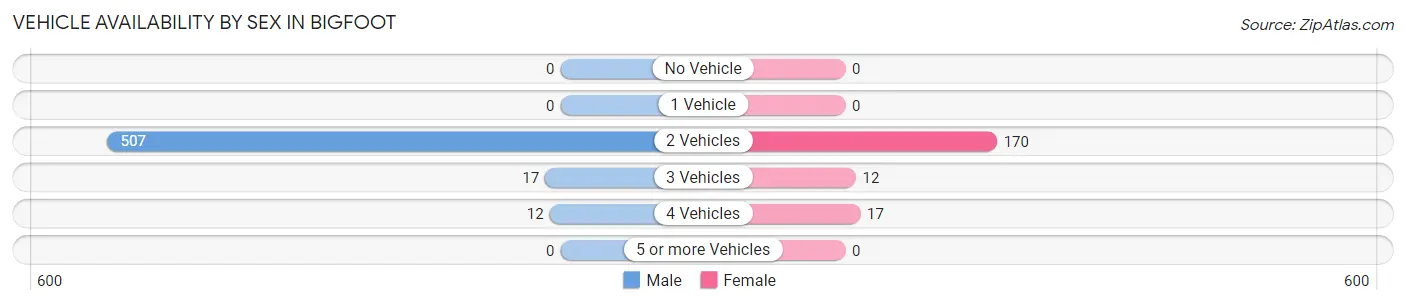
| Vehicles Available | Male | Female |
| No Vehicle | 0 (0.0%) | 0 (0.0%) |
| 1 Vehicle | 0 (0.0%) | 0 (0.0%) |
| 2 Vehicles | 507 (94.6%) | 170 (85.4%) |
| 3 Vehicles | 17 (3.2%) | 12 (6.0%) |
| 4 Vehicles | 12 (2.2%) | 17 (8.5%) |
| 5 or more Vehicles | 0 (0.0%) | 0 (0.0%) |
| Total | 536 (100.0%) | 199 (100.0%) |
Commute Time in Bigfoot
The most frequently occuring commute durations in Bigfoot are 20 to 24 minutes (450 commuters, 61.2%), 10 to 14 minutes (177 commuters, 24.1%), and 30 to 34 minutes (64 commuters, 8.7%).
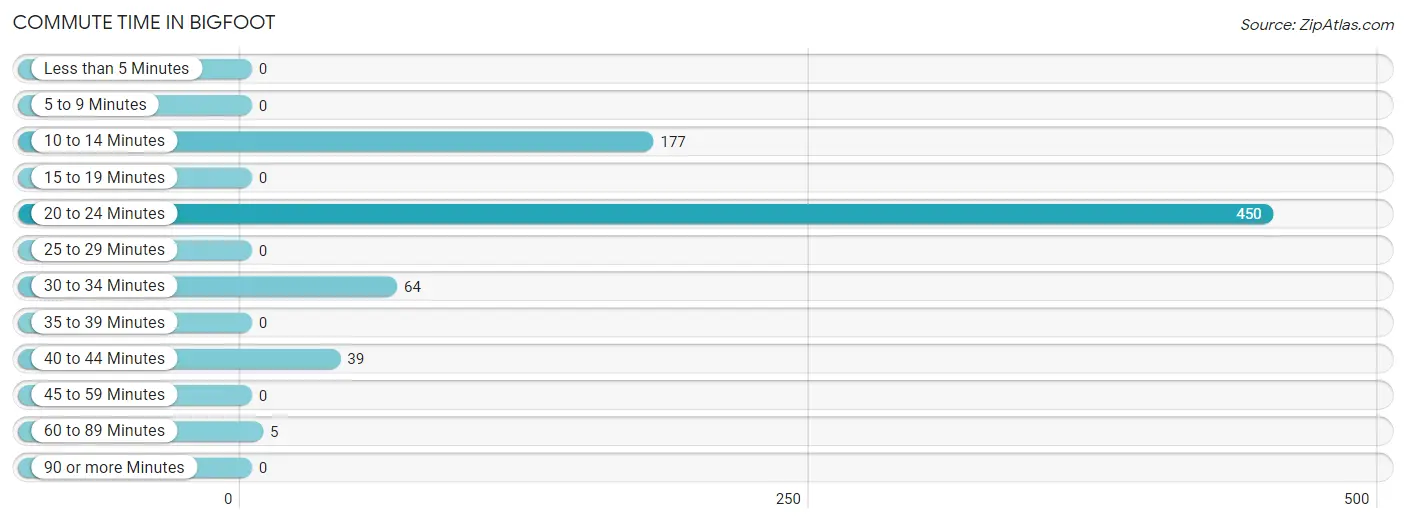
| Commute Time | # Commuters | % Commuters |
| Less than 5 Minutes | 0 | 0.0% |
| 5 to 9 Minutes | 0 | 0.0% |
| 10 to 14 Minutes | 177 | 24.1% |
| 15 to 19 Minutes | 0 | 0.0% |
| 20 to 24 Minutes | 450 | 61.2% |
| 25 to 29 Minutes | 0 | 0.0% |
| 30 to 34 Minutes | 64 | 8.7% |
| 35 to 39 Minutes | 0 | 0.0% |
| 40 to 44 Minutes | 39 | 5.3% |
| 45 to 59 Minutes | 0 | 0.0% |
| 60 to 89 Minutes | 5 | 0.7% |
| 90 or more Minutes | 0 | 0.0% |
Commute Time by Sex in Bigfoot
The most common commute times in Bigfoot are 20 to 24 minutes (440 commuters, 82.1%) for males and 10 to 14 minutes (177 commuters, 88.9%) for females.
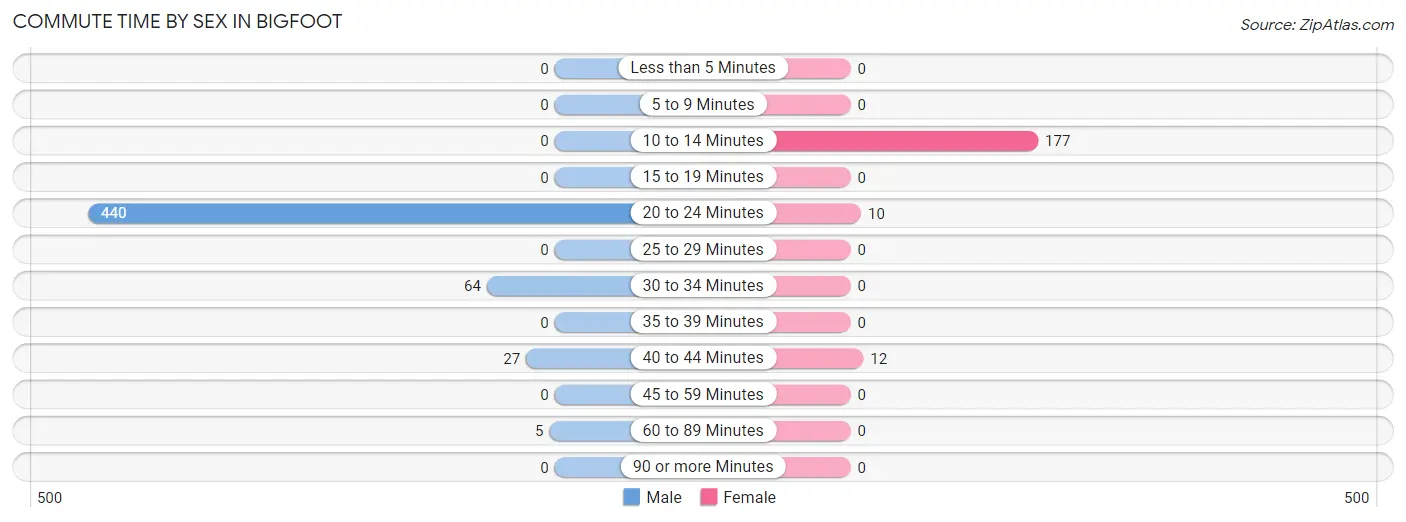
| Commute Time | Male | Female |
| Less than 5 Minutes | 0 (0.0%) | 0 (0.0%) |
| 5 to 9 Minutes | 0 (0.0%) | 0 (0.0%) |
| 10 to 14 Minutes | 0 (0.0%) | 177 (88.9%) |
| 15 to 19 Minutes | 0 (0.0%) | 0 (0.0%) |
| 20 to 24 Minutes | 440 (82.1%) | 10 (5.0%) |
| 25 to 29 Minutes | 0 (0.0%) | 0 (0.0%) |
| 30 to 34 Minutes | 64 (11.9%) | 0 (0.0%) |
| 35 to 39 Minutes | 0 (0.0%) | 0 (0.0%) |
| 40 to 44 Minutes | 27 (5.0%) | 12 (6.0%) |
| 45 to 59 Minutes | 0 (0.0%) | 0 (0.0%) |
| 60 to 89 Minutes | 5 (0.9%) | 0 (0.0%) |
| 90 or more Minutes | 0 (0.0%) | 0 (0.0%) |
Time of Departure to Work by Sex in Bigfoot
The most frequent times of departure to work in Bigfoot are 7:00 AM to 7:29 AM (431, 80.4%) for males and 7:30 AM to 7:59 AM (177, 88.9%) for females.
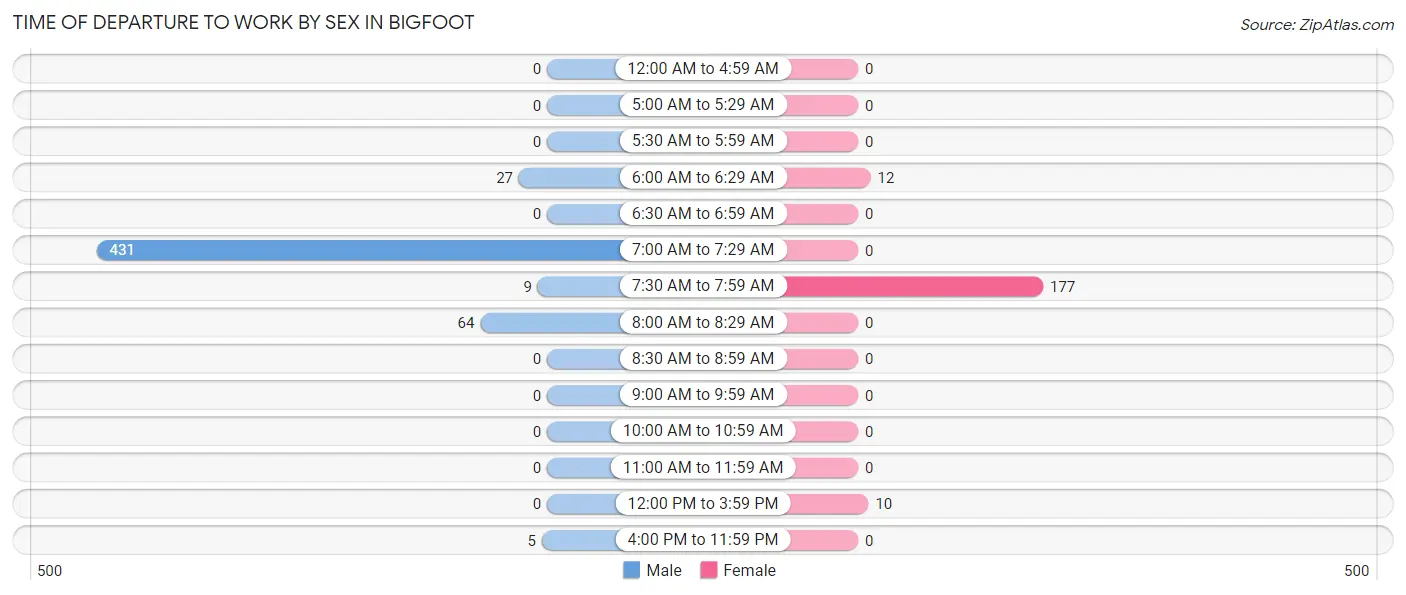
| Time of Departure | Male | Female |
| 12:00 AM to 4:59 AM | 0 (0.0%) | 0 (0.0%) |
| 5:00 AM to 5:29 AM | 0 (0.0%) | 0 (0.0%) |
| 5:30 AM to 5:59 AM | 0 (0.0%) | 0 (0.0%) |
| 6:00 AM to 6:29 AM | 27 (5.0%) | 12 (6.0%) |
| 6:30 AM to 6:59 AM | 0 (0.0%) | 0 (0.0%) |
| 7:00 AM to 7:29 AM | 431 (80.4%) | 0 (0.0%) |
| 7:30 AM to 7:59 AM | 9 (1.7%) | 177 (88.9%) |
| 8:00 AM to 8:29 AM | 64 (11.9%) | 0 (0.0%) |
| 8:30 AM to 8:59 AM | 0 (0.0%) | 0 (0.0%) |
| 9:00 AM to 9:59 AM | 0 (0.0%) | 0 (0.0%) |
| 10:00 AM to 10:59 AM | 0 (0.0%) | 0 (0.0%) |
| 11:00 AM to 11:59 AM | 0 (0.0%) | 0 (0.0%) |
| 12:00 PM to 3:59 PM | 0 (0.0%) | 10 (5.0%) |
| 4:00 PM to 11:59 PM | 5 (0.9%) | 0 (0.0%) |
| Total | 536 (100.0%) | 199 (100.0%) |
Housing Occupancy in Bigfoot
Occupancy by Ownership in Bigfoot
Of the total 435 dwellings in Bigfoot, owner-occupied units account for 265 (60.9%), while renter-occupied units make up 170 (39.1%).
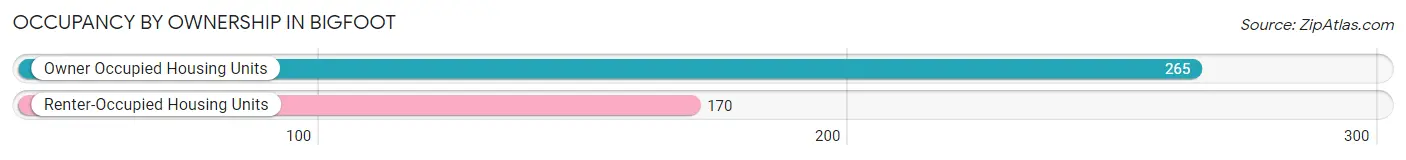
| Occupancy | # Housing Units | % Housing Units |
| Owner Occupied Housing Units | 265 | 60.9% |
| Renter-Occupied Housing Units | 170 | 39.1% |
| Total Occupied Housing Units | 435 | 100.0% |
Occupancy by Household Size in Bigfoot
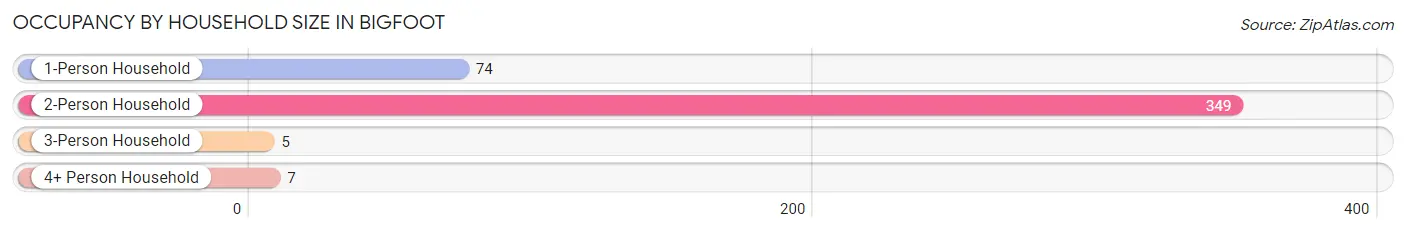
| Household Size | # Housing Units | % Housing Units |
| 1-Person Household | 74 | 17.0% |
| 2-Person Household | 349 | 80.2% |
| 3-Person Household | 5 | 1.1% |
| 4+ Person Household | 7 | 1.6% |
| Total Housing Units | 435 | 100.0% |
Occupancy by Ownership by Household Size in Bigfoot
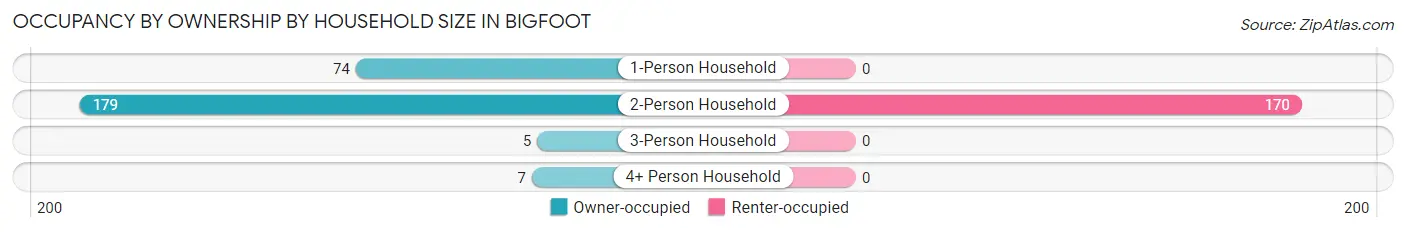
| Household Size | Owner-occupied | Renter-occupied |
| 1-Person Household | 74 (100.0%) | 0 (0.0%) |
| 2-Person Household | 179 (51.3%) | 170 (48.7%) |
| 3-Person Household | 5 (100.0%) | 0 (0.0%) |
| 4+ Person Household | 7 (100.0%) | 0 (0.0%) |
| Total Housing Units | 265 (60.9%) | 170 (39.1%) |
Occupancy by Educational Attainment in Bigfoot
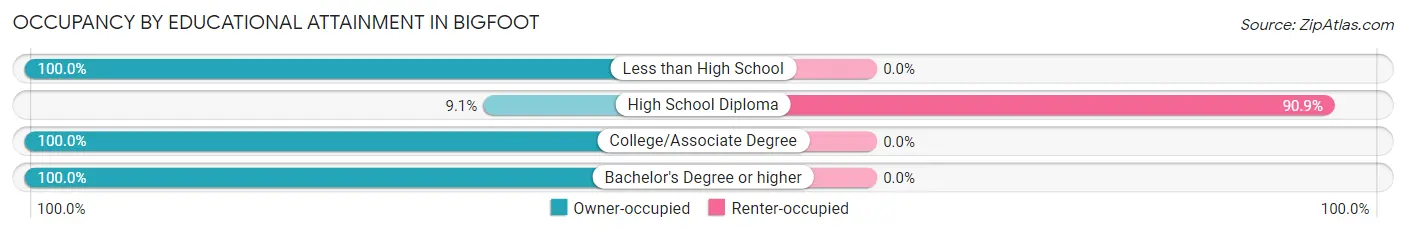
| Household Size | Owner-occupied | Renter-occupied |
| Less than High School | 88 (100.0%) | 0 (0.0%) |
| High School Diploma | 17 (9.1%) | 170 (90.9%) |
| College/Associate Degree | 96 (100.0%) | 0 (0.0%) |
| Bachelor's Degree or higher | 64 (100.0%) | 0 (0.0%) |
Occupancy by Age of Householder in Bigfoot
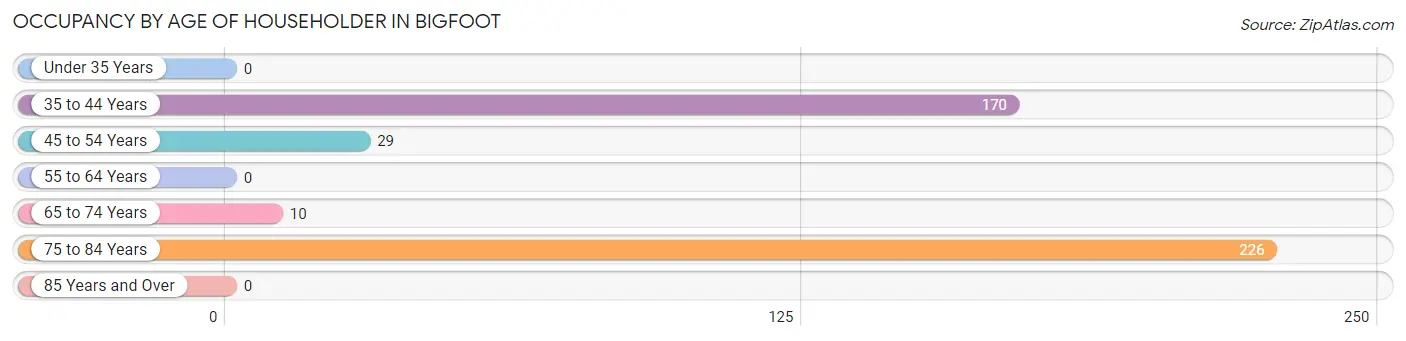
| Age Bracket | # Households | % Households |
| Under 35 Years | 0 | 0.0% |
| 35 to 44 Years | 170 | 39.1% |
| 45 to 54 Years | 29 | 6.7% |
| 55 to 64 Years | 0 | 0.0% |
| 65 to 74 Years | 10 | 2.3% |
| 75 to 84 Years | 226 | 51.9% |
| 85 Years and Over | 0 | 0.0% |
| Total | 435 | 100.0% |
Housing Finances in Bigfoot
Median Income by Occupancy in Bigfoot
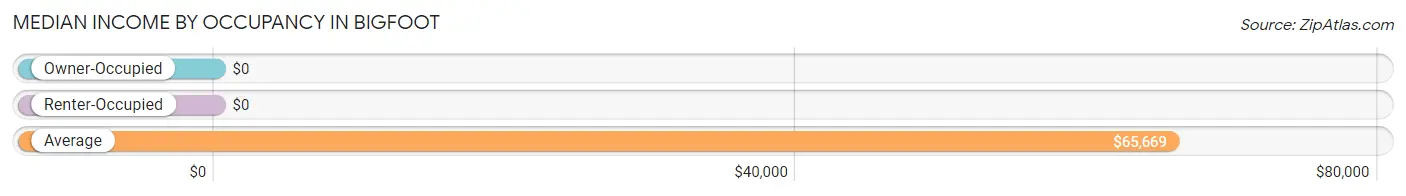
| Occupancy Type | # Households | Median Income |
| Owner-Occupied | 265 (60.9%) | $0 |
| Renter-Occupied | 170 (39.1%) | $0 |
| Average | 435 (100.0%) | $65,669 |
Occupancy by Householder Income Bracket in Bigfoot
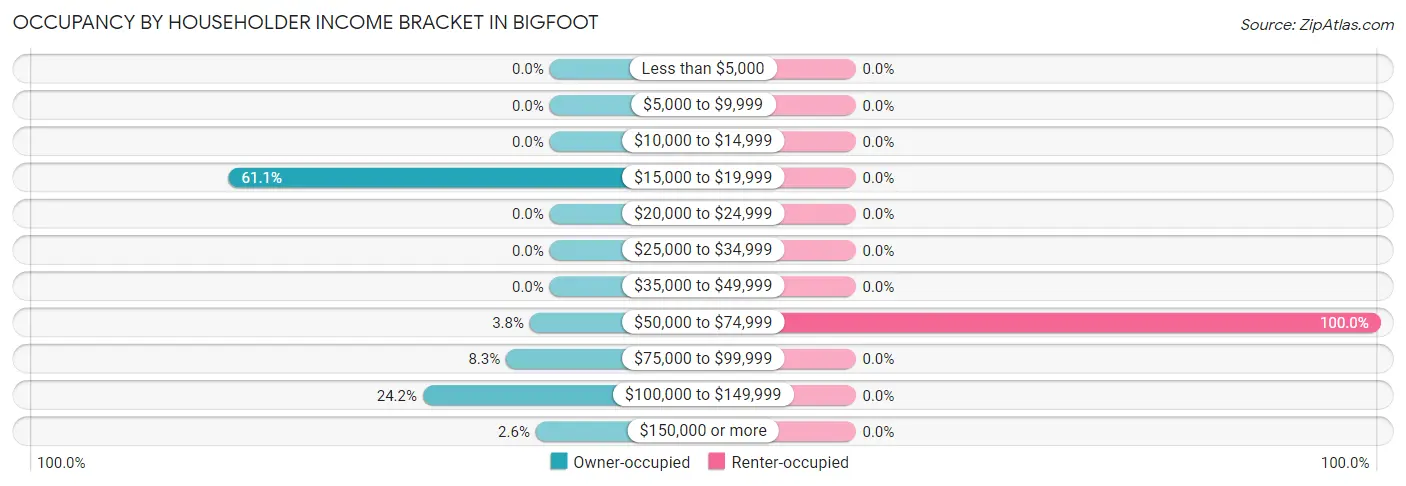
| Income Bracket | Owner-occupied | Renter-occupied |
| Less than $5,000 | 0 (0.0%) | 0 (0.0%) |
| $5,000 to $9,999 | 0 (0.0%) | 0 (0.0%) |
| $10,000 to $14,999 | 0 (0.0%) | 0 (0.0%) |
| $15,000 to $19,999 | 162 (61.1%) | 0 (0.0%) |
| $20,000 to $24,999 | 0 (0.0%) | 0 (0.0%) |
| $25,000 to $34,999 | 0 (0.0%) | 0 (0.0%) |
| $35,000 to $49,999 | 0 (0.0%) | 0 (0.0%) |
| $50,000 to $74,999 | 10 (3.8%) | 170 (100.0%) |
| $75,000 to $99,999 | 22 (8.3%) | 0 (0.0%) |
| $100,000 to $149,999 | 64 (24.1%) | 0 (0.0%) |
| $150,000 or more | 7 (2.6%) | 0 (0.0%) |
| Total | 265 (100.0%) | 170 (100.0%) |
Monthly Housing Cost Tiers in Bigfoot
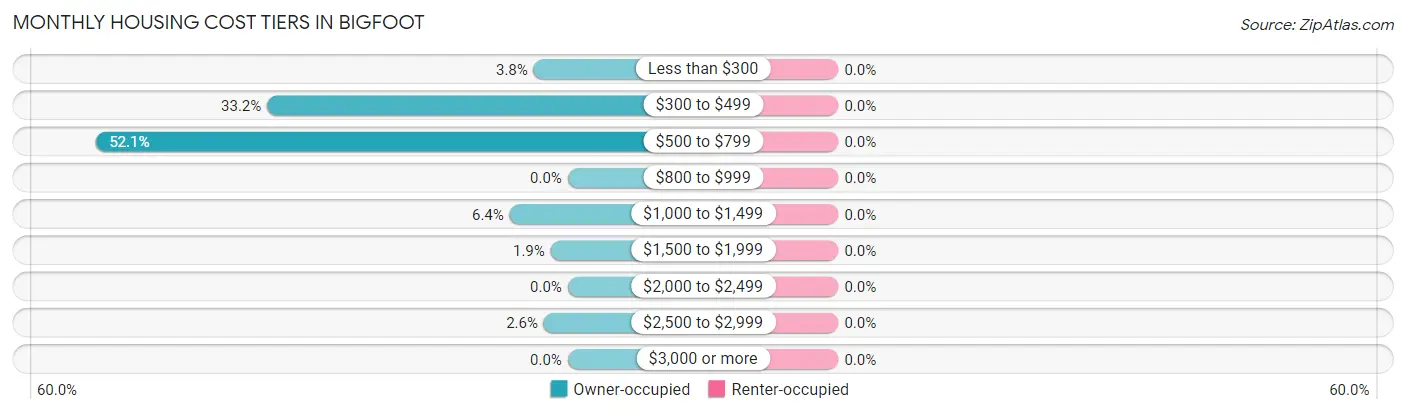
| Monthly Cost | Owner-occupied | Renter-occupied |
| Less than $300 | 10 (3.8%) | 0 (0.0%) |
| $300 to $499 | 88 (33.2%) | 0 (0.0%) |
| $500 to $799 | 138 (52.1%) | 0 (0.0%) |
| $800 to $999 | 0 (0.0%) | 0 (0.0%) |
| $1,000 to $1,499 | 17 (6.4%) | 0 (0.0%) |
| $1,500 to $1,999 | 5 (1.9%) | 0 (0.0%) |
| $2,000 to $2,499 | 0 (0.0%) | 0 (0.0%) |
| $2,500 to $2,999 | 7 (2.6%) | 0 (0.0%) |
| $3,000 or more | 0 (0.0%) | 0 (0.0%) |
| Total | 265 (100.0%) | 170 (100.0%) |
Physical Housing Characteristics in Bigfoot
Housing Structures in Bigfoot
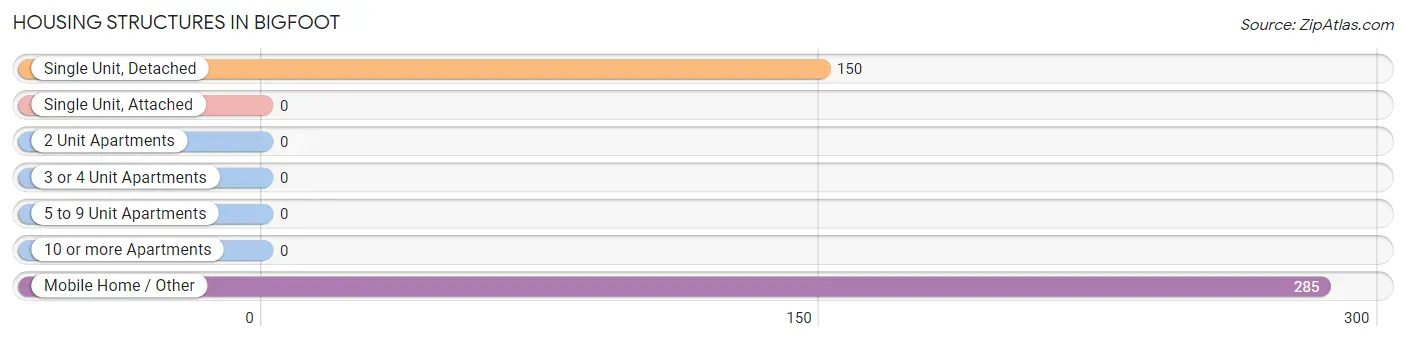
| Structure Type | # Housing Units | % Housing Units |
| Single Unit, Detached | 150 | 34.5% |
| Single Unit, Attached | 0 | 0.0% |
| 2 Unit Apartments | 0 | 0.0% |
| 3 or 4 Unit Apartments | 0 | 0.0% |
| 5 to 9 Unit Apartments | 0 | 0.0% |
| 10 or more Apartments | 0 | 0.0% |
| Mobile Home / Other | 285 | 65.5% |
| Total | 435 | 100.0% |
Housing Structures by Occupancy in Bigfoot
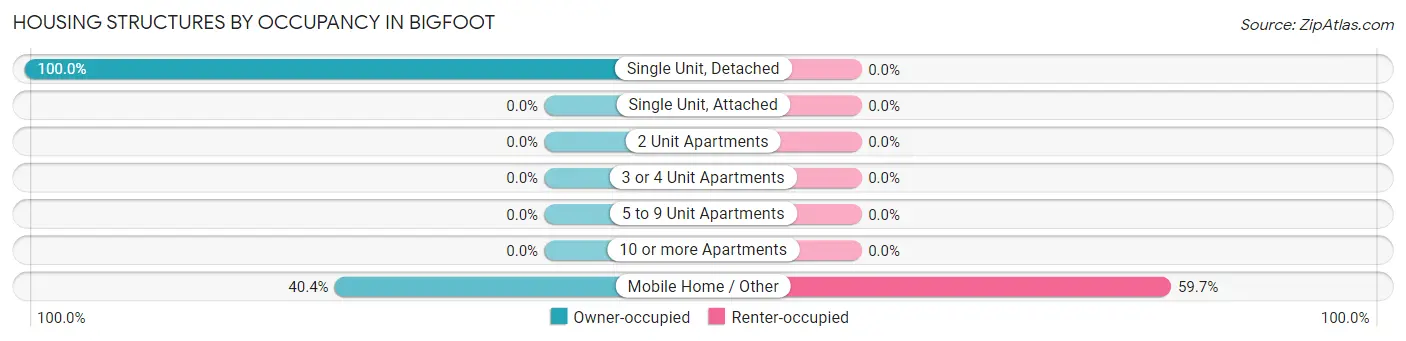
| Structure Type | Owner-occupied | Renter-occupied |
| Single Unit, Detached | 150 (100.0%) | 0 (0.0%) |
| Single Unit, Attached | 0 (0.0%) | 0 (0.0%) |
| 2 Unit Apartments | 0 (0.0%) | 0 (0.0%) |
| 3 or 4 Unit Apartments | 0 (0.0%) | 0 (0.0%) |
| 5 to 9 Unit Apartments | 0 (0.0%) | 0 (0.0%) |
| 10 or more Apartments | 0 (0.0%) | 0 (0.0%) |
| Mobile Home / Other | 115 (40.4%) | 170 (59.7%) |
| Total | 265 (60.9%) | 170 (39.1%) |
Housing Structures by Number of Rooms in Bigfoot
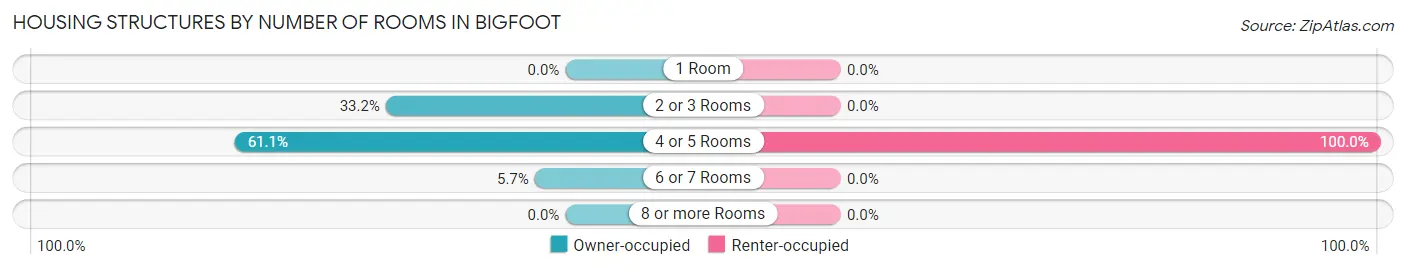
| Number of Rooms | Owner-occupied | Renter-occupied |
| 1 Room | 0 (0.0%) | 0 (0.0%) |
| 2 or 3 Rooms | 88 (33.2%) | 0 (0.0%) |
| 4 or 5 Rooms | 162 (61.1%) | 170 (100.0%) |
| 6 or 7 Rooms | 15 (5.7%) | 0 (0.0%) |
| 8 or more Rooms | 0 (0.0%) | 0 (0.0%) |
| Total | 265 (100.0%) | 170 (100.0%) |
Housing Structure by Heating Type in Bigfoot
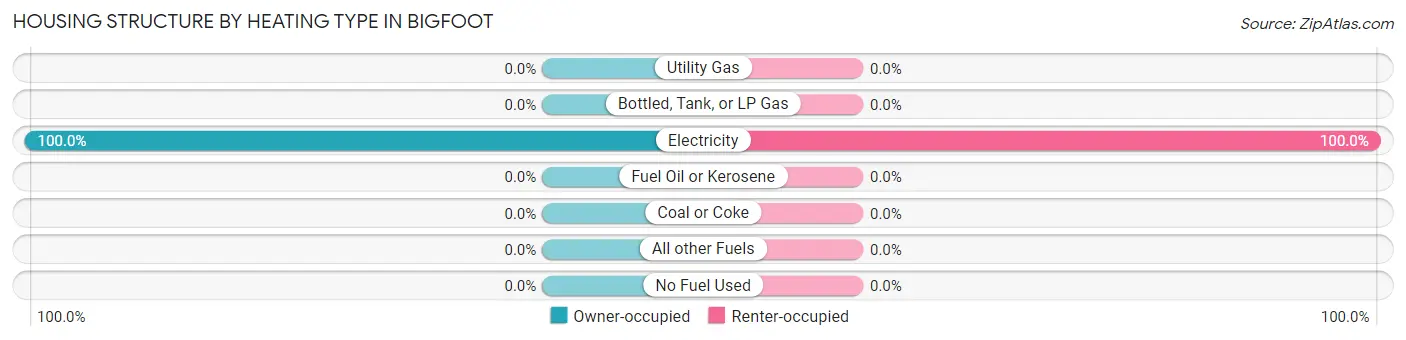
| Heating Type | Owner-occupied | Renter-occupied |
| Utility Gas | 0 (0.0%) | 0 (0.0%) |
| Bottled, Tank, or LP Gas | 0 (0.0%) | 0 (0.0%) |
| Electricity | 265 (100.0%) | 170 (100.0%) |
| Fuel Oil or Kerosene | 0 (0.0%) | 0 (0.0%) |
| Coal or Coke | 0 (0.0%) | 0 (0.0%) |
| All other Fuels | 0 (0.0%) | 0 (0.0%) |
| No Fuel Used | 0 (0.0%) | 0 (0.0%) |
| Total | 265 (100.0%) | 170 (100.0%) |
Household Vehicle Usage in Bigfoot
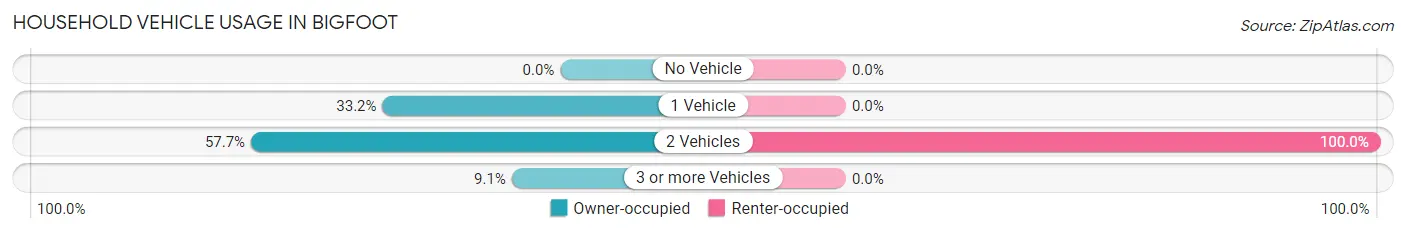
| Vehicles per Household | Owner-occupied | Renter-occupied |
| No Vehicle | 0 (0.0%) | 0 (0.0%) |
| 1 Vehicle | 88 (33.2%) | 0 (0.0%) |
| 2 Vehicles | 153 (57.7%) | 170 (100.0%) |
| 3 or more Vehicles | 24 (9.1%) | 0 (0.0%) |
| Total | 265 (100.0%) | 170 (100.0%) |
Real Estate & Mortgages in Bigfoot
Real Estate and Mortgage Overview in Bigfoot
| Characteristic | Without Mortgage | With Mortgage |
| Housing Units | 236 | 29 |
| Median Property Value | - | - |
| Median Household Income | - | - |
| Monthly Housing Costs | $531 | $0 |
| Real Estate Taxes | $2,270 | $0 |
Property Value by Mortgage Status in Bigfoot
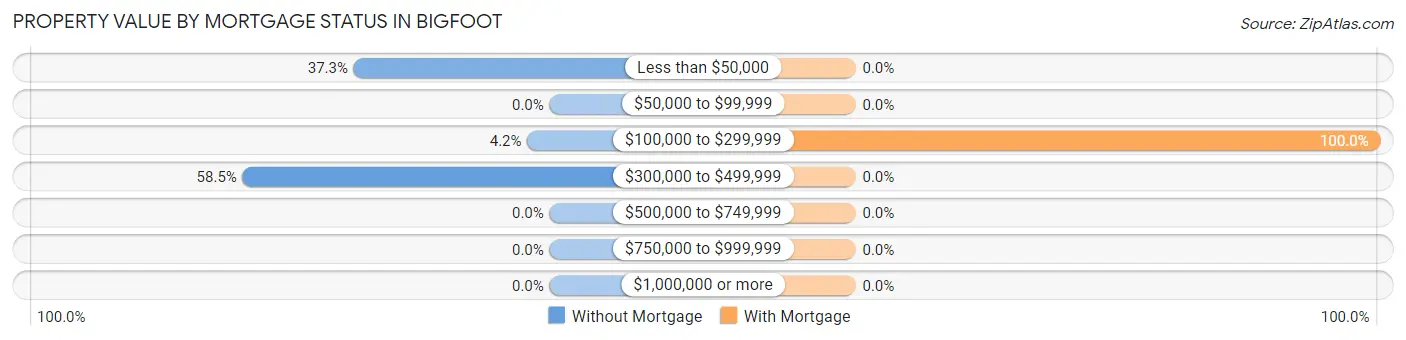
| Property Value | Without Mortgage | With Mortgage |
| Less than $50,000 | 88 (37.3%) | 0 (0.0%) |
| $50,000 to $99,999 | 0 (0.0%) | 0 (0.0%) |
| $100,000 to $299,999 | 10 (4.2%) | 29 (100.0%) |
| $300,000 to $499,999 | 138 (58.5%) | 0 (0.0%) |
| $500,000 to $749,999 | 0 (0.0%) | 0 (0.0%) |
| $750,000 to $999,999 | 0 (0.0%) | 0 (0.0%) |
| $1,000,000 or more | 0 (0.0%) | 0 (0.0%) |
| Total | 236 (100.0%) | 29 (100.0%) |
Household Income by Mortgage Status in Bigfoot
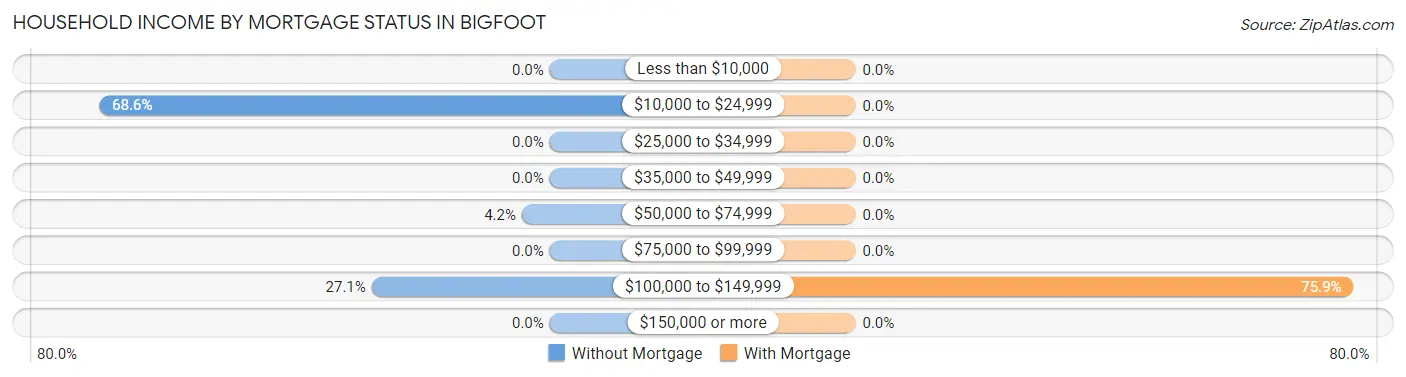
| Household Income | Without Mortgage | With Mortgage |
| Less than $10,000 | 0 (0.0%) | 0 (0.0%) |
| $10,000 to $24,999 | 162 (68.6%) | 0 (0.0%) |
| $25,000 to $34,999 | 0 (0.0%) | 0 (0.0%) |
| $35,000 to $49,999 | 0 (0.0%) | 0 (0.0%) |
| $50,000 to $74,999 | 10 (4.2%) | 0 (0.0%) |
| $75,000 to $99,999 | 0 (0.0%) | 0 (0.0%) |
| $100,000 to $149,999 | 64 (27.1%) | 22 (75.9%) |
| $150,000 or more | 0 (0.0%) | 0 (0.0%) |
| Total | 236 (100.0%) | 29 (100.0%) |
Property Value to Household Income Ratio in Bigfoot
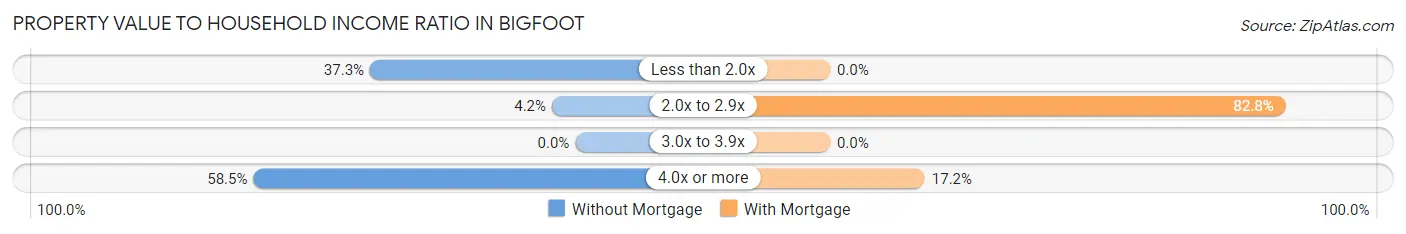
| Value-to-Income Ratio | Without Mortgage | With Mortgage |
| Less than 2.0x | 88 (37.3%) | 0 (0.0%) |
| 2.0x to 2.9x | 10 (4.2%) | 24 (82.8%) |
| 3.0x to 3.9x | 0 (0.0%) | 0 (0.0%) |
| 4.0x or more | 138 (58.5%) | 5 (17.2%) |
| Total | 236 (100.0%) | 29 (100.0%) |
Real Estate Taxes by Mortgage Status in Bigfoot
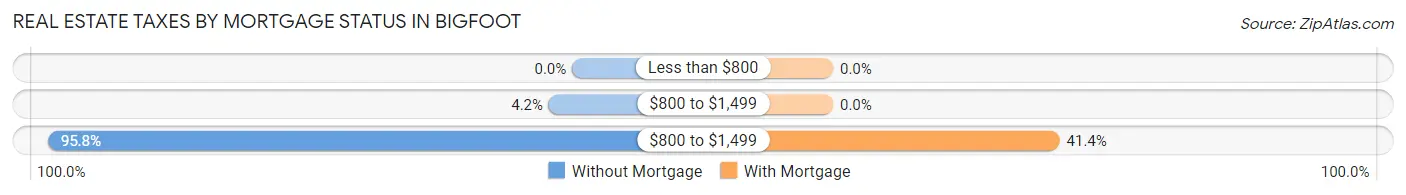
| Property Taxes | Without Mortgage | With Mortgage |
| Less than $800 | 0 (0.0%) | 0 (0.0%) |
| $800 to $1,499 | 10 (4.2%) | 0 (0.0%) |
| $800 to $1,499 | 226 (95.8%) | 12 (41.4%) |
| Total | 236 (100.0%) | 29 (100.0%) |
Health & Disability in Bigfoot
Health Insurance Coverage by Age in Bigfoot
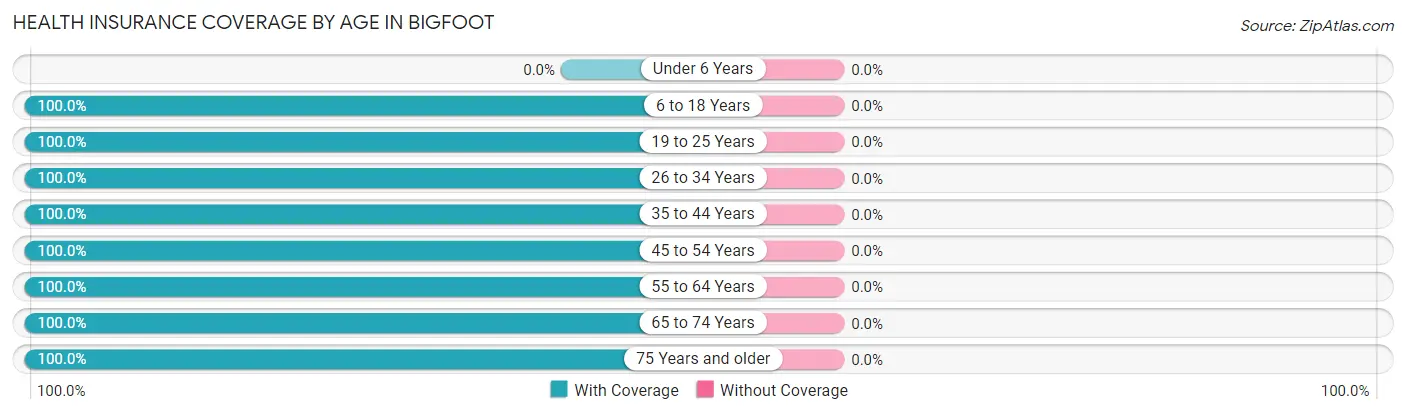
| Age Bracket | With Coverage | Without Coverage |
| Under 6 Years | 0 (0.0%) | 0 (0.0%) |
| 6 to 18 Years | 17 (100.0%) | 0 (0.0%) |
| 19 to 25 Years | 9 (100.0%) | 0 (0.0%) |
| 26 to 34 Years | 428 (100.0%) | 0 (0.0%) |
| 35 to 44 Years | 170 (100.0%) | 0 (0.0%) |
| 45 to 54 Years | 35 (100.0%) | 0 (0.0%) |
| 55 to 64 Years | 12 (100.0%) | 0 (0.0%) |
| 65 to 74 Years | 17 (100.0%) | 0 (0.0%) |
| 75 Years and older | 324 (100.0%) | 0 (0.0%) |
| Total | 1,012 (100.0%) | 0 (0.0%) |
Health Insurance Coverage by Citizenship Status in Bigfoot
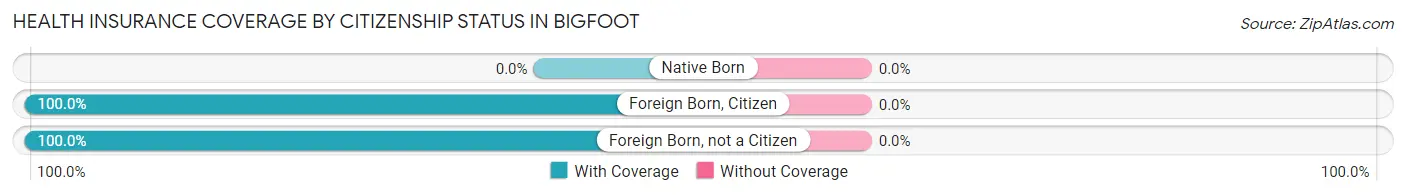
| Citizenship Status | With Coverage | Without Coverage |
| Native Born | 0 (0.0%) | 0 (0.0%) |
| Foreign Born, Citizen | 17 (100.0%) | 0 (0.0%) |
| Foreign Born, not a Citizen | 9 (100.0%) | 0 (0.0%) |
Health Insurance Coverage by Household Income in Bigfoot
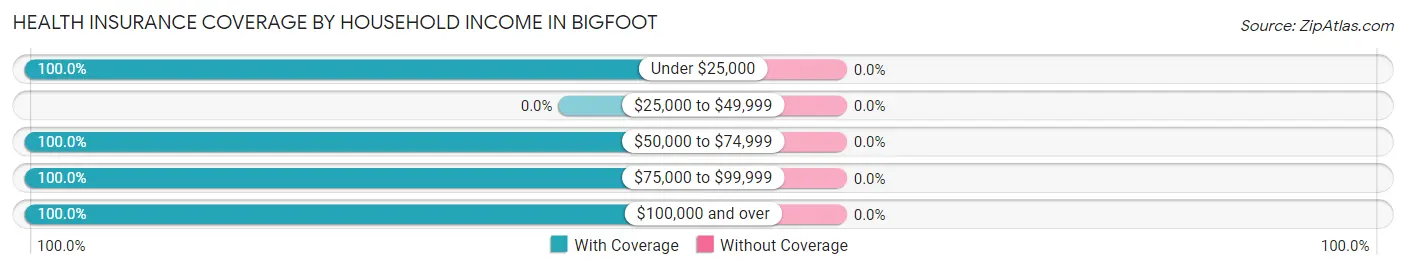
| Household Income | With Coverage | Without Coverage |
| Under $25,000 | 214 (100.0%) | 0 (0.0%) |
| $25,000 to $49,999 | 0 (0.0%) | 0 (0.0%) |
| $50,000 to $74,999 | 615 (100.0%) | 0 (0.0%) |
| $75,000 to $99,999 | 44 (100.0%) | 0 (0.0%) |
| $100,000 and over | 139 (100.0%) | 0 (0.0%) |
Public vs Private Health Insurance Coverage by Age in Bigfoot
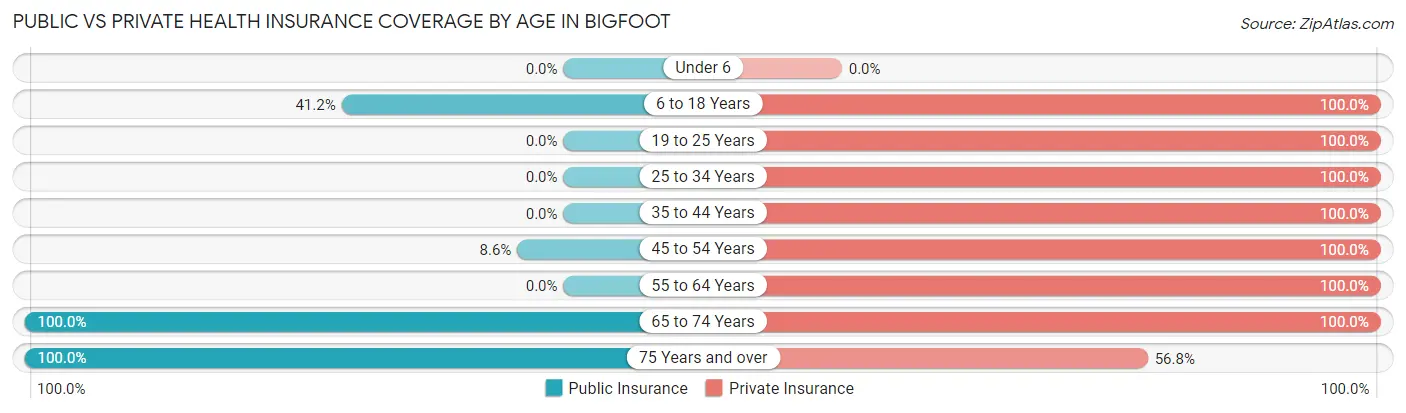
| Age Bracket | Public Insurance | Private Insurance |
| Under 6 | 0 (0.0%) | 0 (0.0%) |
| 6 to 18 Years | 7 (41.2%) | 17 (100.0%) |
| 19 to 25 Years | 0 (0.0%) | 9 (100.0%) |
| 25 to 34 Years | 0 (0.0%) | 428 (100.0%) |
| 35 to 44 Years | 0 (0.0%) | 170 (100.0%) |
| 45 to 54 Years | 3 (8.6%) | 35 (100.0%) |
| 55 to 64 Years | 0 (0.0%) | 12 (100.0%) |
| 65 to 74 Years | 17 (100.0%) | 17 (100.0%) |
| 75 Years and over | 324 (100.0%) | 184 (56.8%) |
| Total | 351 (34.7%) | 872 (86.2%) |
Disability Status by Sex by Age in Bigfoot
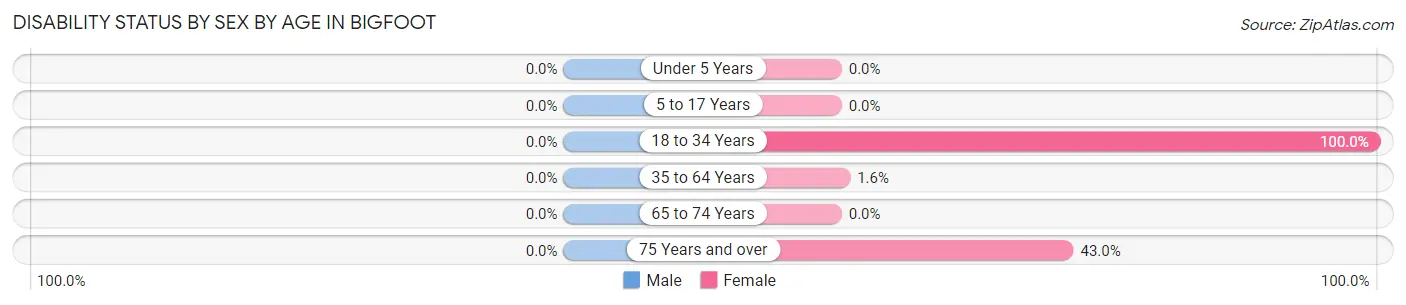
| Age Bracket | Male | Female |
| Under 5 Years | 0 (0.0%) | 0 (0.0%) |
| 5 to 17 Years | 0 (0.0%) | 0 (0.0%) |
| 18 to 34 Years | 0 (0.0%) | 10 (100.0%) |
| 35 to 64 Years | 0 (0.0%) | 3 (1.6%) |
| 65 to 74 Years | 0 (0.0%) | 0 (0.0%) |
| 75 Years and over | 0 (0.0%) | 74 (43.0%) |
Disability Class by Sex by Age in Bigfoot
Disability Class: Hearing Difficulty
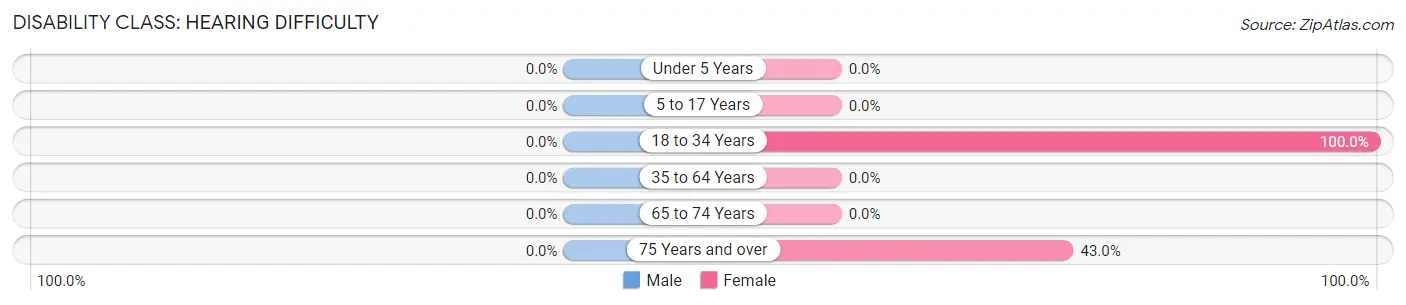
| Age Bracket | Male | Female |
| Under 5 Years | 0 (0.0%) | 0 (0.0%) |
| 5 to 17 Years | 0 (0.0%) | 0 (0.0%) |
| 18 to 34 Years | 0 (0.0%) | 10 (100.0%) |
| 35 to 64 Years | 0 (0.0%) | 0 (0.0%) |
| 65 to 74 Years | 0 (0.0%) | 0 (0.0%) |
| 75 Years and over | 0 (0.0%) | 74 (43.0%) |
Disability Class: Vision Difficulty
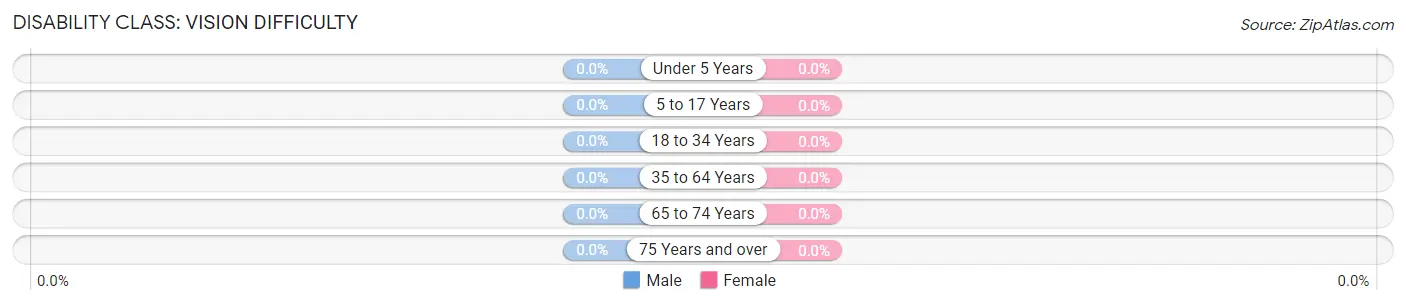
| Age Bracket | Male | Female |
| Under 5 Years | 0 (0.0%) | 0 (0.0%) |
| 5 to 17 Years | 0 (0.0%) | 0 (0.0%) |
| 18 to 34 Years | 0 (0.0%) | 0 (0.0%) |
| 35 to 64 Years | 0 (0.0%) | 0 (0.0%) |
| 65 to 74 Years | 0 (0.0%) | 0 (0.0%) |
| 75 Years and over | 0 (0.0%) | 0 (0.0%) |
Disability Class: Cognitive Difficulty
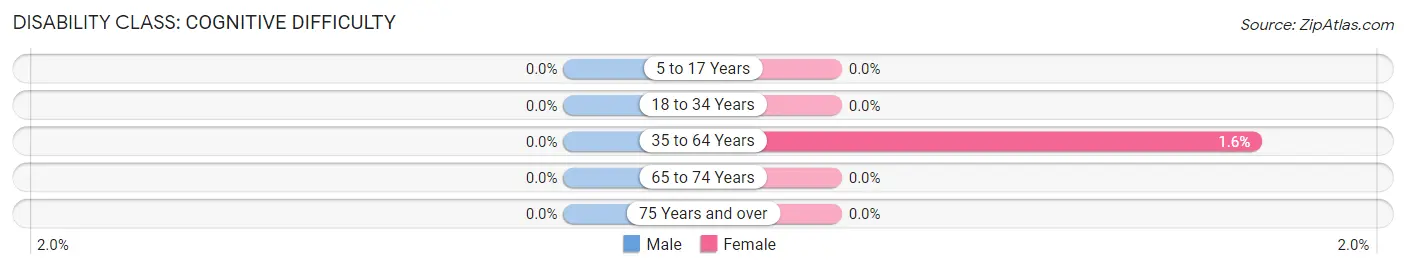
| Age Bracket | Male | Female |
| 5 to 17 Years | 0 (0.0%) | 0 (0.0%) |
| 18 to 34 Years | 0 (0.0%) | 0 (0.0%) |
| 35 to 64 Years | 0 (0.0%) | 3 (1.6%) |
| 65 to 74 Years | 0 (0.0%) | 0 (0.0%) |
| 75 Years and over | 0 (0.0%) | 0 (0.0%) |
Disability Class: Ambulatory Difficulty
| Age Bracket | Male | Female |
| 5 to 17 Years | 0 (0.0%) | 0 (0.0%) |
| 18 to 34 Years | 0 (0.0%) | 0 (0.0%) |
| 35 to 64 Years | 0 (0.0%) | 0 (0.0%) |
| 65 to 74 Years | 0 (0.0%) | 0 (0.0%) |
| 75 Years and over | 0 (0.0%) | 0 (0.0%) |
Disability Class: Self-Care Difficulty
| Age Bracket | Male | Female |
| 5 to 17 Years | 0 (0.0%) | 0 (0.0%) |
| 18 to 34 Years | 0 (0.0%) | 0 (0.0%) |
| 35 to 64 Years | 0 (0.0%) | 0 (0.0%) |
| 65 to 74 Years | 0 (0.0%) | 0 (0.0%) |
| 75 Years and over | 0 (0.0%) | 0 (0.0%) |
Technology Access in Bigfoot
Computing Device Access in Bigfoot
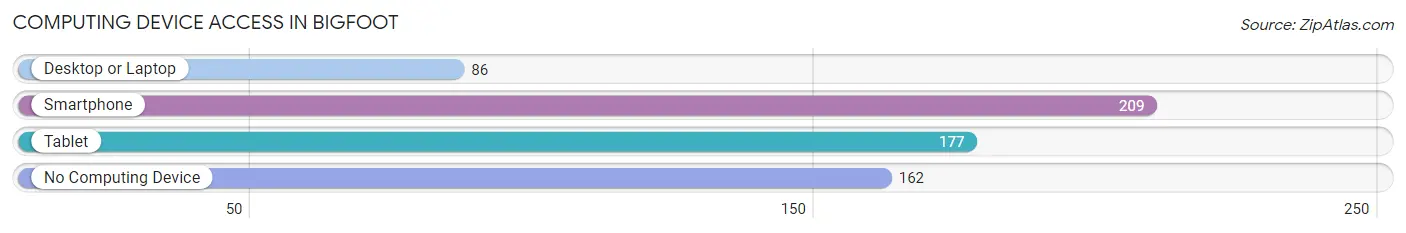
| Device Type | # Households | % Households |
| Desktop or Laptop | 86 | 19.8% |
| Smartphone | 209 | 48.0% |
| Tablet | 177 | 40.7% |
| No Computing Device | 162 | 37.2% |
| Total | 435 | 100.0% |
Internet Access in Bigfoot
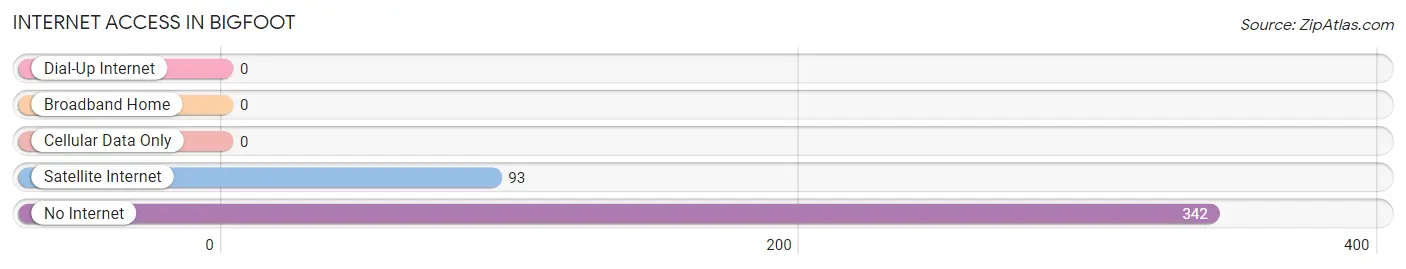
| Internet Type | # Households | % Households |
| Dial-Up Internet | 0 | 0.0% |
| Broadband Home | 0 | 0.0% |
| Cellular Data Only | 0 | 0.0% |
| Satellite Internet | 93 | 21.4% |
| No Internet | 342 | 78.6% |
| Total | 435 | 100.0% |
Bigfoot Summary
Bigfoot, Texas is a small unincorporated community located in the southeastern corner of the state, in the county of Frio. It is situated on the banks of the Frio River, about 25 miles south of San Antonio. The town was founded in the late 1800s and has a population of about 200 people.
History
Bigfoot, Texas was founded in the late 1800s by a group of settlers who were looking for a place to settle down and start a new life. The town was named after a local legend of a large, hairy creature that was said to roam the area. The legend of Bigfoot has been around for centuries, but it was not until the settlers arrived in the area that the name was officially given to the town.
The town was originally a farming community, with the main crops being cotton, corn, and wheat. As the years passed, the town began to grow and develop, and by the early 1900s, it had become a thriving community. The town was home to several businesses, including a general store, a blacksmith, a post office, and a school.
Geography
Bigfoot, Texas is located in the southeastern corner of the state, in the county of Frio. It is situated on the banks of the Frio River, about 25 miles south of San Antonio. The town is surrounded by rolling hills and is located in a semi-arid climate. The average temperature in the summer is around 90 degrees Fahrenheit, and the average temperature in the winter is around 50 degrees Fahrenheit.
Economy
The economy of Bigfoot, Texas is largely based on agriculture. The main crops grown in the area are cotton, corn, and wheat. The town also has a few small businesses, including a general store, a blacksmith, and a post office.
Demographics
As of the 2010 census, the population of Bigfoot, Texas was estimated to be around 200 people. The racial makeup of the town was 97.5% White, 0.5% African American, 0.5% Native American, and 1.5% from other races. The median household income in the town was $30,000, and the median age was 40 years old.
Conclusion
Bigfoot, Texas is a small unincorporated community located in the southeastern corner of the state, in the county of Frio. It is situated on the banks of the Frio River, about 25 miles south of San Antonio. The town was founded in the late 1800s and has a population of about 200 people. The economy of the town is largely based on agriculture, and the main crops grown in the area are cotton, corn, and wheat. The racial makeup of the town is 97.5% White, 0.5% African American, 0.5% Native American, and 1.5% from other races. The median household income in the town was $30,000, and the median age was 40 years old.
Common Questions
What is Per Capita Income in Bigfoot?
Per Capita income in Bigfoot is $34,172.
What is the Median Family Income in Bigfoot?
Median Family Income in Bigfoot is $66,213.
What is the Median Household income in Bigfoot?
Median Household Income in Bigfoot is $65,669.
What is Income or Wage Gap in Bigfoot?
Income or Wage Gap in Bigfoot is 51.2%.
Women in Bigfoot earn 48.8 cents for every dollar earned by a man.
What is Inequality or Gini Index in Bigfoot?
Inequality or Gini Index in Bigfoot is 0.36.
What is the Total Population of Bigfoot?
Total Population of Bigfoot is 1,012.
What is the Total Male Population of Bigfoot?
Total Male Population of Bigfoot is 631.
What is the Total Female Population of Bigfoot?
Total Female Population of Bigfoot is 381.
What is the Ratio of Males per 100 Females in Bigfoot?
There are 165.62 Males per 100 Females in Bigfoot.
What is the Ratio of Females per 100 Males in Bigfoot?
There are 60.38 Females per 100 Males in Bigfoot.
What is the Median Population Age in Bigfoot?
Median Population Age in Bigfoot is 41.3 Years.
What is the Average Family Size in Bigfoot
Average Family Size in Bigfoot is 2.6 People.
What is the Average Household Size in Bigfoot
Average Household Size in Bigfoot is 2.3 People.
How Large is the Labor Force in Bigfoot?
There are 735 People in the Labor Forcein in Bigfoot.
What is the Percentage of People in the Labor Force in Bigfoot?
72.6% of People are in the Labor Force in Bigfoot.