Fargo, GA Map & Demographics
Fargo Map
Fargo Overview
$34,206
PER CAPITA INCOME
$69,362
AVG FAMILY INCOME
$68,960
AVG HOUSEHOLD INCOME
0.29
INEQUALITY / GINI INDEX
460
TOTAL POPULATION
242
MALE POPULATION
218
FEMALE POPULATION
111.01
MALES / 100 FEMALES
90.08
FEMALES / 100 MALES
39.8
MEDIAN AGE
2.0
AVG FAMILY SIZE
1.9
AVG HOUSEHOLD SIZE
225
LABOR FORCE [ PEOPLE ]
58.9%
PERCENT IN LABOR FORCE
0.4%
UNEMPLOYMENT RATE
Fargo Zip Codes
Fargo Area Codes
Income in Fargo
Income Overview in Fargo
Per Capita Income in Fargo is $34,206, while median incomes of families and households are $69,362 and $68,960 respectively.
| Characteristic | Number | Measure |
| Per Capita Income | 460 | $34,206 |
| Median Family Income | 205 | $69,362 |
| Mean Family Income | 205 | $74,476 |
| Median Household Income | 242 | $68,960 |
| Mean Household Income | 242 | $68,076 |
| Income Deficit | 205 | $0 |
| Wage / Income Gap (%) | 460 | 0.00% |
| Wage / Income Gap ($) | 460 | 100.00¢ per $1 |
| Gini / Inequality Index | 460 | 0.29 |
Earnings by Sex in Fargo
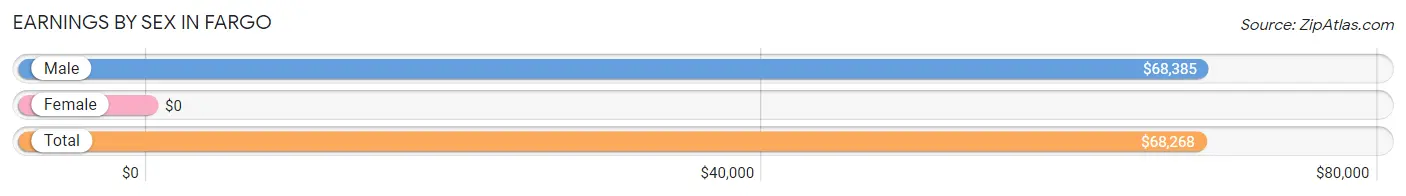
| Sex | Number | Average Earnings |
| Male | 140 (61.1%) | $68,385 |
| Female | 89 (38.9%) | $0 |
| Total | 229 (100.0%) | $68,268 |
Earnings by Sex by Income Bracket in Fargo
The most common earnings brackets in Fargo are $65,000 to $74,999 for men (103 | 73.6%) and $100,000+ for women (28 | 31.5%).
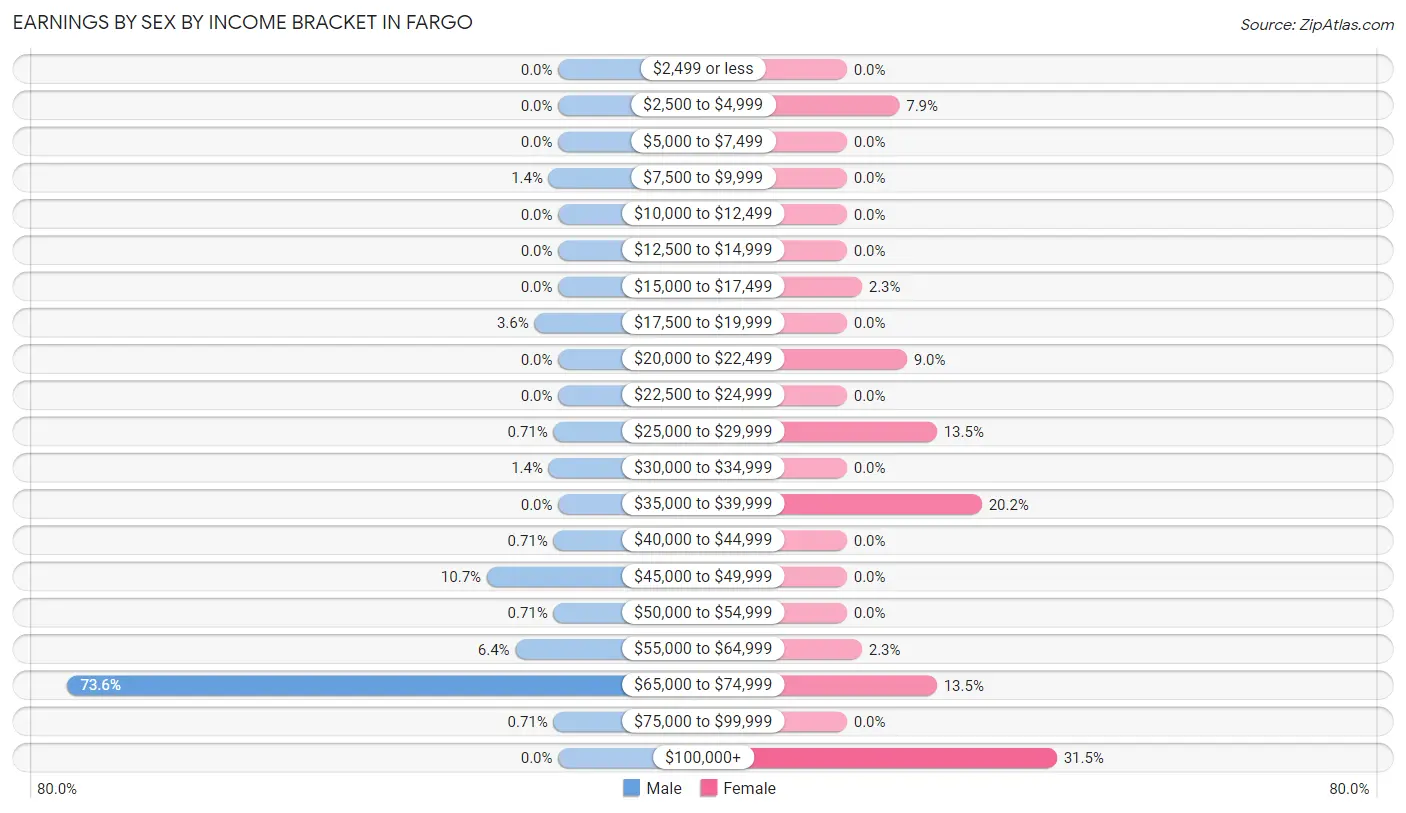
| Income | Male | Female |
| $2,499 or less | 0 (0.0%) | 0 (0.0%) |
| $2,500 to $4,999 | 0 (0.0%) | 7 (7.9%) |
| $5,000 to $7,499 | 0 (0.0%) | 0 (0.0%) |
| $7,500 to $9,999 | 2 (1.4%) | 0 (0.0%) |
| $10,000 to $12,499 | 0 (0.0%) | 0 (0.0%) |
| $12,500 to $14,999 | 0 (0.0%) | 0 (0.0%) |
| $15,000 to $17,499 | 0 (0.0%) | 2 (2.2%) |
| $17,500 to $19,999 | 5 (3.6%) | 0 (0.0%) |
| $20,000 to $22,499 | 0 (0.0%) | 8 (9.0%) |
| $22,500 to $24,999 | 0 (0.0%) | 0 (0.0%) |
| $25,000 to $29,999 | 1 (0.7%) | 12 (13.5%) |
| $30,000 to $34,999 | 2 (1.4%) | 0 (0.0%) |
| $35,000 to $39,999 | 0 (0.0%) | 18 (20.2%) |
| $40,000 to $44,999 | 1 (0.7%) | 0 (0.0%) |
| $45,000 to $49,999 | 15 (10.7%) | 0 (0.0%) |
| $50,000 to $54,999 | 1 (0.7%) | 0 (0.0%) |
| $55,000 to $64,999 | 9 (6.4%) | 2 (2.2%) |
| $65,000 to $74,999 | 103 (73.6%) | 12 (13.5%) |
| $75,000 to $99,999 | 1 (0.7%) | 0 (0.0%) |
| $100,000+ | 0 (0.0%) | 28 (31.5%) |
| Total | 140 (100.0%) | 89 (100.0%) |
Earnings by Sex by Educational Attainment in Fargo
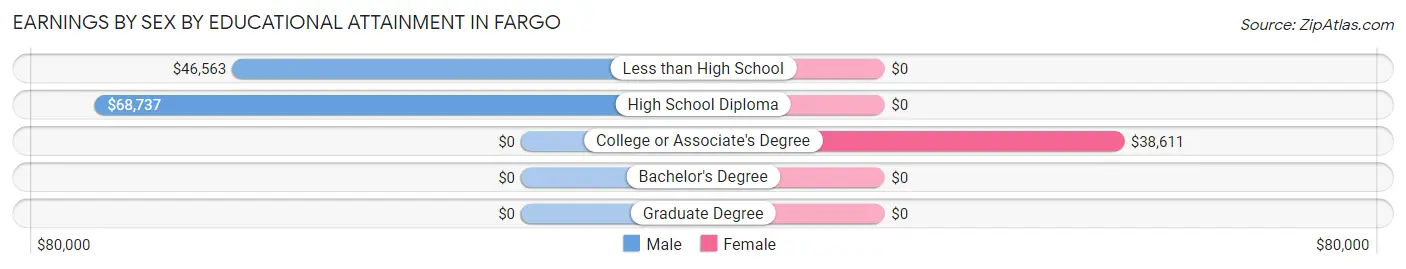
| Educational Attainment | Male Income | Female Income |
| Less than High School | $46,563 | $0 |
| High School Diploma | $68,737 | $0 |
| College or Associate's Degree | - | - |
| Bachelor's Degree | - | - |
| Graduate Degree | - | - |
| Total | $68,490 | $0 |
Family Income in Fargo
Family Income Brackets in Fargo
According to the Fargo family income data, there are 113 families falling into the $50,000 to $74,999 income range, which is the most common income bracket and makes up 55.1% of all families.
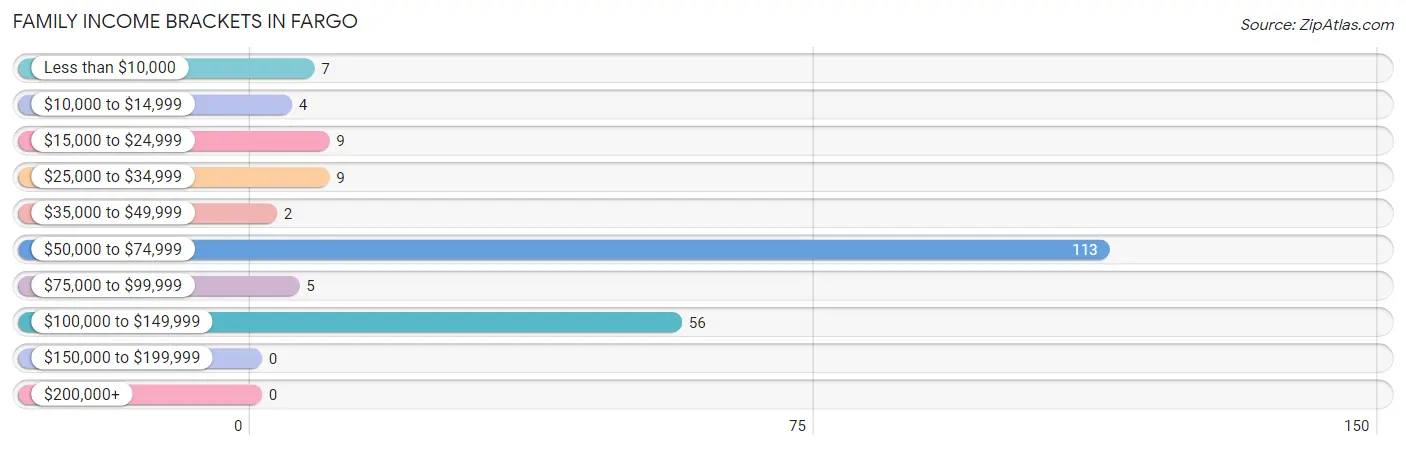
| Income Bracket | # Families | % Families |
| Less than $10,000 | 7 | 3.4% |
| $10,000 to $14,999 | 4 | 2.0% |
| $15,000 to $24,999 | 9 | 4.4% |
| $25,000 to $34,999 | 9 | 4.4% |
| $35,000 to $49,999 | 2 | 1.0% |
| $50,000 to $74,999 | 113 | 55.1% |
| $75,000 to $99,999 | 5 | 2.4% |
| $100,000 to $149,999 | 56 | 27.3% |
| $150,000 to $199,999 | 0 | 0.0% |
| $200,000+ | 0 | 0.0% |
Family Income by Famaliy Size in Fargo
3-person families (33 | 16.1%) account for the highest median family income in Fargo with $100,208 per family, while 2-person families (164 | 80.0%) have the highest median income of $34,610 per family member.
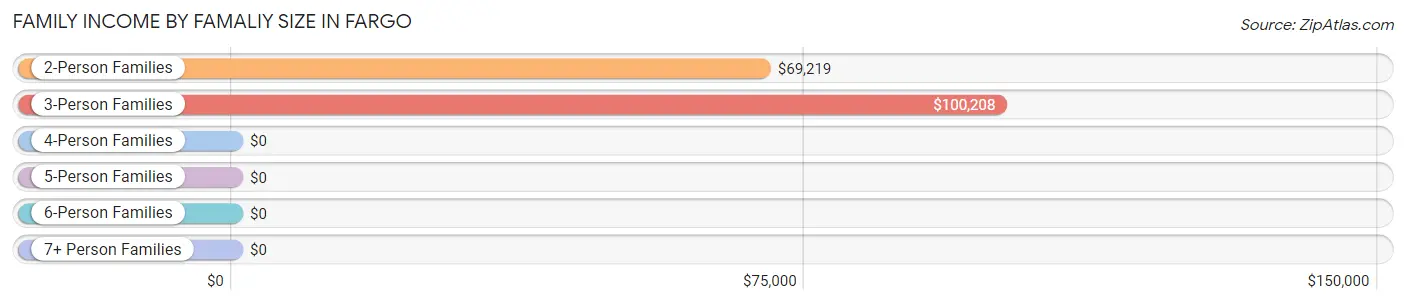
| Income Bracket | # Families | Median Income |
| 2-Person Families | 164 (80.0%) | $69,219 |
| 3-Person Families | 33 (16.1%) | $100,208 |
| 4-Person Families | 8 (3.9%) | $0 |
| 5-Person Families | 0 (0.0%) | $0 |
| 6-Person Families | 0 (0.0%) | $0 |
| 7+ Person Families | 0 (0.0%) | $0 |
| Total | 205 (100.0%) | $69,362 |
Family Income by Number of Earners in Fargo
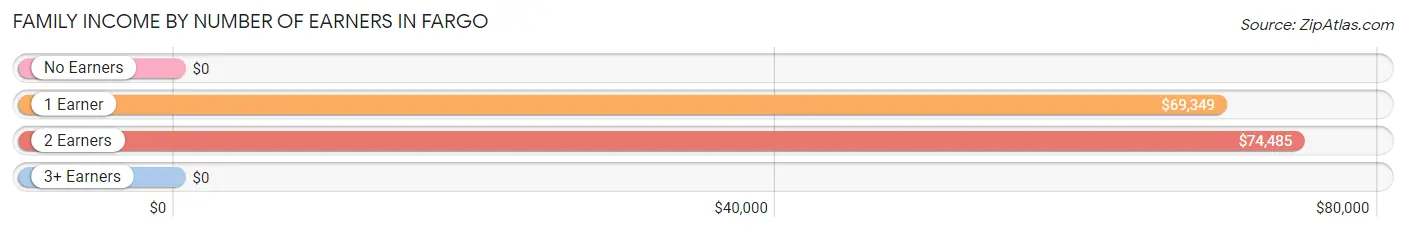
| Number of Earners | # Families | Median Income |
| No Earners | 26 (12.7%) | $0 |
| 1 Earner | 152 (74.2%) | $69,349 |
| 2 Earners | 27 (13.2%) | $74,485 |
| 3+ Earners | 0 (0.0%) | $0 |
| Total | 205 (100.0%) | $69,362 |
Household Income in Fargo
Household Income Brackets in Fargo
With 118 households falling in the category, the $50,000 to $74,999 income range is the most frequent in Fargo, accounting for 48.8% of all households.
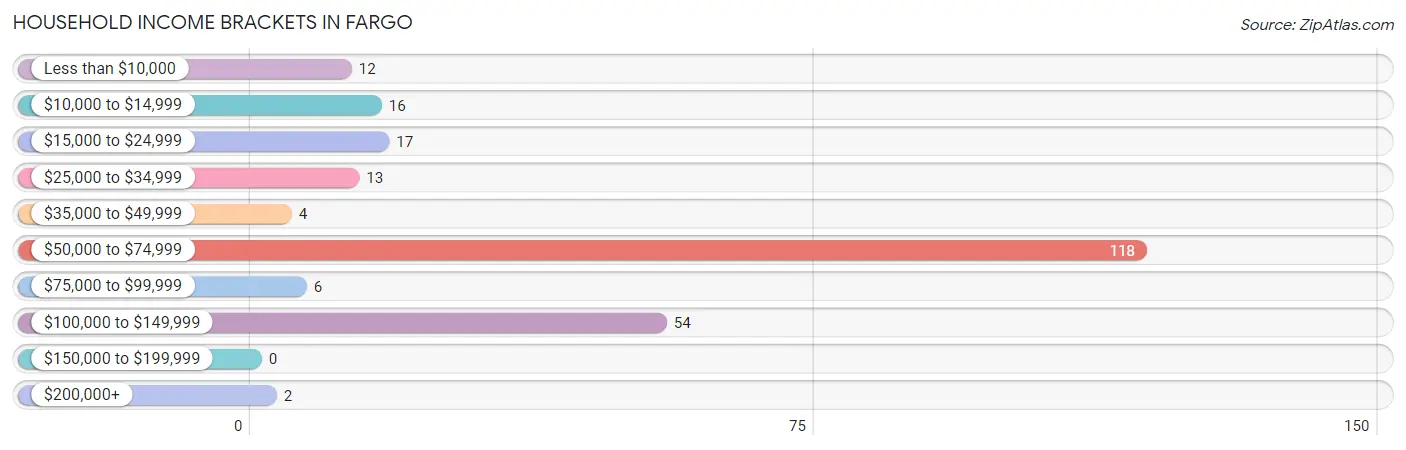
| Income Bracket | # Households | % Households |
| Less than $10,000 | 12 | 5.0% |
| $10,000 to $14,999 | 16 | 6.6% |
| $15,000 to $24,999 | 17 | 7.0% |
| $25,000 to $34,999 | 13 | 5.4% |
| $35,000 to $49,999 | 4 | 1.7% |
| $50,000 to $74,999 | 118 | 48.8% |
| $75,000 to $99,999 | 6 | 2.5% |
| $100,000 to $149,999 | 54 | 22.3% |
| $150,000 to $199,999 | 0 | 0.0% |
| $200,000+ | 2 | 0.8% |
Household Income by Householder Age in Fargo
The median household income in Fargo is $68,960, with the highest median household income of $117,768 found in the 25 to 44 years age bracket for the primary householder. A total of 64 households (26.5%) fall into this category. Meanwhile, the 65+ years age bracket for the primary householder has the lowest median household income of $0, with 47 households (19.4%) in this group.
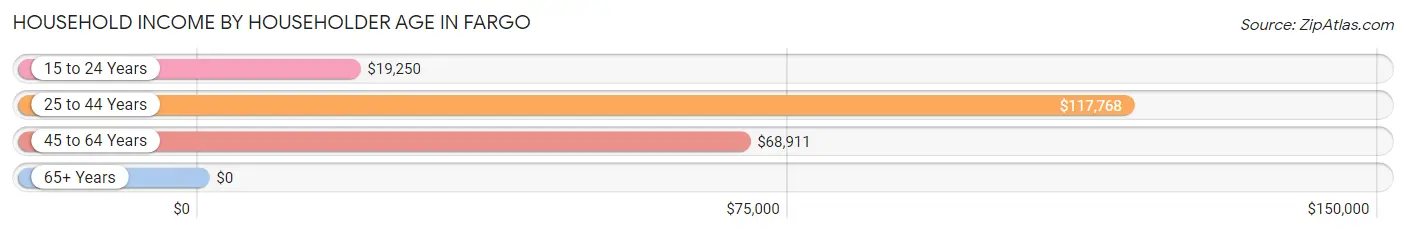
| Income Bracket | # Households | Median Income |
| 15 to 24 Years | 9 (3.7%) | $19,250 |
| 25 to 44 Years | 64 (26.5%) | $117,768 |
| 45 to 64 Years | 122 (50.4%) | $68,911 |
| 65+ Years | 47 (19.4%) | $0 |
| Total | 242 (100.0%) | $68,960 |
Poverty in Fargo
Income Below Poverty by Sex and Age in Fargo
With 17.4% poverty level for males and 13.8% for females among the residents of Fargo, 65 to 74 year old males and 18 to 24 year old females are the most vulnerable to poverty, with 8 males (61.5%) and 1 females (100.0%) in their respective age groups living below the poverty level.
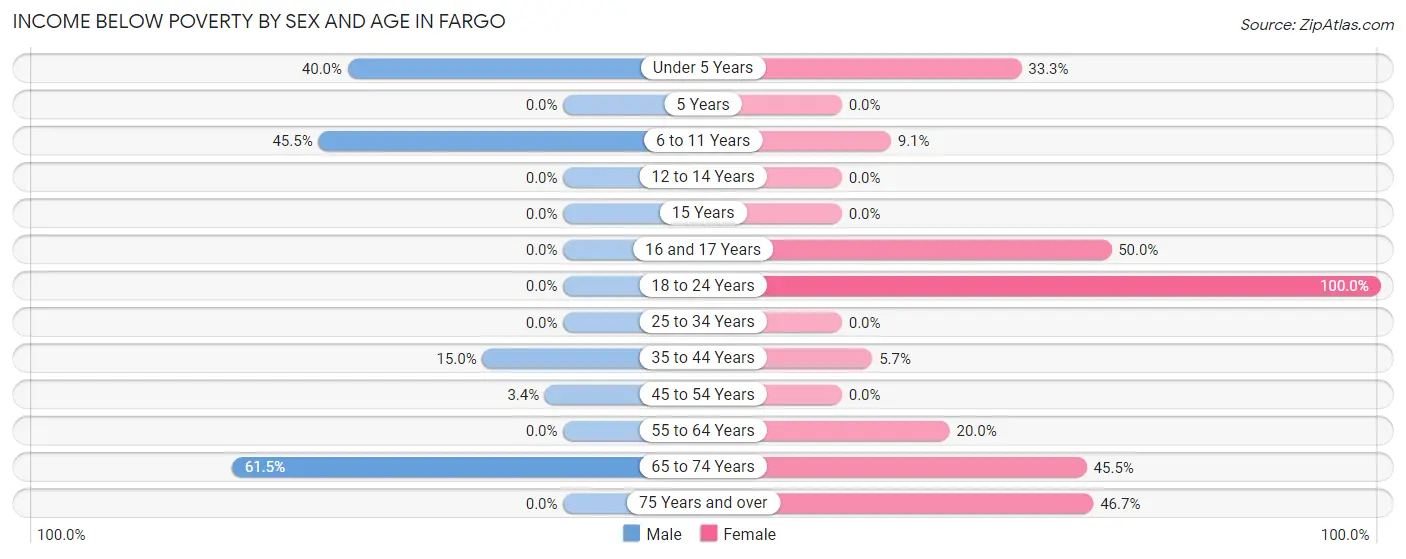
| Age Bracket | Male | Female |
| Under 5 Years | 2 (40.0%) | 2 (33.3%) |
| 5 Years | 0 (0.0%) | 0 (0.0%) |
| 6 to 11 Years | 25 (45.5%) | 1 (9.1%) |
| 12 to 14 Years | 0 (0.0%) | 0 (0.0%) |
| 15 Years | 0 (0.0%) | 0 (0.0%) |
| 16 and 17 Years | 0 (0.0%) | 1 (50.0%) |
| 18 to 24 Years | 0 (0.0%) | 1 (100.0%) |
| 25 to 34 Years | 0 (0.0%) | 0 (0.0%) |
| 35 to 44 Years | 3 (15.0%) | 7 (5.7%) |
| 45 to 54 Years | 4 (3.4%) | 0 (0.0%) |
| 55 to 64 Years | 0 (0.0%) | 1 (20.0%) |
| 65 to 74 Years | 8 (61.5%) | 10 (45.5%) |
| 75 Years and over | 0 (0.0%) | 7 (46.7%) |
| Total | 42 (17.4%) | 30 (13.8%) |
Income Above Poverty by Sex and Age in Fargo
According to the poverty statistics in Fargo, males aged 15 years and females aged 25 to 34 years are the age groups that are most secure financially, with 100.0% of males and 100.0% of females in these age groups living above the poverty line.
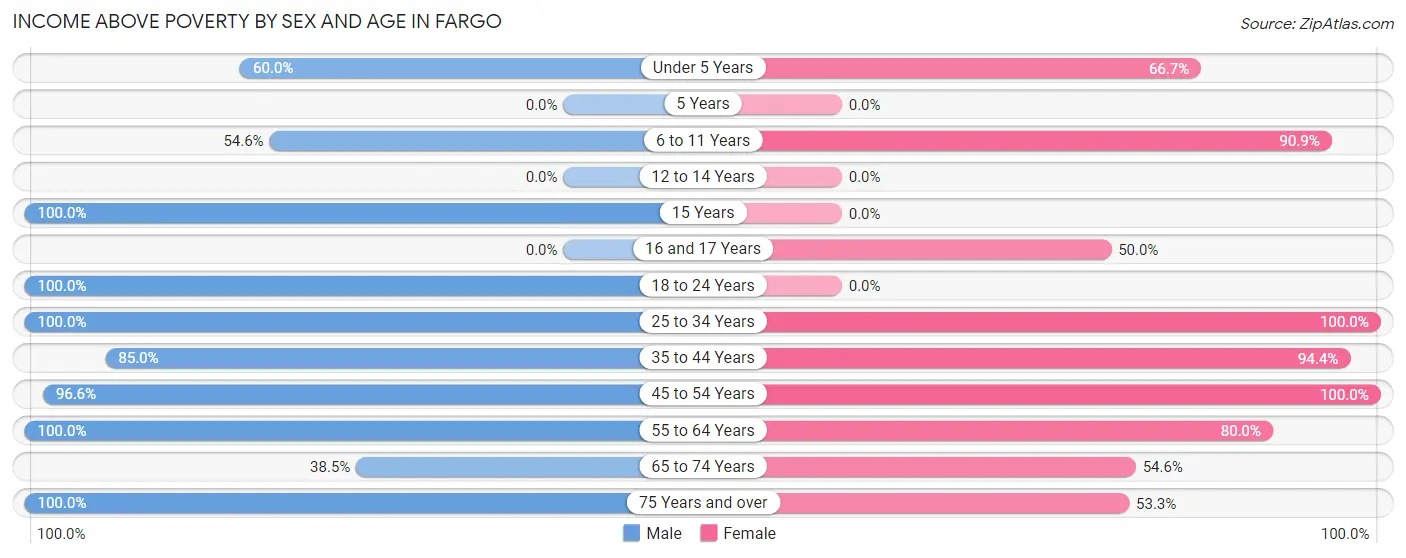
| Age Bracket | Male | Female |
| Under 5 Years | 3 (60.0%) | 4 (66.7%) |
| 5 Years | 0 (0.0%) | 0 (0.0%) |
| 6 to 11 Years | 30 (54.5%) | 10 (90.9%) |
| 12 to 14 Years | 0 (0.0%) | 0 (0.0%) |
| 15 Years | 1 (100.0%) | 0 (0.0%) |
| 16 and 17 Years | 0 (0.0%) | 1 (50.0%) |
| 18 to 24 Years | 9 (100.0%) | 0 (0.0%) |
| 25 to 34 Years | 5 (100.0%) | 23 (100.0%) |
| 35 to 44 Years | 17 (85.0%) | 117 (94.4%) |
| 45 to 54 Years | 114 (96.6%) | 9 (100.0%) |
| 55 to 64 Years | 4 (100.0%) | 4 (80.0%) |
| 65 to 74 Years | 5 (38.5%) | 12 (54.5%) |
| 75 Years and over | 12 (100.0%) | 8 (53.3%) |
| Total | 200 (82.6%) | 188 (86.2%) |
Income Below Poverty Among Married-Couple Families in Fargo
The poverty statistics for married-couple families in Fargo show that 2.5% or 4 of the total 163 families live below the poverty line. Families with 1 or 2 children have the highest poverty rate of 11.1%, comprising of 3 families. On the other hand, families with no children have the lowest poverty rate of 0.7%, which includes 1 families.
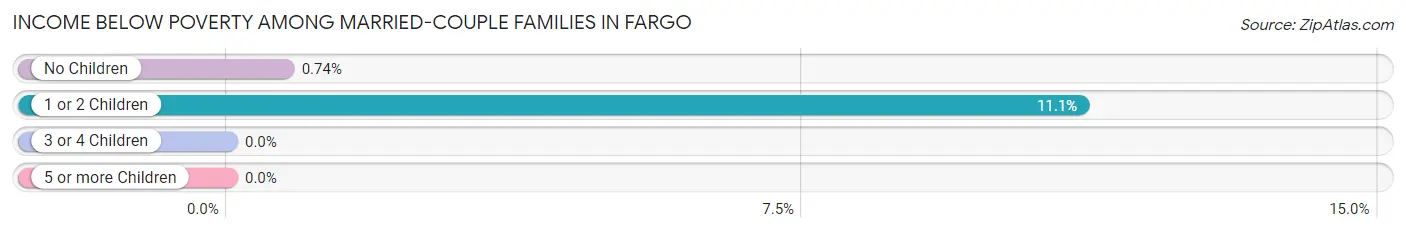
| Children | Above Poverty | Below Poverty |
| No Children | 135 (99.3%) | 1 (0.7%) |
| 1 or 2 Children | 24 (88.9%) | 3 (11.1%) |
| 3 or 4 Children | 0 (0.0%) | 0 (0.0%) |
| 5 or more Children | 0 (0.0%) | 0 (0.0%) |
| Total | 159 (97.6%) | 4 (2.5%) |
Income Below Poverty Among Single-Parent Households in Fargo
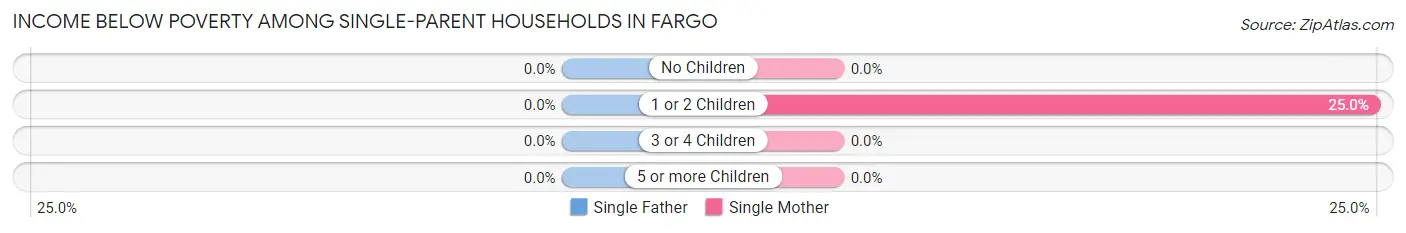
| Children | Single Father | Single Mother |
| No Children | 0 (0.0%) | 0 (0.0%) |
| 1 or 2 Children | 0 (0.0%) | 10 (25.0%) |
| 3 or 4 Children | 0 (0.0%) | 0 (0.0%) |
| 5 or more Children | 0 (0.0%) | 0 (0.0%) |
| Total | 0 (0.0%) | 10 (25.0%) |
Income Below Poverty Among Married-Couple vs Single-Parent Households in Fargo
The poverty data for Fargo shows that 4 of the married-couple family households (2.5%) and 10 of the single-parent households (23.8%) are living below the poverty level. Within the married-couple family households, those with 1 or 2 children have the highest poverty rate, with 3 households (11.1%) falling below the poverty line. Among the single-parent households, those with 1 or 2 children have the highest poverty rate, with 10 household (23.8%) living below poverty.
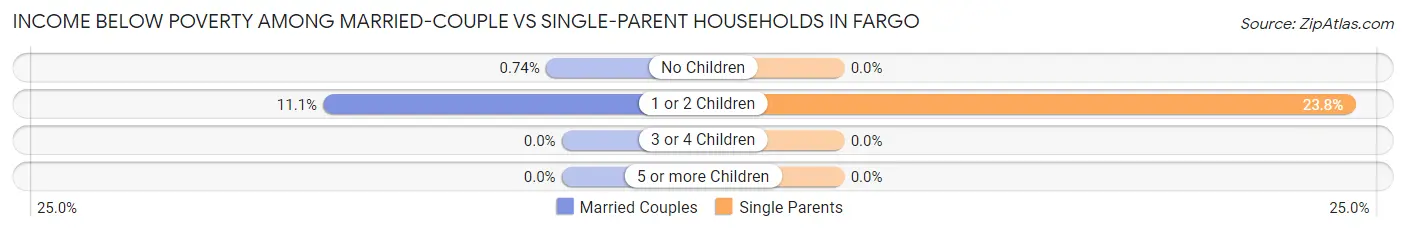
| Children | Married-Couple Families | Single-Parent Households |
| No Children | 1 (0.7%) | 0 (0.0%) |
| 1 or 2 Children | 3 (11.1%) | 10 (23.8%) |
| 3 or 4 Children | 0 (0.0%) | 0 (0.0%) |
| 5 or more Children | 0 (0.0%) | 0 (0.0%) |
| Total | 4 (2.5%) | 10 (23.8%) |
Race in Fargo
The most populous races in Fargo are White / Caucasian (381 | 82.8%), Black / African American (44 | 9.6%), and Native / Alaskan (20 | 4.3%).
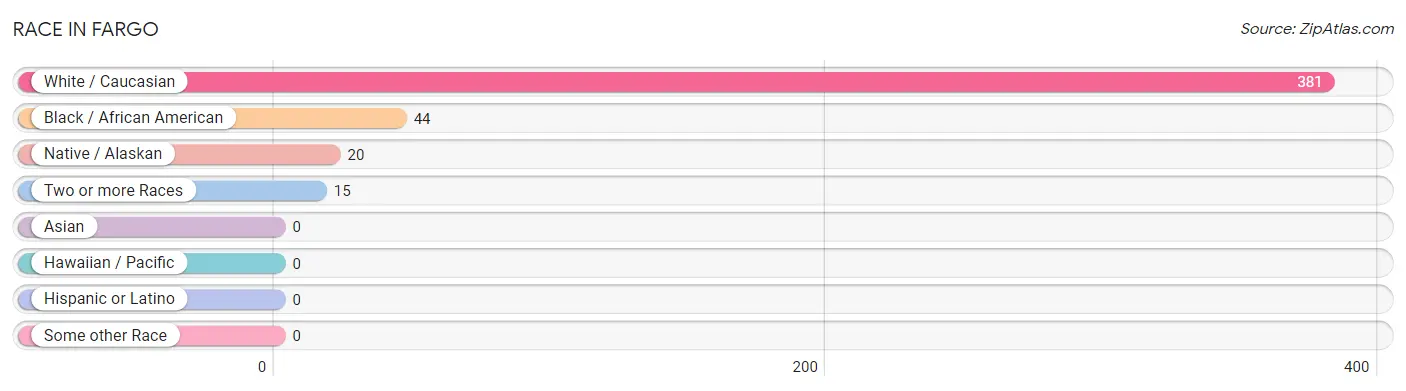
| Race | # Population | % Population |
| Asian | 0 | 0.0% |
| Black / African American | 44 | 9.6% |
| Hawaiian / Pacific | 0 | 0.0% |
| Hispanic or Latino | 0 | 0.0% |
| Native / Alaskan | 20 | 4.3% |
| White / Caucasian | 381 | 82.8% |
| Two or more Races | 15 | 3.3% |
| Some other Race | 0 | 0.0% |
| Total | 460 | 100.0% |
Ancestry in Fargo
The most populous ancestries reported in Fargo are American (98 | 21.3%), Creek (18 | 3.9%), English (4 | 0.9%), Irish (3 | 0.6%), and European (2 | 0.4%), together accounting for 27.2% of all Fargo residents.
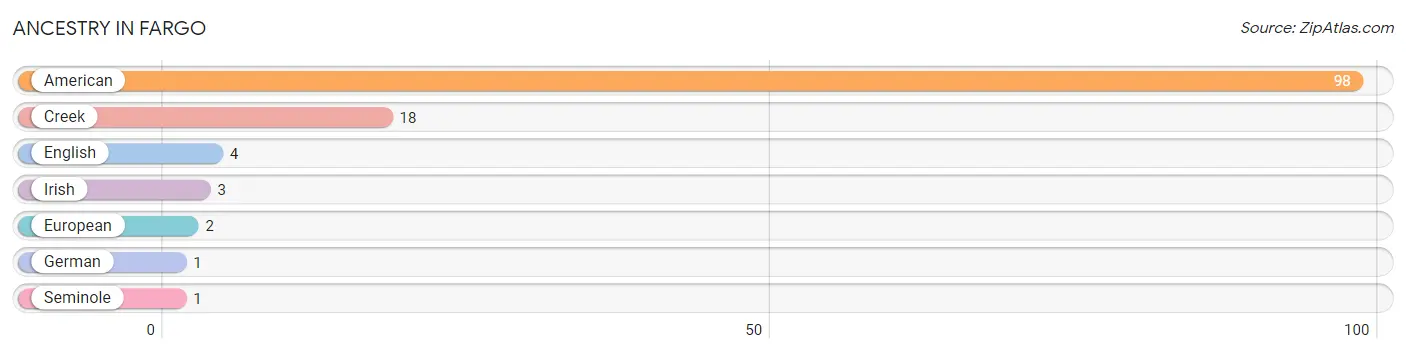
| Ancestry | # Population | % Population |
| American | 98 | 21.3% |
| Creek | 18 | 3.9% |
| English | 4 | 0.9% |
| European | 2 | 0.4% |
| German | 1 | 0.2% |
| Irish | 3 | 0.6% |
| Seminole | 1 | 0.2% | View All 7 Rows |
Immigrants in Fargo

| Immigration Origin | # Population | % Population | View All 0 Rows |
Sex and Age in Fargo
Sex and Age in Fargo
The most populous age groups in Fargo are 50 to 54 Years (104 | 43.0%) for men and 35 to 39 Years (119 | 54.6%) for women.
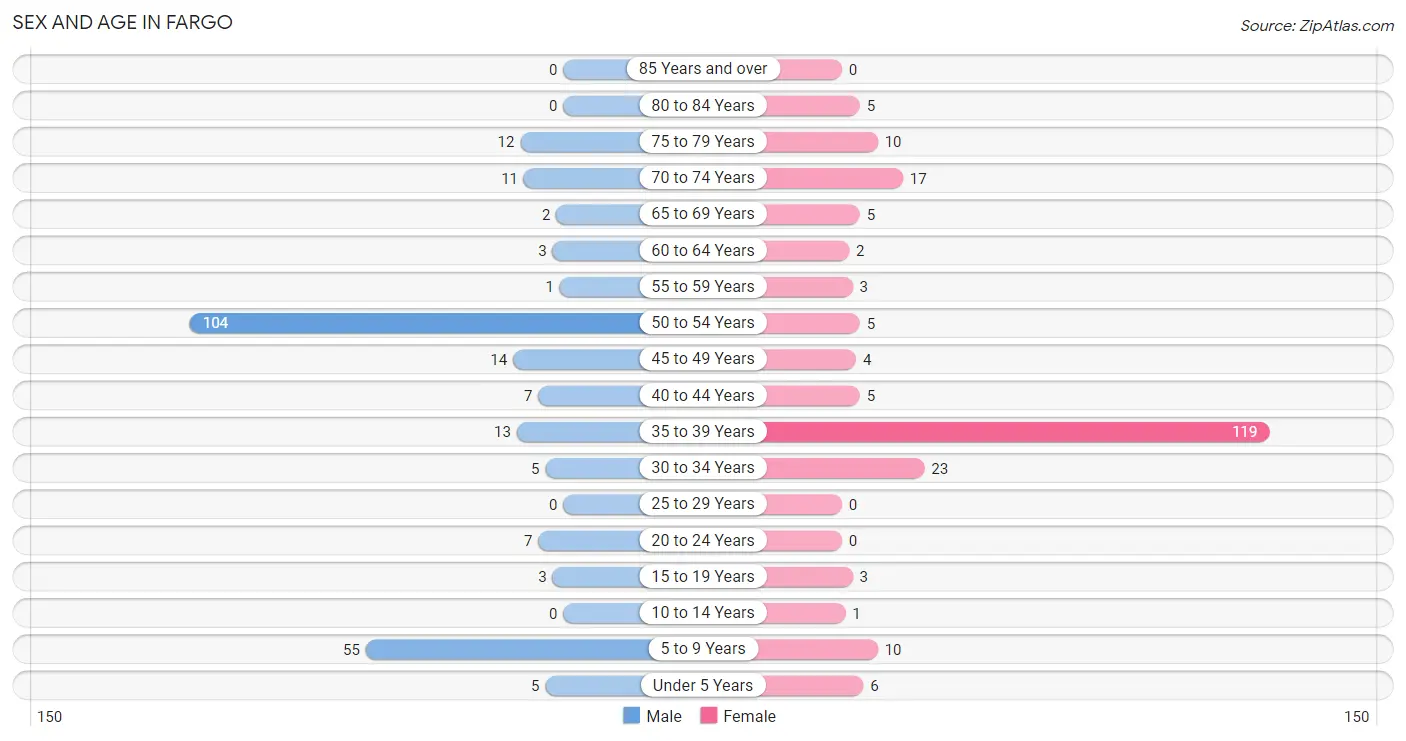
| Age Bracket | Male | Female |
| Under 5 Years | 5 (2.1%) | 6 (2.8%) |
| 5 to 9 Years | 55 (22.7%) | 10 (4.6%) |
| 10 to 14 Years | 0 (0.0%) | 1 (0.5%) |
| 15 to 19 Years | 3 (1.2%) | 3 (1.4%) |
| 20 to 24 Years | 7 (2.9%) | 0 (0.0%) |
| 25 to 29 Years | 0 (0.0%) | 0 (0.0%) |
| 30 to 34 Years | 5 (2.1%) | 23 (10.5%) |
| 35 to 39 Years | 13 (5.4%) | 119 (54.6%) |
| 40 to 44 Years | 7 (2.9%) | 5 (2.3%) |
| 45 to 49 Years | 14 (5.8%) | 4 (1.8%) |
| 50 to 54 Years | 104 (43.0%) | 5 (2.3%) |
| 55 to 59 Years | 1 (0.4%) | 3 (1.4%) |
| 60 to 64 Years | 3 (1.2%) | 2 (0.9%) |
| 65 to 69 Years | 2 (0.8%) | 5 (2.3%) |
| 70 to 74 Years | 11 (4.5%) | 17 (7.8%) |
| 75 to 79 Years | 12 (5.0%) | 10 (4.6%) |
| 80 to 84 Years | 0 (0.0%) | 5 (2.3%) |
| 85 Years and over | 0 (0.0%) | 0 (0.0%) |
| Total | 242 (100.0%) | 218 (100.0%) |
Families and Households in Fargo
Median Family Size in Fargo
The median family size in Fargo is 2.01 persons per family, with single male/father families (2 | 1.0%) accounting for the largest median family size of 4.5 persons per family. On the other hand, married-couple families (163 | 79.5%) represent the smallest median family size with 1.86 persons per family.
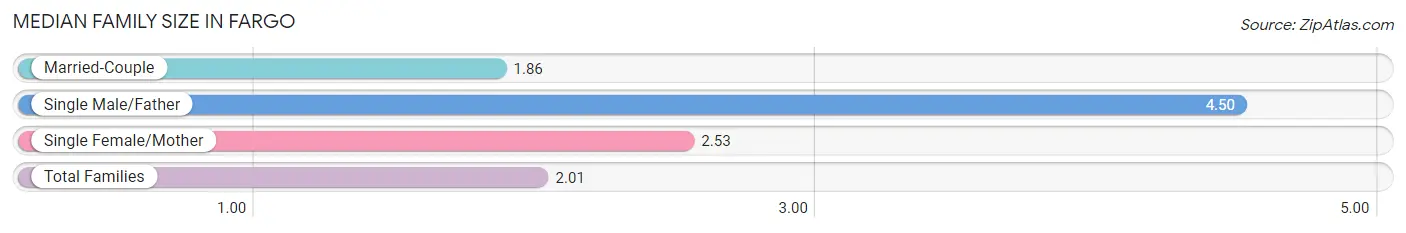
| Family Type | # Families | Family Size |
| Married-Couple | 163 (79.5%) | 1.86 |
| Single Male/Father | 2 (1.0%) | 4.50 |
| Single Female/Mother | 40 (19.5%) | 2.53 |
| Total Families | 205 (100.0%) | 2.01 |
Median Household Size in Fargo
The median household size in Fargo is 1.90 persons per household, with single male/father households (2 | 0.8%) accounting for the largest median household size of 6.5 persons per household. non-family households (37 | 15.3%) represent the smallest median household size with 1.14 persons per household.
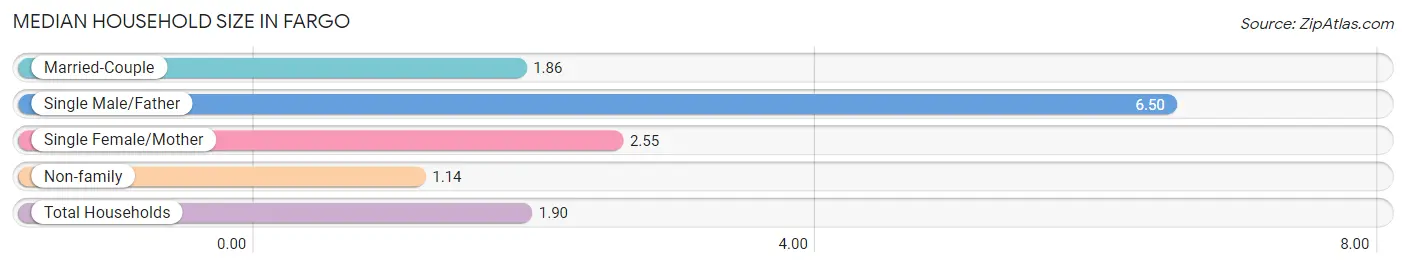
| Household Type | # Households | Household Size |
| Married-Couple | 163 (67.4%) | 1.86 |
| Single Male/Father | 2 (0.8%) | 6.50 |
| Single Female/Mother | 40 (16.5%) | 2.55 |
| Non-family | 37 (15.3%) | 1.14 |
| Total Households | 242 (100.0%) | 1.90 |
Household Size by Marriage Status in Fargo
Out of a total of 242 households in Fargo, 205 (84.7%) are family households, while 37 (15.3%) are nonfamily households. The most numerous type of family households are 2-person households, comprising 164, and the most common type of nonfamily households are 1-person households, comprising 30.
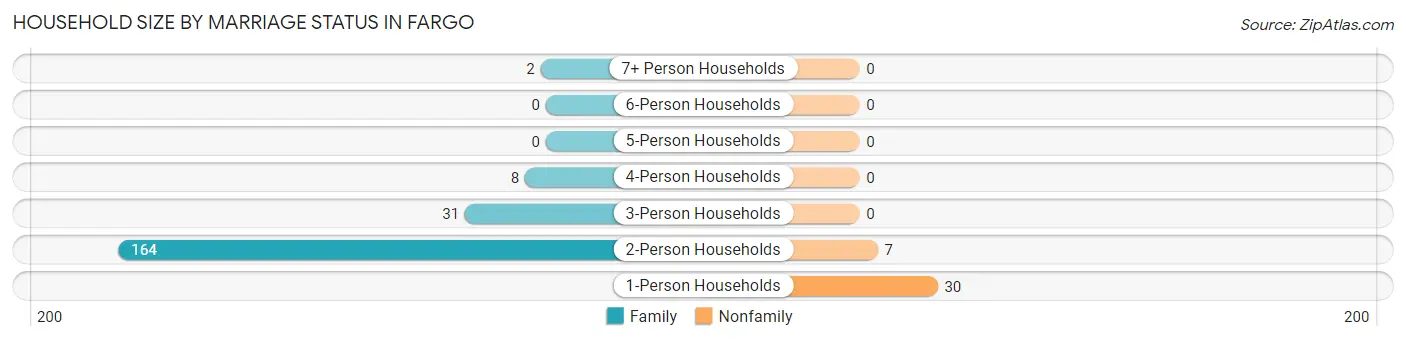
| Household Size | Family Households | Nonfamily Households |
| 1-Person Households | - | 30 (12.4%) |
| 2-Person Households | 164 (67.8%) | 7 (2.9%) |
| 3-Person Households | 31 (12.8%) | 0 (0.0%) |
| 4-Person Households | 8 (3.3%) | 0 (0.0%) |
| 5-Person Households | 0 (0.0%) | 0 (0.0%) |
| 6-Person Households | 0 (0.0%) | 0 (0.0%) |
| 7+ Person Households | 2 (0.8%) | 0 (0.0%) |
| Total | 205 (84.7%) | 37 (15.3%) |
Female Fertility in Fargo
Fertility by Age in Fargo
Average fertility rate in Fargo is 6.0 births per 1,000 women. Women in the age bracket of 15 to 19 years have the highest fertility rate with 333.0 births per 1,000 women. Women in the age bracket of 15 to 19 years acount for 100.0% of all women with births.
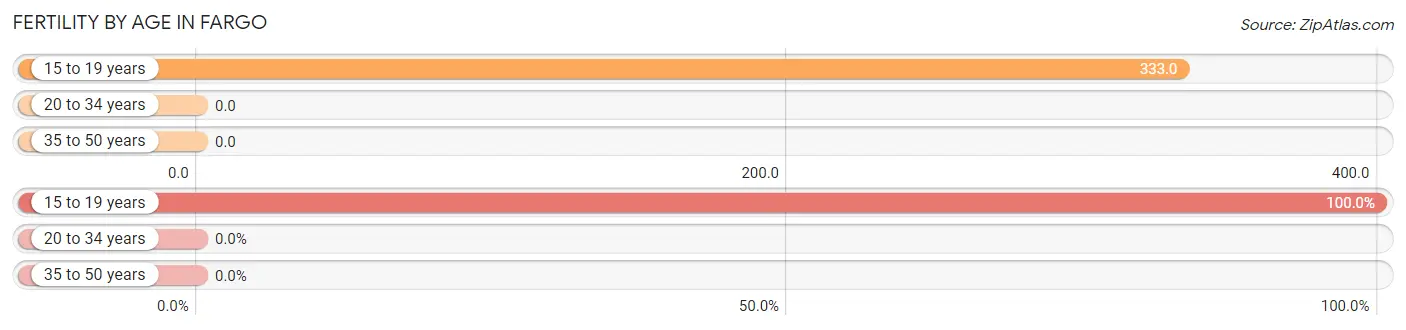
| Age Bracket | Women with Births | Births / 1,000 Women |
| 15 to 19 years | 1 (100.0%) | 333.0 |
| 20 to 34 years | 0 (0.0%) | 0.0 |
| 35 to 50 years | 0 (0.0%) | 0.0 |
| Total | 1 (100.0%) | 6.0 |
Fertility by Age by Marriage Status in Fargo
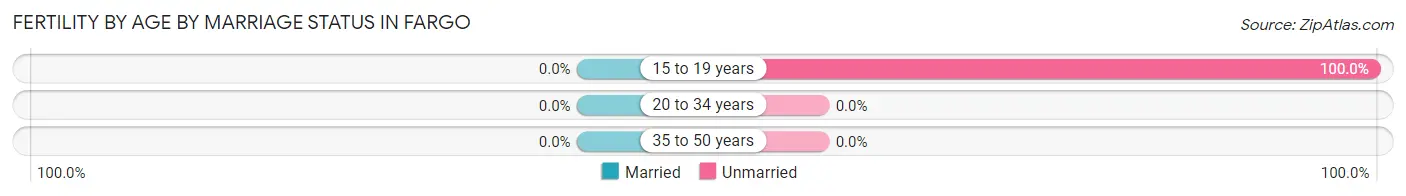
| Age Bracket | Married | Unmarried |
| 15 to 19 years | 0 (0.0%) | 1 (100.0%) |
| 20 to 34 years | 0 (0.0%) | 0 (0.0%) |
| 35 to 50 years | 0 (0.0%) | 0 (0.0%) |
| Total | 0 (0.0%) | 1 (100.0%) |
Fertility by Education in Fargo
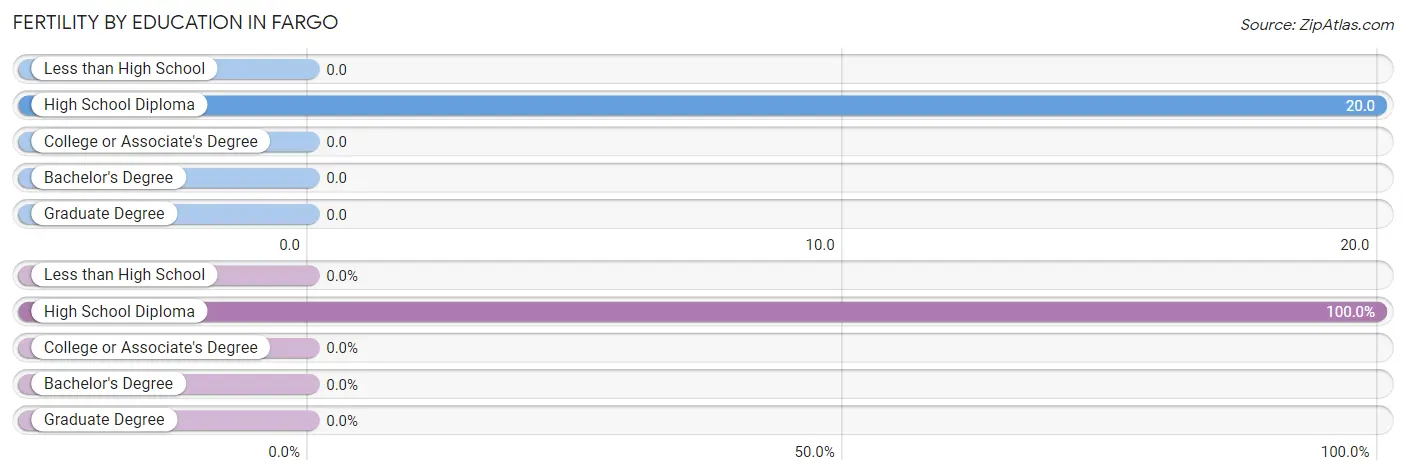
| Educational Attainment | Women with Births | Births / 1,000 Women |
| Less than High School | 0 (0.0%) | 0.0 |
| High School Diploma | 1 (100.0%) | 20.0 |
| College or Associate's Degree | 0 (0.0%) | 0.0 |
| Bachelor's Degree | 0 (0.0%) | 0.0 |
| Graduate Degree | 0 (0.0%) | 0.0 |
| Total | 1 (100.0%) | 6.0 |
Fertility by Education by Marriage Status in Fargo
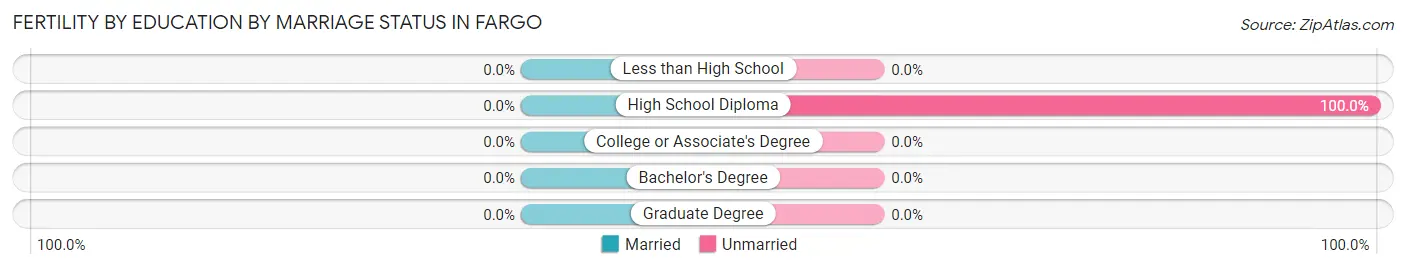
| Educational Attainment | Married | Unmarried |
| Less than High School | 0 (0.0%) | 0 (0.0%) |
| High School Diploma | 0 (0.0%) | 1 (100.0%) |
| College or Associate's Degree | 0 (0.0%) | 0 (0.0%) |
| Bachelor's Degree | 0 (0.0%) | 0 (0.0%) |
| Graduate Degree | 0 (0.0%) | 0 (0.0%) |
| Total | 0 (0.0%) | 1 (100.0%) |
Employment Characteristics in Fargo
Employment by Class of Employer in Fargo
Among the 224 employed individuals in Fargo, private company employees (155 | 69.2%), self-employed (not incorporated) (28 | 12.5%), and state government employees (22 | 9.8%) make up the most common classes of employment.
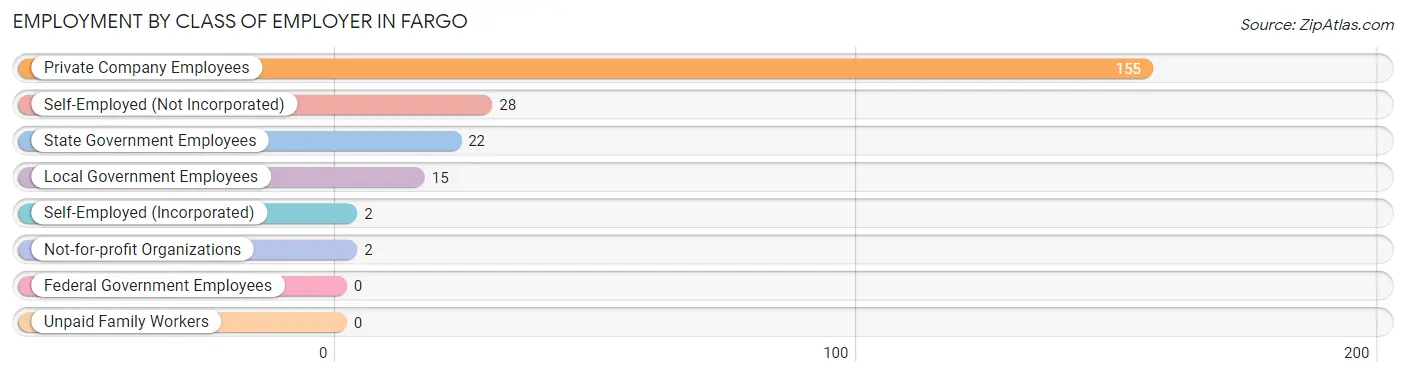
| Employer Class | # Employees | % Employees |
| Private Company Employees | 155 | 69.2% |
| Self-Employed (Incorporated) | 2 | 0.9% |
| Self-Employed (Not Incorporated) | 28 | 12.5% |
| Not-for-profit Organizations | 2 | 0.9% |
| Local Government Employees | 15 | 6.7% |
| State Government Employees | 22 | 9.8% |
| Federal Government Employees | 0 | 0.0% |
| Unpaid Family Workers | 0 | 0.0% |
| Total | 224 | 100.0% |
Employment Status by Age in Fargo
According to the labor force statistics for Fargo, out of the total population over 16 years of age (382), 58.9% or 225 individuals are in the labor force, with 0.4% or 1 of them unemployed. The age group with the highest labor force participation rate is 45 to 54 years, with 93.7% or 119 individuals in the labor force. Within the labor force, the 16 to 19 years age range has the highest percentage of unemployed individuals, with 33.3% or 1 of them being unemployed.

| Age Bracket | In Labor Force | Unemployed |
| 16 to 19 Years | 3 (60.0%) | 1 (33.3%) |
| 20 to 24 Years | 6 (85.7%) | 0 (0.0%) |
| 25 to 29 Years | 0 (0.0%) | 0 (0.0%) |
| 30 to 34 Years | 23 (82.1%) | 0 (0.0%) |
| 35 to 44 Years | 60 (41.7%) | 0 (0.0%) |
| 45 to 54 Years | 119 (93.7%) | 0 (0.0%) |
| 55 to 59 Years | 3 (75.0%) | 0 (0.0%) |
| 60 to 64 Years | 3 (60.0%) | 0 (0.0%) |
| 65 to 74 Years | 7 (20.0%) | 0 (0.0%) |
| 75 Years and over | 1 (3.7%) | 0 (0.0%) |
| Total | 225 (58.9%) | 1 (0.4%) |
Employment Status by Educational Attainment in Fargo
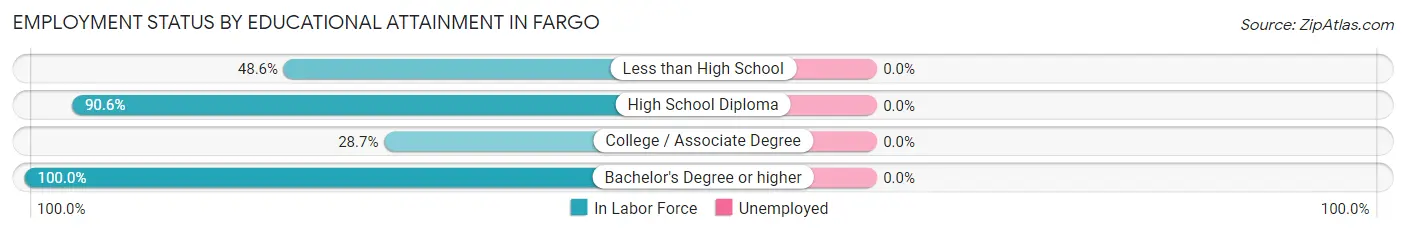
| Educational Attainment | In Labor Force | Unemployed |
| Less than High School | 17 (48.6%) | 0 (0.0%) |
| High School Diploma | 145 (90.6%) | 0 (0.0%) |
| College / Associate Degree | 27 (28.7%) | 0 (0.0%) |
| Bachelor's Degree or higher | 19 (100.0%) | 0 (0.0%) |
| Total | 208 (67.5%) | 0 (0.0%) |
Employment Occupations by Sex in Fargo
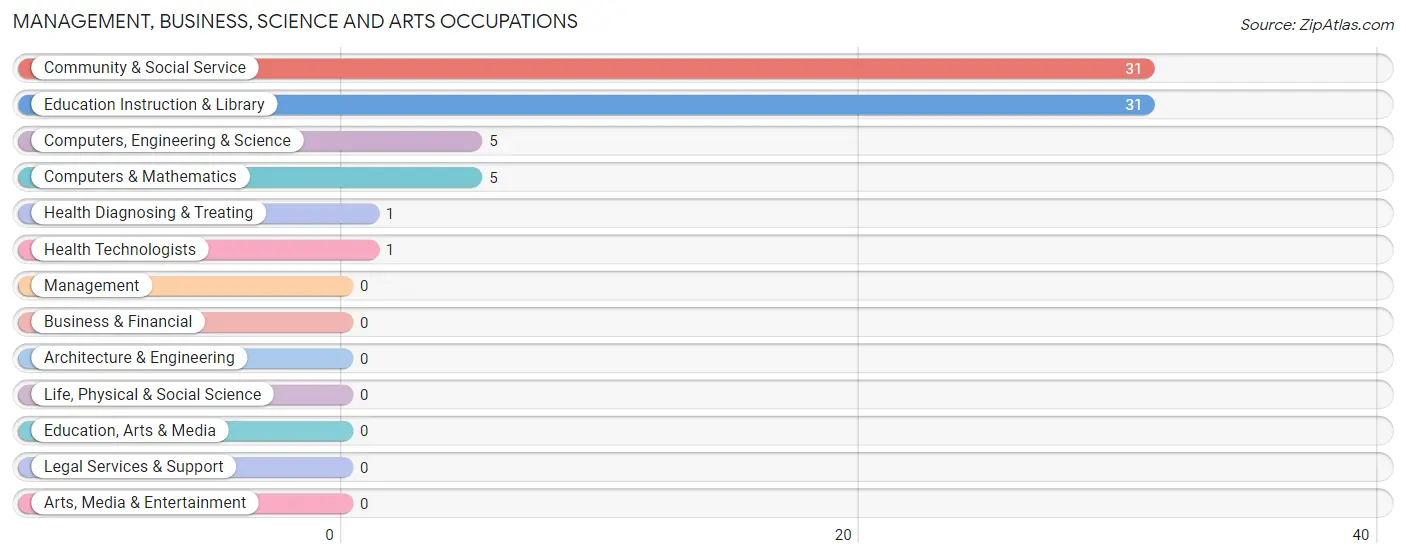
Management, Business, Science and Arts Occupations
The most common Management, Business, Science and Arts occupations in Fargo are Community & Social Service (31 | 13.8%), Education Instruction & Library (31 | 13.8%), Computers, Engineering & Science (5 | 2.2%), Computers & Mathematics (5 | 2.2%), and Health Diagnosing & Treating (1 | 0.4%).
Management, Business, Science and Arts Occupations by Sex
Within the Management, Business, Science and Arts occupations in Fargo, the most male-oriented occupations are Computers, Engineering & Science (100.0%), Computers & Mathematics (100.0%), and Community & Social Service (38.7%), while the most female-oriented occupations are Health Diagnosing & Treating (100.0%), Health Technologists (100.0%), and Community & Social Service (61.3%).
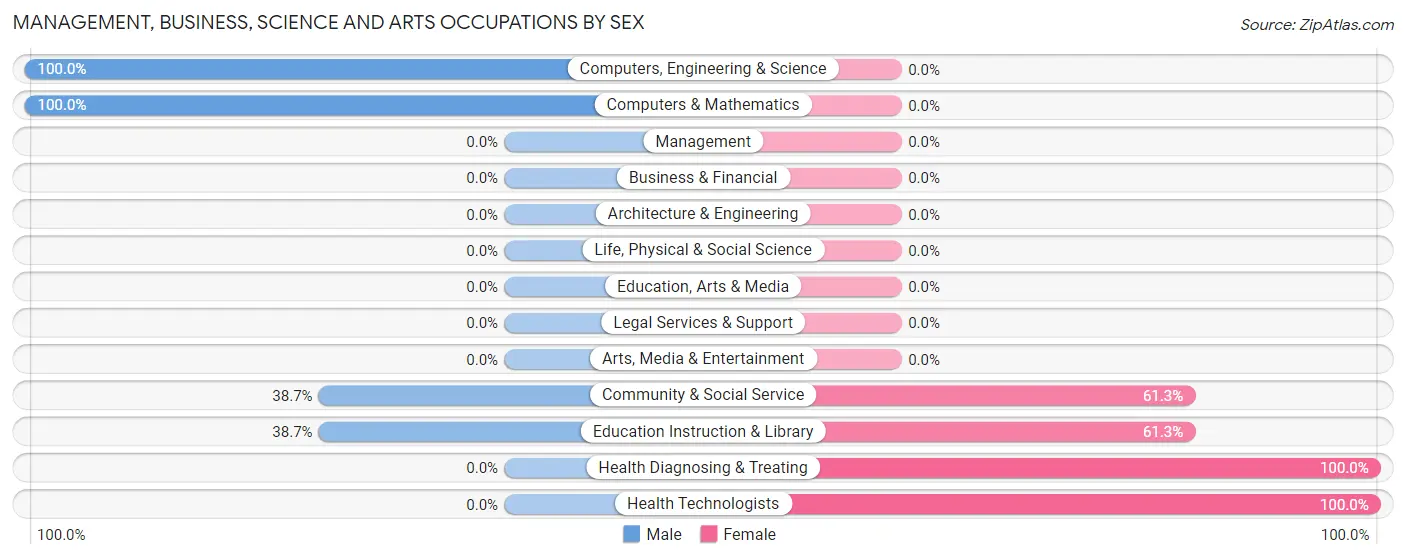
| Occupation | Male | Female |
| Management | 0 (0.0%) | 0 (0.0%) |
| Business & Financial | 0 (0.0%) | 0 (0.0%) |
| Computers, Engineering & Science | 5 (100.0%) | 0 (0.0%) |
| Computers & Mathematics | 5 (100.0%) | 0 (0.0%) |
| Architecture & Engineering | 0 (0.0%) | 0 (0.0%) |
| Life, Physical & Social Science | 0 (0.0%) | 0 (0.0%) |
| Community & Social Service | 12 (38.7%) | 19 (61.3%) |
| Education, Arts & Media | 0 (0.0%) | 0 (0.0%) |
| Legal Services & Support | 0 (0.0%) | 0 (0.0%) |
| Education Instruction & Library | 12 (38.7%) | 19 (61.3%) |
| Arts, Media & Entertainment | 0 (0.0%) | 0 (0.0%) |
| Health Diagnosing & Treating | 0 (0.0%) | 1 (100.0%) |
| Health Technologists | 0 (0.0%) | 1 (100.0%) |
| Total (Category) | 17 (46.0%) | 20 (54.0%) |
| Total (Overall) | 140 (62.5%) | 84 (37.5%) |
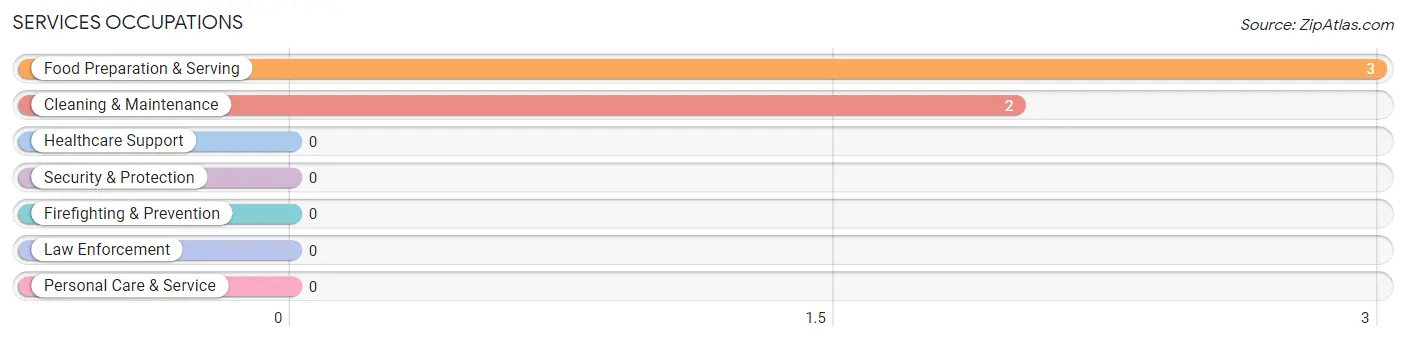
Services Occupations
The most common Services occupations in Fargo are Food Preparation & Serving (3 | 1.3%), and Cleaning & Maintenance (2 | 0.9%).
Services Occupations by Sex
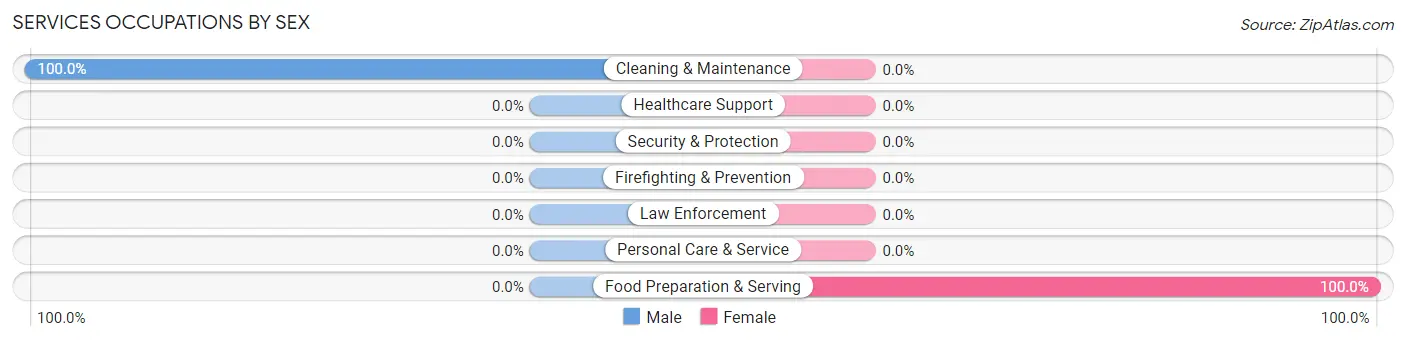
| Occupation | Male | Female |
| Healthcare Support | 0 (0.0%) | 0 (0.0%) |
| Security & Protection | 0 (0.0%) | 0 (0.0%) |
| Firefighting & Prevention | 0 (0.0%) | 0 (0.0%) |
| Law Enforcement | 0 (0.0%) | 0 (0.0%) |
| Food Preparation & Serving | 0 (0.0%) | 3 (100.0%) |
| Cleaning & Maintenance | 2 (100.0%) | 0 (0.0%) |
| Personal Care & Service | 0 (0.0%) | 0 (0.0%) |
| Total (Category) | 2 (40.0%) | 3 (60.0%) |
| Total (Overall) | 140 (62.5%) | 84 (37.5%) |
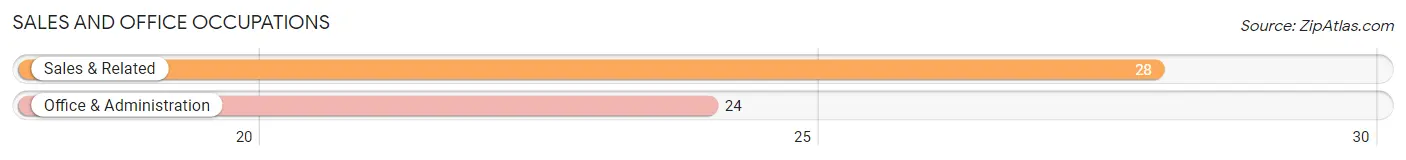
Sales and Office Occupations
The most common Sales and Office occupations in Fargo are Sales & Related (28 | 12.5%), and Office & Administration (24 | 10.7%).
Sales and Office Occupations by Sex

| Occupation | Male | Female |
| Sales & Related | 0 (0.0%) | 28 (100.0%) |
| Office & Administration | 0 (0.0%) | 24 (100.0%) |
| Total (Category) | 0 (0.0%) | 52 (100.0%) |
| Total (Overall) | 140 (62.5%) | 84 (37.5%) |
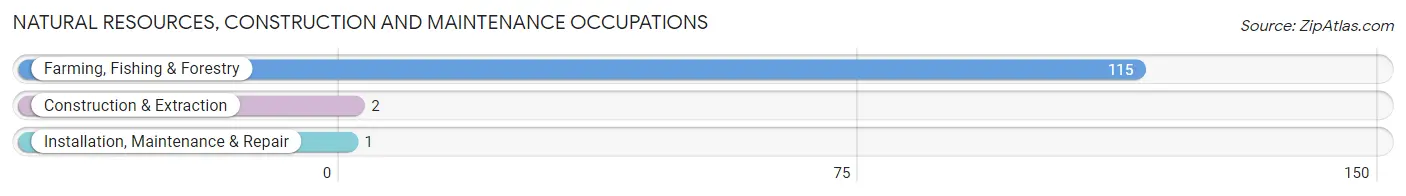
Natural Resources, Construction and Maintenance Occupations
The most common Natural Resources, Construction and Maintenance occupations in Fargo are Farming, Fishing & Forestry (115 | 51.3%), Construction & Extraction (2 | 0.9%), and Installation, Maintenance & Repair (1 | 0.4%).
Natural Resources, Construction and Maintenance Occupations by Sex
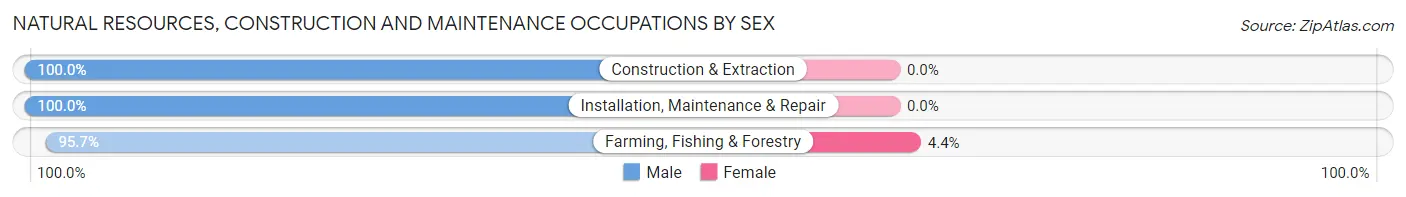
| Occupation | Male | Female |
| Farming, Fishing & Forestry | 110 (95.7%) | 5 (4.3%) |
| Construction & Extraction | 2 (100.0%) | 0 (0.0%) |
| Installation, Maintenance & Repair | 1 (100.0%) | 0 (0.0%) |
| Total (Category) | 113 (95.8%) | 5 (4.2%) |
| Total (Overall) | 140 (62.5%) | 84 (37.5%) |
Production, Transportation and Moving Occupations
The most common Production, Transportation and Moving occupations in Fargo are Production (6 | 2.7%), and Material Moving (6 | 2.7%).
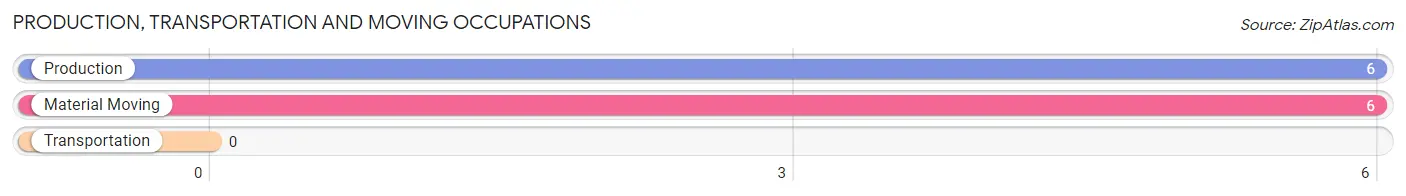
Production, Transportation and Moving Occupations by Sex
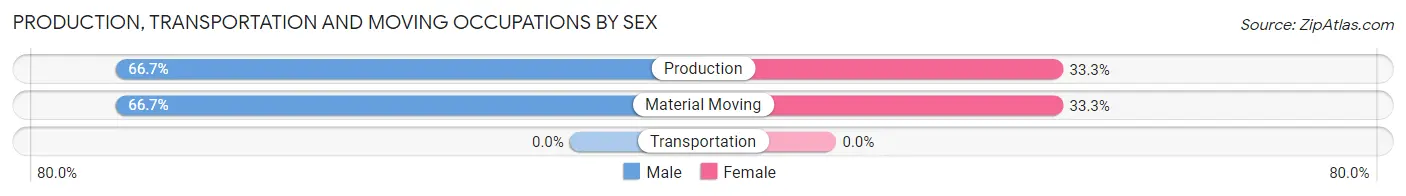
| Occupation | Male | Female |
| Production | 4 (66.7%) | 2 (33.3%) |
| Transportation | 0 (0.0%) | 0 (0.0%) |
| Material Moving | 4 (66.7%) | 2 (33.3%) |
| Total (Category) | 8 (66.7%) | 4 (33.3%) |
| Total (Overall) | 140 (62.5%) | 84 (37.5%) |
Employment Industries by Sex in Fargo
Employment Industries in Fargo
The major employment industries in Fargo include Agriculture, Fishing & Hunting (120 | 53.6%), Finance & Insurance (28 | 12.5%), Educational Services (26 | 11.6%), Manufacturing (23 | 10.3%), and Construction (8 | 3.6%).
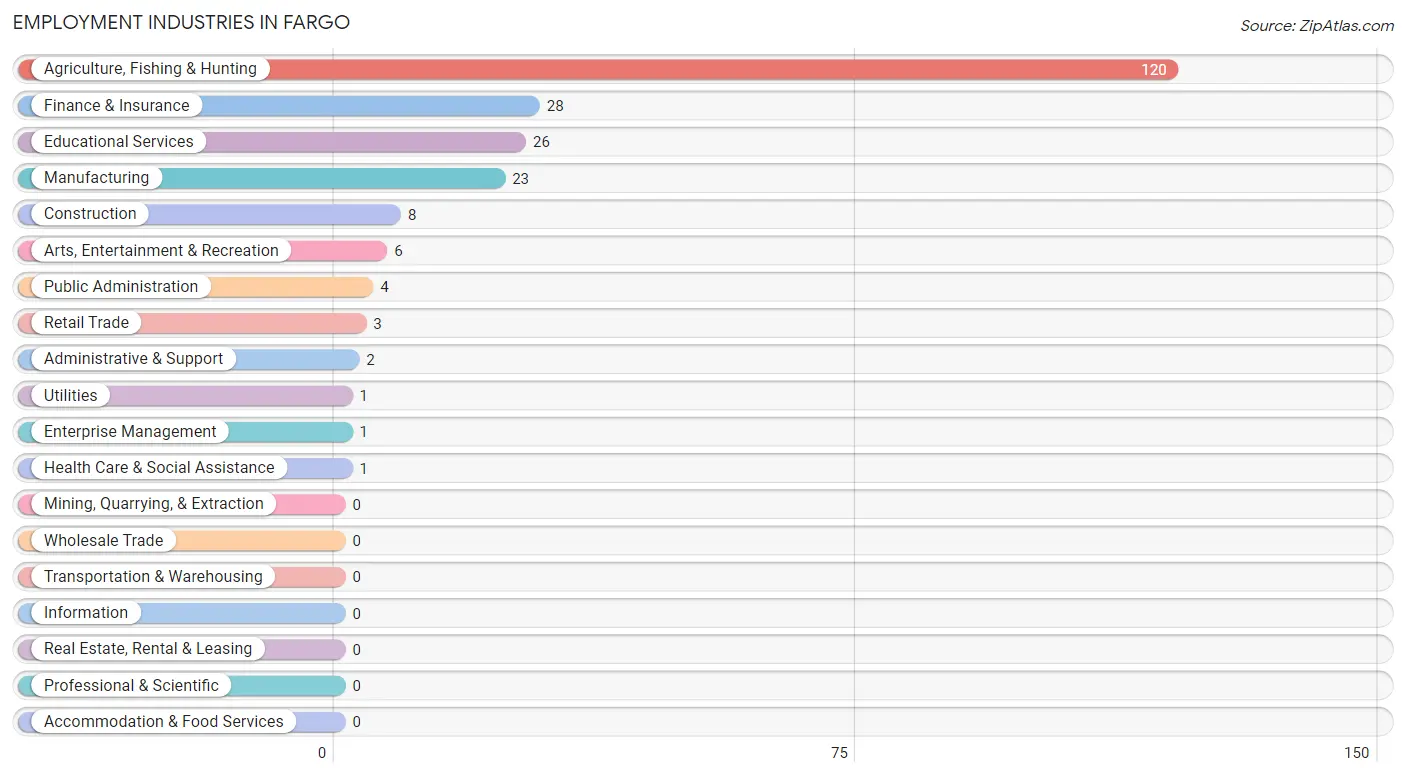
Employment Industries by Sex in Fargo
The Fargo industries that see more men than women are Construction (100.0%), Administrative & Support (100.0%), and Agriculture, Fishing & Hunting (94.2%), whereas the industries that tend to have a higher number of women are Retail Trade (100.0%), Utilities (100.0%), and Finance & Insurance (100.0%).
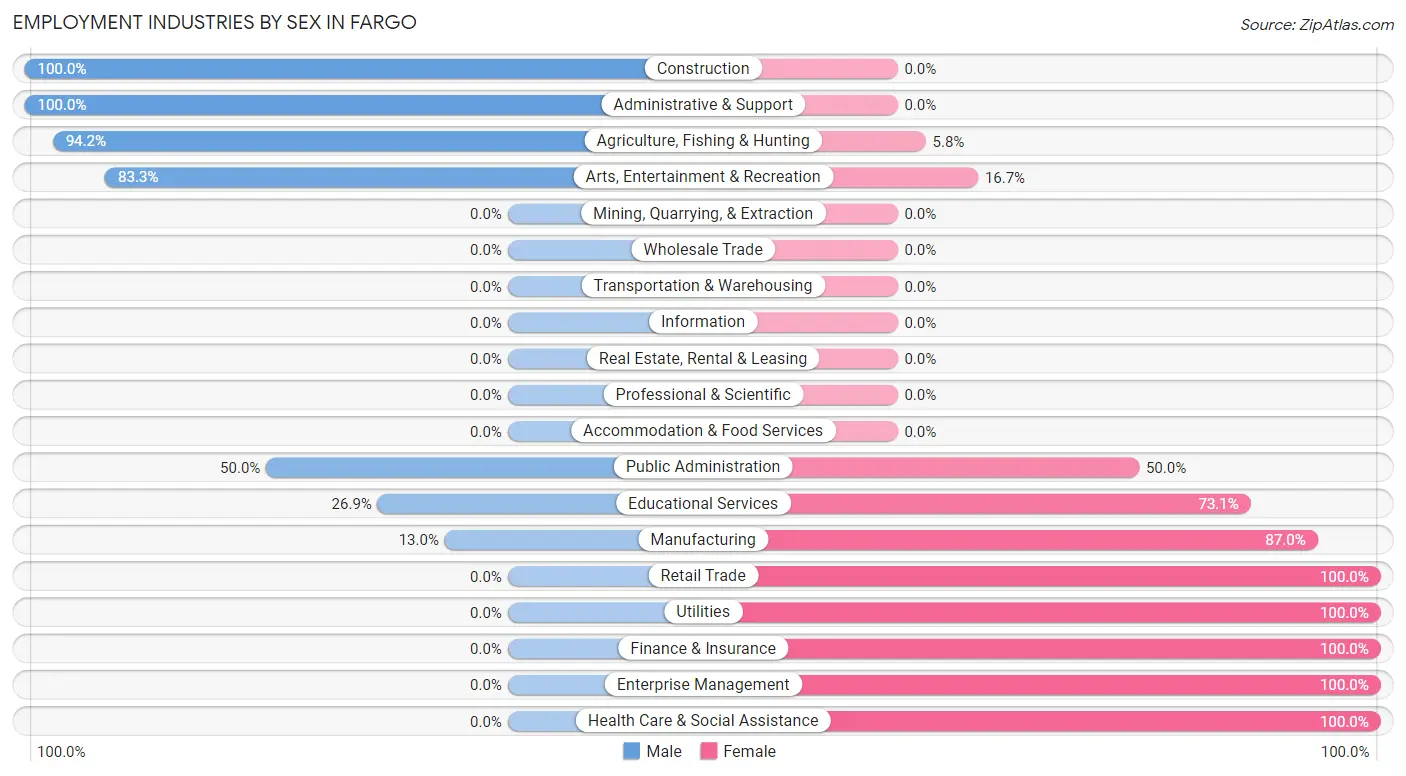
| Industry | Male | Female |
| Agriculture, Fishing & Hunting | 113 (94.2%) | 7 (5.8%) |
| Mining, Quarrying, & Extraction | 0 (0.0%) | 0 (0.0%) |
| Construction | 8 (100.0%) | 0 (0.0%) |
| Manufacturing | 3 (13.0%) | 20 (87.0%) |
| Wholesale Trade | 0 (0.0%) | 0 (0.0%) |
| Retail Trade | 0 (0.0%) | 3 (100.0%) |
| Transportation & Warehousing | 0 (0.0%) | 0 (0.0%) |
| Utilities | 0 (0.0%) | 1 (100.0%) |
| Information | 0 (0.0%) | 0 (0.0%) |
| Finance & Insurance | 0 (0.0%) | 28 (100.0%) |
| Real Estate, Rental & Leasing | 0 (0.0%) | 0 (0.0%) |
| Professional & Scientific | 0 (0.0%) | 0 (0.0%) |
| Enterprise Management | 0 (0.0%) | 1 (100.0%) |
| Administrative & Support | 2 (100.0%) | 0 (0.0%) |
| Educational Services | 7 (26.9%) | 19 (73.1%) |
| Health Care & Social Assistance | 0 (0.0%) | 1 (100.0%) |
| Arts, Entertainment & Recreation | 5 (83.3%) | 1 (16.7%) |
| Accommodation & Food Services | 0 (0.0%) | 0 (0.0%) |
| Public Administration | 2 (50.0%) | 2 (50.0%) |
| Total | 140 (62.5%) | 84 (37.5%) |
Education in Fargo
School Enrollment in Fargo
The most common levels of schooling among the 72 students in Fargo are kindergarten (35 | 48.6%), elementary school (30 | 41.7%), and nursery / preschool (3 | 4.2%).
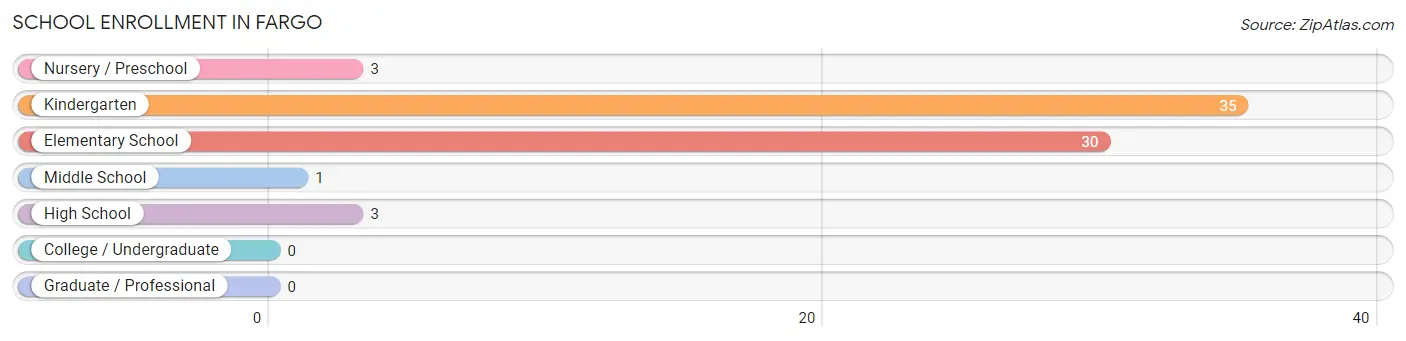
| School Level | # Students | % Students |
| Nursery / Preschool | 3 | 4.2% |
| Kindergarten | 35 | 48.6% |
| Elementary School | 30 | 41.7% |
| Middle School | 1 | 1.4% |
| High School | 3 | 4.2% |
| College / Undergraduate | 0 | 0.0% |
| Graduate / Professional | 0 | 0.0% |
| Total | 72 | 100.0% |
School Enrollment by Age by Funding Source in Fargo
Out of a total of 72 students who are enrolled in schools in Fargo, 4 (5.6%) attend a private institution, while the remaining 68 (94.4%) are enrolled in public schools. The age group of 10 to 14 year olds has the highest likelihood of being enrolled in private schools, with 1 (100.0% in the age bracket) enrolled. Conversely, the age group of 3 to 4 year olds has the lowest likelihood of being enrolled in a private school, with 3 (100.0% in the age bracket) attending a public institution.
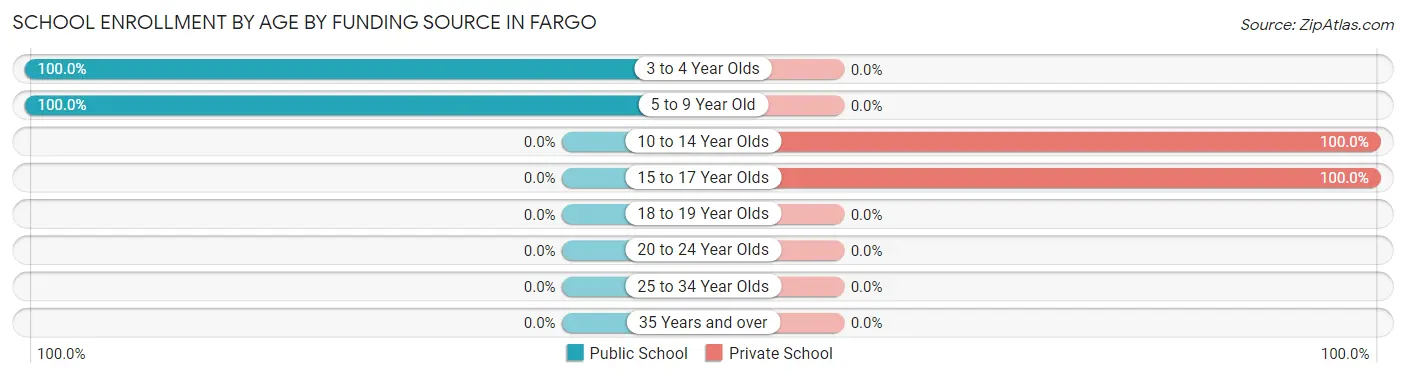
| Age Bracket | Public School | Private School |
| 3 to 4 Year Olds | 3 (100.0%) | 0 (0.0%) |
| 5 to 9 Year Old | 65 (100.0%) | 0 (0.0%) |
| 10 to 14 Year Olds | 0 (0.0%) | 1 (100.0%) |
| 15 to 17 Year Olds | 0 (0.0%) | 3 (100.0%) |
| 18 to 19 Year Olds | 0 (0.0%) | 0 (0.0%) |
| 20 to 24 Year Olds | 0 (0.0%) | 0 (0.0%) |
| 25 to 34 Year Olds | 0 (0.0%) | 0 (0.0%) |
| 35 Years and over | 0 (0.0%) | 0 (0.0%) |
| Total | 68 (94.4%) | 4 (5.6%) |
Educational Attainment by Field of Study in Fargo
Education (17 | 85.0%), social sciences (2 | 10.0%), and business (1 | 5.0%) are the most common fields of study among 20 individuals in Fargo who have obtained a bachelor's degree or higher.
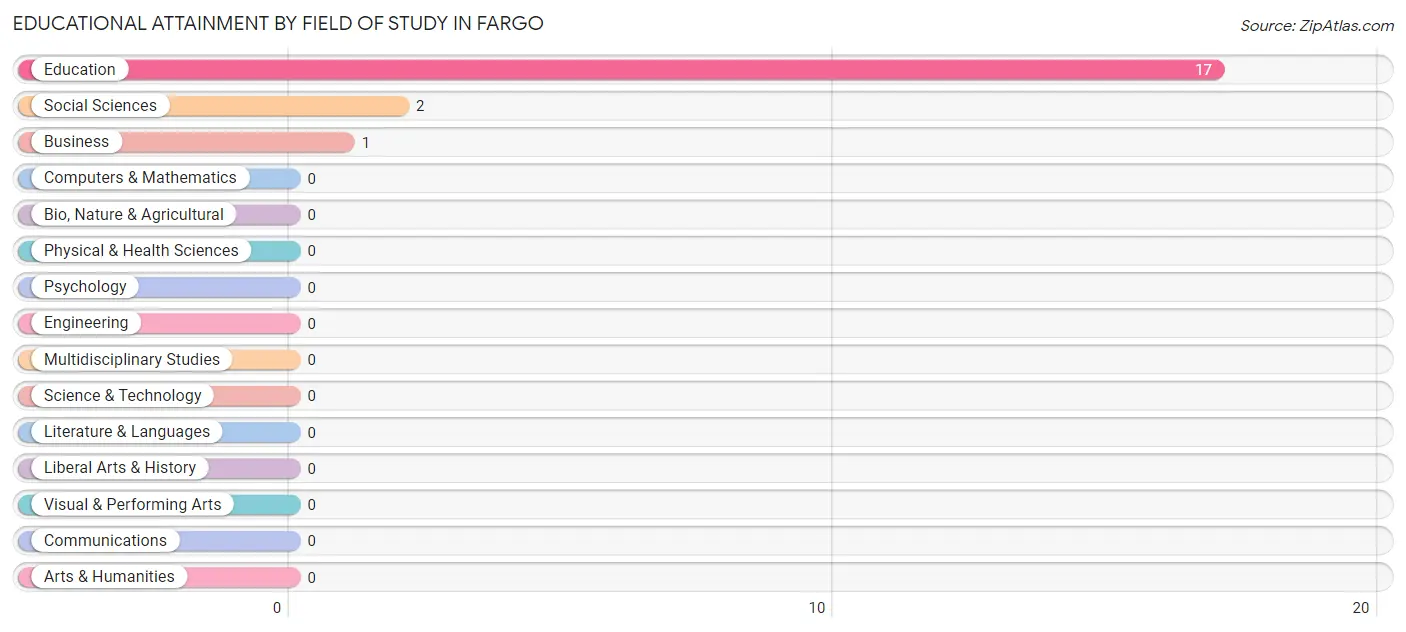
| Field of Study | # Graduates | % Graduates |
| Computers & Mathematics | 0 | 0.0% |
| Bio, Nature & Agricultural | 0 | 0.0% |
| Physical & Health Sciences | 0 | 0.0% |
| Psychology | 0 | 0.0% |
| Social Sciences | 2 | 10.0% |
| Engineering | 0 | 0.0% |
| Multidisciplinary Studies | 0 | 0.0% |
| Science & Technology | 0 | 0.0% |
| Business | 1 | 5.0% |
| Education | 17 | 85.0% |
| Literature & Languages | 0 | 0.0% |
| Liberal Arts & History | 0 | 0.0% |
| Visual & Performing Arts | 0 | 0.0% |
| Communications | 0 | 0.0% |
| Arts & Humanities | 0 | 0.0% |
| Total | 20 | 100.0% |
Transportation & Commute in Fargo
Vehicle Availability by Sex in Fargo
The most prevalent vehicle ownership categories in Fargo are males with 3 vehicles (108, accounting for 77.1%) and females with 3 vehicles (12, making up 128.6%).
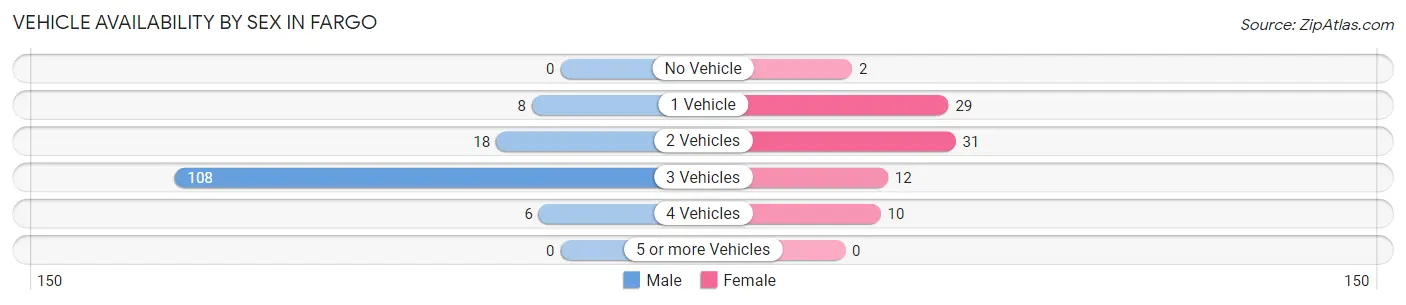
| Vehicles Available | Male | Female |
| No Vehicle | 0 (0.0%) | 2 (2.4%) |
| 1 Vehicle | 8 (5.7%) | 29 (34.5%) |
| 2 Vehicles | 18 (12.9%) | 31 (36.9%) |
| 3 Vehicles | 108 (77.1%) | 12 (14.3%) |
| 4 Vehicles | 6 (4.3%) | 10 (11.9%) |
| 5 or more Vehicles | 0 (0.0%) | 0 (0.0%) |
| Total | 140 (100.0%) | 84 (100.0%) |
Commute Time in Fargo
The most frequently occuring commute durations in Fargo are 30 to 34 minutes (151 commuters, 67.4%), 60 to 89 minutes (30 commuters, 13.4%), and 10 to 14 minutes (19 commuters, 8.5%).
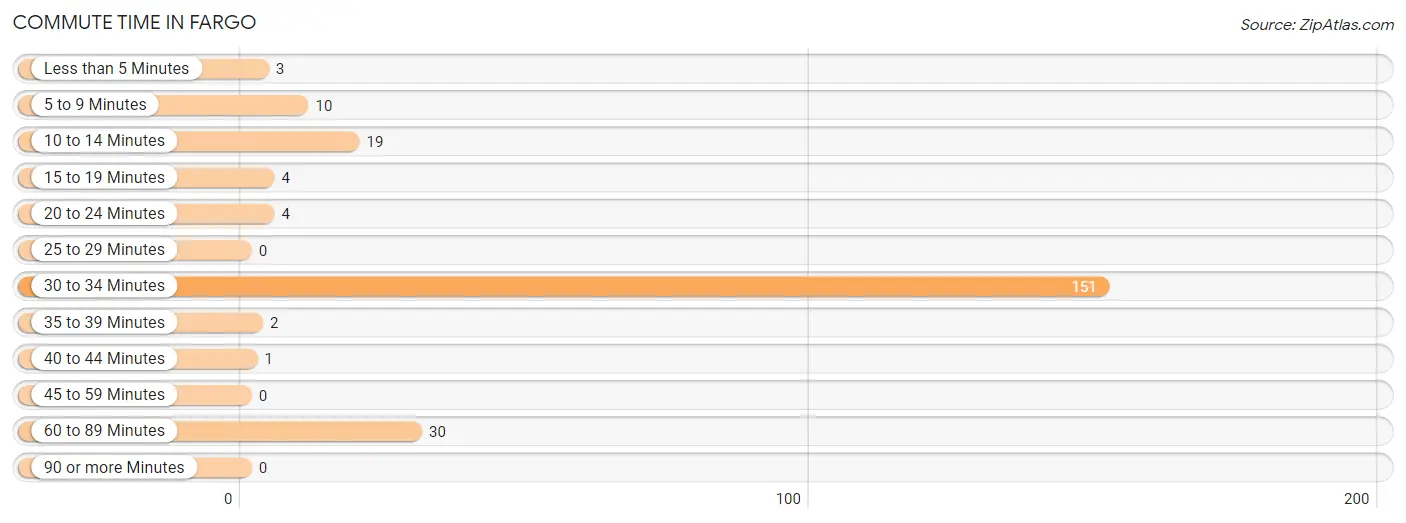
| Commute Time | # Commuters | % Commuters |
| Less than 5 Minutes | 3 | 1.3% |
| 5 to 9 Minutes | 10 | 4.5% |
| 10 to 14 Minutes | 19 | 8.5% |
| 15 to 19 Minutes | 4 | 1.8% |
| 20 to 24 Minutes | 4 | 1.8% |
| 25 to 29 Minutes | 0 | 0.0% |
| 30 to 34 Minutes | 151 | 67.4% |
| 35 to 39 Minutes | 2 | 0.9% |
| 40 to 44 Minutes | 1 | 0.4% |
| 45 to 59 Minutes | 0 | 0.0% |
| 60 to 89 Minutes | 30 | 13.4% |
| 90 or more Minutes | 0 | 0.0% |
Commute Time by Sex in Fargo
The most common commute times in Fargo are 30 to 34 minutes (106 commuters, 75.7%) for males and 30 to 34 minutes (45 commuters, 53.6%) for females.
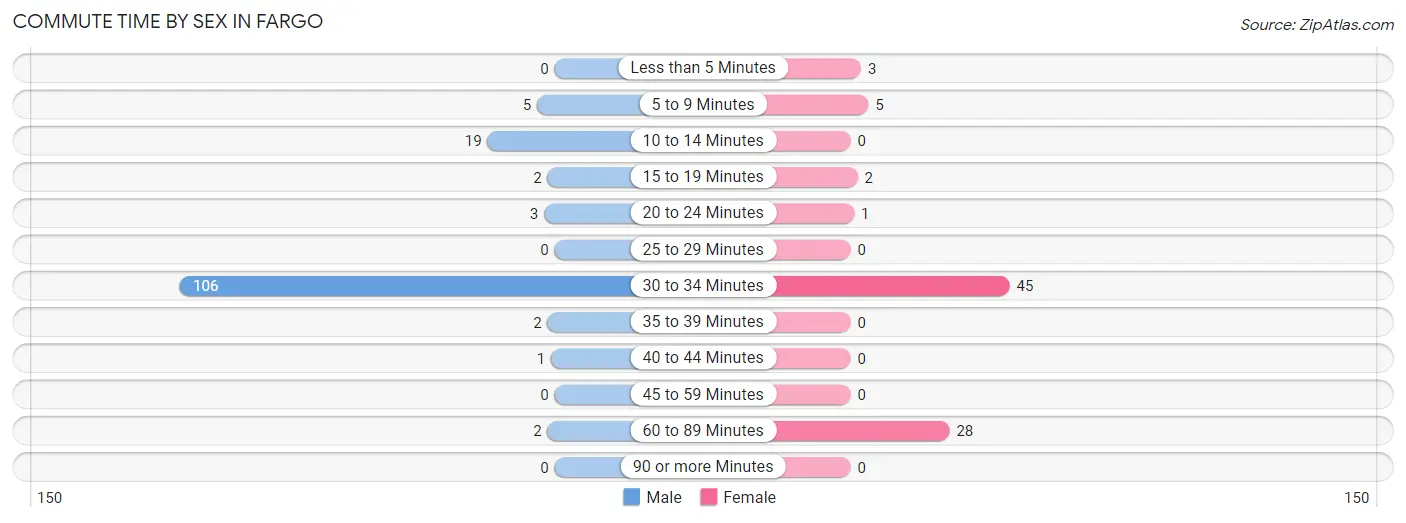
| Commute Time | Male | Female |
| Less than 5 Minutes | 0 (0.0%) | 3 (3.6%) |
| 5 to 9 Minutes | 5 (3.6%) | 5 (5.9%) |
| 10 to 14 Minutes | 19 (13.6%) | 0 (0.0%) |
| 15 to 19 Minutes | 2 (1.4%) | 2 (2.4%) |
| 20 to 24 Minutes | 3 (2.1%) | 1 (1.2%) |
| 25 to 29 Minutes | 0 (0.0%) | 0 (0.0%) |
| 30 to 34 Minutes | 106 (75.7%) | 45 (53.6%) |
| 35 to 39 Minutes | 2 (1.4%) | 0 (0.0%) |
| 40 to 44 Minutes | 1 (0.7%) | 0 (0.0%) |
| 45 to 59 Minutes | 0 (0.0%) | 0 (0.0%) |
| 60 to 89 Minutes | 2 (1.4%) | 28 (33.3%) |
| 90 or more Minutes | 0 (0.0%) | 0 (0.0%) |
Time of Departure to Work by Sex in Fargo
The most frequent times of departure to work in Fargo are 6:00 AM to 6:29 AM (111, 79.3%) for males and 6:30 AM to 6:59 AM (38, 45.2%) for females.
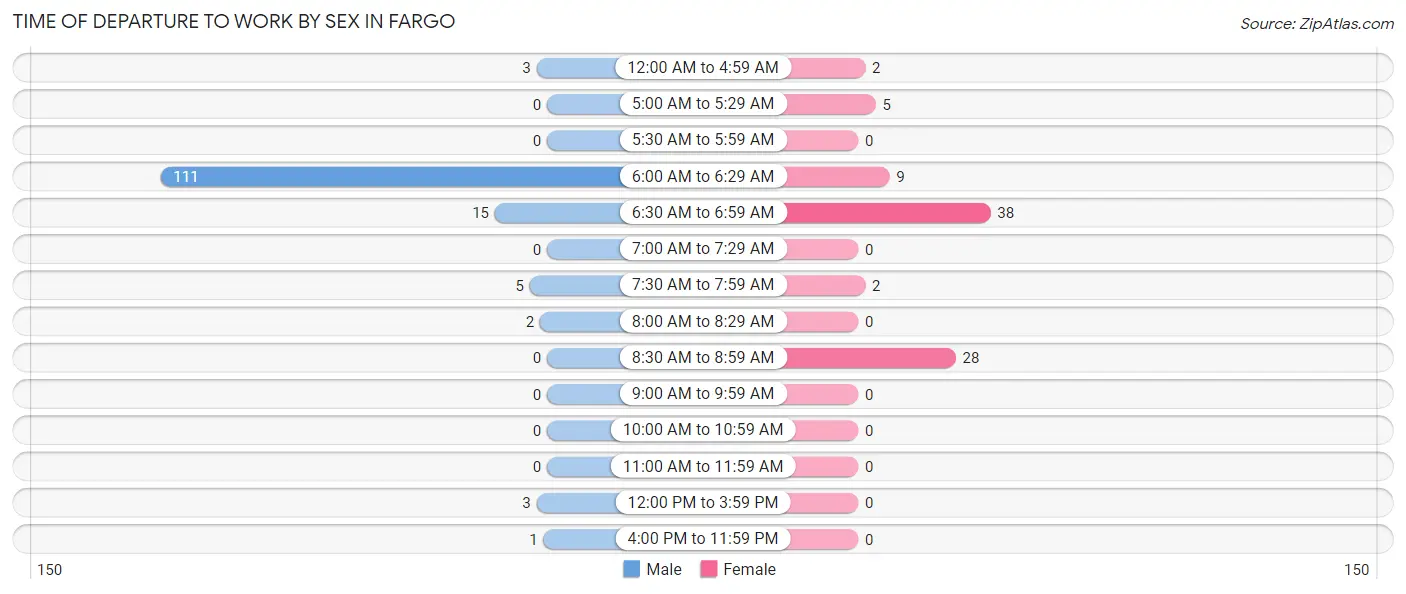
| Time of Departure | Male | Female |
| 12:00 AM to 4:59 AM | 3 (2.1%) | 2 (2.4%) |
| 5:00 AM to 5:29 AM | 0 (0.0%) | 5 (5.9%) |
| 5:30 AM to 5:59 AM | 0 (0.0%) | 0 (0.0%) |
| 6:00 AM to 6:29 AM | 111 (79.3%) | 9 (10.7%) |
| 6:30 AM to 6:59 AM | 15 (10.7%) | 38 (45.2%) |
| 7:00 AM to 7:29 AM | 0 (0.0%) | 0 (0.0%) |
| 7:30 AM to 7:59 AM | 5 (3.6%) | 2 (2.4%) |
| 8:00 AM to 8:29 AM | 2 (1.4%) | 0 (0.0%) |
| 8:30 AM to 8:59 AM | 0 (0.0%) | 28 (33.3%) |
| 9:00 AM to 9:59 AM | 0 (0.0%) | 0 (0.0%) |
| 10:00 AM to 10:59 AM | 0 (0.0%) | 0 (0.0%) |
| 11:00 AM to 11:59 AM | 0 (0.0%) | 0 (0.0%) |
| 12:00 PM to 3:59 PM | 3 (2.1%) | 0 (0.0%) |
| 4:00 PM to 11:59 PM | 1 (0.7%) | 0 (0.0%) |
| Total | 140 (100.0%) | 84 (100.0%) |
Housing Occupancy in Fargo
Occupancy by Ownership in Fargo
Of the total 242 dwellings in Fargo, owner-occupied units account for 198 (81.8%), while renter-occupied units make up 44 (18.2%).
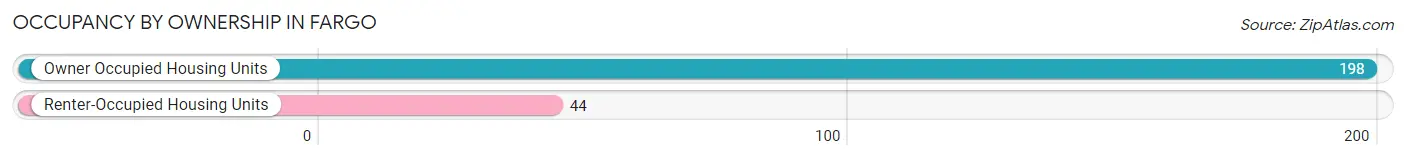
| Occupancy | # Housing Units | % Housing Units |
| Owner Occupied Housing Units | 198 | 81.8% |
| Renter-Occupied Housing Units | 44 | 18.2% |
| Total Occupied Housing Units | 242 | 100.0% |
Occupancy by Household Size in Fargo
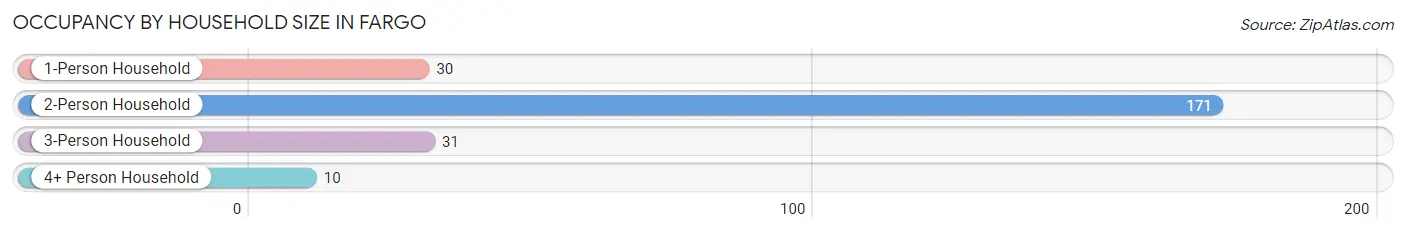
| Household Size | # Housing Units | % Housing Units |
| 1-Person Household | 30 | 12.4% |
| 2-Person Household | 171 | 70.7% |
| 3-Person Household | 31 | 12.8% |
| 4+ Person Household | 10 | 4.1% |
| Total Housing Units | 242 | 100.0% |
Occupancy by Ownership by Household Size in Fargo
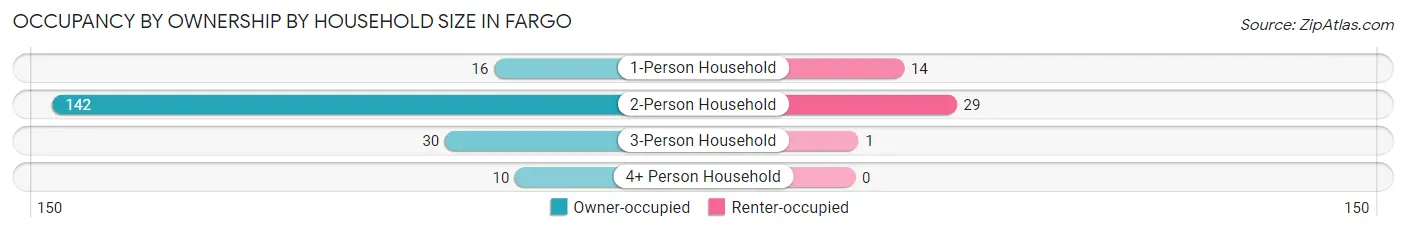
| Household Size | Owner-occupied | Renter-occupied |
| 1-Person Household | 16 (53.3%) | 14 (46.7%) |
| 2-Person Household | 142 (83.0%) | 29 (17.0%) |
| 3-Person Household | 30 (96.8%) | 1 (3.2%) |
| 4+ Person Household | 10 (100.0%) | 0 (0.0%) |
| Total Housing Units | 198 (81.8%) | 44 (18.2%) |
Occupancy by Educational Attainment in Fargo
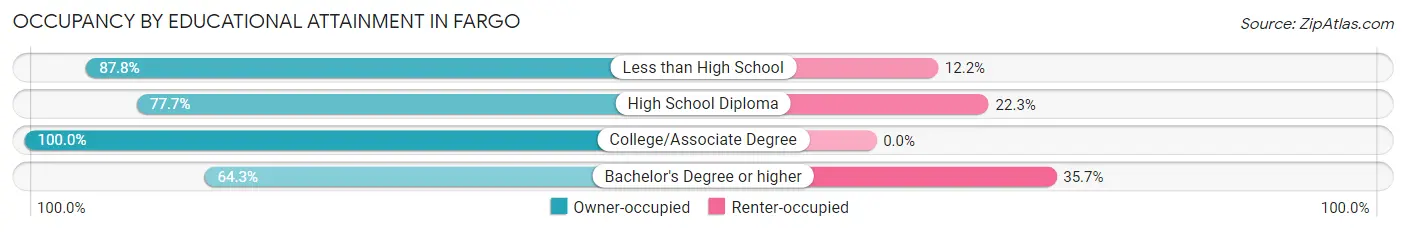
| Household Size | Owner-occupied | Renter-occupied |
| Less than High School | 43 (87.8%) | 6 (12.2%) |
| High School Diploma | 115 (77.7%) | 33 (22.3%) |
| College/Associate Degree | 31 (100.0%) | 0 (0.0%) |
| Bachelor's Degree or higher | 9 (64.3%) | 5 (35.7%) |
Occupancy by Age of Householder in Fargo
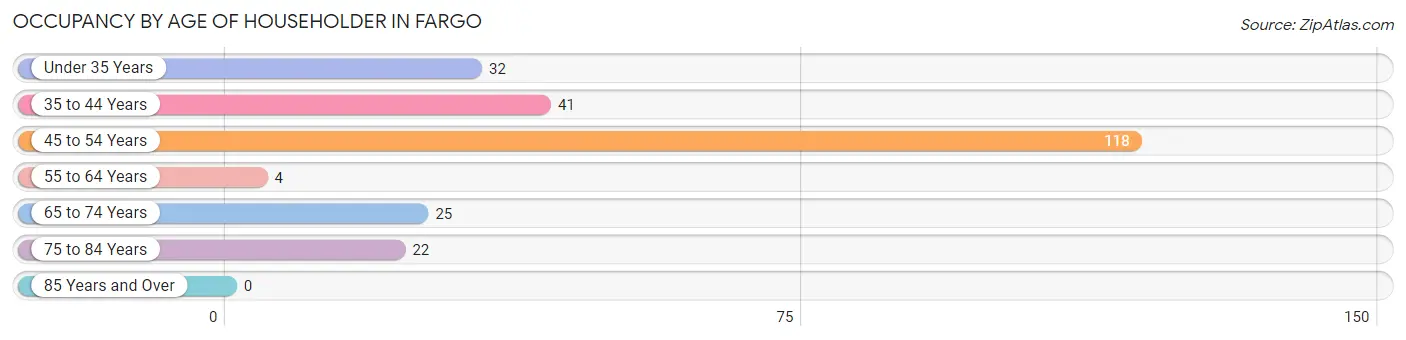
| Age Bracket | # Households | % Households |
| Under 35 Years | 32 | 13.2% |
| 35 to 44 Years | 41 | 16.9% |
| 45 to 54 Years | 118 | 48.8% |
| 55 to 64 Years | 4 | 1.7% |
| 65 to 74 Years | 25 | 10.3% |
| 75 to 84 Years | 22 | 9.1% |
| 85 Years and Over | 0 | 0.0% |
| Total | 242 | 100.0% |
Housing Finances in Fargo
Median Income by Occupancy in Fargo
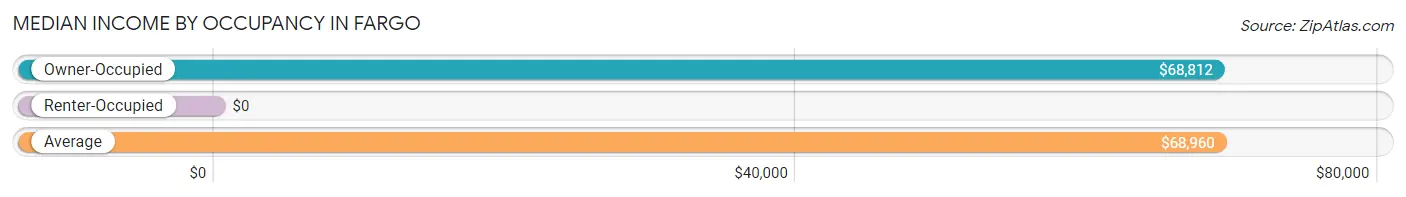
| Occupancy Type | # Households | Median Income |
| Owner-Occupied | 198 (81.8%) | $68,812 |
| Renter-Occupied | 44 (18.2%) | $0 |
| Average | 242 (100.0%) | $68,960 |
Occupancy by Householder Income Bracket in Fargo
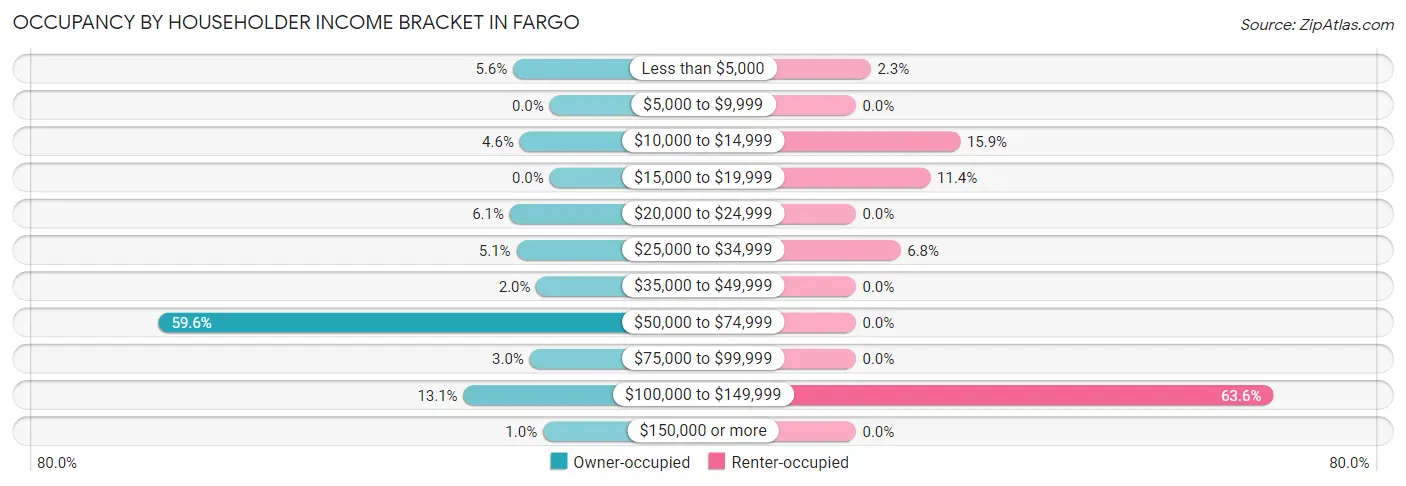
| Income Bracket | Owner-occupied | Renter-occupied |
| Less than $5,000 | 11 (5.6%) | 1 (2.3%) |
| $5,000 to $9,999 | 0 (0.0%) | 0 (0.0%) |
| $10,000 to $14,999 | 9 (4.5%) | 7 (15.9%) |
| $15,000 to $19,999 | 0 (0.0%) | 5 (11.4%) |
| $20,000 to $24,999 | 12 (6.1%) | 0 (0.0%) |
| $25,000 to $34,999 | 10 (5.1%) | 3 (6.8%) |
| $35,000 to $49,999 | 4 (2.0%) | 0 (0.0%) |
| $50,000 to $74,999 | 118 (59.6%) | 0 (0.0%) |
| $75,000 to $99,999 | 6 (3.0%) | 0 (0.0%) |
| $100,000 to $149,999 | 26 (13.1%) | 28 (63.6%) |
| $150,000 or more | 2 (1.0%) | 0 (0.0%) |
| Total | 198 (100.0%) | 44 (100.0%) |
Monthly Housing Cost Tiers in Fargo
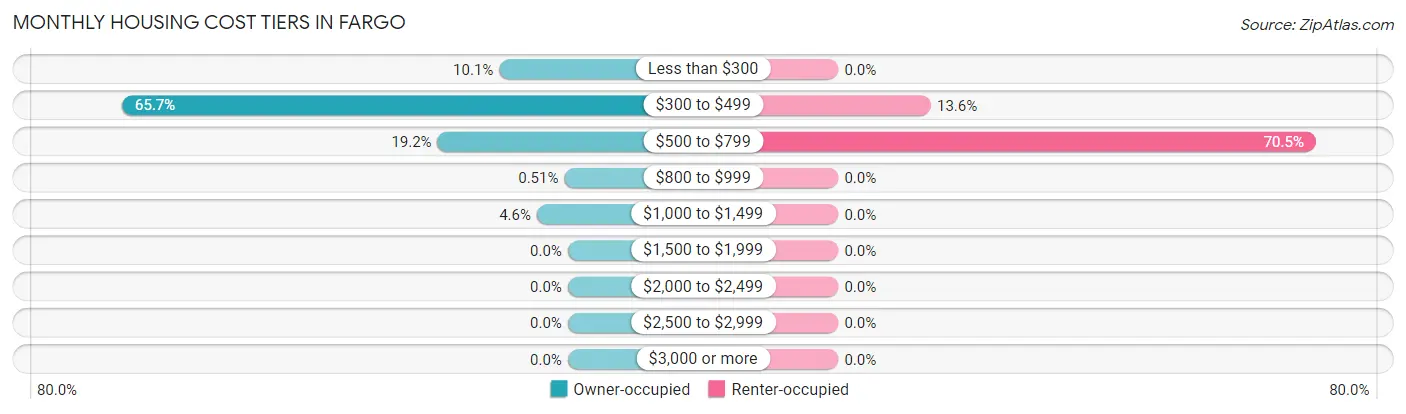
| Monthly Cost | Owner-occupied | Renter-occupied |
| Less than $300 | 20 (10.1%) | 0 (0.0%) |
| $300 to $499 | 130 (65.7%) | 6 (13.6%) |
| $500 to $799 | 38 (19.2%) | 31 (70.5%) |
| $800 to $999 | 1 (0.5%) | 0 (0.0%) |
| $1,000 to $1,499 | 9 (4.5%) | 0 (0.0%) |
| $1,500 to $1,999 | 0 (0.0%) | 0 (0.0%) |
| $2,000 to $2,499 | 0 (0.0%) | 0 (0.0%) |
| $2,500 to $2,999 | 0 (0.0%) | 0 (0.0%) |
| $3,000 or more | 0 (0.0%) | 0 (0.0%) |
| Total | 198 (100.0%) | 44 (100.0%) |
Physical Housing Characteristics in Fargo
Housing Structures in Fargo
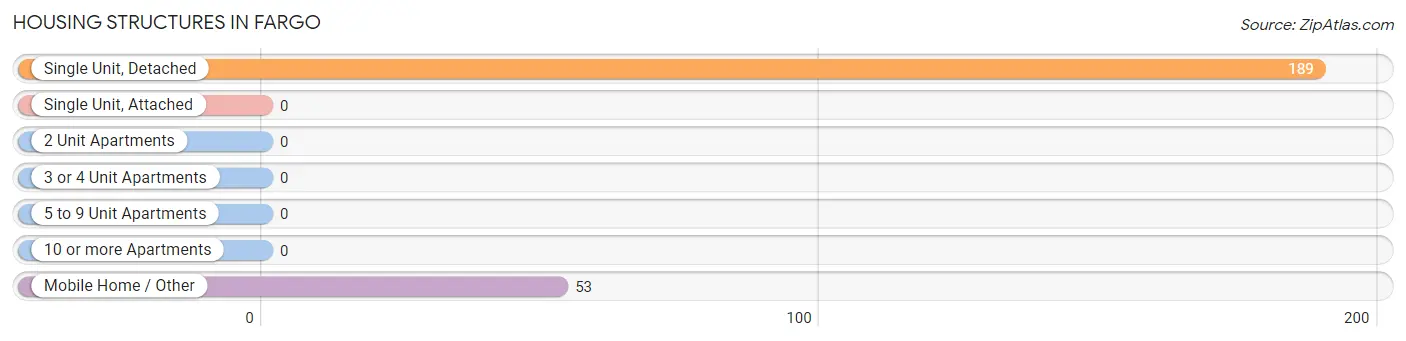
| Structure Type | # Housing Units | % Housing Units |
| Single Unit, Detached | 189 | 78.1% |
| Single Unit, Attached | 0 | 0.0% |
| 2 Unit Apartments | 0 | 0.0% |
| 3 or 4 Unit Apartments | 0 | 0.0% |
| 5 to 9 Unit Apartments | 0 | 0.0% |
| 10 or more Apartments | 0 | 0.0% |
| Mobile Home / Other | 53 | 21.9% |
| Total | 242 | 100.0% |
Housing Structures by Occupancy in Fargo
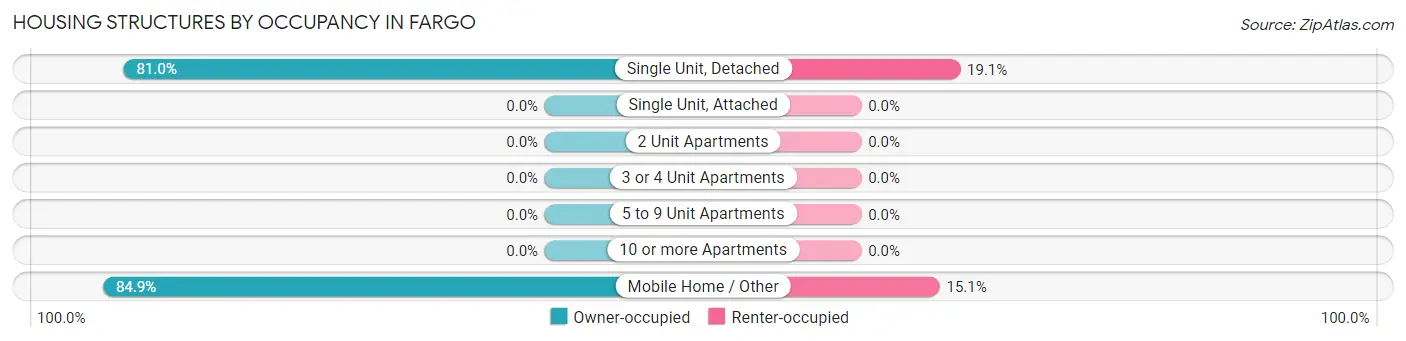
| Structure Type | Owner-occupied | Renter-occupied |
| Single Unit, Detached | 153 (80.9%) | 36 (19.1%) |
| Single Unit, Attached | 0 (0.0%) | 0 (0.0%) |
| 2 Unit Apartments | 0 (0.0%) | 0 (0.0%) |
| 3 or 4 Unit Apartments | 0 (0.0%) | 0 (0.0%) |
| 5 to 9 Unit Apartments | 0 (0.0%) | 0 (0.0%) |
| 10 or more Apartments | 0 (0.0%) | 0 (0.0%) |
| Mobile Home / Other | 45 (84.9%) | 8 (15.1%) |
| Total | 198 (81.8%) | 44 (18.2%) |
Housing Structures by Number of Rooms in Fargo
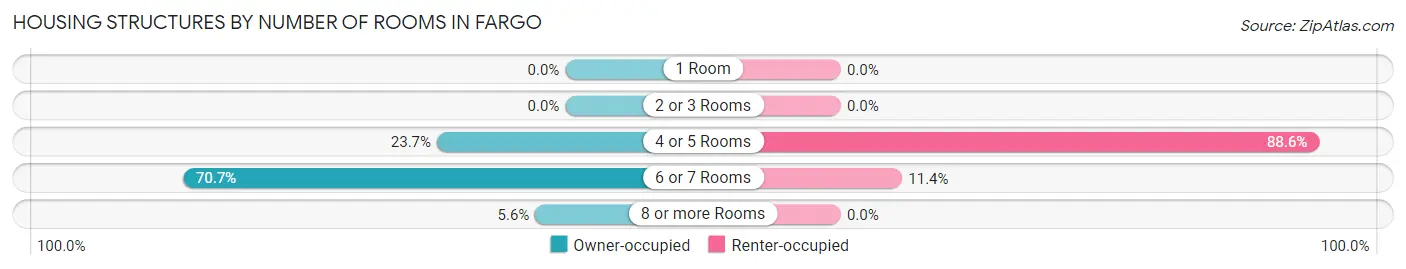
| Number of Rooms | Owner-occupied | Renter-occupied |
| 1 Room | 0 (0.0%) | 0 (0.0%) |
| 2 or 3 Rooms | 0 (0.0%) | 0 (0.0%) |
| 4 or 5 Rooms | 47 (23.7%) | 39 (88.6%) |
| 6 or 7 Rooms | 140 (70.7%) | 5 (11.4%) |
| 8 or more Rooms | 11 (5.6%) | 0 (0.0%) |
| Total | 198 (100.0%) | 44 (100.0%) |
Housing Structure by Heating Type in Fargo
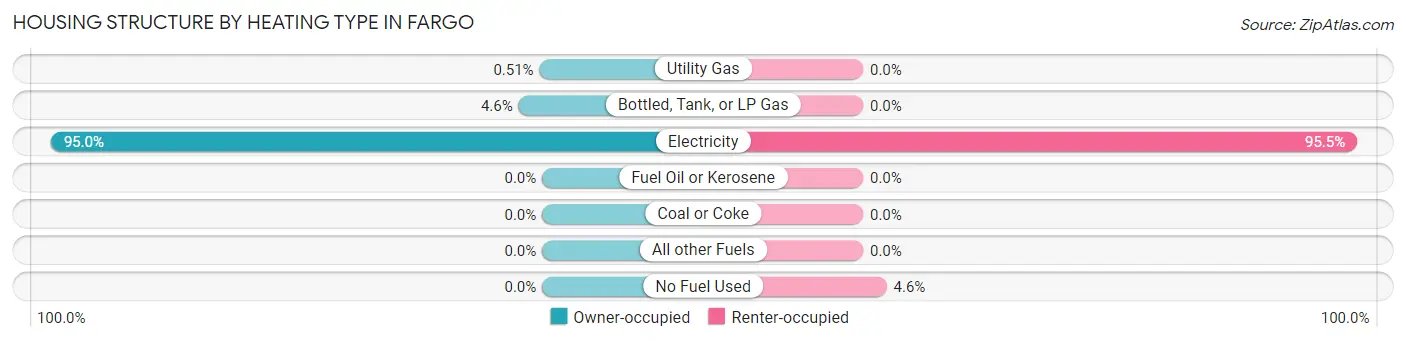
| Heating Type | Owner-occupied | Renter-occupied |
| Utility Gas | 1 (0.5%) | 0 (0.0%) |
| Bottled, Tank, or LP Gas | 9 (4.5%) | 0 (0.0%) |
| Electricity | 188 (95.0%) | 42 (95.5%) |
| Fuel Oil or Kerosene | 0 (0.0%) | 0 (0.0%) |
| Coal or Coke | 0 (0.0%) | 0 (0.0%) |
| All other Fuels | 0 (0.0%) | 0 (0.0%) |
| No Fuel Used | 0 (0.0%) | 2 (4.5%) |
| Total | 198 (100.0%) | 44 (100.0%) |
Household Vehicle Usage in Fargo
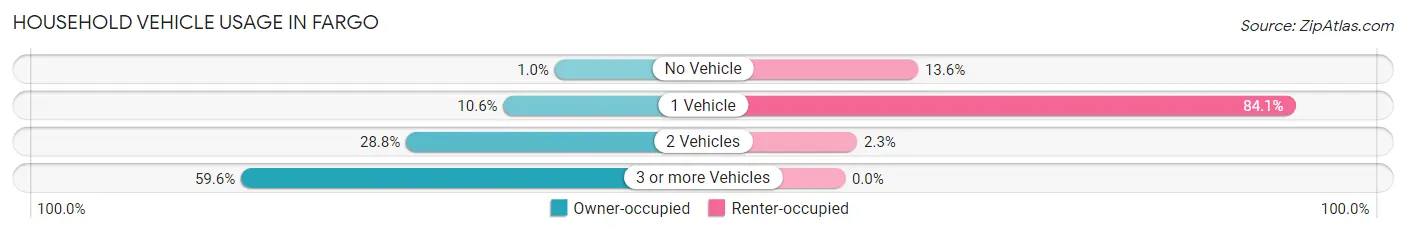
| Vehicles per Household | Owner-occupied | Renter-occupied |
| No Vehicle | 2 (1.0%) | 6 (13.6%) |
| 1 Vehicle | 21 (10.6%) | 37 (84.1%) |
| 2 Vehicles | 57 (28.8%) | 1 (2.3%) |
| 3 or more Vehicles | 118 (59.6%) | 0 (0.0%) |
| Total | 198 (100.0%) | 44 (100.0%) |
Real Estate & Mortgages in Fargo
Real Estate and Mortgage Overview in Fargo
| Characteristic | Without Mortgage | With Mortgage |
| Housing Units | 170 | 28 |
| Median Property Value | $73,800 | $0 |
| Median Household Income | $68,490 | $2 |
| Monthly Housing Costs | $332 | $0 |
| Real Estate Taxes | $1,177 | $2 |
Property Value by Mortgage Status in Fargo
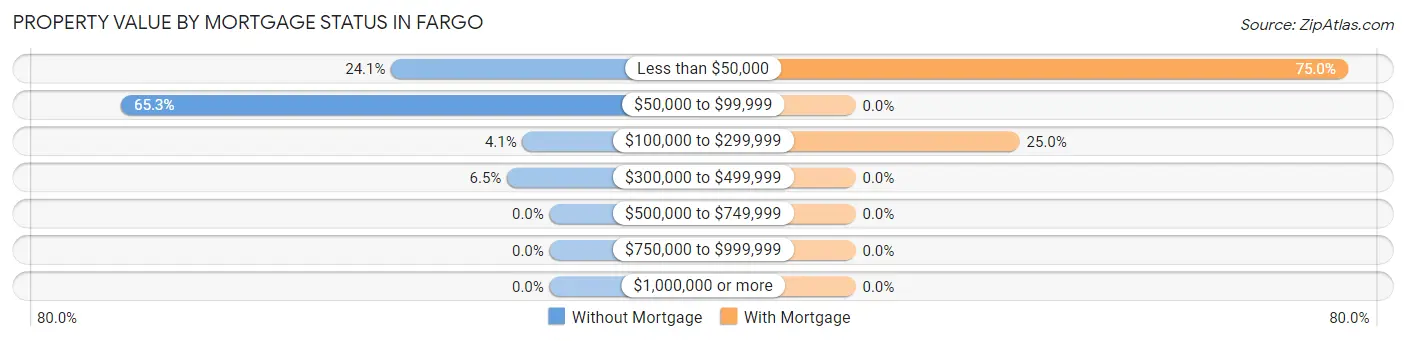
| Property Value | Without Mortgage | With Mortgage |
| Less than $50,000 | 41 (24.1%) | 21 (75.0%) |
| $50,000 to $99,999 | 111 (65.3%) | 0 (0.0%) |
| $100,000 to $299,999 | 7 (4.1%) | 7 (25.0%) |
| $300,000 to $499,999 | 11 (6.5%) | 0 (0.0%) |
| $500,000 to $749,999 | 0 (0.0%) | 0 (0.0%) |
| $750,000 to $999,999 | 0 (0.0%) | 0 (0.0%) |
| $1,000,000 or more | 0 (0.0%) | 0 (0.0%) |
| Total | 170 (100.0%) | 28 (100.0%) |
Household Income by Mortgage Status in Fargo
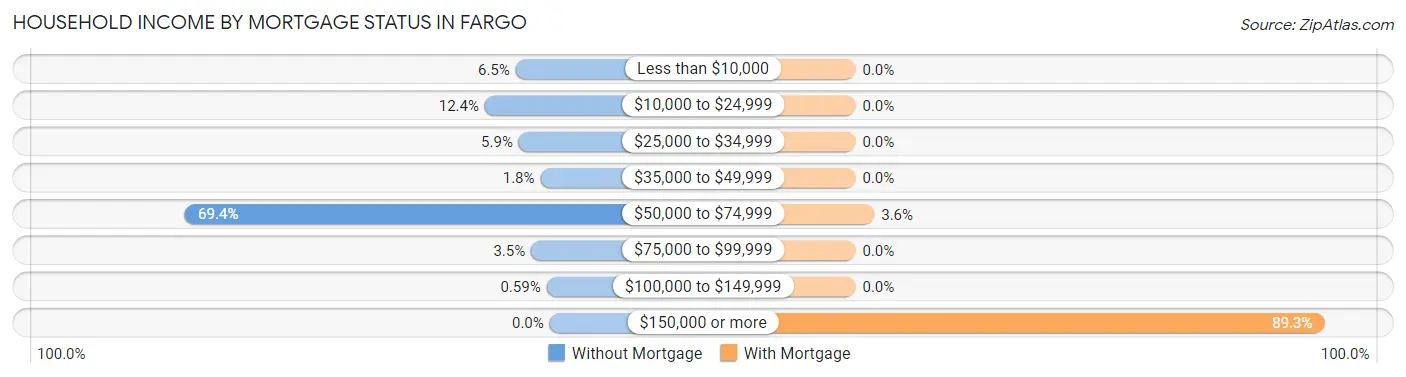
| Household Income | Without Mortgage | With Mortgage |
| Less than $10,000 | 11 (6.5%) | 0 (0.0%) |
| $10,000 to $24,999 | 21 (12.3%) | 0 (0.0%) |
| $25,000 to $34,999 | 10 (5.9%) | 0 (0.0%) |
| $35,000 to $49,999 | 3 (1.8%) | 0 (0.0%) |
| $50,000 to $74,999 | 118 (69.4%) | 1 (3.6%) |
| $75,000 to $99,999 | 6 (3.5%) | 0 (0.0%) |
| $100,000 to $149,999 | 1 (0.6%) | 0 (0.0%) |
| $150,000 or more | 0 (0.0%) | 25 (89.3%) |
| Total | 170 (100.0%) | 28 (100.0%) |
Property Value to Household Income Ratio in Fargo
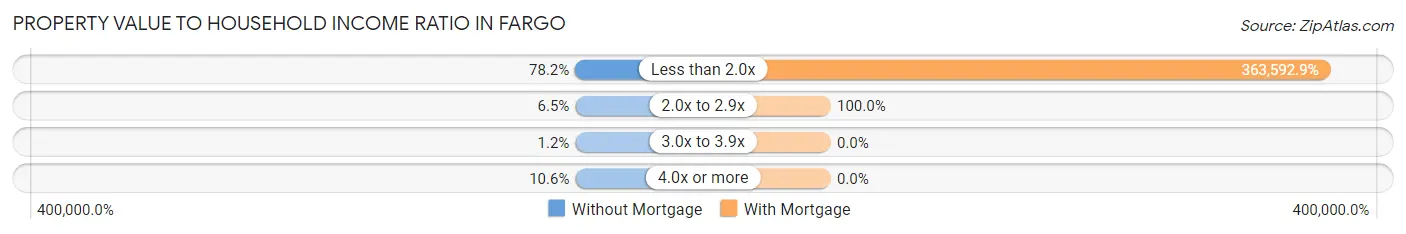
| Value-to-Income Ratio | Without Mortgage | With Mortgage |
| Less than 2.0x | 133 (78.2%) | 101,806 (363,592.9%) |
| 2.0x to 2.9x | 11 (6.5%) | 28 (100.0%) |
| 3.0x to 3.9x | 2 (1.2%) | 0 (0.0%) |
| 4.0x or more | 18 (10.6%) | 0 (0.0%) |
| Total | 170 (100.0%) | 28 (100.0%) |
Real Estate Taxes by Mortgage Status in Fargo
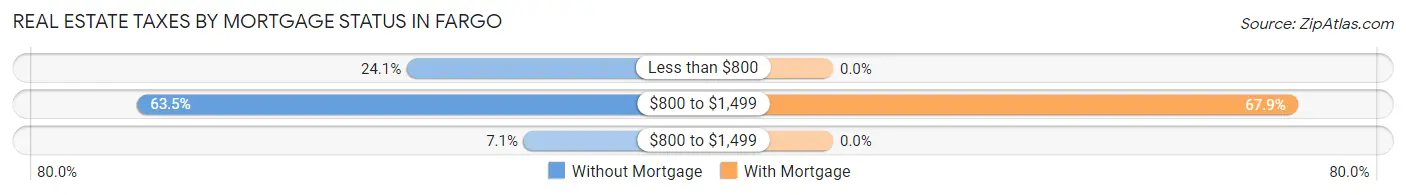
| Property Taxes | Without Mortgage | With Mortgage |
| Less than $800 | 41 (24.1%) | 0 (0.0%) |
| $800 to $1,499 | 108 (63.5%) | 19 (67.9%) |
| $800 to $1,499 | 12 (7.1%) | 0 (0.0%) |
| Total | 170 (100.0%) | 28 (100.0%) |
Health & Disability in Fargo
Health Insurance Coverage by Age in Fargo
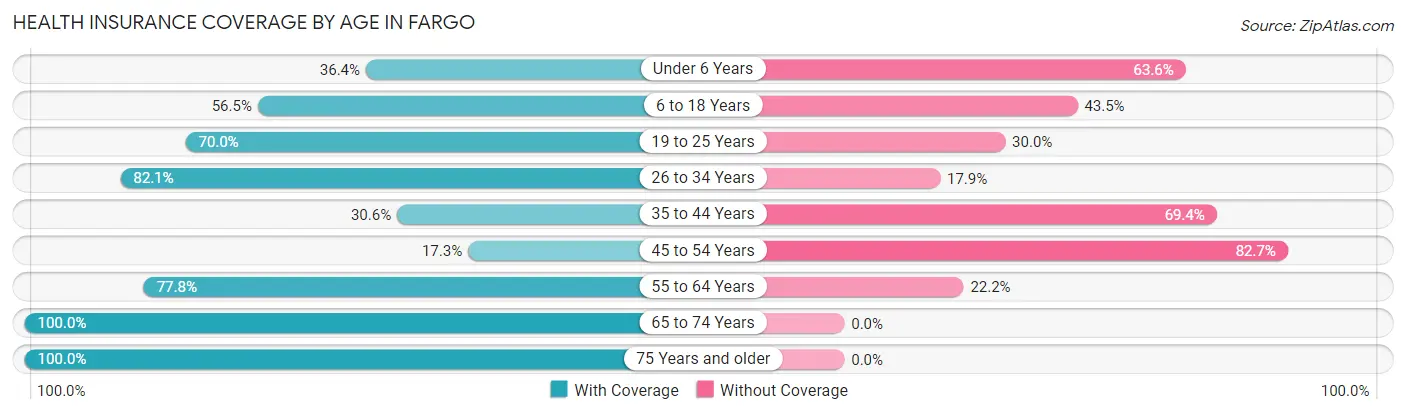
| Age Bracket | With Coverage | Without Coverage |
| Under 6 Years | 4 (36.4%) | 7 (63.6%) |
| 6 to 18 Years | 39 (56.5%) | 30 (43.5%) |
| 19 to 25 Years | 7 (70.0%) | 3 (30.0%) |
| 26 to 34 Years | 23 (82.1%) | 5 (17.9%) |
| 35 to 44 Years | 44 (30.6%) | 100 (69.4%) |
| 45 to 54 Years | 22 (17.3%) | 105 (82.7%) |
| 55 to 64 Years | 7 (77.8%) | 2 (22.2%) |
| 65 to 74 Years | 35 (100.0%) | 0 (0.0%) |
| 75 Years and older | 27 (100.0%) | 0 (0.0%) |
| Total | 208 (45.2%) | 252 (54.8%) |
Health Insurance Coverage by Citizenship Status in Fargo
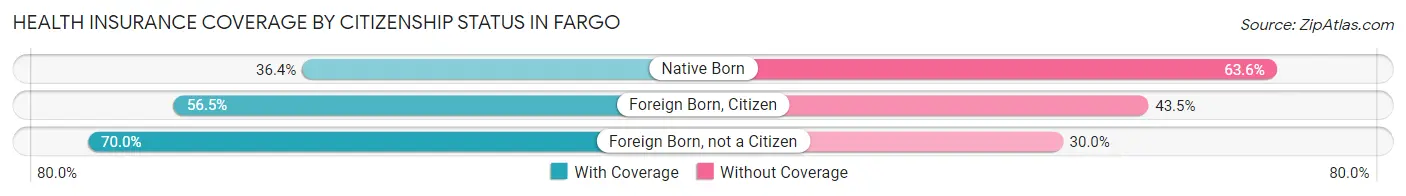
| Citizenship Status | With Coverage | Without Coverage |
| Native Born | 4 (36.4%) | 7 (63.6%) |
| Foreign Born, Citizen | 39 (56.5%) | 30 (43.5%) |
| Foreign Born, not a Citizen | 7 (70.0%) | 3 (30.0%) |
Health Insurance Coverage by Household Income in Fargo
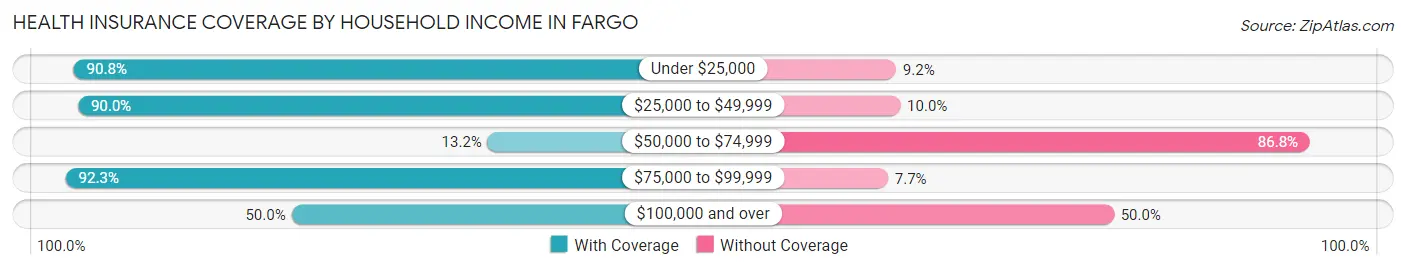
| Household Income | With Coverage | Without Coverage |
| Under $25,000 | 79 (90.8%) | 8 (9.2%) |
| $25,000 to $49,999 | 27 (90.0%) | 3 (10.0%) |
| $50,000 to $74,999 | 27 (13.2%) | 177 (86.8%) |
| $75,000 to $99,999 | 12 (92.3%) | 1 (7.7%) |
| $100,000 and over | 63 (50.0%) | 63 (50.0%) |
Public vs Private Health Insurance Coverage by Age in Fargo
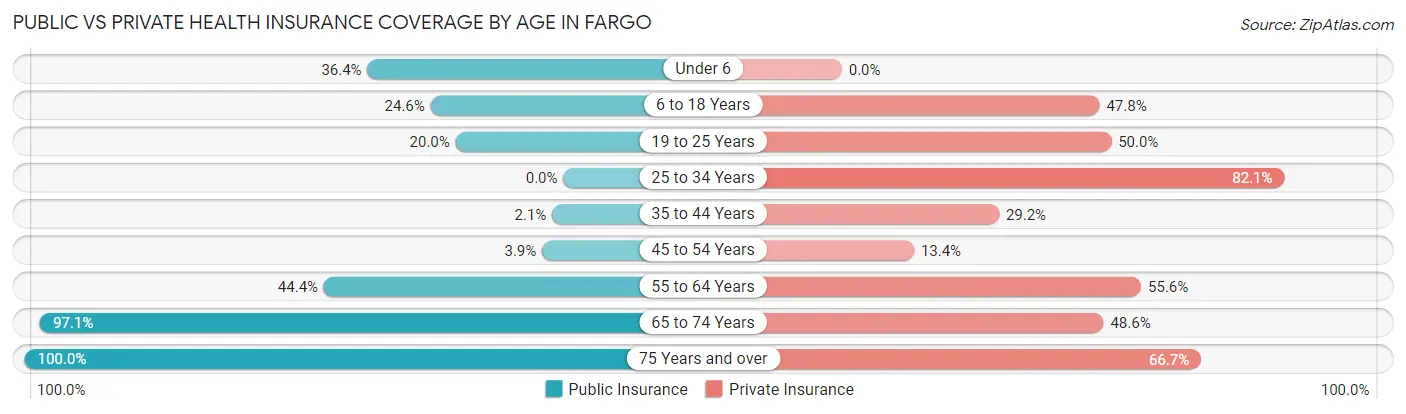
| Age Bracket | Public Insurance | Private Insurance |
| Under 6 | 4 (36.4%) | 0 (0.0%) |
| 6 to 18 Years | 17 (24.6%) | 33 (47.8%) |
| 19 to 25 Years | 2 (20.0%) | 5 (50.0%) |
| 25 to 34 Years | 0 (0.0%) | 23 (82.1%) |
| 35 to 44 Years | 3 (2.1%) | 42 (29.2%) |
| 45 to 54 Years | 5 (3.9%) | 17 (13.4%) |
| 55 to 64 Years | 4 (44.4%) | 5 (55.6%) |
| 65 to 74 Years | 34 (97.1%) | 17 (48.6%) |
| 75 Years and over | 27 (100.0%) | 18 (66.7%) |
| Total | 96 (20.9%) | 160 (34.8%) |
Disability Status by Sex by Age in Fargo
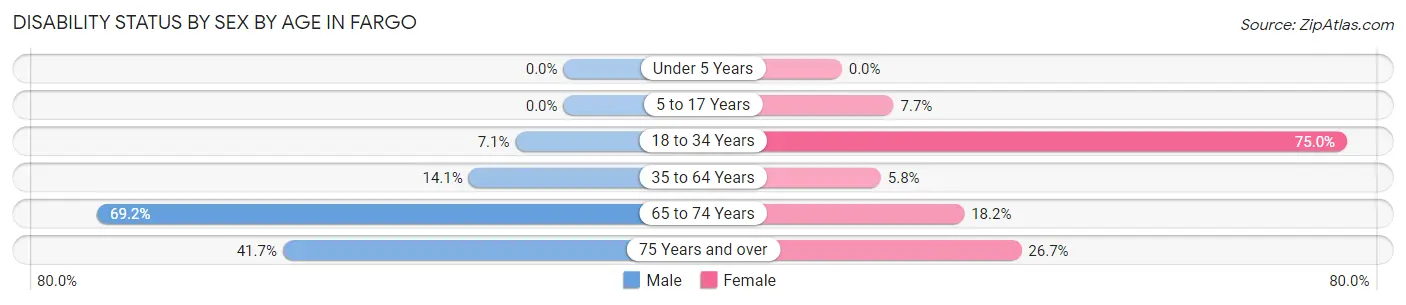
| Age Bracket | Male | Female |
| Under 5 Years | 0 (0.0%) | 0 (0.0%) |
| 5 to 17 Years | 0 (0.0%) | 1 (7.7%) |
| 18 to 34 Years | 1 (7.1%) | 18 (75.0%) |
| 35 to 64 Years | 20 (14.1%) | 8 (5.8%) |
| 65 to 74 Years | 9 (69.2%) | 4 (18.2%) |
| 75 Years and over | 5 (41.7%) | 4 (26.7%) |
Disability Class by Sex by Age in Fargo
Disability Class: Hearing Difficulty
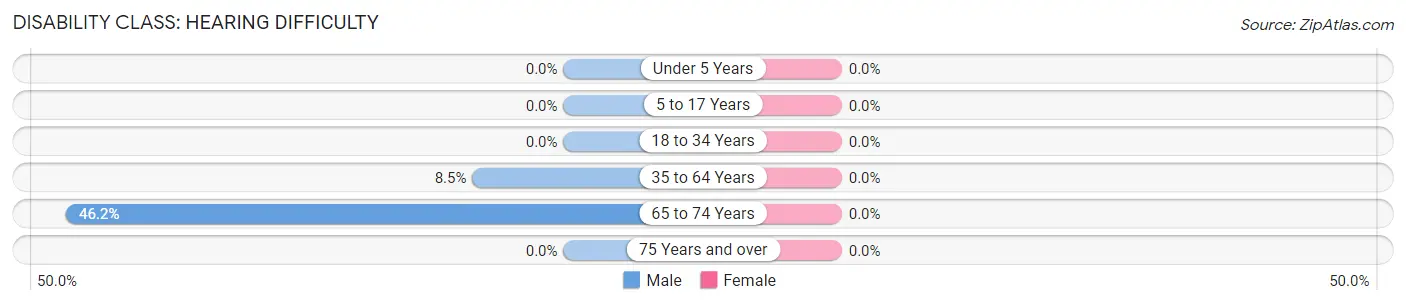
| Age Bracket | Male | Female |
| Under 5 Years | 0 (0.0%) | 0 (0.0%) |
| 5 to 17 Years | 0 (0.0%) | 0 (0.0%) |
| 18 to 34 Years | 0 (0.0%) | 0 (0.0%) |
| 35 to 64 Years | 12 (8.5%) | 0 (0.0%) |
| 65 to 74 Years | 6 (46.2%) | 0 (0.0%) |
| 75 Years and over | 0 (0.0%) | 0 (0.0%) |
Disability Class: Vision Difficulty
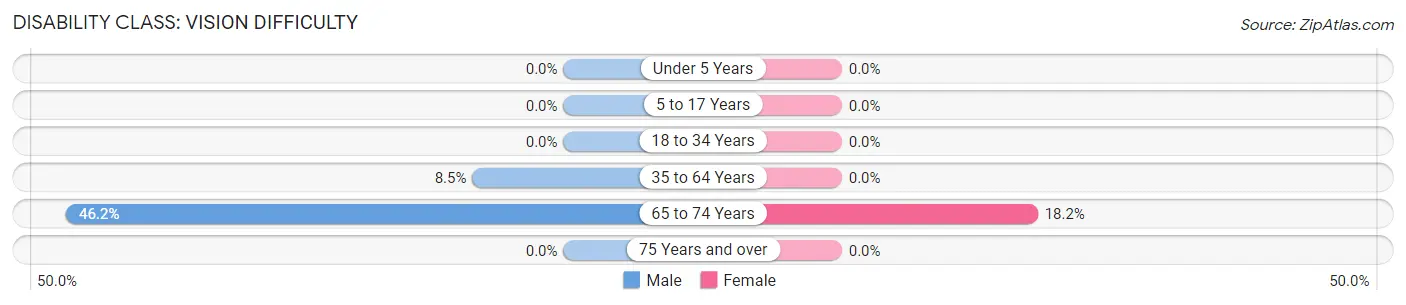
| Age Bracket | Male | Female |
| Under 5 Years | 0 (0.0%) | 0 (0.0%) |
| 5 to 17 Years | 0 (0.0%) | 0 (0.0%) |
| 18 to 34 Years | 0 (0.0%) | 0 (0.0%) |
| 35 to 64 Years | 12 (8.5%) | 0 (0.0%) |
| 65 to 74 Years | 6 (46.2%) | 4 (18.2%) |
| 75 Years and over | 0 (0.0%) | 0 (0.0%) |
Disability Class: Cognitive Difficulty
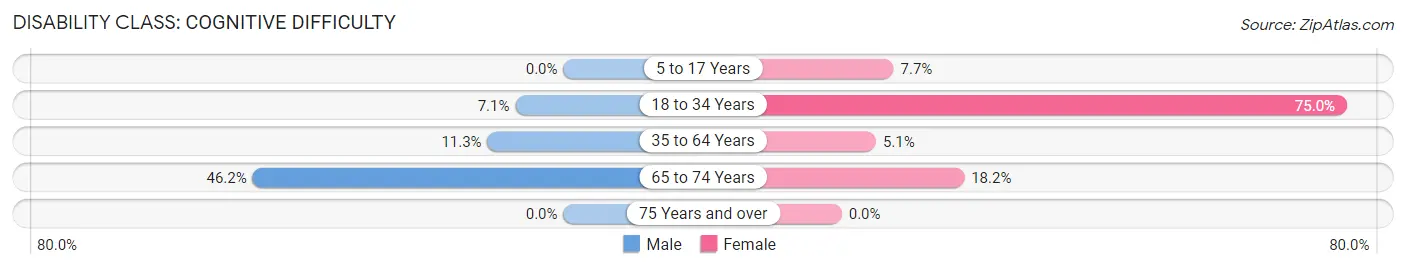
| Age Bracket | Male | Female |
| 5 to 17 Years | 0 (0.0%) | 1 (7.7%) |
| 18 to 34 Years | 1 (7.1%) | 18 (75.0%) |
| 35 to 64 Years | 16 (11.3%) | 7 (5.1%) |
| 65 to 74 Years | 6 (46.2%) | 4 (18.2%) |
| 75 Years and over | 0 (0.0%) | 0 (0.0%) |
Disability Class: Ambulatory Difficulty
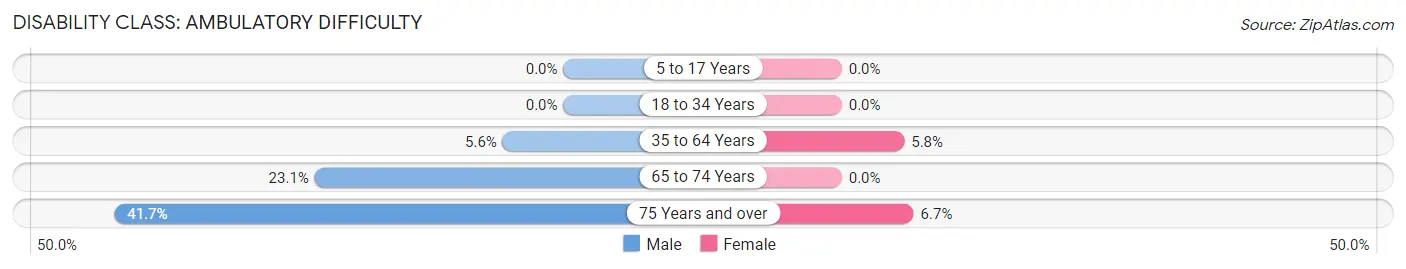
| Age Bracket | Male | Female |
| 5 to 17 Years | 0 (0.0%) | 0 (0.0%) |
| 18 to 34 Years | 0 (0.0%) | 0 (0.0%) |
| 35 to 64 Years | 8 (5.6%) | 8 (5.8%) |
| 65 to 74 Years | 3 (23.1%) | 0 (0.0%) |
| 75 Years and over | 5 (41.7%) | 1 (6.7%) |
Disability Class: Self-Care Difficulty
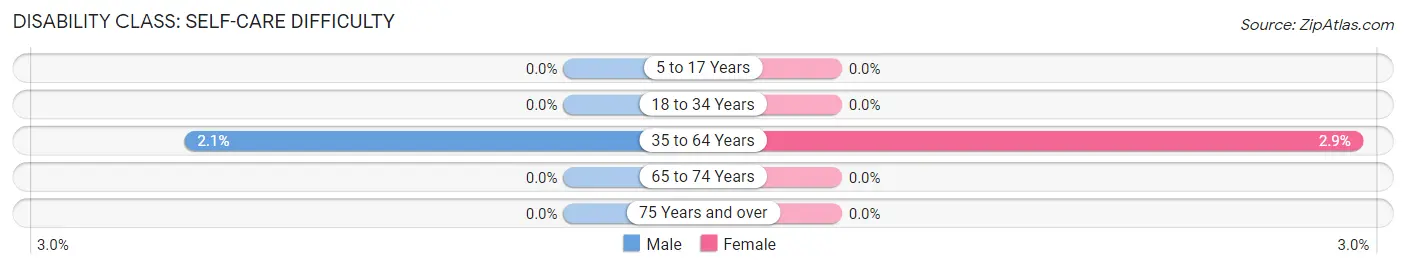
| Age Bracket | Male | Female |
| 5 to 17 Years | 0 (0.0%) | 0 (0.0%) |
| 18 to 34 Years | 0 (0.0%) | 0 (0.0%) |
| 35 to 64 Years | 3 (2.1%) | 4 (2.9%) |
| 65 to 74 Years | 0 (0.0%) | 0 (0.0%) |
| 75 Years and over | 0 (0.0%) | 0 (0.0%) |
Technology Access in Fargo
Computing Device Access in Fargo
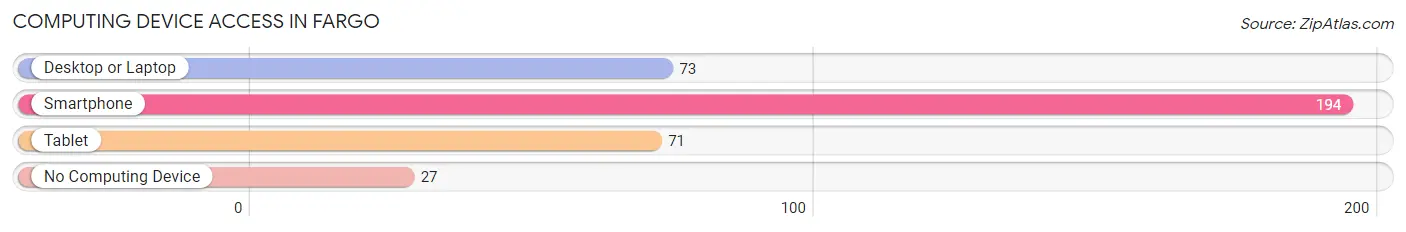
| Device Type | # Households | % Households |
| Desktop or Laptop | 73 | 30.2% |
| Smartphone | 194 | 80.2% |
| Tablet | 71 | 29.3% |
| No Computing Device | 27 | 11.2% |
| Total | 242 | 100.0% |
Internet Access in Fargo
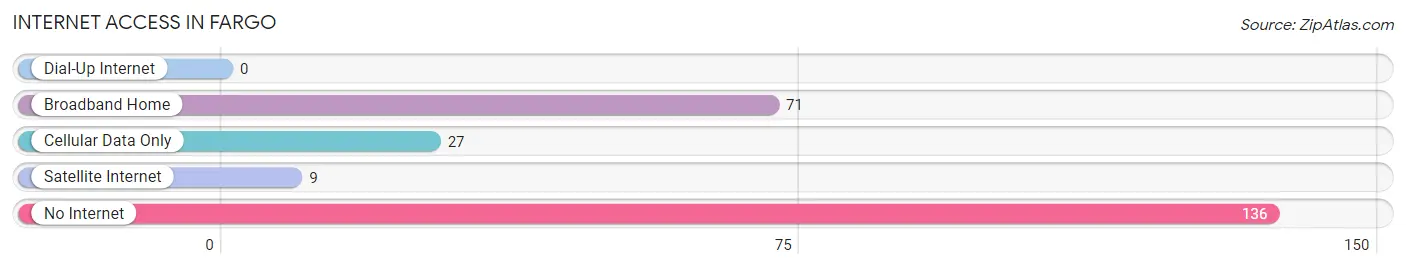
| Internet Type | # Households | % Households |
| Dial-Up Internet | 0 | 0.0% |
| Broadband Home | 71 | 29.3% |
| Cellular Data Only | 27 | 11.2% |
| Satellite Internet | 9 | 3.7% |
| No Internet | 136 | 56.2% |
| Total | 242 | 100.0% |
Fargo Summary
Fargo, Georgia is a small town located in the southeastern corner of Georgia, in Clinch County. It is situated on the banks of the Suwannee River, and is surrounded by the Okefenokee Swamp. The town was founded in 1854, and was named after the nearby town of Fargo, Florida. The population of Fargo, Georgia was estimated to be 1,072 in 2019.
Geography
Fargo is located in the southeastern corner of Georgia, in Clinch County. It is situated on the banks of the Suwannee River, and is surrounded by the Okefenokee Swamp. The town is located at an elevation of approximately 30 feet above sea level. The climate in Fargo is humid subtropical, with hot, humid summers and mild winters. The average annual temperature is around 70 degrees Fahrenheit.
Economy
Fargo’s economy is largely based on agriculture and forestry. The town is home to several farms, which produce a variety of crops, including corn, soybeans, cotton, and peanuts. The town is also home to several timber companies, which harvest timber from the surrounding forests. In addition, the town is home to several small businesses, including restaurants, convenience stores, and gas stations.
Demographics
As of 2019, the population of Fargo, Georgia was estimated to be 1,072. The racial makeup of the town was 79.2% White, 17.2% African American, 0.7% Native American, 0.3% Asian, 0.1% Pacific Islander, and 2.5% from other races. The median household income in Fargo was $30,938, and the median age was 41.
History
Fargo was founded in 1854, and was named after the nearby town of Fargo, Florida. The town was originally a small farming community, and was home to several small businesses. In the late 19th century, the town began to grow, and several new businesses were established. In the early 20th century, the town was home to several sawmills and timber companies. In the 1950s, the town began to decline, and many of the businesses closed. In the late 20th century, the town began to experience a resurgence, and several new businesses were established.
Fargo is a small town with a rich history and a bright future. The town is home to several small businesses, and is surrounded by the beautiful Okefenokee Swamp. The town is a great place to live, work, and raise a family.
Common Questions
What is Per Capita Income in Fargo?
Per Capita income in Fargo is $34,206.
What is the Median Family Income in Fargo?
Median Family Income in Fargo is $69,362.
What is the Median Household income in Fargo?
Median Household Income in Fargo is $68,960.
What is Inequality or Gini Index in Fargo?
Inequality or Gini Index in Fargo is 0.29.
What is the Total Population of Fargo?
Total Population of Fargo is 460.
What is the Total Male Population of Fargo?
Total Male Population of Fargo is 242.
What is the Total Female Population of Fargo?
Total Female Population of Fargo is 218.
What is the Ratio of Males per 100 Females in Fargo?
There are 111.01 Males per 100 Females in Fargo.
What is the Ratio of Females per 100 Males in Fargo?
There are 90.08 Females per 100 Males in Fargo.
What is the Median Population Age in Fargo?
Median Population Age in Fargo is 39.8 Years.
What is the Average Family Size in Fargo
Average Family Size in Fargo is 2.0 People.
What is the Average Household Size in Fargo
Average Household Size in Fargo is 1.9 People.
How Large is the Labor Force in Fargo?
There are 225 People in the Labor Forcein in Fargo.
What is the Percentage of People in the Labor Force in Fargo?
58.9% of People are in the Labor Force in Fargo.
What is the Unemployment Rate in Fargo?
Unemployment Rate in Fargo is 0.4%.