Alpaugh, CA Map & Demographics
Alpaugh Map
Alpaugh Overview
$11,260
PER CAPITA INCOME
$39,688
AVG HOUSEHOLD INCOME
25.7%
WAGE / INCOME GAP [ % ]
74.3¢/ $1
WAGE / INCOME GAP [ $ ]
0.38
INEQUALITY / GINI INDEX
880
TOTAL POPULATION
371
MALE POPULATION
509
FEMALE POPULATION
72.89
MALES / 100 FEMALES
137.20
FEMALES / 100 MALES
23.1
MEDIAN AGE
4.9
AVG FAMILY SIZE
4.4
AVG HOUSEHOLD SIZE
334
LABOR FORCE [ PEOPLE ]
65.9%
PERCENT IN LABOR FORCE
20.1%
UNEMPLOYMENT RATE
Alpaugh Zip Codes
Alpaugh Area Codes
Income in Alpaugh
Income Overview in Alpaugh
| Characteristic | Number | Measure |
| Per Capita Income | 880 | $11,260 |
| Median Family Income | 167 | $0 |
| Mean Family Income | 167 | $49,199 |
| Median Household Income | 199 | $39,688 |
| Mean Household Income | 199 | $47,904 |
| Income Deficit | 167 | $0 |
| Wage / Income Gap (%) | 880 | 25.72% |
| Wage / Income Gap ($) | 880 | 74.28¢ per $1 |
| Gini / Inequality Index | 880 | 0.38 |
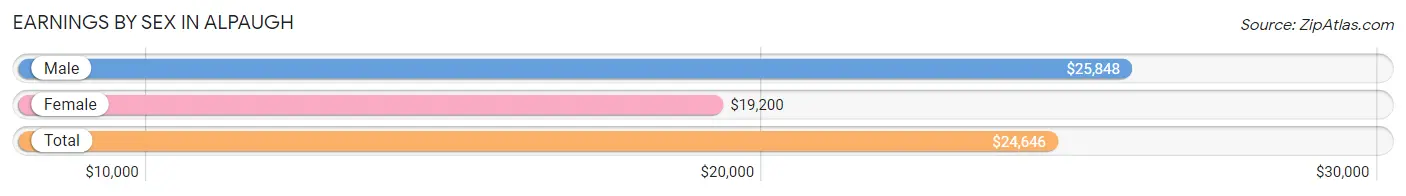
Earnings by Sex in Alpaugh
Average Earnings in Alpaugh are $24,646, $25,848 for men and $19,200 for women, a difference of 25.7%.
| Sex | Number | Average Earnings |
| Male | 239 (72.6%) | $25,848 |
| Female | 90 (27.4%) | $19,200 |
| Total | 329 (100.0%) | $24,646 |
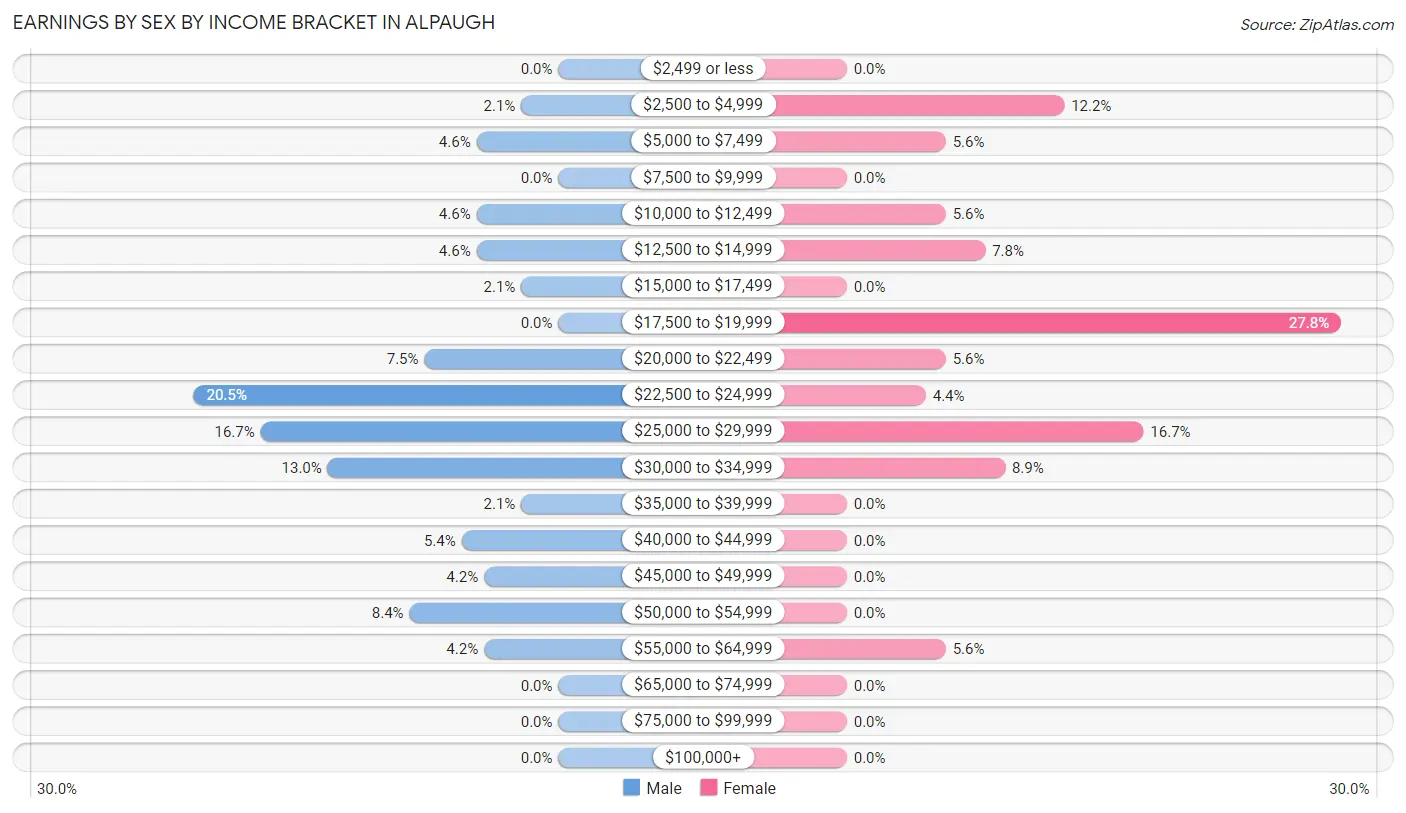
Earnings by Sex by Income Bracket in Alpaugh
The most common earnings brackets in Alpaugh are $22,500 to $24,999 for men (49 | 20.5%) and $17,500 to $19,999 for women (25 | 27.8%).
| Income | Male | Female |
| $2,499 or less | 0 (0.0%) | 0 (0.0%) |
| $2,500 to $4,999 | 5 (2.1%) | 11 (12.2%) |
| $5,000 to $7,499 | 11 (4.6%) | 5 (5.6%) |
| $7,500 to $9,999 | 0 (0.0%) | 0 (0.0%) |
| $10,000 to $12,499 | 11 (4.6%) | 5 (5.6%) |
| $12,500 to $14,999 | 11 (4.6%) | 7 (7.8%) |
| $15,000 to $17,499 | 5 (2.1%) | 0 (0.0%) |
| $17,500 to $19,999 | 0 (0.0%) | 25 (27.8%) |
| $20,000 to $22,499 | 18 (7.5%) | 5 (5.6%) |
| $22,500 to $24,999 | 49 (20.5%) | 4 (4.4%) |
| $25,000 to $29,999 | 40 (16.7%) | 15 (16.7%) |
| $30,000 to $34,999 | 31 (13.0%) | 8 (8.9%) |
| $35,000 to $39,999 | 5 (2.1%) | 0 (0.0%) |
| $40,000 to $44,999 | 13 (5.4%) | 0 (0.0%) |
| $45,000 to $49,999 | 10 (4.2%) | 0 (0.0%) |
| $50,000 to $54,999 | 20 (8.4%) | 0 (0.0%) |
| $55,000 to $64,999 | 10 (4.2%) | 5 (5.6%) |
| $65,000 to $74,999 | 0 (0.0%) | 0 (0.0%) |
| $75,000 to $99,999 | 0 (0.0%) | 0 (0.0%) |
| $100,000+ | 0 (0.0%) | 0 (0.0%) |
| Total | 239 (100.0%) | 90 (100.0%) |
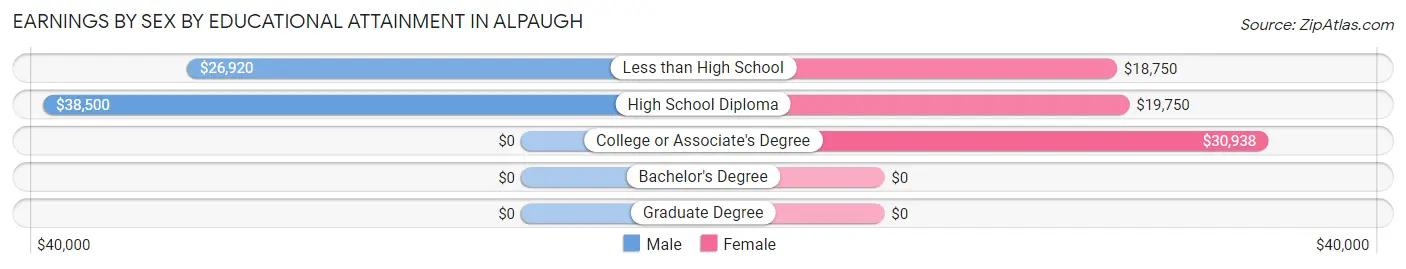
Earnings by Sex by Educational Attainment in Alpaugh
Average earnings in Alpaugh are $30,682 for men and $21,000 for women, a difference of 31.6%. Men with an educational attainment of high school diploma enjoy the highest average annual earnings of $38,500, while those with less than high school education earn the least with $26,920. Women with an educational attainment of college or associate's degree earn the most with the average annual earnings of $30,938, while those with less than high school education have the smallest earnings of $18,750.
| Educational Attainment | Male Income | Female Income |
| Less than High School | $26,920 | $18,750 |
| High School Diploma | $38,500 | $19,750 |
| College or Associate's Degree | - | - |
| Bachelor's Degree | - | - |
| Graduate Degree | - | - |
| Total | $30,682 | $21,000 |
Family Income in Alpaugh
Family Income Brackets in Alpaugh
According to the Alpaugh family income data, there are 47 families falling into the $50,000 to $74,999 income range, which is the most common income bracket and makes up 28.1% of all families.
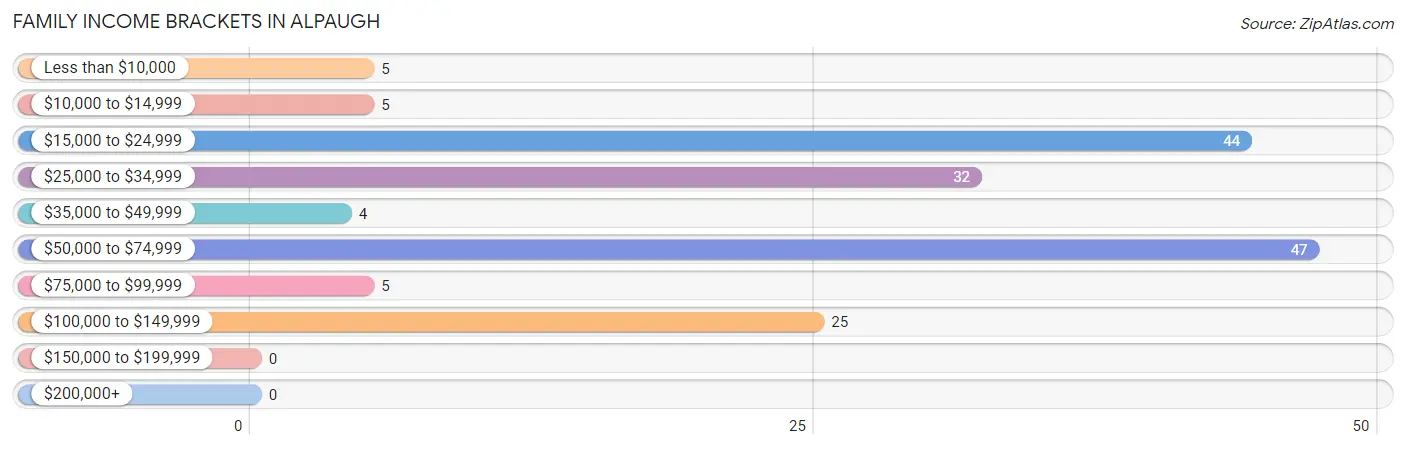
| Income Bracket | # Families | % Families |
| Less than $10,000 | 5 | 3.0% |
| $10,000 to $14,999 | 5 | 3.0% |
| $15,000 to $24,999 | 44 | 26.3% |
| $25,000 to $34,999 | 32 | 19.2% |
| $35,000 to $49,999 | 4 | 2.4% |
| $50,000 to $74,999 | 47 | 28.1% |
| $75,000 to $99,999 | 5 | 3.0% |
| $100,000 to $149,999 | 25 | 15.0% |
| $150,000 to $199,999 | 0 | 0.0% |
| $200,000+ | 0 | 0.0% |
Family Income by Famaliy Size in Alpaugh
6-person families (53 | 31.7%) account for the highest median family income in Alpaugh with $59,250 per family, while 5-person families (19 | 11.4%) have the highest median income of $10,050 per family member.
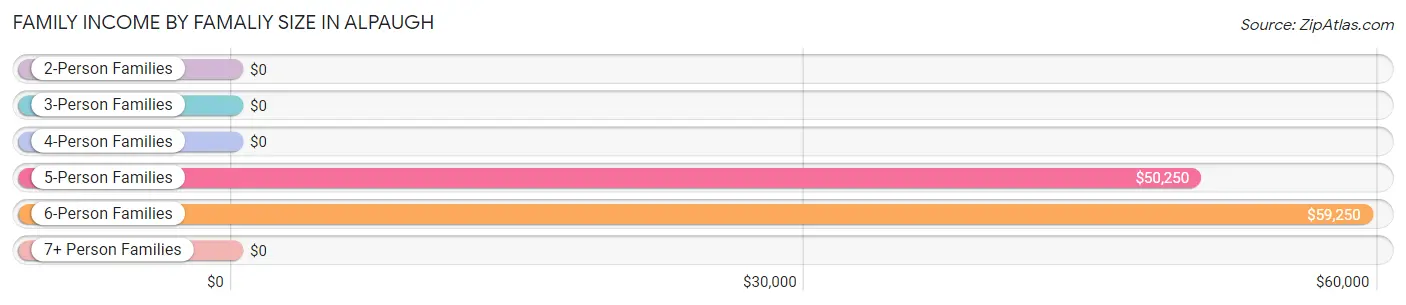
| Income Bracket | # Families | Median Income |
| 2-Person Families | 13 (7.8%) | $0 |
| 3-Person Families | 24 (14.4%) | $0 |
| 4-Person Families | 49 (29.3%) | $0 |
| 5-Person Families | 19 (11.4%) | $50,250 |
| 6-Person Families | 53 (31.7%) | $59,250 |
| 7+ Person Families | 9 (5.4%) | $0 |
| Total | 167 (100.0%) | $0 |
Family Income by Number of Earners in Alpaugh
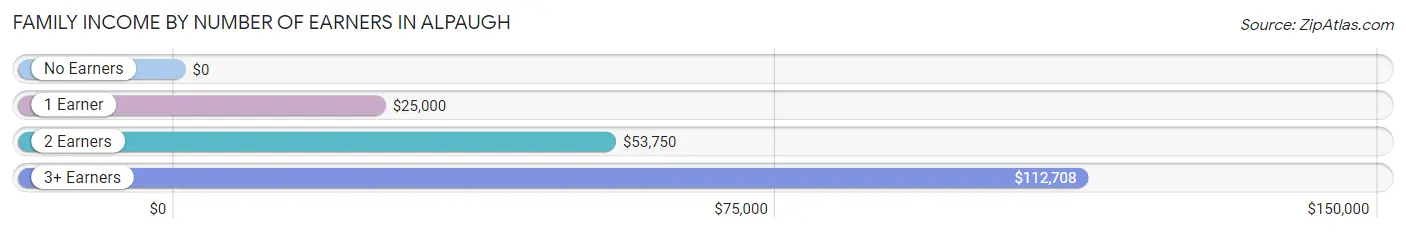
| Number of Earners | # Families | Median Income |
| No Earners | 5 (3.0%) | $0 |
| 1 Earner | 98 (58.7%) | $25,000 |
| 2 Earners | 33 (19.8%) | $53,750 |
| 3+ Earners | 31 (18.6%) | $112,708 |
| Total | 167 (100.0%) | $0 |
Household Income in Alpaugh
Household Income Brackets in Alpaugh
With 55 households falling in the category, the $50,000 to $74,999 income range is the most frequent in Alpaugh, accounting for 27.6% of all households.
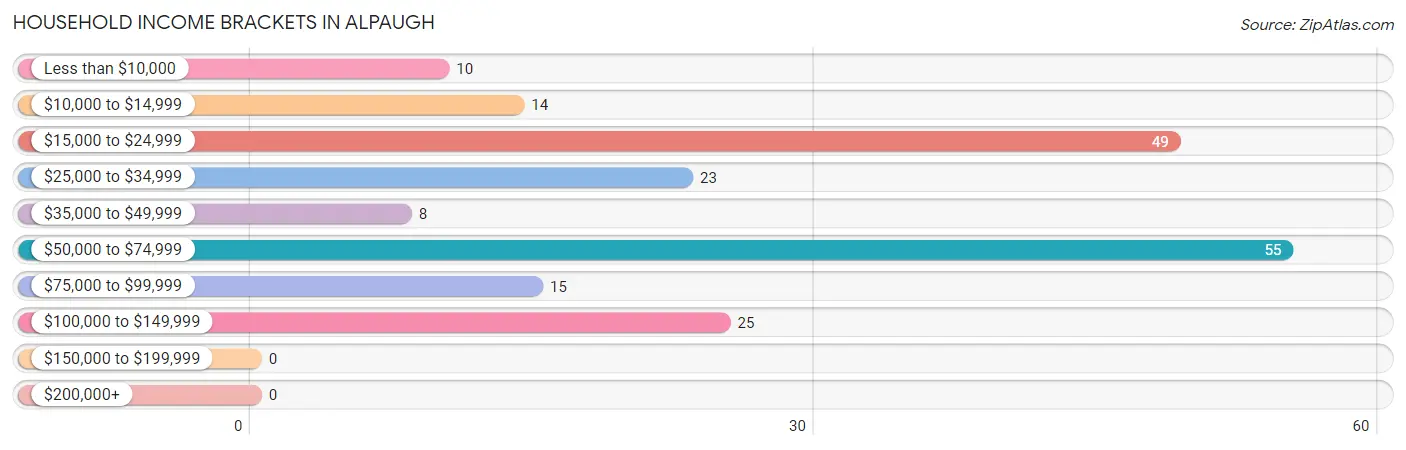
| Income Bracket | # Households | % Households |
| Less than $10,000 | 10 | 5.0% |
| $10,000 to $14,999 | 14 | 7.0% |
| $15,000 to $24,999 | 49 | 24.6% |
| $25,000 to $34,999 | 23 | 11.6% |
| $35,000 to $49,999 | 8 | 4.0% |
| $50,000 to $74,999 | 55 | 27.6% |
| $75,000 to $99,999 | 15 | 7.5% |
| $100,000 to $149,999 | 25 | 12.6% |
| $150,000 to $199,999 | 0 | 0.0% |
| $200,000+ | 0 | 0.0% |
Household Income by Householder Age in Alpaugh
The median household income in Alpaugh is $39,688, with the highest median household income of $52,292 found in the 45 to 64 years age bracket for the primary householder. A total of 52 households (26.1%) fall into this category. Meanwhile, the 15 to 24 years age bracket for the primary householder has the lowest median household income of $0, with 39 households (19.6%) in this group.
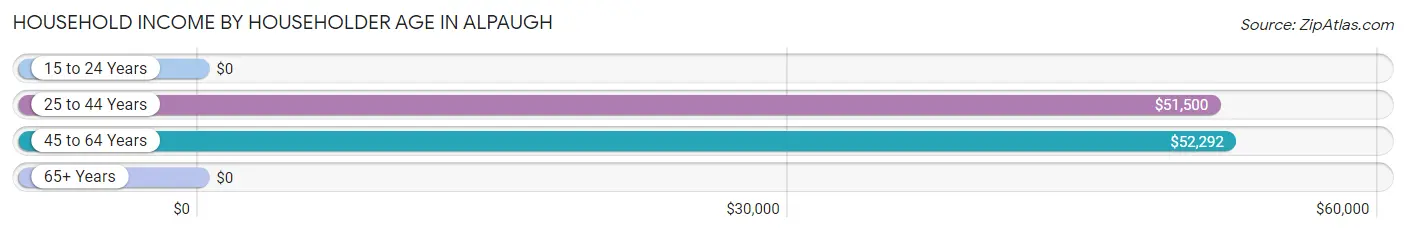
| Income Bracket | # Households | Median Income |
| 15 to 24 Years | 39 (19.6%) | $0 |
| 25 to 44 Years | 96 (48.2%) | $51,500 |
| 45 to 64 Years | 52 (26.1%) | $52,292 |
| 65+ Years | 12 (6.0%) | $0 |
| Total | 199 (100.0%) | $39,688 |
Poverty in Alpaugh
Income Below Poverty by Sex and Age in Alpaugh
With 31.5% poverty level for males and 60.9% for females among the residents of Alpaugh, 6 to 11 year old males and 5 year old females are the most vulnerable to poverty, with 10 males (100.0%) and 54 females (100.0%) in their respective age groups living below the poverty level.
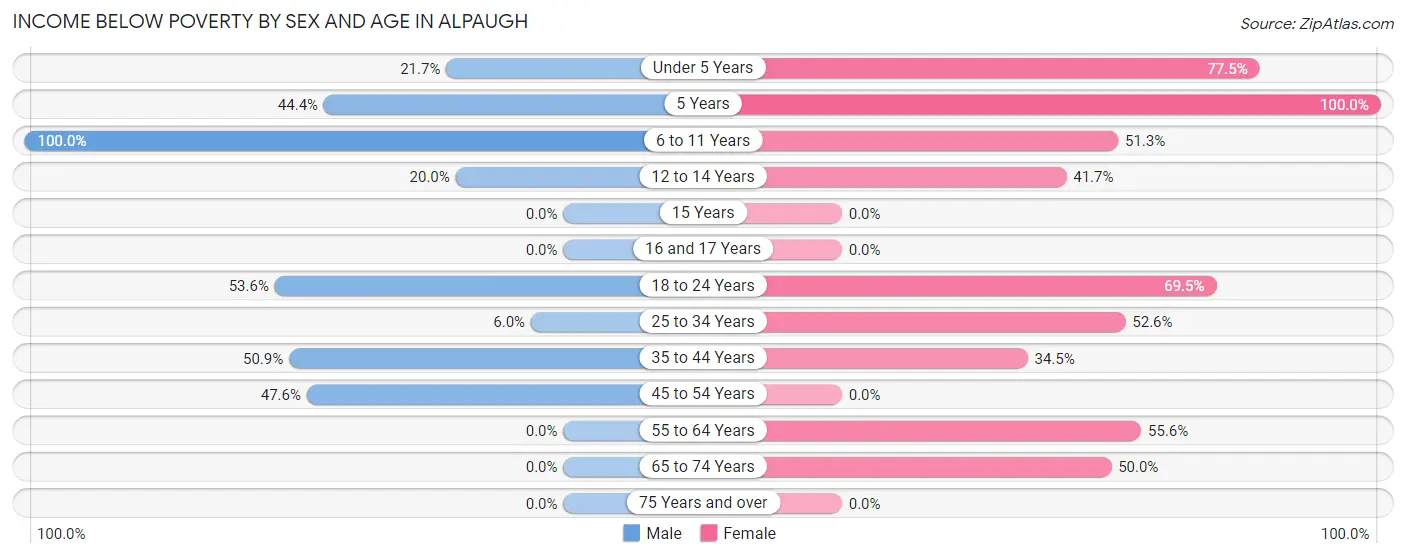
| Age Bracket | Male | Female |
| Under 5 Years | 10 (21.7%) | 100 (77.5%) |
| 5 Years | 4 (44.4%) | 54 (100.0%) |
| 6 to 11 Years | 10 (100.0%) | 40 (51.3%) |
| 12 to 14 Years | 5 (20.0%) | 5 (41.7%) |
| 15 Years | 0 (0.0%) | 0 (0.0%) |
| 16 and 17 Years | 0 (0.0%) | 0 (0.0%) |
| 18 to 24 Years | 45 (53.6%) | 57 (69.5%) |
| 25 to 34 Years | 5 (6.0%) | 30 (52.6%) |
| 35 to 44 Years | 28 (50.9%) | 10 (34.5%) |
| 45 to 54 Years | 10 (47.6%) | 0 (0.0%) |
| 55 to 64 Years | 0 (0.0%) | 10 (55.6%) |
| 65 to 74 Years | 0 (0.0%) | 4 (50.0%) |
| 75 Years and over | 0 (0.0%) | 0 (0.0%) |
| Total | 117 (31.5%) | 310 (60.9%) |
Income Above Poverty by Sex and Age in Alpaugh
According to the poverty statistics in Alpaugh, males aged 15 years and females aged 16 and 17 years are the age groups that are most secure financially, with 100.0% of males and 100.0% of females in these age groups living above the poverty line.
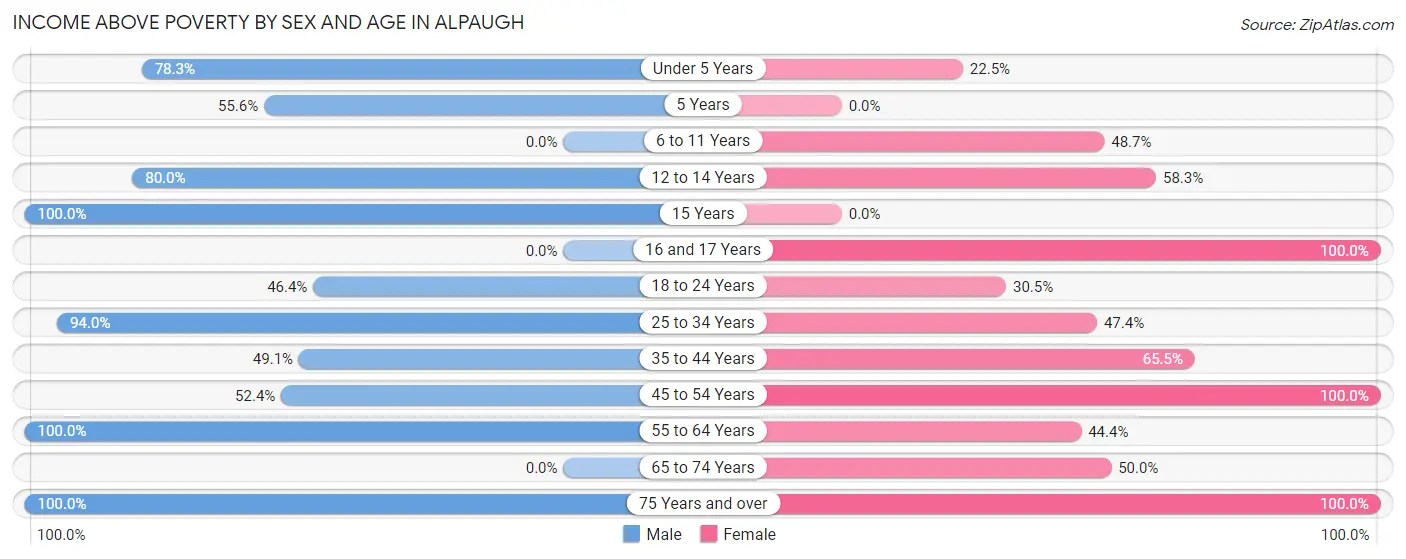
| Age Bracket | Male | Female |
| Under 5 Years | 36 (78.3%) | 29 (22.5%) |
| 5 Years | 5 (55.6%) | 0 (0.0%) |
| 6 to 11 Years | 0 (0.0%) | 38 (48.7%) |
| 12 to 14 Years | 20 (80.0%) | 7 (58.3%) |
| 15 Years | 10 (100.0%) | 0 (0.0%) |
| 16 and 17 Years | 0 (0.0%) | 5 (100.0%) |
| 18 to 24 Years | 39 (46.4%) | 25 (30.5%) |
| 25 to 34 Years | 78 (94.0%) | 27 (47.4%) |
| 35 to 44 Years | 27 (49.1%) | 19 (65.5%) |
| 45 to 54 Years | 11 (52.4%) | 33 (100.0%) |
| 55 to 64 Years | 23 (100.0%) | 8 (44.4%) |
| 65 to 74 Years | 0 (0.0%) | 4 (50.0%) |
| 75 Years and over | 5 (100.0%) | 4 (100.0%) |
| Total | 254 (68.5%) | 199 (39.1%) |
Income Below Poverty Among Married-Couple Families in Alpaugh
The poverty statistics for married-couple families in Alpaugh show that 54.1% or 72 of the total 133 families live below the poverty line. Families with 1 or 2 children have the highest poverty rate of 67.1%, comprising of 49 families. On the other hand, families with no children have the lowest poverty rate of 22.7%, which includes 5 families.
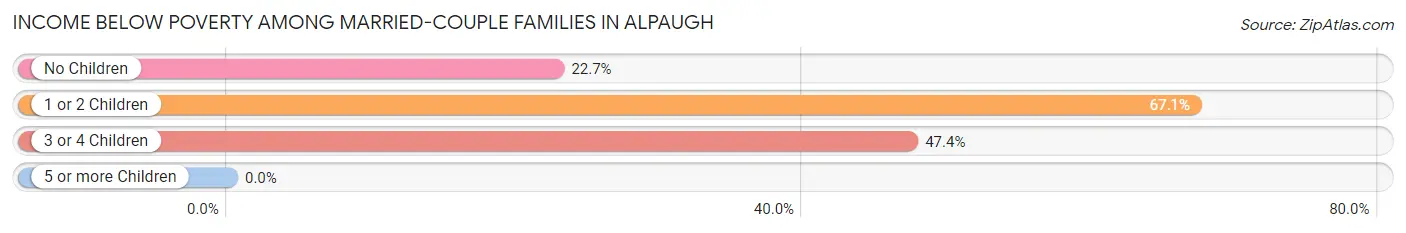
| Children | Above Poverty | Below Poverty |
| No Children | 17 (77.3%) | 5 (22.7%) |
| 1 or 2 Children | 24 (32.9%) | 49 (67.1%) |
| 3 or 4 Children | 20 (52.6%) | 18 (47.4%) |
| 5 or more Children | 0 (0.0%) | 0 (0.0%) |
| Total | 61 (45.9%) | 72 (54.1%) |
Income Below Poverty Among Single-Parent Households in Alpaugh
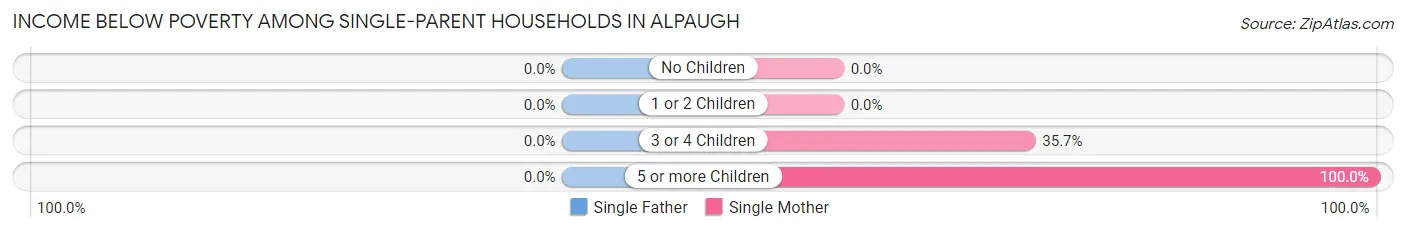
| Children | Single Father | Single Mother |
| No Children | 0 (0.0%) | 0 (0.0%) |
| 1 or 2 Children | 0 (0.0%) | 0 (0.0%) |
| 3 or 4 Children | 0 (0.0%) | 5 (35.7%) |
| 5 or more Children | 0 (0.0%) | 4 (100.0%) |
| Total | 0 (0.0%) | 9 (32.1%) |
Income Below Poverty Among Married-Couple vs Single-Parent Households in Alpaugh
The poverty data for Alpaugh shows that 72 of the married-couple family households (54.1%) and 9 of the single-parent households (26.5%) are living below the poverty level. Within the married-couple family households, those with 1 or 2 children have the highest poverty rate, with 49 households (67.1%) falling below the poverty line. Among the single-parent households, those with 5 or more children have the highest poverty rate, with 4 household (100.0%) living below poverty.
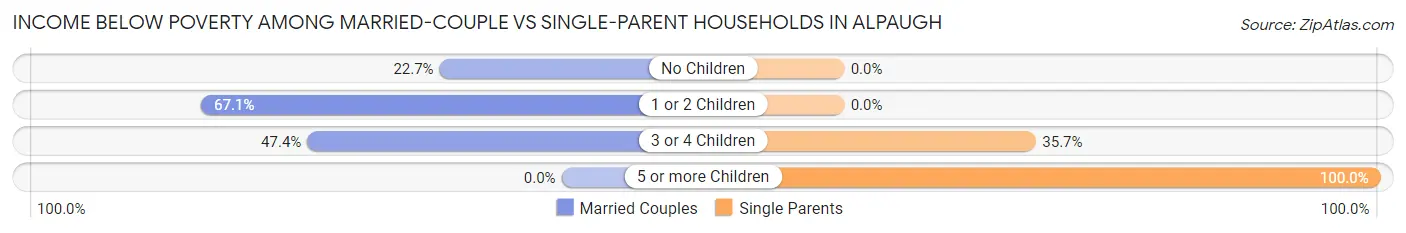
| Children | Married-Couple Families | Single-Parent Households |
| No Children | 5 (22.7%) | 0 (0.0%) |
| 1 or 2 Children | 49 (67.1%) | 0 (0.0%) |
| 3 or 4 Children | 18 (47.4%) | 5 (35.7%) |
| 5 or more Children | 0 (0.0%) | 4 (100.0%) |
| Total | 72 (54.1%) | 9 (26.5%) |
Race in Alpaugh
The most populous races in Alpaugh are Hispanic or Latino (789 | 89.7%), White / Caucasian (514 | 58.4%), and Some other Race (197 | 22.4%).
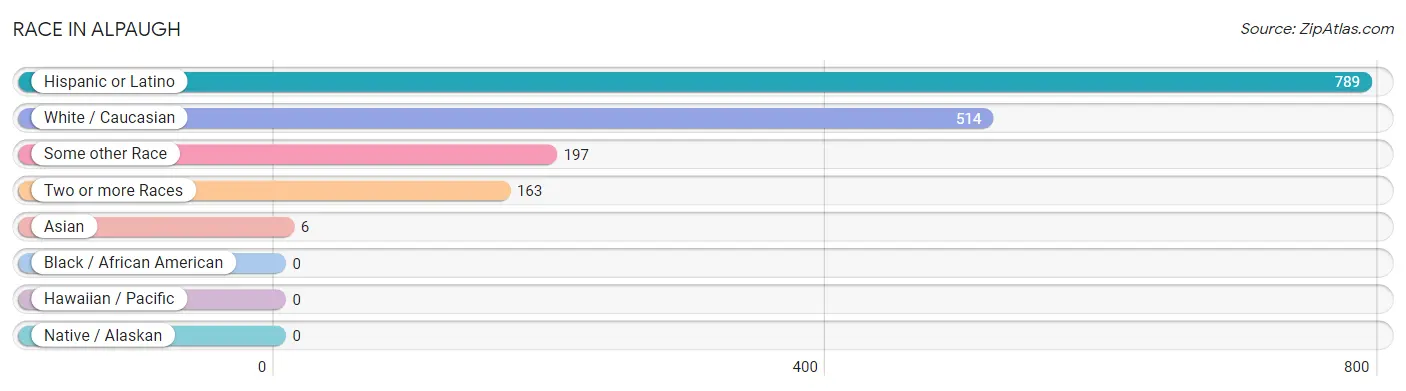
| Race | # Population | % Population |
| Asian | 6 | 0.7% |
| Black / African American | 0 | 0.0% |
| Hawaiian / Pacific | 0 | 0.0% |
| Hispanic or Latino | 789 | 89.7% |
| Native / Alaskan | 0 | 0.0% |
| White / Caucasian | 514 | 58.4% |
| Two or more Races | 163 | 18.5% |
| Some other Race | 197 | 22.4% |
| Total | 880 | 100.0% |
Ancestry in Alpaugh
The most populous ancestries reported in Alpaugh are Mexican (771 | 87.6%), Irish (21 | 2.4%), Cuban (14 | 1.6%), Comanche (10 | 1.1%), and Pakistani (10 | 1.1%), together accounting for 93.9% of all Alpaugh residents.
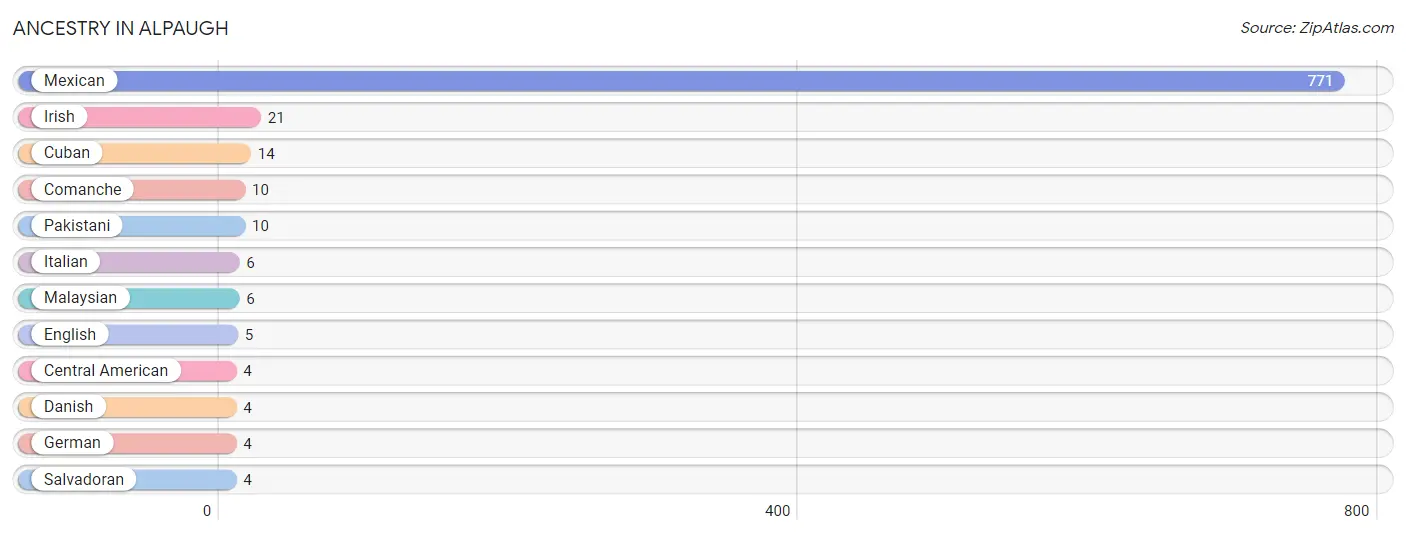
| Ancestry | # Population | % Population |
| Central American | 4 | 0.4% |
| Comanche | 10 | 1.1% |
| Cuban | 14 | 1.6% |
| Danish | 4 | 0.4% |
| English | 5 | 0.6% |
| German | 4 | 0.4% |
| Irish | 21 | 2.4% |
| Italian | 6 | 0.7% |
| Malaysian | 6 | 0.7% |
| Mexican | 771 | 87.6% |
| Pakistani | 10 | 1.1% |
| Salvadoran | 4 | 0.4% | View All 12 Rows |
Immigrants in Alpaugh
The most numerous immigrant groups reported in Alpaugh came from Central America (289 | 32.8%), Latin America (289 | 32.8%), Mexico (285 | 32.4%), Asia (6 | 0.7%), and Laos (6 | 0.7%), together accounting for 99.4% of all Alpaugh residents.
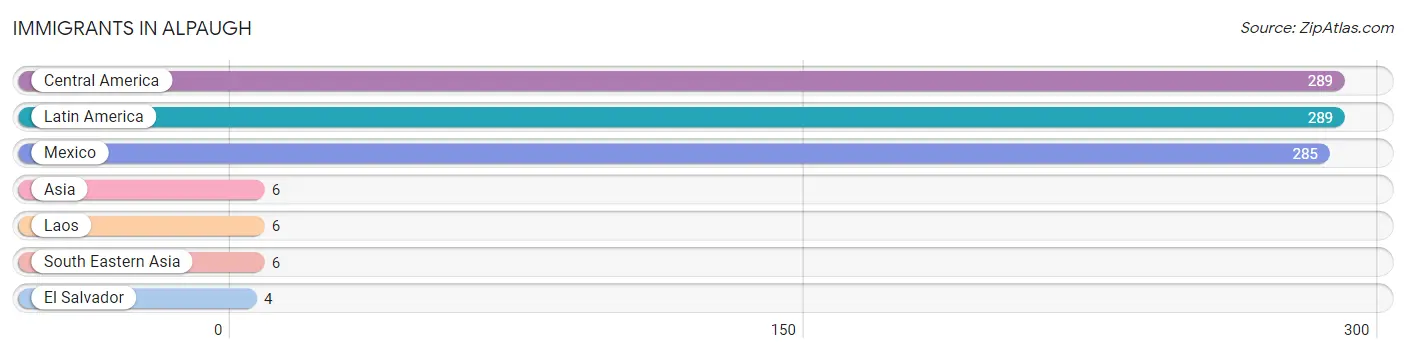
| Immigration Origin | # Population | % Population |
| Asia | 6 | 0.7% |
| Central America | 289 | 32.8% |
| El Salvador | 4 | 0.4% |
| Laos | 6 | 0.7% |
| Latin America | 289 | 32.8% |
| Mexico | 285 | 32.4% |
| South Eastern Asia | 6 | 0.7% | View All 7 Rows |
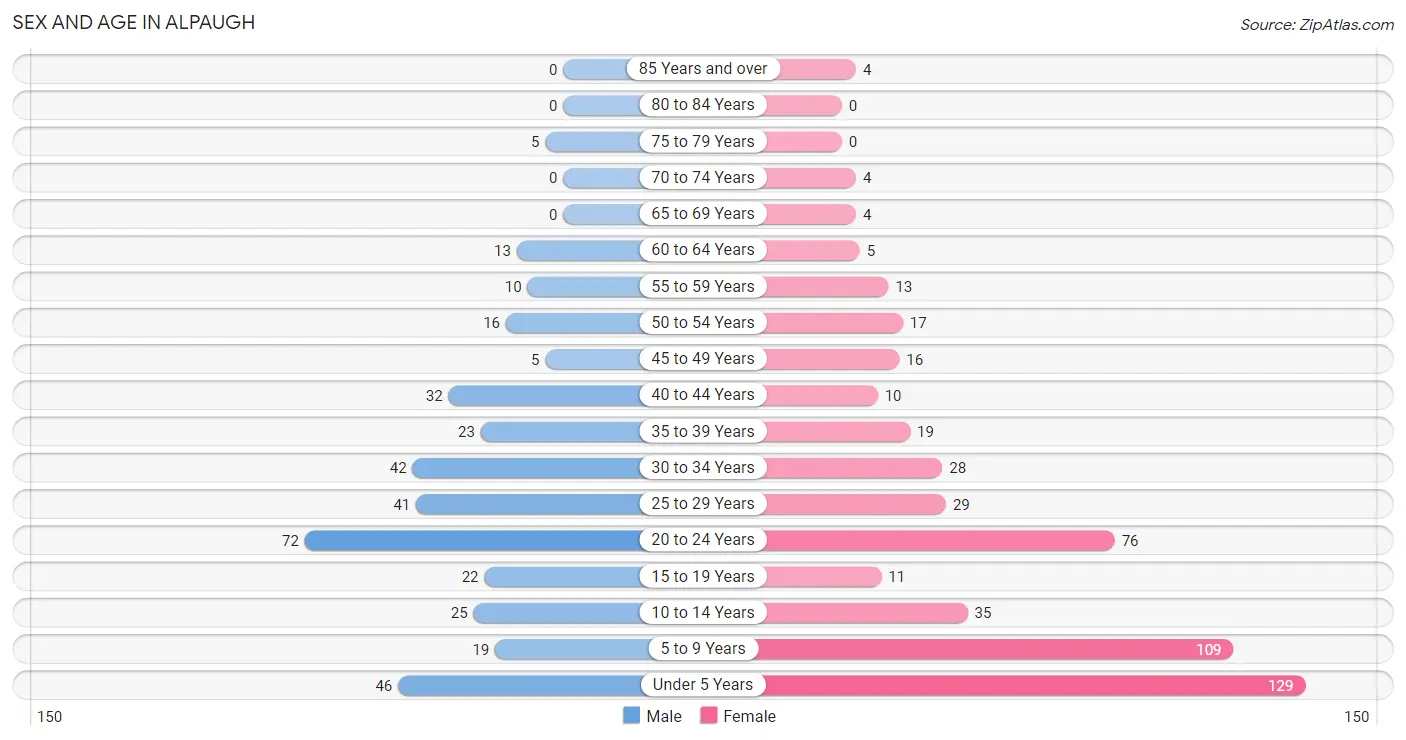
Sex and Age in Alpaugh
Sex and Age in Alpaugh
The most populous age groups in Alpaugh are 20 to 24 Years (72 | 19.4%) for men and Under 5 Years (129 | 25.3%) for women.
| Age Bracket | Male | Female |
| Under 5 Years | 46 (12.4%) | 129 (25.3%) |
| 5 to 9 Years | 19 (5.1%) | 109 (21.4%) |
| 10 to 14 Years | 25 (6.7%) | 35 (6.9%) |
| 15 to 19 Years | 22 (5.9%) | 11 (2.2%) |
| 20 to 24 Years | 72 (19.4%) | 76 (14.9%) |
| 25 to 29 Years | 41 (11.1%) | 29 (5.7%) |
| 30 to 34 Years | 42 (11.3%) | 28 (5.5%) |
| 35 to 39 Years | 23 (6.2%) | 19 (3.7%) |
| 40 to 44 Years | 32 (8.6%) | 10 (2.0%) |
| 45 to 49 Years | 5 (1.3%) | 16 (3.1%) |
| 50 to 54 Years | 16 (4.3%) | 17 (3.3%) |
| 55 to 59 Years | 10 (2.7%) | 13 (2.5%) |
| 60 to 64 Years | 13 (3.5%) | 5 (1.0%) |
| 65 to 69 Years | 0 (0.0%) | 4 (0.8%) |
| 70 to 74 Years | 0 (0.0%) | 4 (0.8%) |
| 75 to 79 Years | 5 (1.3%) | 0 (0.0%) |
| 80 to 84 Years | 0 (0.0%) | 0 (0.0%) |
| 85 Years and over | 0 (0.0%) | 4 (0.8%) |
| Total | 371 (100.0%) | 509 (100.0%) |
Families and Households in Alpaugh
Median Family Size in Alpaugh
The median family size in Alpaugh is 4.92 persons per family, with single female/mother families (28 | 16.8%) accounting for the largest median family size of 6.43 persons per family. On the other hand, single male/father families (6 | 3.6%) represent the smallest median family size with 3.17 persons per family.
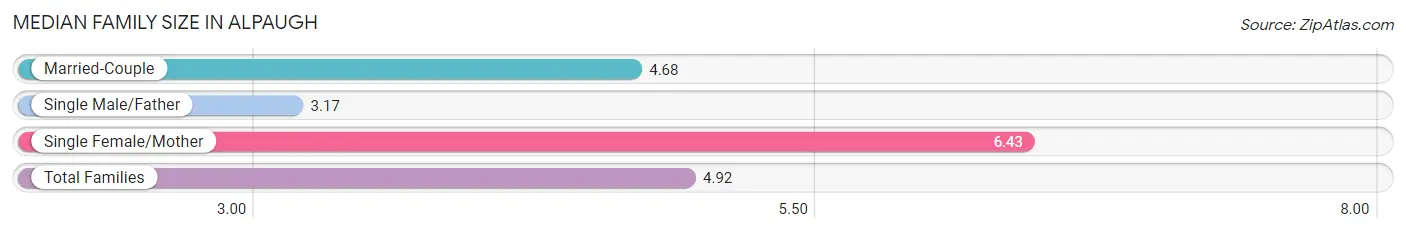
| Family Type | # Families | Family Size |
| Married-Couple | 133 (79.6%) | 4.68 |
| Single Male/Father | 6 (3.6%) | 3.17 |
| Single Female/Mother | 28 (16.8%) | 6.43 |
| Total Families | 167 (100.0%) | 4.92 |
Median Household Size in Alpaugh
The median household size in Alpaugh is 4.42 persons per household, with single female/mother households (28 | 14.1%) accounting for the largest median household size of 7.21 persons per household. non-family households (32 | 16.1%) represent the smallest median household size with 1.13 persons per household.
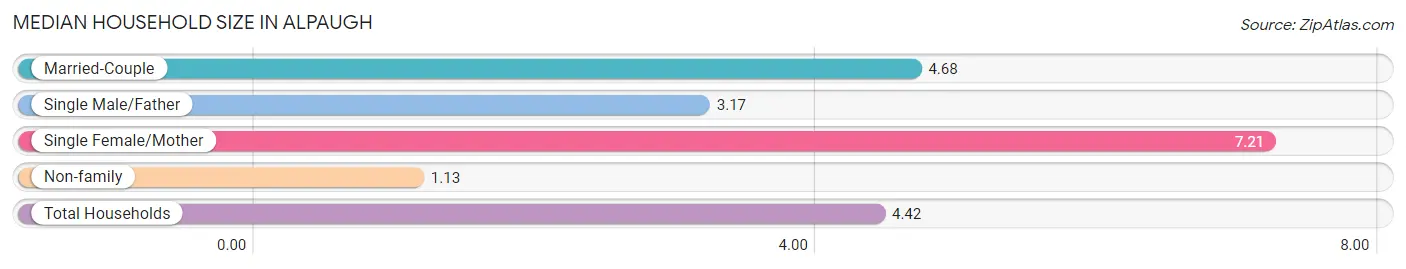
| Household Type | # Households | Household Size |
| Married-Couple | 133 (66.8%) | 4.68 |
| Single Male/Father | 6 (3.0%) | 3.17 |
| Single Female/Mother | 28 (14.1%) | 7.21 |
| Non-family | 32 (16.1%) | 1.13 |
| Total Households | 199 (100.0%) | 4.42 |
Household Size by Marriage Status in Alpaugh
Out of a total of 199 households in Alpaugh, 167 (83.9%) are family households, while 32 (16.1%) are nonfamily households. The most numerous type of family households are 4-person households, comprising 54, and the most common type of nonfamily households are 1-person households, comprising 28.
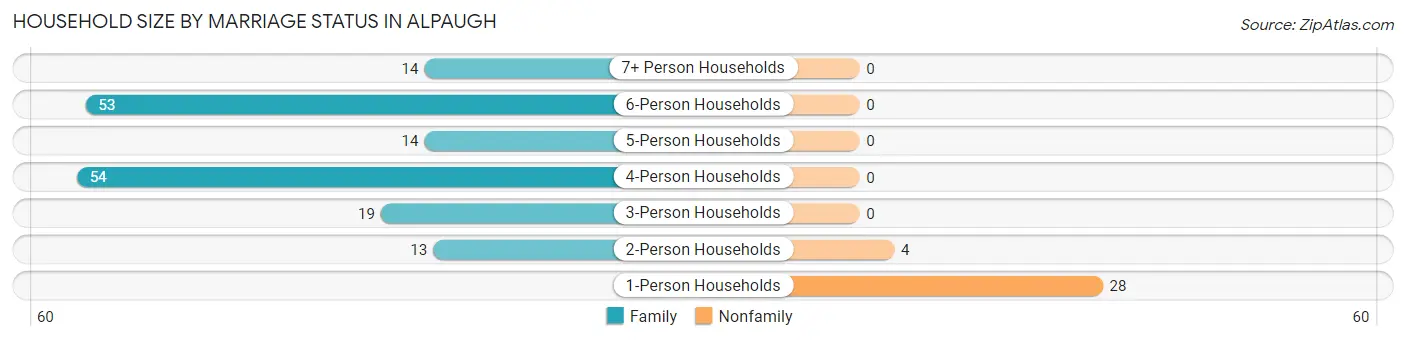
| Household Size | Family Households | Nonfamily Households |
| 1-Person Households | - | 28 (14.1%) |
| 2-Person Households | 13 (6.5%) | 4 (2.0%) |
| 3-Person Households | 19 (9.6%) | 0 (0.0%) |
| 4-Person Households | 54 (27.1%) | 0 (0.0%) |
| 5-Person Households | 14 (7.0%) | 0 (0.0%) |
| 6-Person Households | 53 (26.6%) | 0 (0.0%) |
| 7+ Person Households | 14 (7.0%) | 0 (0.0%) |
| Total | 167 (83.9%) | 32 (16.1%) |
Female Fertility in Alpaugh
Fertility by Age in Alpaugh
Average fertility rate in Alpaugh is 161.0 births per 1,000 women. Women in the age bracket of 20 to 34 years have the highest fertility rate with 195.0 births per 1,000 women. Women in the age bracket of 20 to 34 years acount for 83.9% of all women with births.
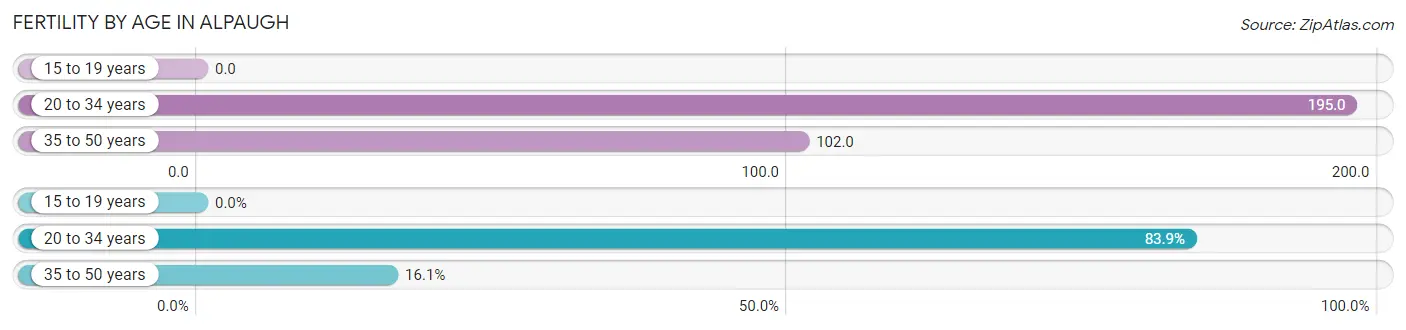
| Age Bracket | Women with Births | Births / 1,000 Women |
| 15 to 19 years | 0 (0.0%) | 0.0 |
| 20 to 34 years | 26 (83.9%) | 195.0 |
| 35 to 50 years | 5 (16.1%) | 102.0 |
| Total | 31 (100.0%) | 161.0 |
Fertility by Age by Marriage Status in Alpaugh
67.7% of women with births (31) in Alpaugh are married. The highest percentage of unmarried women with births falls into 35 to 50 years age bracket with 100.0% of them unmarried at the time of birth, while the lowest percentage of unmarried women with births belong to 20 to 34 years age bracket with 19.2% of them unmarried.
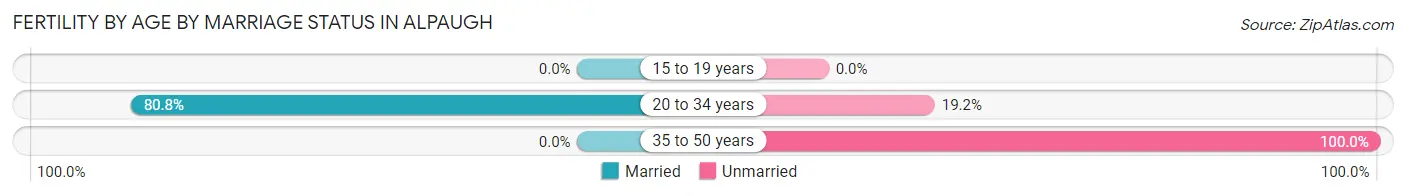
| Age Bracket | Married | Unmarried |
| 15 to 19 years | 0 (0.0%) | 0 (0.0%) |
| 20 to 34 years | 21 (80.8%) | 5 (19.2%) |
| 35 to 50 years | 0 (0.0%) | 5 (100.0%) |
| Total | 21 (67.7%) | 10 (32.3%) |
Fertility by Education in Alpaugh
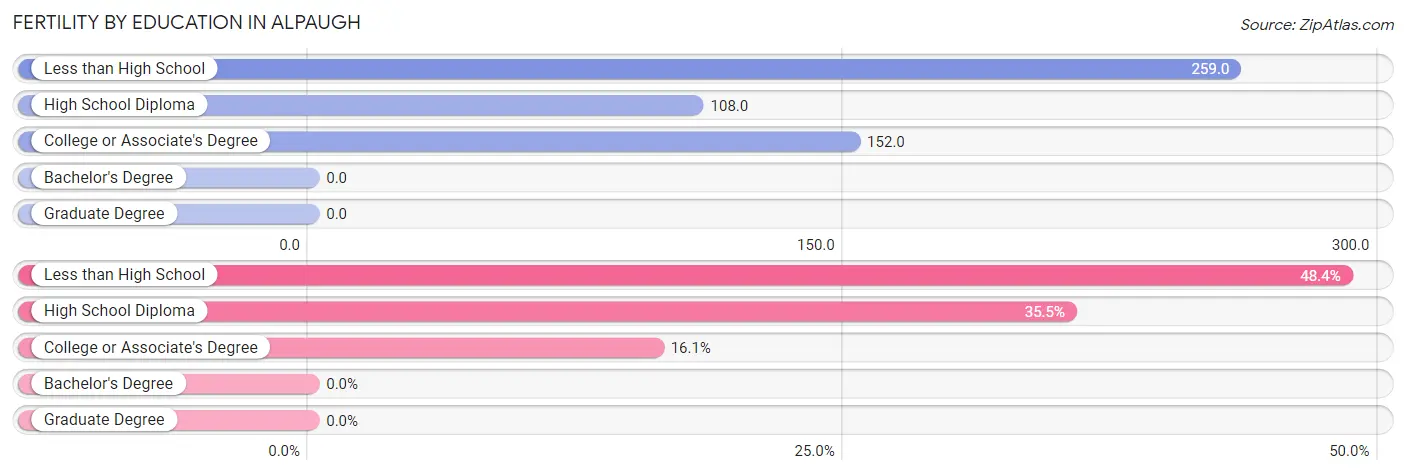
| Educational Attainment | Women with Births | Births / 1,000 Women |
| Less than High School | 15 (48.4%) | 259.0 |
| High School Diploma | 11 (35.5%) | 108.0 |
| College or Associate's Degree | 5 (16.1%) | 152.0 |
| Bachelor's Degree | 0 (0.0%) | 0.0 |
| Graduate Degree | 0 (0.0%) | 0.0 |
| Total | 31 (100.0%) | 161.0 |
Fertility by Education by Marriage Status in Alpaugh
32.3% of women with births in Alpaugh are unmarried. Women with the educational attainment of less than high school are most likely to be married with 100.0% of them married at childbirth, while women with the educational attainment of college or associate's degree are least likely to be married with 100.0% of them unmarried at childbirth.
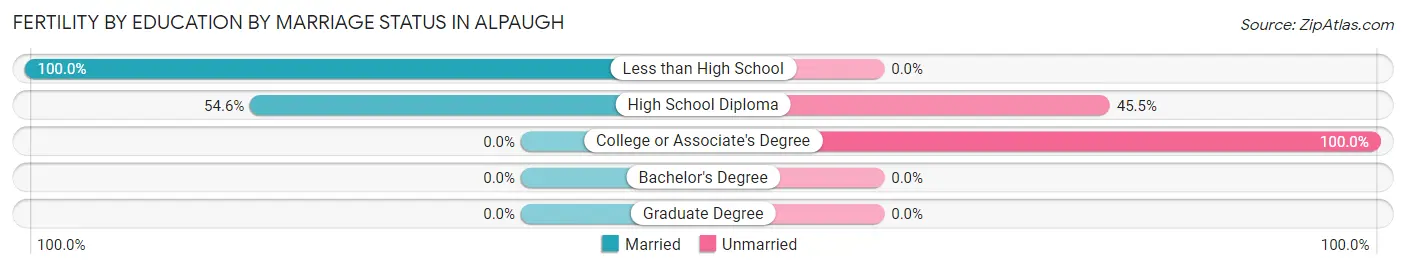
| Educational Attainment | Married | Unmarried |
| Less than High School | 15 (100.0%) | 0 (0.0%) |
| High School Diploma | 6 (54.5%) | 5 (45.5%) |
| College or Associate's Degree | 0 (0.0%) | 5 (100.0%) |
| Bachelor's Degree | 0 (0.0%) | 0 (0.0%) |
| Graduate Degree | 0 (0.0%) | 0 (0.0%) |
| Total | 21 (67.7%) | 10 (32.3%) |
Employment Characteristics in Alpaugh
Employment by Class of Employer in Alpaugh
Among the 258 employed individuals in Alpaugh, private company employees (220 | 85.3%), local government employees (11 | 4.3%), and self-employed (not incorporated) (10 | 3.9%) make up the most common classes of employment.
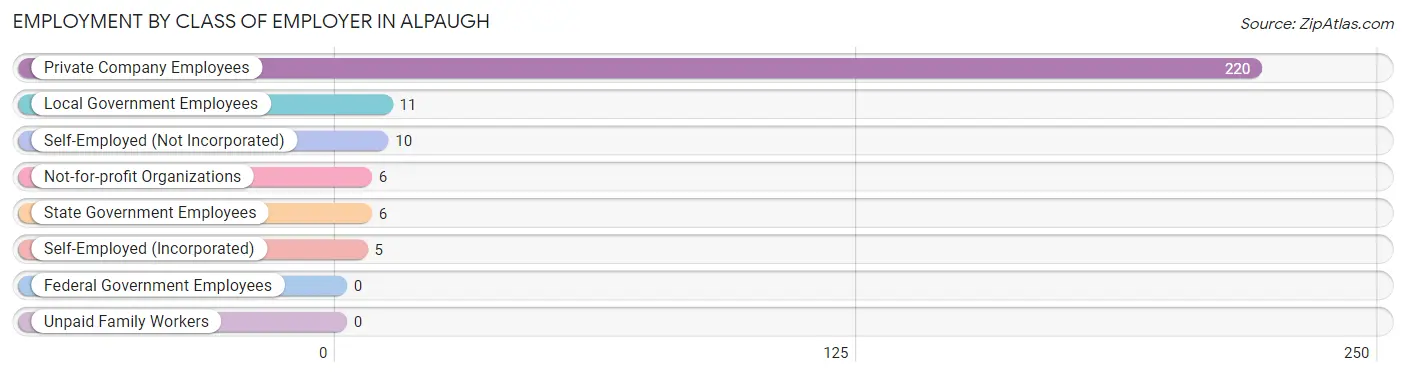
| Employer Class | # Employees | % Employees |
| Private Company Employees | 220 | 85.3% |
| Self-Employed (Incorporated) | 5 | 1.9% |
| Self-Employed (Not Incorporated) | 10 | 3.9% |
| Not-for-profit Organizations | 6 | 2.3% |
| Local Government Employees | 11 | 4.3% |
| State Government Employees | 6 | 2.3% |
| Federal Government Employees | 0 | 0.0% |
| Unpaid Family Workers | 0 | 0.0% |
| Total | 258 | 100.0% |
Employment Status by Age in Alpaugh
According to the labor force statistics for Alpaugh, out of the total population over 16 years of age (507), 65.9% or 334 individuals are in the labor force, with 20.1% or 67 of them unemployed. The age group with the highest labor force participation rate is 35 to 44 years, with 88.1% or 74 individuals in the labor force. Within the labor force, the 45 to 54 years age range has the highest percentage of unemployed individuals, with 55.9% or 19 of them being unemployed.
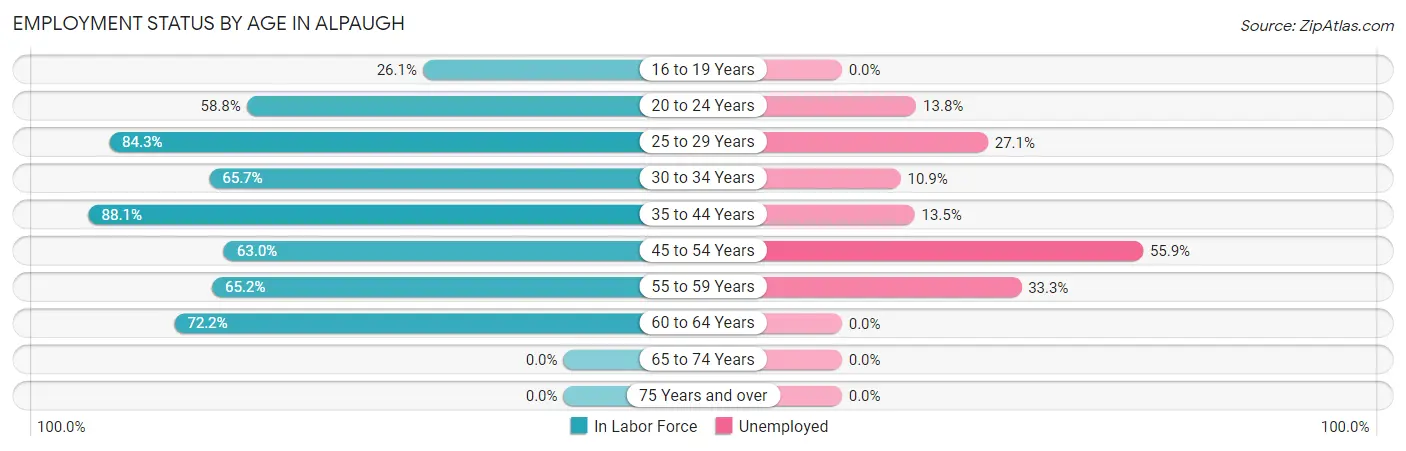
| Age Bracket | In Labor Force | Unemployed |
| 16 to 19 Years | 6 (26.1%) | 0 (0.0%) |
| 20 to 24 Years | 87 (58.8%) | 12 (13.8%) |
| 25 to 29 Years | 59 (84.3%) | 16 (27.1%) |
| 30 to 34 Years | 46 (65.7%) | 5 (10.9%) |
| 35 to 44 Years | 74 (88.1%) | 10 (13.5%) |
| 45 to 54 Years | 34 (63.0%) | 19 (55.9%) |
| 55 to 59 Years | 15 (65.2%) | 5 (33.3%) |
| 60 to 64 Years | 13 (72.2%) | 0 (0.0%) |
| 65 to 74 Years | 0 (0.0%) | 0 (0.0%) |
| 75 Years and over | 0 (0.0%) | 0 (0.0%) |
| Total | 334 (65.9%) | 67 (20.1%) |
Employment Status by Educational Attainment in Alpaugh
According to labor force statistics for Alpaugh, 75.5% of individuals (241) out of the total population between 25 and 64 years of age (319) are in the labor force, with 22.8% or 55 of them being unemployed. The group with the highest labor force participation rate are those with the educational attainment of high school diploma, with 84.3% or 102 individuals in the labor force. Within the labor force, individuals with less than high school education have the highest percentage of unemployment, with 25.2% or 29 of them being unemployed.
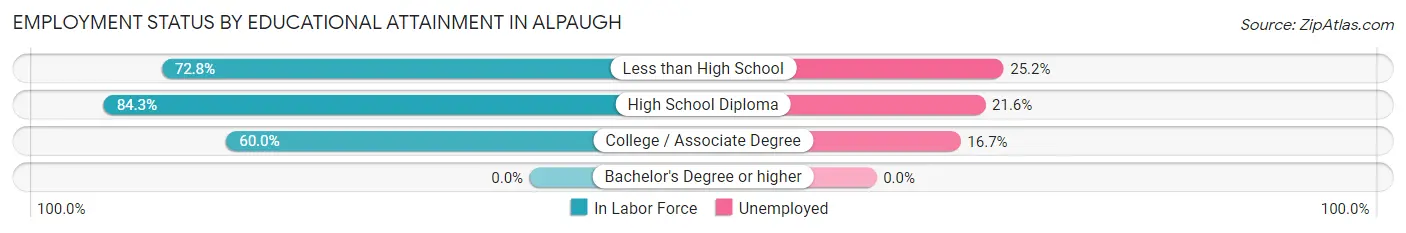
| Educational Attainment | In Labor Force | Unemployed |
| Less than High School | 115 (72.8%) | 40 (25.2%) |
| High School Diploma | 102 (84.3%) | 26 (21.6%) |
| College / Associate Degree | 24 (60.0%) | 7 (16.7%) |
| Bachelor's Degree or higher | 0 (0.0%) | 0 (0.0%) |
| Total | 241 (75.5%) | 73 (22.8%) |
Employment Occupations by Sex in Alpaugh
Management, Business, Science and Arts Occupations
The most common Management, Business, Science and Arts occupations in Alpaugh are Management (10 | 3.7%), and Health Diagnosing & Treating (5 | 1.9%).
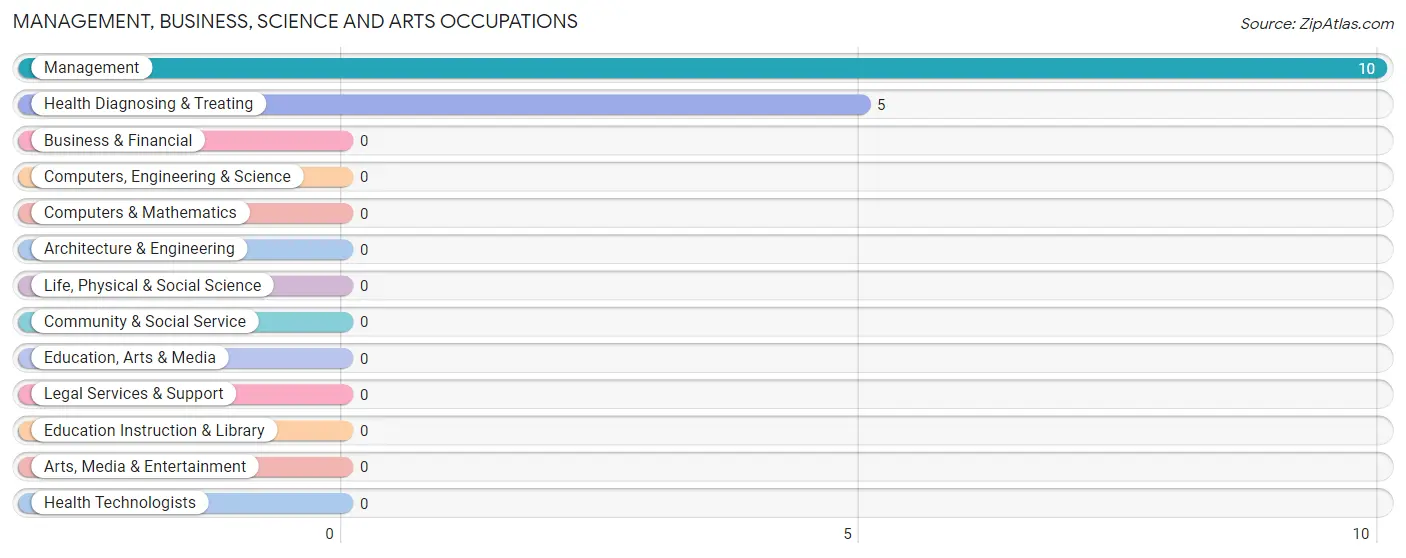
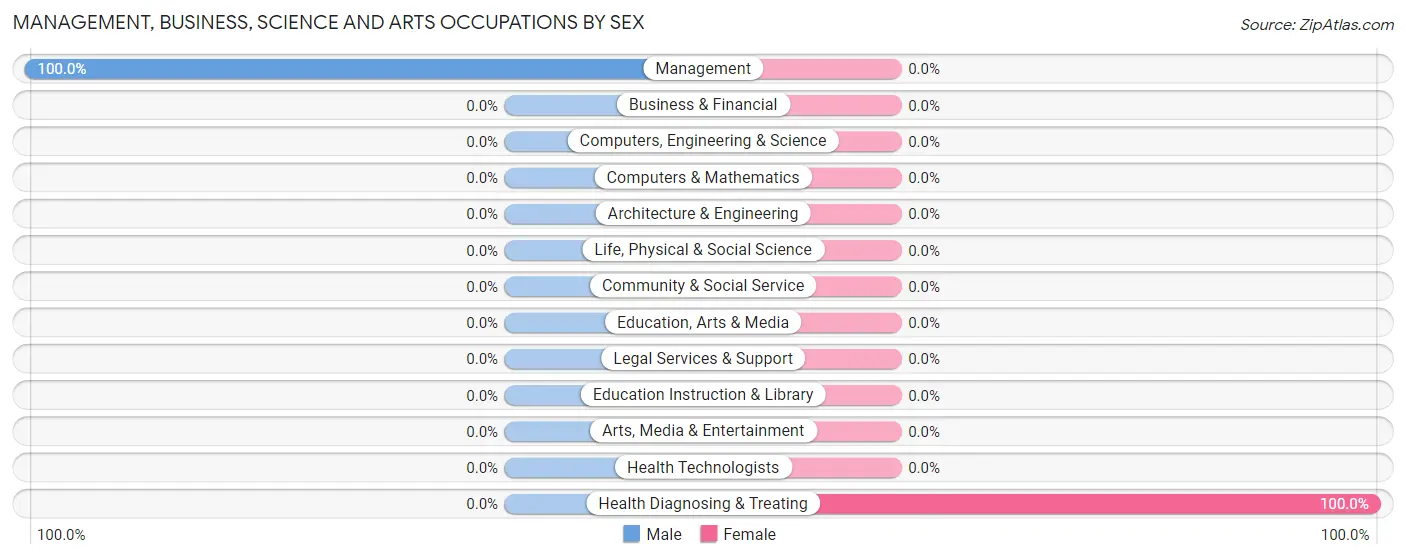
Management, Business, Science and Arts Occupations by Sex
| Occupation | Male | Female |
| Management | 10 (100.0%) | 0 (0.0%) |
| Business & Financial | 0 (0.0%) | 0 (0.0%) |
| Computers, Engineering & Science | 0 (0.0%) | 0 (0.0%) |
| Computers & Mathematics | 0 (0.0%) | 0 (0.0%) |
| Architecture & Engineering | 0 (0.0%) | 0 (0.0%) |
| Life, Physical & Social Science | 0 (0.0%) | 0 (0.0%) |
| Community & Social Service | 0 (0.0%) | 0 (0.0%) |
| Education, Arts & Media | 0 (0.0%) | 0 (0.0%) |
| Legal Services & Support | 0 (0.0%) | 0 (0.0%) |
| Education Instruction & Library | 0 (0.0%) | 0 (0.0%) |
| Arts, Media & Entertainment | 0 (0.0%) | 0 (0.0%) |
| Health Diagnosing & Treating | 0 (0.0%) | 5 (100.0%) |
| Health Technologists | 0 (0.0%) | 0 (0.0%) |
| Total (Category) | 10 (66.7%) | 5 (33.3%) |
| Total (Overall) | 195 (73.0%) | 72 (27.0%) |
Services Occupations
The most common Services occupations in Alpaugh are Food Preparation & Serving (27 | 10.1%), Healthcare Support (10 | 3.7%), and Cleaning & Maintenance (5 | 1.9%).
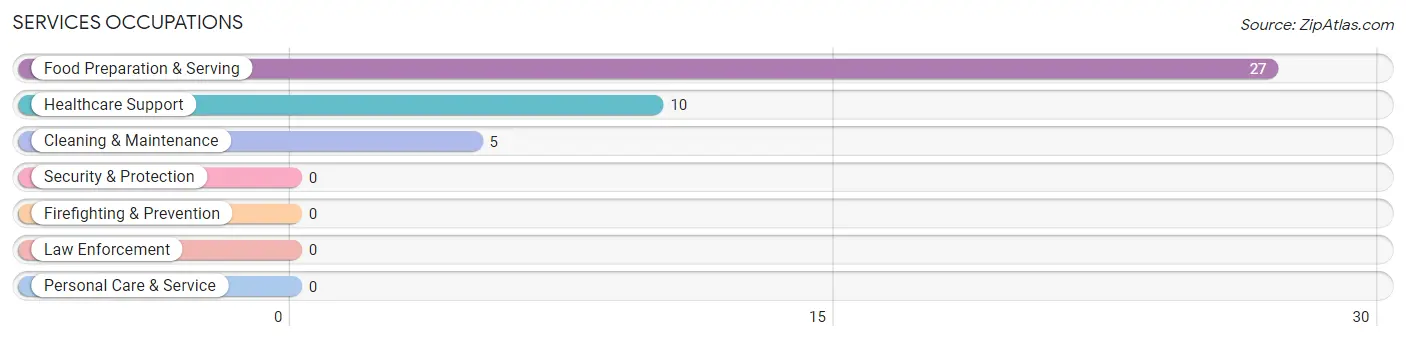
Services Occupations by Sex
Within the Services occupations in Alpaugh, the most male-oriented occupations are Cleaning & Maintenance (100.0%), and Food Preparation & Serving (40.7%), while the most female-oriented occupations are Healthcare Support (100.0%), and Food Preparation & Serving (59.3%).

| Occupation | Male | Female |
| Healthcare Support | 0 (0.0%) | 10 (100.0%) |
| Security & Protection | 0 (0.0%) | 0 (0.0%) |
| Firefighting & Prevention | 0 (0.0%) | 0 (0.0%) |
| Law Enforcement | 0 (0.0%) | 0 (0.0%) |
| Food Preparation & Serving | 11 (40.7%) | 16 (59.3%) |
| Cleaning & Maintenance | 5 (100.0%) | 0 (0.0%) |
| Personal Care & Service | 0 (0.0%) | 0 (0.0%) |
| Total (Category) | 16 (38.1%) | 26 (61.9%) |
| Total (Overall) | 195 (73.0%) | 72 (27.0%) |
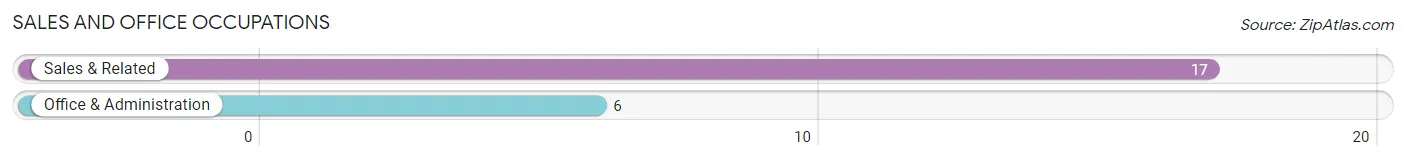
Sales and Office Occupations
The most common Sales and Office occupations in Alpaugh are Sales & Related (17 | 6.4%), and Office & Administration (6 | 2.2%).
Sales and Office Occupations by Sex
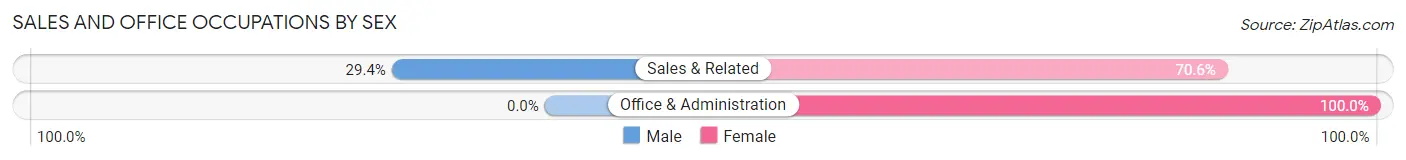
| Occupation | Male | Female |
| Sales & Related | 5 (29.4%) | 12 (70.6%) |
| Office & Administration | 0 (0.0%) | 6 (100.0%) |
| Total (Category) | 5 (21.7%) | 18 (78.3%) |
| Total (Overall) | 195 (73.0%) | 72 (27.0%) |
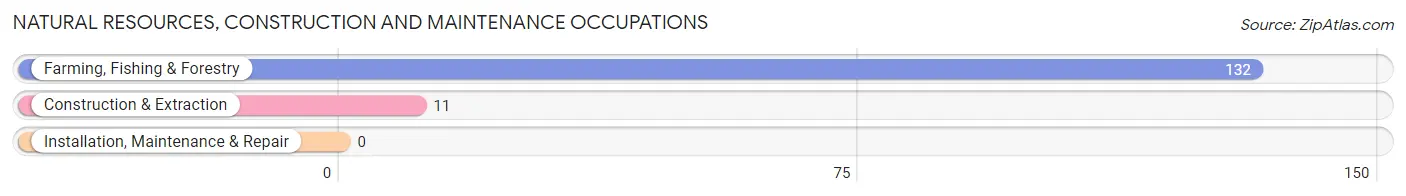
Natural Resources, Construction and Maintenance Occupations
The most common Natural Resources, Construction and Maintenance occupations in Alpaugh are Farming, Fishing & Forestry (132 | 49.4%), and Construction & Extraction (11 | 4.1%).
Natural Resources, Construction and Maintenance Occupations by Sex
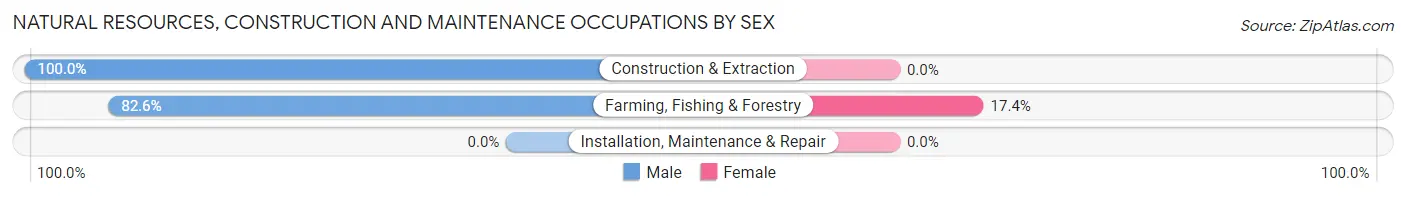
| Occupation | Male | Female |
| Farming, Fishing & Forestry | 109 (82.6%) | 23 (17.4%) |
| Construction & Extraction | 11 (100.0%) | 0 (0.0%) |
| Installation, Maintenance & Repair | 0 (0.0%) | 0 (0.0%) |
| Total (Category) | 120 (83.9%) | 23 (16.1%) |
| Total (Overall) | 195 (73.0%) | 72 (27.0%) |
Production, Transportation and Moving Occupations
The most common Production, Transportation and Moving occupations in Alpaugh are Production (18 | 6.7%), Material Moving (16 | 6.0%), and Transportation (10 | 3.7%).
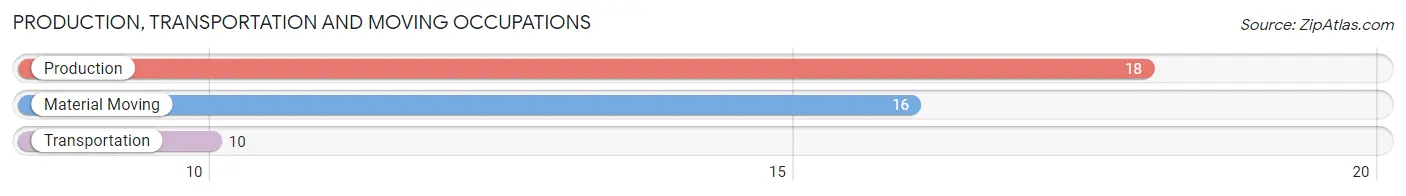
Production, Transportation and Moving Occupations by Sex
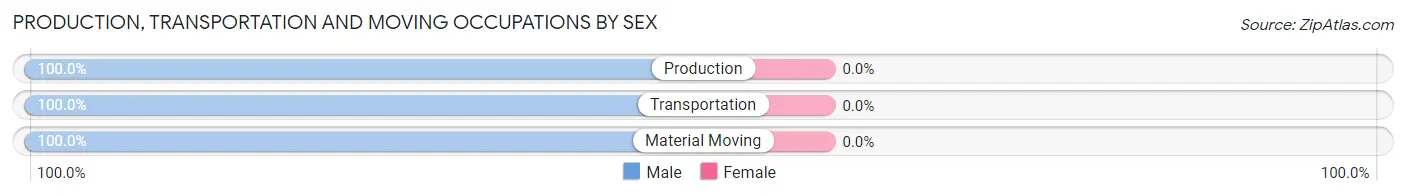
| Occupation | Male | Female |
| Production | 18 (100.0%) | 0 (0.0%) |
| Transportation | 10 (100.0%) | 0 (0.0%) |
| Material Moving | 16 (100.0%) | 0 (0.0%) |
| Total (Category) | 44 (100.0%) | 0 (0.0%) |
| Total (Overall) | 195 (73.0%) | 72 (27.0%) |
Employment Industries by Sex in Alpaugh
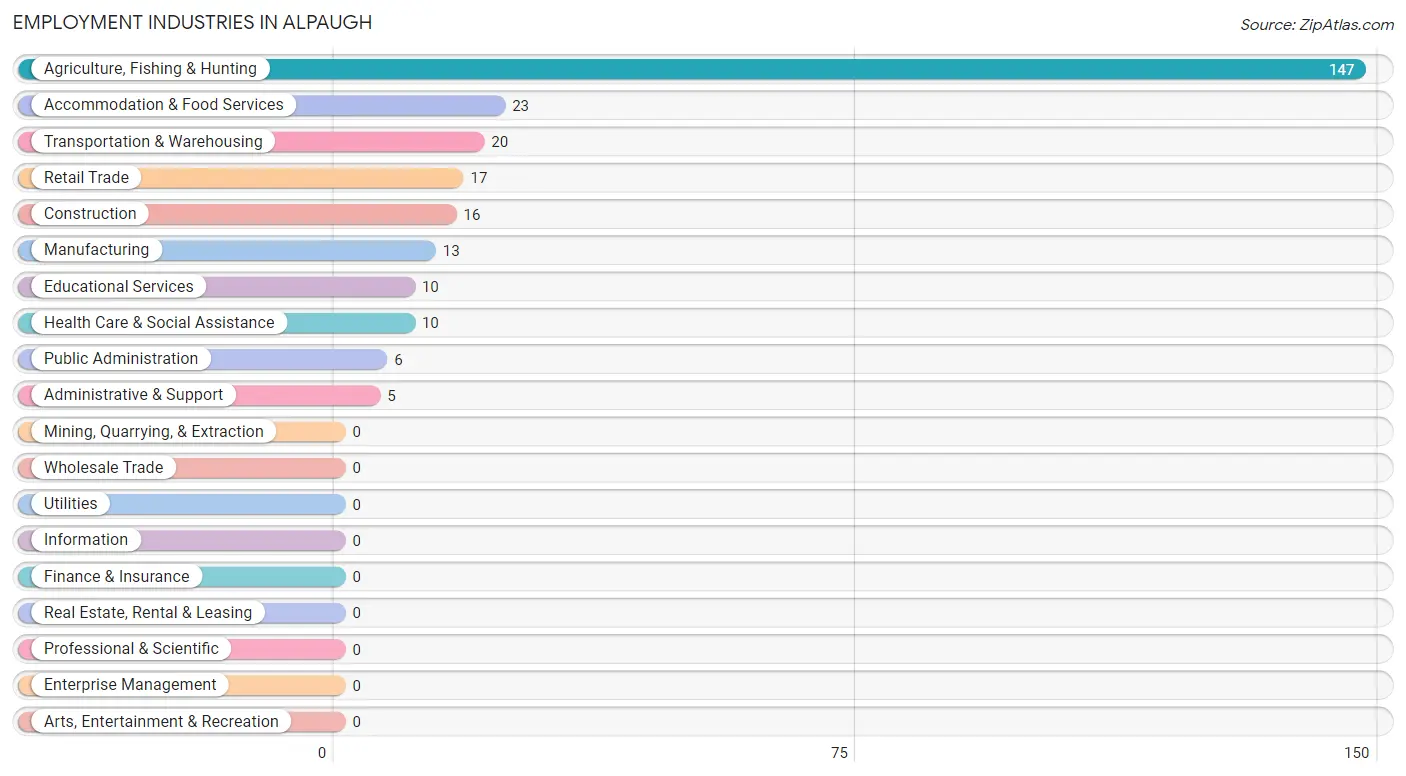
Employment Industries in Alpaugh
The major employment industries in Alpaugh include Agriculture, Fishing & Hunting (147 | 55.1%), Accommodation & Food Services (23 | 8.6%), Transportation & Warehousing (20 | 7.5%), Retail Trade (17 | 6.4%), and Construction (16 | 6.0%).
Employment Industries by Sex in Alpaugh
The Alpaugh industries that see more men than women are Construction (100.0%), Manufacturing (100.0%), and Transportation & Warehousing (100.0%), whereas the industries that tend to have a higher number of women are Administrative & Support (100.0%), Educational Services (100.0%), and Health Care & Social Assistance (100.0%).
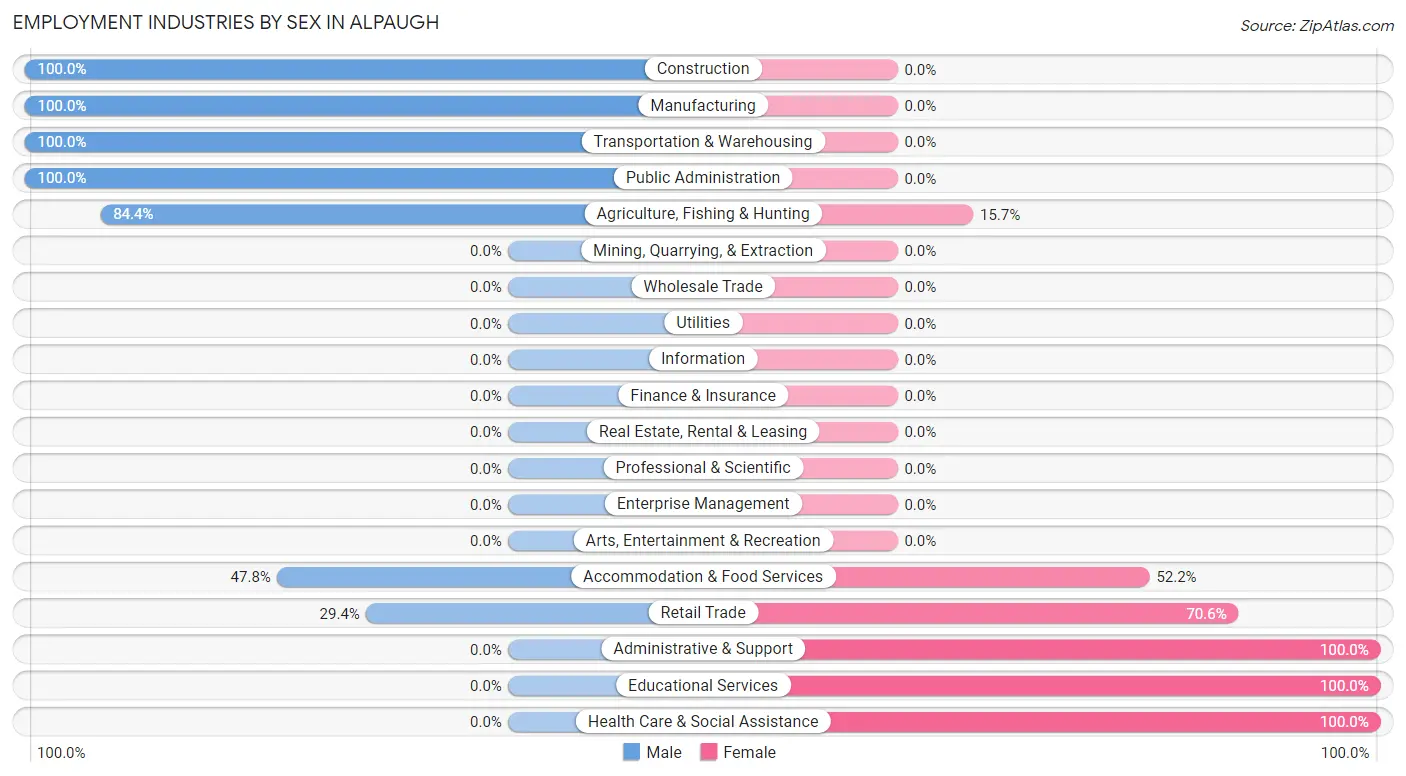
| Industry | Male | Female |
| Agriculture, Fishing & Hunting | 124 (84.4%) | 23 (15.7%) |
| Mining, Quarrying, & Extraction | 0 (0.0%) | 0 (0.0%) |
| Construction | 16 (100.0%) | 0 (0.0%) |
| Manufacturing | 13 (100.0%) | 0 (0.0%) |
| Wholesale Trade | 0 (0.0%) | 0 (0.0%) |
| Retail Trade | 5 (29.4%) | 12 (70.6%) |
| Transportation & Warehousing | 20 (100.0%) | 0 (0.0%) |
| Utilities | 0 (0.0%) | 0 (0.0%) |
| Information | 0 (0.0%) | 0 (0.0%) |
| Finance & Insurance | 0 (0.0%) | 0 (0.0%) |
| Real Estate, Rental & Leasing | 0 (0.0%) | 0 (0.0%) |
| Professional & Scientific | 0 (0.0%) | 0 (0.0%) |
| Enterprise Management | 0 (0.0%) | 0 (0.0%) |
| Administrative & Support | 0 (0.0%) | 5 (100.0%) |
| Educational Services | 0 (0.0%) | 10 (100.0%) |
| Health Care & Social Assistance | 0 (0.0%) | 10 (100.0%) |
| Arts, Entertainment & Recreation | 0 (0.0%) | 0 (0.0%) |
| Accommodation & Food Services | 11 (47.8%) | 12 (52.2%) |
| Public Administration | 6 (100.0%) | 0 (0.0%) |
| Total | 195 (73.0%) | 72 (27.0%) |
Education in Alpaugh
School Enrollment in Alpaugh
The most common levels of schooling among the 259 students in Alpaugh are elementary school (65 | 25.1%), high school (63 | 24.3%), and middle school (58 | 22.4%).
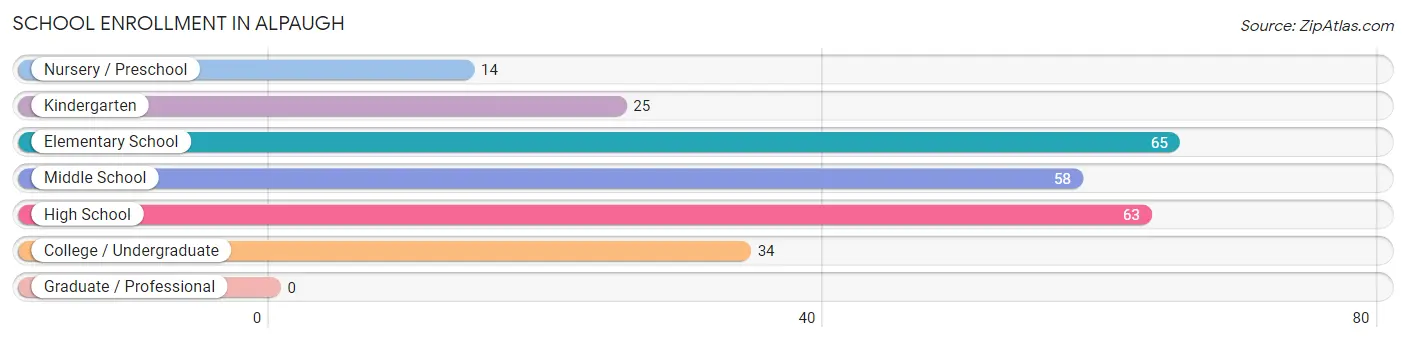
| School Level | # Students | % Students |
| Nursery / Preschool | 14 | 5.4% |
| Kindergarten | 25 | 9.7% |
| Elementary School | 65 | 25.1% |
| Middle School | 58 | 22.4% |
| High School | 63 | 24.3% |
| College / Undergraduate | 34 | 13.1% |
| Graduate / Professional | 0 | 0.0% |
| Total | 259 | 100.0% |
School Enrollment by Age by Funding Source in Alpaugh
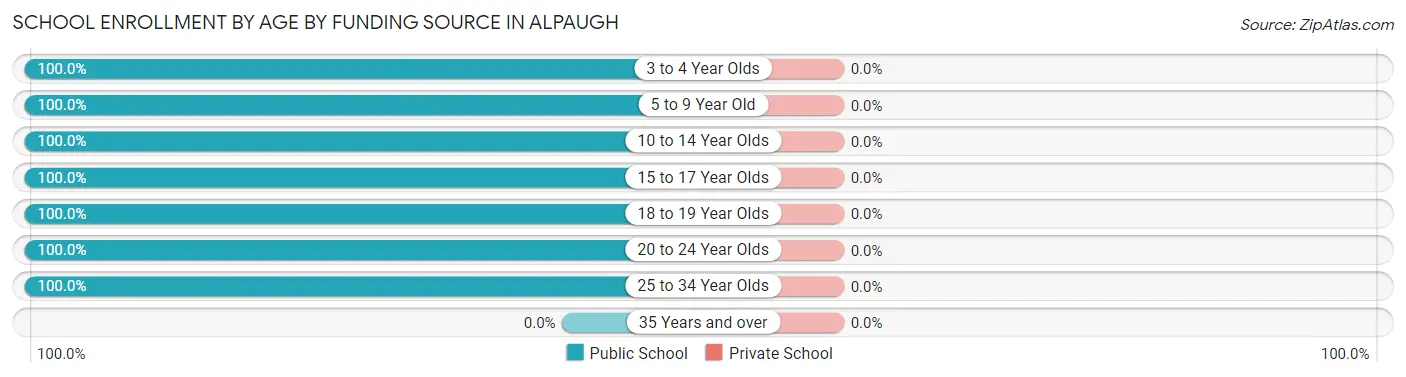
| Age Bracket | Public School | Private School |
| 3 to 4 Year Olds | 10 (100.0%) | 0 (0.0%) |
| 5 to 9 Year Old | 89 (100.0%) | 0 (0.0%) |
| 10 to 14 Year Olds | 60 (100.0%) | 0 (0.0%) |
| 15 to 17 Year Olds | 15 (100.0%) | 0 (0.0%) |
| 18 to 19 Year Olds | 12 (100.0%) | 0 (0.0%) |
| 20 to 24 Year Olds | 67 (100.0%) | 0 (0.0%) |
| 25 to 34 Year Olds | 6 (100.0%) | 0 (0.0%) |
| 35 Years and over | 0 (0.0%) | 0 (0.0%) |
| Total | 259 (100.0%) | 0 (0.0%) |
Educational Attainment by Field of Study in Alpaugh
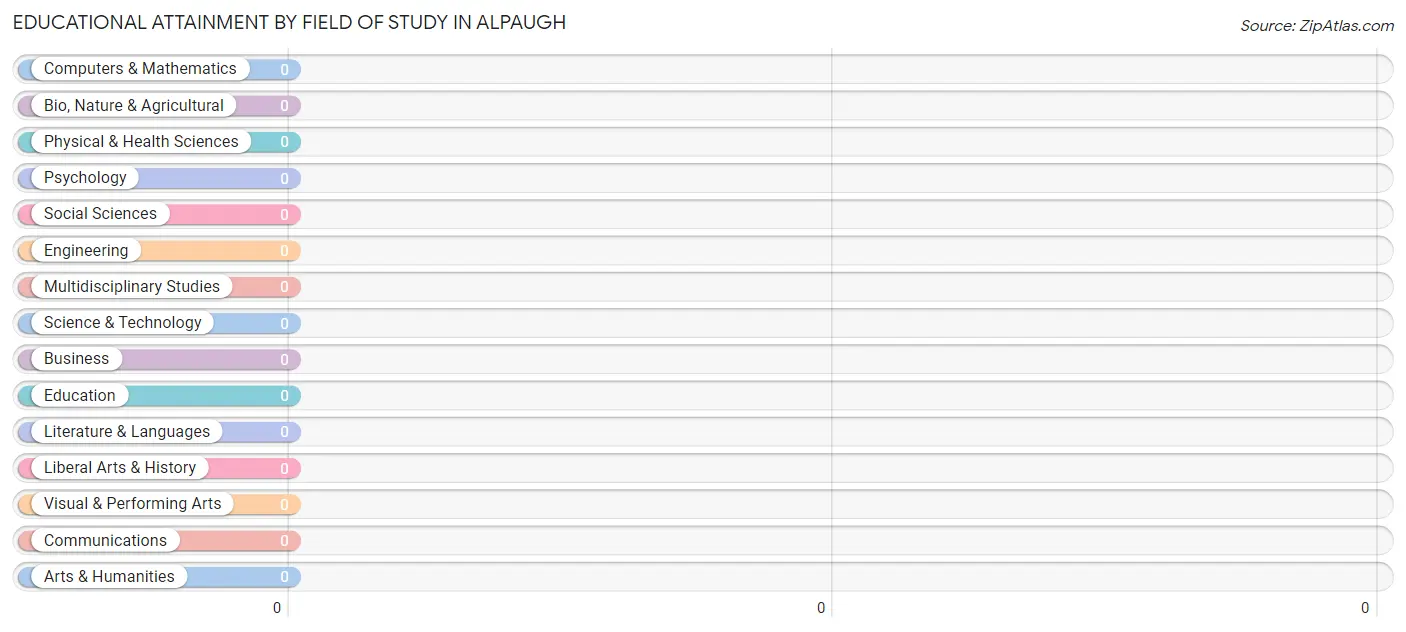
| Field of Study | # Graduates | % Graduates |
| Computers & Mathematics | 0 | 0.0% |
| Bio, Nature & Agricultural | 0 | 0.0% |
| Physical & Health Sciences | 0 | 0.0% |
| Psychology | 0 | 0.0% |
| Social Sciences | 0 | 0.0% |
| Engineering | 0 | 0.0% |
| Multidisciplinary Studies | 0 | 0.0% |
| Science & Technology | 0 | 0.0% |
| Business | 0 | 0.0% |
| Education | 0 | 0.0% |
| Literature & Languages | 0 | 0.0% |
| Liberal Arts & History | 0 | 0.0% |
| Visual & Performing Arts | 0 | 0.0% |
| Communications | 0 | 0.0% |
| Arts & Humanities | 0 | 0.0% |
| Total | 0 | 0.0% |
Transportation & Commute in Alpaugh
Vehicle Availability by Sex in Alpaugh
The most prevalent vehicle ownership categories in Alpaugh are males with 2 vehicles (81, accounting for 42.6%) and females with 2 vehicles (23, making up 119.1%).
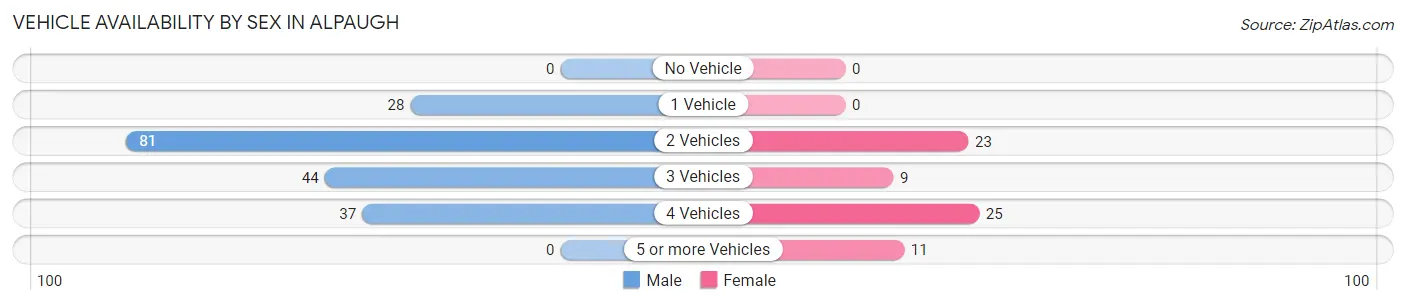
| Vehicles Available | Male | Female |
| No Vehicle | 0 (0.0%) | 0 (0.0%) |
| 1 Vehicle | 28 (14.7%) | 0 (0.0%) |
| 2 Vehicles | 81 (42.6%) | 23 (33.8%) |
| 3 Vehicles | 44 (23.2%) | 9 (13.2%) |
| 4 Vehicles | 37 (19.5%) | 25 (36.8%) |
| 5 or more Vehicles | 0 (0.0%) | 11 (16.2%) |
| Total | 190 (100.0%) | 68 (100.0%) |
Commute Time in Alpaugh
The most frequently occuring commute durations in Alpaugh are 30 to 34 minutes (95 commuters, 36.8%), 45 to 59 minutes (57 commuters, 22.1%), and 40 to 44 minutes (29 commuters, 11.2%).
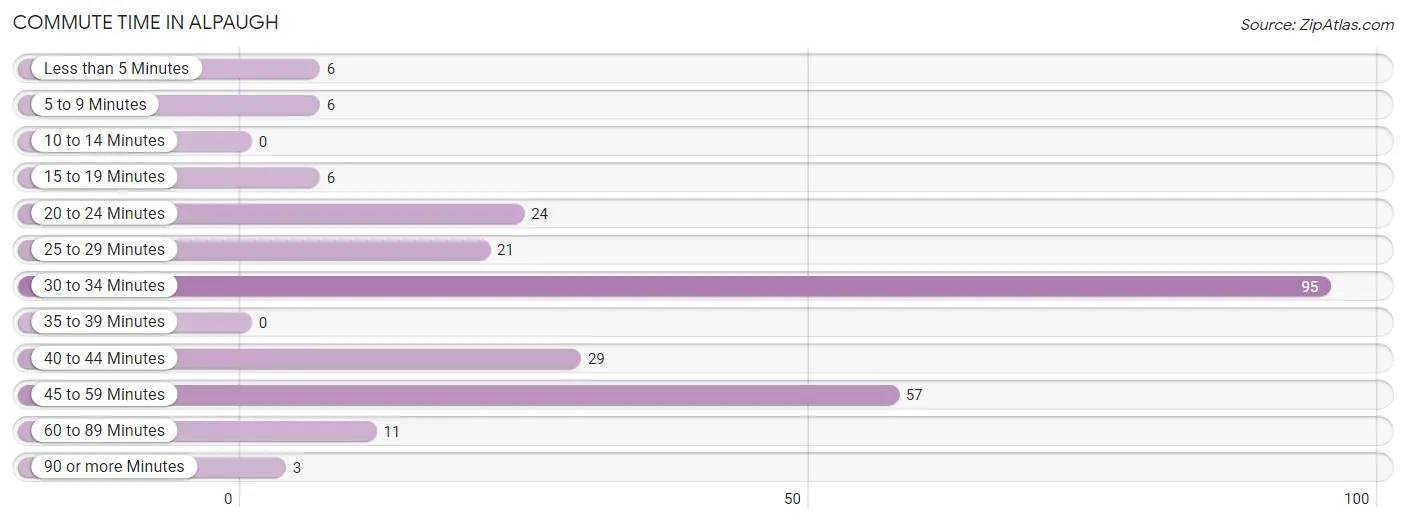
| Commute Time | # Commuters | % Commuters |
| Less than 5 Minutes | 6 | 2.3% |
| 5 to 9 Minutes | 6 | 2.3% |
| 10 to 14 Minutes | 0 | 0.0% |
| 15 to 19 Minutes | 6 | 2.3% |
| 20 to 24 Minutes | 24 | 9.3% |
| 25 to 29 Minutes | 21 | 8.1% |
| 30 to 34 Minutes | 95 | 36.8% |
| 35 to 39 Minutes | 0 | 0.0% |
| 40 to 44 Minutes | 29 | 11.2% |
| 45 to 59 Minutes | 57 | 22.1% |
| 60 to 89 Minutes | 11 | 4.3% |
| 90 or more Minutes | 3 | 1.2% |
Commute Time by Sex in Alpaugh
The most common commute times in Alpaugh are 30 to 34 minutes (72 commuters, 37.9%) for males and 30 to 34 minutes (23 commuters, 33.8%) for females.
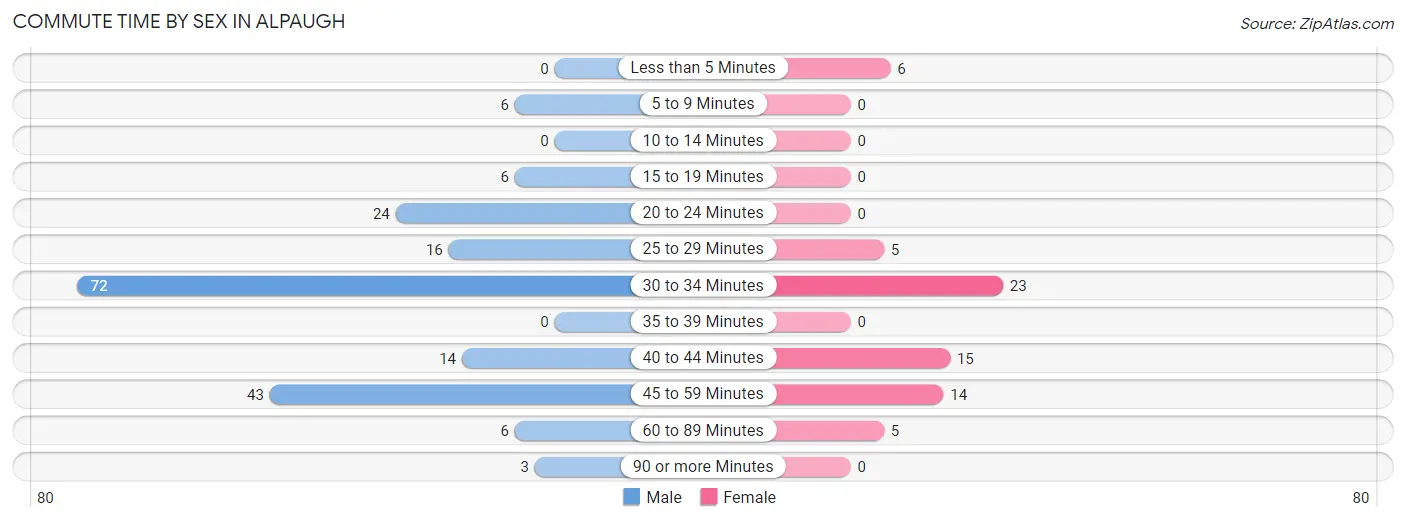
| Commute Time | Male | Female |
| Less than 5 Minutes | 0 (0.0%) | 6 (8.8%) |
| 5 to 9 Minutes | 6 (3.2%) | 0 (0.0%) |
| 10 to 14 Minutes | 0 (0.0%) | 0 (0.0%) |
| 15 to 19 Minutes | 6 (3.2%) | 0 (0.0%) |
| 20 to 24 Minutes | 24 (12.6%) | 0 (0.0%) |
| 25 to 29 Minutes | 16 (8.4%) | 5 (7.3%) |
| 30 to 34 Minutes | 72 (37.9%) | 23 (33.8%) |
| 35 to 39 Minutes | 0 (0.0%) | 0 (0.0%) |
| 40 to 44 Minutes | 14 (7.4%) | 15 (22.1%) |
| 45 to 59 Minutes | 43 (22.6%) | 14 (20.6%) |
| 60 to 89 Minutes | 6 (3.2%) | 5 (7.3%) |
| 90 or more Minutes | 3 (1.6%) | 0 (0.0%) |
Time of Departure to Work by Sex in Alpaugh
The most frequent times of departure to work in Alpaugh are 6:00 AM to 6:29 AM (66, 34.7%) for males and 5:30 AM to 5:59 AM (21, 30.9%) for females.
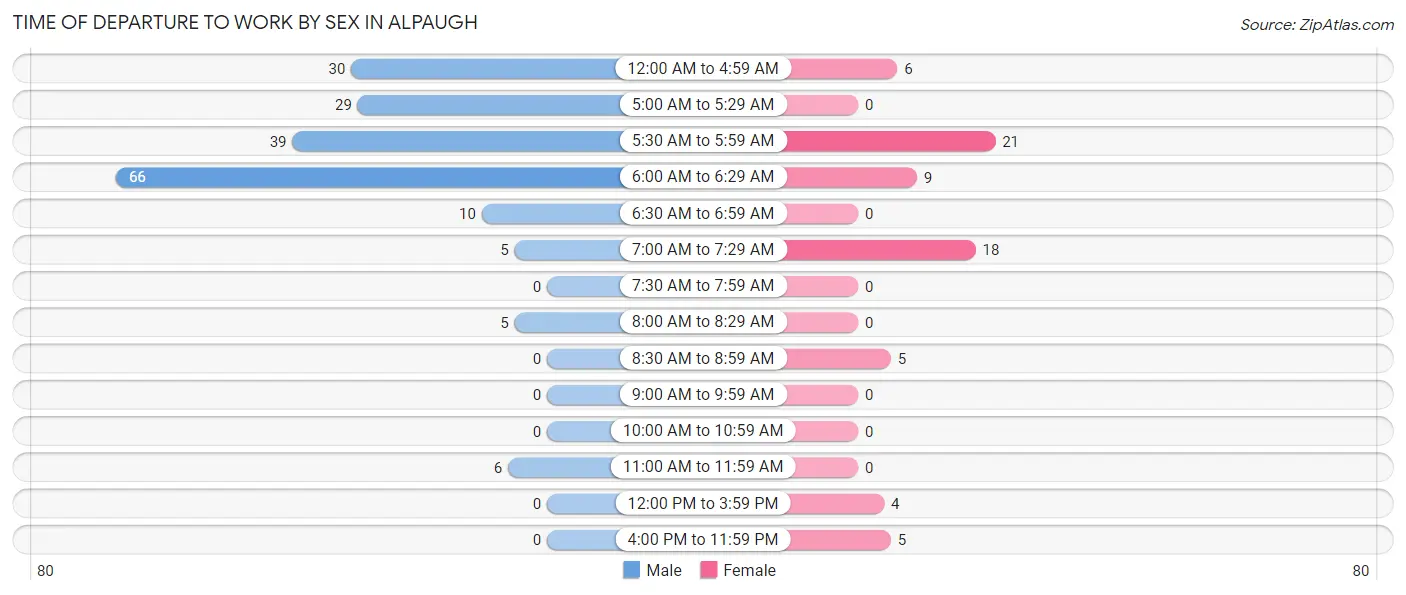
| Time of Departure | Male | Female |
| 12:00 AM to 4:59 AM | 30 (15.8%) | 6 (8.8%) |
| 5:00 AM to 5:29 AM | 29 (15.3%) | 0 (0.0%) |
| 5:30 AM to 5:59 AM | 39 (20.5%) | 21 (30.9%) |
| 6:00 AM to 6:29 AM | 66 (34.7%) | 9 (13.2%) |
| 6:30 AM to 6:59 AM | 10 (5.3%) | 0 (0.0%) |
| 7:00 AM to 7:29 AM | 5 (2.6%) | 18 (26.5%) |
| 7:30 AM to 7:59 AM | 0 (0.0%) | 0 (0.0%) |
| 8:00 AM to 8:29 AM | 5 (2.6%) | 0 (0.0%) |
| 8:30 AM to 8:59 AM | 0 (0.0%) | 5 (7.3%) |
| 9:00 AM to 9:59 AM | 0 (0.0%) | 0 (0.0%) |
| 10:00 AM to 10:59 AM | 0 (0.0%) | 0 (0.0%) |
| 11:00 AM to 11:59 AM | 6 (3.2%) | 0 (0.0%) |
| 12:00 PM to 3:59 PM | 0 (0.0%) | 4 (5.9%) |
| 4:00 PM to 11:59 PM | 0 (0.0%) | 5 (7.3%) |
| Total | 190 (100.0%) | 68 (100.0%) |
Housing Occupancy in Alpaugh
Occupancy by Ownership in Alpaugh
Of the total 199 dwellings in Alpaugh, owner-occupied units account for 66 (33.2%), while renter-occupied units make up 133 (66.8%).
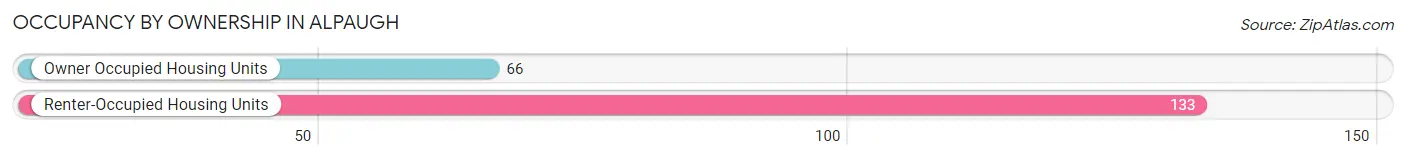
| Occupancy | # Housing Units | % Housing Units |
| Owner Occupied Housing Units | 66 | 33.2% |
| Renter-Occupied Housing Units | 133 | 66.8% |
| Total Occupied Housing Units | 199 | 100.0% |
Occupancy by Household Size in Alpaugh
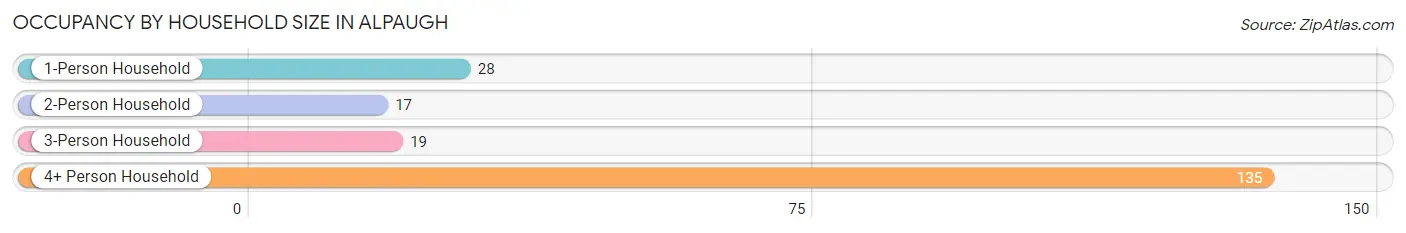
| Household Size | # Housing Units | % Housing Units |
| 1-Person Household | 28 | 14.1% |
| 2-Person Household | 17 | 8.5% |
| 3-Person Household | 19 | 9.6% |
| 4+ Person Household | 135 | 67.8% |
| Total Housing Units | 199 | 100.0% |
Occupancy by Ownership by Household Size in Alpaugh
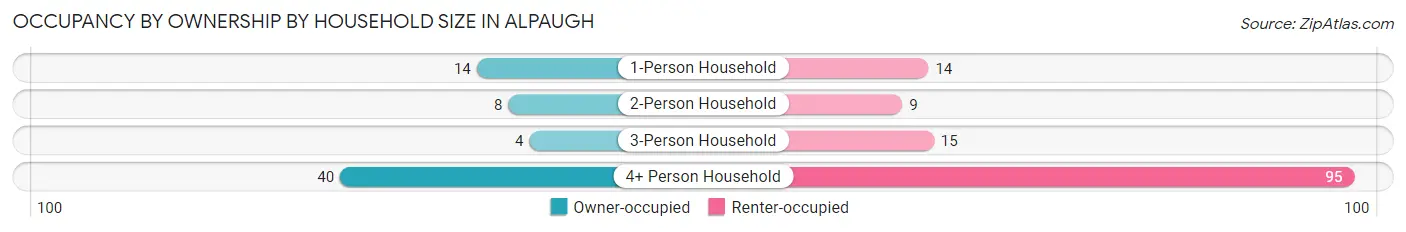
| Household Size | Owner-occupied | Renter-occupied |
| 1-Person Household | 14 (50.0%) | 14 (50.0%) |
| 2-Person Household | 8 (47.1%) | 9 (52.9%) |
| 3-Person Household | 4 (21.0%) | 15 (78.9%) |
| 4+ Person Household | 40 (29.6%) | 95 (70.4%) |
| Total Housing Units | 66 (33.2%) | 133 (66.8%) |
Occupancy by Educational Attainment in Alpaugh
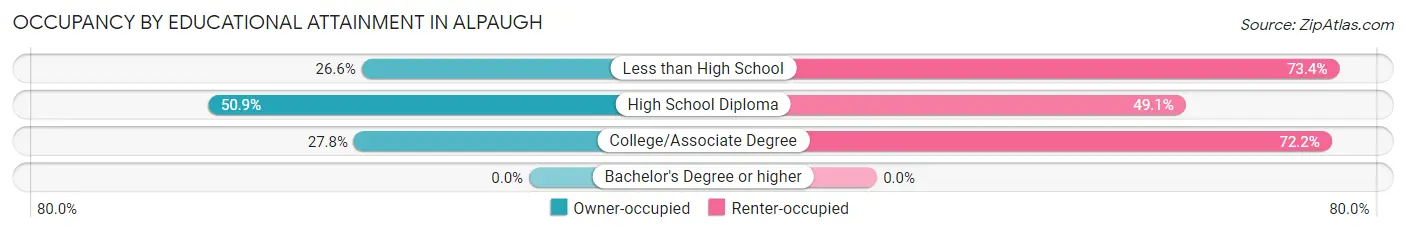
| Household Size | Owner-occupied | Renter-occupied |
| Less than High School | 34 (26.6%) | 94 (73.4%) |
| High School Diploma | 27 (50.9%) | 26 (49.1%) |
| College/Associate Degree | 5 (27.8%) | 13 (72.2%) |
| Bachelor's Degree or higher | 0 (0.0%) | 0 (0.0%) |
Occupancy by Age of Householder in Alpaugh
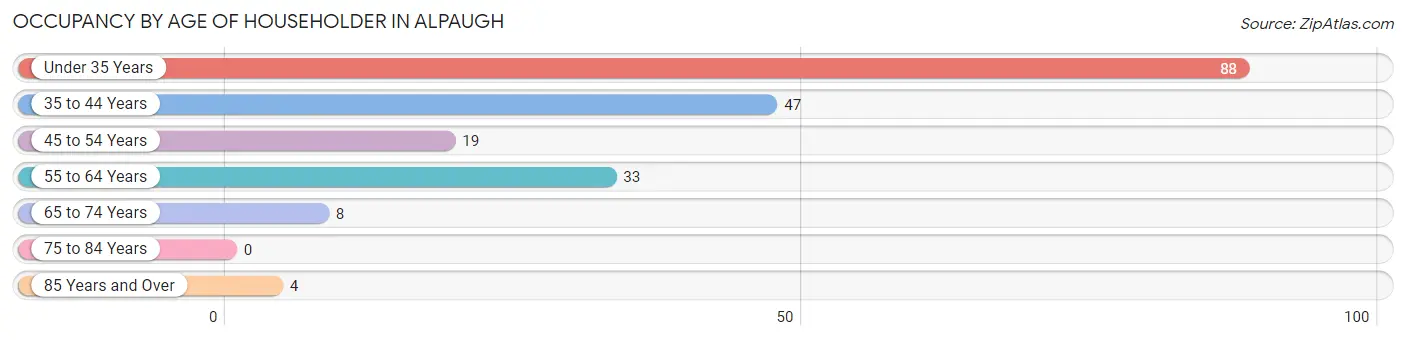
| Age Bracket | # Households | % Households |
| Under 35 Years | 88 | 44.2% |
| 35 to 44 Years | 47 | 23.6% |
| 45 to 54 Years | 19 | 9.6% |
| 55 to 64 Years | 33 | 16.6% |
| 65 to 74 Years | 8 | 4.0% |
| 75 to 84 Years | 0 | 0.0% |
| 85 Years and Over | 4 | 2.0% |
| Total | 199 | 100.0% |
Housing Finances in Alpaugh
Median Income by Occupancy in Alpaugh
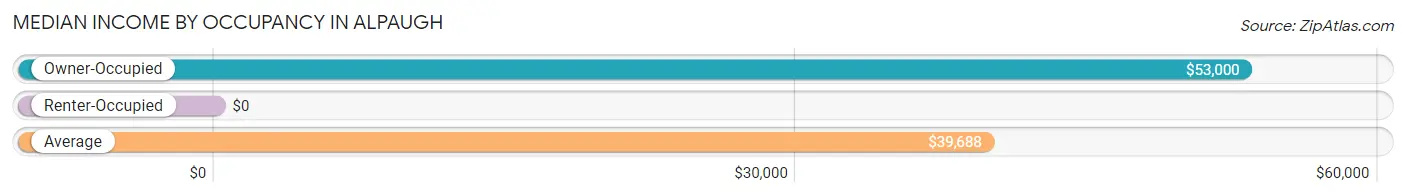
| Occupancy Type | # Households | Median Income |
| Owner-Occupied | 66 (33.2%) | $53,000 |
| Renter-Occupied | 133 (66.8%) | $0 |
| Average | 199 (100.0%) | $39,688 |
Occupancy by Householder Income Bracket in Alpaugh
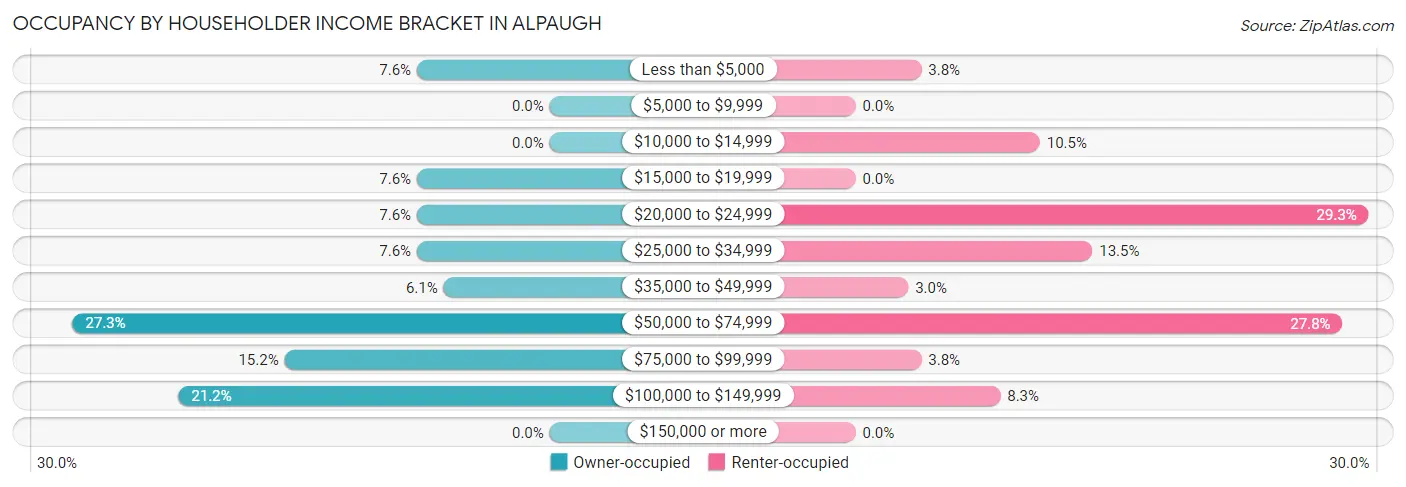
| Income Bracket | Owner-occupied | Renter-occupied |
| Less than $5,000 | 5 (7.6%) | 5 (3.8%) |
| $5,000 to $9,999 | 0 (0.0%) | 0 (0.0%) |
| $10,000 to $14,999 | 0 (0.0%) | 14 (10.5%) |
| $15,000 to $19,999 | 5 (7.6%) | 0 (0.0%) |
| $20,000 to $24,999 | 5 (7.6%) | 39 (29.3%) |
| $25,000 to $34,999 | 5 (7.6%) | 18 (13.5%) |
| $35,000 to $49,999 | 4 (6.1%) | 4 (3.0%) |
| $50,000 to $74,999 | 18 (27.3%) | 37 (27.8%) |
| $75,000 to $99,999 | 10 (15.1%) | 5 (3.8%) |
| $100,000 to $149,999 | 14 (21.2%) | 11 (8.3%) |
| $150,000 or more | 0 (0.0%) | 0 (0.0%) |
| Total | 66 (100.0%) | 133 (100.0%) |
Monthly Housing Cost Tiers in Alpaugh
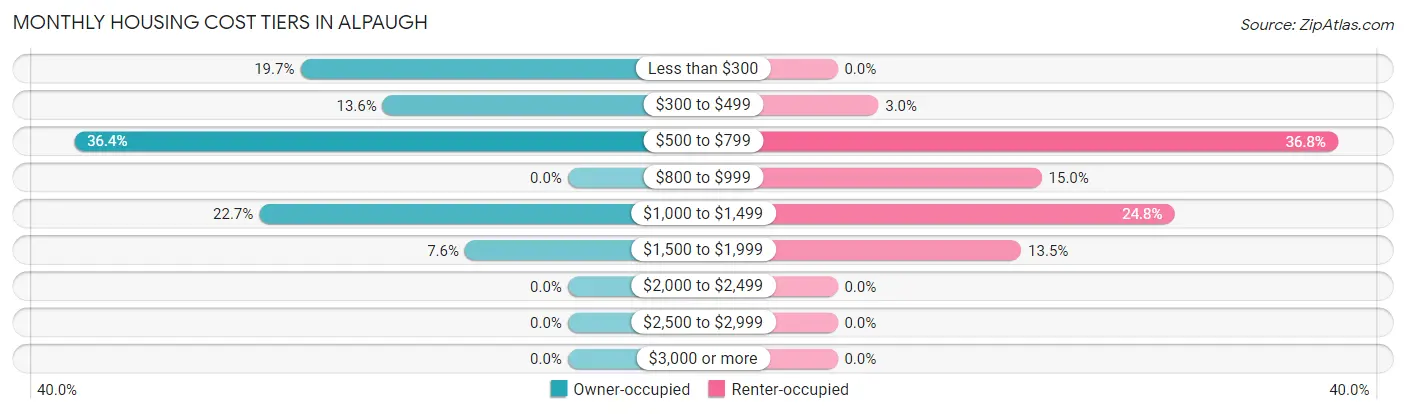
| Monthly Cost | Owner-occupied | Renter-occupied |
| Less than $300 | 13 (19.7%) | 0 (0.0%) |
| $300 to $499 | 9 (13.6%) | 4 (3.0%) |
| $500 to $799 | 24 (36.4%) | 49 (36.8%) |
| $800 to $999 | 0 (0.0%) | 20 (15.0%) |
| $1,000 to $1,499 | 15 (22.7%) | 33 (24.8%) |
| $1,500 to $1,999 | 5 (7.6%) | 18 (13.5%) |
| $2,000 to $2,499 | 0 (0.0%) | 0 (0.0%) |
| $2,500 to $2,999 | 0 (0.0%) | 0 (0.0%) |
| $3,000 or more | 0 (0.0%) | 0 (0.0%) |
| Total | 66 (100.0%) | 133 (100.0%) |
Physical Housing Characteristics in Alpaugh
Housing Structures in Alpaugh
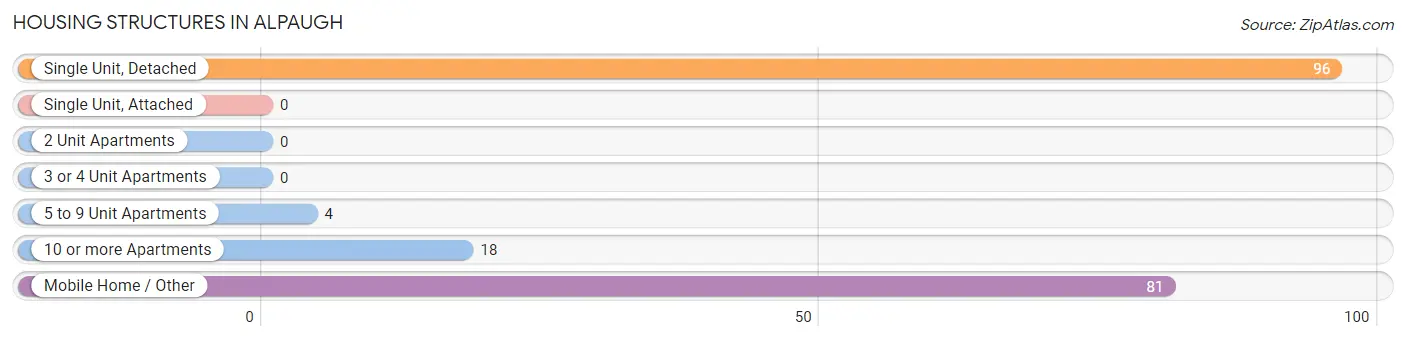
| Structure Type | # Housing Units | % Housing Units |
| Single Unit, Detached | 96 | 48.2% |
| Single Unit, Attached | 0 | 0.0% |
| 2 Unit Apartments | 0 | 0.0% |
| 3 or 4 Unit Apartments | 0 | 0.0% |
| 5 to 9 Unit Apartments | 4 | 2.0% |
| 10 or more Apartments | 18 | 9.0% |
| Mobile Home / Other | 81 | 40.7% |
| Total | 199 | 100.0% |
Housing Structures by Occupancy in Alpaugh
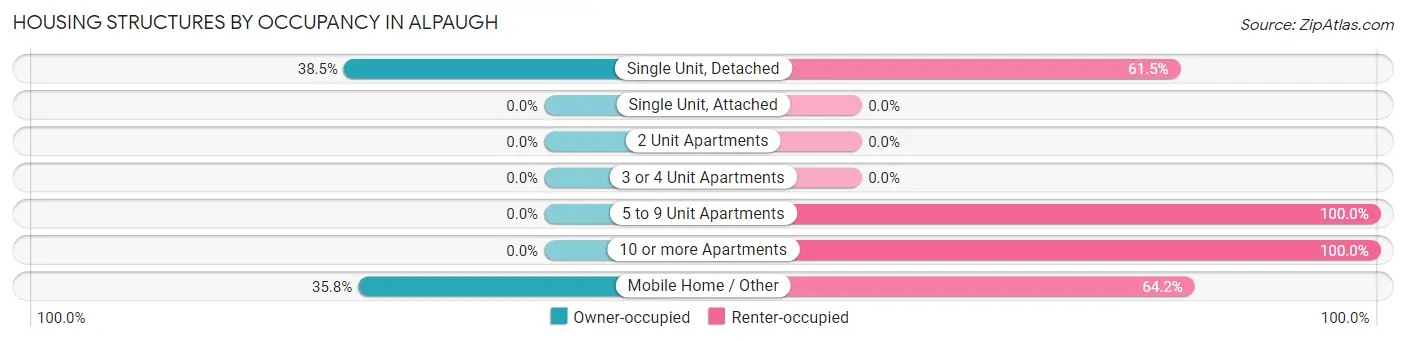
| Structure Type | Owner-occupied | Renter-occupied |
| Single Unit, Detached | 37 (38.5%) | 59 (61.5%) |
| Single Unit, Attached | 0 (0.0%) | 0 (0.0%) |
| 2 Unit Apartments | 0 (0.0%) | 0 (0.0%) |
| 3 or 4 Unit Apartments | 0 (0.0%) | 0 (0.0%) |
| 5 to 9 Unit Apartments | 0 (0.0%) | 4 (100.0%) |
| 10 or more Apartments | 0 (0.0%) | 18 (100.0%) |
| Mobile Home / Other | 29 (35.8%) | 52 (64.2%) |
| Total | 66 (33.2%) | 133 (66.8%) |
Housing Structures by Number of Rooms in Alpaugh
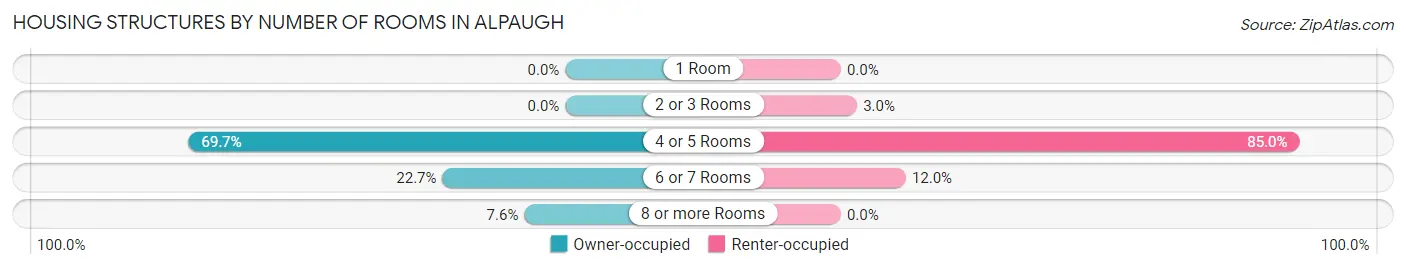
| Number of Rooms | Owner-occupied | Renter-occupied |
| 1 Room | 0 (0.0%) | 0 (0.0%) |
| 2 or 3 Rooms | 0 (0.0%) | 4 (3.0%) |
| 4 or 5 Rooms | 46 (69.7%) | 113 (85.0%) |
| 6 or 7 Rooms | 15 (22.7%) | 16 (12.0%) |
| 8 or more Rooms | 5 (7.6%) | 0 (0.0%) |
| Total | 66 (100.0%) | 133 (100.0%) |
Housing Structure by Heating Type in Alpaugh
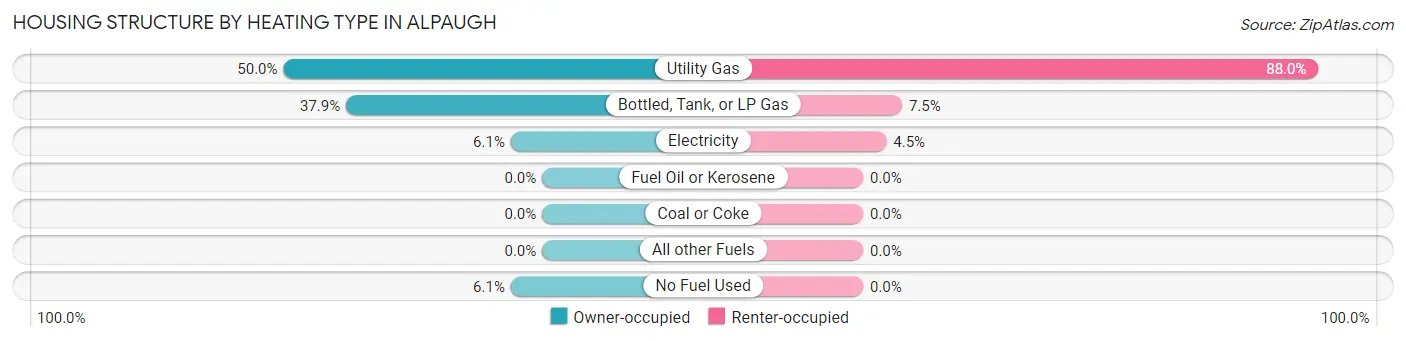
| Heating Type | Owner-occupied | Renter-occupied |
| Utility Gas | 33 (50.0%) | 117 (88.0%) |
| Bottled, Tank, or LP Gas | 25 (37.9%) | 10 (7.5%) |
| Electricity | 4 (6.1%) | 6 (4.5%) |
| Fuel Oil or Kerosene | 0 (0.0%) | 0 (0.0%) |
| Coal or Coke | 0 (0.0%) | 0 (0.0%) |
| All other Fuels | 0 (0.0%) | 0 (0.0%) |
| No Fuel Used | 4 (6.1%) | 0 (0.0%) |
| Total | 66 (100.0%) | 133 (100.0%) |
Household Vehicle Usage in Alpaugh
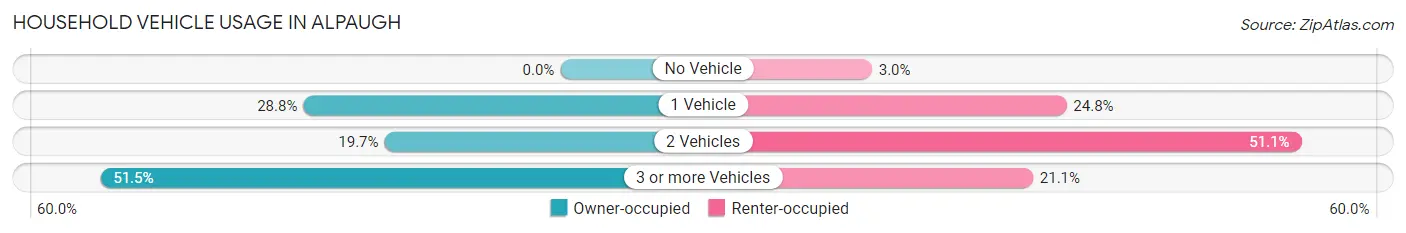
| Vehicles per Household | Owner-occupied | Renter-occupied |
| No Vehicle | 0 (0.0%) | 4 (3.0%) |
| 1 Vehicle | 19 (28.8%) | 33 (24.8%) |
| 2 Vehicles | 13 (19.7%) | 68 (51.1%) |
| 3 or more Vehicles | 34 (51.5%) | 28 (21.0%) |
| Total | 66 (100.0%) | 133 (100.0%) |
Real Estate & Mortgages in Alpaugh
Real Estate and Mortgage Overview in Alpaugh
| Characteristic | Without Mortgage | With Mortgage |
| Housing Units | 46 | 20 |
| Median Property Value | $82,200 | $90,000 |
| Median Household Income | $63,000 | $0 |
| Monthly Housing Costs | $511 | $0 |
| Real Estate Taxes | $389 | $0 |
Property Value by Mortgage Status in Alpaugh
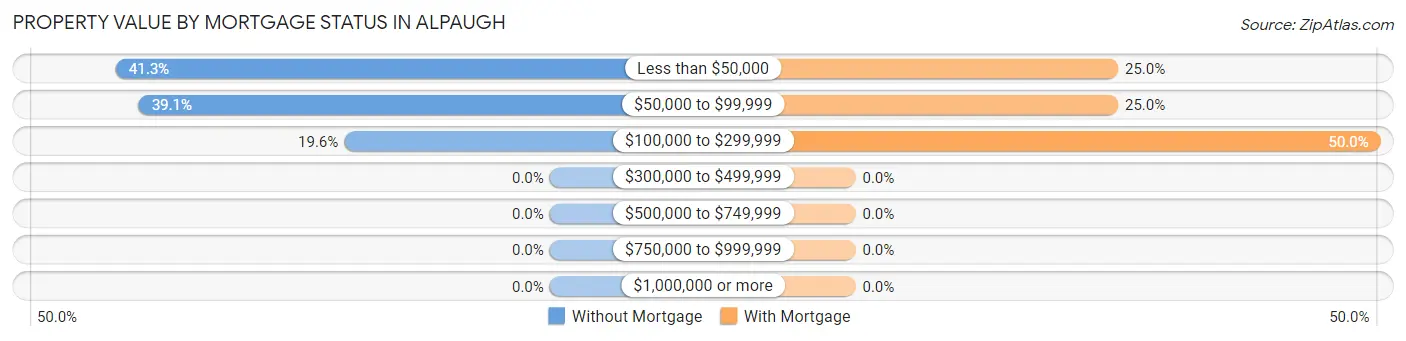
| Property Value | Without Mortgage | With Mortgage |
| Less than $50,000 | 19 (41.3%) | 5 (25.0%) |
| $50,000 to $99,999 | 18 (39.1%) | 5 (25.0%) |
| $100,000 to $299,999 | 9 (19.6%) | 10 (50.0%) |
| $300,000 to $499,999 | 0 (0.0%) | 0 (0.0%) |
| $500,000 to $749,999 | 0 (0.0%) | 0 (0.0%) |
| $750,000 to $999,999 | 0 (0.0%) | 0 (0.0%) |
| $1,000,000 or more | 0 (0.0%) | 0 (0.0%) |
| Total | 46 (100.0%) | 20 (100.0%) |
Household Income by Mortgage Status in Alpaugh
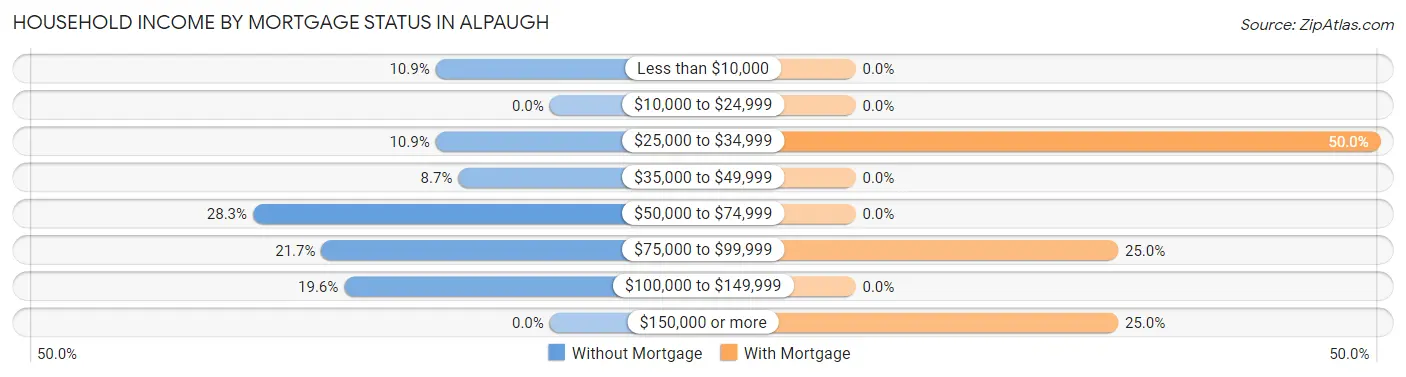
| Household Income | Without Mortgage | With Mortgage |
| Less than $10,000 | 5 (10.9%) | 0 (0.0%) |
| $10,000 to $24,999 | 0 (0.0%) | 0 (0.0%) |
| $25,000 to $34,999 | 5 (10.9%) | 10 (50.0%) |
| $35,000 to $49,999 | 4 (8.7%) | 0 (0.0%) |
| $50,000 to $74,999 | 13 (28.3%) | 0 (0.0%) |
| $75,000 to $99,999 | 10 (21.7%) | 5 (25.0%) |
| $100,000 to $149,999 | 9 (19.6%) | 0 (0.0%) |
| $150,000 or more | 0 (0.0%) | 5 (25.0%) |
| Total | 46 (100.0%) | 20 (100.0%) |
Property Value to Household Income Ratio in Alpaugh
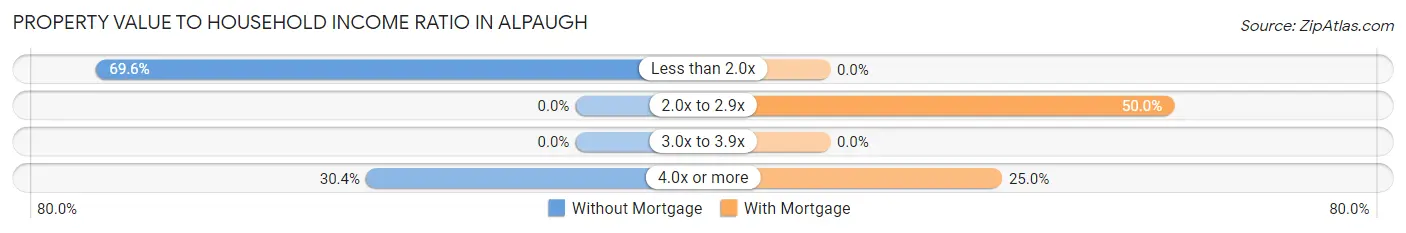
| Value-to-Income Ratio | Without Mortgage | With Mortgage |
| Less than 2.0x | 32 (69.6%) | 0 (0.0%) |
| 2.0x to 2.9x | 0 (0.0%) | 10 (50.0%) |
| 3.0x to 3.9x | 0 (0.0%) | 0 (0.0%) |
| 4.0x or more | 14 (30.4%) | 5 (25.0%) |
| Total | 46 (100.0%) | 20 (100.0%) |
Real Estate Taxes by Mortgage Status in Alpaugh
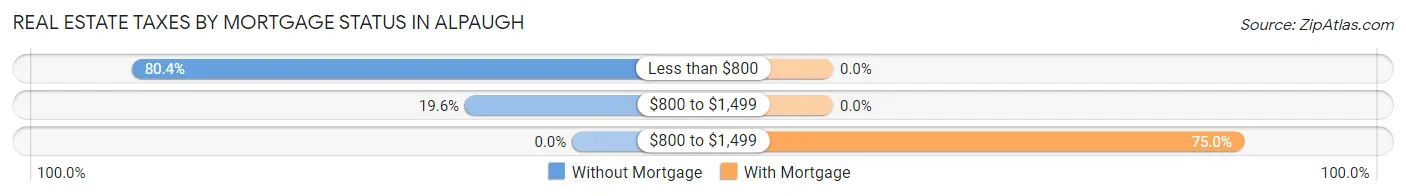
| Property Taxes | Without Mortgage | With Mortgage |
| Less than $800 | 37 (80.4%) | 0 (0.0%) |
| $800 to $1,499 | 9 (19.6%) | 0 (0.0%) |
| $800 to $1,499 | 0 (0.0%) | 15 (75.0%) |
| Total | 46 (100.0%) | 20 (100.0%) |
Health & Disability in Alpaugh
Health Insurance Coverage by Age in Alpaugh
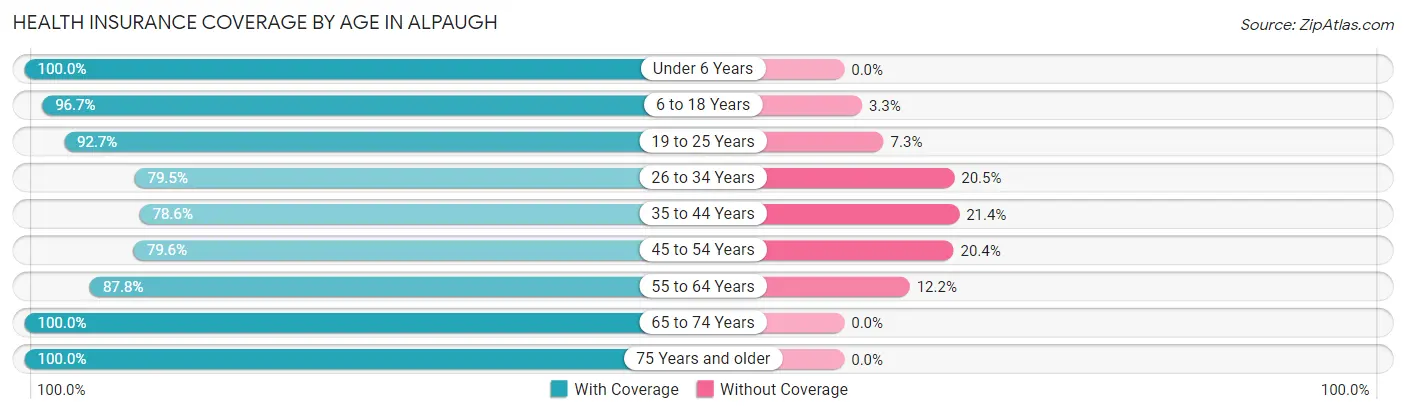
| Age Bracket | With Coverage | Without Coverage |
| Under 6 Years | 238 (100.0%) | 0 (0.0%) |
| 6 to 18 Years | 147 (96.7%) | 5 (3.3%) |
| 19 to 25 Years | 164 (92.7%) | 13 (7.3%) |
| 26 to 34 Years | 93 (79.5%) | 24 (20.5%) |
| 35 to 44 Years | 66 (78.6%) | 18 (21.4%) |
| 45 to 54 Years | 43 (79.6%) | 11 (20.4%) |
| 55 to 64 Years | 36 (87.8%) | 5 (12.2%) |
| 65 to 74 Years | 8 (100.0%) | 0 (0.0%) |
| 75 Years and older | 9 (100.0%) | 0 (0.0%) |
| Total | 804 (91.4%) | 76 (8.6%) |
Health Insurance Coverage by Citizenship Status in Alpaugh
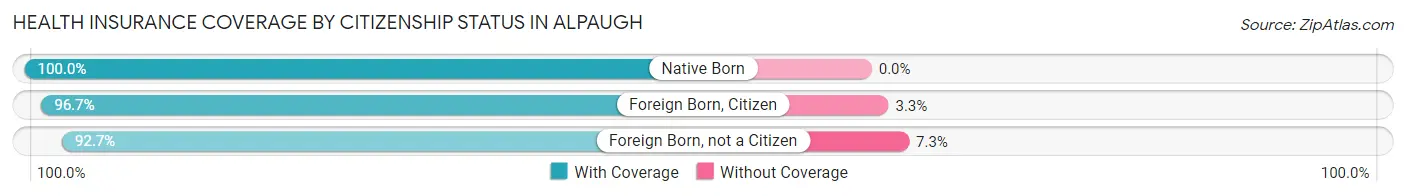
| Citizenship Status | With Coverage | Without Coverage |
| Native Born | 238 (100.0%) | 0 (0.0%) |
| Foreign Born, Citizen | 147 (96.7%) | 5 (3.3%) |
| Foreign Born, not a Citizen | 164 (92.7%) | 13 (7.3%) |
Health Insurance Coverage by Household Income in Alpaugh
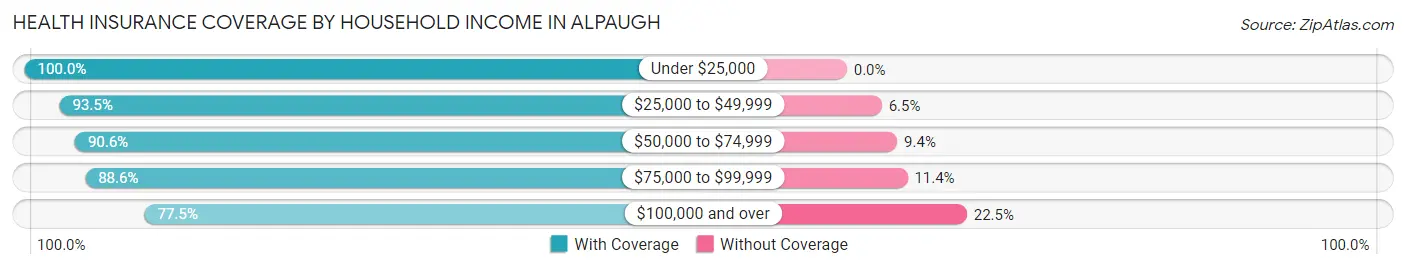
| Household Income | With Coverage | Without Coverage |
| Under $25,000 | 224 (100.0%) | 0 (0.0%) |
| $25,000 to $49,999 | 143 (93.5%) | 10 (6.5%) |
| $50,000 to $74,999 | 259 (90.6%) | 27 (9.4%) |
| $75,000 to $99,999 | 78 (88.6%) | 10 (11.4%) |
| $100,000 and over | 100 (77.5%) | 29 (22.5%) |
Public vs Private Health Insurance Coverage by Age in Alpaugh
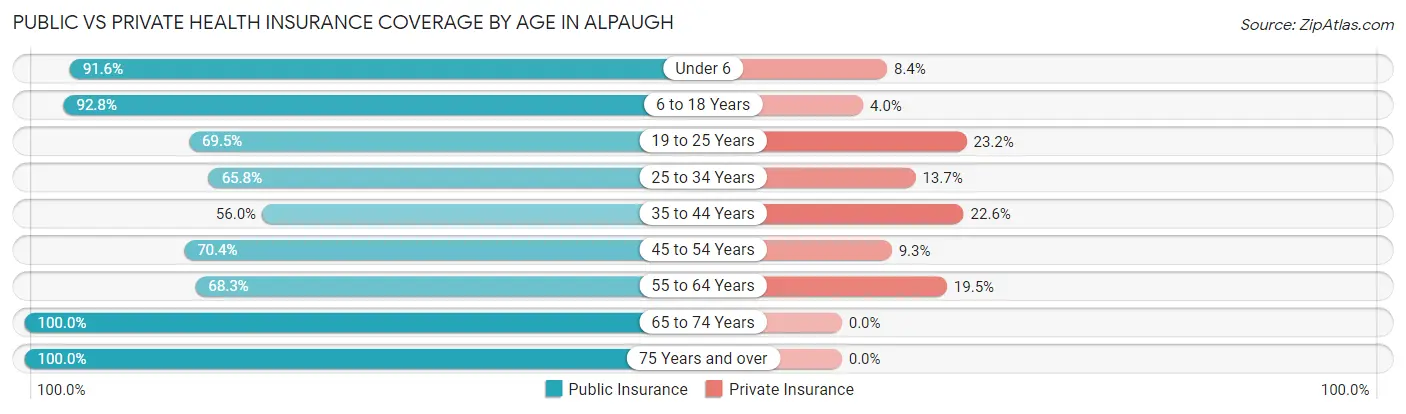
| Age Bracket | Public Insurance | Private Insurance |
| Under 6 | 218 (91.6%) | 20 (8.4%) |
| 6 to 18 Years | 141 (92.8%) | 6 (4.0%) |
| 19 to 25 Years | 123 (69.5%) | 41 (23.2%) |
| 25 to 34 Years | 77 (65.8%) | 16 (13.7%) |
| 35 to 44 Years | 47 (55.9%) | 19 (22.6%) |
| 45 to 54 Years | 38 (70.4%) | 5 (9.3%) |
| 55 to 64 Years | 28 (68.3%) | 8 (19.5%) |
| 65 to 74 Years | 8 (100.0%) | 0 (0.0%) |
| 75 Years and over | 9 (100.0%) | 0 (0.0%) |
| Total | 689 (78.3%) | 115 (13.1%) |
Disability Status by Sex by Age in Alpaugh
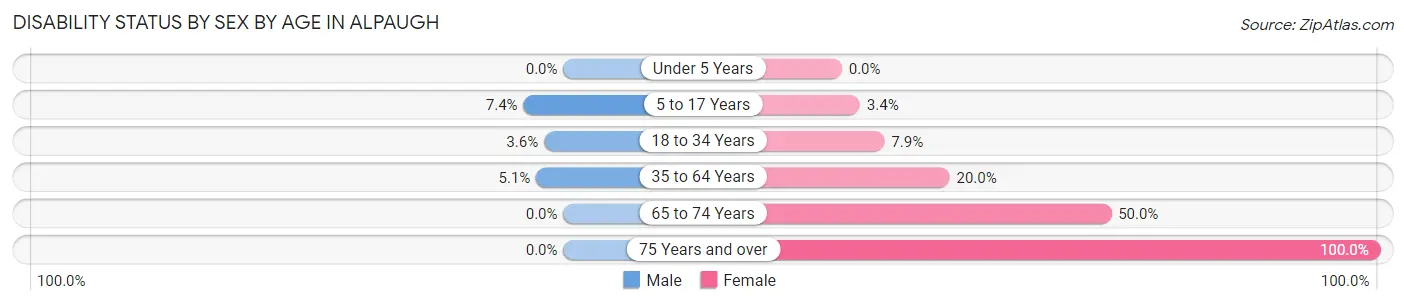
| Age Bracket | Male | Female |
| Under 5 Years | 0 (0.0%) | 0 (0.0%) |
| 5 to 17 Years | 4 (7.4%) | 5 (3.4%) |
| 18 to 34 Years | 6 (3.6%) | 11 (7.9%) |
| 35 to 64 Years | 5 (5.1%) | 16 (20.0%) |
| 65 to 74 Years | 0 (0.0%) | 4 (50.0%) |
| 75 Years and over | 0 (0.0%) | 4 (100.0%) |
Disability Class by Sex by Age in Alpaugh
Disability Class: Hearing Difficulty
| Age Bracket | Male | Female |
| Under 5 Years | 0 (0.0%) | 0 (0.0%) |
| 5 to 17 Years | 0 (0.0%) | 0 (0.0%) |
| 18 to 34 Years | 0 (0.0%) | 0 (0.0%) |
| 35 to 64 Years | 0 (0.0%) | 0 (0.0%) |
| 65 to 74 Years | 0 (0.0%) | 0 (0.0%) |
| 75 Years and over | 0 (0.0%) | 0 (0.0%) |
Disability Class: Vision Difficulty
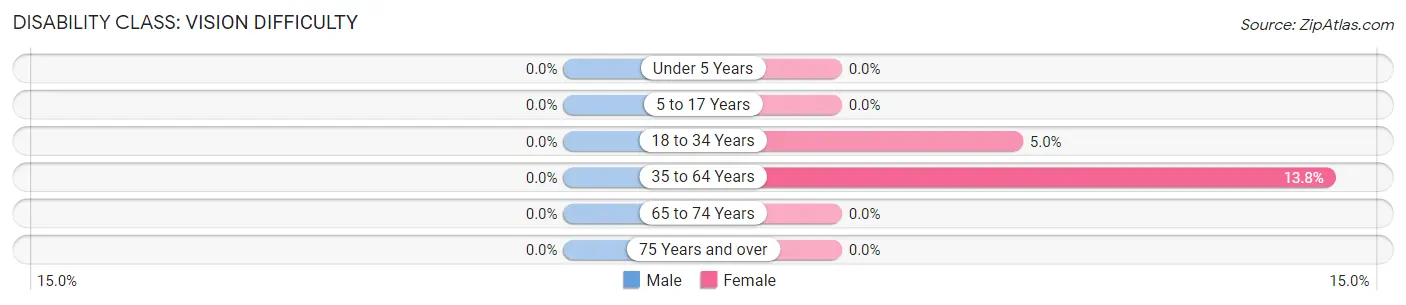
| Age Bracket | Male | Female |
| Under 5 Years | 0 (0.0%) | 0 (0.0%) |
| 5 to 17 Years | 0 (0.0%) | 0 (0.0%) |
| 18 to 34 Years | 0 (0.0%) | 7 (5.0%) |
| 35 to 64 Years | 0 (0.0%) | 11 (13.8%) |
| 65 to 74 Years | 0 (0.0%) | 0 (0.0%) |
| 75 Years and over | 0 (0.0%) | 0 (0.0%) |
Disability Class: Cognitive Difficulty
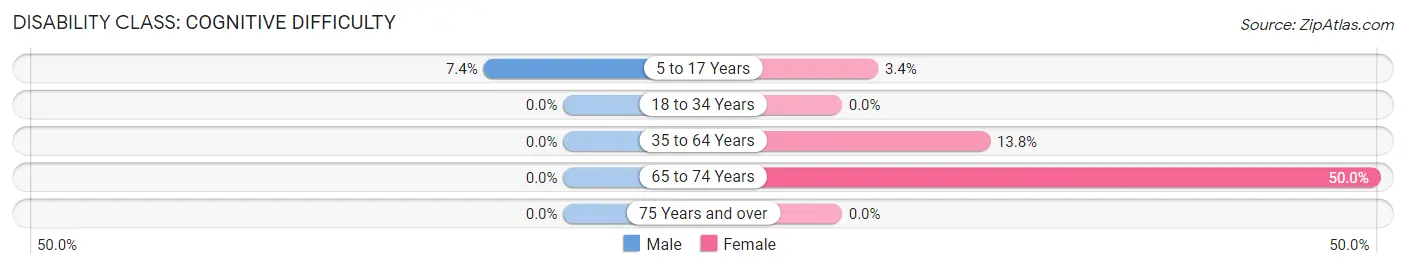
| Age Bracket | Male | Female |
| 5 to 17 Years | 4 (7.4%) | 5 (3.4%) |
| 18 to 34 Years | 0 (0.0%) | 0 (0.0%) |
| 35 to 64 Years | 0 (0.0%) | 11 (13.8%) |
| 65 to 74 Years | 0 (0.0%) | 4 (50.0%) |
| 75 Years and over | 0 (0.0%) | 0 (0.0%) |
Disability Class: Ambulatory Difficulty
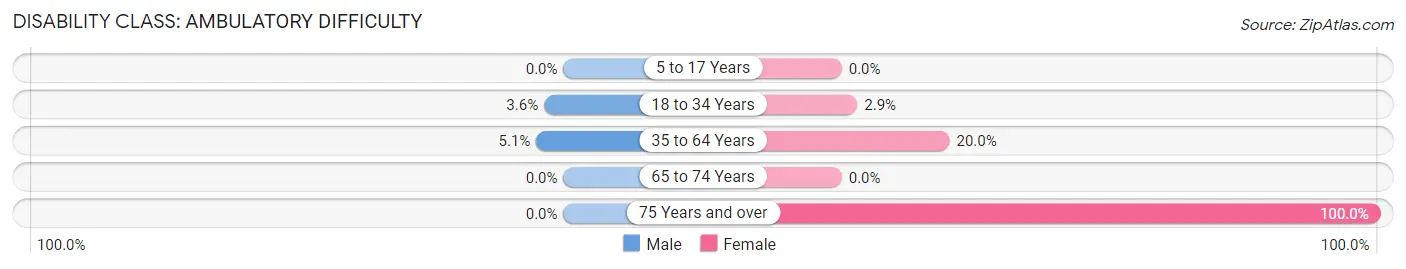
| Age Bracket | Male | Female |
| 5 to 17 Years | 0 (0.0%) | 0 (0.0%) |
| 18 to 34 Years | 6 (3.6%) | 4 (2.9%) |
| 35 to 64 Years | 5 (5.1%) | 16 (20.0%) |
| 65 to 74 Years | 0 (0.0%) | 0 (0.0%) |
| 75 Years and over | 0 (0.0%) | 4 (100.0%) |
Disability Class: Self-Care Difficulty
| Age Bracket | Male | Female |
| 5 to 17 Years | 0 (0.0%) | 0 (0.0%) |
| 18 to 34 Years | 0 (0.0%) | 0 (0.0%) |
| 35 to 64 Years | 0 (0.0%) | 0 (0.0%) |
| 65 to 74 Years | 0 (0.0%) | 0 (0.0%) |
| 75 Years and over | 0 (0.0%) | 0 (0.0%) |
Technology Access in Alpaugh
Computing Device Access in Alpaugh
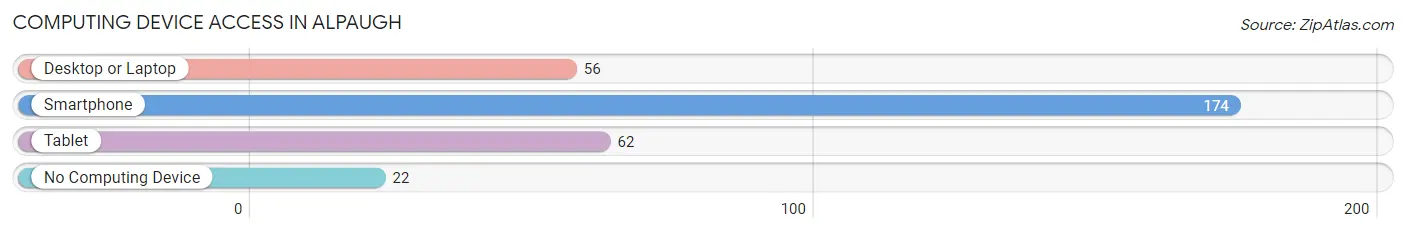
| Device Type | # Households | % Households |
| Desktop or Laptop | 56 | 28.1% |
| Smartphone | 174 | 87.4% |
| Tablet | 62 | 31.2% |
| No Computing Device | 22 | 11.1% |
| Total | 199 | 100.0% |
Internet Access in Alpaugh
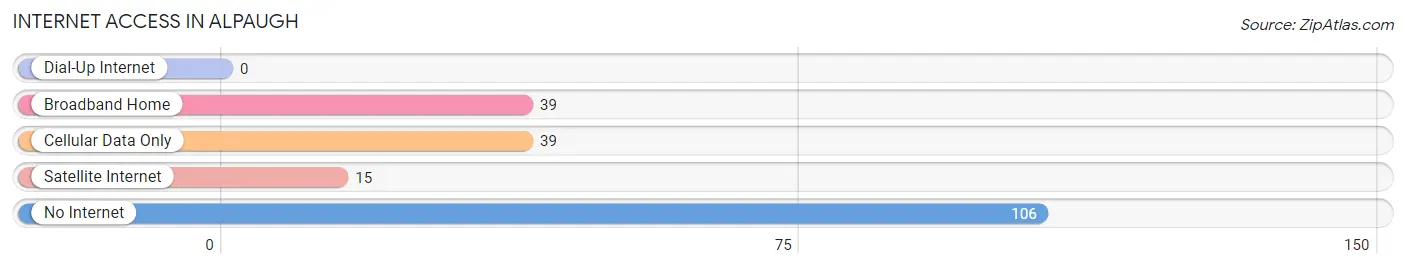
| Internet Type | # Households | % Households |
| Dial-Up Internet | 0 | 0.0% |
| Broadband Home | 39 | 19.6% |
| Cellular Data Only | 39 | 19.6% |
| Satellite Internet | 15 | 7.5% |
| No Internet | 106 | 53.3% |
| Total | 199 | 100.0% |
Alpaugh Summary
Alpaugh is a small unincorporated community located in Tulare County, California. It is situated in the San Joaquin Valley, approximately 10 miles south of Pixley and 25 miles northwest of Tulare. The population of Alpaugh was estimated to be 1,093 in 2019.
History
Alpaugh was founded in 1891 by the Southern Pacific Railroad. The town was named after the Alpaugh family, who were early settlers in the area. The Alpaughs were of German descent and had come to California in the late 1800s.
The town was originally a farming community, with the main crops being cotton, wheat, and barley. In the early 1900s, the town began to grow and develop, with the addition of a post office, a school, and a general store.
In the 1920s, the town experienced a boom in population due to the oil industry. Oil was discovered in the area and many people moved to Alpaugh to work in the oil fields. This led to the construction of several new businesses, including a bank, a hotel, and a movie theater.
In the 1950s, the town experienced a decline in population as the oil industry began to decline. Many of the businesses closed and the population decreased.
Geography
Alpaugh is located in the San Joaquin Valley, approximately 10 miles south of Pixley and 25 miles northwest of Tulare. The town is situated at an elevation of approximately 200 feet above sea level.
The climate in Alpaugh is hot and dry, with temperatures ranging from the mid-90s in the summer to the mid-50s in the winter. The area receives an average of 8 inches of rain per year.
Economy
The economy of Alpaugh is largely based on agriculture. The main crops grown in the area are cotton, wheat, and barley. Other crops grown in the area include alfalfa, corn, and tomatoes.
The town also has a few small businesses, including a gas station, a grocery store, and a hardware store.
Demographics
As of 2019, the population of Alpaugh was estimated to be 1,093. The racial makeup of the town was 73.3% White, 0.7% African American, 0.3% Native American, 0.2% Asian, 0.1% Pacific Islander, 22.7% from other races, and 2.7% from two or more races. Hispanic or Latino of any race were 33.2% of the population.
The median household income in Alpaugh was $37,917, and the median family income was $41,250. The per capita income was $14,945. About 18.3% of the population was below the poverty line.
Common Questions
What is Per Capita Income in Alpaugh?
Per Capita income in Alpaugh is $11,260.
What is the Median Household income in Alpaugh?
Median Household Income in Alpaugh is $39,688.
What is Income or Wage Gap in Alpaugh?
Income or Wage Gap in Alpaugh is 25.7%.
Women in Alpaugh earn 74.3 cents for every dollar earned by a man.
What is Inequality or Gini Index in Alpaugh?
Inequality or Gini Index in Alpaugh is 0.38.
What is the Total Population of Alpaugh?
Total Population of Alpaugh is 880.
What is the Total Male Population of Alpaugh?
Total Male Population of Alpaugh is 371.
What is the Total Female Population of Alpaugh?
Total Female Population of Alpaugh is 509.
What is the Ratio of Males per 100 Females in Alpaugh?
There are 72.89 Males per 100 Females in Alpaugh.
What is the Ratio of Females per 100 Males in Alpaugh?
There are 137.20 Females per 100 Males in Alpaugh.
What is the Median Population Age in Alpaugh?
Median Population Age in Alpaugh is 23.1 Years.
What is the Average Family Size in Alpaugh
Average Family Size in Alpaugh is 4.9 People.
What is the Average Household Size in Alpaugh
Average Household Size in Alpaugh is 4.4 People.
How Large is the Labor Force in Alpaugh?
There are 334 People in the Labor Forcein in Alpaugh.
What is the Percentage of People in the Labor Force in Alpaugh?
65.9% of People are in the Labor Force in Alpaugh.
What is the Unemployment Rate in Alpaugh?
Unemployment Rate in Alpaugh is 20.1%.