Zip Codes with the Highest Percentage of Population Employed in Health Diagnosing & Treating in Cordova, TN
RELATED REPORTS & OPTIONS
Health Diagnosing & Treating
Cordova
Compare Zip Codes
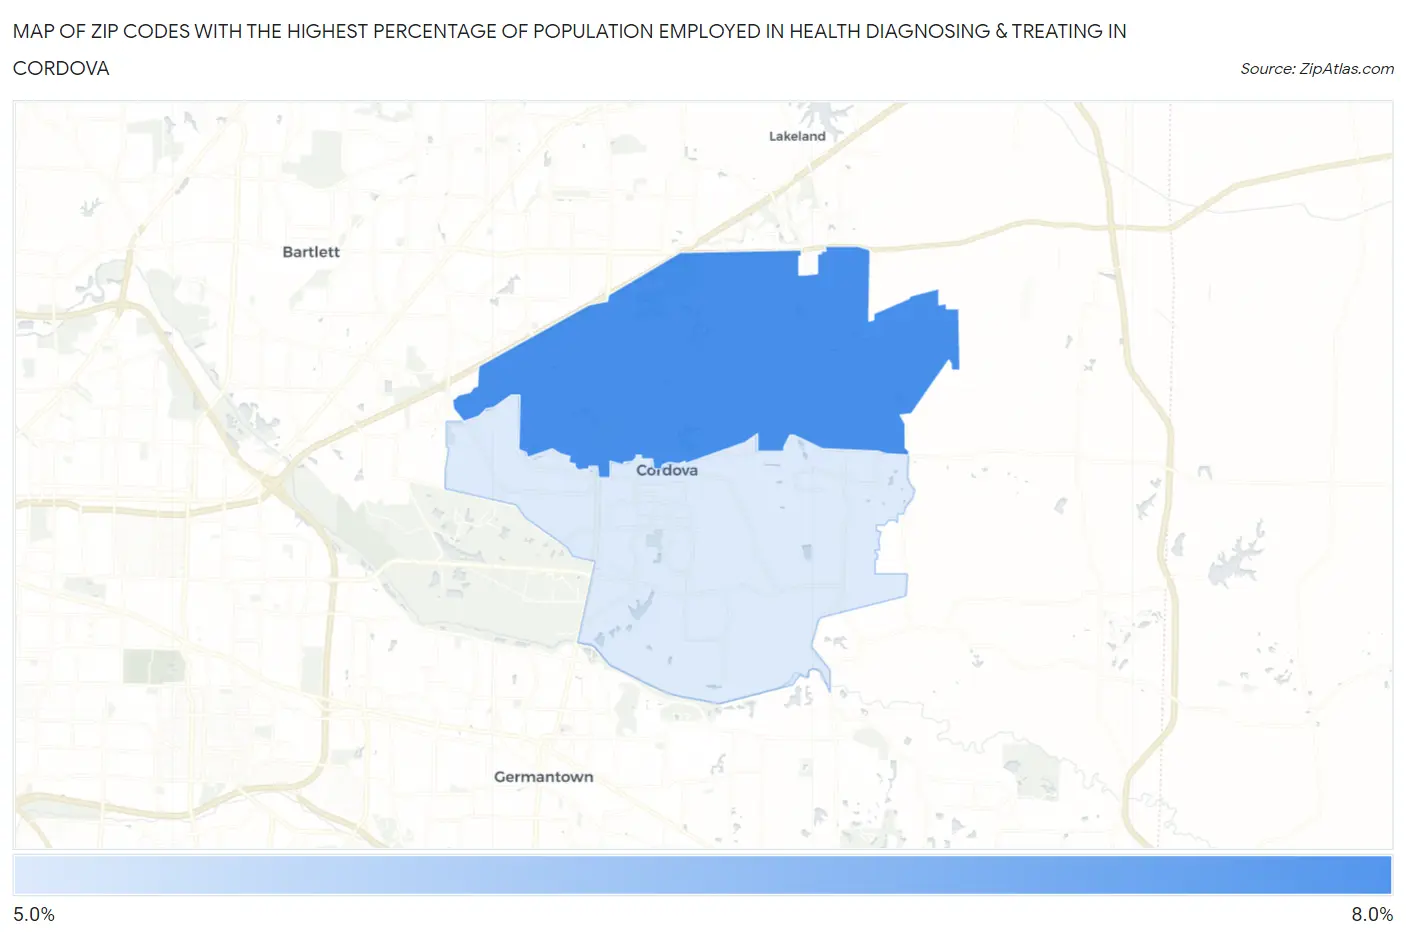
Map of Zip Codes with the Highest Percentage of Population Employed in Health Diagnosing & Treating in Cordova
5.9%
6.2%
Zip Codes with the Highest Percentage of Population Employed in Health Diagnosing & Treating in Cordova, TN
| Zip Code | % Employed | vs State | vs National | |
| 1. | 38016 | 6.2% | 6.9%(-0.659)#313 | 6.2%(-0.042)#13,140 |
| 2. | 38018 | 5.9% | 6.9%(-1.01)#337 | 6.2%(-0.390)#14,400 |
1
Common Questions
What are the Top Zip Codes with the Highest Percentage of Population Employed in Health Diagnosing & Treating in Cordova, TN?
Top Zip Codes with the Highest Percentage of Population Employed in Health Diagnosing & Treating in Cordova, TN are:
What zip code has the Highest Percentage of Population Employed in Health Diagnosing & Treating in Cordova, TN?
38016 has the Highest Percentage of Population Employed in Health Diagnosing & Treating in Cordova, TN with 6.2%.
What is the Percentage of Population Employed in Health Diagnosing & Treating in Tennessee?
Percentage of Population Employed in Health Diagnosing & Treating in Tennessee is 6.9%.
What is the Percentage of Population Employed in Health Diagnosing & Treating in the United States?
Percentage of Population Employed in Health Diagnosing & Treating in the United States is 6.2%.