Zip Codes with the Highest Percentage of Population Employed in Health Diagnosing & Treating in Lebanon, TN
RELATED REPORTS & OPTIONS
Health Diagnosing & Treating
Lebanon
Compare Zip Codes
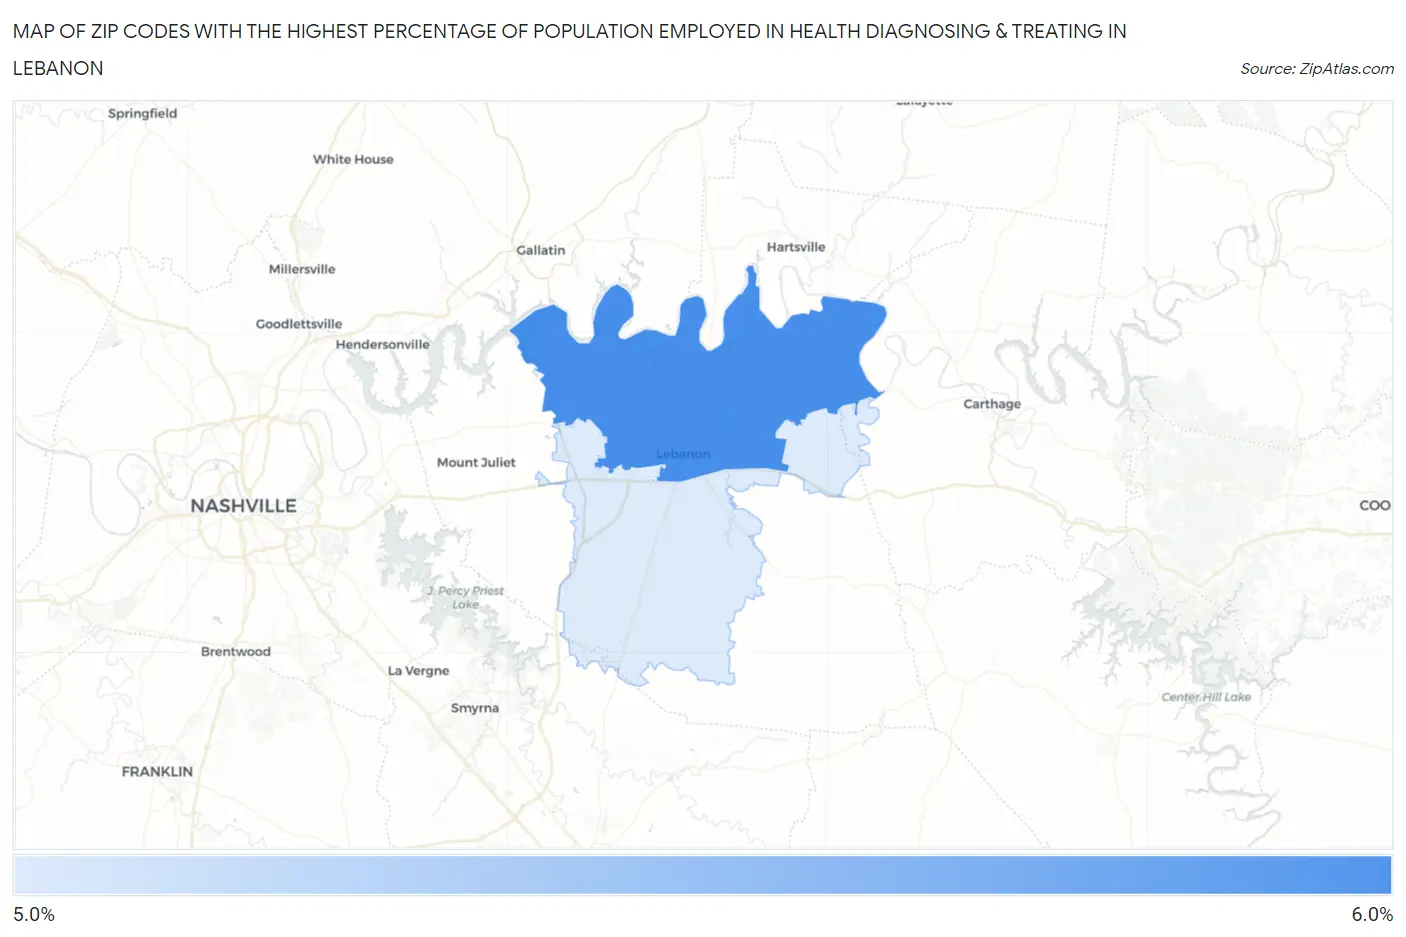
Map of Zip Codes with the Highest Percentage of Population Employed in Health Diagnosing & Treating in Lebanon
5.5%
5.6%
Zip Codes with the Highest Percentage of Population Employed in Health Diagnosing & Treating in Lebanon, TN
| Zip Code | % Employed | vs State | vs National | |
| 1. | 37087 | 5.6% | 6.9%(-1.22)#352 | 6.2%(-0.598)#15,201 |
| 2. | 37090 | 5.5% | 6.9%(-1.39)#364 | 6.2%(-0.769)#15,876 |
1
Common Questions
What are the Top Zip Codes with the Highest Percentage of Population Employed in Health Diagnosing & Treating in Lebanon, TN?
Top Zip Codes with the Highest Percentage of Population Employed in Health Diagnosing & Treating in Lebanon, TN are:
What zip code has the Highest Percentage of Population Employed in Health Diagnosing & Treating in Lebanon, TN?
37087 has the Highest Percentage of Population Employed in Health Diagnosing & Treating in Lebanon, TN with 5.6%.
What is the Percentage of Population Employed in Health Diagnosing & Treating in Lebanon, TN?
Percentage of Population Employed in Health Diagnosing & Treating in Lebanon is 5.0%.
What is the Percentage of Population Employed in Health Diagnosing & Treating in Tennessee?
Percentage of Population Employed in Health Diagnosing & Treating in Tennessee is 6.9%.
What is the Percentage of Population Employed in Health Diagnosing & Treating in the United States?
Percentage of Population Employed in Health Diagnosing & Treating in the United States is 6.2%.