Zip Codes with the Highest Percentage of Population Employed in Health Diagnosing & Treating in Lenoir City, TN
RELATED REPORTS & OPTIONS
Health Diagnosing & Treating
Lenoir City
Compare Zip Codes
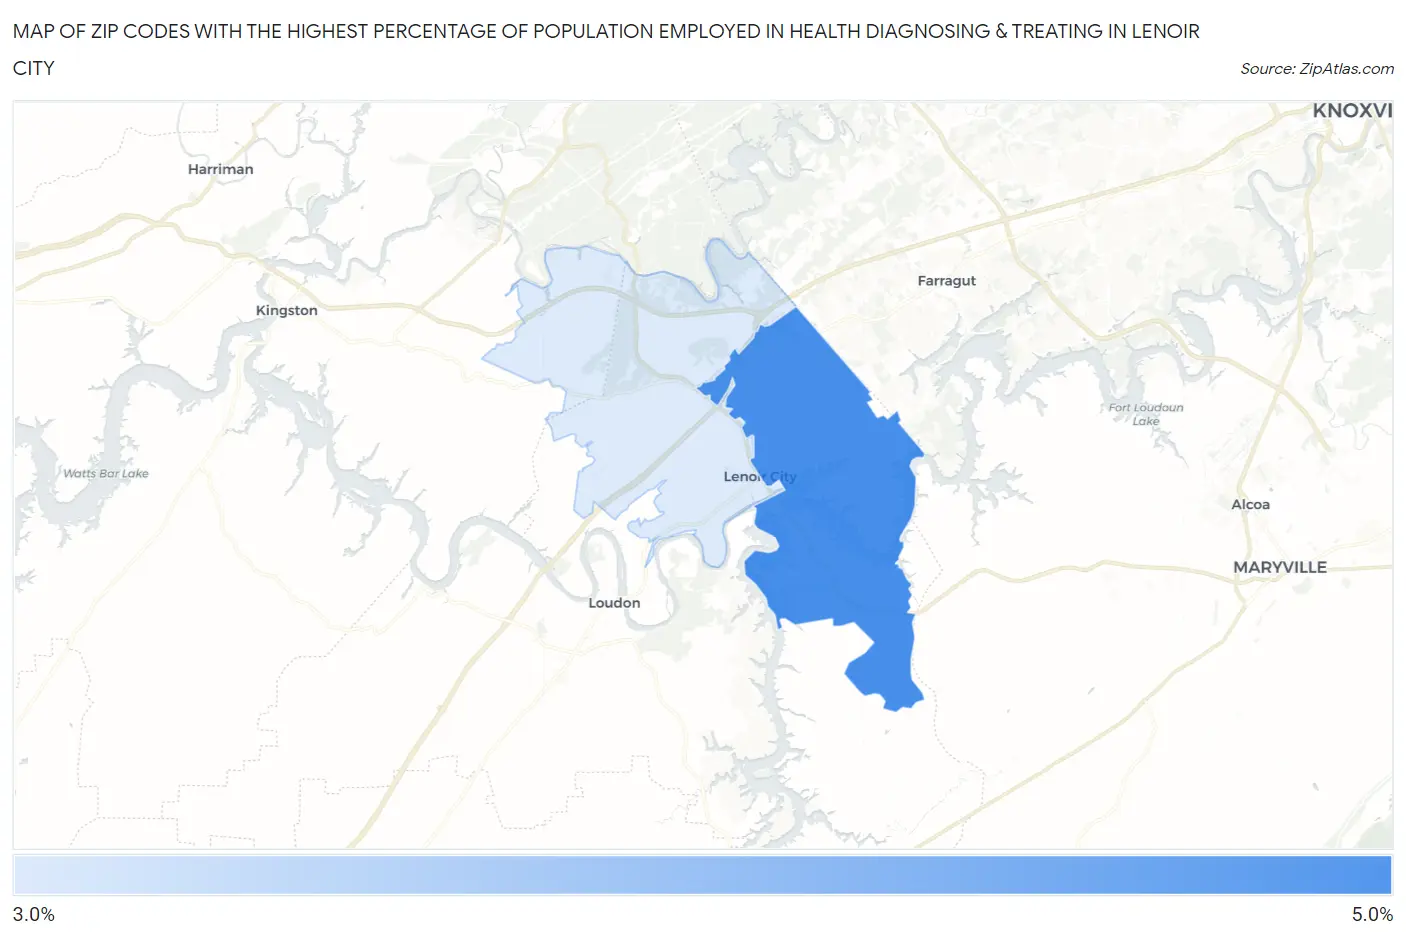
Map of Zip Codes with the Highest Percentage of Population Employed in Health Diagnosing & Treating in Lenoir City
3.9%
4.4%
Zip Codes with the Highest Percentage of Population Employed in Health Diagnosing & Treating in Lenoir City, TN
| Zip Code | % Employed | vs State | vs National | |
| 1. | 37772 | 4.4% | 6.9%(-2.51)#436 | 6.2%(-1.89)#20,148 |
| 2. | 37771 | 3.9% | 6.9%(-2.97)#463 | 6.2%(-2.35)#21,717 |
1
Common Questions
What are the Top Zip Codes with the Highest Percentage of Population Employed in Health Diagnosing & Treating in Lenoir City, TN?
Top Zip Codes with the Highest Percentage of Population Employed in Health Diagnosing & Treating in Lenoir City, TN are:
What zip code has the Highest Percentage of Population Employed in Health Diagnosing & Treating in Lenoir City, TN?
37772 has the Highest Percentage of Population Employed in Health Diagnosing & Treating in Lenoir City, TN with 4.4%.
What is the Percentage of Population Employed in Health Diagnosing & Treating in Lenoir City, TN?
Percentage of Population Employed in Health Diagnosing & Treating in Lenoir City is 5.8%.
What is the Percentage of Population Employed in Health Diagnosing & Treating in Tennessee?
Percentage of Population Employed in Health Diagnosing & Treating in Tennessee is 6.9%.
What is the Percentage of Population Employed in Health Diagnosing & Treating in the United States?
Percentage of Population Employed in Health Diagnosing & Treating in the United States is 6.2%.