Zip Codes with the Highest Percentage of Population Employed in Health Diagnosing & Treating in Crossville, TN
RELATED REPORTS & OPTIONS
Health Diagnosing & Treating
Crossville
Compare Zip Codes
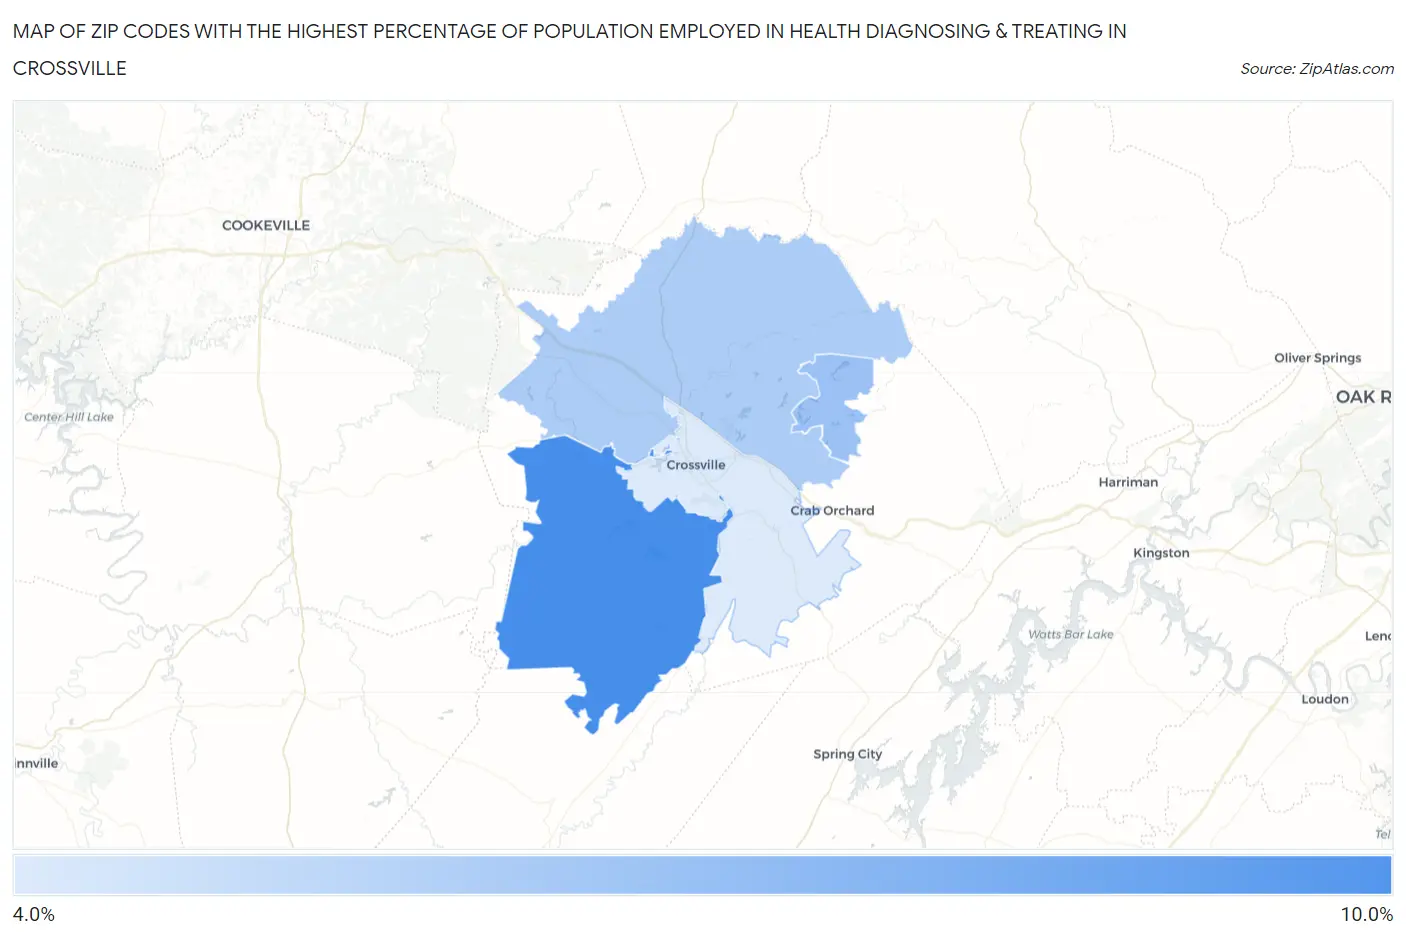
Map of Zip Codes with the Highest Percentage of Population Employed in Health Diagnosing & Treating in Crossville
4.3%
8.7%
Zip Codes with the Highest Percentage of Population Employed in Health Diagnosing & Treating in Crossville, TN
| Zip Code | % Employed | vs State | vs National | |
| 1. | 38572 | 8.7% | 6.9%(+1.84)#139 | 6.2%(+2.46)#5,926 |
| 2. | 38558 | 6.2% | 6.9%(-0.642)#312 | 6.2%(-0.026)#13,086 |
| 3. | 38571 | 5.7% | 6.9%(-1.18)#349 | 6.2%(-0.565)#15,060 |
| 4. | 38555 | 4.3% | 6.9%(-2.56)#439 | 6.2%(-1.94)#20,321 |
1
Common Questions
What are the Top 3 Zip Codes with the Highest Percentage of Population Employed in Health Diagnosing & Treating in Crossville, TN?
Top 3 Zip Codes with the Highest Percentage of Population Employed in Health Diagnosing & Treating in Crossville, TN are:
What zip code has the Highest Percentage of Population Employed in Health Diagnosing & Treating in Crossville, TN?
38572 has the Highest Percentage of Population Employed in Health Diagnosing & Treating in Crossville, TN with 8.7%.
What is the Percentage of Population Employed in Health Diagnosing & Treating in Crossville, TN?
Percentage of Population Employed in Health Diagnosing & Treating in Crossville is 3.0%.
What is the Percentage of Population Employed in Health Diagnosing & Treating in Tennessee?
Percentage of Population Employed in Health Diagnosing & Treating in Tennessee is 6.9%.
What is the Percentage of Population Employed in Health Diagnosing & Treating in the United States?
Percentage of Population Employed in Health Diagnosing & Treating in the United States is 6.2%.