Zip Codes with the Highest Percentage of Population Employed in Health Diagnosing & Treating in Greeneville, TN
RELATED REPORTS & OPTIONS
Health Diagnosing & Treating
Greeneville
Compare Zip Codes
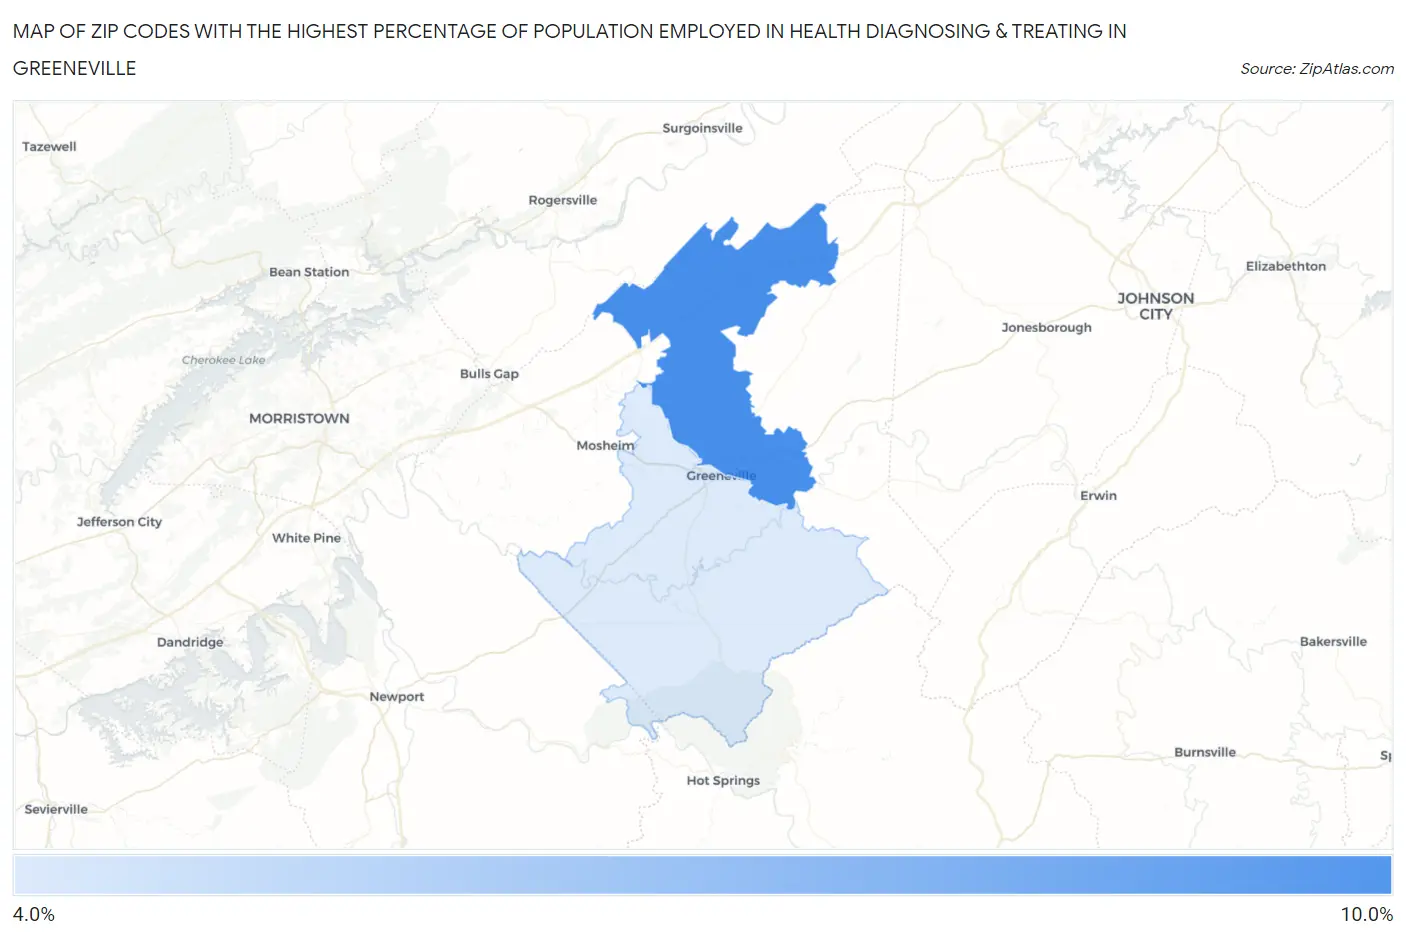
Map of Zip Codes with the Highest Percentage of Population Employed in Health Diagnosing & Treating in Greeneville
4.8%
8.9%
Zip Codes with the Highest Percentage of Population Employed in Health Diagnosing & Treating in Greeneville, TN
| Zip Code | % Employed | vs State | vs National | |
| 1. | 37745 | 8.9% | 6.9%(+2.07)#129 | 6.2%(+2.69)#5,478 |
| 2. | 37743 | 4.8% | 6.9%(-2.02)#400 | 6.2%(-1.40)#18,316 |
1
Common Questions
What are the Top Zip Codes with the Highest Percentage of Population Employed in Health Diagnosing & Treating in Greeneville, TN?
Top Zip Codes with the Highest Percentage of Population Employed in Health Diagnosing & Treating in Greeneville, TN are:
What zip code has the Highest Percentage of Population Employed in Health Diagnosing & Treating in Greeneville, TN?
37745 has the Highest Percentage of Population Employed in Health Diagnosing & Treating in Greeneville, TN with 8.9%.
What is the Percentage of Population Employed in Health Diagnosing & Treating in Greeneville, TN?
Percentage of Population Employed in Health Diagnosing & Treating in Greeneville is 5.4%.
What is the Percentage of Population Employed in Health Diagnosing & Treating in Tennessee?
Percentage of Population Employed in Health Diagnosing & Treating in Tennessee is 6.9%.
What is the Percentage of Population Employed in Health Diagnosing & Treating in the United States?
Percentage of Population Employed in Health Diagnosing & Treating in the United States is 6.2%.