Three Way, TN Map & Demographics
Three Way Map
Three Way Overview
$40,437
PER CAPITA INCOME
$94,844
AVG FAMILY INCOME
$84,609
AVG HOUSEHOLD INCOME
30.6%
WAGE / INCOME GAP [ % ]
69.4¢/ $1
WAGE / INCOME GAP [ $ ]
$9,916
FAMILY INCOME DEFICIT
0.32
INEQUALITY / GINI INDEX
1,755
TOTAL POPULATION
904
MALE POPULATION
851
FEMALE POPULATION
106.23
MALES / 100 FEMALES
94.14
FEMALES / 100 MALES
54.8
MEDIAN AGE
2.7
AVG FAMILY SIZE
2.3
AVG HOUSEHOLD SIZE
957
LABOR FORCE [ PEOPLE ]
61.6%
PERCENT IN LABOR FORCE
4.1%
UNEMPLOYMENT RATE
Three Way Area Codes
Income in Three Way
Income Overview in Three Way
Per Capita Income in Three Way is $40,437, while median incomes of families and households are $94,844 and $84,609 respectively.
| Characteristic | Number | Measure |
| Per Capita Income | 1,755 | $40,437 |
| Median Family Income | 537 | $94,844 |
| Mean Family Income | 537 | $102,936 |
| Median Household Income | 761 | $84,609 |
| Mean Household Income | 761 | $89,937 |
| Income Deficit | 537 | $9,916 |
| Wage / Income Gap (%) | 1,755 | 30.57% |
| Wage / Income Gap ($) | 1,755 | 69.43¢ per $1 |
| Gini / Inequality Index | 1,755 | 0.32 |
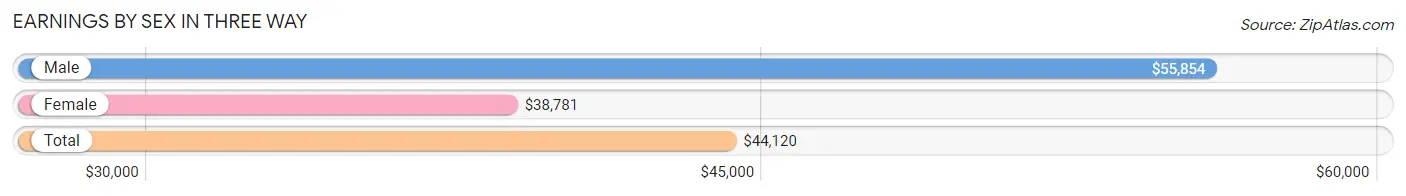
Earnings by Sex in Three Way
Average Earnings in Three Way are $44,120, $55,854 for men and $38,781 for women, a difference of 30.6%.
| Sex | Number | Average Earnings |
| Male | 482 (49.5%) | $55,854 |
| Female | 491 (50.5%) | $38,781 |
| Total | 973 (100.0%) | $44,120 |
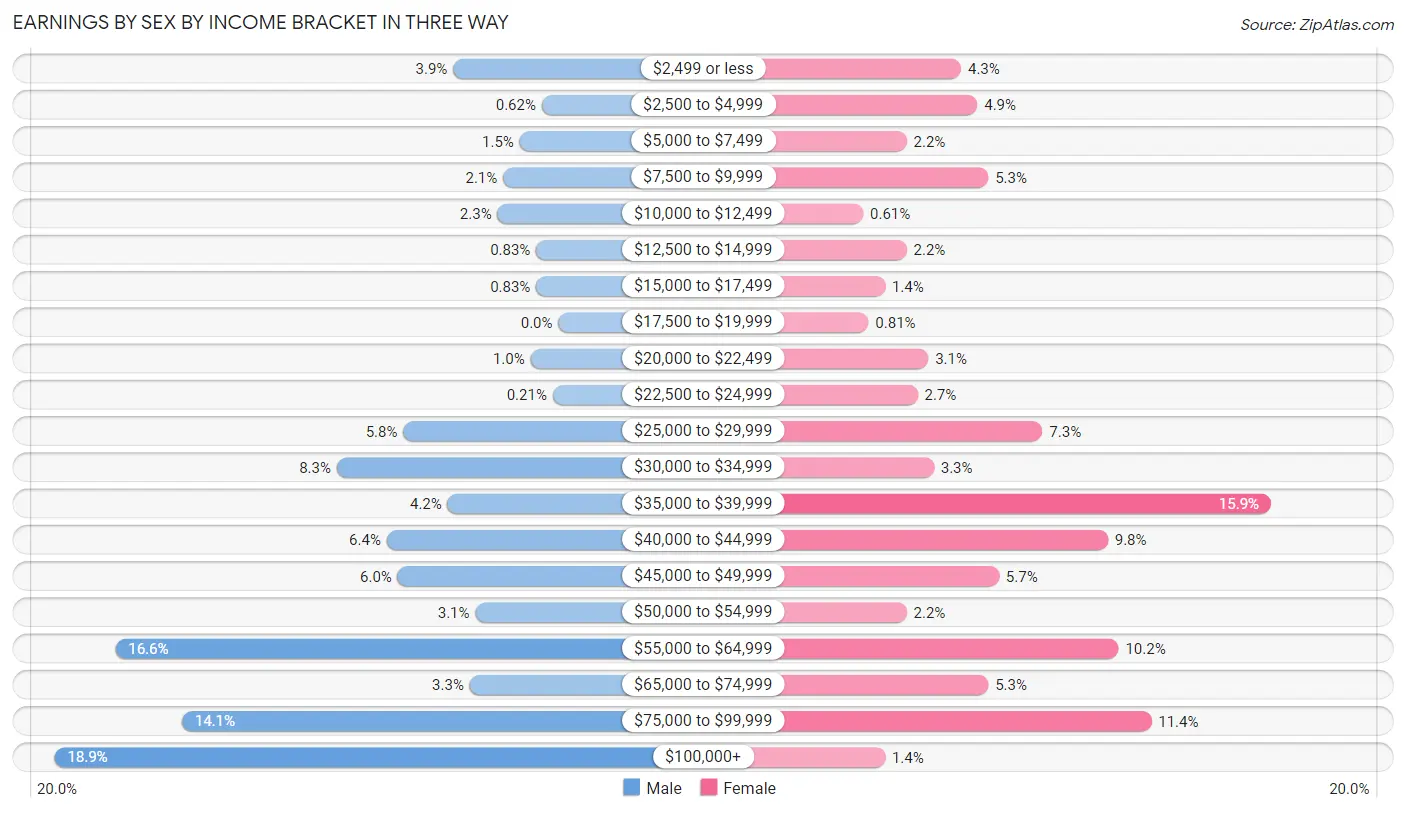
Earnings by Sex by Income Bracket in Three Way
The most common earnings brackets in Three Way are $100,000+ for men (91 | 18.9%) and $35,000 to $39,999 for women (78 | 15.9%).
| Income | Male | Female |
| $2,499 or less | 19 (3.9%) | 21 (4.3%) |
| $2,500 to $4,999 | 3 (0.6%) | 24 (4.9%) |
| $5,000 to $7,499 | 7 (1.5%) | 11 (2.2%) |
| $7,500 to $9,999 | 10 (2.1%) | 26 (5.3%) |
| $10,000 to $12,499 | 11 (2.3%) | 3 (0.6%) |
| $12,500 to $14,999 | 4 (0.8%) | 11 (2.2%) |
| $15,000 to $17,499 | 4 (0.8%) | 7 (1.4%) |
| $17,500 to $19,999 | 0 (0.0%) | 4 (0.8%) |
| $20,000 to $22,499 | 5 (1.0%) | 15 (3.0%) |
| $22,500 to $24,999 | 1 (0.2%) | 13 (2.6%) |
| $25,000 to $29,999 | 28 (5.8%) | 36 (7.3%) |
| $30,000 to $34,999 | 40 (8.3%) | 16 (3.3%) |
| $35,000 to $39,999 | 20 (4.2%) | 78 (15.9%) |
| $40,000 to $44,999 | 31 (6.4%) | 48 (9.8%) |
| $45,000 to $49,999 | 29 (6.0%) | 28 (5.7%) |
| $50,000 to $54,999 | 15 (3.1%) | 11 (2.2%) |
| $55,000 to $64,999 | 80 (16.6%) | 50 (10.2%) |
| $65,000 to $74,999 | 16 (3.3%) | 26 (5.3%) |
| $75,000 to $99,999 | 68 (14.1%) | 56 (11.4%) |
| $100,000+ | 91 (18.9%) | 7 (1.4%) |
| Total | 482 (100.0%) | 491 (100.0%) |
Earnings by Sex by Educational Attainment in Three Way
Average earnings in Three Way are $56,250 for men and $40,729 for women, a difference of 27.6%. Men with an educational attainment of graduate degree enjoy the highest average annual earnings of $79,408, while those with less than high school education earn the least with $33,654. Women with an educational attainment of graduate degree earn the most with the average annual earnings of $49,219, while those with high school diploma education have the smallest earnings of $36,563.

| Educational Attainment | Male Income | Female Income |
| Less than High School | $33,654 | $0 |
| High School Diploma | $43,438 | $36,563 |
| College or Associate's Degree | $51,932 | $37,778 |
| Bachelor's Degree | $59,821 | $44,896 |
| Graduate Degree | $79,408 | $49,219 |
| Total | $56,250 | $40,729 |
Family Income in Three Way
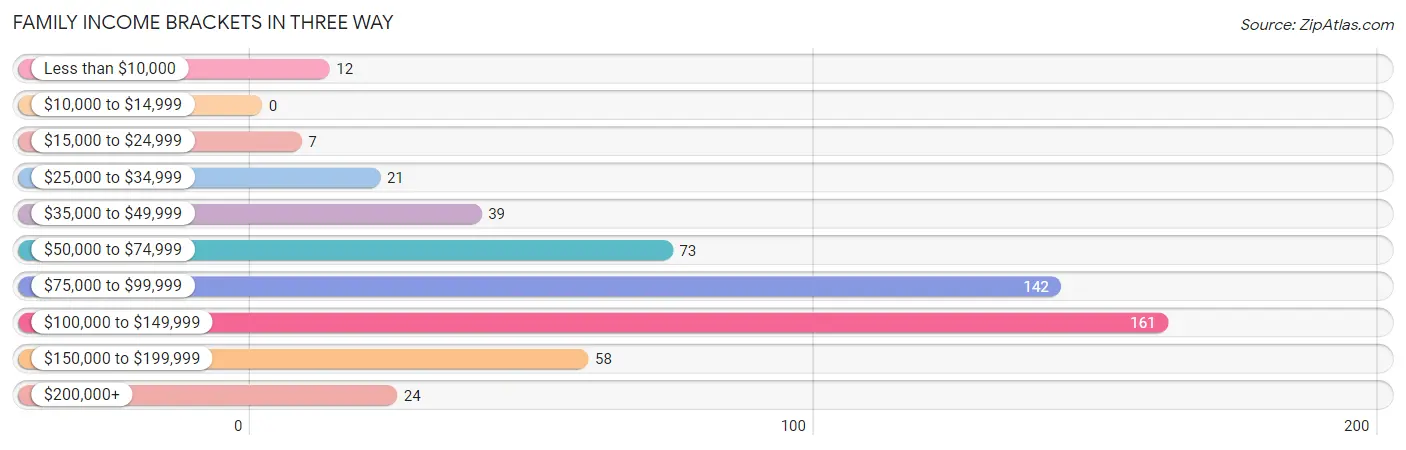
Family Income Brackets in Three Way
According to the Three Way family income data, there are 161 families falling into the $100,000 to $149,999 income range, which is the most common income bracket and makes up 30.0% of all families.
| Income Bracket | # Families | % Families |
| Less than $10,000 | 12 | 2.2% |
| $10,000 to $14,999 | 0 | 0.0% |
| $15,000 to $24,999 | 7 | 1.3% |
| $25,000 to $34,999 | 21 | 3.9% |
| $35,000 to $49,999 | 39 | 7.3% |
| $50,000 to $74,999 | 73 | 13.6% |
| $75,000 to $99,999 | 142 | 26.4% |
| $100,000 to $149,999 | 161 | 30.0% |
| $150,000 to $199,999 | 58 | 10.8% |
| $200,000+ | 24 | 4.5% |
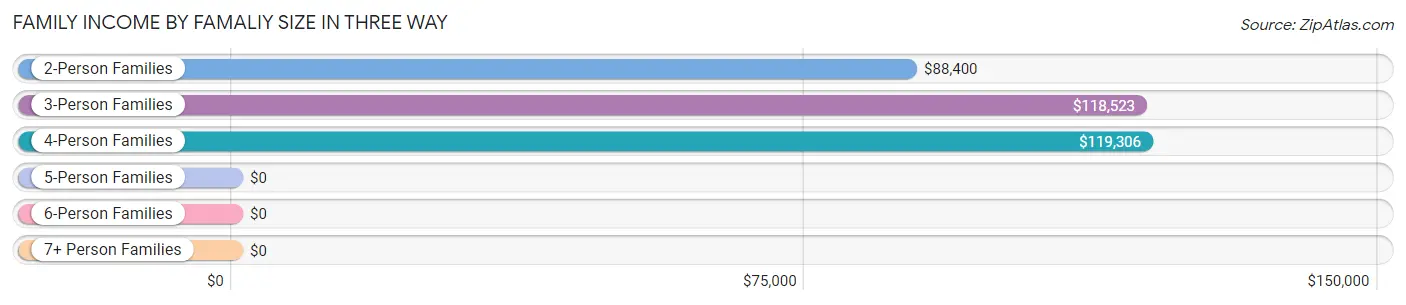
Family Income by Famaliy Size in Three Way
4-person families (53 | 9.9%) account for the highest median family income in Three Way with $119,306 per family, while 2-person families (328 | 61.1%) have the highest median income of $44,200 per family member.
| Income Bracket | # Families | Median Income |
| 2-Person Families | 328 (61.1%) | $88,400 |
| 3-Person Families | 129 (24.0%) | $118,523 |
| 4-Person Families | 53 (9.9%) | $119,306 |
| 5-Person Families | 25 (4.7%) | $0 |
| 6-Person Families | 2 (0.4%) | $0 |
| 7+ Person Families | 0 (0.0%) | $0 |
| Total | 537 (100.0%) | $94,844 |
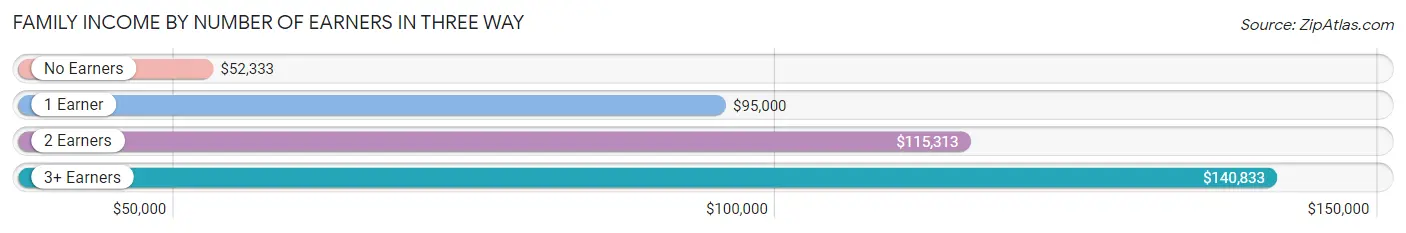
Family Income by Number of Earners in Three Way
The median family income in Three Way is $94,844, with families comprising 3+ earners (70) having the highest median family income of $140,833, while families with no earners (142) have the lowest median family income of $52,333, accounting for 13.0% and 26.4% of families, respectively.
| Number of Earners | # Families | Median Income |
| No Earners | 142 (26.4%) | $52,333 |
| 1 Earner | 122 (22.7%) | $95,000 |
| 2 Earners | 203 (37.8%) | $115,313 |
| 3+ Earners | 70 (13.0%) | $140,833 |
| Total | 537 (100.0%) | $94,844 |
Household Income in Three Way
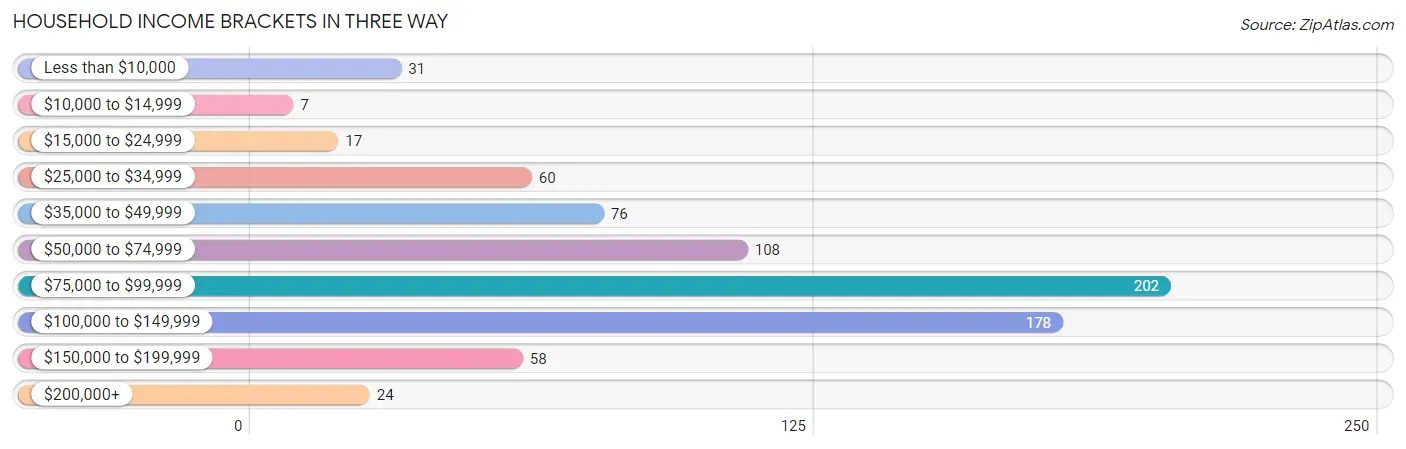
Household Income Brackets in Three Way
With 202 households falling in the category, the $75,000 to $99,999 income range is the most frequent in Three Way, accounting for 26.5% of all households. In contrast, only 7 households (0.9%) fall into the $10,000 to $14,999 income bracket, making it the least populous group.
| Income Bracket | # Households | % Households |
| Less than $10,000 | 31 | 4.1% |
| $10,000 to $14,999 | 7 | 0.9% |
| $15,000 to $24,999 | 17 | 2.2% |
| $25,000 to $34,999 | 60 | 7.9% |
| $35,000 to $49,999 | 76 | 10.0% |
| $50,000 to $74,999 | 108 | 14.2% |
| $75,000 to $99,999 | 202 | 26.5% |
| $100,000 to $149,999 | 178 | 23.4% |
| $150,000 to $199,999 | 58 | 7.6% |
| $200,000+ | 24 | 3.2% |
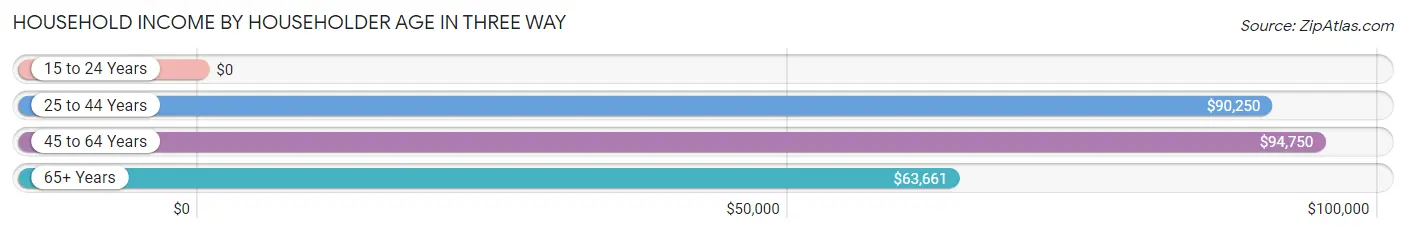
Household Income by Householder Age in Three Way
The median household income in Three Way is $84,609, with the highest median household income of $94,750 found in the 45 to 64 years age bracket for the primary householder. A total of 327 households (43.0%) fall into this category.
| Income Bracket | # Households | Median Income |
| 15 to 24 Years | 0 (0.0%) | $0 |
| 25 to 44 Years | 147 (19.3%) | $90,250 |
| 45 to 64 Years | 327 (43.0%) | $94,750 |
| 65+ Years | 287 (37.7%) | $63,661 |
| Total | 761 (100.0%) | $84,609 |
Poverty in Three Way
Income Below Poverty by Sex and Age in Three Way
With 4.6% poverty level for males and 6.1% for females among the residents of Three Way, 5 year old males and 6 to 11 year old females are the most vulnerable to poverty, with 12 males (85.7%) and 10 females (20.0%) in their respective age groups living below the poverty level.
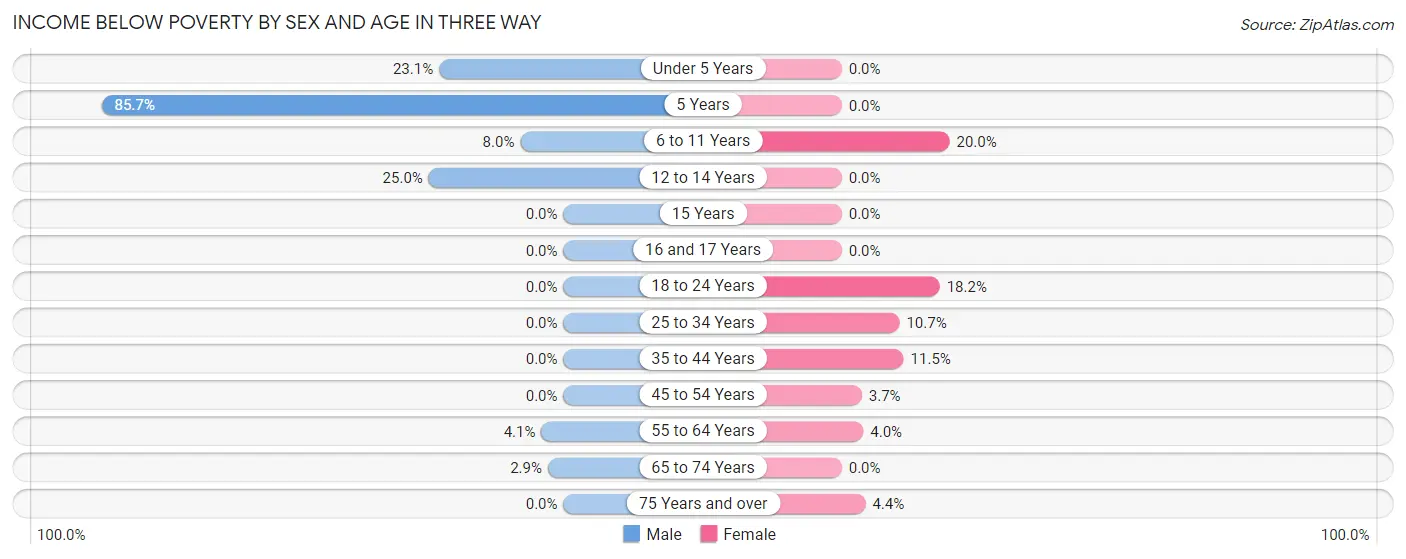
| Age Bracket | Male | Female |
| Under 5 Years | 6 (23.1%) | 0 (0.0%) |
| 5 Years | 12 (85.7%) | 0 (0.0%) |
| 6 to 11 Years | 4 (8.0%) | 10 (20.0%) |
| 12 to 14 Years | 9 (25.0%) | 0 (0.0%) |
| 15 Years | 0 (0.0%) | 0 (0.0%) |
| 16 and 17 Years | 0 (0.0%) | 0 (0.0%) |
| 18 to 24 Years | 0 (0.0%) | 10 (18.2%) |
| 25 to 34 Years | 0 (0.0%) | 9 (10.7%) |
| 35 to 44 Years | 0 (0.0%) | 7 (11.5%) |
| 45 to 54 Years | 0 (0.0%) | 5 (3.7%) |
| 55 to 64 Years | 8 (4.1%) | 7 (4.0%) |
| 65 to 74 Years | 3 (2.9%) | 0 (0.0%) |
| 75 Years and over | 0 (0.0%) | 4 (4.4%) |
| Total | 42 (4.6%) | 52 (6.1%) |
Income Above Poverty by Sex and Age in Three Way
According to the poverty statistics in Three Way, males aged 15 years and females aged under 5 years are the age groups that are most secure financially, with 100.0% of males and 100.0% of females in these age groups living above the poverty line.
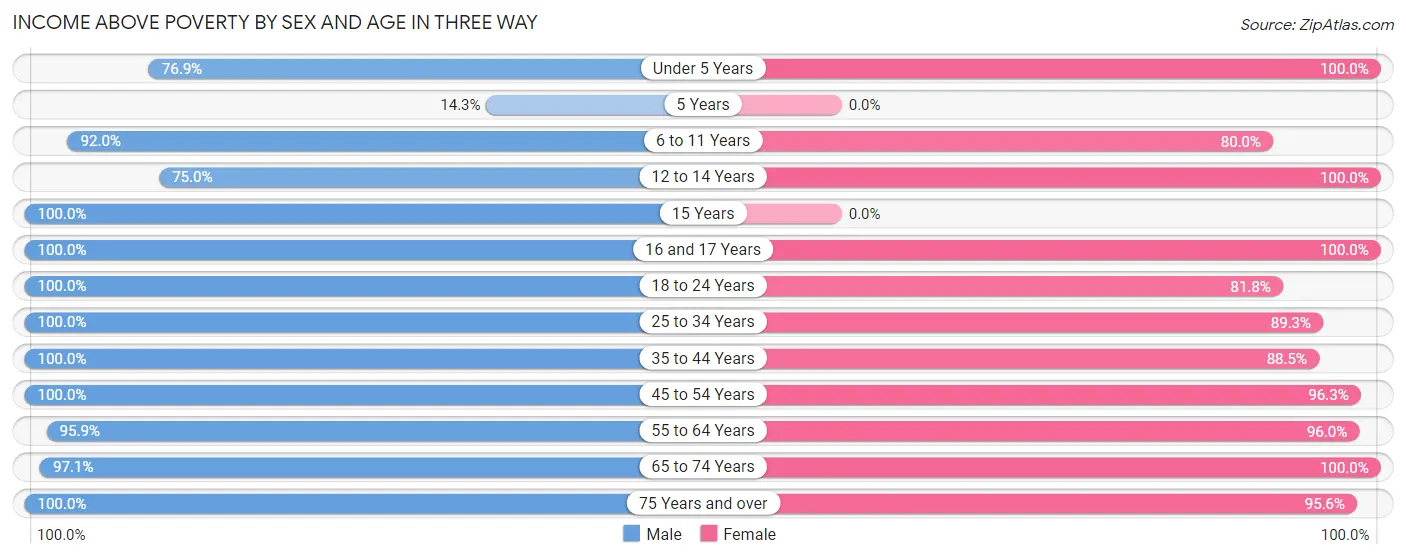
| Age Bracket | Male | Female |
| Under 5 Years | 20 (76.9%) | 12 (100.0%) |
| 5 Years | 2 (14.3%) | 0 (0.0%) |
| 6 to 11 Years | 46 (92.0%) | 40 (80.0%) |
| 12 to 14 Years | 27 (75.0%) | 10 (100.0%) |
| 15 Years | 4 (100.0%) | 0 (0.0%) |
| 16 and 17 Years | 17 (100.0%) | 33 (100.0%) |
| 18 to 24 Years | 23 (100.0%) | 45 (81.8%) |
| 25 to 34 Years | 75 (100.0%) | 75 (89.3%) |
| 35 to 44 Years | 91 (100.0%) | 54 (88.5%) |
| 45 to 54 Years | 111 (100.0%) | 129 (96.3%) |
| 55 to 64 Years | 187 (95.9%) | 168 (96.0%) |
| 65 to 74 Years | 101 (97.1%) | 146 (100.0%) |
| 75 Years and over | 158 (100.0%) | 87 (95.6%) |
| Total | 862 (95.4%) | 799 (93.9%) |
Income Below Poverty Among Married-Couple Families in Three Way
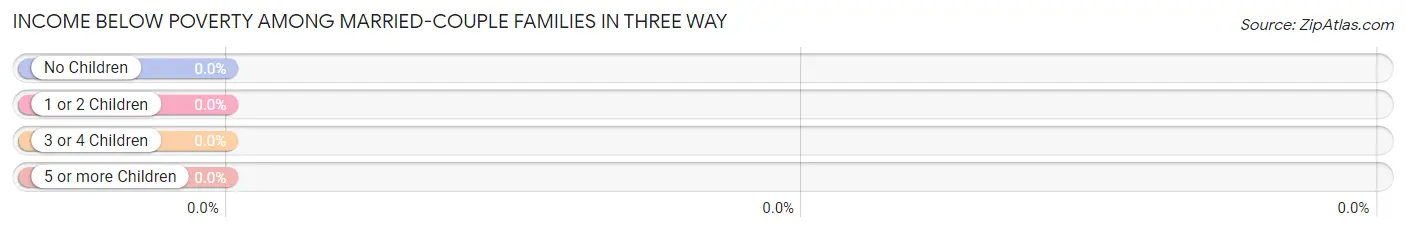
| Children | Above Poverty | Below Poverty |
| No Children | 348 (100.0%) | 0 (0.0%) |
| 1 or 2 Children | 117 (100.0%) | 0 (0.0%) |
| 3 or 4 Children | 8 (100.0%) | 0 (0.0%) |
| 5 or more Children | 0 (0.0%) | 0 (0.0%) |
| Total | 473 (100.0%) | 0 (0.0%) |
Income Below Poverty Among Single-Parent Households in Three Way
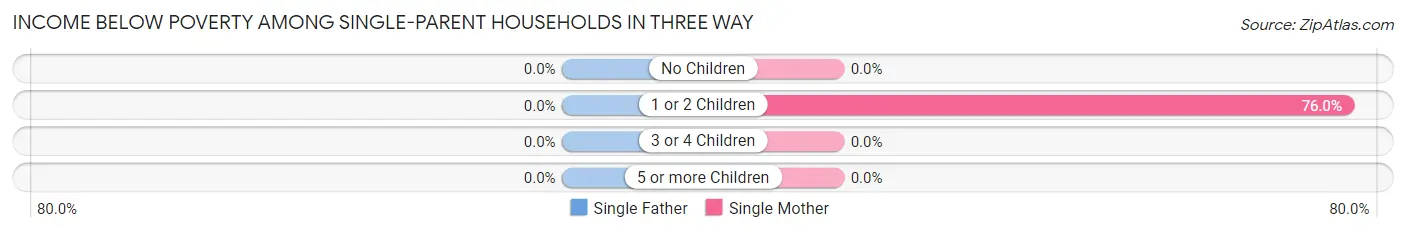
| Children | Single Father | Single Mother |
| No Children | 0 (0.0%) | 0 (0.0%) |
| 1 or 2 Children | 0 (0.0%) | 19 (76.0%) |
| 3 or 4 Children | 0 (0.0%) | 0 (0.0%) |
| 5 or more Children | 0 (0.0%) | 0 (0.0%) |
| Total | 0 (0.0%) | 19 (40.4%) |
Income Below Poverty Among Married-Couple vs Single-Parent Households in Three Way
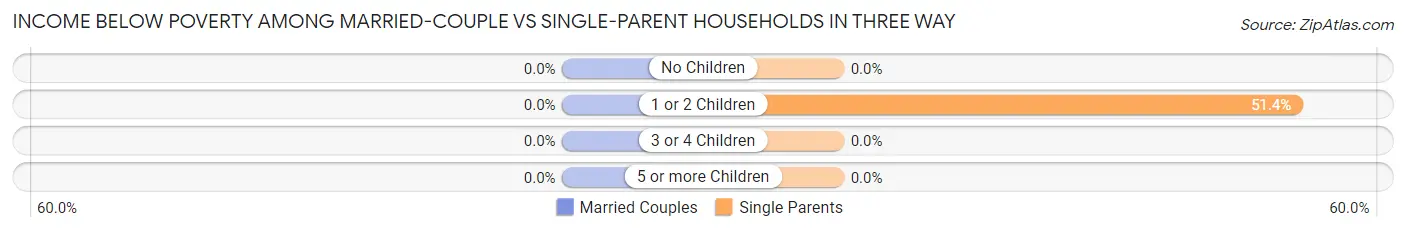
| Children | Married-Couple Families | Single-Parent Households |
| No Children | 0 (0.0%) | 0 (0.0%) |
| 1 or 2 Children | 0 (0.0%) | 19 (51.3%) |
| 3 or 4 Children | 0 (0.0%) | 0 (0.0%) |
| 5 or more Children | 0 (0.0%) | 0 (0.0%) |
| Total | 0 (0.0%) | 19 (29.7%) |
Race in Three Way
The most populous races in Three Way are White / Caucasian (1,315 | 74.9%), Black / African American (316 | 18.0%), and Hispanic or Latino (68 | 3.9%).
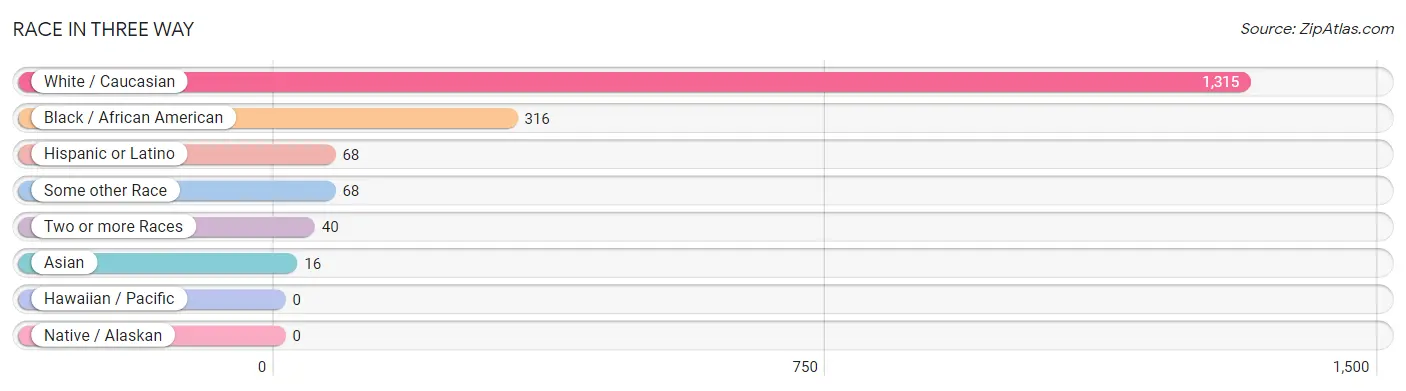
| Race | # Population | % Population |
| Asian | 16 | 0.9% |
| Black / African American | 316 | 18.0% |
| Hawaiian / Pacific | 0 | 0.0% |
| Hispanic or Latino | 68 | 3.9% |
| Native / Alaskan | 0 | 0.0% |
| White / Caucasian | 1,315 | 74.9% |
| Two or more Races | 40 | 2.3% |
| Some other Race | 68 | 3.9% |
| Total | 1,755 | 100.0% |
Ancestry in Three Way
The most populous ancestries reported in Three Way are Irish (211 | 12.0%), English (193 | 11.0%), German (156 | 8.9%), American (147 | 8.4%), and Mexican (61 | 3.5%), together accounting for 43.8% of all Three Way residents.
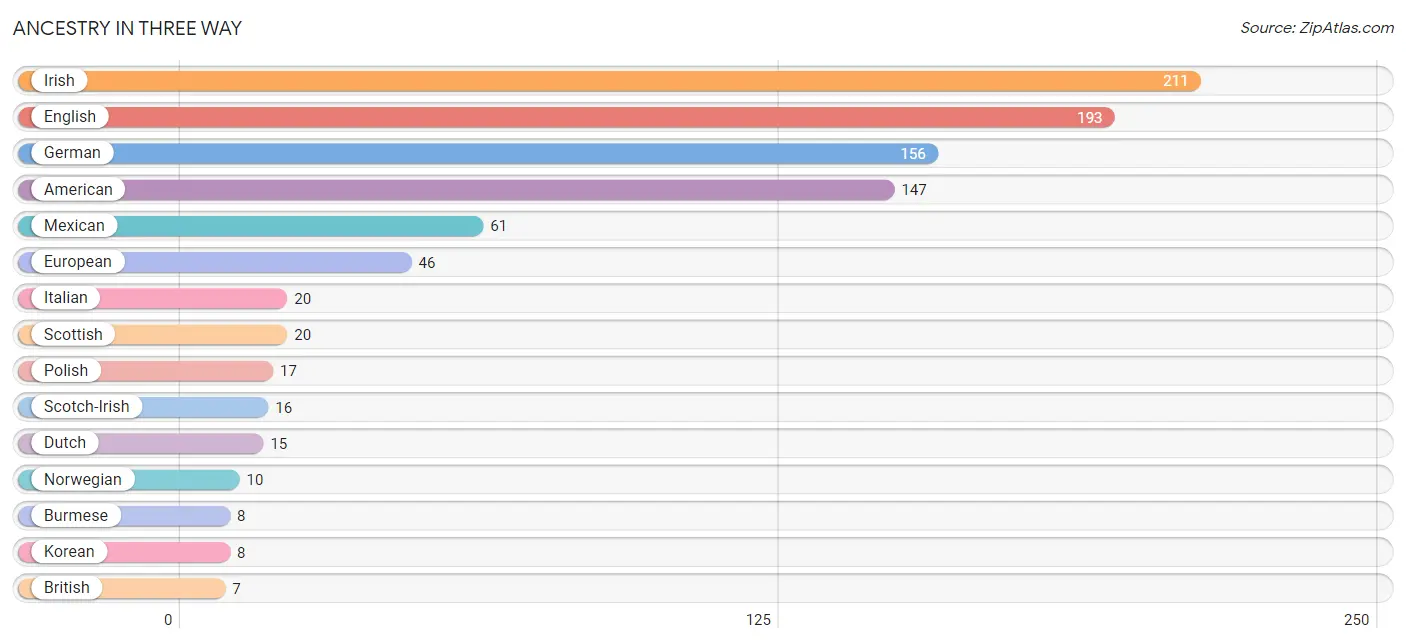
| Ancestry | # Population | % Population |
| American | 147 | 8.4% |
| Belgian | 4 | 0.2% |
| British | 7 | 0.4% |
| Burmese | 8 | 0.5% |
| Cherokee | 5 | 0.3% |
| Colombian | 7 | 0.4% |
| Czech | 3 | 0.2% |
| Dutch | 15 | 0.9% |
| English | 193 | 11.0% |
| European | 46 | 2.6% |
| German | 156 | 8.9% |
| Irish | 211 | 12.0% |
| Italian | 20 | 1.1% |
| Korean | 8 | 0.5% |
| Mexican | 61 | 3.5% |
| Norwegian | 10 | 0.6% |
| Polish | 17 | 1.0% |
| Scotch-Irish | 16 | 0.9% |
| Scottish | 20 | 1.1% |
| South American | 7 | 0.4% |
| Swedish | 4 | 0.2% | View All 21 Rows |
Immigrants in Three Way
The most numerous immigrant groups reported in Three Way came from Latin America (46 | 2.6%), Central America (39 | 2.2%), Mexico (39 | 2.2%), Asia (22 | 1.3%), and Europe (22 | 1.3%), together accounting for 9.6% of all Three Way residents.
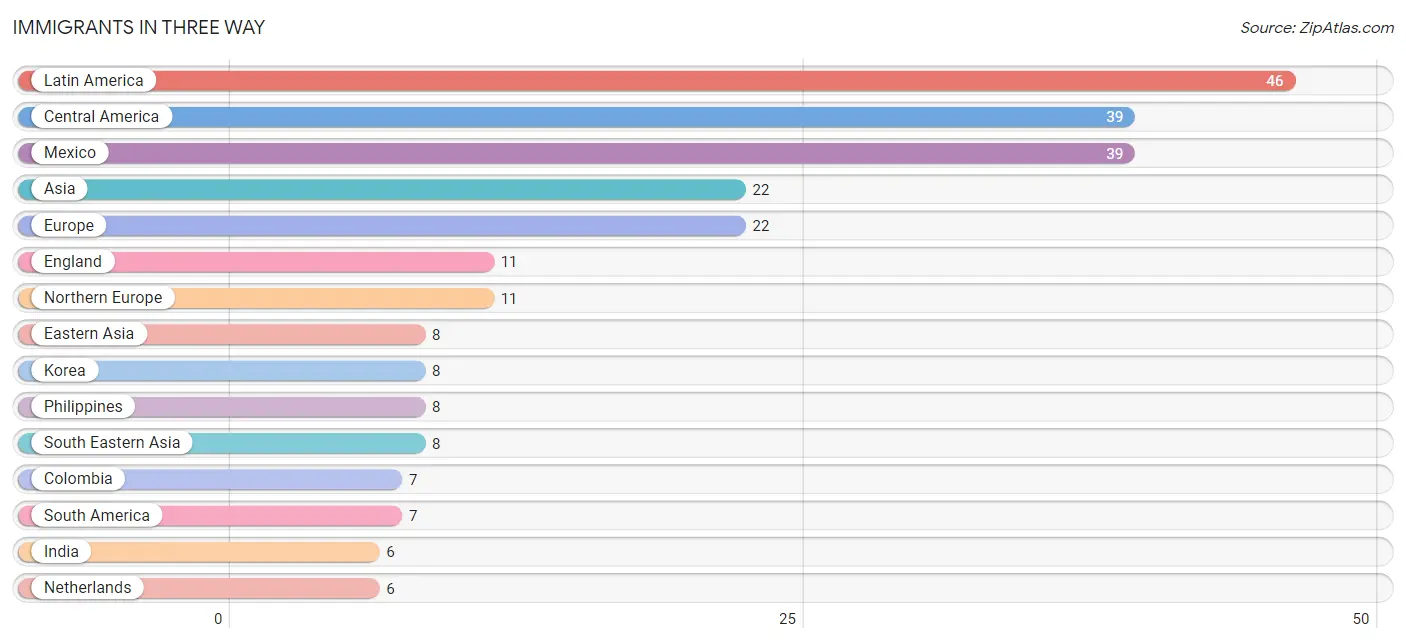
| Immigration Origin | # Population | % Population |
| Asia | 22 | 1.3% |
| Central America | 39 | 2.2% |
| Colombia | 7 | 0.4% |
| Eastern Asia | 8 | 0.5% |
| Eastern Europe | 5 | 0.3% |
| England | 11 | 0.6% |
| Europe | 22 | 1.3% |
| India | 6 | 0.3% |
| Korea | 8 | 0.5% |
| Latin America | 46 | 2.6% |
| Mexico | 39 | 2.2% |
| Netherlands | 6 | 0.3% |
| Northern Europe | 11 | 0.6% |
| Philippines | 8 | 0.5% |
| Poland | 5 | 0.3% |
| South America | 7 | 0.4% |
| South Central Asia | 6 | 0.3% |
| South Eastern Asia | 8 | 0.5% |
| Western Europe | 6 | 0.3% | View All 19 Rows |
Sex and Age in Three Way
Sex and Age in Three Way
The most populous age groups in Three Way are 55 to 59 Years (106 | 11.7%) for men and 55 to 59 Years (116 | 13.6%) for women.
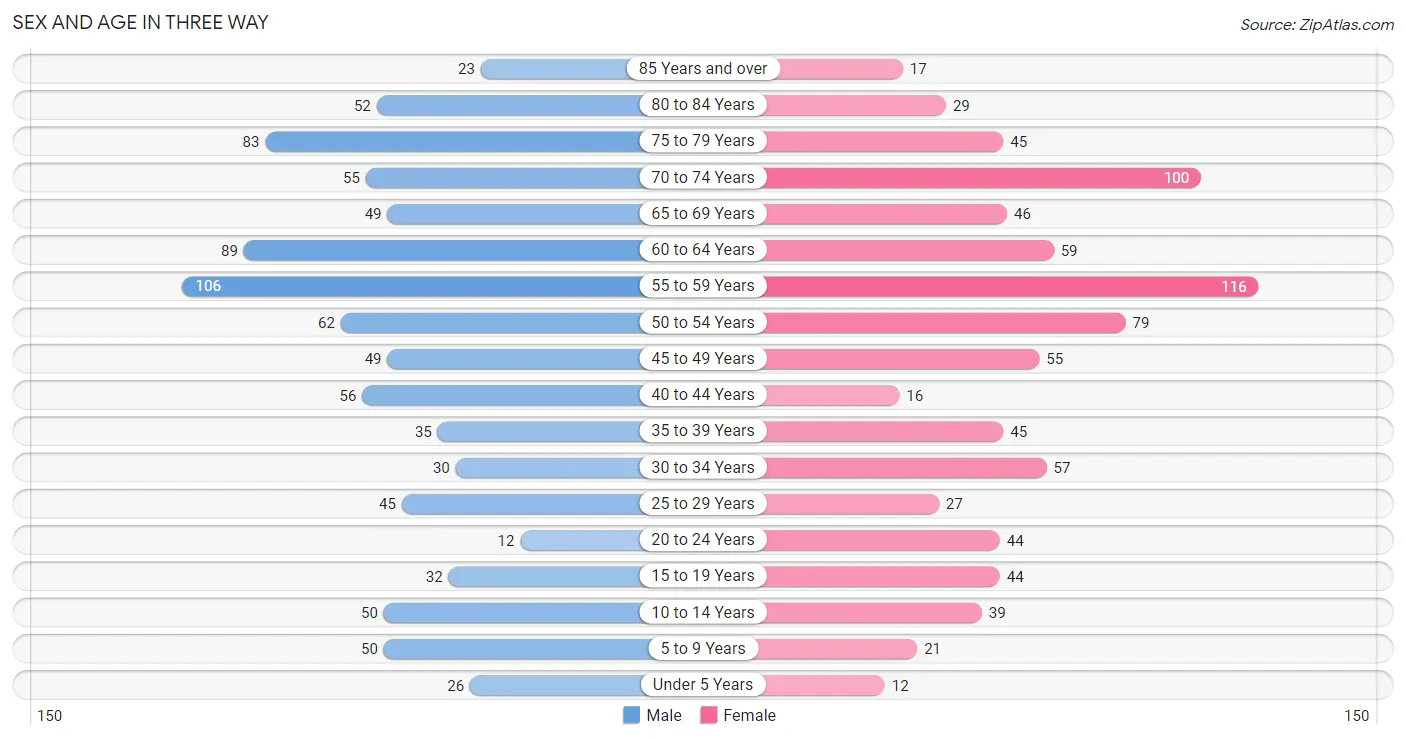
| Age Bracket | Male | Female |
| Under 5 Years | 26 (2.9%) | 12 (1.4%) |
| 5 to 9 Years | 50 (5.5%) | 21 (2.5%) |
| 10 to 14 Years | 50 (5.5%) | 39 (4.6%) |
| 15 to 19 Years | 32 (3.5%) | 44 (5.2%) |
| 20 to 24 Years | 12 (1.3%) | 44 (5.2%) |
| 25 to 29 Years | 45 (5.0%) | 27 (3.2%) |
| 30 to 34 Years | 30 (3.3%) | 57 (6.7%) |
| 35 to 39 Years | 35 (3.9%) | 45 (5.3%) |
| 40 to 44 Years | 56 (6.2%) | 16 (1.9%) |
| 45 to 49 Years | 49 (5.4%) | 55 (6.5%) |
| 50 to 54 Years | 62 (6.9%) | 79 (9.3%) |
| 55 to 59 Years | 106 (11.7%) | 116 (13.6%) |
| 60 to 64 Years | 89 (9.9%) | 59 (6.9%) |
| 65 to 69 Years | 49 (5.4%) | 46 (5.4%) |
| 70 to 74 Years | 55 (6.1%) | 100 (11.7%) |
| 75 to 79 Years | 83 (9.2%) | 45 (5.3%) |
| 80 to 84 Years | 52 (5.8%) | 29 (3.4%) |
| 85 Years and over | 23 (2.5%) | 17 (2.0%) |
| Total | 904 (100.0%) | 851 (100.0%) |
Families and Households in Three Way
Median Family Size in Three Way
The median family size in Three Way is 2.74 persons per family, with single female/mother families (47 | 8.7%) accounting for the largest median family size of 3.02 persons per family. On the other hand, single male/father families (17 | 3.2%) represent the smallest median family size with 2.00 persons per family.
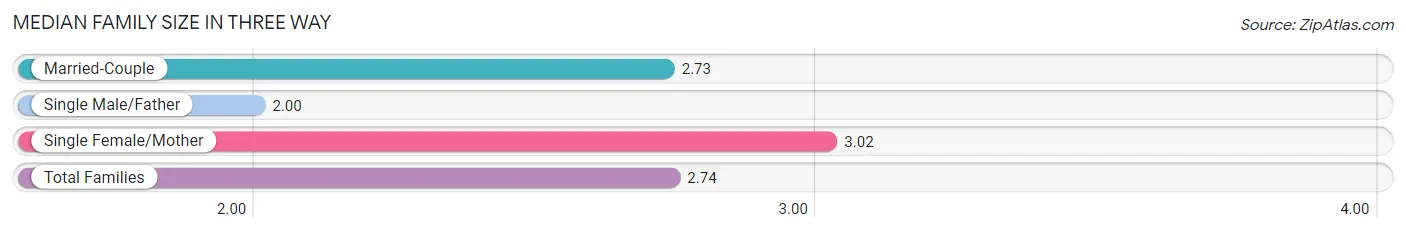
| Family Type | # Families | Family Size |
| Married-Couple | 473 (88.1%) | 2.73 |
| Single Male/Father | 17 (3.2%) | 2.00 |
| Single Female/Mother | 47 (8.7%) | 3.02 |
| Total Families | 537 (100.0%) | 2.74 |
Median Household Size in Three Way
The median household size in Three Way is 2.31 persons per household, with single female/mother households (47 | 6.2%) accounting for the largest median household size of 3.21 persons per household. non-family households (224 | 29.4%) represent the smallest median household size with 1.20 persons per household.
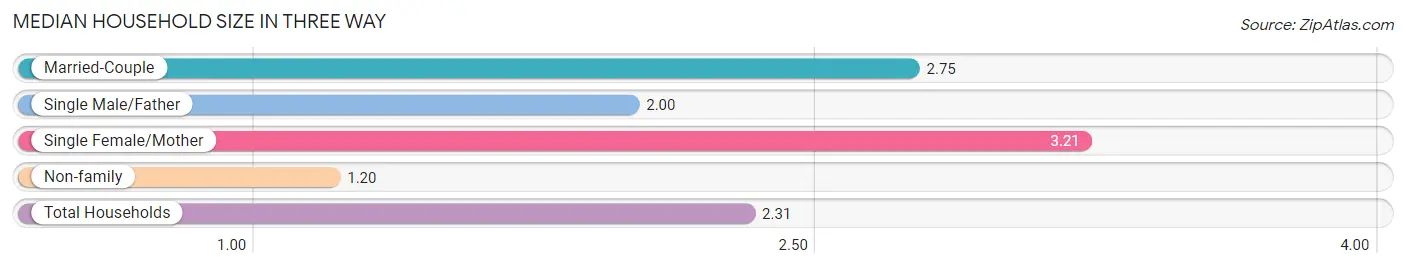
| Household Type | # Households | Household Size |
| Married-Couple | 473 (62.2%) | 2.75 |
| Single Male/Father | 17 (2.2%) | 2.00 |
| Single Female/Mother | 47 (6.2%) | 3.21 |
| Non-family | 224 (29.4%) | 1.20 |
| Total Households | 761 (100.0%) | 2.31 |
Household Size by Marriage Status in Three Way
Out of a total of 761 households in Three Way, 537 (70.6%) are family households, while 224 (29.4%) are nonfamily households. The most numerous type of family households are 2-person households, comprising 324, and the most common type of nonfamily households are 1-person households, comprising 182.
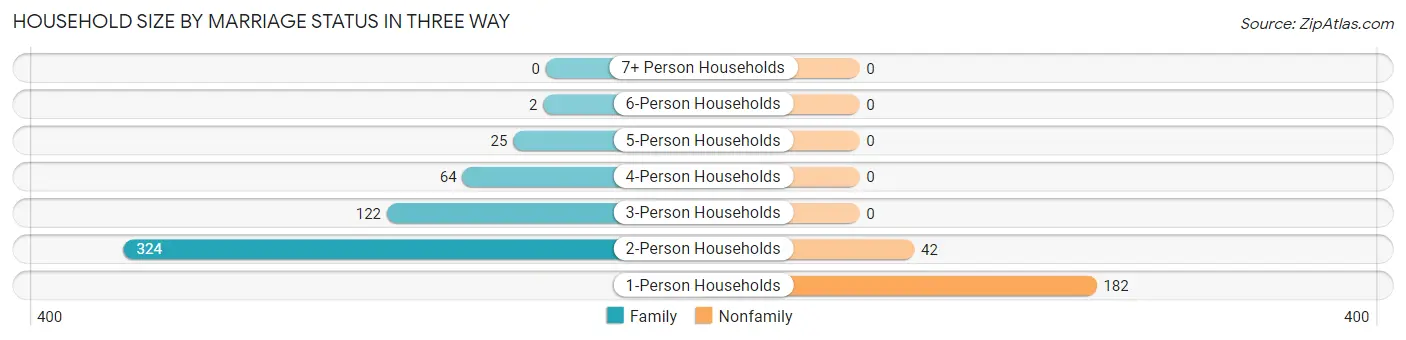
| Household Size | Family Households | Nonfamily Households |
| 1-Person Households | - | 182 (23.9%) |
| 2-Person Households | 324 (42.6%) | 42 (5.5%) |
| 3-Person Households | 122 (16.0%) | 0 (0.0%) |
| 4-Person Households | 64 (8.4%) | 0 (0.0%) |
| 5-Person Households | 25 (3.3%) | 0 (0.0%) |
| 6-Person Households | 2 (0.3%) | 0 (0.0%) |
| 7+ Person Households | 0 (0.0%) | 0 (0.0%) |
| Total | 537 (70.6%) | 224 (29.4%) |
Female Fertility in Three Way
Fertility by Age in Three Way
Average fertility rate in Three Way is 17.0 births per 1,000 women. Women in the age bracket of 20 to 34 years have the highest fertility rate with 23.0 births per 1,000 women. Women in the age bracket of 20 to 34 years acount for 60.0% of all women with births.
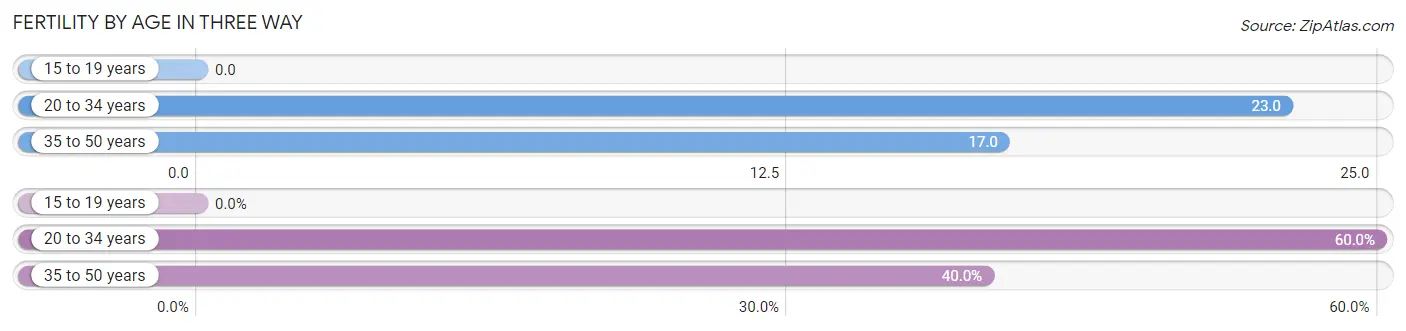
| Age Bracket | Women with Births | Births / 1,000 Women |
| 15 to 19 years | 0 (0.0%) | 0.0 |
| 20 to 34 years | 3 (60.0%) | 23.0 |
| 35 to 50 years | 2 (40.0%) | 17.0 |
| Total | 5 (100.0%) | 17.0 |
Fertility by Age by Marriage Status in Three Way
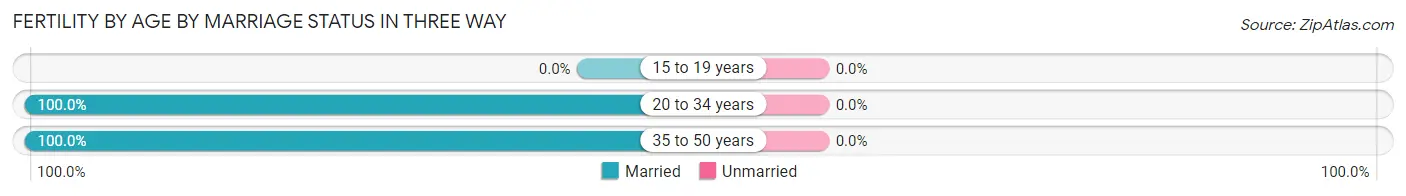
| Age Bracket | Married | Unmarried |
| 15 to 19 years | 0 (0.0%) | 0 (0.0%) |
| 20 to 34 years | 3 (100.0%) | 0 (0.0%) |
| 35 to 50 years | 2 (100.0%) | 0 (0.0%) |
| Total | 5 (100.0%) | 0 (0.0%) |
Fertility by Education in Three Way
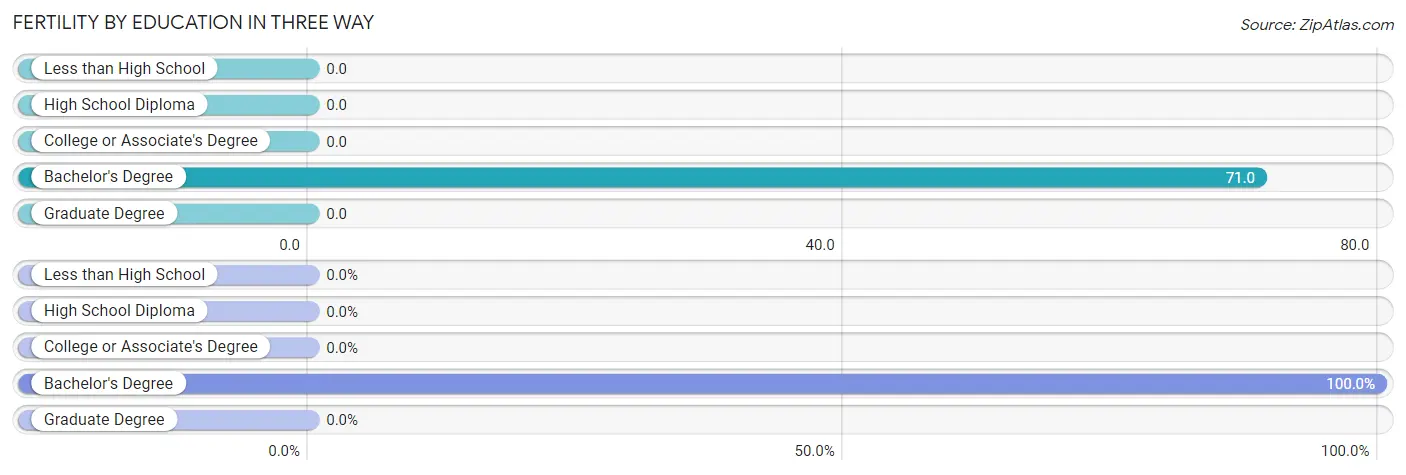
| Educational Attainment | Women with Births | Births / 1,000 Women |
| Less than High School | 0 (0.0%) | 0.0 |
| High School Diploma | 0 (0.0%) | 0.0 |
| College or Associate's Degree | 0 (0.0%) | 0.0 |
| Bachelor's Degree | 5 (100.0%) | 71.0 |
| Graduate Degree | 0 (0.0%) | 0.0 |
| Total | 5 (100.0%) | 17.0 |
Fertility by Education by Marriage Status in Three Way
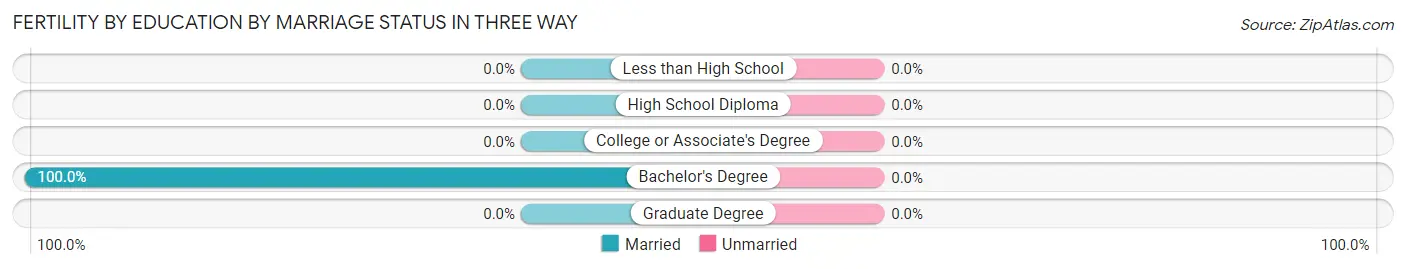
| Educational Attainment | Married | Unmarried |
| Less than High School | 0 (0.0%) | 0 (0.0%) |
| High School Diploma | 0 (0.0%) | 0 (0.0%) |
| College or Associate's Degree | 0 (0.0%) | 0 (0.0%) |
| Bachelor's Degree | 5 (100.0%) | 0 (0.0%) |
| Graduate Degree | 0 (0.0%) | 0 (0.0%) |
| Total | 5 (100.0%) | 0 (0.0%) |
Employment Characteristics in Three Way
Employment by Class of Employer in Three Way
Among the 917 employed individuals in Three Way, private company employees (497 | 54.2%), not-for-profit organizations (118 | 12.9%), and self-employed (not incorporated) (104 | 11.3%) make up the most common classes of employment.
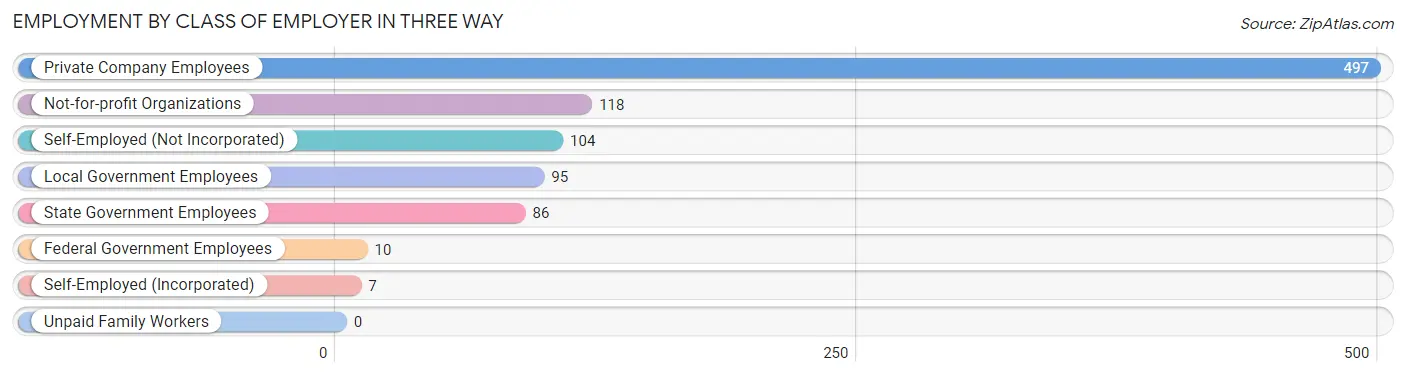
| Employer Class | # Employees | % Employees |
| Private Company Employees | 497 | 54.2% |
| Self-Employed (Incorporated) | 7 | 0.8% |
| Self-Employed (Not Incorporated) | 104 | 11.3% |
| Not-for-profit Organizations | 118 | 12.9% |
| Local Government Employees | 95 | 10.4% |
| State Government Employees | 86 | 9.4% |
| Federal Government Employees | 10 | 1.1% |
| Unpaid Family Workers | 0 | 0.0% |
| Total | 917 | 100.0% |
Employment Status by Age in Three Way
According to the labor force statistics for Three Way, out of the total population over 16 years of age (1,553), 61.6% or 957 individuals are in the labor force, with 4.1% or 39 of them unemployed. The age group with the highest labor force participation rate is 25 to 29 years, with 100.0% or 72 individuals in the labor force. Within the labor force, the 35 to 44 years age range has the highest percentage of unemployed individuals, with 13.7% or 20 of them being unemployed.
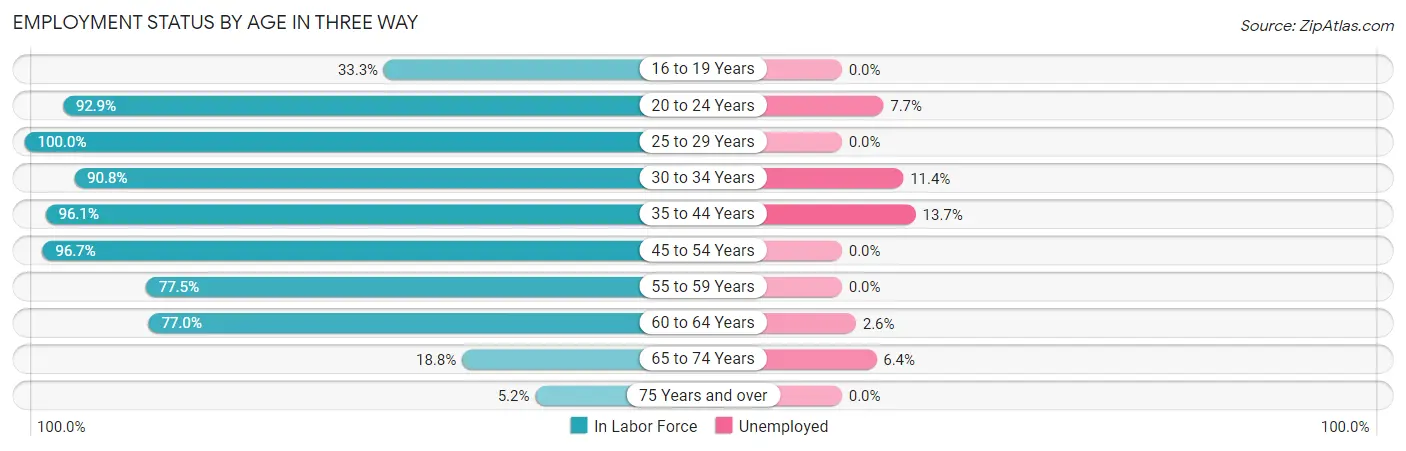
| Age Bracket | In Labor Force | Unemployed |
| 16 to 19 Years | 24 (33.3%) | 0 (0.0%) |
| 20 to 24 Years | 52 (92.9%) | 4 (7.7%) |
| 25 to 29 Years | 72 (100.0%) | 0 (0.0%) |
| 30 to 34 Years | 79 (90.8%) | 9 (11.4%) |
| 35 to 44 Years | 146 (96.1%) | 20 (13.7%) |
| 45 to 54 Years | 237 (96.7%) | 0 (0.0%) |
| 55 to 59 Years | 172 (77.5%) | 0 (0.0%) |
| 60 to 64 Years | 114 (77.0%) | 3 (2.6%) |
| 65 to 74 Years | 47 (18.8%) | 3 (6.4%) |
| 75 Years and over | 13 (5.2%) | 0 (0.0%) |
| Total | 957 (61.6%) | 39 (4.1%) |
Employment Status by Educational Attainment in Three Way
According to labor force statistics for Three Way, 88.6% of individuals (820) out of the total population between 25 and 64 years of age (926) are in the labor force, with 3.9% or 32 of them being unemployed. The group with the highest labor force participation rate are those with the educational attainment of bachelor's degree or higher, with 90.8% or 377 individuals in the labor force. Within the labor force, individuals with college / associate degree education have the highest percentage of unemployment, with 10.7% or 29 of them being unemployed.
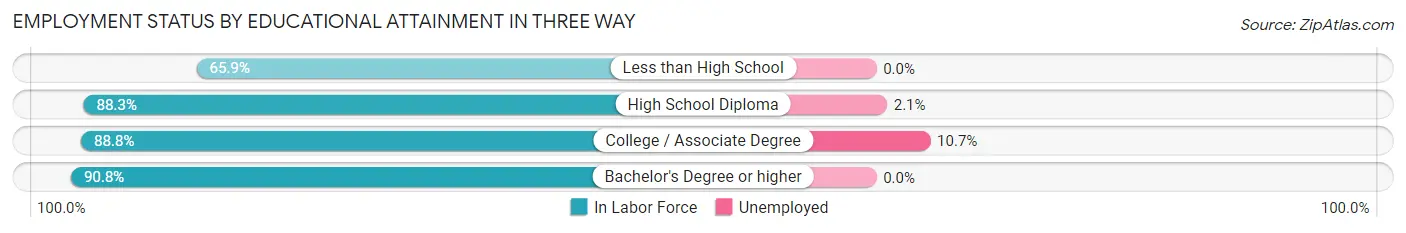
| Educational Attainment | In Labor Force | Unemployed |
| Less than High School | 29 (65.9%) | 0 (0.0%) |
| High School Diploma | 144 (88.3%) | 3 (2.1%) |
| College / Associate Degree | 270 (88.8%) | 33 (10.7%) |
| Bachelor's Degree or higher | 377 (90.8%) | 0 (0.0%) |
| Total | 820 (88.6%) | 36 (3.9%) |
Employment Occupations by Sex in Three Way
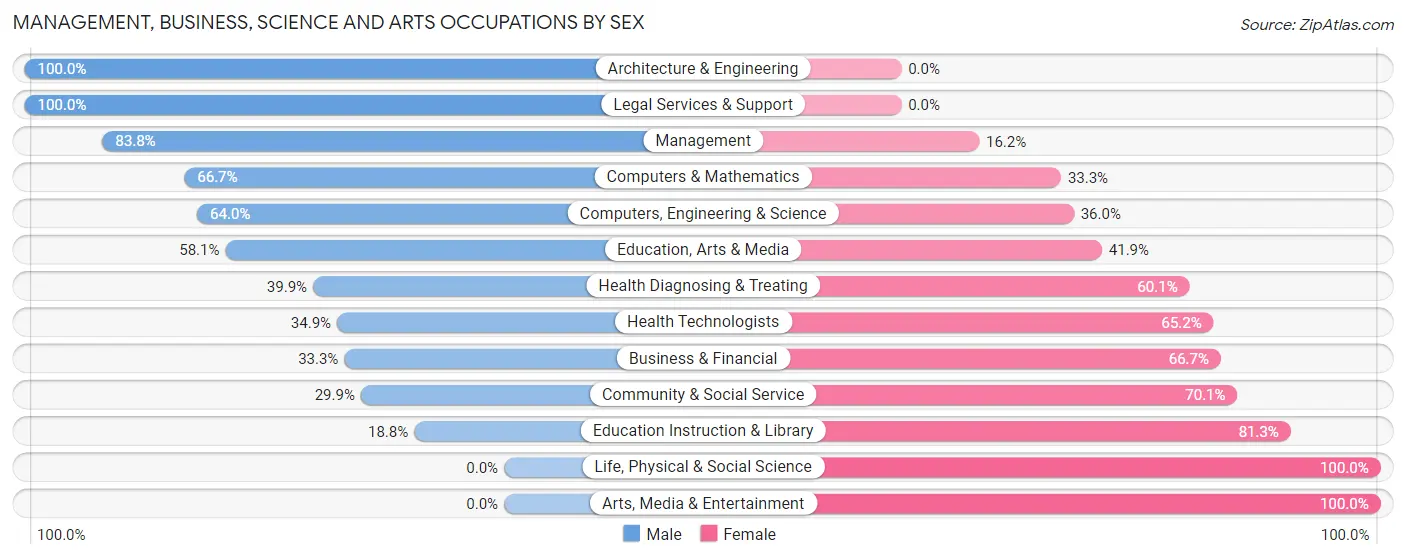
Management, Business, Science and Arts Occupations
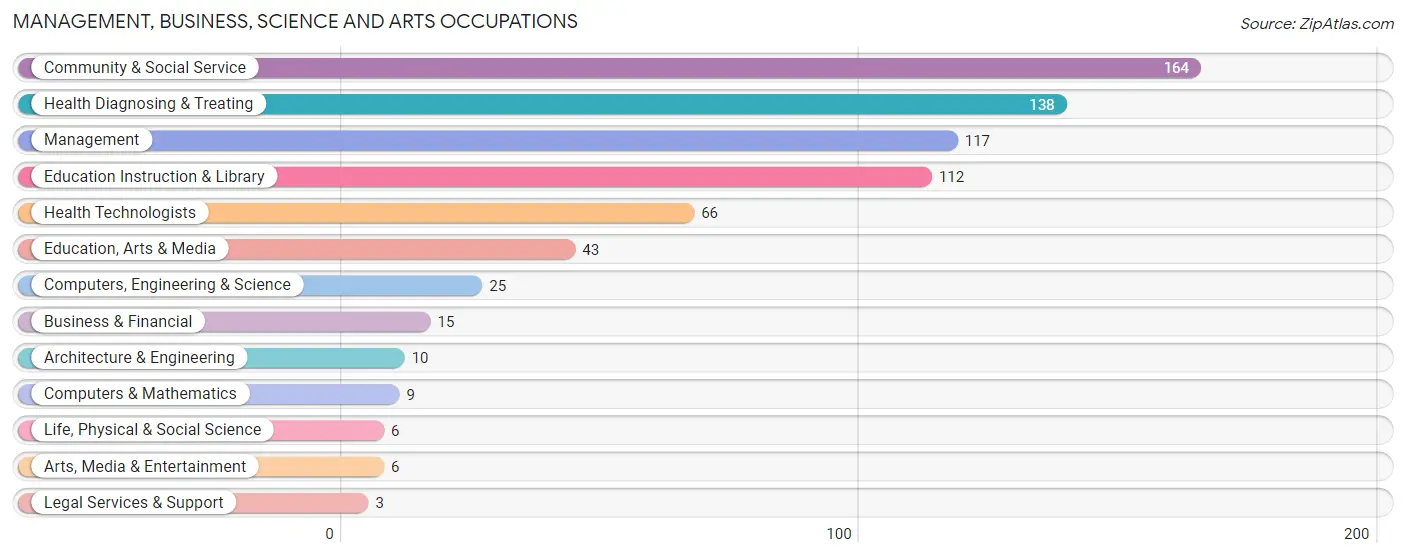
The most common Management, Business, Science and Arts occupations in Three Way are Community & Social Service (164 | 17.9%), Health Diagnosing & Treating (138 | 15.0%), Management (117 | 12.8%), Education Instruction & Library (112 | 12.2%), and Health Technologists (66 | 7.2%).
Management, Business, Science and Arts Occupations by Sex
Within the Management, Business, Science and Arts occupations in Three Way, the most male-oriented occupations are Architecture & Engineering (100.0%), Legal Services & Support (100.0%), and Management (83.8%), while the most female-oriented occupations are Life, Physical & Social Science (100.0%), Arts, Media & Entertainment (100.0%), and Education Instruction & Library (81.2%).
| Occupation | Male | Female |
| Management | 98 (83.8%) | 19 (16.2%) |
| Business & Financial | 5 (33.3%) | 10 (66.7%) |
| Computers, Engineering & Science | 16 (64.0%) | 9 (36.0%) |
| Computers & Mathematics | 6 (66.7%) | 3 (33.3%) |
| Architecture & Engineering | 10 (100.0%) | 0 (0.0%) |
| Life, Physical & Social Science | 0 (0.0%) | 6 (100.0%) |
| Community & Social Service | 49 (29.9%) | 115 (70.1%) |
| Education, Arts & Media | 25 (58.1%) | 18 (41.9%) |
| Legal Services & Support | 3 (100.0%) | 0 (0.0%) |
| Education Instruction & Library | 21 (18.8%) | 91 (81.2%) |
| Arts, Media & Entertainment | 0 (0.0%) | 6 (100.0%) |
| Health Diagnosing & Treating | 55 (39.9%) | 83 (60.1%) |
| Health Technologists | 23 (34.8%) | 43 (65.1%) |
| Total (Category) | 223 (48.6%) | 236 (51.4%) |
| Total (Overall) | 447 (48.7%) | 470 (51.2%) |
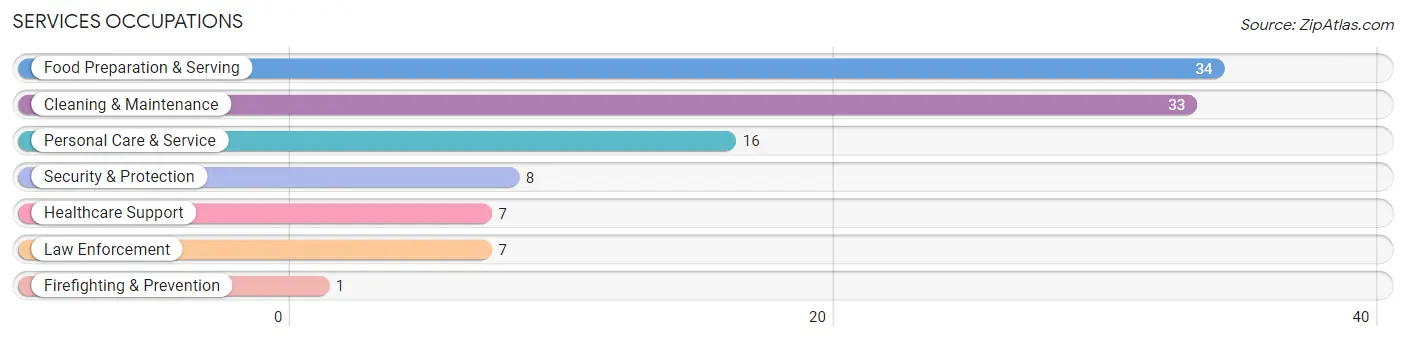
Services Occupations
The most common Services occupations in Three Way are Food Preparation & Serving (34 | 3.7%), Cleaning & Maintenance (33 | 3.6%), Personal Care & Service (16 | 1.7%), Security & Protection (8 | 0.9%), and Healthcare Support (7 | 0.8%).
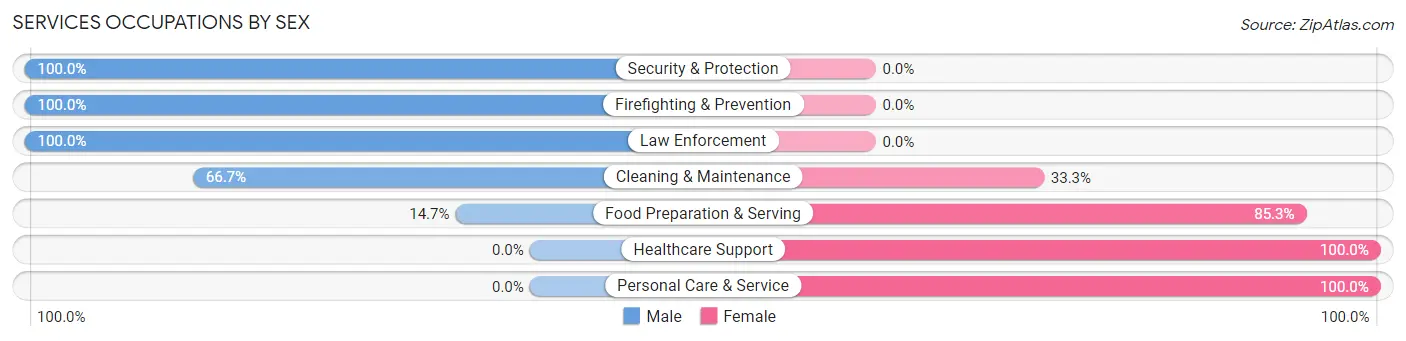
Services Occupations by Sex
Within the Services occupations in Three Way, the most male-oriented occupations are Security & Protection (100.0%), Firefighting & Prevention (100.0%), and Law Enforcement (100.0%), while the most female-oriented occupations are Healthcare Support (100.0%), Personal Care & Service (100.0%), and Food Preparation & Serving (85.3%).
| Occupation | Male | Female |
| Healthcare Support | 0 (0.0%) | 7 (100.0%) |
| Security & Protection | 8 (100.0%) | 0 (0.0%) |
| Firefighting & Prevention | 1 (100.0%) | 0 (0.0%) |
| Law Enforcement | 7 (100.0%) | 0 (0.0%) |
| Food Preparation & Serving | 5 (14.7%) | 29 (85.3%) |
| Cleaning & Maintenance | 22 (66.7%) | 11 (33.3%) |
| Personal Care & Service | 0 (0.0%) | 16 (100.0%) |
| Total (Category) | 35 (35.7%) | 63 (64.3%) |
| Total (Overall) | 447 (48.7%) | 470 (51.2%) |
Sales and Office Occupations
The most common Sales and Office occupations in Three Way are Office & Administration (100 | 10.9%), and Sales & Related (86 | 9.4%).
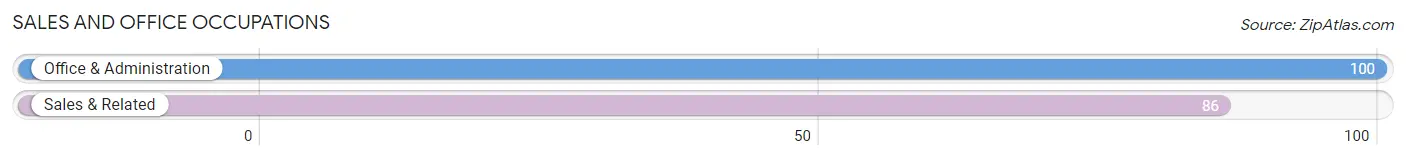
Sales and Office Occupations by Sex
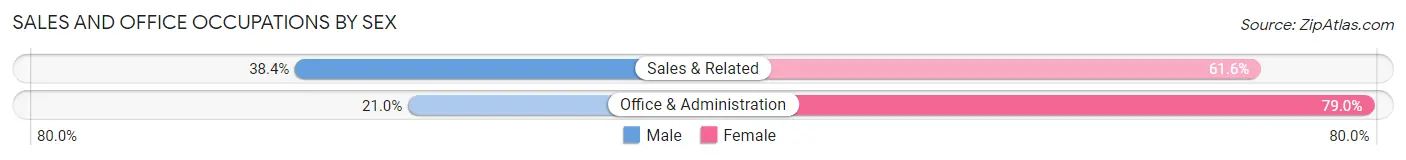
| Occupation | Male | Female |
| Sales & Related | 33 (38.4%) | 53 (61.6%) |
| Office & Administration | 21 (21.0%) | 79 (79.0%) |
| Total (Category) | 54 (29.0%) | 132 (71.0%) |
| Total (Overall) | 447 (48.7%) | 470 (51.2%) |
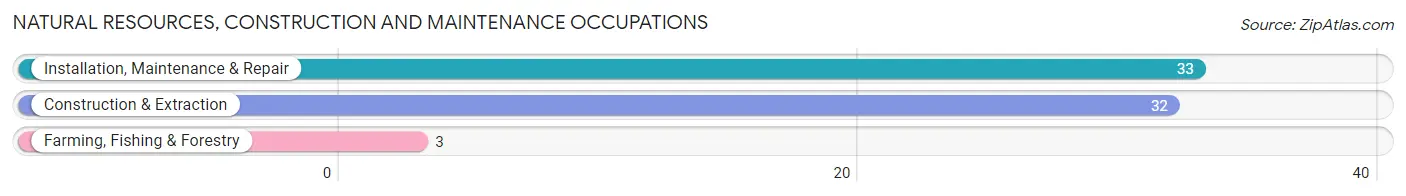
Natural Resources, Construction and Maintenance Occupations
The most common Natural Resources, Construction and Maintenance occupations in Three Way are Installation, Maintenance & Repair (33 | 3.6%), Construction & Extraction (32 | 3.5%), and Farming, Fishing & Forestry (3 | 0.3%).
Natural Resources, Construction and Maintenance Occupations by Sex
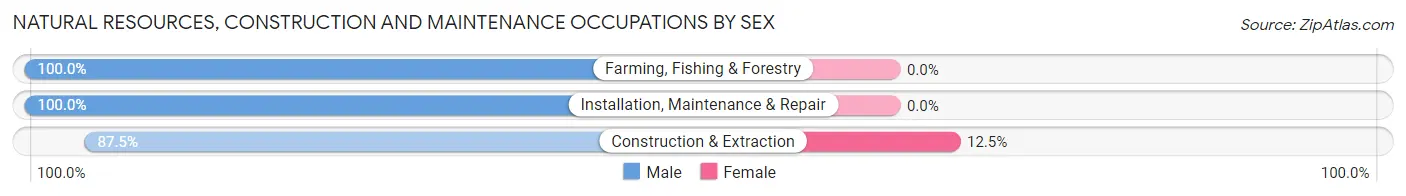
| Occupation | Male | Female |
| Farming, Fishing & Forestry | 3 (100.0%) | 0 (0.0%) |
| Construction & Extraction | 28 (87.5%) | 4 (12.5%) |
| Installation, Maintenance & Repair | 33 (100.0%) | 0 (0.0%) |
| Total (Category) | 64 (94.1%) | 4 (5.9%) |
| Total (Overall) | 447 (48.7%) | 470 (51.2%) |
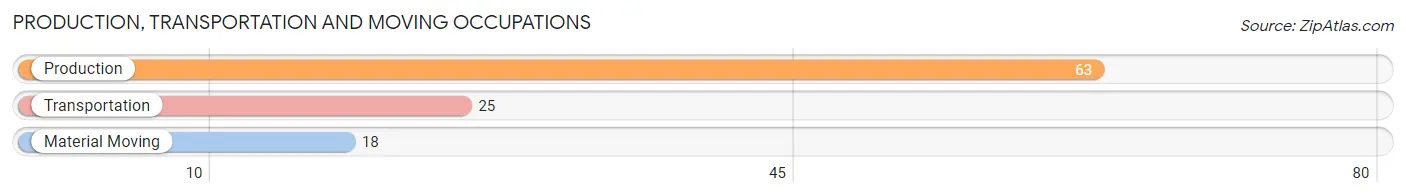
Production, Transportation and Moving Occupations
The most common Production, Transportation and Moving occupations in Three Way are Production (63 | 6.9%), Transportation (25 | 2.7%), and Material Moving (18 | 2.0%).
Production, Transportation and Moving Occupations by Sex
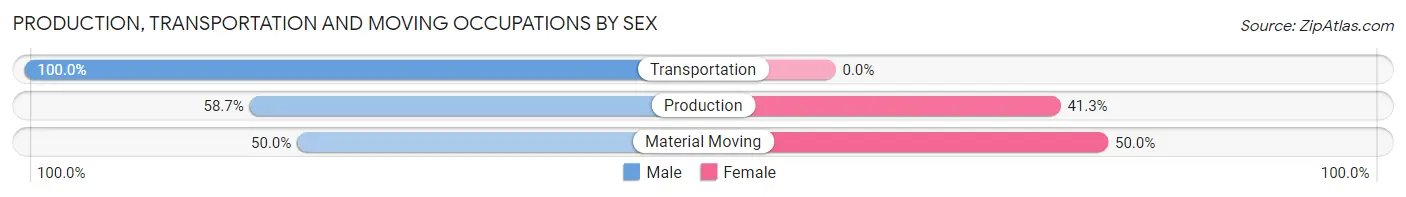
| Occupation | Male | Female |
| Production | 37 (58.7%) | 26 (41.3%) |
| Transportation | 25 (100.0%) | 0 (0.0%) |
| Material Moving | 9 (50.0%) | 9 (50.0%) |
| Total (Category) | 71 (67.0%) | 35 (33.0%) |
| Total (Overall) | 447 (48.7%) | 470 (51.2%) |
Employment Industries by Sex in Three Way
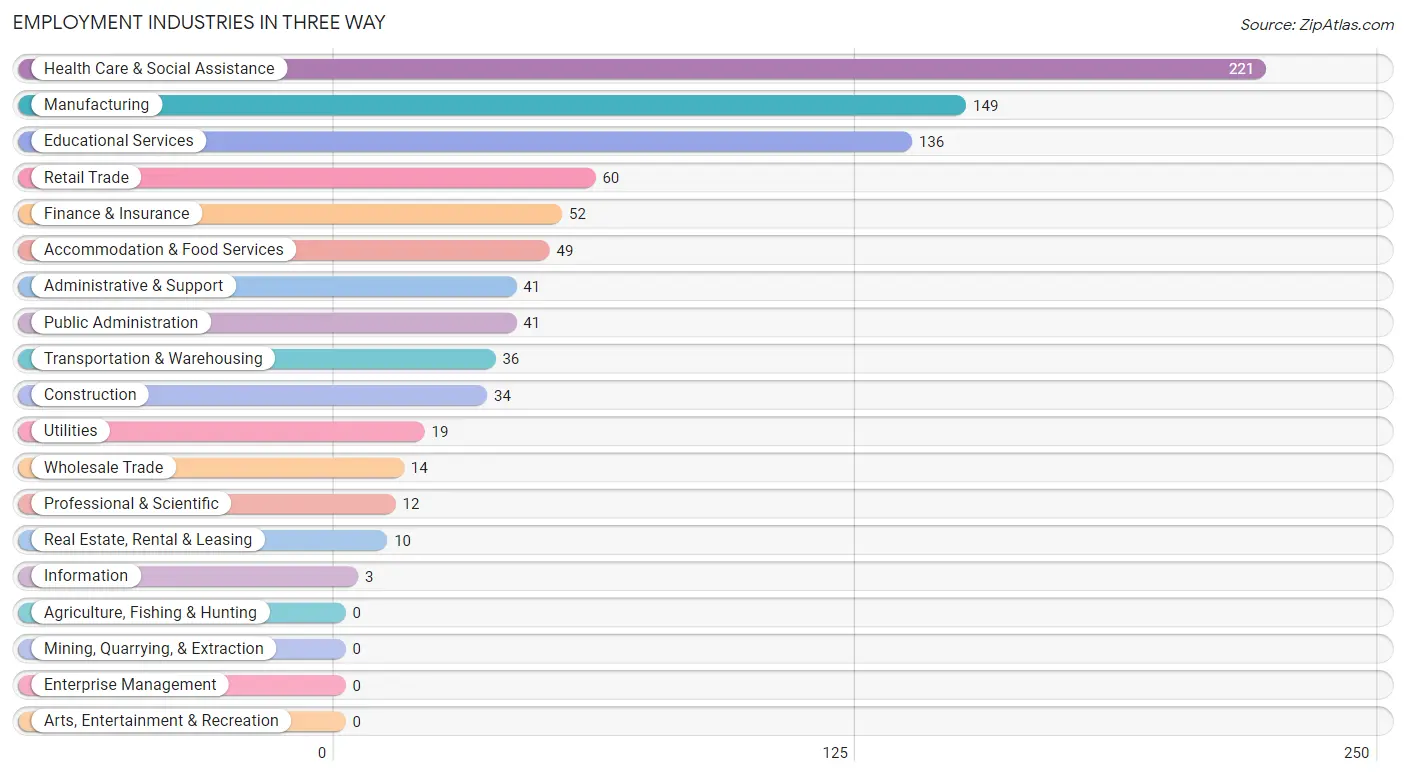
Employment Industries in Three Way
The major employment industries in Three Way include Health Care & Social Assistance (221 | 24.1%), Manufacturing (149 | 16.3%), Educational Services (136 | 14.8%), Retail Trade (60 | 6.5%), and Finance & Insurance (52 | 5.7%).
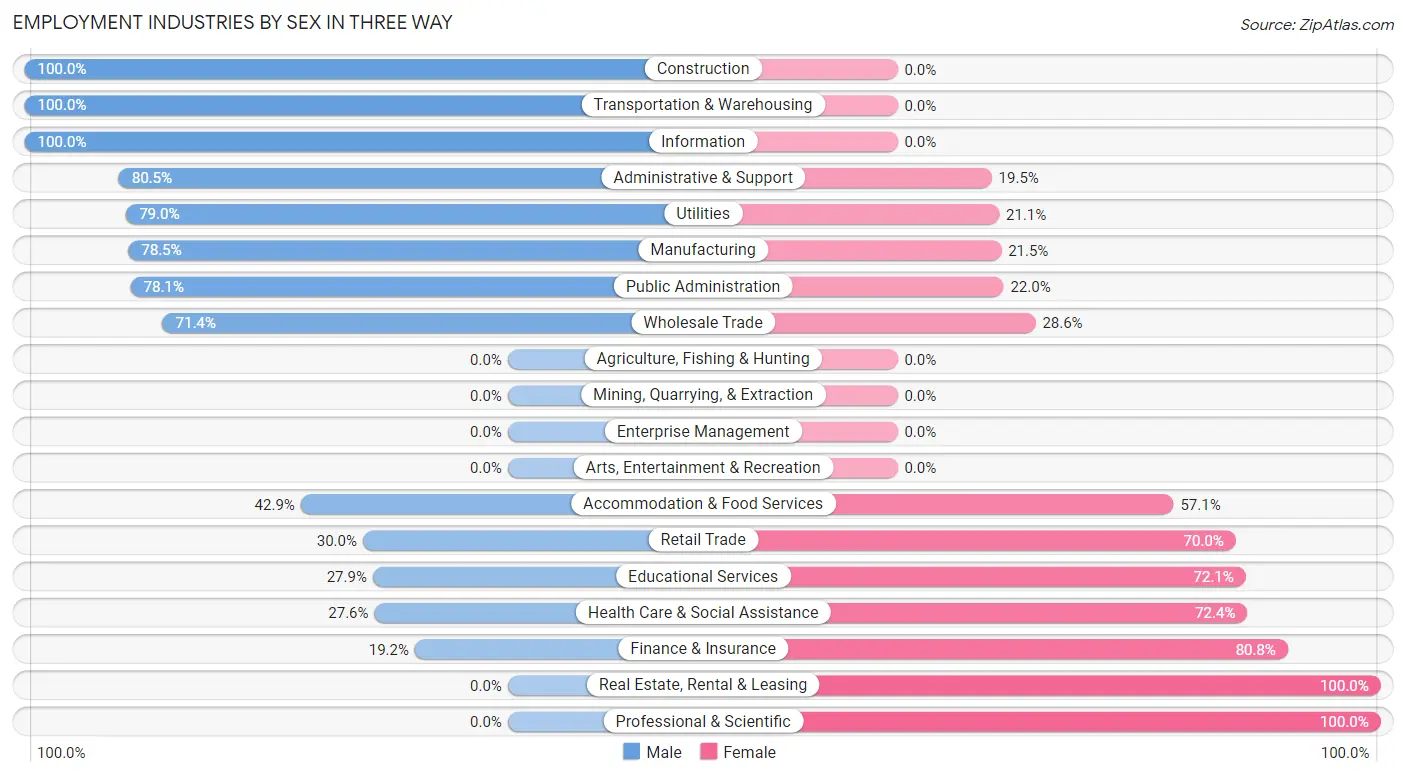
Employment Industries by Sex in Three Way
The Three Way industries that see more men than women are Construction (100.0%), Transportation & Warehousing (100.0%), and Information (100.0%), whereas the industries that tend to have a higher number of women are Real Estate, Rental & Leasing (100.0%), Professional & Scientific (100.0%), and Finance & Insurance (80.8%).
| Industry | Male | Female |
| Agriculture, Fishing & Hunting | 0 (0.0%) | 0 (0.0%) |
| Mining, Quarrying, & Extraction | 0 (0.0%) | 0 (0.0%) |
| Construction | 34 (100.0%) | 0 (0.0%) |
| Manufacturing | 117 (78.5%) | 32 (21.5%) |
| Wholesale Trade | 10 (71.4%) | 4 (28.6%) |
| Retail Trade | 18 (30.0%) | 42 (70.0%) |
| Transportation & Warehousing | 36 (100.0%) | 0 (0.0%) |
| Utilities | 15 (78.9%) | 4 (21.0%) |
| Information | 3 (100.0%) | 0 (0.0%) |
| Finance & Insurance | 10 (19.2%) | 42 (80.8%) |
| Real Estate, Rental & Leasing | 0 (0.0%) | 10 (100.0%) |
| Professional & Scientific | 0 (0.0%) | 12 (100.0%) |
| Enterprise Management | 0 (0.0%) | 0 (0.0%) |
| Administrative & Support | 33 (80.5%) | 8 (19.5%) |
| Educational Services | 38 (27.9%) | 98 (72.1%) |
| Health Care & Social Assistance | 61 (27.6%) | 160 (72.4%) |
| Arts, Entertainment & Recreation | 0 (0.0%) | 0 (0.0%) |
| Accommodation & Food Services | 21 (42.9%) | 28 (57.1%) |
| Public Administration | 32 (78.0%) | 9 (22.0%) |
| Total | 447 (48.7%) | 470 (51.2%) |
Education in Three Way
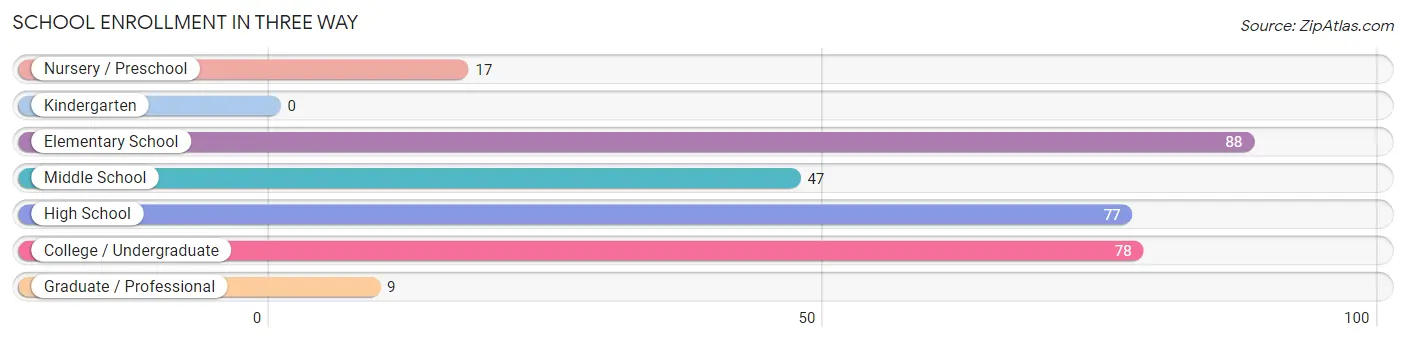
School Enrollment in Three Way
The most common levels of schooling among the 316 students in Three Way are elementary school (88 | 27.9%), college / undergraduate (78 | 24.7%), and high school (77 | 24.4%).
| School Level | # Students | % Students |
| Nursery / Preschool | 17 | 5.4% |
| Kindergarten | 0 | 0.0% |
| Elementary School | 88 | 27.9% |
| Middle School | 47 | 14.9% |
| High School | 77 | 24.4% |
| College / Undergraduate | 78 | 24.7% |
| Graduate / Professional | 9 | 2.9% |
| Total | 316 | 100.0% |
School Enrollment by Age by Funding Source in Three Way
Out of a total of 316 students who are enrolled in schools in Three Way, 84 (26.6%) attend a private institution, while the remaining 232 (73.4%) are enrolled in public schools. The age group of 15 to 17 year olds has the highest likelihood of being enrolled in private schools, with 33 (61.1% in the age bracket) enrolled. Conversely, the age group of 20 to 24 year olds has the lowest likelihood of being enrolled in a private school, with 35 (100.0% in the age bracket) attending a public institution.
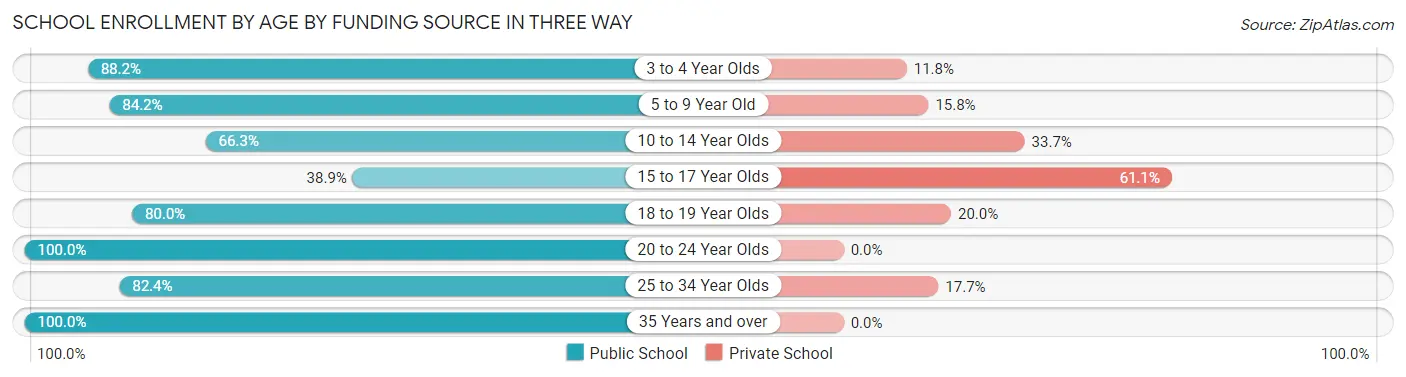
| Age Bracket | Public School | Private School |
| 3 to 4 Year Olds | 15 (88.2%) | 2 (11.8%) |
| 5 to 9 Year Old | 48 (84.2%) | 9 (15.8%) |
| 10 to 14 Year Olds | 59 (66.3%) | 30 (33.7%) |
| 15 to 17 Year Olds | 21 (38.9%) | 33 (61.1%) |
| 18 to 19 Year Olds | 16 (80.0%) | 4 (20.0%) |
| 20 to 24 Year Olds | 35 (100.0%) | 0 (0.0%) |
| 25 to 34 Year Olds | 28 (82.4%) | 6 (17.6%) |
| 35 Years and over | 10 (100.0%) | 0 (0.0%) |
| Total | 232 (73.4%) | 84 (26.6%) |
Educational Attainment by Field of Study in Three Way
Business (125 | 23.1%), education (124 | 22.9%), science & technology (83 | 15.3%), bio, nature & agricultural (45 | 8.3%), and arts & humanities (37 | 6.8%) are the most common fields of study among 541 individuals in Three Way who have obtained a bachelor's degree or higher.
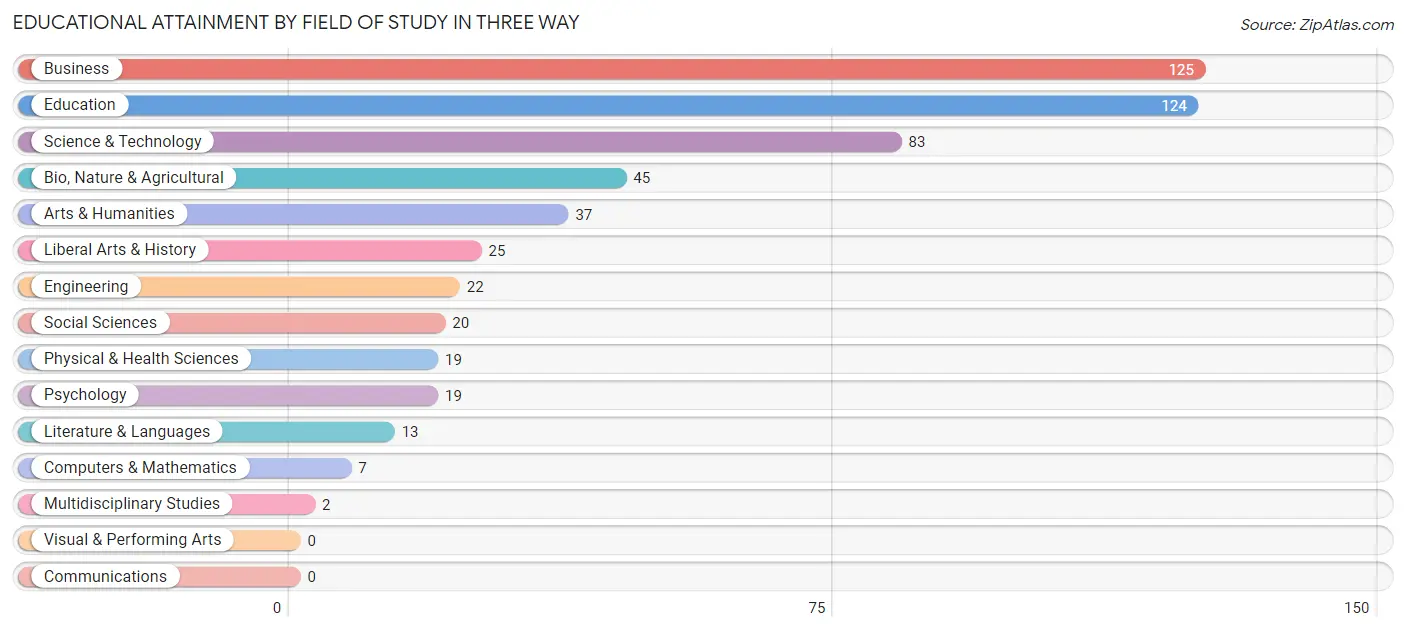
| Field of Study | # Graduates | % Graduates |
| Computers & Mathematics | 7 | 1.3% |
| Bio, Nature & Agricultural | 45 | 8.3% |
| Physical & Health Sciences | 19 | 3.5% |
| Psychology | 19 | 3.5% |
| Social Sciences | 20 | 3.7% |
| Engineering | 22 | 4.1% |
| Multidisciplinary Studies | 2 | 0.4% |
| Science & Technology | 83 | 15.3% |
| Business | 125 | 23.1% |
| Education | 124 | 22.9% |
| Literature & Languages | 13 | 2.4% |
| Liberal Arts & History | 25 | 4.6% |
| Visual & Performing Arts | 0 | 0.0% |
| Communications | 0 | 0.0% |
| Arts & Humanities | 37 | 6.8% |
| Total | 541 | 100.0% |
Transportation & Commute in Three Way
Vehicle Availability by Sex in Three Way
The most prevalent vehicle ownership categories in Three Way are males with 3 vehicles (189, accounting for 42.3%) and females with 3 vehicles (163, making up 40.2%).
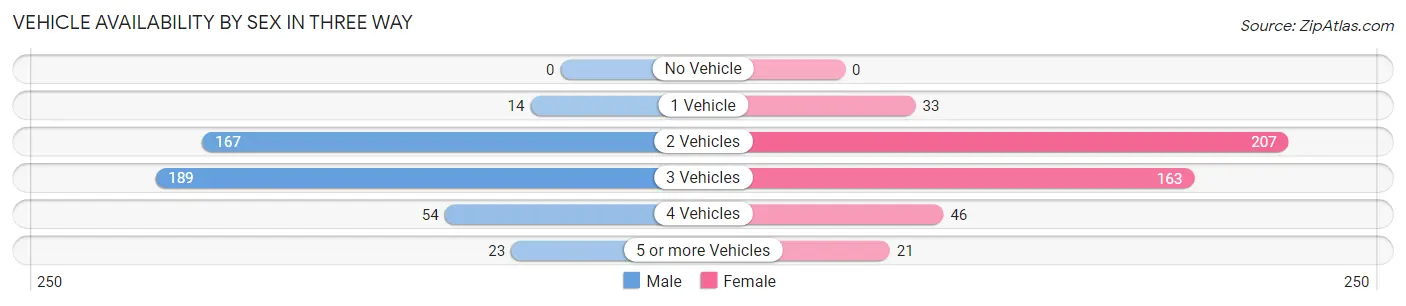
| Vehicles Available | Male | Female |
| No Vehicle | 0 (0.0%) | 0 (0.0%) |
| 1 Vehicle | 14 (3.1%) | 33 (7.0%) |
| 2 Vehicles | 167 (37.4%) | 207 (44.0%) |
| 3 Vehicles | 189 (42.3%) | 163 (34.7%) |
| 4 Vehicles | 54 (12.1%) | 46 (9.8%) |
| 5 or more Vehicles | 23 (5.1%) | 21 (4.5%) |
| Total | 447 (100.0%) | 470 (100.0%) |
Commute Time in Three Way
The most frequently occuring commute durations in Three Way are 20 to 24 minutes (219 commuters, 25.7%), 15 to 19 minutes (167 commuters, 19.6%), and 10 to 14 minutes (153 commuters, 18.0%).
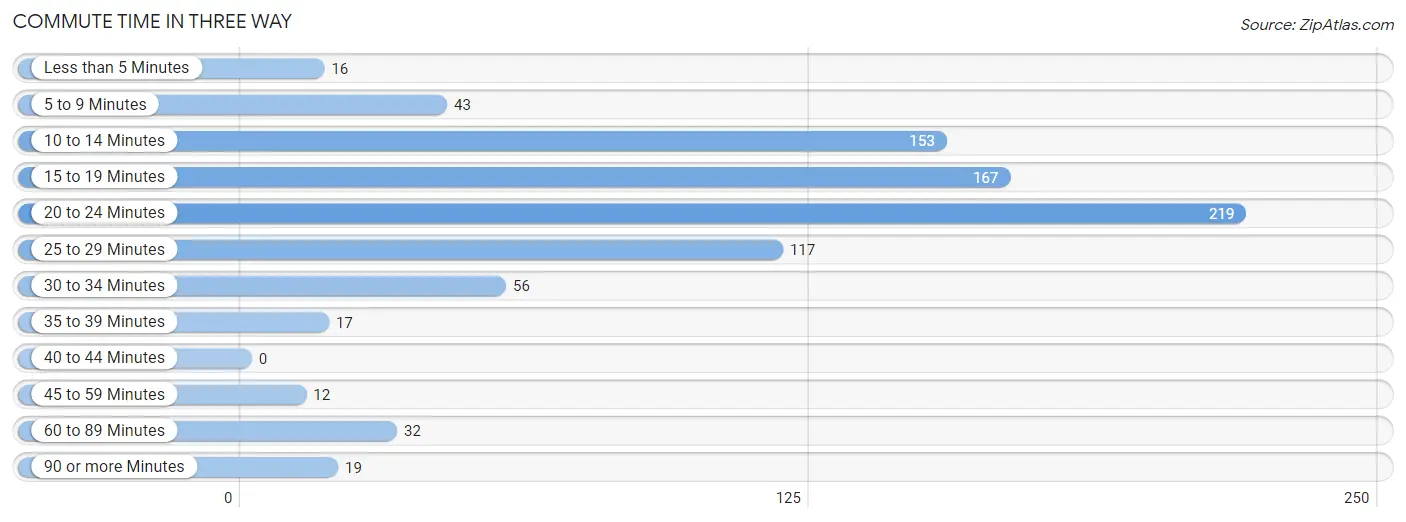
| Commute Time | # Commuters | % Commuters |
| Less than 5 Minutes | 16 | 1.9% |
| 5 to 9 Minutes | 43 | 5.1% |
| 10 to 14 Minutes | 153 | 18.0% |
| 15 to 19 Minutes | 167 | 19.6% |
| 20 to 24 Minutes | 219 | 25.7% |
| 25 to 29 Minutes | 117 | 13.8% |
| 30 to 34 Minutes | 56 | 6.6% |
| 35 to 39 Minutes | 17 | 2.0% |
| 40 to 44 Minutes | 0 | 0.0% |
| 45 to 59 Minutes | 12 | 1.4% |
| 60 to 89 Minutes | 32 | 3.8% |
| 90 or more Minutes | 19 | 2.2% |
Commute Time by Sex in Three Way
The most common commute times in Three Way are 20 to 24 minutes (101 commuters, 24.9%) for males and 15 to 19 minutes (122 commuters, 27.4%) for females.
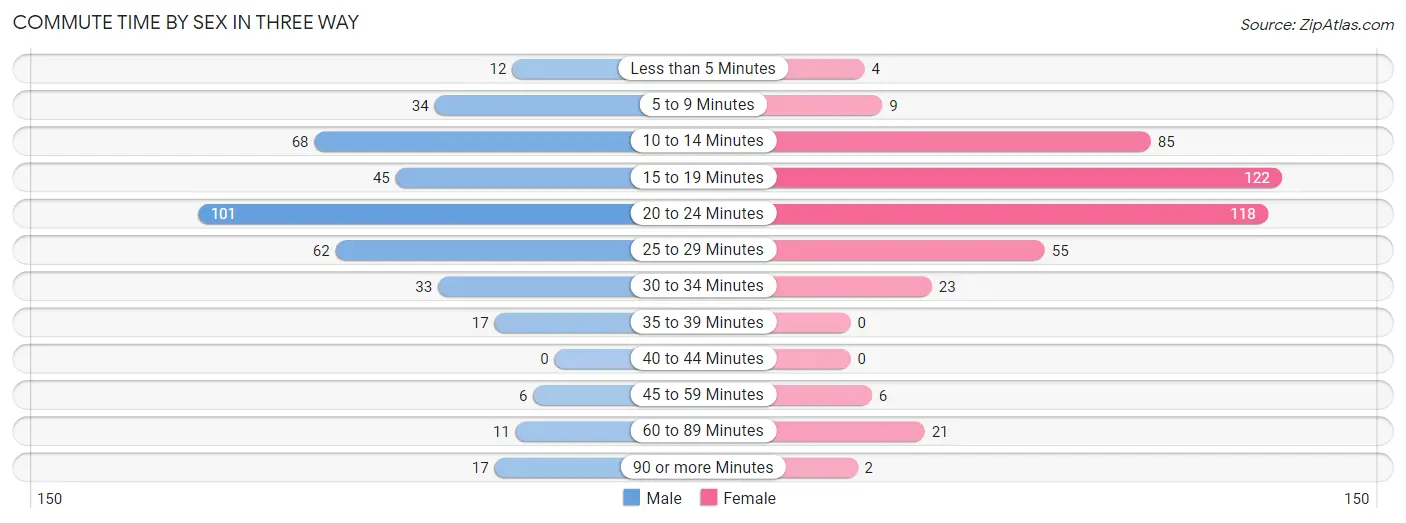
| Commute Time | Male | Female |
| Less than 5 Minutes | 12 (3.0%) | 4 (0.9%) |
| 5 to 9 Minutes | 34 (8.4%) | 9 (2.0%) |
| 10 to 14 Minutes | 68 (16.8%) | 85 (19.1%) |
| 15 to 19 Minutes | 45 (11.1%) | 122 (27.4%) |
| 20 to 24 Minutes | 101 (24.9%) | 118 (26.5%) |
| 25 to 29 Minutes | 62 (15.3%) | 55 (12.4%) |
| 30 to 34 Minutes | 33 (8.1%) | 23 (5.2%) |
| 35 to 39 Minutes | 17 (4.2%) | 0 (0.0%) |
| 40 to 44 Minutes | 0 (0.0%) | 0 (0.0%) |
| 45 to 59 Minutes | 6 (1.5%) | 6 (1.3%) |
| 60 to 89 Minutes | 11 (2.7%) | 21 (4.7%) |
| 90 or more Minutes | 17 (4.2%) | 2 (0.4%) |
Time of Departure to Work by Sex in Three Way
The most frequent times of departure to work in Three Way are 7:00 AM to 7:29 AM (121, 29.8%) for males and 7:30 AM to 7:59 AM (110, 24.7%) for females.
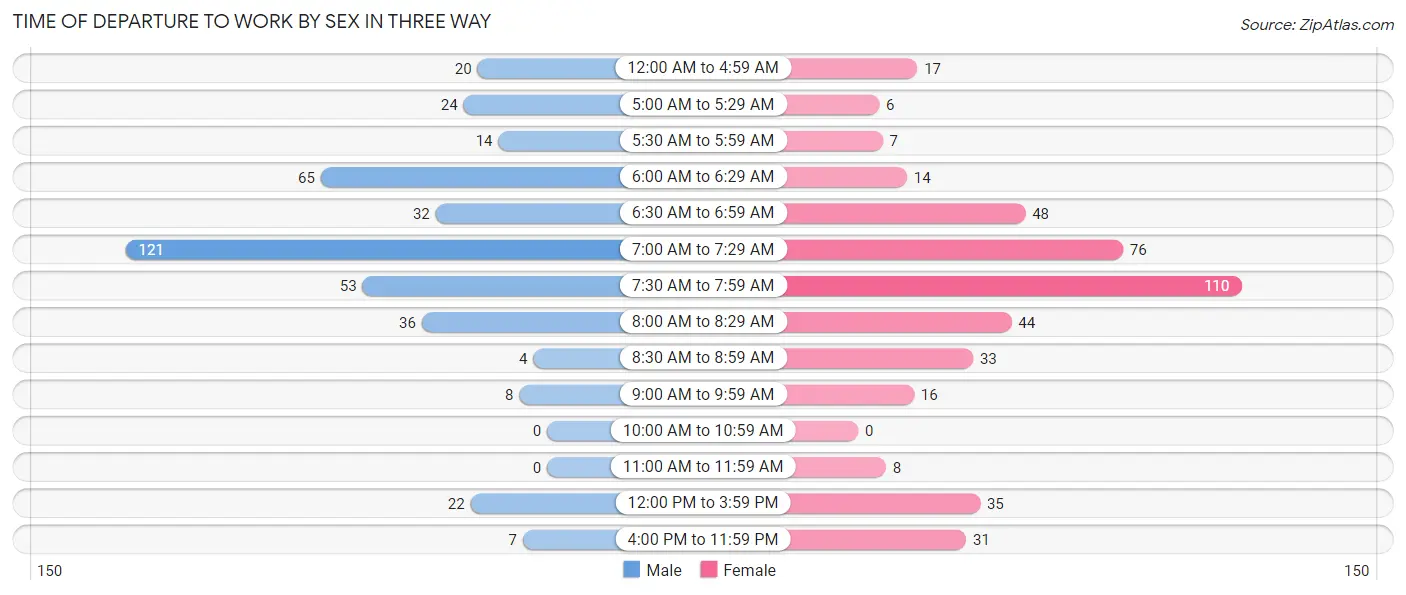
| Time of Departure | Male | Female |
| 12:00 AM to 4:59 AM | 20 (4.9%) | 17 (3.8%) |
| 5:00 AM to 5:29 AM | 24 (5.9%) | 6 (1.3%) |
| 5:30 AM to 5:59 AM | 14 (3.5%) | 7 (1.6%) |
| 6:00 AM to 6:29 AM | 65 (16.0%) | 14 (3.2%) |
| 6:30 AM to 6:59 AM | 32 (7.9%) | 48 (10.8%) |
| 7:00 AM to 7:29 AM | 121 (29.8%) | 76 (17.1%) |
| 7:30 AM to 7:59 AM | 53 (13.1%) | 110 (24.7%) |
| 8:00 AM to 8:29 AM | 36 (8.9%) | 44 (9.9%) |
| 8:30 AM to 8:59 AM | 4 (1.0%) | 33 (7.4%) |
| 9:00 AM to 9:59 AM | 8 (2.0%) | 16 (3.6%) |
| 10:00 AM to 10:59 AM | 0 (0.0%) | 0 (0.0%) |
| 11:00 AM to 11:59 AM | 0 (0.0%) | 8 (1.8%) |
| 12:00 PM to 3:59 PM | 22 (5.4%) | 35 (7.9%) |
| 4:00 PM to 11:59 PM | 7 (1.7%) | 31 (7.0%) |
| Total | 406 (100.0%) | 445 (100.0%) |
Housing Occupancy in Three Way
Occupancy by Ownership in Three Way
Of the total 761 dwellings in Three Way, owner-occupied units account for 707 (92.9%), while renter-occupied units make up 54 (7.1%).
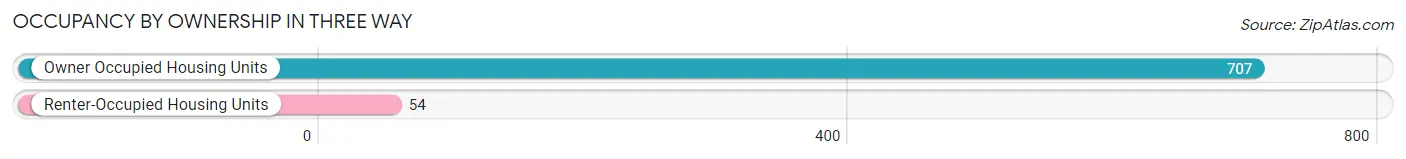
| Occupancy | # Housing Units | % Housing Units |
| Owner Occupied Housing Units | 707 | 92.9% |
| Renter-Occupied Housing Units | 54 | 7.1% |
| Total Occupied Housing Units | 761 | 100.0% |
Occupancy by Household Size in Three Way
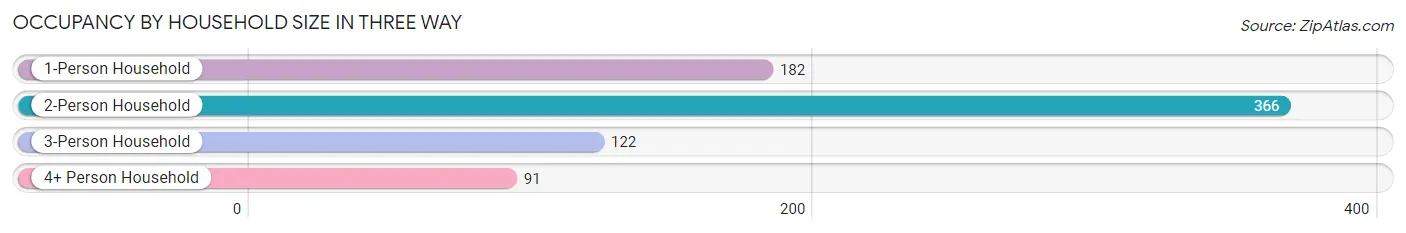
| Household Size | # Housing Units | % Housing Units |
| 1-Person Household | 182 | 23.9% |
| 2-Person Household | 366 | 48.1% |
| 3-Person Household | 122 | 16.0% |
| 4+ Person Household | 91 | 12.0% |
| Total Housing Units | 761 | 100.0% |
Occupancy by Ownership by Household Size in Three Way
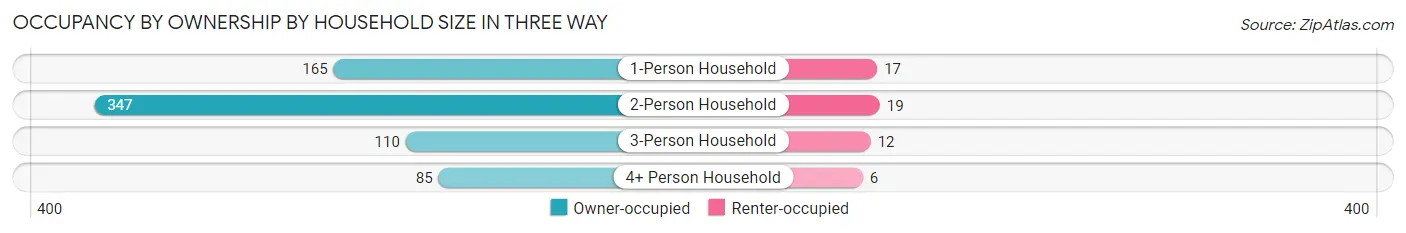
| Household Size | Owner-occupied | Renter-occupied |
| 1-Person Household | 165 (90.7%) | 17 (9.3%) |
| 2-Person Household | 347 (94.8%) | 19 (5.2%) |
| 3-Person Household | 110 (90.2%) | 12 (9.8%) |
| 4+ Person Household | 85 (93.4%) | 6 (6.6%) |
| Total Housing Units | 707 (92.9%) | 54 (7.1%) |
Occupancy by Educational Attainment in Three Way
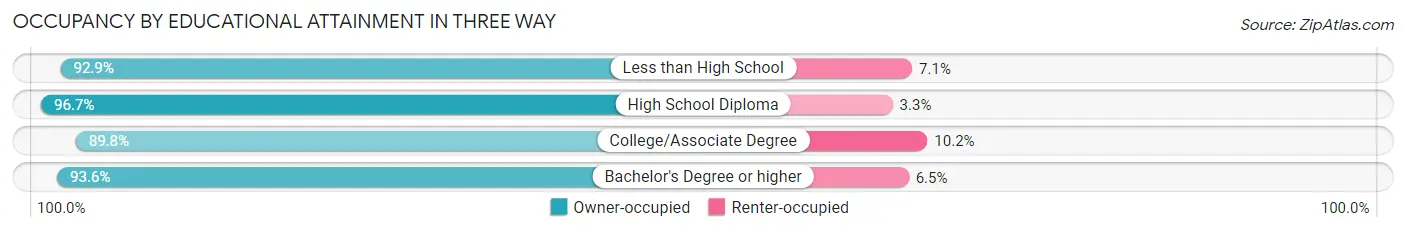
| Household Size | Owner-occupied | Renter-occupied |
| Less than High School | 39 (92.9%) | 3 (7.1%) |
| High School Diploma | 148 (96.7%) | 5 (3.3%) |
| College/Associate Degree | 230 (89.8%) | 26 (10.2%) |
| Bachelor's Degree or higher | 290 (93.5%) | 20 (6.5%) |
Occupancy by Age of Householder in Three Way
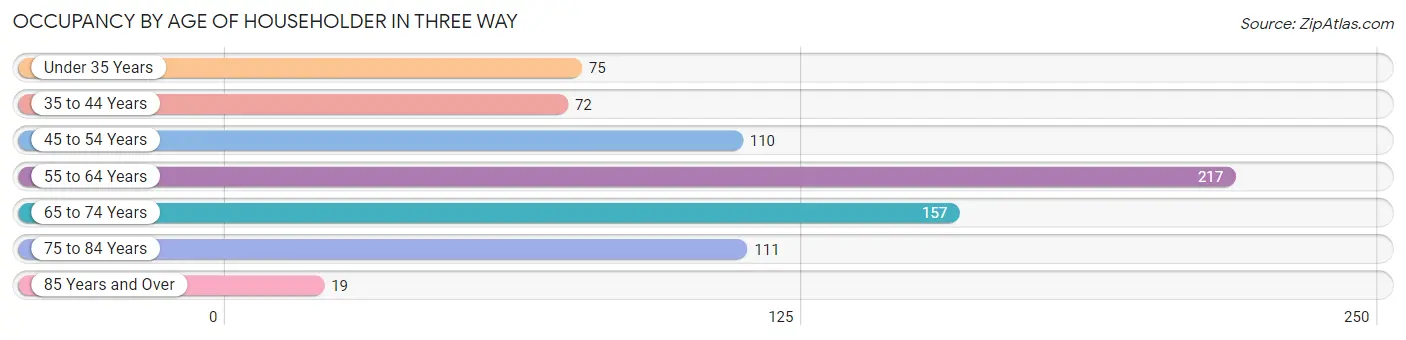
| Age Bracket | # Households | % Households |
| Under 35 Years | 75 | 9.9% |
| 35 to 44 Years | 72 | 9.5% |
| 45 to 54 Years | 110 | 14.4% |
| 55 to 64 Years | 217 | 28.5% |
| 65 to 74 Years | 157 | 20.6% |
| 75 to 84 Years | 111 | 14.6% |
| 85 Years and Over | 19 | 2.5% |
| Total | 761 | 100.0% |
Housing Finances in Three Way
Median Income by Occupancy in Three Way
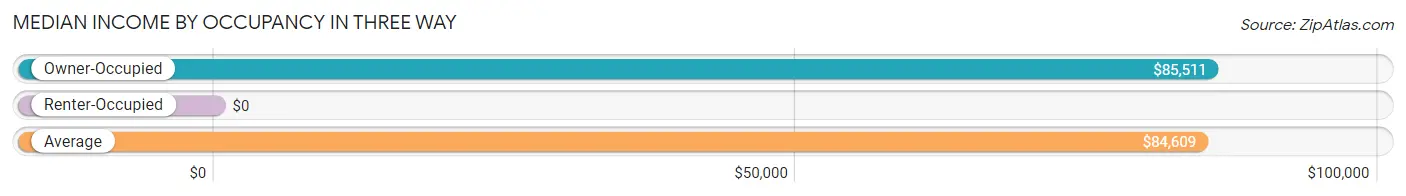
| Occupancy Type | # Households | Median Income |
| Owner-Occupied | 707 (92.9%) | $85,511 |
| Renter-Occupied | 54 (7.1%) | $0 |
| Average | 761 (100.0%) | $84,609 |
Occupancy by Householder Income Bracket in Three Way
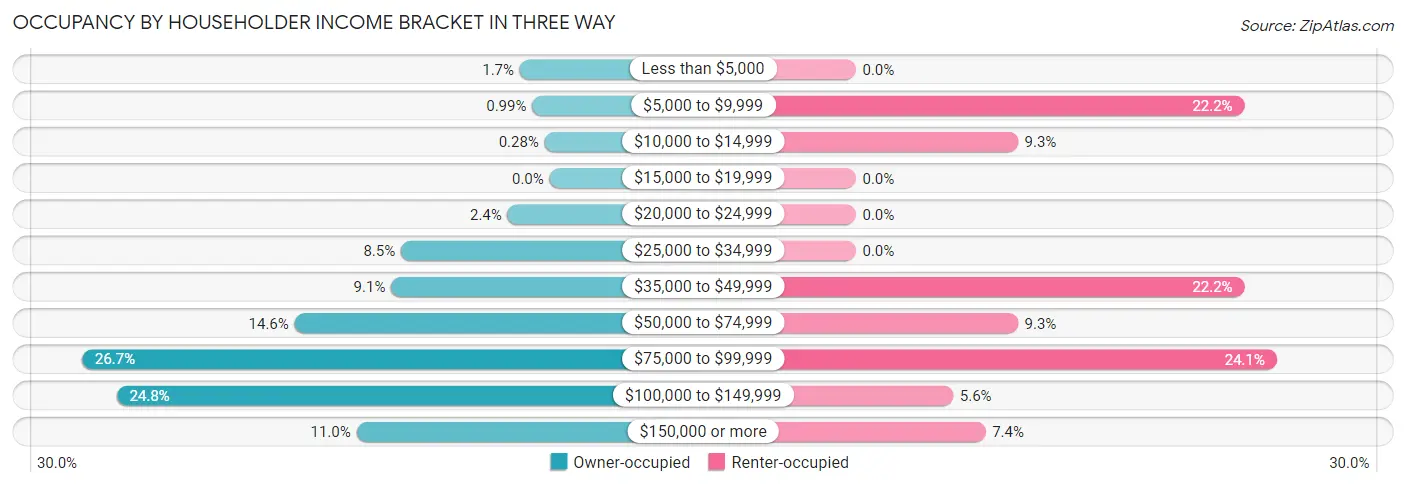
| Income Bracket | Owner-occupied | Renter-occupied |
| Less than $5,000 | 12 (1.7%) | 0 (0.0%) |
| $5,000 to $9,999 | 7 (1.0%) | 12 (22.2%) |
| $10,000 to $14,999 | 2 (0.3%) | 5 (9.3%) |
| $15,000 to $19,999 | 0 (0.0%) | 0 (0.0%) |
| $20,000 to $24,999 | 17 (2.4%) | 0 (0.0%) |
| $25,000 to $34,999 | 60 (8.5%) | 0 (0.0%) |
| $35,000 to $49,999 | 64 (9.0%) | 12 (22.2%) |
| $50,000 to $74,999 | 103 (14.6%) | 5 (9.3%) |
| $75,000 to $99,999 | 189 (26.7%) | 13 (24.1%) |
| $100,000 to $149,999 | 175 (24.7%) | 3 (5.6%) |
| $150,000 or more | 78 (11.0%) | 4 (7.4%) |
| Total | 707 (100.0%) | 54 (100.0%) |
Monthly Housing Cost Tiers in Three Way
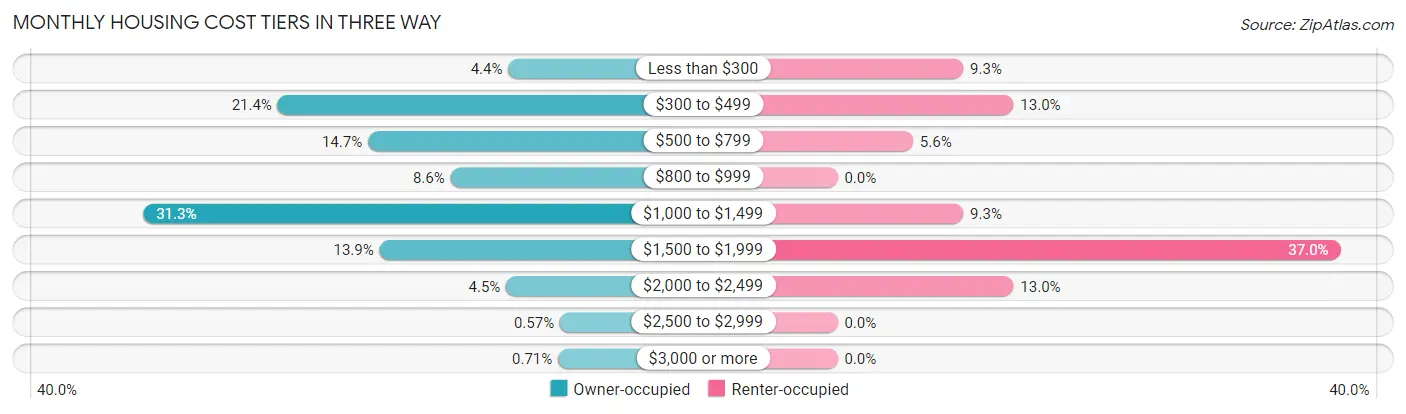
| Monthly Cost | Owner-occupied | Renter-occupied |
| Less than $300 | 31 (4.4%) | 5 (9.3%) |
| $300 to $499 | 151 (21.4%) | 7 (13.0%) |
| $500 to $799 | 104 (14.7%) | 3 (5.6%) |
| $800 to $999 | 61 (8.6%) | 0 (0.0%) |
| $1,000 to $1,499 | 221 (31.3%) | 5 (9.3%) |
| $1,500 to $1,999 | 98 (13.9%) | 20 (37.0%) |
| $2,000 to $2,499 | 32 (4.5%) | 7 (13.0%) |
| $2,500 to $2,999 | 4 (0.6%) | 0 (0.0%) |
| $3,000 or more | 5 (0.7%) | 0 (0.0%) |
| Total | 707 (100.0%) | 54 (100.0%) |
Physical Housing Characteristics in Three Way
Housing Structures in Three Way
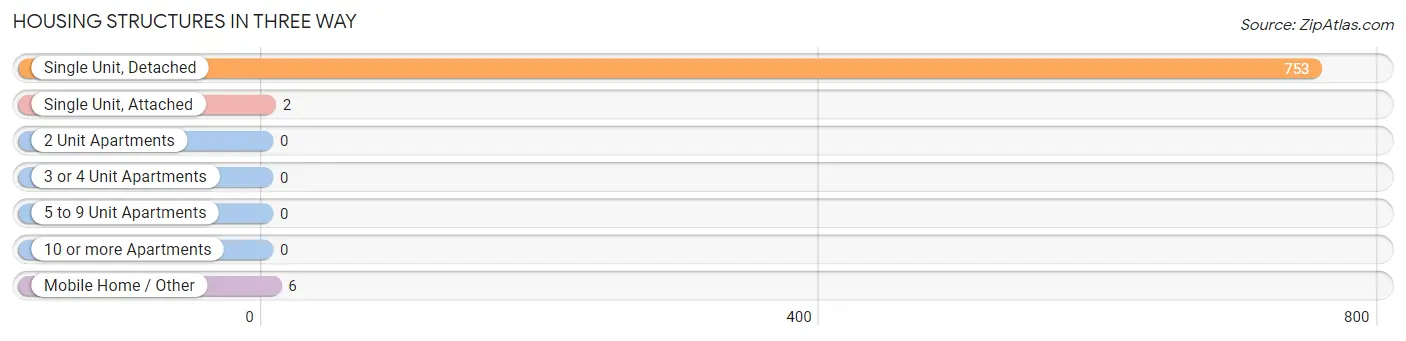
| Structure Type | # Housing Units | % Housing Units |
| Single Unit, Detached | 753 | 99.0% |
| Single Unit, Attached | 2 | 0.3% |
| 2 Unit Apartments | 0 | 0.0% |
| 3 or 4 Unit Apartments | 0 | 0.0% |
| 5 to 9 Unit Apartments | 0 | 0.0% |
| 10 or more Apartments | 0 | 0.0% |
| Mobile Home / Other | 6 | 0.8% |
| Total | 761 | 100.0% |
Housing Structures by Occupancy in Three Way
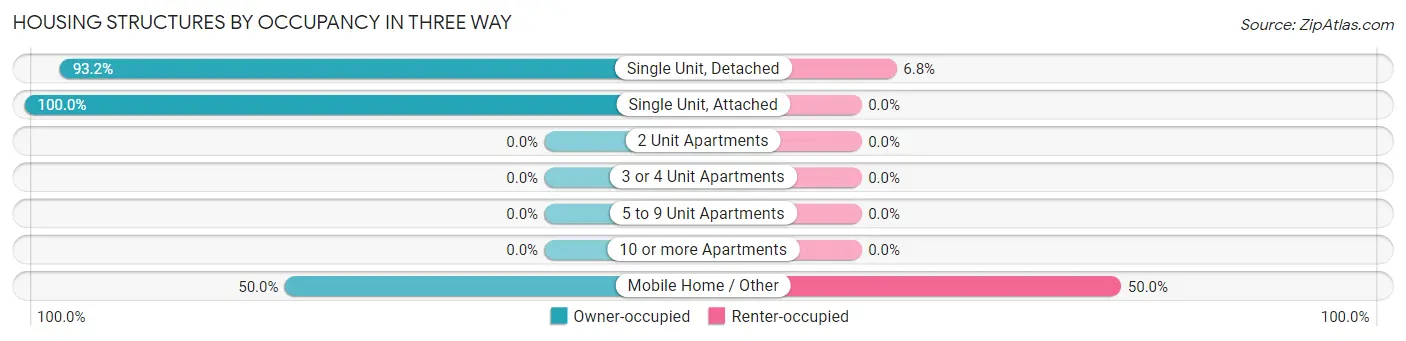
| Structure Type | Owner-occupied | Renter-occupied |
| Single Unit, Detached | 702 (93.2%) | 51 (6.8%) |
| Single Unit, Attached | 2 (100.0%) | 0 (0.0%) |
| 2 Unit Apartments | 0 (0.0%) | 0 (0.0%) |
| 3 or 4 Unit Apartments | 0 (0.0%) | 0 (0.0%) |
| 5 to 9 Unit Apartments | 0 (0.0%) | 0 (0.0%) |
| 10 or more Apartments | 0 (0.0%) | 0 (0.0%) |
| Mobile Home / Other | 3 (50.0%) | 3 (50.0%) |
| Total | 707 (92.9%) | 54 (7.1%) |
Housing Structures by Number of Rooms in Three Way
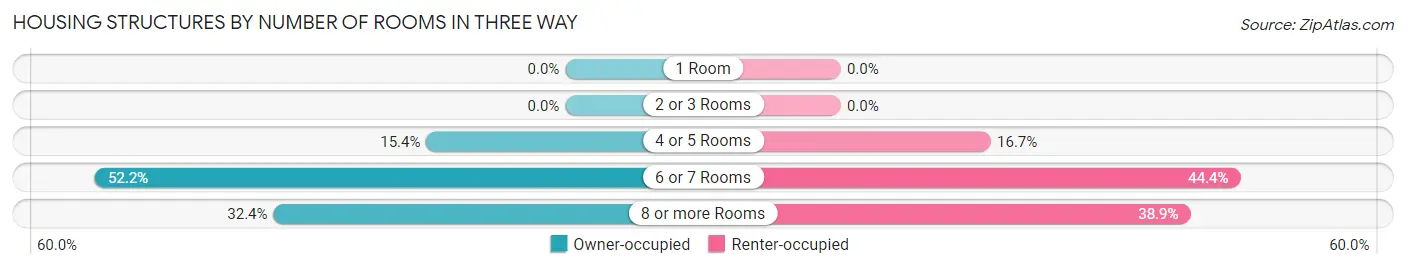
| Number of Rooms | Owner-occupied | Renter-occupied |
| 1 Room | 0 (0.0%) | 0 (0.0%) |
| 2 or 3 Rooms | 0 (0.0%) | 0 (0.0%) |
| 4 or 5 Rooms | 109 (15.4%) | 9 (16.7%) |
| 6 or 7 Rooms | 369 (52.2%) | 24 (44.4%) |
| 8 or more Rooms | 229 (32.4%) | 21 (38.9%) |
| Total | 707 (100.0%) | 54 (100.0%) |
Housing Structure by Heating Type in Three Way
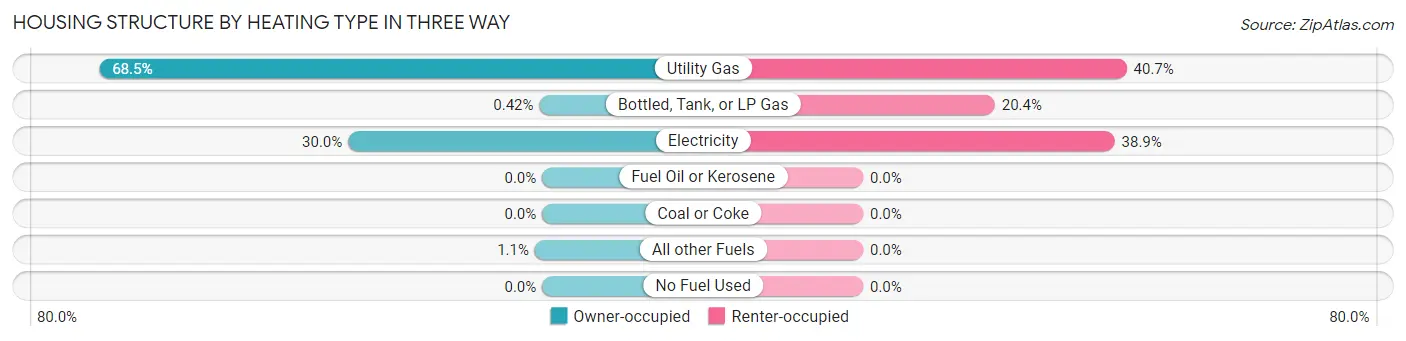
| Heating Type | Owner-occupied | Renter-occupied |
| Utility Gas | 484 (68.5%) | 22 (40.7%) |
| Bottled, Tank, or LP Gas | 3 (0.4%) | 11 (20.4%) |
| Electricity | 212 (30.0%) | 21 (38.9%) |
| Fuel Oil or Kerosene | 0 (0.0%) | 0 (0.0%) |
| Coal or Coke | 0 (0.0%) | 0 (0.0%) |
| All other Fuels | 8 (1.1%) | 0 (0.0%) |
| No Fuel Used | 0 (0.0%) | 0 (0.0%) |
| Total | 707 (100.0%) | 54 (100.0%) |
Household Vehicle Usage in Three Way
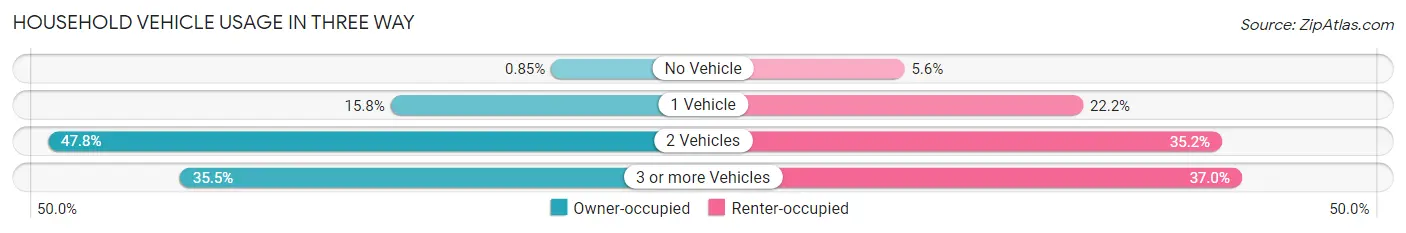
| Vehicles per Household | Owner-occupied | Renter-occupied |
| No Vehicle | 6 (0.9%) | 3 (5.6%) |
| 1 Vehicle | 112 (15.8%) | 12 (22.2%) |
| 2 Vehicles | 338 (47.8%) | 19 (35.2%) |
| 3 or more Vehicles | 251 (35.5%) | 20 (37.0%) |
| Total | 707 (100.0%) | 54 (100.0%) |
Real Estate & Mortgages in Three Way
Real Estate and Mortgage Overview in Three Way
| Characteristic | Without Mortgage | With Mortgage |
| Housing Units | 262 | 445 |
| Median Property Value | $196,700 | $202,500 |
| Median Household Income | $73,846 | $59 |
| Monthly Housing Costs | $464 | $5 |
| Real Estate Taxes | $1,333 | $8 |
Property Value by Mortgage Status in Three Way
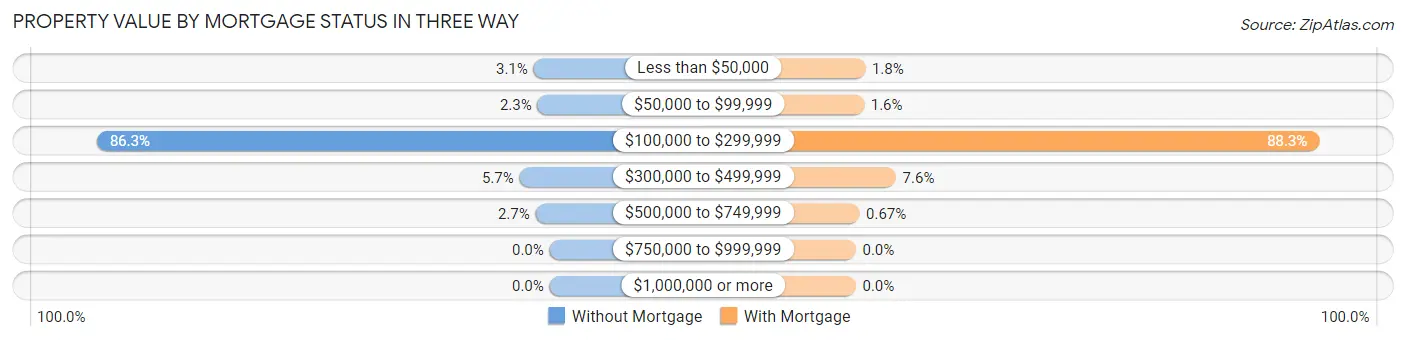
| Property Value | Without Mortgage | With Mortgage |
| Less than $50,000 | 8 (3.0%) | 8 (1.8%) |
| $50,000 to $99,999 | 6 (2.3%) | 7 (1.6%) |
| $100,000 to $299,999 | 226 (86.3%) | 393 (88.3%) |
| $300,000 to $499,999 | 15 (5.7%) | 34 (7.6%) |
| $500,000 to $749,999 | 7 (2.7%) | 3 (0.7%) |
| $750,000 to $999,999 | 0 (0.0%) | 0 (0.0%) |
| $1,000,000 or more | 0 (0.0%) | 0 (0.0%) |
| Total | 262 (100.0%) | 445 (100.0%) |
Household Income by Mortgage Status in Three Way
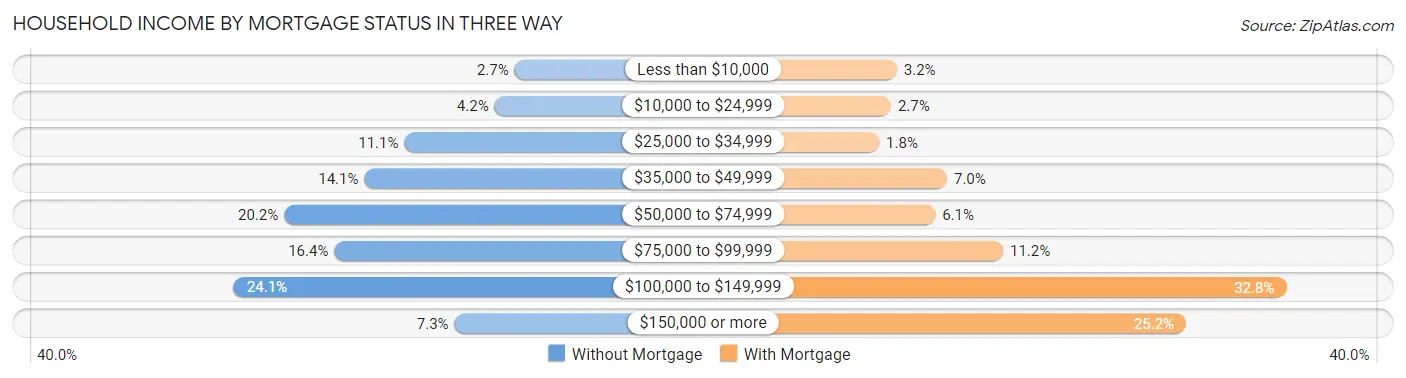
| Household Income | Without Mortgage | With Mortgage |
| Less than $10,000 | 7 (2.7%) | 14 (3.2%) |
| $10,000 to $24,999 | 11 (4.2%) | 12 (2.7%) |
| $25,000 to $34,999 | 29 (11.1%) | 8 (1.8%) |
| $35,000 to $49,999 | 37 (14.1%) | 31 (7.0%) |
| $50,000 to $74,999 | 53 (20.2%) | 27 (6.1%) |
| $75,000 to $99,999 | 43 (16.4%) | 50 (11.2%) |
| $100,000 to $149,999 | 63 (24.0%) | 146 (32.8%) |
| $150,000 or more | 19 (7.2%) | 112 (25.2%) |
| Total | 262 (100.0%) | 445 (100.0%) |
Property Value to Household Income Ratio in Three Way
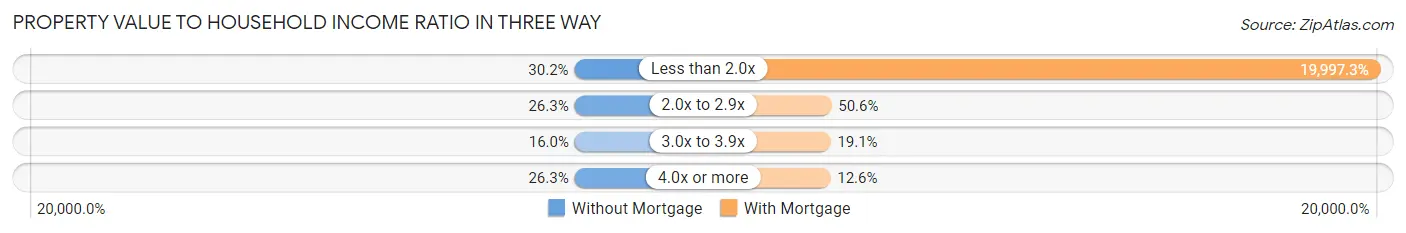
| Value-to-Income Ratio | Without Mortgage | With Mortgage |
| Less than 2.0x | 79 (30.1%) | 88,988 (19,997.3%) |
| 2.0x to 2.9x | 69 (26.3%) | 225 (50.6%) |
| 3.0x to 3.9x | 42 (16.0%) | 85 (19.1%) |
| 4.0x or more | 69 (26.3%) | 56 (12.6%) |
| Total | 262 (100.0%) | 445 (100.0%) |
Real Estate Taxes by Mortgage Status in Three Way
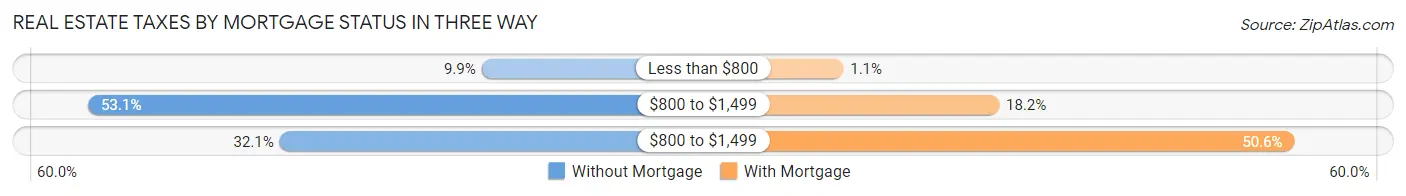
| Property Taxes | Without Mortgage | With Mortgage |
| Less than $800 | 26 (9.9%) | 5 (1.1%) |
| $800 to $1,499 | 139 (53.0%) | 81 (18.2%) |
| $800 to $1,499 | 84 (32.1%) | 225 (50.6%) |
| Total | 262 (100.0%) | 445 (100.0%) |
Health & Disability in Three Way
Health Insurance Coverage by Age in Three Way
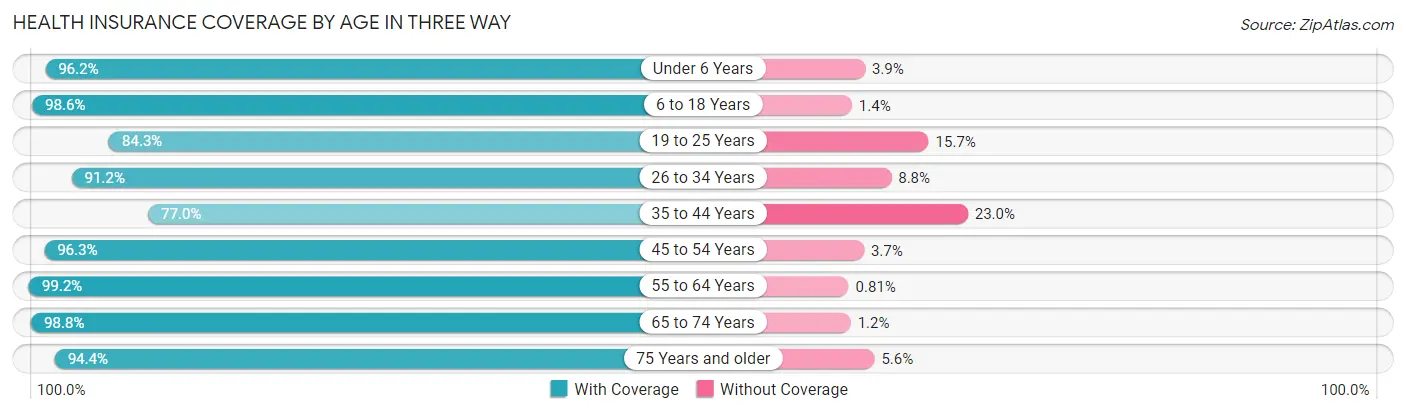
| Age Bracket | With Coverage | Without Coverage |
| Under 6 Years | 50 (96.2%) | 2 (3.8%) |
| 6 to 18 Years | 208 (98.6%) | 3 (1.4%) |
| 19 to 25 Years | 75 (84.3%) | 14 (15.7%) |
| 26 to 34 Years | 125 (91.2%) | 12 (8.8%) |
| 35 to 44 Years | 117 (77.0%) | 35 (23.0%) |
| 45 to 54 Years | 236 (96.3%) | 9 (3.7%) |
| 55 to 64 Years | 367 (99.2%) | 3 (0.8%) |
| 65 to 74 Years | 247 (98.8%) | 3 (1.2%) |
| 75 Years and older | 235 (94.4%) | 14 (5.6%) |
| Total | 1,660 (94.6%) | 95 (5.4%) |
Health Insurance Coverage by Citizenship Status in Three Way
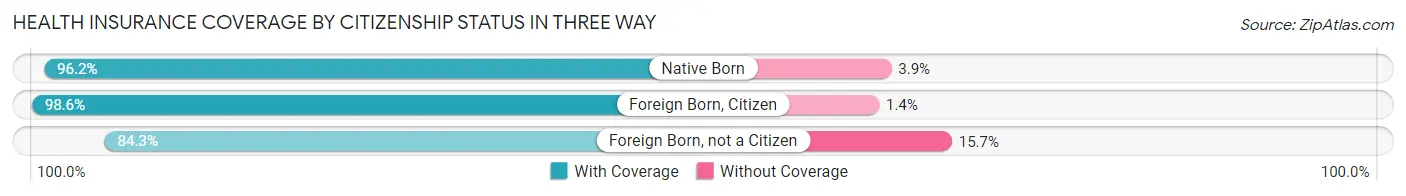
| Citizenship Status | With Coverage | Without Coverage |
| Native Born | 50 (96.2%) | 2 (3.8%) |
| Foreign Born, Citizen | 208 (98.6%) | 3 (1.4%) |
| Foreign Born, not a Citizen | 75 (84.3%) | 14 (15.7%) |
Health Insurance Coverage by Household Income in Three Way
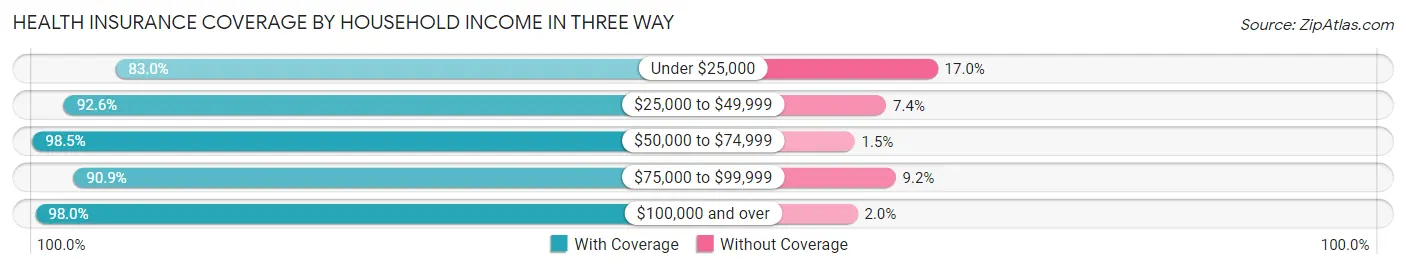
| Household Income | With Coverage | Without Coverage |
| Under $25,000 | 78 (83.0%) | 16 (17.0%) |
| $25,000 to $49,999 | 201 (92.6%) | 16 (7.4%) |
| $50,000 to $74,999 | 203 (98.5%) | 3 (1.5%) |
| $75,000 to $99,999 | 447 (90.8%) | 45 (9.1%) |
| $100,000 and over | 731 (98.0%) | 15 (2.0%) |
Public vs Private Health Insurance Coverage by Age in Three Way
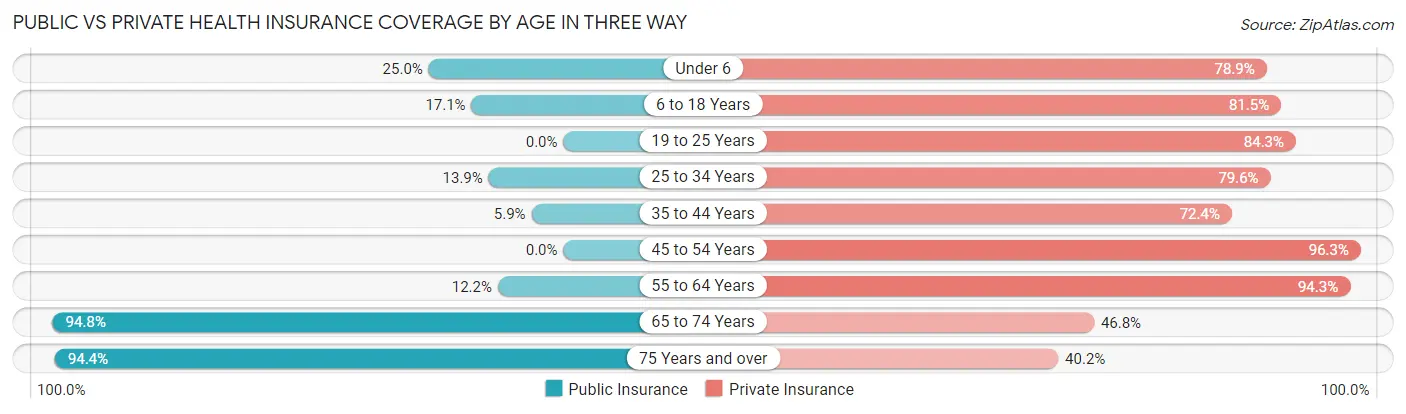
| Age Bracket | Public Insurance | Private Insurance |
| Under 6 | 13 (25.0%) | 41 (78.8%) |
| 6 to 18 Years | 36 (17.1%) | 172 (81.5%) |
| 19 to 25 Years | 0 (0.0%) | 75 (84.3%) |
| 25 to 34 Years | 19 (13.9%) | 109 (79.6%) |
| 35 to 44 Years | 9 (5.9%) | 110 (72.4%) |
| 45 to 54 Years | 0 (0.0%) | 236 (96.3%) |
| 55 to 64 Years | 45 (12.2%) | 349 (94.3%) |
| 65 to 74 Years | 237 (94.8%) | 117 (46.8%) |
| 75 Years and over | 235 (94.4%) | 100 (40.2%) |
| Total | 594 (33.9%) | 1,309 (74.6%) |
Disability Status by Sex by Age in Three Way
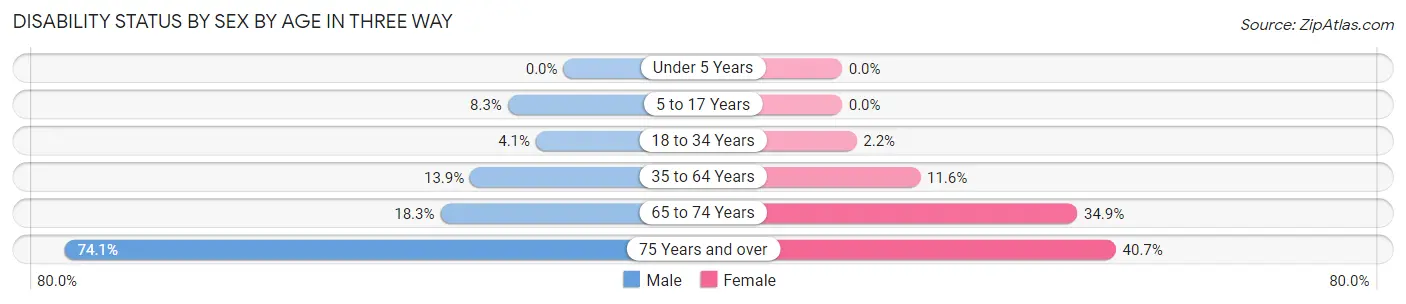
| Age Bracket | Male | Female |
| Under 5 Years | 0 (0.0%) | 0 (0.0%) |
| 5 to 17 Years | 10 (8.3%) | 0 (0.0%) |
| 18 to 34 Years | 4 (4.1%) | 3 (2.2%) |
| 35 to 64 Years | 55 (13.9%) | 43 (11.6%) |
| 65 to 74 Years | 19 (18.3%) | 51 (34.9%) |
| 75 Years and over | 117 (74.1%) | 37 (40.7%) |
Disability Class by Sex by Age in Three Way
Disability Class: Hearing Difficulty
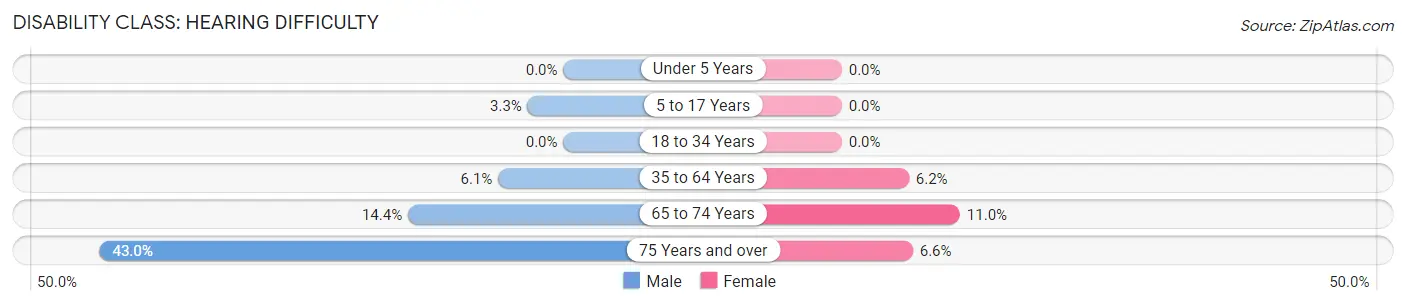
| Age Bracket | Male | Female |
| Under 5 Years | 0 (0.0%) | 0 (0.0%) |
| 5 to 17 Years | 4 (3.3%) | 0 (0.0%) |
| 18 to 34 Years | 0 (0.0%) | 0 (0.0%) |
| 35 to 64 Years | 24 (6.0%) | 23 (6.2%) |
| 65 to 74 Years | 15 (14.4%) | 16 (11.0%) |
| 75 Years and over | 68 (43.0%) | 6 (6.6%) |
Disability Class: Vision Difficulty
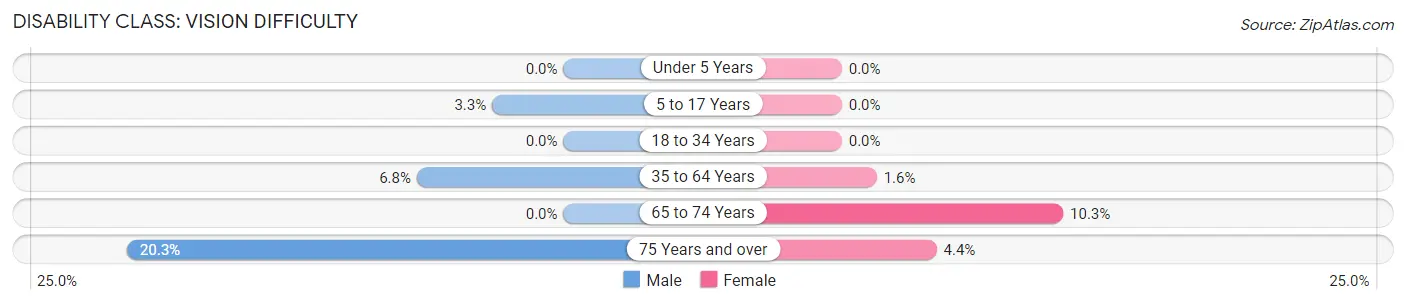
| Age Bracket | Male | Female |
| Under 5 Years | 0 (0.0%) | 0 (0.0%) |
| 5 to 17 Years | 4 (3.3%) | 0 (0.0%) |
| 18 to 34 Years | 0 (0.0%) | 0 (0.0%) |
| 35 to 64 Years | 27 (6.8%) | 6 (1.6%) |
| 65 to 74 Years | 0 (0.0%) | 15 (10.3%) |
| 75 Years and over | 32 (20.3%) | 4 (4.4%) |
Disability Class: Cognitive Difficulty
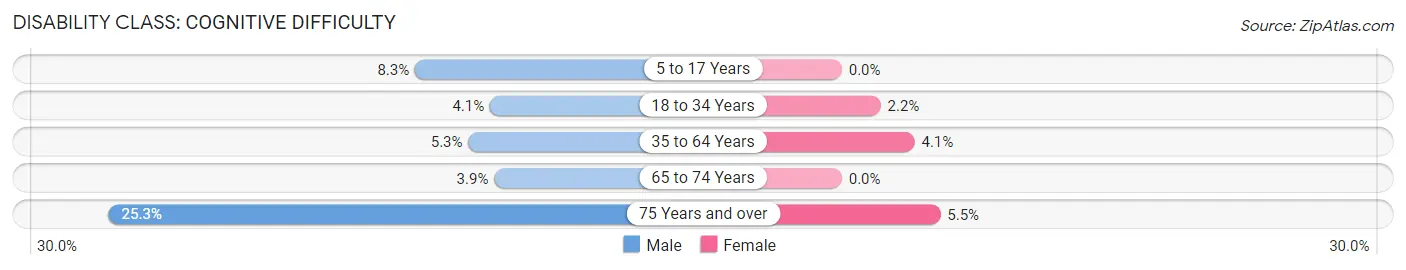
| Age Bracket | Male | Female |
| 5 to 17 Years | 10 (8.3%) | 0 (0.0%) |
| 18 to 34 Years | 4 (4.1%) | 3 (2.2%) |
| 35 to 64 Years | 21 (5.3%) | 15 (4.1%) |
| 65 to 74 Years | 4 (3.8%) | 0 (0.0%) |
| 75 Years and over | 40 (25.3%) | 5 (5.5%) |
Disability Class: Ambulatory Difficulty
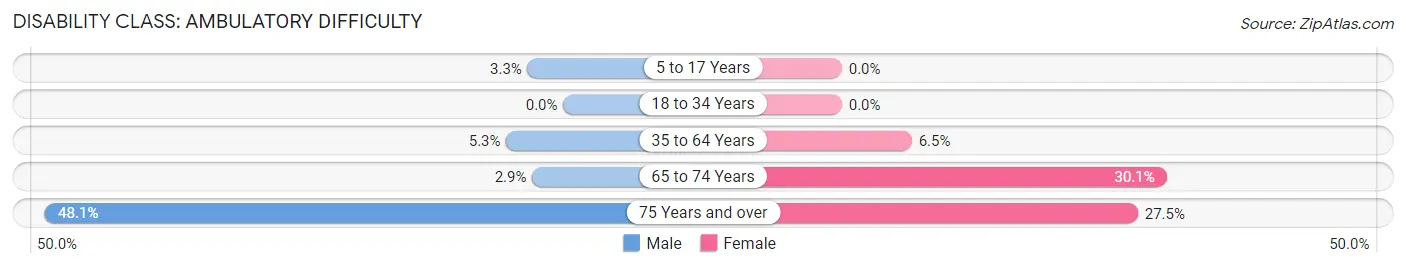
| Age Bracket | Male | Female |
| 5 to 17 Years | 4 (3.3%) | 0 (0.0%) |
| 18 to 34 Years | 0 (0.0%) | 0 (0.0%) |
| 35 to 64 Years | 21 (5.3%) | 24 (6.5%) |
| 65 to 74 Years | 3 (2.9%) | 44 (30.1%) |
| 75 Years and over | 76 (48.1%) | 25 (27.5%) |
Disability Class: Self-Care Difficulty
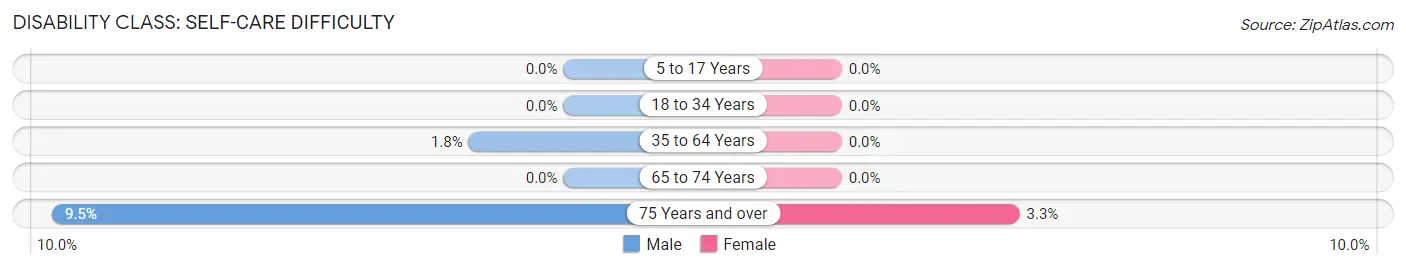
| Age Bracket | Male | Female |
| 5 to 17 Years | 0 (0.0%) | 0 (0.0%) |
| 18 to 34 Years | 0 (0.0%) | 0 (0.0%) |
| 35 to 64 Years | 7 (1.8%) | 0 (0.0%) |
| 65 to 74 Years | 0 (0.0%) | 0 (0.0%) |
| 75 Years and over | 15 (9.5%) | 3 (3.3%) |
Technology Access in Three Way
Computing Device Access in Three Way
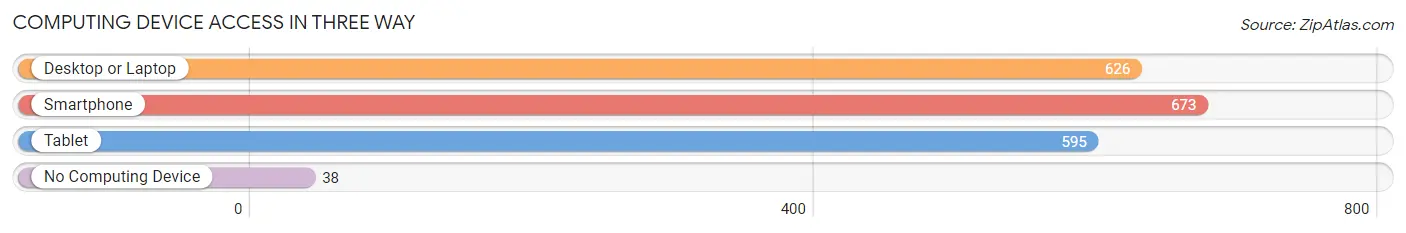
| Device Type | # Households | % Households |
| Desktop or Laptop | 626 | 82.3% |
| Smartphone | 673 | 88.4% |
| Tablet | 595 | 78.2% |
| No Computing Device | 38 | 5.0% |
| Total | 761 | 100.0% |
Internet Access in Three Way
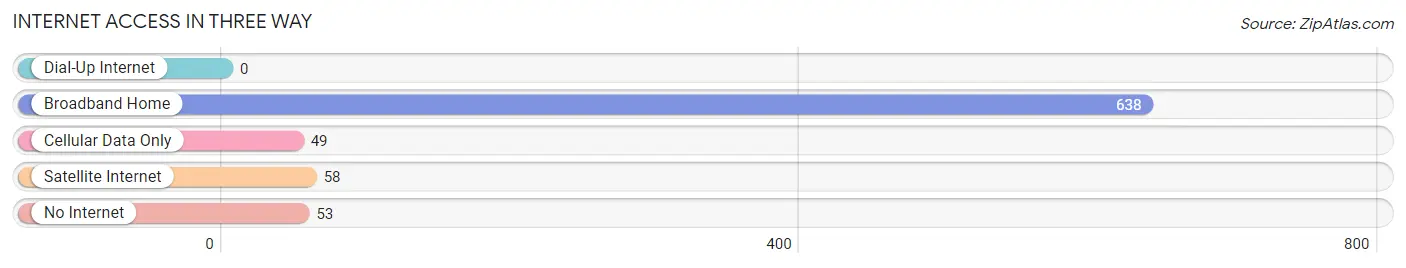
| Internet Type | # Households | % Households |
| Dial-Up Internet | 0 | 0.0% |
| Broadband Home | 638 | 83.8% |
| Cellular Data Only | 49 | 6.4% |
| Satellite Internet | 58 | 7.6% |
| No Internet | 53 | 7.0% |
| Total | 761 | 100.0% |
Three Way Summary
Three Way is a small unincorporated community located in Madison County, Tennessee. It is situated along the Tennessee-Kentucky border, just south of the city of Jackson. The population of Three Way was estimated to be 1,845 in 2019.
History
The area that is now Three Way was first settled in the early 1800s by settlers from North Carolina and Virginia. The community was originally known as "Three Way Station" due to its location at the intersection of three major roads. The roads were the Lexington-Jackson Road, the Lexington-Nashville Road, and the Lexington-Memphis Road. The name was eventually shortened to "Three Way".
The community was officially incorporated in 1875. The first post office was established in 1876. The town was home to several businesses, including a general store, a blacksmith shop, a grist mill, and a cotton gin.
Geography
Three Way is located in Madison County, Tennessee, along the Tennessee-Kentucky border. It is situated just south of the city of Jackson. The town is located at an elevation of 590 feet above sea level.
The climate in Three Way is humid subtropical, with hot summers and mild winters. The average annual temperature is around 63°F, and the average annual precipitation is around 48 inches.
Economy
The economy of Three Way is largely based on agriculture. The town is home to several farms, which produce a variety of crops, including corn, soybeans, wheat, and hay. The town is also home to several small businesses, including a gas station, a convenience store, and a restaurant.
Demographics
As of the 2010 census, the population of Three Way was 1,845. The racial makeup of the town was 94.3% White, 3.2% African American, 0.7% Native American, 0.3% Asian, and 1.5% from other races. The median household income was $37,917, and the median family income was $45,625.
The town is served by the Madison County School District. The town is home to Three Way Elementary School, which serves students in grades K-5. The town is also home to a branch of the Jackson-Madison County Library.
Conclusion
Three Way is a small unincorporated community located in Madison County, Tennessee. It is situated along the Tennessee-Kentucky border, just south of the city of Jackson. The population of Three Way was estimated to be 1,845 in 2019. The economy of Three Way is largely based on agriculture, and the town is home to several small businesses. The racial makeup of the town was 94.3% White, 3.2% African American, 0.7% Native American, 0.3% Asian, and 1.5% from other races. The town is served by the Madison County School District and is home to Three Way Elementary School.
Common Questions
What is Per Capita Income in Three Way?
Per Capita income in Three Way is $40,437.
What is the Median Family Income in Three Way?
Median Family Income in Three Way is $94,844.
What is the Median Household income in Three Way?
Median Household Income in Three Way is $84,609.
What is Income or Wage Gap in Three Way?
Income or Wage Gap in Three Way is 30.6%.
Women in Three Way earn 69.4 cents for every dollar earned by a man.
What is Family Income Deficit in Three Way?
Family Income Deficit in Three Way is $9,916.
Families that are below poverty line in Three Way earn $9,916 less on average than the poverty threshold level.
What is Inequality or Gini Index in Three Way?
Inequality or Gini Index in Three Way is 0.32.
What is the Total Population of Three Way?
Total Population of Three Way is 1,755.
What is the Total Male Population of Three Way?
Total Male Population of Three Way is 904.
What is the Total Female Population of Three Way?
Total Female Population of Three Way is 851.
What is the Ratio of Males per 100 Females in Three Way?
There are 106.23 Males per 100 Females in Three Way.
What is the Ratio of Females per 100 Males in Three Way?
There are 94.14 Females per 100 Males in Three Way.
What is the Median Population Age in Three Way?
Median Population Age in Three Way is 54.8 Years.
What is the Average Family Size in Three Way
Average Family Size in Three Way is 2.7 People.
What is the Average Household Size in Three Way
Average Household Size in Three Way is 2.3 People.
How Large is the Labor Force in Three Way?
There are 957 People in the Labor Forcein in Three Way.
What is the Percentage of People in the Labor Force in Three Way?
61.6% of People are in the Labor Force in Three Way.
What is the Unemployment Rate in Three Way?
Unemployment Rate in Three Way is 4.1%.