Jefferson City, TN Map & Demographics
Jefferson City Map
Jefferson City Overview
$24,242
PER CAPITA INCOME
$67,044
AVG FAMILY INCOME
$48,212
AVG HOUSEHOLD INCOME
34.1%
WAGE / INCOME GAP [ % ]
65.9¢/ $1
WAGE / INCOME GAP [ $ ]
0.45
INEQUALITY / GINI INDEX
8,391
TOTAL POPULATION
4,099
MALE POPULATION
4,292
FEMALE POPULATION
95.50
MALES / 100 FEMALES
104.71
FEMALES / 100 MALES
30.8
MEDIAN AGE
3.1
AVG FAMILY SIZE
2.4
AVG HOUSEHOLD SIZE
4,117
LABOR FORCE [ PEOPLE ]
57.7%
PERCENT IN LABOR FORCE
6.8%
UNEMPLOYMENT RATE
Jefferson City Zip Codes
Jefferson City Area Codes
Income in Jefferson City
Income Overview in Jefferson City
Per Capita Income in Jefferson City is $24,242, while median incomes of families and households are $67,044 and $48,212 respectively.
| Characteristic | Number | Measure |
| Per Capita Income | 8,391 | $24,242 |
| Median Family Income | 1,765 | $67,044 |
| Mean Family Income | 1,765 | $80,261 |
| Median Household Income | 3,052 | $48,212 |
| Mean Household Income | 3,052 | $61,569 |
| Income Deficit | 1,765 | $0 |
| Wage / Income Gap (%) | 8,391 | 34.11% |
| Wage / Income Gap ($) | 8,391 | 65.89¢ per $1 |
| Gini / Inequality Index | 8,391 | 0.45 |
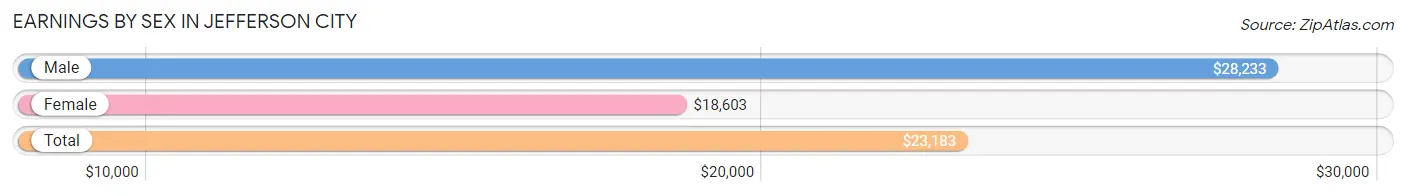
Earnings by Sex in Jefferson City
Average Earnings in Jefferson City are $23,183, $28,233 for men and $18,603 for women, a difference of 34.1%.
| Sex | Number | Average Earnings |
| Male | 2,447 (52.9%) | $28,233 |
| Female | 2,181 (47.1%) | $18,603 |
| Total | 4,628 (100.0%) | $23,183 |
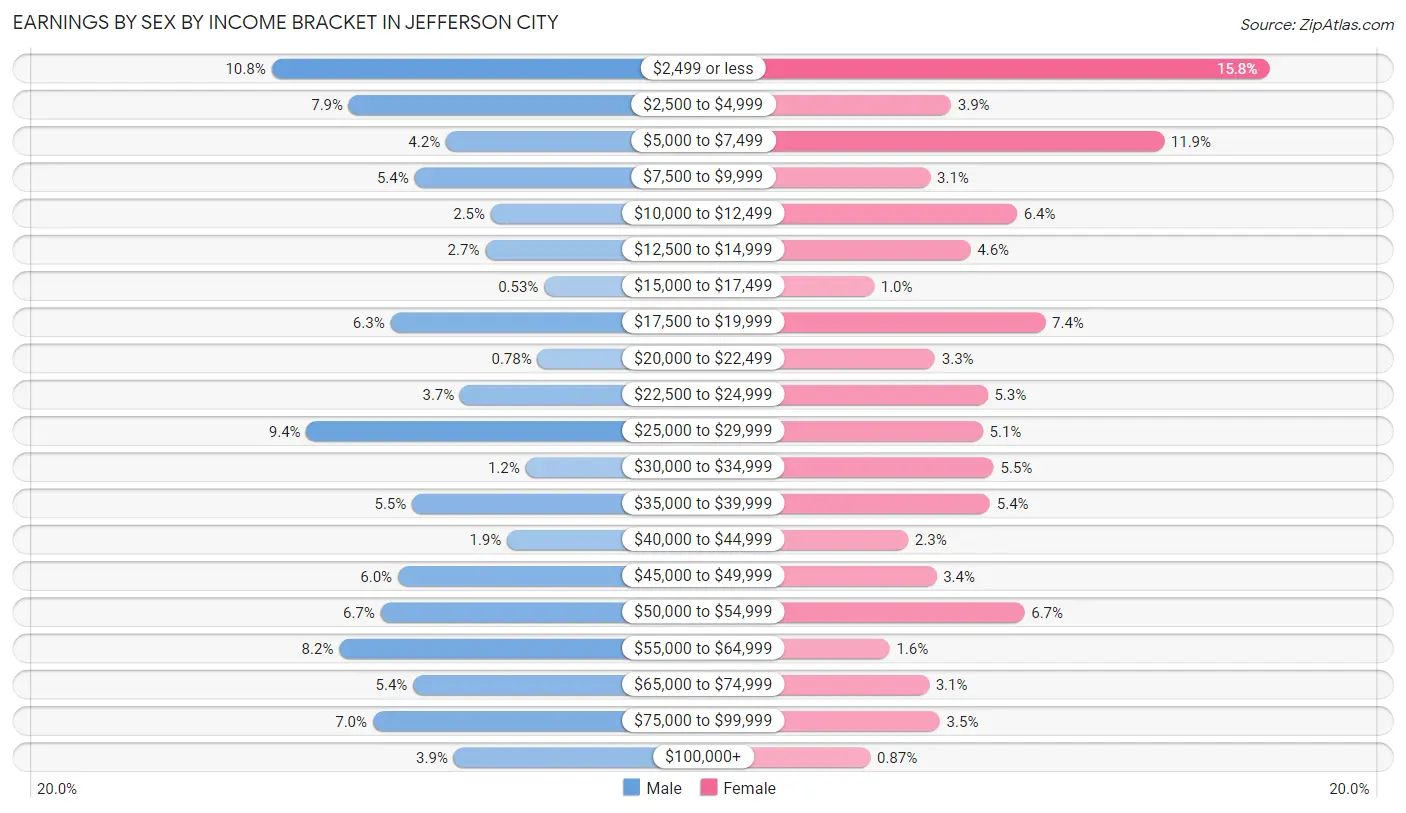
Earnings by Sex by Income Bracket in Jefferson City
The most common earnings brackets in Jefferson City are $2,499 or less for men (263 | 10.7%) and $2,499 or less for women (345 | 15.8%).
| Income | Male | Female |
| $2,499 or less | 263 (10.7%) | 345 (15.8%) |
| $2,500 to $4,999 | 192 (7.9%) | 85 (3.9%) |
| $5,000 to $7,499 | 103 (4.2%) | 259 (11.9%) |
| $7,500 to $9,999 | 132 (5.4%) | 68 (3.1%) |
| $10,000 to $12,499 | 62 (2.5%) | 139 (6.4%) |
| $12,500 to $14,999 | 67 (2.7%) | 101 (4.6%) |
| $15,000 to $17,499 | 13 (0.5%) | 22 (1.0%) |
| $17,500 to $19,999 | 154 (6.3%) | 162 (7.4%) |
| $20,000 to $22,499 | 19 (0.8%) | 72 (3.3%) |
| $22,500 to $24,999 | 90 (3.7%) | 115 (5.3%) |
| $25,000 to $29,999 | 231 (9.4%) | 111 (5.1%) |
| $30,000 to $34,999 | 30 (1.2%) | 120 (5.5%) |
| $35,000 to $39,999 | 134 (5.5%) | 117 (5.4%) |
| $40,000 to $44,999 | 47 (1.9%) | 50 (2.3%) |
| $45,000 to $49,999 | 147 (6.0%) | 73 (3.4%) |
| $50,000 to $54,999 | 163 (6.7%) | 145 (6.7%) |
| $55,000 to $64,999 | 201 (8.2%) | 35 (1.6%) |
| $65,000 to $74,999 | 133 (5.4%) | 67 (3.1%) |
| $75,000 to $99,999 | 170 (7.0%) | 76 (3.5%) |
| $100,000+ | 96 (3.9%) | 19 (0.9%) |
| Total | 2,447 (100.0%) | 2,181 (100.0%) |
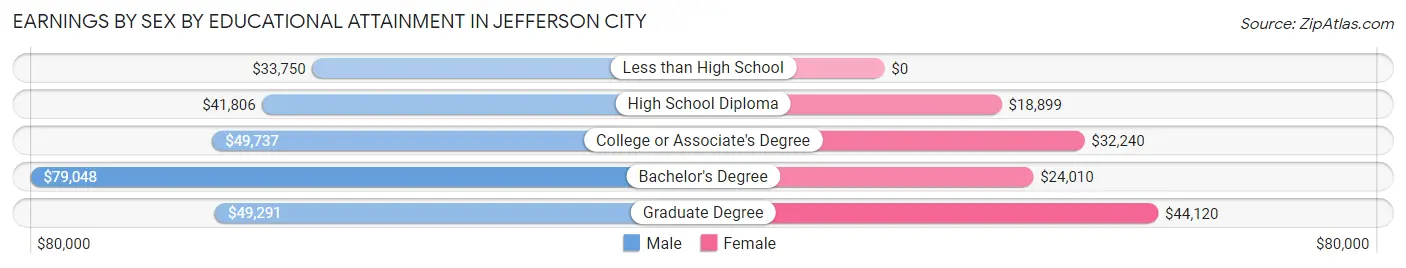
Earnings by Sex by Educational Attainment in Jefferson City
Average earnings in Jefferson City are $49,548 for men and $28,670 for women, a difference of 42.1%. Men with an educational attainment of bachelor's degree enjoy the highest average annual earnings of $79,048, while those with less than high school education earn the least with $33,750. Women with an educational attainment of graduate degree earn the most with the average annual earnings of $44,120, while those with high school diploma education have the smallest earnings of $18,899.
| Educational Attainment | Male Income | Female Income |
| Less than High School | $33,750 | $0 |
| High School Diploma | $41,806 | $18,899 |
| College or Associate's Degree | $49,737 | $32,240 |
| Bachelor's Degree | $79,048 | $24,010 |
| Graduate Degree | $49,291 | $44,120 |
| Total | $49,548 | $28,670 |
Family Income in Jefferson City
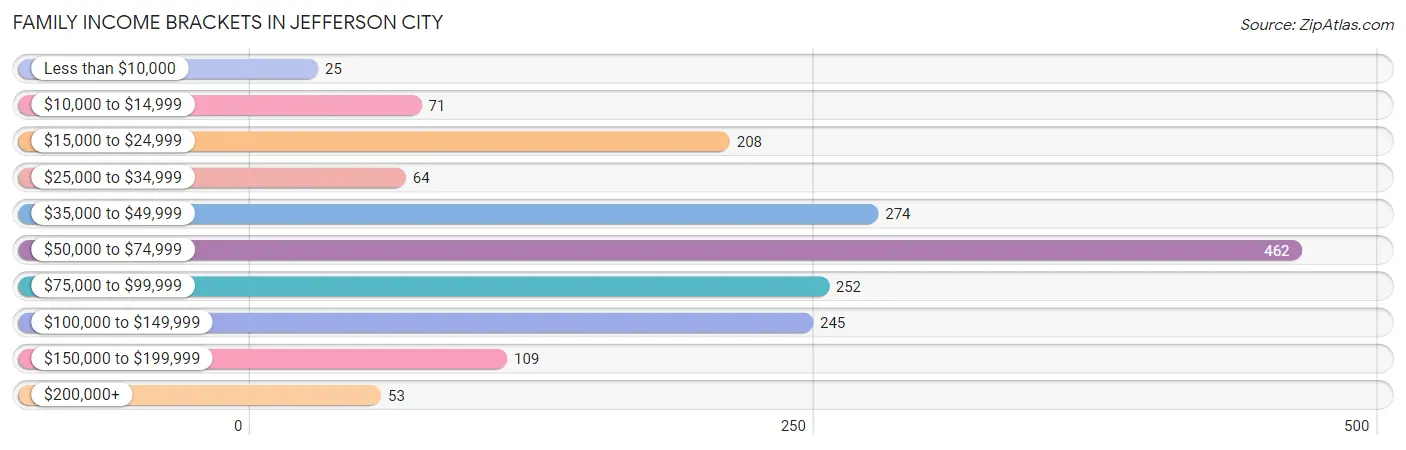
Family Income Brackets in Jefferson City
According to the Jefferson City family income data, there are 462 families falling into the $50,000 to $74,999 income range, which is the most common income bracket and makes up 26.2% of all families. Conversely, the less than $10,000 income bracket is the least frequent group with only 25 families (1.4%) belonging to this category.
| Income Bracket | # Families | % Families |
| Less than $10,000 | 25 | 1.4% |
| $10,000 to $14,999 | 71 | 4.0% |
| $15,000 to $24,999 | 208 | 11.8% |
| $25,000 to $34,999 | 64 | 3.6% |
| $35,000 to $49,999 | 274 | 15.5% |
| $50,000 to $74,999 | 462 | 26.2% |
| $75,000 to $99,999 | 252 | 14.3% |
| $100,000 to $149,999 | 245 | 13.9% |
| $150,000 to $199,999 | 109 | 6.2% |
| $200,000+ | 53 | 3.0% |
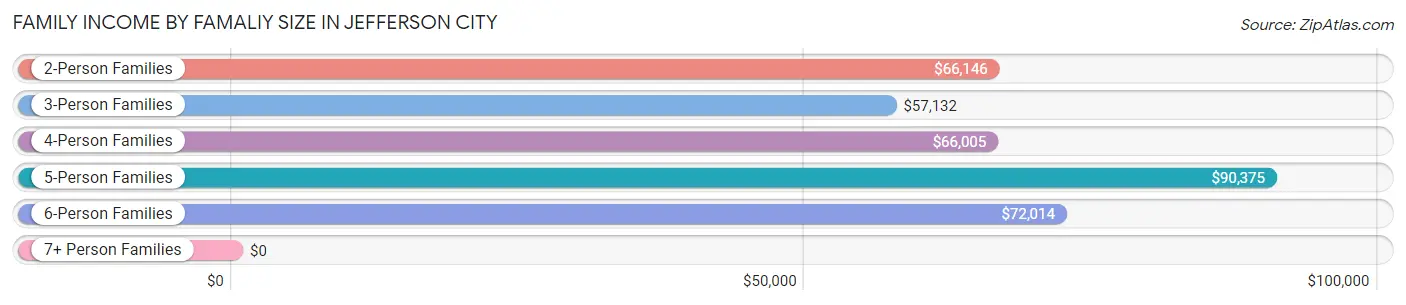
Family Income by Famaliy Size in Jefferson City
5-person families (65 | 3.7%) account for the highest median family income in Jefferson City with $90,375 per family, while 2-person families (784 | 44.4%) have the highest median income of $33,073 per family member.
| Income Bracket | # Families | Median Income |
| 2-Person Families | 784 (44.4%) | $66,146 |
| 3-Person Families | 400 (22.7%) | $57,132 |
| 4-Person Families | 429 (24.3%) | $66,005 |
| 5-Person Families | 65 (3.7%) | $90,375 |
| 6-Person Families | 87 (4.9%) | $72,014 |
| 7+ Person Families | 0 (0.0%) | $0 |
| Total | 1,765 (100.0%) | $67,044 |
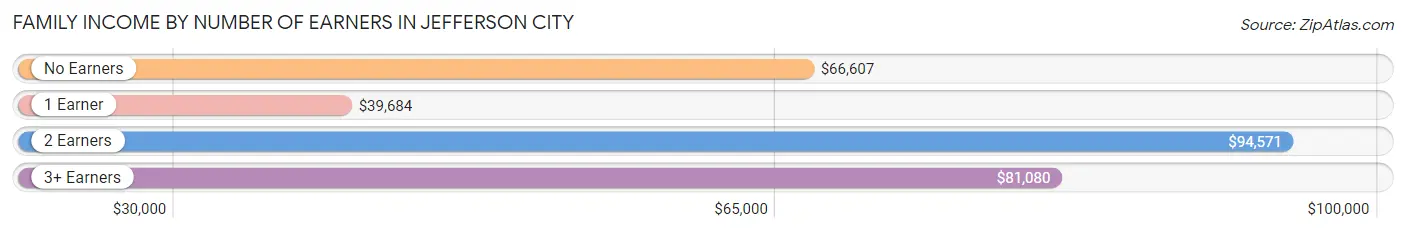
Family Income by Number of Earners in Jefferson City
The median family income in Jefferson City is $67,044, with families comprising 2 earners (472) having the highest median family income of $94,571, while families with 1 earner (738) have the lowest median family income of $39,684, accounting for 26.7% and 41.8% of families, respectively.
| Number of Earners | # Families | Median Income |
| No Earners | 200 (11.3%) | $66,607 |
| 1 Earner | 738 (41.8%) | $39,684 |
| 2 Earners | 472 (26.7%) | $94,571 |
| 3+ Earners | 355 (20.1%) | $81,080 |
| Total | 1,765 (100.0%) | $67,044 |
Household Income in Jefferson City
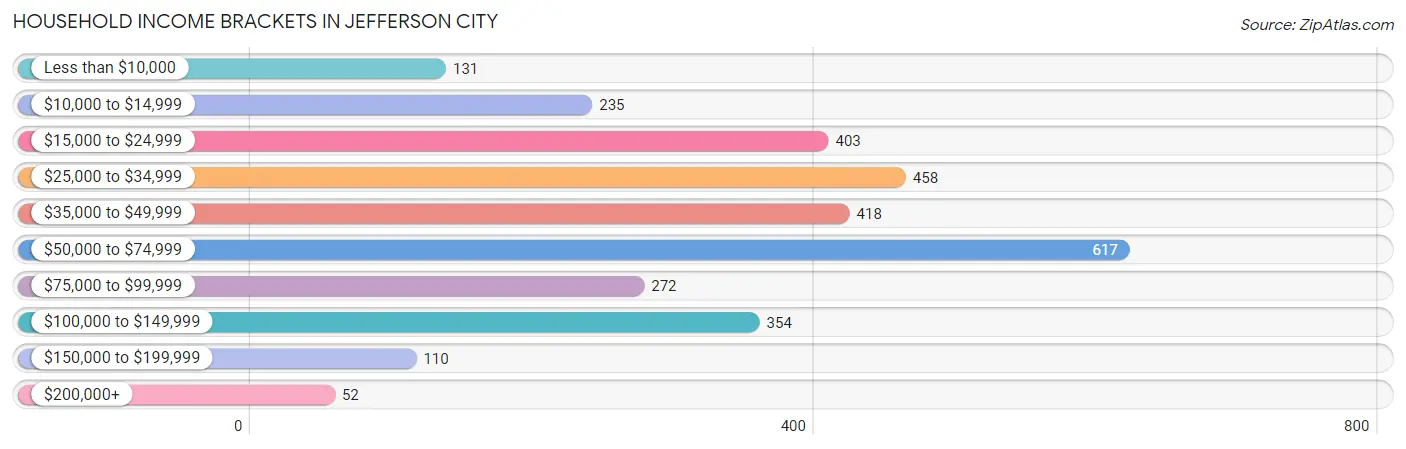
Household Income Brackets in Jefferson City
With 617 households falling in the category, the $50,000 to $74,999 income range is the most frequent in Jefferson City, accounting for 20.2% of all households. In contrast, only 52 households (1.7%) fall into the $200,000+ income bracket, making it the least populous group.
| Income Bracket | # Households | % Households |
| Less than $10,000 | 131 | 4.3% |
| $10,000 to $14,999 | 235 | 7.7% |
| $15,000 to $24,999 | 403 | 13.2% |
| $25,000 to $34,999 | 458 | 15.0% |
| $35,000 to $49,999 | 418 | 13.7% |
| $50,000 to $74,999 | 617 | 20.2% |
| $75,000 to $99,999 | 272 | 8.9% |
| $100,000 to $149,999 | 354 | 11.6% |
| $150,000 to $199,999 | 110 | 3.6% |
| $200,000+ | 52 | 1.7% |
Household Income by Householder Age in Jefferson City
The median household income in Jefferson City is $48,212, with the highest median household income of $65,781 found in the 45 to 64 years age bracket for the primary householder. A total of 1,247 households (40.9%) fall into this category. Meanwhile, the 15 to 24 years age bracket for the primary householder has the lowest median household income of $25,173, with 263 households (8.6%) in this group.
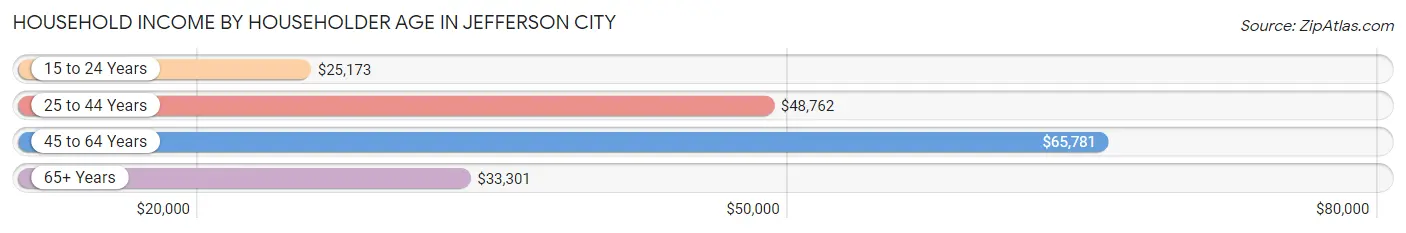
| Income Bracket | # Households | Median Income |
| 15 to 24 Years | 263 (8.6%) | $25,173 |
| 25 to 44 Years | 925 (30.3%) | $48,762 |
| 45 to 64 Years | 1,247 (40.9%) | $65,781 |
| 65+ Years | 617 (20.2%) | $33,301 |
| Total | 3,052 (100.0%) | $48,212 |
Poverty in Jefferson City
Income Below Poverty by Sex and Age in Jefferson City
With 17.6% poverty level for males and 20.9% for females among the residents of Jefferson City, 18 to 24 year old males and 6 to 11 year old females are the most vulnerable to poverty, with 237 males (37.3%) and 145 females (71.8%) in their respective age groups living below the poverty level.
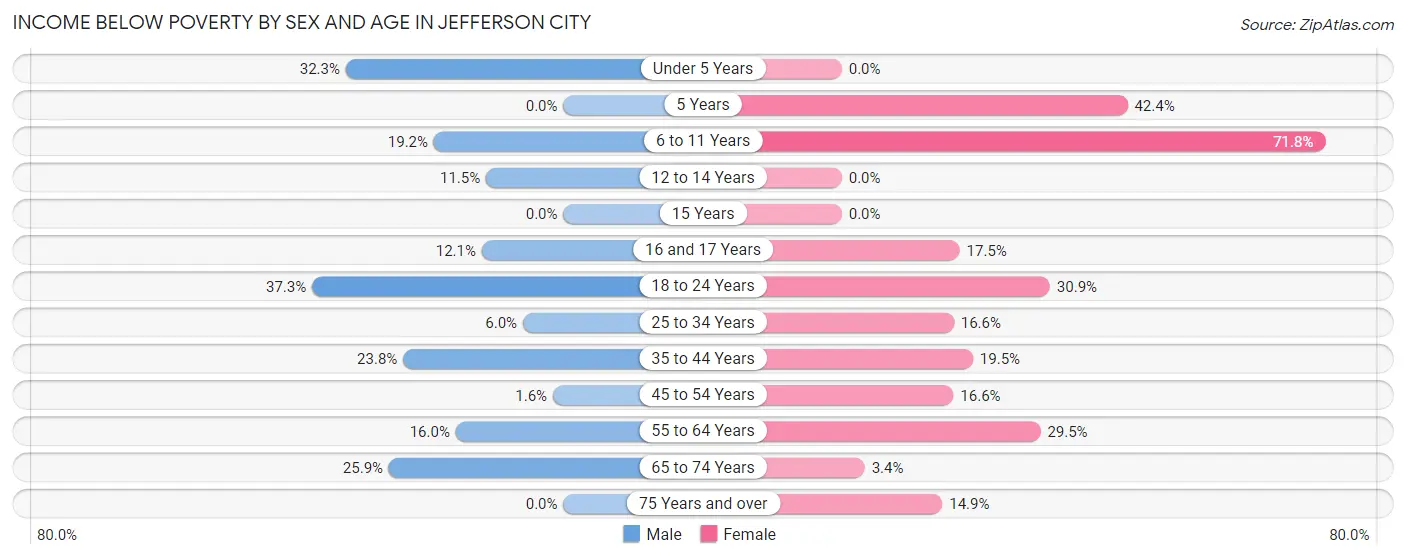
| Age Bracket | Male | Female |
| Under 5 Years | 42 (32.3%) | 0 (0.0%) |
| 5 Years | 0 (0.0%) | 14 (42.4%) |
| 6 to 11 Years | 60 (19.2%) | 145 (71.8%) |
| 12 to 14 Years | 7 (11.5%) | 0 (0.0%) |
| 15 Years | 0 (0.0%) | 0 (0.0%) |
| 16 and 17 Years | 27 (12.1%) | 14 (17.5%) |
| 18 to 24 Years | 237 (37.3%) | 161 (30.9%) |
| 25 to 34 Years | 37 (6.0%) | 77 (16.6%) |
| 35 to 44 Years | 54 (23.8%) | 51 (19.5%) |
| 45 to 54 Years | 6 (1.5%) | 88 (16.6%) |
| 55 to 64 Years | 70 (16.0%) | 172 (29.5%) |
| 65 to 74 Years | 79 (25.9%) | 9 (3.4%) |
| 75 Years and over | 0 (0.0%) | 47 (14.9%) |
| Total | 619 (17.6%) | 778 (20.9%) |
Income Above Poverty by Sex and Age in Jefferson City
According to the poverty statistics in Jefferson City, males aged 5 years and females aged under 5 years are the age groups that are most secure financially, with 100.0% of males and 100.0% of females in these age groups living above the poverty line.
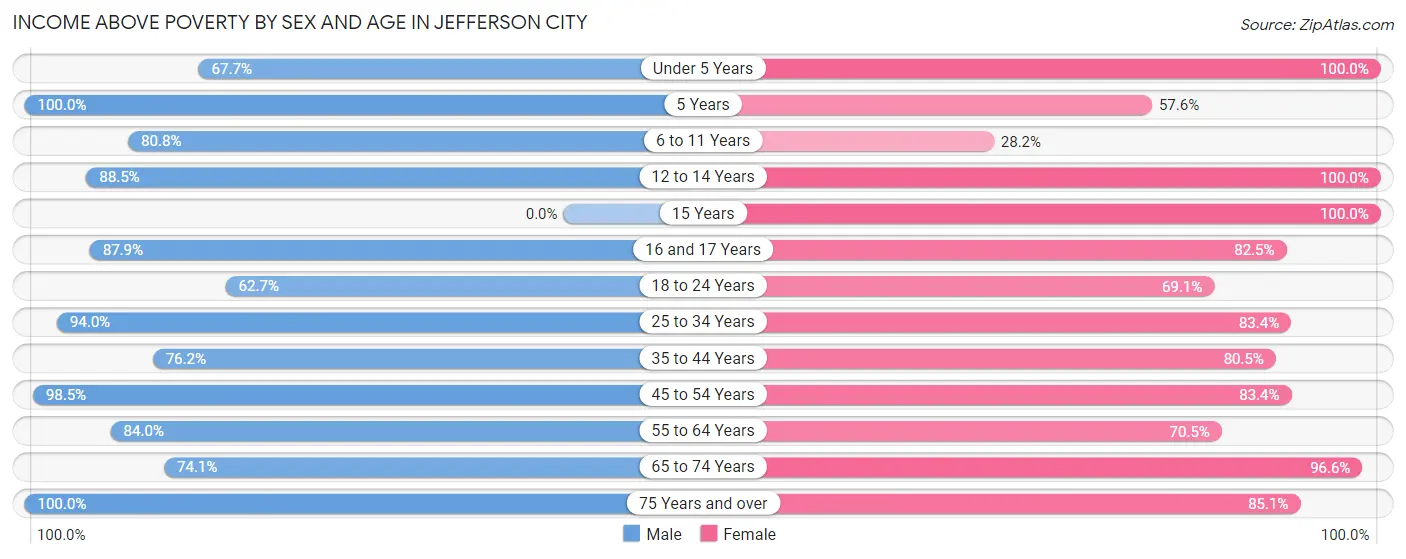
| Age Bracket | Male | Female |
| Under 5 Years | 88 (67.7%) | 312 (100.0%) |
| 5 Years | 48 (100.0%) | 19 (57.6%) |
| 6 to 11 Years | 252 (80.8%) | 57 (28.2%) |
| 12 to 14 Years | 54 (88.5%) | 88 (100.0%) |
| 15 Years | 0 (0.0%) | 69 (100.0%) |
| 16 and 17 Years | 196 (87.9%) | 66 (82.5%) |
| 18 to 24 Years | 398 (62.7%) | 360 (69.1%) |
| 25 to 34 Years | 580 (94.0%) | 386 (83.4%) |
| 35 to 44 Years | 173 (76.2%) | 211 (80.5%) |
| 45 to 54 Years | 380 (98.5%) | 443 (83.4%) |
| 55 to 64 Years | 368 (84.0%) | 411 (70.5%) |
| 65 to 74 Years | 226 (74.1%) | 255 (96.6%) |
| 75 Years and over | 139 (100.0%) | 268 (85.1%) |
| Total | 2,902 (82.4%) | 2,945 (79.1%) |
Income Below Poverty Among Married-Couple Families in Jefferson City
The poverty statistics for married-couple families in Jefferson City show that 6.1% or 70 of the total 1,140 families live below the poverty line. Families with 1 or 2 children have the highest poverty rate of 7.6%, comprising of 39 families. On the other hand, families with 3 or 4 children have the lowest poverty rate of 0.0%, which includes 0 families.
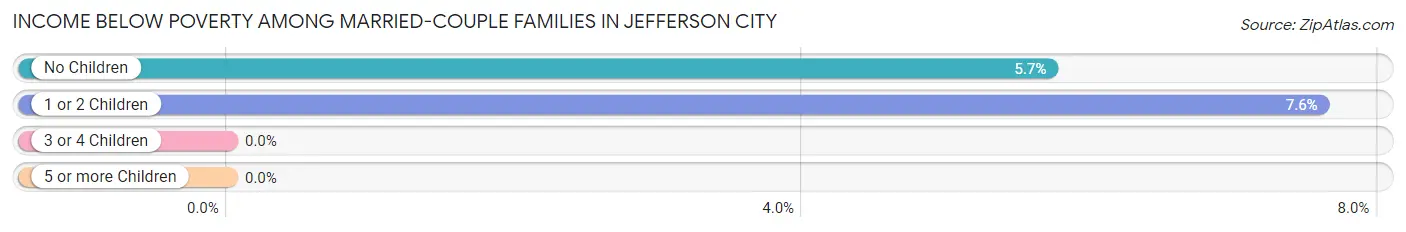
| Children | Above Poverty | Below Poverty |
| No Children | 512 (94.3%) | 31 (5.7%) |
| 1 or 2 Children | 474 (92.4%) | 39 (7.6%) |
| 3 or 4 Children | 84 (100.0%) | 0 (0.0%) |
| 5 or more Children | 0 (0.0%) | 0 (0.0%) |
| Total | 1,070 (93.9%) | 70 (6.1%) |
Income Below Poverty Among Single-Parent Households in Jefferson City
According to the poverty data in Jefferson City, 11.8% or 11 single-father households and 37.8% or 201 single-mother households are living below the poverty line. Among single-father households, those with 3 or 4 children have the highest poverty rate, with 11 households (50.0%) experiencing poverty. Likewise, among single-mother households, those with 1 or 2 children have the highest poverty rate, with 114 households (43.3%) falling below the poverty line.
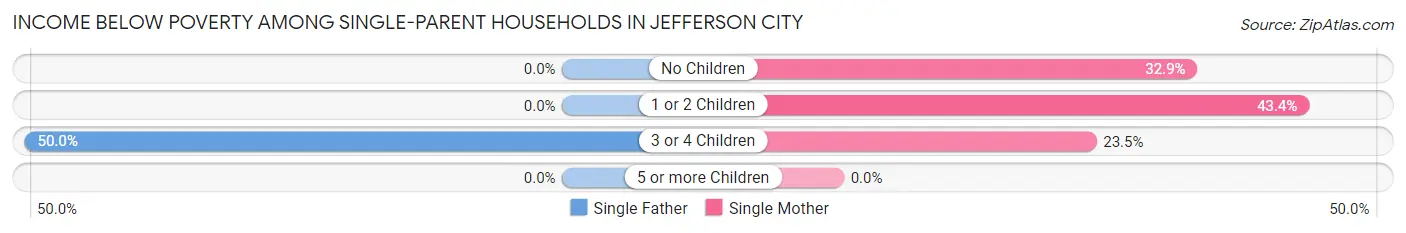
| Children | Single Father | Single Mother |
| No Children | 0 (0.0%) | 83 (32.9%) |
| 1 or 2 Children | 0 (0.0%) | 114 (43.3%) |
| 3 or 4 Children | 11 (50.0%) | 4 (23.5%) |
| 5 or more Children | 0 (0.0%) | 0 (0.0%) |
| Total | 11 (11.8%) | 201 (37.8%) |
Income Below Poverty Among Married-Couple vs Single-Parent Households in Jefferson City
The poverty data for Jefferson City shows that 70 of the married-couple family households (6.1%) and 212 of the single-parent households (33.9%) are living below the poverty level. Within the married-couple family households, those with 1 or 2 children have the highest poverty rate, with 39 households (7.6%) falling below the poverty line. Among the single-parent households, those with 3 or 4 children have the highest poverty rate, with 15 household (38.5%) living below poverty.
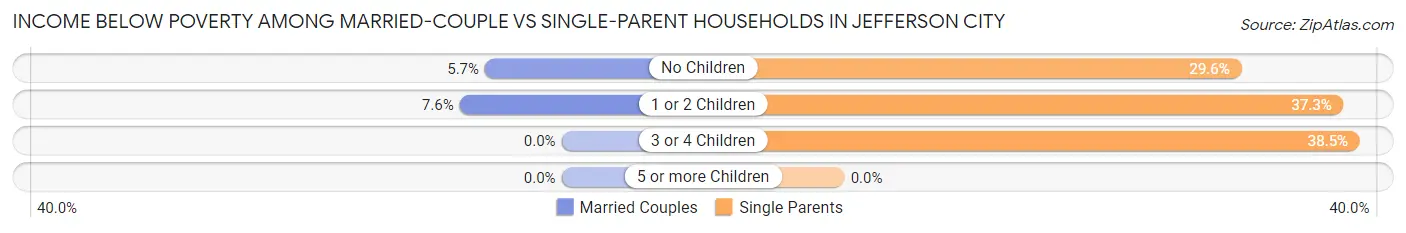
| Children | Married-Couple Families | Single-Parent Households |
| No Children | 31 (5.7%) | 83 (29.6%) |
| 1 or 2 Children | 39 (7.6%) | 114 (37.2%) |
| 3 or 4 Children | 0 (0.0%) | 15 (38.5%) |
| 5 or more Children | 0 (0.0%) | 0 (0.0%) |
| Total | 70 (6.1%) | 212 (33.9%) |
Race in Jefferson City
The most populous races in Jefferson City are White / Caucasian (7,439 | 88.6%), Hispanic or Latino (761 | 9.1%), and Two or more Races (519 | 6.2%).
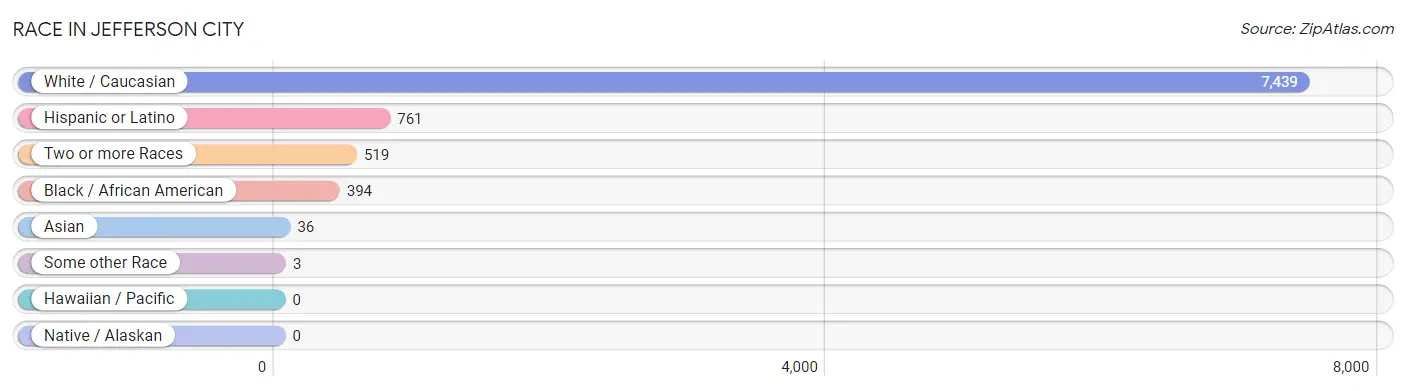
| Race | # Population | % Population |
| Asian | 36 | 0.4% |
| Black / African American | 394 | 4.7% |
| Hawaiian / Pacific | 0 | 0.0% |
| Hispanic or Latino | 761 | 9.1% |
| Native / Alaskan | 0 | 0.0% |
| White / Caucasian | 7,439 | 88.6% |
| Two or more Races | 519 | 6.2% |
| Some other Race | 3 | 0.0% |
| Total | 8,391 | 100.0% |
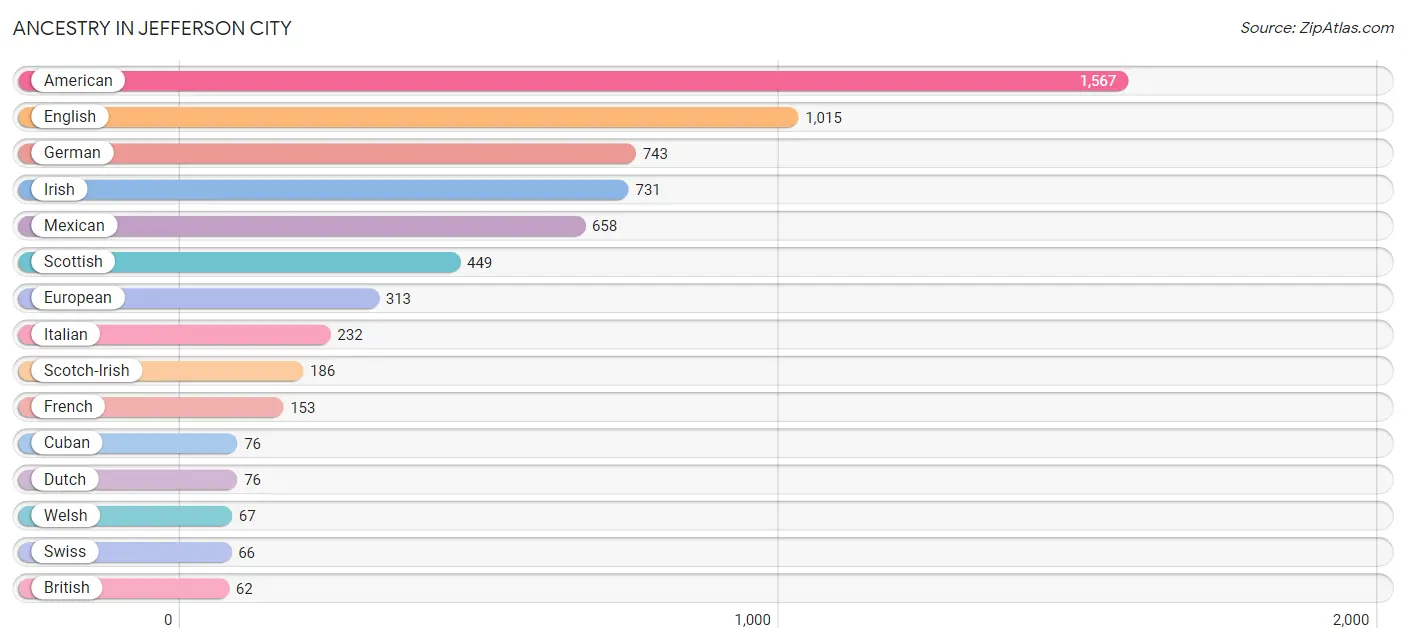
Ancestry in Jefferson City
The most populous ancestries reported in Jefferson City are American (1,567 | 18.7%), English (1,015 | 12.1%), German (743 | 8.8%), Irish (731 | 8.7%), and Mexican (658 | 7.8%), together accounting for 56.2% of all Jefferson City residents.
| Ancestry | # Population | % Population |
| African | 5 | 0.1% |
| American | 1,567 | 18.7% |
| British | 62 | 0.7% |
| Burmese | 6 | 0.1% |
| Canadian | 3 | 0.0% |
| Central American | 3 | 0.0% |
| Cherokee | 7 | 0.1% |
| Cuban | 76 | 0.9% |
| Dutch | 76 | 0.9% |
| Eastern European | 14 | 0.2% |
| English | 1,015 | 12.1% |
| European | 313 | 3.7% |
| French | 153 | 1.8% |
| German | 743 | 8.8% |
| Greek | 12 | 0.1% |
| Haitian | 7 | 0.1% |
| Honduran | 3 | 0.0% |
| Hungarian | 21 | 0.3% |
| Icelander | 58 | 0.7% |
| Irish | 731 | 8.7% |
| Italian | 232 | 2.8% |
| Jamaican | 3 | 0.0% |
| Korean | 30 | 0.4% |
| Mexican | 658 | 7.8% |
| Northern European | 34 | 0.4% |
| Norwegian | 36 | 0.4% |
| Polish | 54 | 0.6% |
| Puerto Rican | 18 | 0.2% |
| Scotch-Irish | 186 | 2.2% |
| Scottish | 449 | 5.3% |
| South African | 4 | 0.1% |
| Subsaharan African | 23 | 0.3% |
| Swedish | 3 | 0.0% |
| Swiss | 66 | 0.8% |
| Welsh | 67 | 0.8% |
| West Indian | 7 | 0.1% | View All 36 Rows |
Immigrants in Jefferson City
The most numerous immigrant groups reported in Jefferson City came from Central America (270 | 3.2%), Latin America (270 | 3.2%), Mexico (261 | 3.1%), Europe (76 | 0.9%), and Northern Europe (61 | 0.7%), together accounting for 11.2% of all Jefferson City residents.
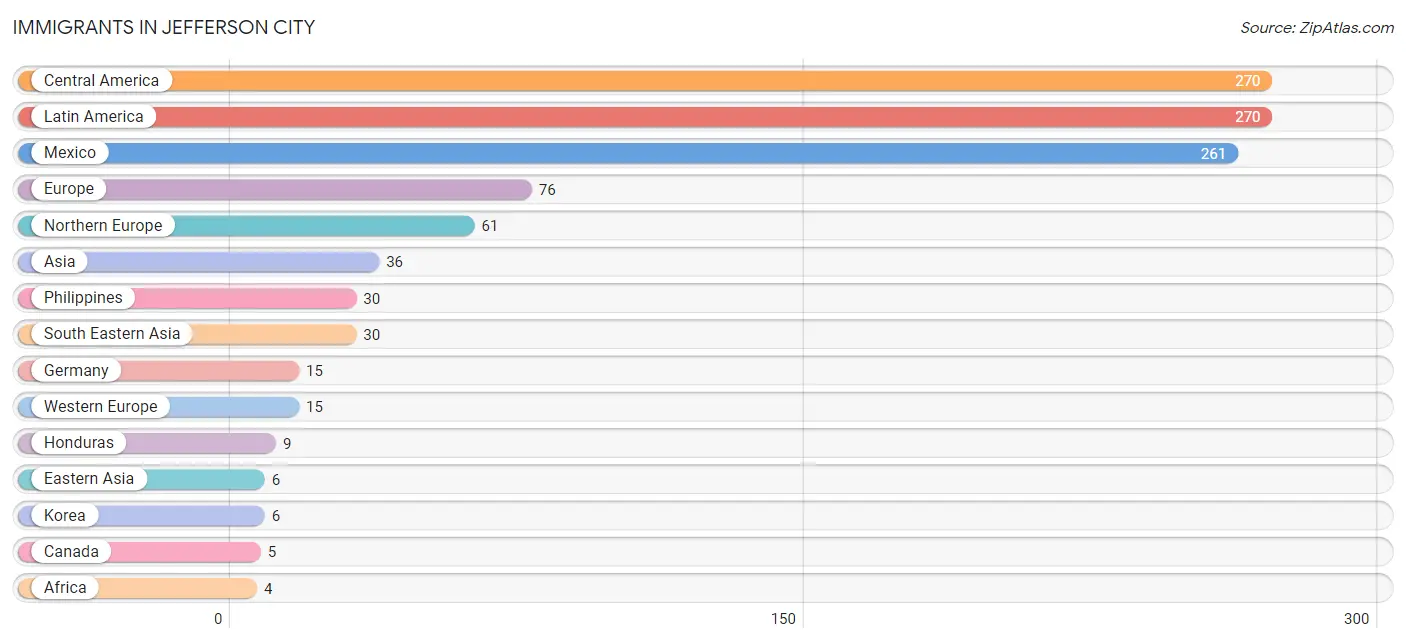
| Immigration Origin | # Population | % Population |
| Africa | 4 | 0.1% |
| Asia | 36 | 0.4% |
| Canada | 5 | 0.1% |
| Central America | 270 | 3.2% |
| Eastern Asia | 6 | 0.1% |
| England | 3 | 0.0% |
| Europe | 76 | 0.9% |
| Germany | 15 | 0.2% |
| Honduras | 9 | 0.1% |
| Korea | 6 | 0.1% |
| Latin America | 270 | 3.2% |
| Mexico | 261 | 3.1% |
| Northern Europe | 61 | 0.7% |
| Philippines | 30 | 0.4% |
| South Africa | 4 | 0.1% |
| South Eastern Asia | 30 | 0.4% |
| Western Europe | 15 | 0.2% | View All 17 Rows |
Sex and Age in Jefferson City
Sex and Age in Jefferson City
The most populous age groups in Jefferson City are 20 to 24 Years (755 | 18.4%) for men and 20 to 24 Years (612 | 14.3%) for women.
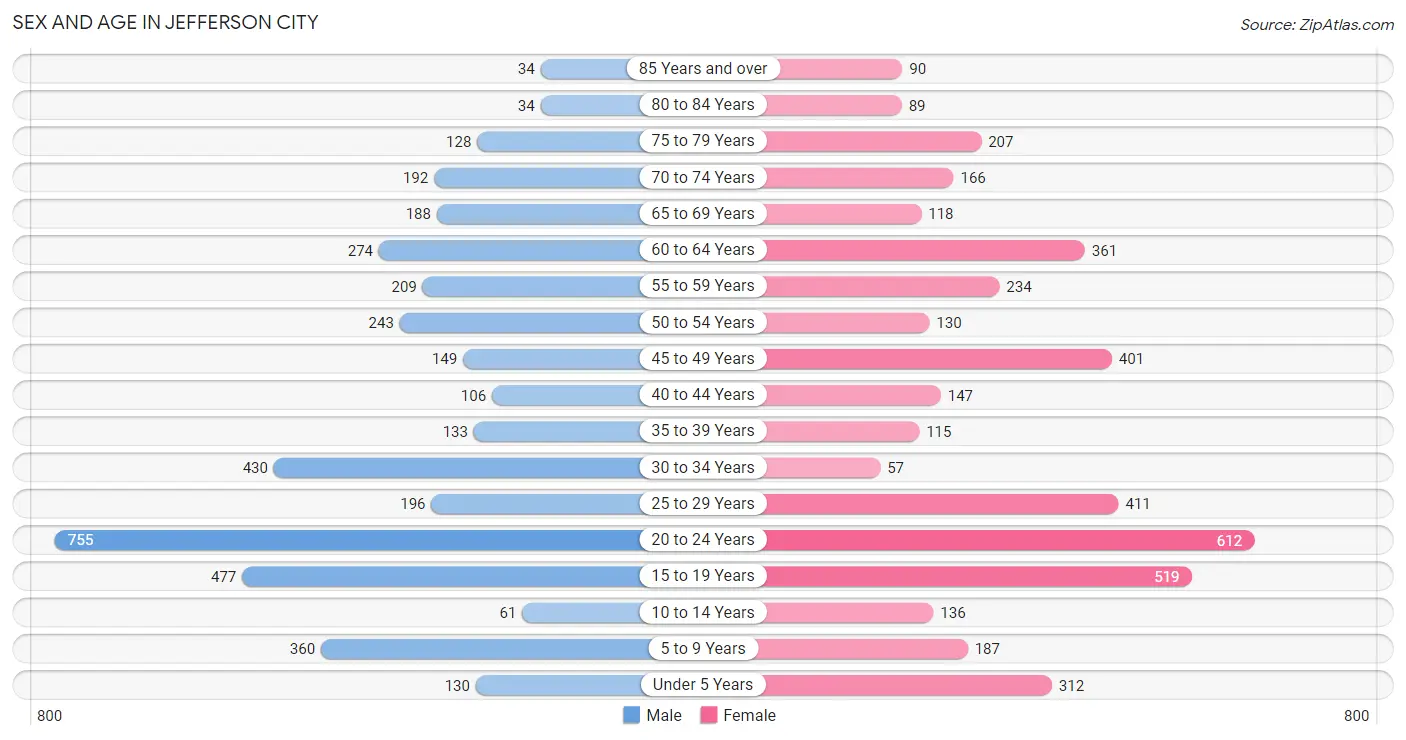
| Age Bracket | Male | Female |
| Under 5 Years | 130 (3.2%) | 312 (7.3%) |
| 5 to 9 Years | 360 (8.8%) | 187 (4.4%) |
| 10 to 14 Years | 61 (1.5%) | 136 (3.2%) |
| 15 to 19 Years | 477 (11.6%) | 519 (12.1%) |
| 20 to 24 Years | 755 (18.4%) | 612 (14.3%) |
| 25 to 29 Years | 196 (4.8%) | 411 (9.6%) |
| 30 to 34 Years | 430 (10.5%) | 57 (1.3%) |
| 35 to 39 Years | 133 (3.2%) | 115 (2.7%) |
| 40 to 44 Years | 106 (2.6%) | 147 (3.4%) |
| 45 to 49 Years | 149 (3.6%) | 401 (9.3%) |
| 50 to 54 Years | 243 (5.9%) | 130 (3.0%) |
| 55 to 59 Years | 209 (5.1%) | 234 (5.4%) |
| 60 to 64 Years | 274 (6.7%) | 361 (8.4%) |
| 65 to 69 Years | 188 (4.6%) | 118 (2.8%) |
| 70 to 74 Years | 192 (4.7%) | 166 (3.9%) |
| 75 to 79 Years | 128 (3.1%) | 207 (4.8%) |
| 80 to 84 Years | 34 (0.8%) | 89 (2.1%) |
| 85 Years and over | 34 (0.8%) | 90 (2.1%) |
| Total | 4,099 (100.0%) | 4,292 (100.0%) |
Families and Households in Jefferson City
Median Family Size in Jefferson City
The median family size in Jefferson City is 3.07 persons per family, with married-couple families (1,140 | 64.6%) accounting for the largest median family size of 3.46 persons per family. On the other hand, single female/mother families (532 | 30.1%) represent the smallest median family size with 2.33 persons per family.
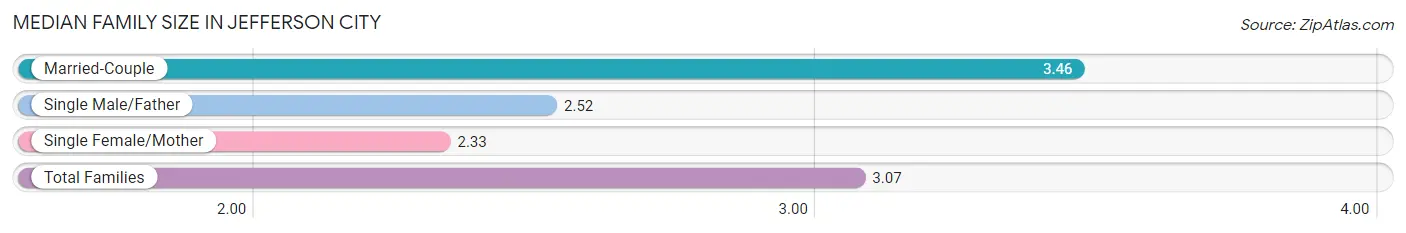
| Family Type | # Families | Family Size |
| Married-Couple | 1,140 (64.6%) | 3.46 |
| Single Male/Father | 93 (5.3%) | 2.52 |
| Single Female/Mother | 532 (30.1%) | 2.33 |
| Total Families | 1,765 (100.0%) | 3.07 |
Median Household Size in Jefferson City
The median household size in Jefferson City is 2.37 persons per household, with married-couple households (1,140 | 37.3%) accounting for the largest median household size of 3.46 persons per household. non-family households (1,287 | 42.2%) represent the smallest median household size with 1.25 persons per household.
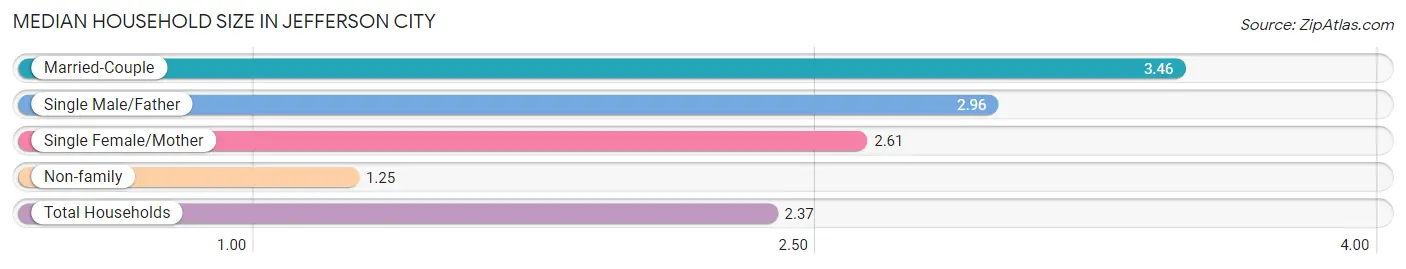
| Household Type | # Households | Household Size |
| Married-Couple | 1,140 (37.3%) | 3.46 |
| Single Male/Father | 93 (3.0%) | 2.96 |
| Single Female/Mother | 532 (17.4%) | 2.61 |
| Non-family | 1,287 (42.2%) | 1.25 |
| Total Households | 3,052 (100.0%) | 2.37 |
Household Size by Marriage Status in Jefferson City
Out of a total of 3,052 households in Jefferson City, 1,765 (57.8%) are family households, while 1,287 (42.2%) are nonfamily households. The most numerous type of family households are 2-person households, comprising 580, and the most common type of nonfamily households are 1-person households, comprising 1,128.
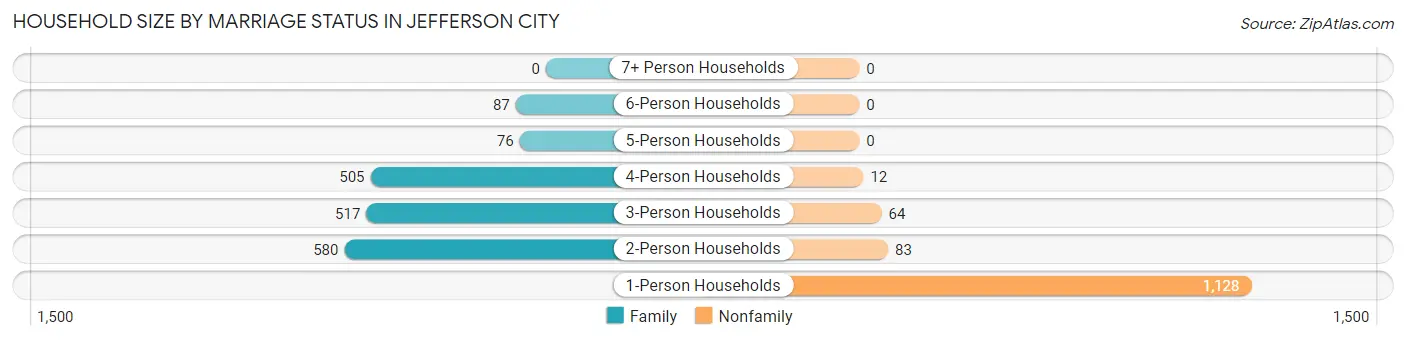
| Household Size | Family Households | Nonfamily Households |
| 1-Person Households | - | 1,128 (37.0%) |
| 2-Person Households | 580 (19.0%) | 83 (2.7%) |
| 3-Person Households | 517 (16.9%) | 64 (2.1%) |
| 4-Person Households | 505 (16.6%) | 12 (0.4%) |
| 5-Person Households | 76 (2.5%) | 0 (0.0%) |
| 6-Person Households | 87 (2.9%) | 0 (0.0%) |
| 7+ Person Households | 0 (0.0%) | 0 (0.0%) |
| Total | 1,765 (57.8%) | 1,287 (42.2%) |
Female Fertility in Jefferson City
Fertility by Age in Jefferson City
Average fertility rate in Jefferson City is 69.0 births per 1,000 women. Women in the age bracket of 20 to 34 years have the highest fertility rate with 145.0 births per 1,000 women. Women in the age bracket of 20 to 34 years acount for 100.0% of all women with births.
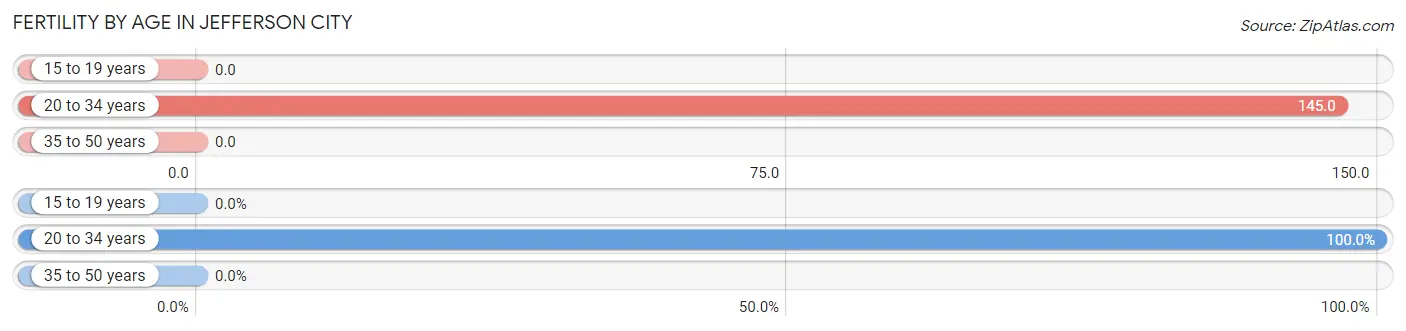
| Age Bracket | Women with Births | Births / 1,000 Women |
| 15 to 19 years | 0 (0.0%) | 0.0 |
| 20 to 34 years | 157 (100.0%) | 145.0 |
| 35 to 50 years | 0 (0.0%) | 0.0 |
| Total | 157 (100.0%) | 69.0 |
Fertility by Age by Marriage Status in Jefferson City
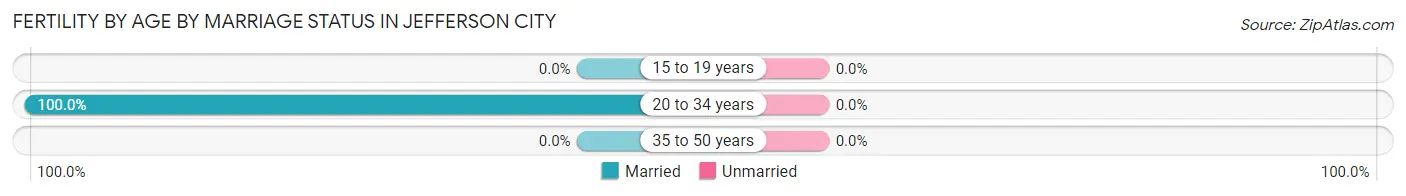
| Age Bracket | Married | Unmarried |
| 15 to 19 years | 0 (0.0%) | 0 (0.0%) |
| 20 to 34 years | 157 (100.0%) | 0 (0.0%) |
| 35 to 50 years | 0 (0.0%) | 0 (0.0%) |
| Total | 157 (100.0%) | 0 (0.0%) |
Fertility by Education in Jefferson City
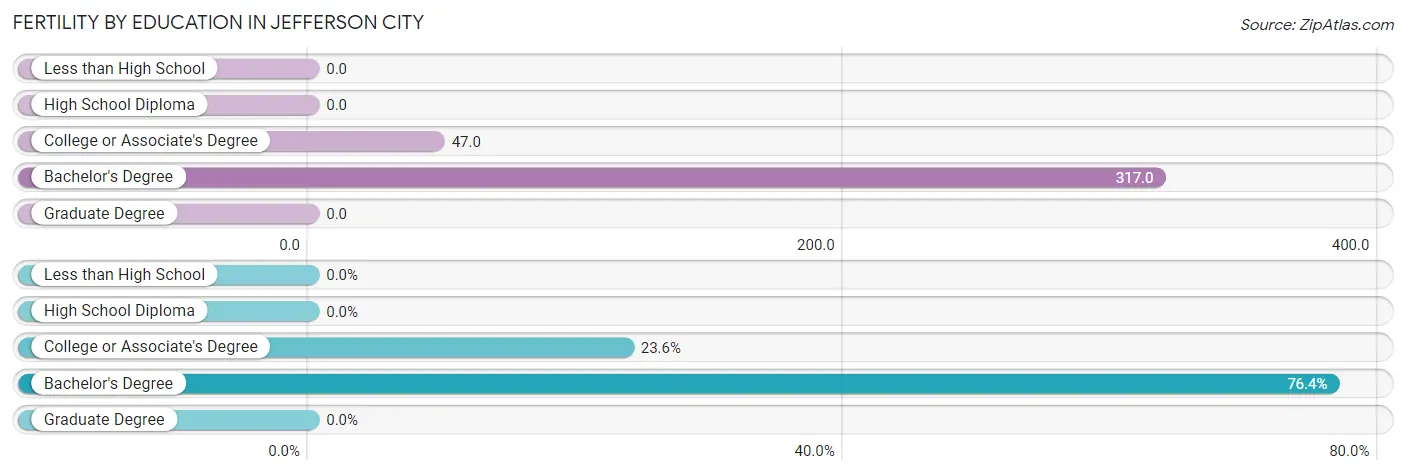
| Educational Attainment | Women with Births | Births / 1,000 Women |
| Less than High School | 0 (0.0%) | 0.0 |
| High School Diploma | 0 (0.0%) | 0.0 |
| College or Associate's Degree | 37 (23.6%) | 47.0 |
| Bachelor's Degree | 120 (76.4%) | 317.0 |
| Graduate Degree | 0 (0.0%) | 0.0 |
| Total | 157 (100.0%) | 69.0 |
Fertility by Education by Marriage Status in Jefferson City
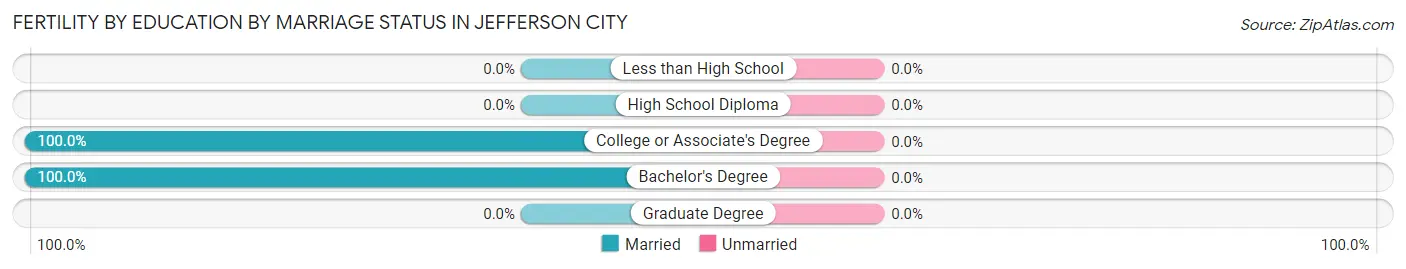
| Educational Attainment | Married | Unmarried |
| Less than High School | 0 (0.0%) | 0 (0.0%) |
| High School Diploma | 0 (0.0%) | 0 (0.0%) |
| College or Associate's Degree | 37 (100.0%) | 0 (0.0%) |
| Bachelor's Degree | 120 (100.0%) | 0 (0.0%) |
| Graduate Degree | 0 (0.0%) | 0 (0.0%) |
| Total | 157 (100.0%) | 0 (0.0%) |
Employment Characteristics in Jefferson City
Employment by Class of Employer in Jefferson City
Among the 3,731 employed individuals in Jefferson City, private company employees (2,832 | 75.9%), not-for-profit organizations (313 | 8.4%), and local government employees (225 | 6.0%) make up the most common classes of employment.
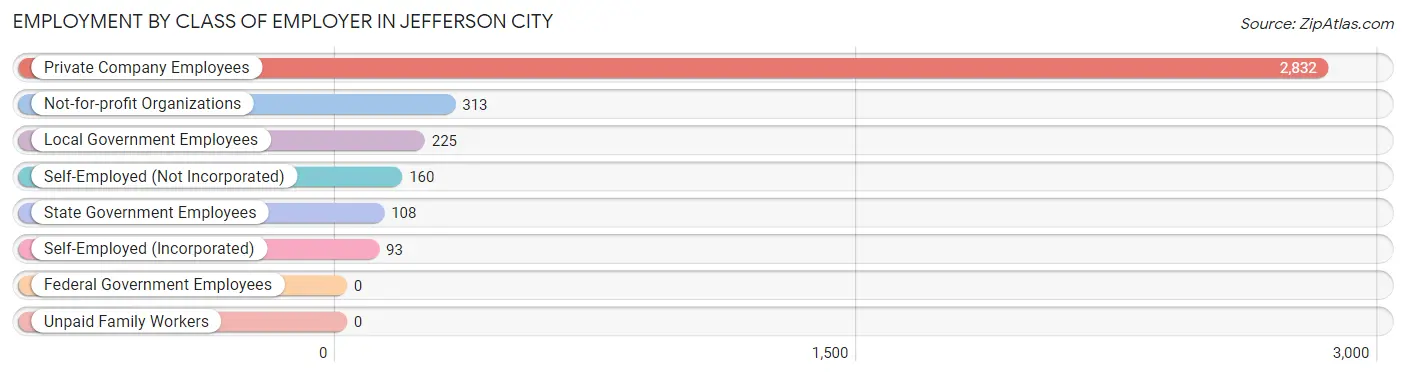
| Employer Class | # Employees | % Employees |
| Private Company Employees | 2,832 | 75.9% |
| Self-Employed (Incorporated) | 93 | 2.5% |
| Self-Employed (Not Incorporated) | 160 | 4.3% |
| Not-for-profit Organizations | 313 | 8.4% |
| Local Government Employees | 225 | 6.0% |
| State Government Employees | 108 | 2.9% |
| Federal Government Employees | 0 | 0.0% |
| Unpaid Family Workers | 0 | 0.0% |
| Total | 3,731 | 100.0% |
Employment Status by Age in Jefferson City
According to the labor force statistics for Jefferson City, out of the total population over 16 years of age (7,136), 57.7% or 4,117 individuals are in the labor force, with 6.8% or 280 of them unemployed. The age group with the highest labor force participation rate is 30 to 34 years, with 93.2% or 454 individuals in the labor force. Within the labor force, the 60 to 64 years age range has the highest percentage of unemployed individuals, with 29.3% or 90 of them being unemployed.
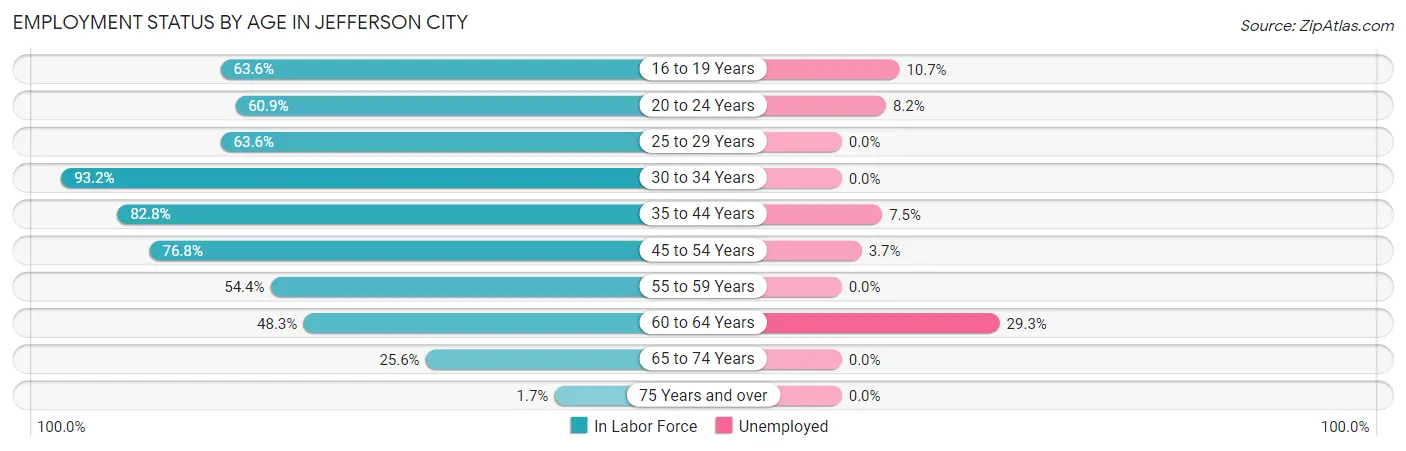
| Age Bracket | In Labor Force | Unemployed |
| 16 to 19 Years | 590 (63.6%) | 63 (10.7%) |
| 20 to 24 Years | 833 (60.9%) | 68 (8.2%) |
| 25 to 29 Years | 386 (63.6%) | 0 (0.0%) |
| 30 to 34 Years | 454 (93.2%) | 0 (0.0%) |
| 35 to 44 Years | 415 (82.8%) | 31 (7.5%) |
| 45 to 54 Years | 709 (76.8%) | 26 (3.7%) |
| 55 to 59 Years | 241 (54.4%) | 0 (0.0%) |
| 60 to 64 Years | 307 (48.3%) | 90 (29.3%) |
| 65 to 74 Years | 170 (25.6%) | 0 (0.0%) |
| 75 Years and over | 10 (1.7%) | 0 (0.0%) |
| Total | 4,117 (57.7%) | 280 (6.8%) |
Employment Status by Educational Attainment in Jefferson City
According to labor force statistics for Jefferson City, 69.9% of individuals (2,514) out of the total population between 25 and 64 years of age (3,596) are in the labor force, with 5.9% or 148 of them being unemployed. The group with the highest labor force participation rate are those with the educational attainment of bachelor's degree or higher, with 82.5% or 774 individuals in the labor force. Within the labor force, individuals with less than high school education have the highest percentage of unemployment, with 32.6% or 63 of them being unemployed.
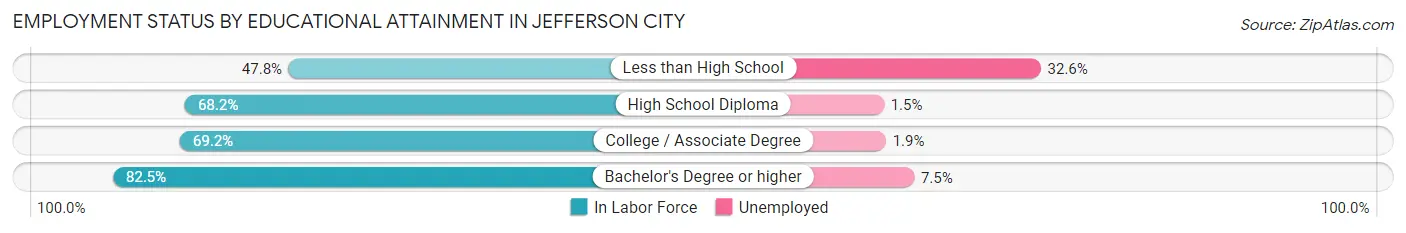
| Educational Attainment | In Labor Force | Unemployed |
| Less than High School | 193 (47.8%) | 132 (32.6%) |
| High School Diploma | 975 (68.2%) | 21 (1.5%) |
| College / Associate Degree | 570 (69.2%) | 16 (1.9%) |
| Bachelor's Degree or higher | 774 (82.5%) | 70 (7.5%) |
| Total | 2,514 (69.9%) | 212 (5.9%) |
Employment Occupations by Sex in Jefferson City
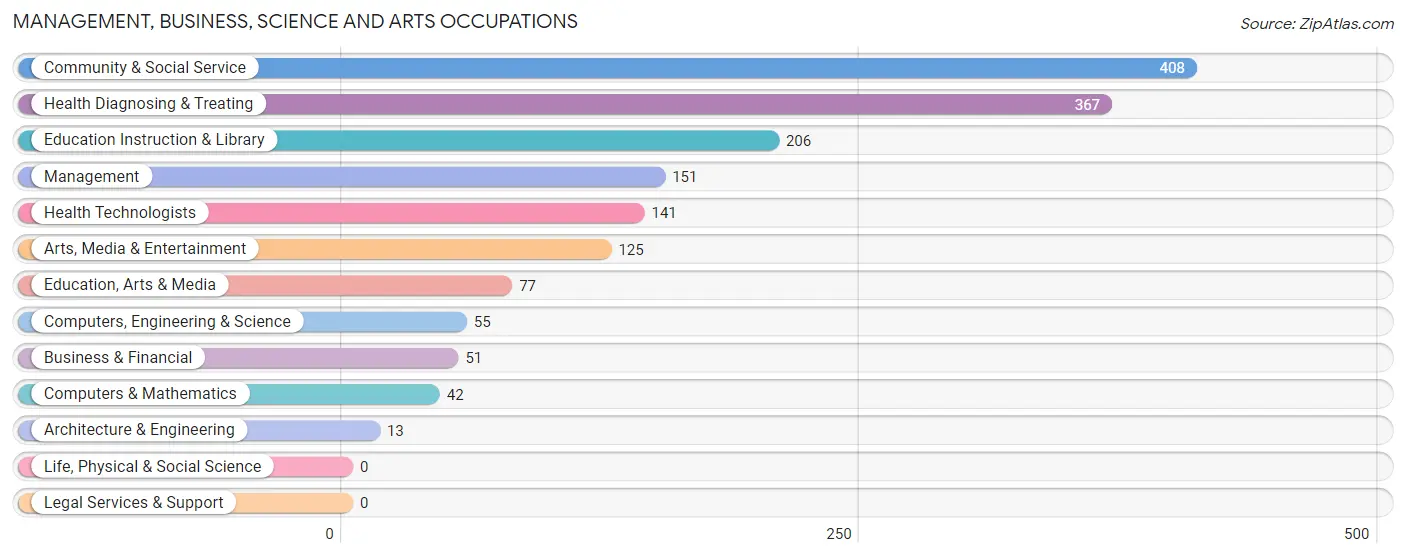
Management, Business, Science and Arts Occupations
The most common Management, Business, Science and Arts occupations in Jefferson City are Community & Social Service (408 | 10.6%), Health Diagnosing & Treating (367 | 9.6%), Education Instruction & Library (206 | 5.4%), Management (151 | 3.9%), and Health Technologists (141 | 3.7%).
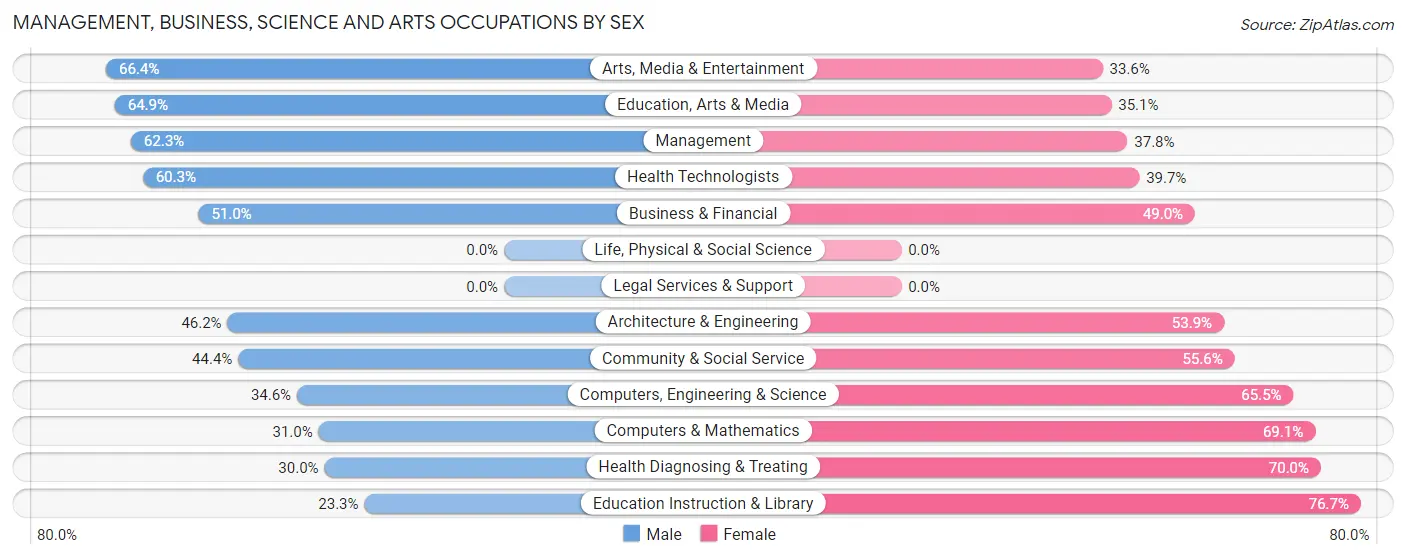
Management, Business, Science and Arts Occupations by Sex
Within the Management, Business, Science and Arts occupations in Jefferson City, the most male-oriented occupations are Arts, Media & Entertainment (66.4%), Education, Arts & Media (64.9%), and Management (62.3%), while the most female-oriented occupations are Education Instruction & Library (76.7%), Health Diagnosing & Treating (70.0%), and Computers & Mathematics (69.1%).
| Occupation | Male | Female |
| Management | 94 (62.3%) | 57 (37.8%) |
| Business & Financial | 26 (51.0%) | 25 (49.0%) |
| Computers, Engineering & Science | 19 (34.5%) | 36 (65.4%) |
| Computers & Mathematics | 13 (30.9%) | 29 (69.1%) |
| Architecture & Engineering | 6 (46.2%) | 7 (53.8%) |
| Life, Physical & Social Science | 0 (0.0%) | 0 (0.0%) |
| Community & Social Service | 181 (44.4%) | 227 (55.6%) |
| Education, Arts & Media | 50 (64.9%) | 27 (35.1%) |
| Legal Services & Support | 0 (0.0%) | 0 (0.0%) |
| Education Instruction & Library | 48 (23.3%) | 158 (76.7%) |
| Arts, Media & Entertainment | 83 (66.4%) | 42 (33.6%) |
| Health Diagnosing & Treating | 110 (30.0%) | 257 (70.0%) |
| Health Technologists | 85 (60.3%) | 56 (39.7%) |
| Total (Category) | 430 (41.7%) | 602 (58.3%) |
| Total (Overall) | 2,037 (53.1%) | 1,799 (46.9%) |
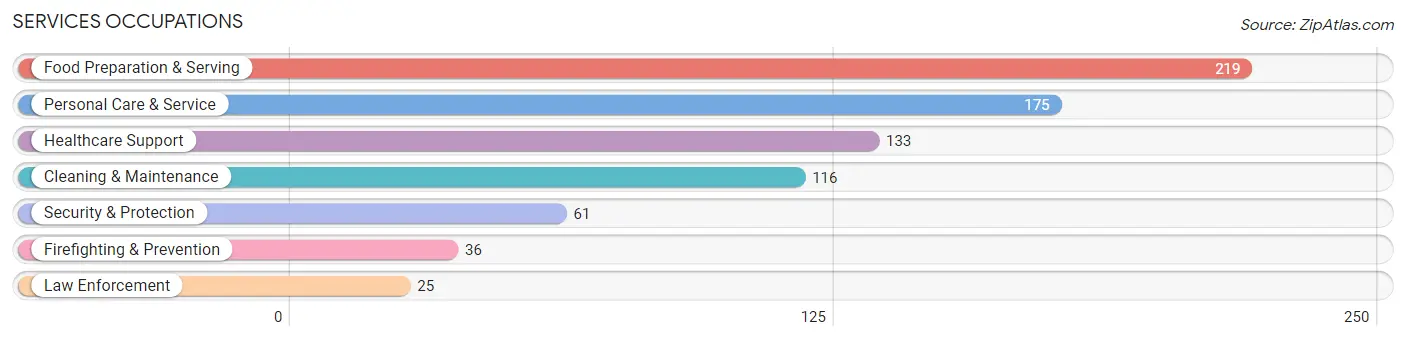
Services Occupations
The most common Services occupations in Jefferson City are Food Preparation & Serving (219 | 5.7%), Personal Care & Service (175 | 4.6%), Healthcare Support (133 | 3.5%), Cleaning & Maintenance (116 | 3.0%), and Security & Protection (61 | 1.6%).
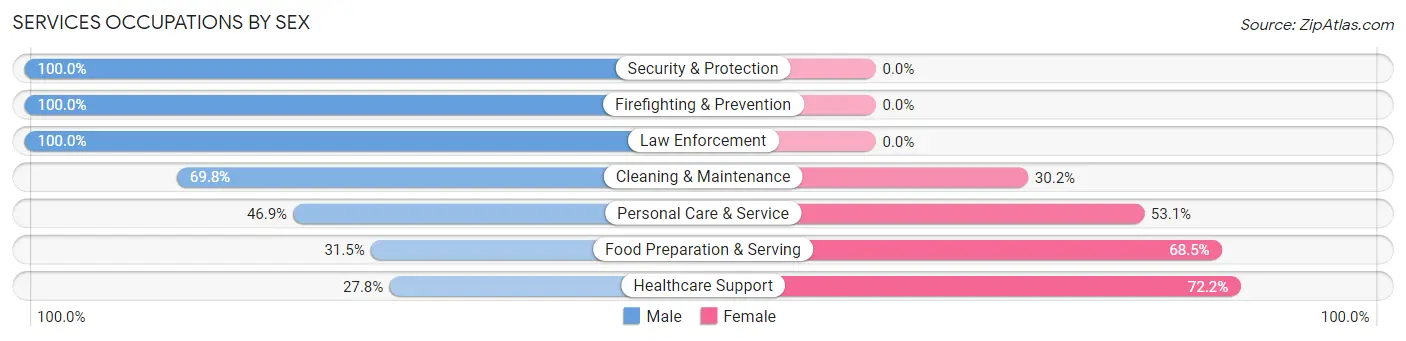
Services Occupations by Sex
Within the Services occupations in Jefferson City, the most male-oriented occupations are Security & Protection (100.0%), Firefighting & Prevention (100.0%), and Law Enforcement (100.0%), while the most female-oriented occupations are Healthcare Support (72.2%), Food Preparation & Serving (68.5%), and Personal Care & Service (53.1%).
| Occupation | Male | Female |
| Healthcare Support | 37 (27.8%) | 96 (72.2%) |
| Security & Protection | 61 (100.0%) | 0 (0.0%) |
| Firefighting & Prevention | 36 (100.0%) | 0 (0.0%) |
| Law Enforcement | 25 (100.0%) | 0 (0.0%) |
| Food Preparation & Serving | 69 (31.5%) | 150 (68.5%) |
| Cleaning & Maintenance | 81 (69.8%) | 35 (30.2%) |
| Personal Care & Service | 82 (46.9%) | 93 (53.1%) |
| Total (Category) | 330 (46.9%) | 374 (53.1%) |
| Total (Overall) | 2,037 (53.1%) | 1,799 (46.9%) |
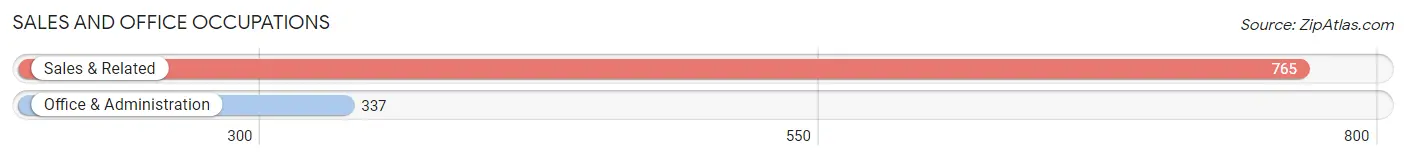
Sales and Office Occupations
The most common Sales and Office occupations in Jefferson City are Sales & Related (765 | 19.9%), and Office & Administration (337 | 8.8%).
Sales and Office Occupations by Sex
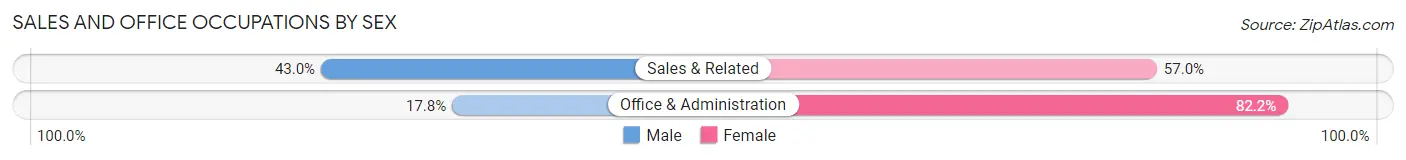
| Occupation | Male | Female |
| Sales & Related | 329 (43.0%) | 436 (57.0%) |
| Office & Administration | 60 (17.8%) | 277 (82.2%) |
| Total (Category) | 389 (35.3%) | 713 (64.7%) |
| Total (Overall) | 2,037 (53.1%) | 1,799 (46.9%) |
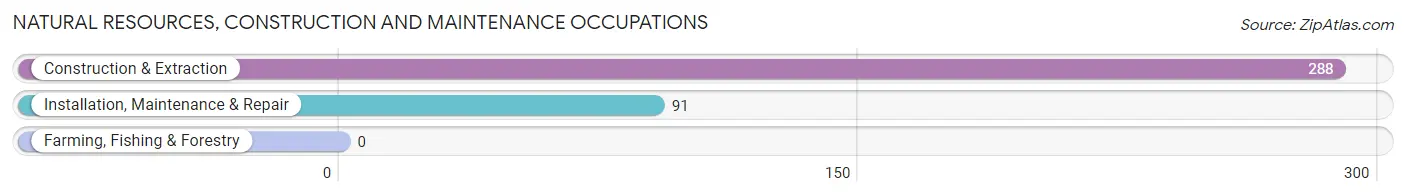
Natural Resources, Construction and Maintenance Occupations
The most common Natural Resources, Construction and Maintenance occupations in Jefferson City are Construction & Extraction (288 | 7.5%), and Installation, Maintenance & Repair (91 | 2.4%).
Natural Resources, Construction and Maintenance Occupations by Sex
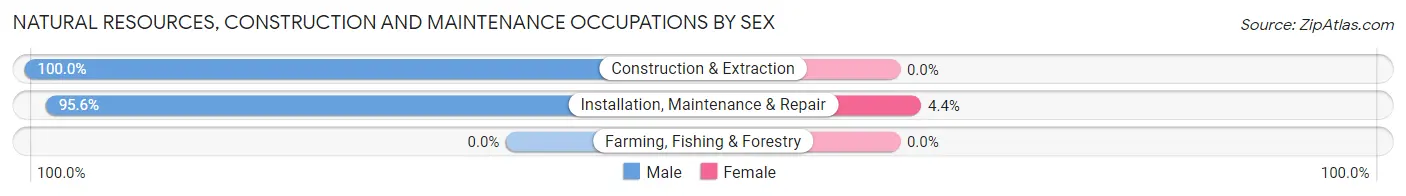
| Occupation | Male | Female |
| Farming, Fishing & Forestry | 0 (0.0%) | 0 (0.0%) |
| Construction & Extraction | 288 (100.0%) | 0 (0.0%) |
| Installation, Maintenance & Repair | 87 (95.6%) | 4 (4.4%) |
| Total (Category) | 375 (98.9%) | 4 (1.1%) |
| Total (Overall) | 2,037 (53.1%) | 1,799 (46.9%) |
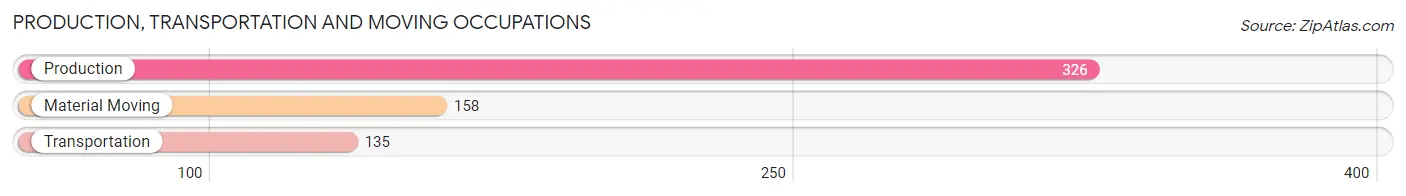
Production, Transportation and Moving Occupations
The most common Production, Transportation and Moving occupations in Jefferson City are Production (326 | 8.5%), Material Moving (158 | 4.1%), and Transportation (135 | 3.5%).
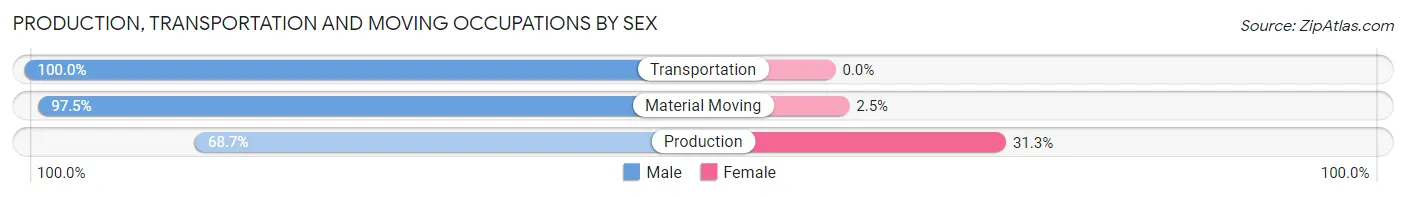
Production, Transportation and Moving Occupations by Sex
| Occupation | Male | Female |
| Production | 224 (68.7%) | 102 (31.3%) |
| Transportation | 135 (100.0%) | 0 (0.0%) |
| Material Moving | 154 (97.5%) | 4 (2.5%) |
| Total (Category) | 513 (82.9%) | 106 (17.1%) |
| Total (Overall) | 2,037 (53.1%) | 1,799 (46.9%) |
Employment Industries by Sex in Jefferson City
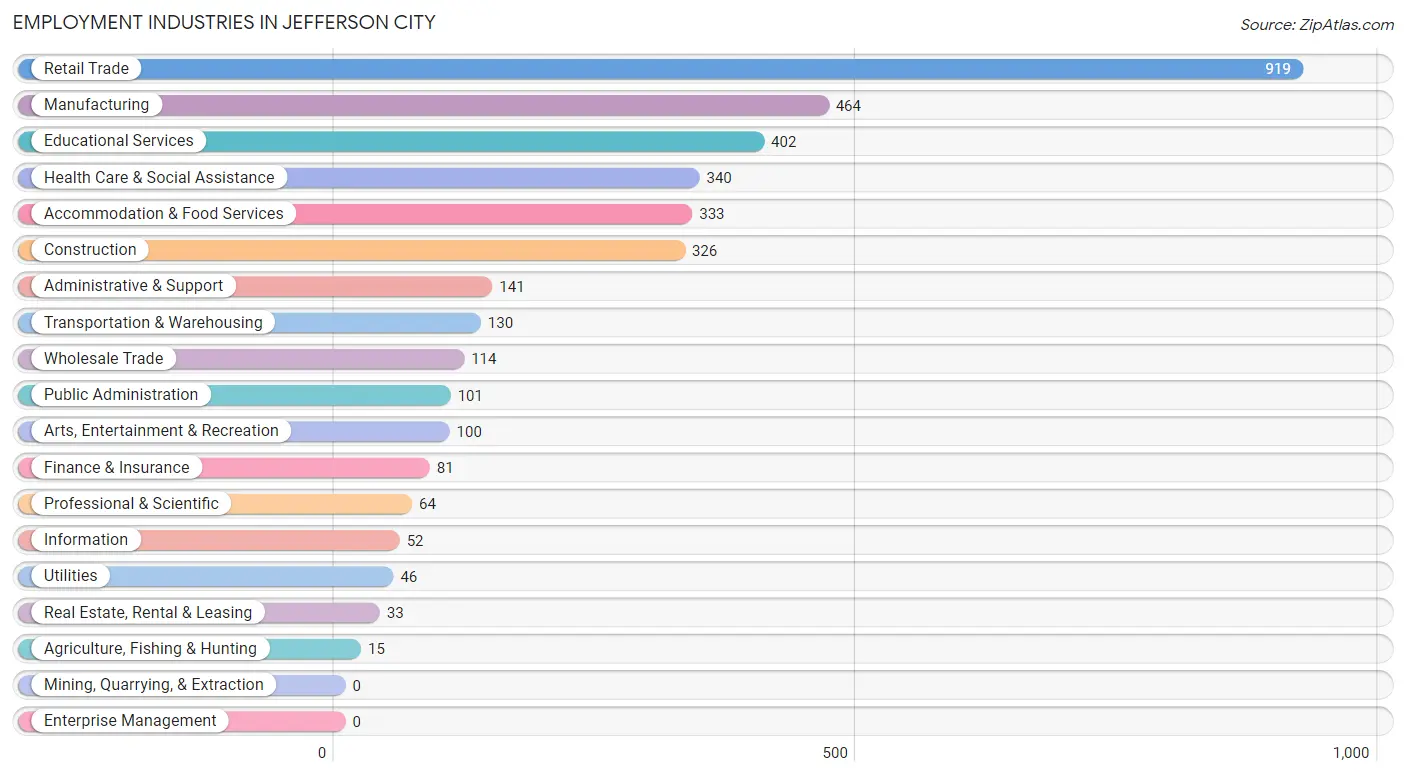
Employment Industries in Jefferson City
The major employment industries in Jefferson City include Retail Trade (919 | 24.0%), Manufacturing (464 | 12.1%), Educational Services (402 | 10.5%), Health Care & Social Assistance (340 | 8.9%), and Accommodation & Food Services (333 | 8.7%).
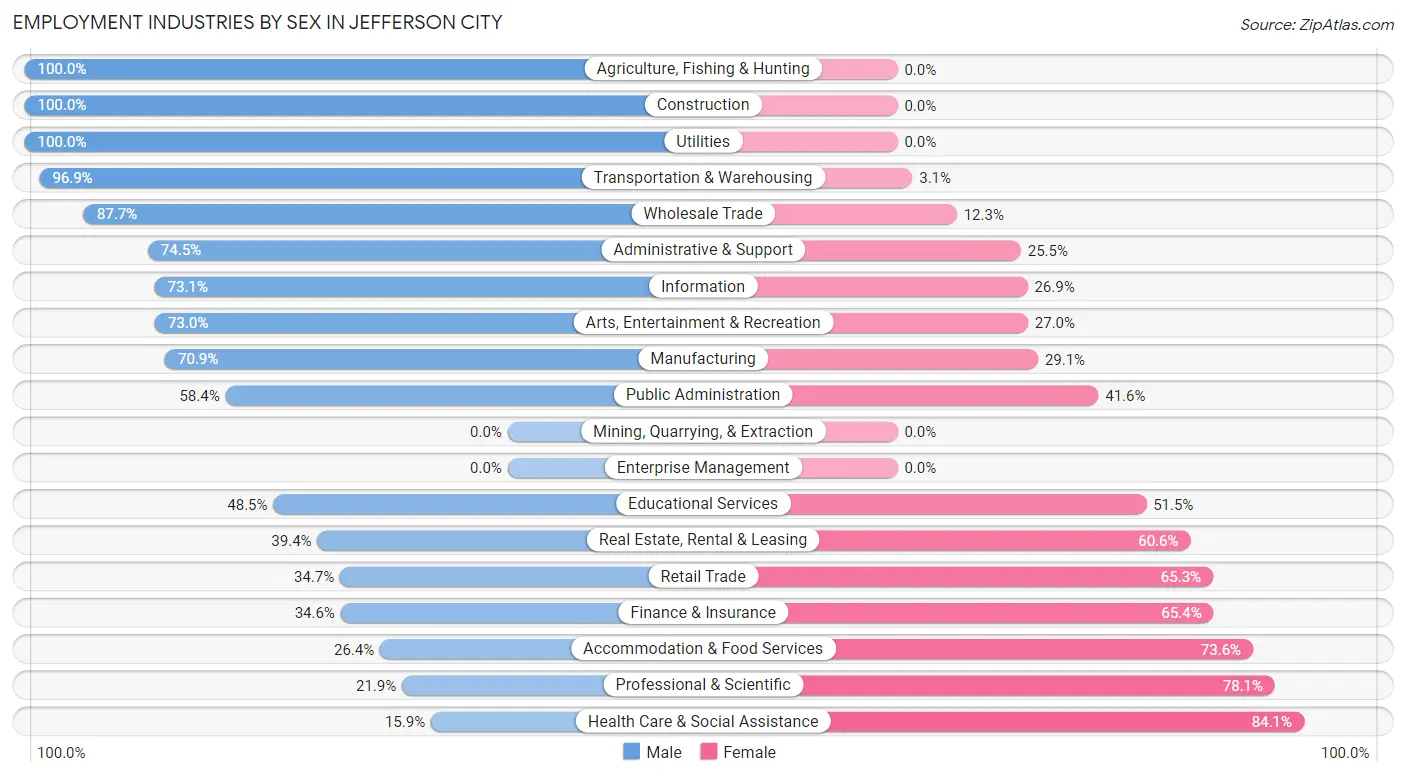
Employment Industries by Sex in Jefferson City
The Jefferson City industries that see more men than women are Agriculture, Fishing & Hunting (100.0%), Construction (100.0%), and Utilities (100.0%), whereas the industries that tend to have a higher number of women are Health Care & Social Assistance (84.1%), Professional & Scientific (78.1%), and Accommodation & Food Services (73.6%).
| Industry | Male | Female |
| Agriculture, Fishing & Hunting | 15 (100.0%) | 0 (0.0%) |
| Mining, Quarrying, & Extraction | 0 (0.0%) | 0 (0.0%) |
| Construction | 326 (100.0%) | 0 (0.0%) |
| Manufacturing | 329 (70.9%) | 135 (29.1%) |
| Wholesale Trade | 100 (87.7%) | 14 (12.3%) |
| Retail Trade | 319 (34.7%) | 600 (65.3%) |
| Transportation & Warehousing | 126 (96.9%) | 4 (3.1%) |
| Utilities | 46 (100.0%) | 0 (0.0%) |
| Information | 38 (73.1%) | 14 (26.9%) |
| Finance & Insurance | 28 (34.6%) | 53 (65.4%) |
| Real Estate, Rental & Leasing | 13 (39.4%) | 20 (60.6%) |
| Professional & Scientific | 14 (21.9%) | 50 (78.1%) |
| Enterprise Management | 0 (0.0%) | 0 (0.0%) |
| Administrative & Support | 105 (74.5%) | 36 (25.5%) |
| Educational Services | 195 (48.5%) | 207 (51.5%) |
| Health Care & Social Assistance | 54 (15.9%) | 286 (84.1%) |
| Arts, Entertainment & Recreation | 73 (73.0%) | 27 (27.0%) |
| Accommodation & Food Services | 88 (26.4%) | 245 (73.6%) |
| Public Administration | 59 (58.4%) | 42 (41.6%) |
| Total | 2,037 (53.1%) | 1,799 (46.9%) |
Education in Jefferson City
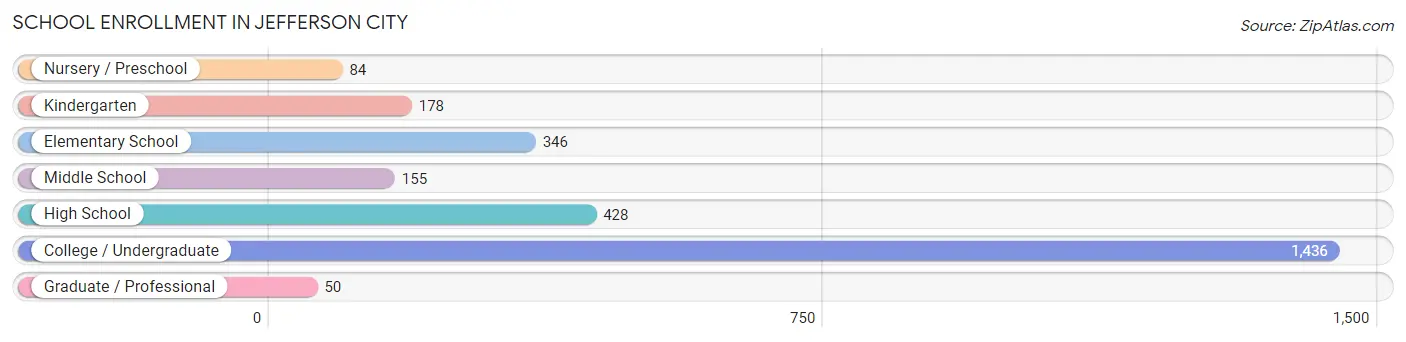
School Enrollment in Jefferson City
The most common levels of schooling among the 2,677 students in Jefferson City are college / undergraduate (1,436 | 53.6%), high school (428 | 16.0%), and elementary school (346 | 12.9%).
| School Level | # Students | % Students |
| Nursery / Preschool | 84 | 3.1% |
| Kindergarten | 178 | 6.7% |
| Elementary School | 346 | 12.9% |
| Middle School | 155 | 5.8% |
| High School | 428 | 16.0% |
| College / Undergraduate | 1,436 | 53.6% |
| Graduate / Professional | 50 | 1.9% |
| Total | 2,677 | 100.0% |
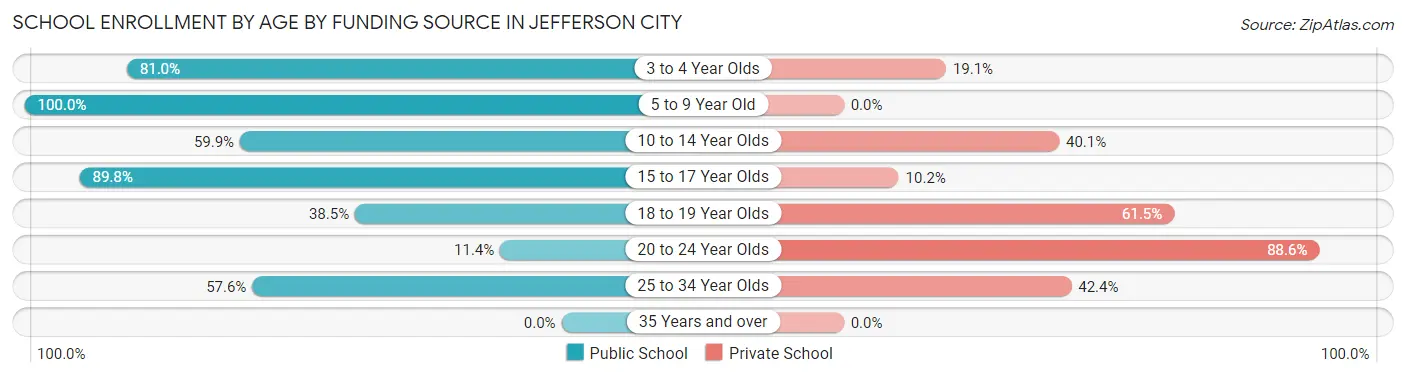
School Enrollment by Age by Funding Source in Jefferson City
Out of a total of 2,677 students who are enrolled in schools in Jefferson City, 1,301 (48.6%) attend a private institution, while the remaining 1,376 (51.4%) are enrolled in public schools. The age group of 20 to 24 year olds has the highest likelihood of being enrolled in private schools, with 837 (88.6% in the age bracket) enrolled. Conversely, the age group of 5 to 9 year old has the lowest likelihood of being enrolled in a private school, with 512 (100.0% in the age bracket) attending a public institution.
| Age Bracket | Public School | Private School |
| 3 to 4 Year Olds | 68 (80.9%) | 16 (19.1%) |
| 5 to 9 Year Old | 512 (100.0%) | 0 (0.0%) |
| 10 to 14 Year Olds | 109 (59.9%) | 73 (40.1%) |
| 15 to 17 Year Olds | 342 (89.8%) | 39 (10.2%) |
| 18 to 19 Year Olds | 185 (38.5%) | 296 (61.5%) |
| 20 to 24 Year Olds | 108 (11.4%) | 837 (88.6%) |
| 25 to 34 Year Olds | 53 (57.6%) | 39 (42.4%) |
| 35 Years and over | 0 (0.0%) | 0 (0.0%) |
| Total | 1,376 (51.4%) | 1,301 (48.6%) |
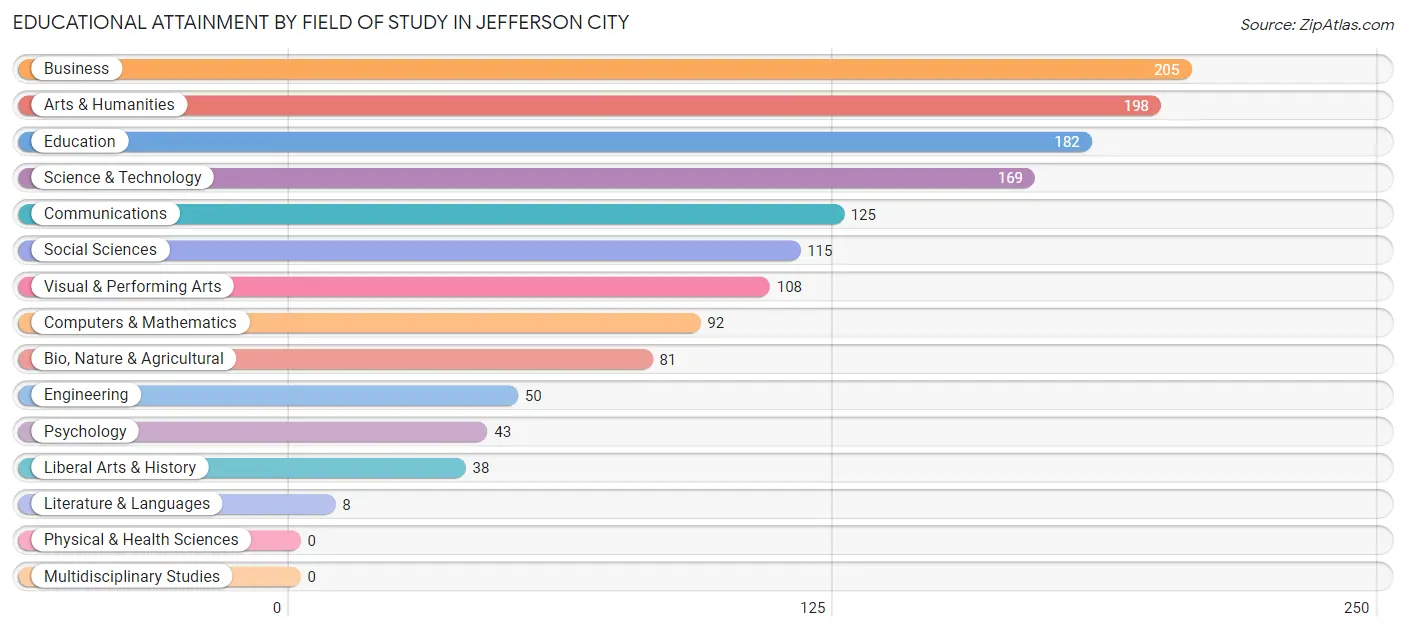
Educational Attainment by Field of Study in Jefferson City
Business (205 | 14.5%), arts & humanities (198 | 14.0%), education (182 | 12.9%), science & technology (169 | 11.9%), and communications (125 | 8.8%) are the most common fields of study among 1,414 individuals in Jefferson City who have obtained a bachelor's degree or higher.
| Field of Study | # Graduates | % Graduates |
| Computers & Mathematics | 92 | 6.5% |
| Bio, Nature & Agricultural | 81 | 5.7% |
| Physical & Health Sciences | 0 | 0.0% |
| Psychology | 43 | 3.0% |
| Social Sciences | 115 | 8.1% |
| Engineering | 50 | 3.5% |
| Multidisciplinary Studies | 0 | 0.0% |
| Science & Technology | 169 | 11.9% |
| Business | 205 | 14.5% |
| Education | 182 | 12.9% |
| Literature & Languages | 8 | 0.6% |
| Liberal Arts & History | 38 | 2.7% |
| Visual & Performing Arts | 108 | 7.6% |
| Communications | 125 | 8.8% |
| Arts & Humanities | 198 | 14.0% |
| Total | 1,414 | 100.0% |
Transportation & Commute in Jefferson City
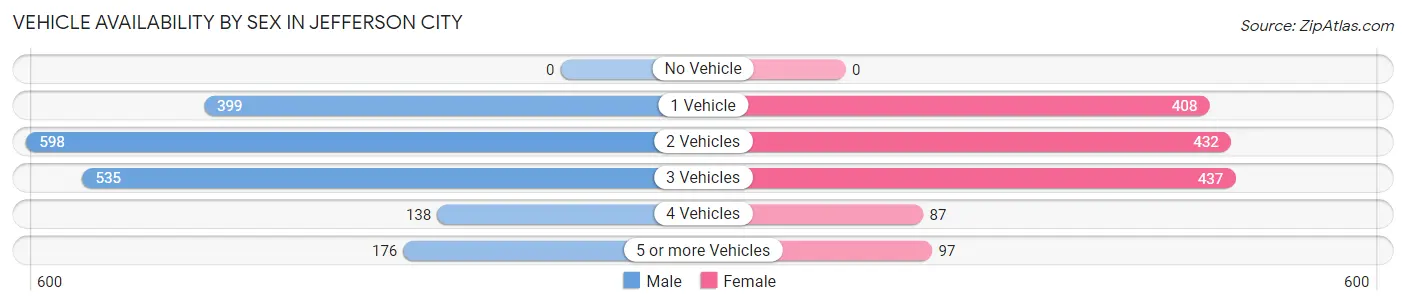
Vehicle Availability by Sex in Jefferson City
The most prevalent vehicle ownership categories in Jefferson City are males with 2 vehicles (598, accounting for 32.4%) and females with 2 vehicles (432, making up 40.9%).
| Vehicles Available | Male | Female |
| No Vehicle | 0 (0.0%) | 0 (0.0%) |
| 1 Vehicle | 399 (21.6%) | 408 (27.9%) |
| 2 Vehicles | 598 (32.4%) | 432 (29.6%) |
| 3 Vehicles | 535 (29.0%) | 437 (29.9%) |
| 4 Vehicles | 138 (7.5%) | 87 (5.9%) |
| 5 or more Vehicles | 176 (9.5%) | 97 (6.6%) |
| Total | 1,846 (100.0%) | 1,461 (100.0%) |
Commute Time in Jefferson City
The most frequently occuring commute durations in Jefferson City are 5 to 9 minutes (873 commuters, 24.4%), 10 to 14 minutes (543 commuters, 15.2%), and 30 to 34 minutes (499 commuters, 14.0%).
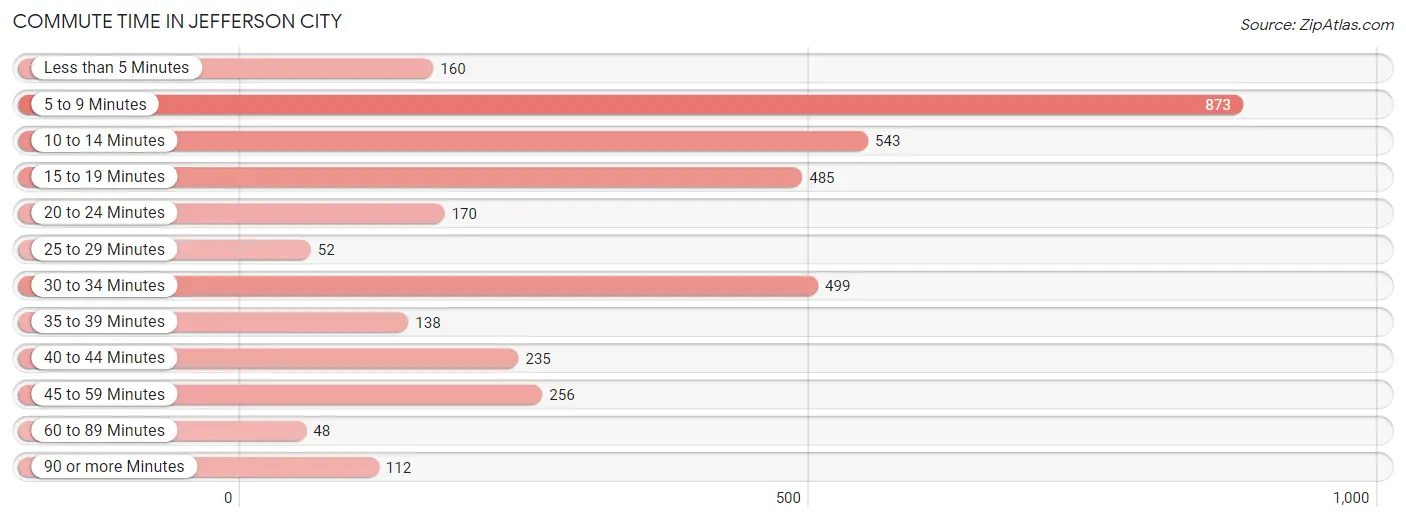
| Commute Time | # Commuters | % Commuters |
| Less than 5 Minutes | 160 | 4.5% |
| 5 to 9 Minutes | 873 | 24.4% |
| 10 to 14 Minutes | 543 | 15.2% |
| 15 to 19 Minutes | 485 | 13.6% |
| 20 to 24 Minutes | 170 | 4.8% |
| 25 to 29 Minutes | 52 | 1.5% |
| 30 to 34 Minutes | 499 | 14.0% |
| 35 to 39 Minutes | 138 | 3.9% |
| 40 to 44 Minutes | 235 | 6.6% |
| 45 to 59 Minutes | 256 | 7.2% |
| 60 to 89 Minutes | 48 | 1.3% |
| 90 or more Minutes | 112 | 3.1% |
Commute Time by Sex in Jefferson City
The most common commute times in Jefferson City are 5 to 9 minutes (447 commuters, 23.1%) for males and 5 to 9 minutes (426 commuters, 26.0%) for females.
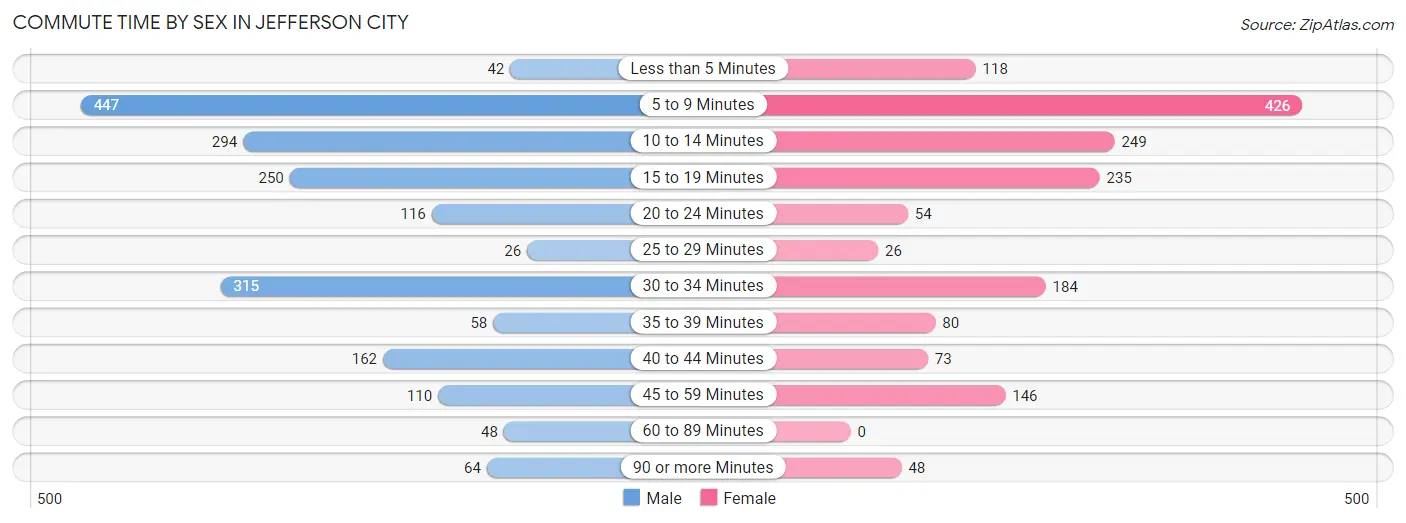
| Commute Time | Male | Female |
| Less than 5 Minutes | 42 (2.2%) | 118 (7.2%) |
| 5 to 9 Minutes | 447 (23.1%) | 426 (26.0%) |
| 10 to 14 Minutes | 294 (15.2%) | 249 (15.2%) |
| 15 to 19 Minutes | 250 (12.9%) | 235 (14.3%) |
| 20 to 24 Minutes | 116 (6.0%) | 54 (3.3%) |
| 25 to 29 Minutes | 26 (1.3%) | 26 (1.6%) |
| 30 to 34 Minutes | 315 (16.3%) | 184 (11.2%) |
| 35 to 39 Minutes | 58 (3.0%) | 80 (4.9%) |
| 40 to 44 Minutes | 162 (8.4%) | 73 (4.4%) |
| 45 to 59 Minutes | 110 (5.7%) | 146 (8.9%) |
| 60 to 89 Minutes | 48 (2.5%) | 0 (0.0%) |
| 90 or more Minutes | 64 (3.3%) | 48 (2.9%) |
Time of Departure to Work by Sex in Jefferson City
The most frequent times of departure to work in Jefferson City are 7:00 AM to 7:29 AM (242, 12.5%) for males and 7:30 AM to 7:59 AM (314, 19.2%) for females.
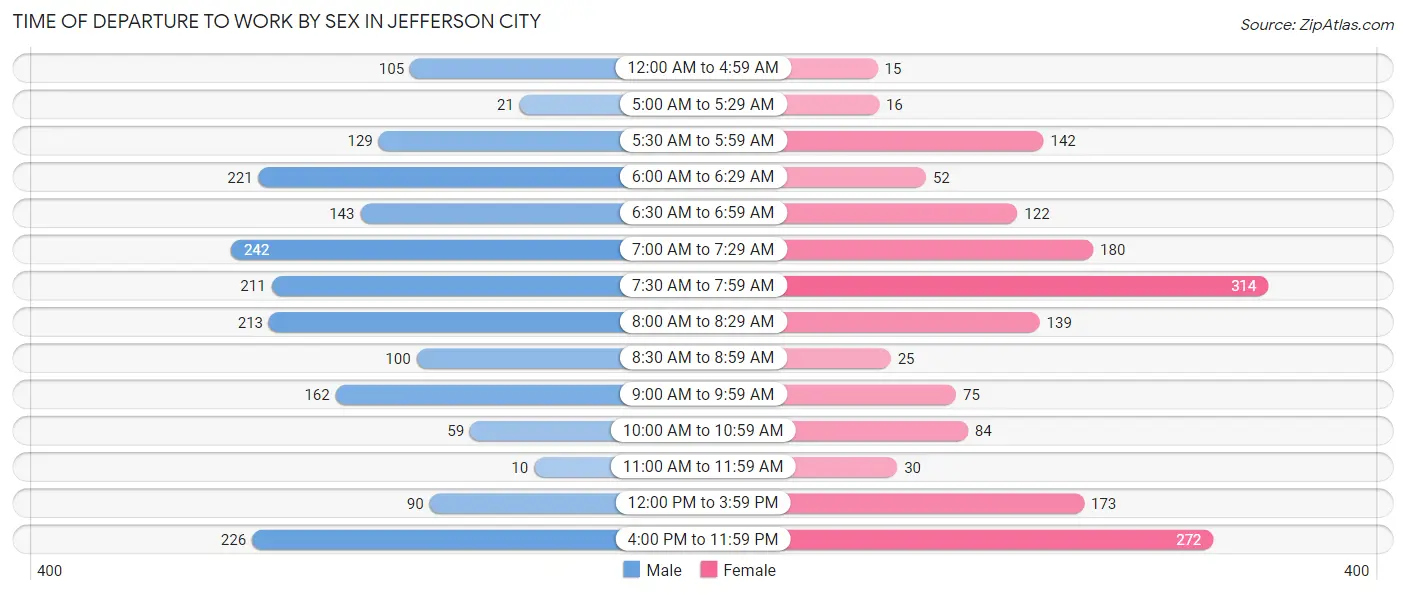
| Time of Departure | Male | Female |
| 12:00 AM to 4:59 AM | 105 (5.4%) | 15 (0.9%) |
| 5:00 AM to 5:29 AM | 21 (1.1%) | 16 (1.0%) |
| 5:30 AM to 5:59 AM | 129 (6.7%) | 142 (8.7%) |
| 6:00 AM to 6:29 AM | 221 (11.4%) | 52 (3.2%) |
| 6:30 AM to 6:59 AM | 143 (7.4%) | 122 (7.4%) |
| 7:00 AM to 7:29 AM | 242 (12.5%) | 180 (11.0%) |
| 7:30 AM to 7:59 AM | 211 (10.9%) | 314 (19.2%) |
| 8:00 AM to 8:29 AM | 213 (11.0%) | 139 (8.5%) |
| 8:30 AM to 8:59 AM | 100 (5.2%) | 25 (1.5%) |
| 9:00 AM to 9:59 AM | 162 (8.4%) | 75 (4.6%) |
| 10:00 AM to 10:59 AM | 59 (3.0%) | 84 (5.1%) |
| 11:00 AM to 11:59 AM | 10 (0.5%) | 30 (1.8%) |
| 12:00 PM to 3:59 PM | 90 (4.7%) | 173 (10.6%) |
| 4:00 PM to 11:59 PM | 226 (11.7%) | 272 (16.6%) |
| Total | 1,932 (100.0%) | 1,639 (100.0%) |
Housing Occupancy in Jefferson City
Occupancy by Ownership in Jefferson City
Of the total 3,052 dwellings in Jefferson City, owner-occupied units account for 1,372 (45.0%), while renter-occupied units make up 1,680 (55.0%).
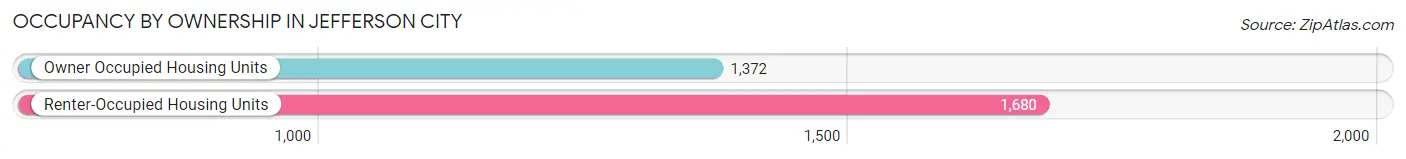
| Occupancy | # Housing Units | % Housing Units |
| Owner Occupied Housing Units | 1,372 | 45.0% |
| Renter-Occupied Housing Units | 1,680 | 55.0% |
| Total Occupied Housing Units | 3,052 | 100.0% |
Occupancy by Household Size in Jefferson City
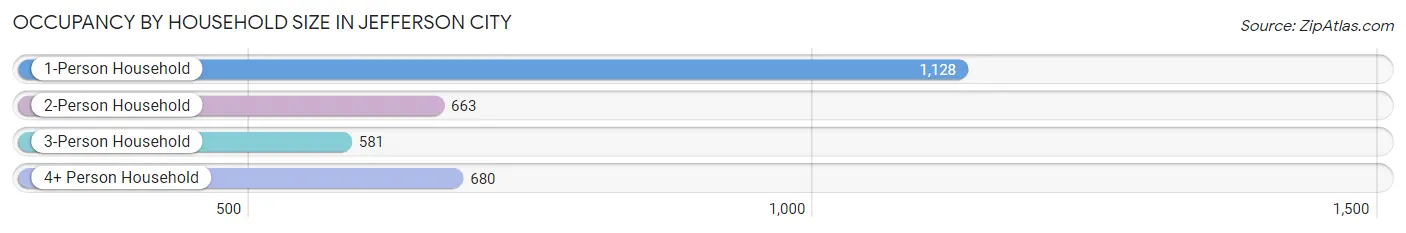
| Household Size | # Housing Units | % Housing Units |
| 1-Person Household | 1,128 | 37.0% |
| 2-Person Household | 663 | 21.7% |
| 3-Person Household | 581 | 19.0% |
| 4+ Person Household | 680 | 22.3% |
| Total Housing Units | 3,052 | 100.0% |
Occupancy by Ownership by Household Size in Jefferson City
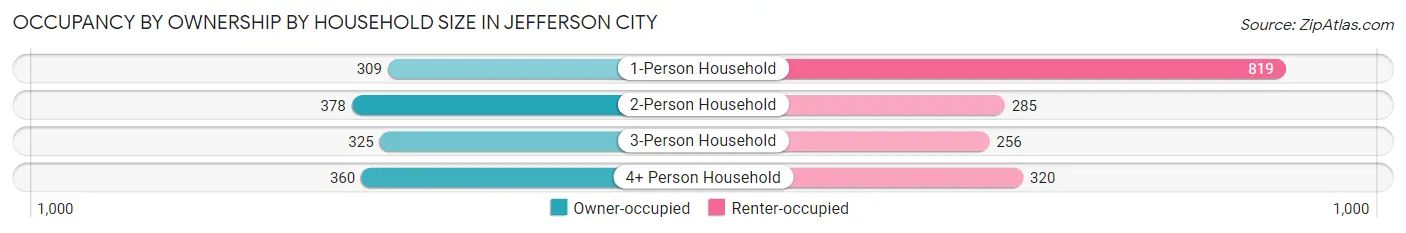
| Household Size | Owner-occupied | Renter-occupied |
| 1-Person Household | 309 (27.4%) | 819 (72.6%) |
| 2-Person Household | 378 (57.0%) | 285 (43.0%) |
| 3-Person Household | 325 (55.9%) | 256 (44.1%) |
| 4+ Person Household | 360 (52.9%) | 320 (47.1%) |
| Total Housing Units | 1,372 (45.0%) | 1,680 (55.0%) |
Occupancy by Educational Attainment in Jefferson City
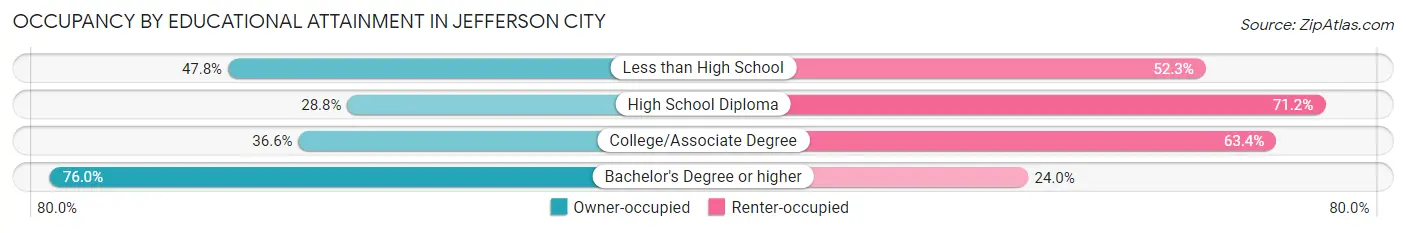
| Household Size | Owner-occupied | Renter-occupied |
| Less than High School | 138 (47.7%) | 151 (52.2%) |
| High School Diploma | 311 (28.8%) | 768 (71.2%) |
| College/Associate Degree | 331 (36.6%) | 574 (63.4%) |
| Bachelor's Degree or higher | 592 (76.0%) | 187 (24.0%) |
Occupancy by Age of Householder in Jefferson City
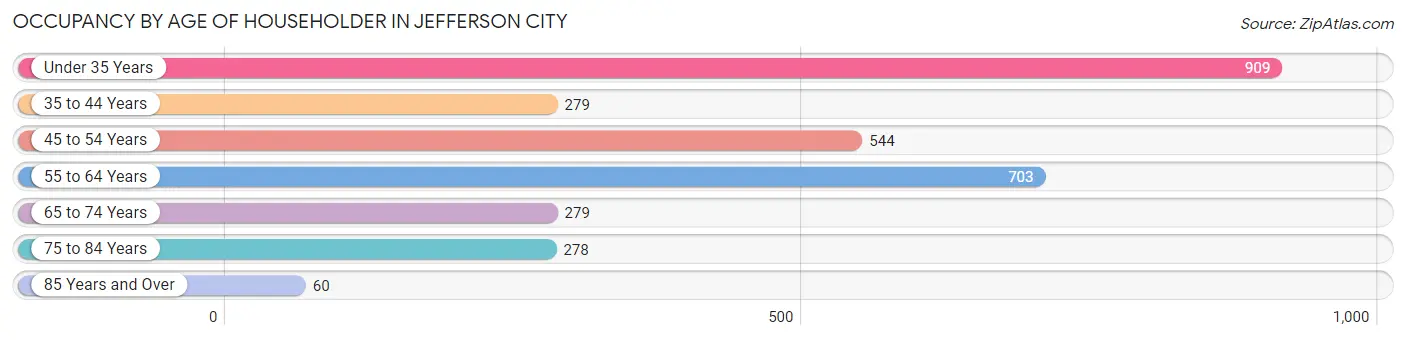
| Age Bracket | # Households | % Households |
| Under 35 Years | 909 | 29.8% |
| 35 to 44 Years | 279 | 9.1% |
| 45 to 54 Years | 544 | 17.8% |
| 55 to 64 Years | 703 | 23.0% |
| 65 to 74 Years | 279 | 9.1% |
| 75 to 84 Years | 278 | 9.1% |
| 85 Years and Over | 60 | 2.0% |
| Total | 3,052 | 100.0% |
Housing Finances in Jefferson City
Median Income by Occupancy in Jefferson City
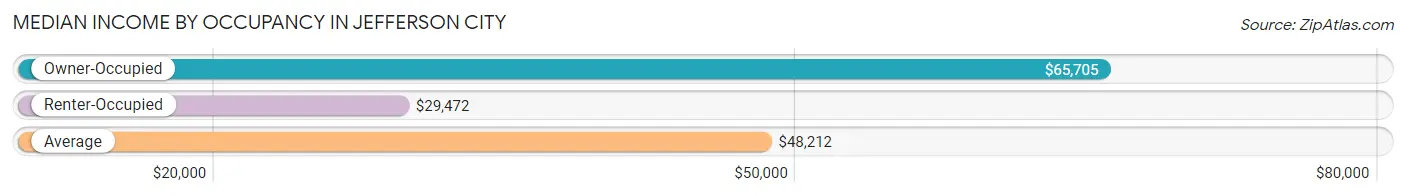
| Occupancy Type | # Households | Median Income |
| Owner-Occupied | 1,372 (45.0%) | $65,705 |
| Renter-Occupied | 1,680 (55.0%) | $29,472 |
| Average | 3,052 (100.0%) | $48,212 |
Occupancy by Householder Income Bracket in Jefferson City
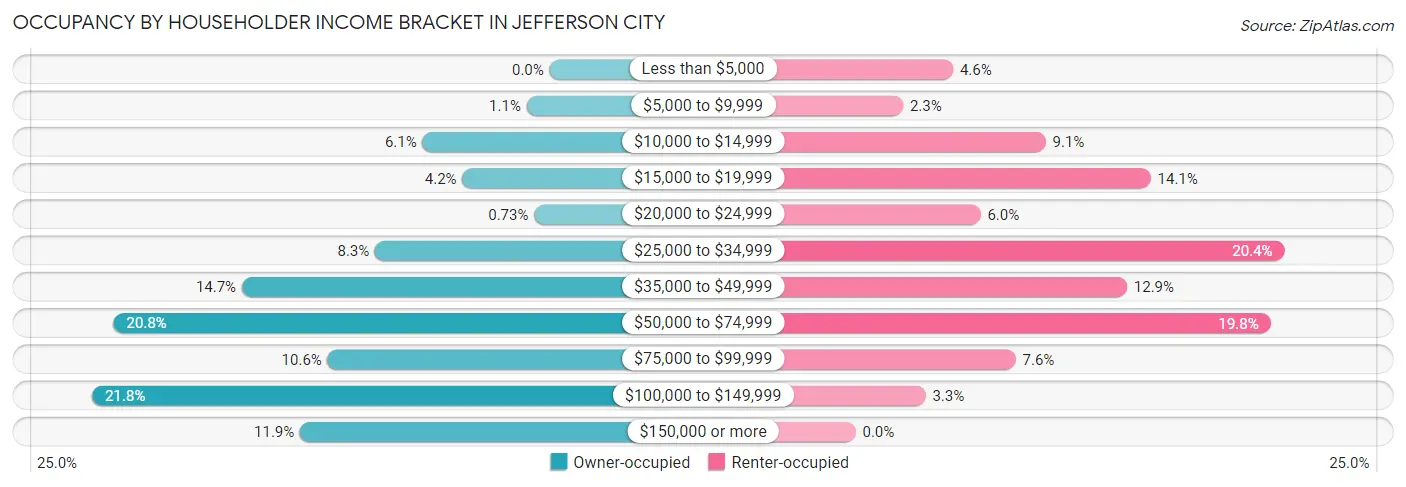
| Income Bracket | Owner-occupied | Renter-occupied |
| Less than $5,000 | 0 (0.0%) | 78 (4.6%) |
| $5,000 to $9,999 | 15 (1.1%) | 38 (2.3%) |
| $10,000 to $14,999 | 83 (6.0%) | 152 (9.0%) |
| $15,000 to $19,999 | 57 (4.2%) | 236 (14.1%) |
| $20,000 to $24,999 | 10 (0.7%) | 100 (5.9%) |
| $25,000 to $34,999 | 114 (8.3%) | 343 (20.4%) |
| $35,000 to $49,999 | 201 (14.6%) | 217 (12.9%) |
| $50,000 to $74,999 | 285 (20.8%) | 332 (19.8%) |
| $75,000 to $99,999 | 145 (10.6%) | 128 (7.6%) |
| $100,000 to $149,999 | 299 (21.8%) | 56 (3.3%) |
| $150,000 or more | 163 (11.9%) | 0 (0.0%) |
| Total | 1,372 (100.0%) | 1,680 (100.0%) |
Monthly Housing Cost Tiers in Jefferson City
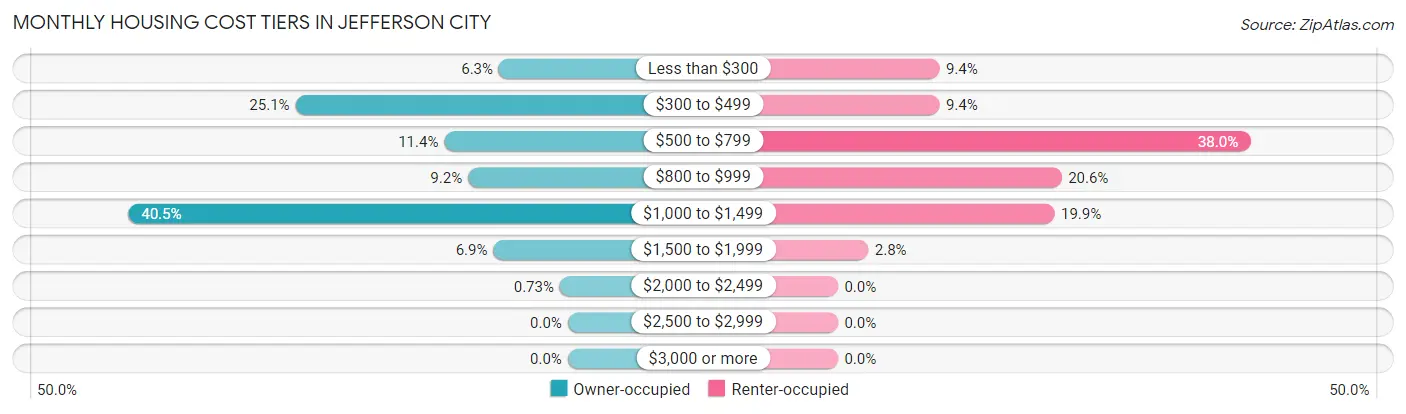
| Monthly Cost | Owner-occupied | Renter-occupied |
| Less than $300 | 87 (6.3%) | 157 (9.3%) |
| $300 to $499 | 344 (25.1%) | 157 (9.3%) |
| $500 to $799 | 156 (11.4%) | 638 (38.0%) |
| $800 to $999 | 126 (9.2%) | 346 (20.6%) |
| $1,000 to $1,499 | 555 (40.5%) | 335 (19.9%) |
| $1,500 to $1,999 | 94 (6.9%) | 47 (2.8%) |
| $2,000 to $2,499 | 10 (0.7%) | 0 (0.0%) |
| $2,500 to $2,999 | 0 (0.0%) | 0 (0.0%) |
| $3,000 or more | 0 (0.0%) | 0 (0.0%) |
| Total | 1,372 (100.0%) | 1,680 (100.0%) |
Physical Housing Characteristics in Jefferson City
Housing Structures in Jefferson City
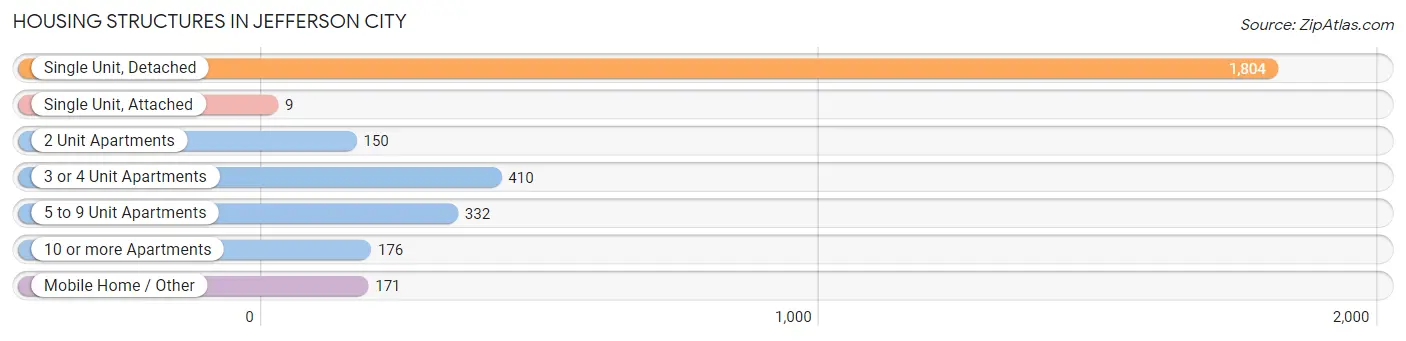
| Structure Type | # Housing Units | % Housing Units |
| Single Unit, Detached | 1,804 | 59.1% |
| Single Unit, Attached | 9 | 0.3% |
| 2 Unit Apartments | 150 | 4.9% |
| 3 or 4 Unit Apartments | 410 | 13.4% |
| 5 to 9 Unit Apartments | 332 | 10.9% |
| 10 or more Apartments | 176 | 5.8% |
| Mobile Home / Other | 171 | 5.6% |
| Total | 3,052 | 100.0% |
Housing Structures by Occupancy in Jefferson City
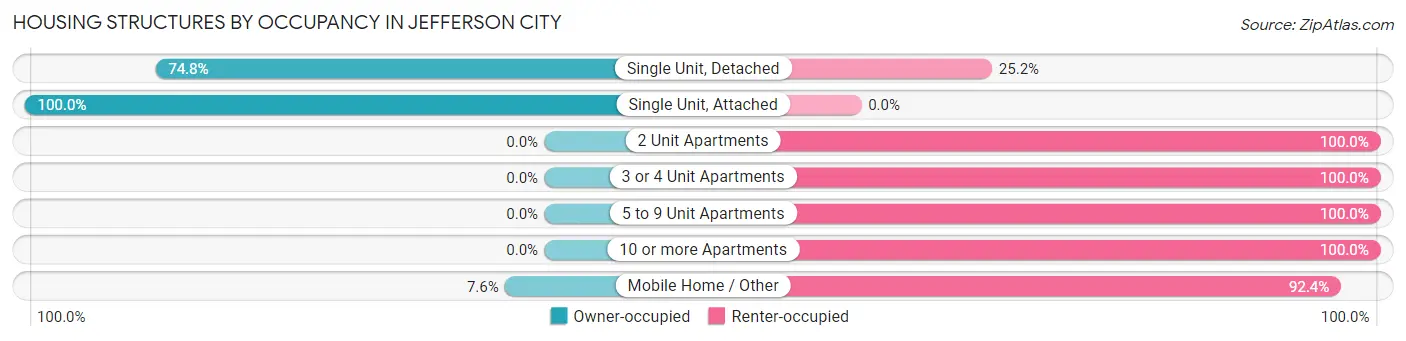
| Structure Type | Owner-occupied | Renter-occupied |
| Single Unit, Detached | 1,350 (74.8%) | 454 (25.2%) |
| Single Unit, Attached | 9 (100.0%) | 0 (0.0%) |
| 2 Unit Apartments | 0 (0.0%) | 150 (100.0%) |
| 3 or 4 Unit Apartments | 0 (0.0%) | 410 (100.0%) |
| 5 to 9 Unit Apartments | 0 (0.0%) | 332 (100.0%) |
| 10 or more Apartments | 0 (0.0%) | 176 (100.0%) |
| Mobile Home / Other | 13 (7.6%) | 158 (92.4%) |
| Total | 1,372 (45.0%) | 1,680 (55.0%) |
Housing Structures by Number of Rooms in Jefferson City
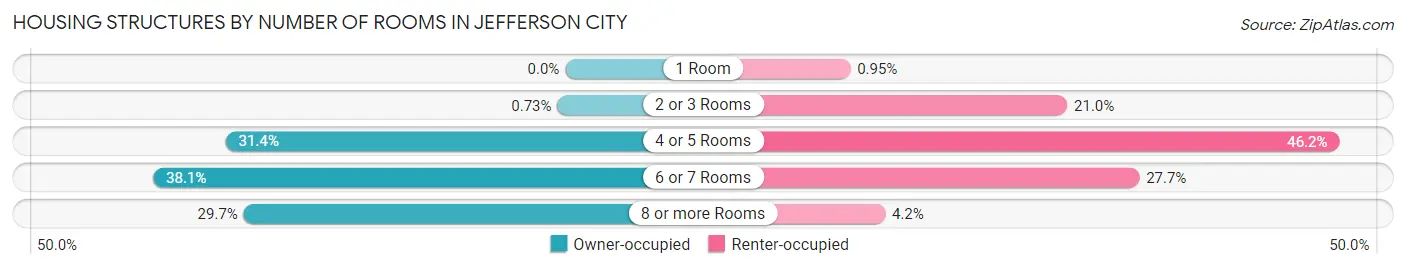
| Number of Rooms | Owner-occupied | Renter-occupied |
| 1 Room | 0 (0.0%) | 16 (0.9%) |
| 2 or 3 Rooms | 10 (0.7%) | 353 (21.0%) |
| 4 or 5 Rooms | 431 (31.4%) | 776 (46.2%) |
| 6 or 7 Rooms | 523 (38.1%) | 465 (27.7%) |
| 8 or more Rooms | 408 (29.7%) | 70 (4.2%) |
| Total | 1,372 (100.0%) | 1,680 (100.0%) |
Housing Structure by Heating Type in Jefferson City
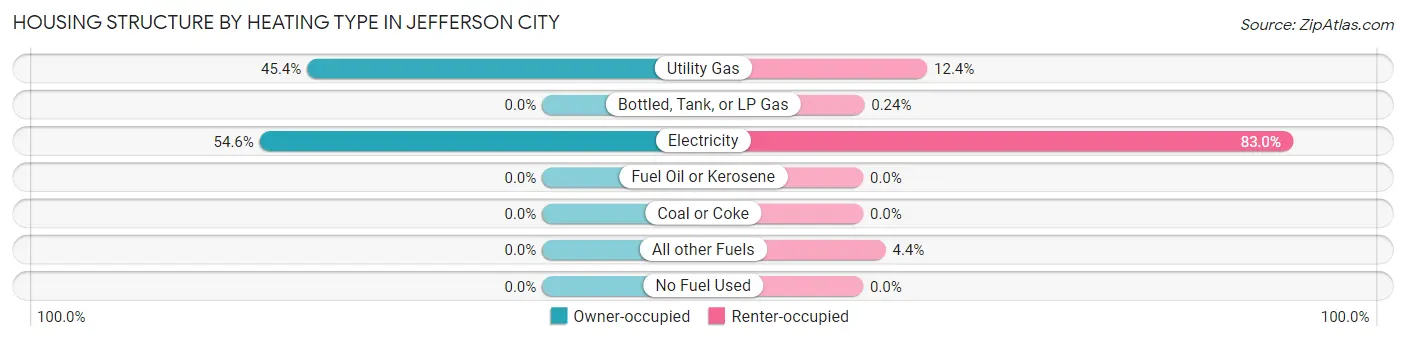
| Heating Type | Owner-occupied | Renter-occupied |
| Utility Gas | 623 (45.4%) | 208 (12.4%) |
| Bottled, Tank, or LP Gas | 0 (0.0%) | 4 (0.2%) |
| Electricity | 749 (54.6%) | 1,395 (83.0%) |
| Fuel Oil or Kerosene | 0 (0.0%) | 0 (0.0%) |
| Coal or Coke | 0 (0.0%) | 0 (0.0%) |
| All other Fuels | 0 (0.0%) | 73 (4.3%) |
| No Fuel Used | 0 (0.0%) | 0 (0.0%) |
| Total | 1,372 (100.0%) | 1,680 (100.0%) |
Household Vehicle Usage in Jefferson City
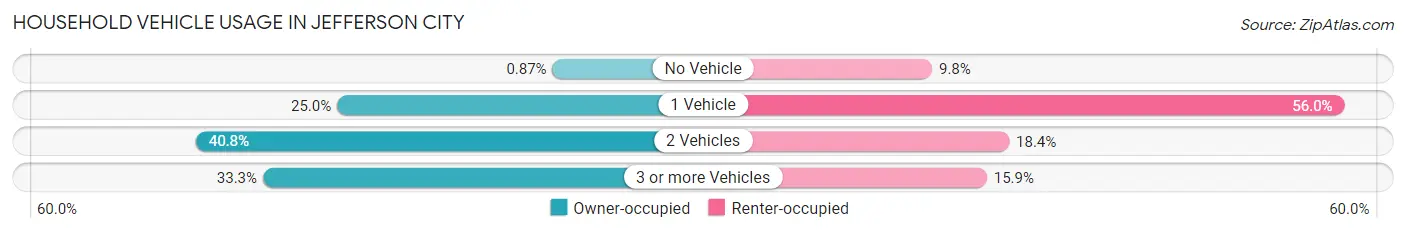
| Vehicles per Household | Owner-occupied | Renter-occupied |
| No Vehicle | 12 (0.9%) | 164 (9.8%) |
| 1 Vehicle | 343 (25.0%) | 940 (55.9%) |
| 2 Vehicles | 560 (40.8%) | 309 (18.4%) |
| 3 or more Vehicles | 457 (33.3%) | 267 (15.9%) |
| Total | 1,372 (100.0%) | 1,680 (100.0%) |
Real Estate & Mortgages in Jefferson City
Real Estate and Mortgage Overview in Jefferson City
| Characteristic | Without Mortgage | With Mortgage |
| Housing Units | 491 | 881 |
| Median Property Value | $189,000 | $160,600 |
| Median Household Income | $66,518 | $112 |
| Monthly Housing Costs | $370 | $0 |
| Real Estate Taxes | $947 | $87 |
Property Value by Mortgage Status in Jefferson City
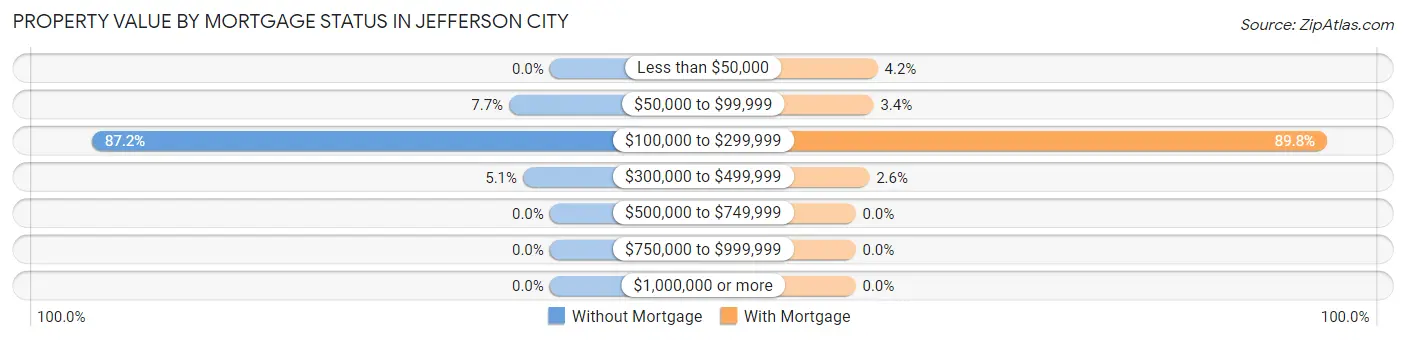
| Property Value | Without Mortgage | With Mortgage |
| Less than $50,000 | 0 (0.0%) | 37 (4.2%) |
| $50,000 to $99,999 | 38 (7.7%) | 30 (3.4%) |
| $100,000 to $299,999 | 428 (87.2%) | 791 (89.8%) |
| $300,000 to $499,999 | 25 (5.1%) | 23 (2.6%) |
| $500,000 to $749,999 | 0 (0.0%) | 0 (0.0%) |
| $750,000 to $999,999 | 0 (0.0%) | 0 (0.0%) |
| $1,000,000 or more | 0 (0.0%) | 0 (0.0%) |
| Total | 491 (100.0%) | 881 (100.0%) |
Household Income by Mortgage Status in Jefferson City
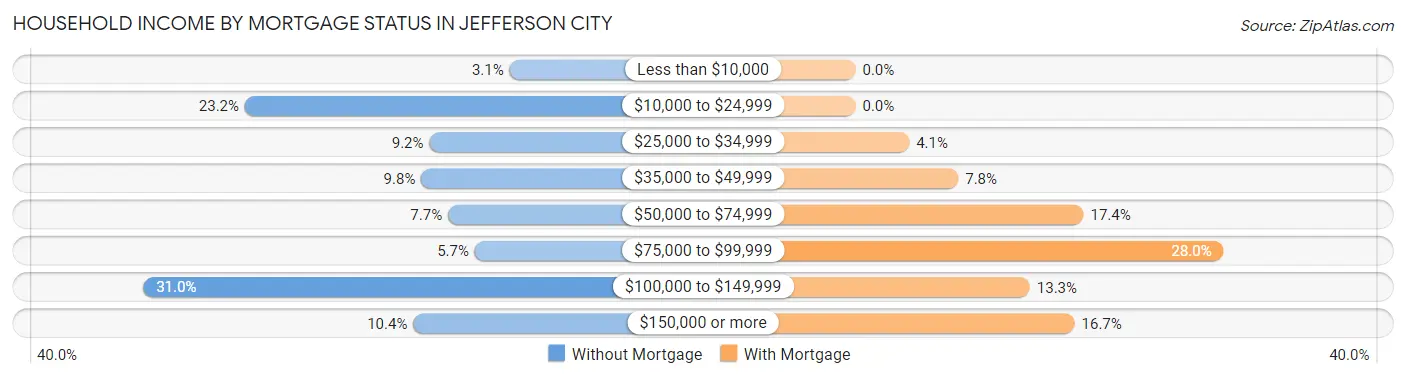
| Household Income | Without Mortgage | With Mortgage |
| Less than $10,000 | 15 (3.0%) | 0 (0.0%) |
| $10,000 to $24,999 | 114 (23.2%) | 0 (0.0%) |
| $25,000 to $34,999 | 45 (9.2%) | 36 (4.1%) |
| $35,000 to $49,999 | 48 (9.8%) | 69 (7.8%) |
| $50,000 to $74,999 | 38 (7.7%) | 153 (17.4%) |
| $75,000 to $99,999 | 28 (5.7%) | 247 (28.0%) |
| $100,000 to $149,999 | 152 (31.0%) | 117 (13.3%) |
| $150,000 or more | 51 (10.4%) | 147 (16.7%) |
| Total | 491 (100.0%) | 881 (100.0%) |
Property Value to Household Income Ratio in Jefferson City
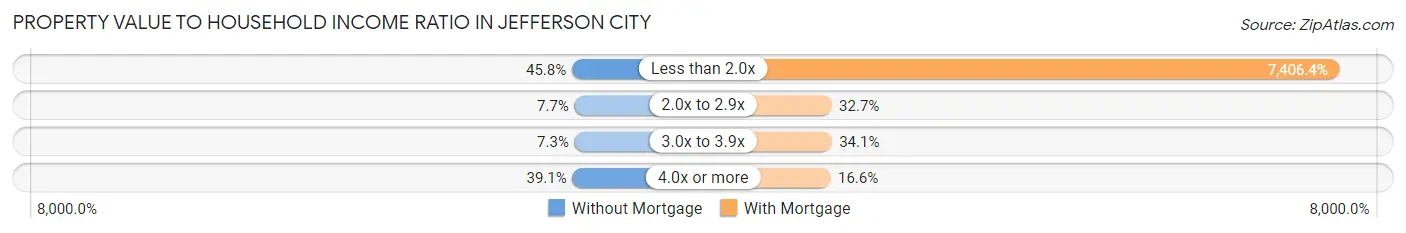
| Value-to-Income Ratio | Without Mortgage | With Mortgage |
| Less than 2.0x | 225 (45.8%) | 65,250 (7,406.4%) |
| 2.0x to 2.9x | 38 (7.7%) | 288 (32.7%) |
| 3.0x to 3.9x | 36 (7.3%) | 300 (34.1%) |
| 4.0x or more | 192 (39.1%) | 146 (16.6%) |
| Total | 491 (100.0%) | 881 (100.0%) |
Real Estate Taxes by Mortgage Status in Jefferson City
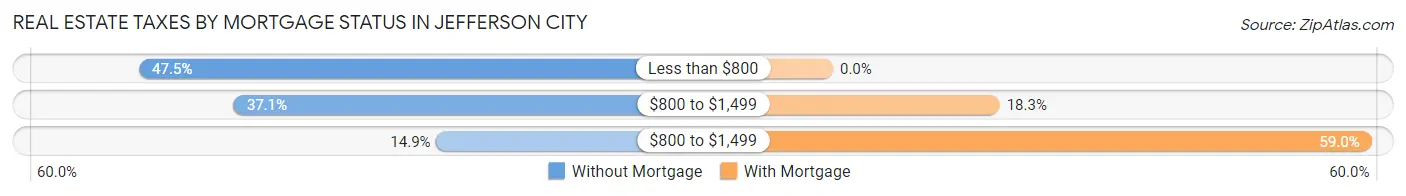
| Property Taxes | Without Mortgage | With Mortgage |
| Less than $800 | 233 (47.4%) | 0 (0.0%) |
| $800 to $1,499 | 182 (37.1%) | 161 (18.3%) |
| $800 to $1,499 | 73 (14.9%) | 520 (59.0%) |
| Total | 491 (100.0%) | 881 (100.0%) |
Health & Disability in Jefferson City
Health Insurance Coverage by Age in Jefferson City
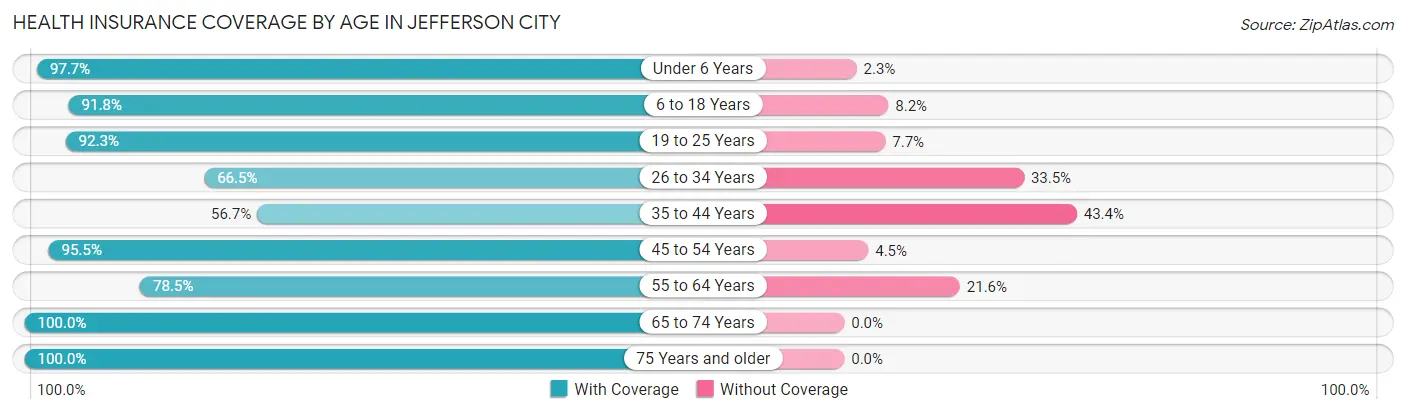
| Age Bracket | With Coverage | Without Coverage |
| Under 6 Years | 511 (97.7%) | 12 (2.3%) |
| 6 to 18 Years | 1,208 (91.8%) | 108 (8.2%) |
| 19 to 25 Years | 1,652 (92.3%) | 137 (7.7%) |
| 26 to 34 Years | 675 (66.5%) | 340 (33.5%) |
| 35 to 44 Years | 277 (56.7%) | 212 (43.3%) |
| 45 to 54 Years | 876 (95.5%) | 41 (4.5%) |
| 55 to 64 Years | 801 (78.4%) | 220 (21.5%) |
| 65 to 74 Years | 569 (100.0%) | 0 (0.0%) |
| 75 Years and older | 454 (100.0%) | 0 (0.0%) |
| Total | 7,023 (86.8%) | 1,070 (13.2%) |
Health Insurance Coverage by Citizenship Status in Jefferson City
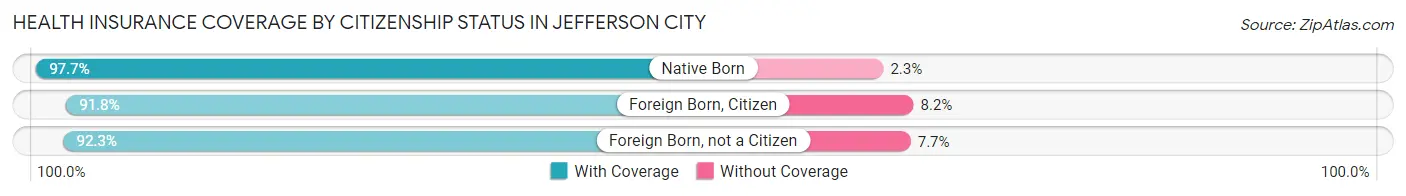
| Citizenship Status | With Coverage | Without Coverage |
| Native Born | 511 (97.7%) | 12 (2.3%) |
| Foreign Born, Citizen | 1,208 (91.8%) | 108 (8.2%) |
| Foreign Born, not a Citizen | 1,652 (92.3%) | 137 (7.7%) |
Health Insurance Coverage by Household Income in Jefferson City
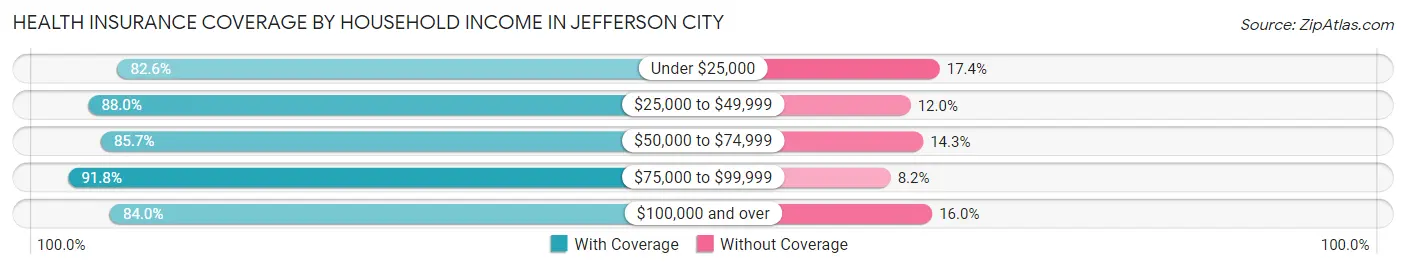
| Household Income | With Coverage | Without Coverage |
| Under $25,000 | 1,099 (82.6%) | 232 (17.4%) |
| $25,000 to $49,999 | 1,455 (88.0%) | 198 (12.0%) |
| $50,000 to $74,999 | 1,424 (85.7%) | 238 (14.3%) |
| $75,000 to $99,999 | 647 (91.8%) | 58 (8.2%) |
| $100,000 and over | 1,568 (84.0%) | 299 (16.0%) |
Public vs Private Health Insurance Coverage by Age in Jefferson City
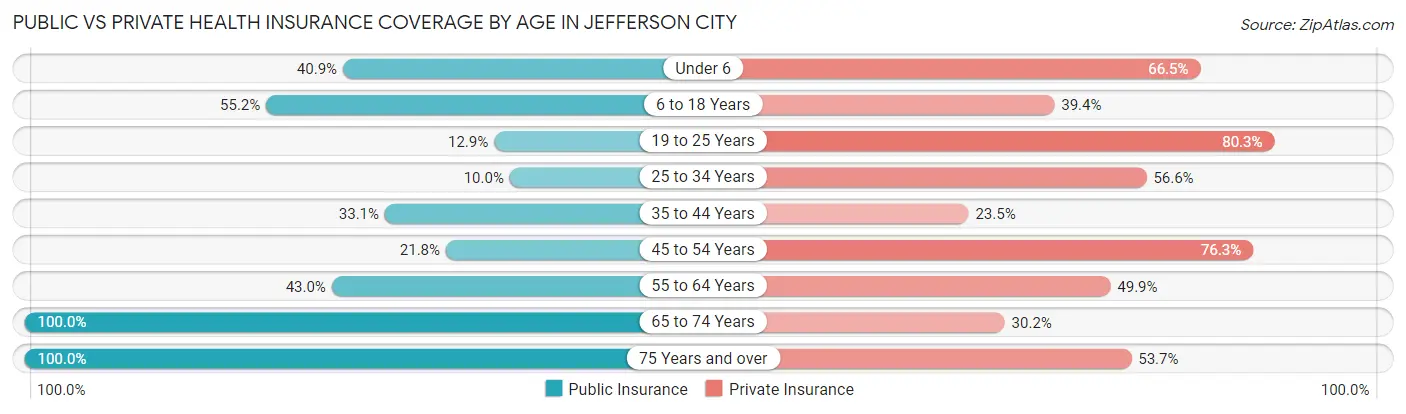
| Age Bracket | Public Insurance | Private Insurance |
| Under 6 | 214 (40.9%) | 348 (66.5%) |
| 6 to 18 Years | 726 (55.2%) | 519 (39.4%) |
| 19 to 25 Years | 230 (12.9%) | 1,436 (80.3%) |
| 25 to 34 Years | 101 (10.0%) | 574 (56.6%) |
| 35 to 44 Years | 162 (33.1%) | 115 (23.5%) |
| 45 to 54 Years | 200 (21.8%) | 700 (76.3%) |
| 55 to 64 Years | 439 (43.0%) | 509 (49.8%) |
| 65 to 74 Years | 569 (100.0%) | 172 (30.2%) |
| 75 Years and over | 454 (100.0%) | 244 (53.7%) |
| Total | 3,095 (38.2%) | 4,617 (57.1%) |
Disability Status by Sex by Age in Jefferson City
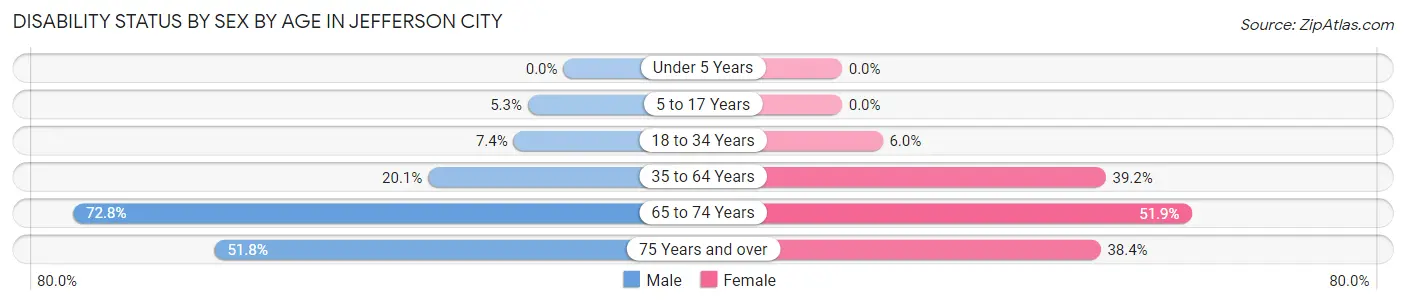
| Age Bracket | Male | Female |
| Under 5 Years | 0 (0.0%) | 0 (0.0%) |
| 5 to 17 Years | 34 (5.3%) | 0 (0.0%) |
| 18 to 34 Years | 121 (7.4%) | 87 (6.0%) |
| 35 to 64 Years | 211 (20.1%) | 539 (39.2%) |
| 65 to 74 Years | 222 (72.8%) | 137 (51.9%) |
| 75 Years and over | 72 (51.8%) | 121 (38.4%) |
Disability Class by Sex by Age in Jefferson City
Disability Class: Hearing Difficulty
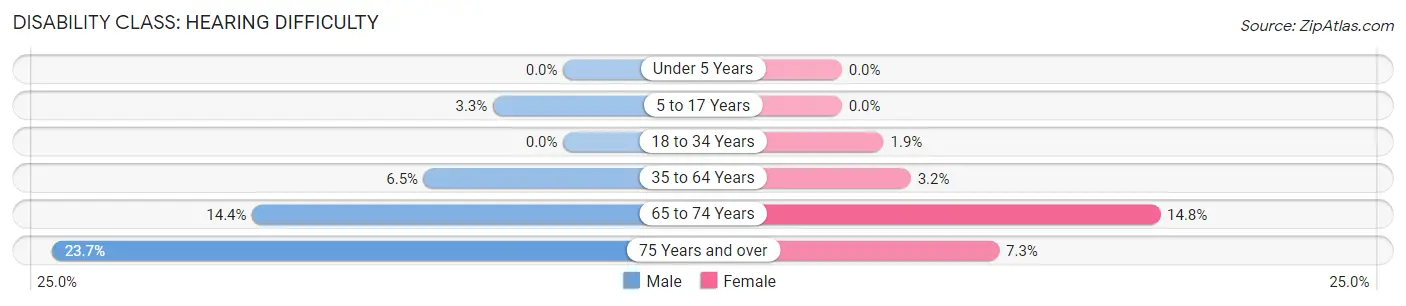
| Age Bracket | Male | Female |
| Under 5 Years | 0 (0.0%) | 0 (0.0%) |
| 5 to 17 Years | 21 (3.3%) | 0 (0.0%) |
| 18 to 34 Years | 0 (0.0%) | 28 (1.9%) |
| 35 to 64 Years | 68 (6.5%) | 44 (3.2%) |
| 65 to 74 Years | 44 (14.4%) | 39 (14.8%) |
| 75 Years and over | 33 (23.7%) | 23 (7.3%) |
Disability Class: Vision Difficulty
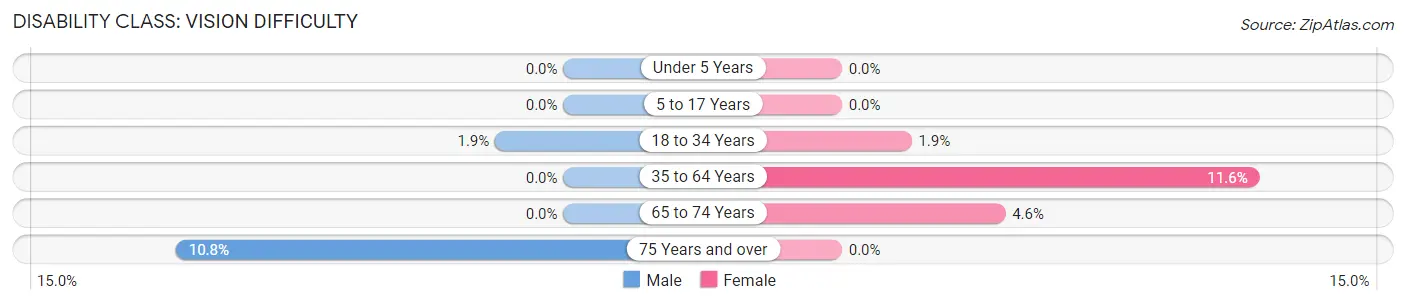
| Age Bracket | Male | Female |
| Under 5 Years | 0 (0.0%) | 0 (0.0%) |
| 5 to 17 Years | 0 (0.0%) | 0 (0.0%) |
| 18 to 34 Years | 31 (1.9%) | 28 (1.9%) |
| 35 to 64 Years | 0 (0.0%) | 160 (11.6%) |
| 65 to 74 Years | 0 (0.0%) | 12 (4.5%) |
| 75 Years and over | 15 (10.8%) | 0 (0.0%) |
Disability Class: Cognitive Difficulty
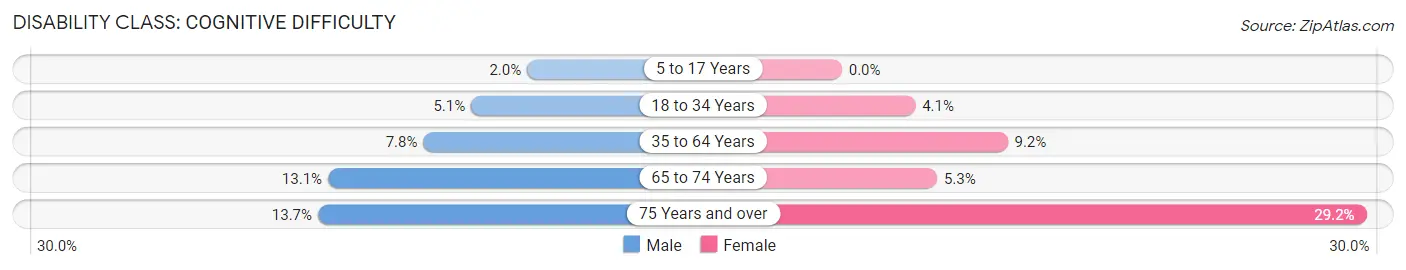
| Age Bracket | Male | Female |
| 5 to 17 Years | 13 (2.0%) | 0 (0.0%) |
| 18 to 34 Years | 84 (5.1%) | 59 (4.1%) |
| 35 to 64 Years | 82 (7.8%) | 127 (9.2%) |
| 65 to 74 Years | 40 (13.1%) | 14 (5.3%) |
| 75 Years and over | 19 (13.7%) | 92 (29.2%) |
Disability Class: Ambulatory Difficulty
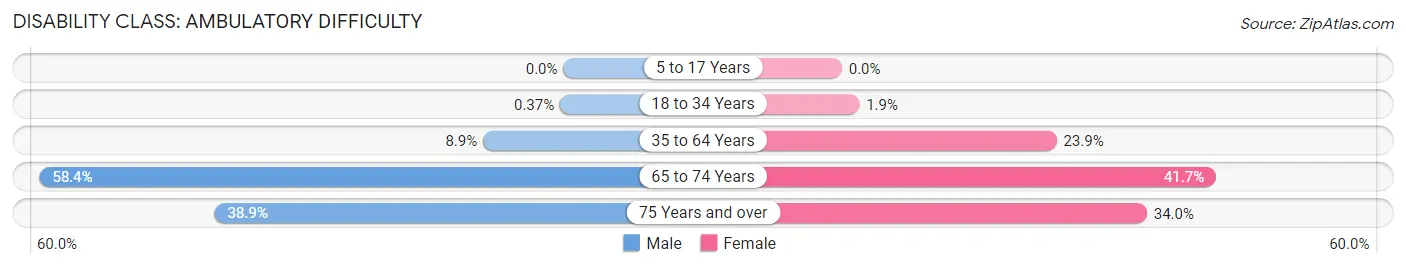
| Age Bracket | Male | Female |
| 5 to 17 Years | 0 (0.0%) | 0 (0.0%) |
| 18 to 34 Years | 6 (0.4%) | 28 (1.9%) |
| 35 to 64 Years | 94 (8.9%) | 329 (23.9%) |
| 65 to 74 Years | 178 (58.4%) | 110 (41.7%) |
| 75 Years and over | 54 (38.9%) | 107 (34.0%) |
Disability Class: Self-Care Difficulty
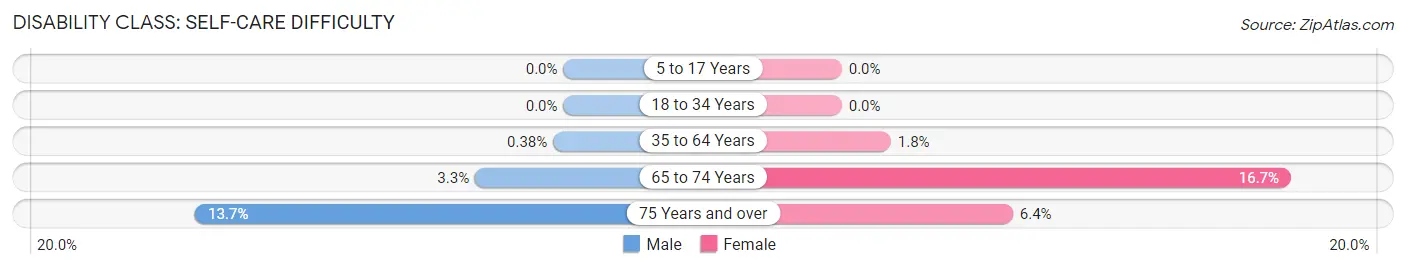
| Age Bracket | Male | Female |
| 5 to 17 Years | 0 (0.0%) | 0 (0.0%) |
| 18 to 34 Years | 0 (0.0%) | 0 (0.0%) |
| 35 to 64 Years | 4 (0.4%) | 25 (1.8%) |
| 65 to 74 Years | 10 (3.3%) | 44 (16.7%) |
| 75 Years and over | 19 (13.7%) | 20 (6.4%) |
Technology Access in Jefferson City
Computing Device Access in Jefferson City
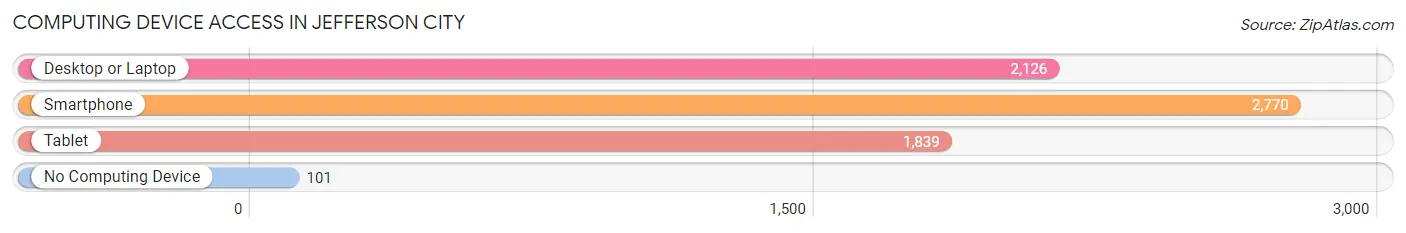
| Device Type | # Households | % Households |
| Desktop or Laptop | 2,126 | 69.7% |
| Smartphone | 2,770 | 90.8% |
| Tablet | 1,839 | 60.3% |
| No Computing Device | 101 | 3.3% |
| Total | 3,052 | 100.0% |
Internet Access in Jefferson City
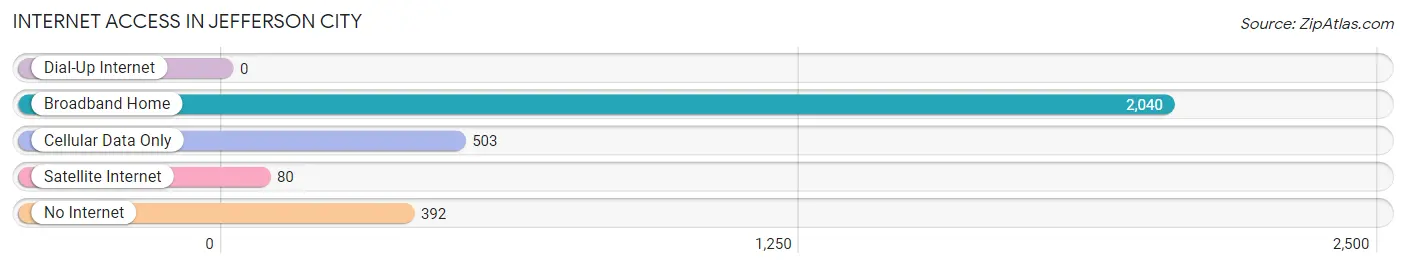
| Internet Type | # Households | % Households |
| Dial-Up Internet | 0 | 0.0% |
| Broadband Home | 2,040 | 66.8% |
| Cellular Data Only | 503 | 16.5% |
| Satellite Internet | 80 | 2.6% |
| No Internet | 392 | 12.8% |
| Total | 3,052 | 100.0% |
Jefferson City Summary
Jefferson City, Tennessee is a small city located in the eastern part of the state, in the foothills of the Great Smoky Mountains. It is the county seat of Jefferson County and is part of the Knoxville Metropolitan Statistical Area. The city has a population of 8,845 as of the 2010 census, and is the second largest city in the county.
History
Jefferson City was founded in 1792 by William Jefferson, a Revolutionary War veteran. The city was named after Thomas Jefferson, the third President of the United States. The city was originally part of the Cherokee Nation, and was part of the Treaty of Holston in 1791, which ceded the land to the United States. The city was incorporated in 1819, and was the first city in the county to be incorporated.
In the early 19th century, Jefferson City was a major stop on the stagecoach route between Knoxville and Asheville, North Carolina. The city was also a major stop on the railroad line between Knoxville and Chattanooga. The city was a major center for the production of textiles, and was home to several cotton mills.
Geography
Jefferson City is located in the eastern part of the state, in the foothills of the Great Smoky Mountains. The city is situated at the confluence of the French Broad and Nolichucky Rivers. The city is located at an elevation of 1,068 feet above sea level. The city has a total area of 8.3 square miles, of which 8.2 square miles is land and 0.1 square miles is water.
Economy
Jefferson City has a diverse economy, with a mix of manufacturing, retail, and service industries. The city is home to several manufacturing companies, including a paper mill, a furniture factory, and a plastics plant. The city is also home to several retail stores, including a Walmart Supercenter, a Lowe's Home Improvement store, and several restaurants. The city is also home to several service industries, including a hospital, a nursing home, and several medical offices.
Demographics
As of the 2010 census, Jefferson City had a population of 8,845. The racial makeup of the city was 87.3% White, 8.2% African American, 0.3% Native American, 0.7% Asian, 0.1% Pacific Islander, 1.2% from other races, and 2.4% from two or more races. Hispanic or Latino of any race were 3.2% of the population.
The median income for a household in the city was $37,945, and the median income for a family was $45,945. The per capita income for the city was $19,945. About 14.3% of families and 17.2% of the population were below the poverty line, including 25.2% of those under age 18 and 11.2% of those age 65 or over.
Jefferson City is served by the Jefferson County School System, which consists of five elementary schools, two middle schools, and one high school. The city is also home to Carson-Newman University, a private liberal arts college.
Common Questions
What is Per Capita Income in Jefferson City?
Per Capita income in Jefferson City is $24,242.
What is the Median Family Income in Jefferson City?
Median Family Income in Jefferson City is $67,044.
What is the Median Household income in Jefferson City?
Median Household Income in Jefferson City is $48,212.
What is Income or Wage Gap in Jefferson City?
Income or Wage Gap in Jefferson City is 34.1%.
Women in Jefferson City earn 65.9 cents for every dollar earned by a man.
What is Inequality or Gini Index in Jefferson City?
Inequality or Gini Index in Jefferson City is 0.45.
What is the Total Population of Jefferson City?
Total Population of Jefferson City is 8,391.
What is the Total Male Population of Jefferson City?
Total Male Population of Jefferson City is 4,099.
What is the Total Female Population of Jefferson City?
Total Female Population of Jefferson City is 4,292.
What is the Ratio of Males per 100 Females in Jefferson City?
There are 95.50 Males per 100 Females in Jefferson City.
What is the Ratio of Females per 100 Males in Jefferson City?
There are 104.71 Females per 100 Males in Jefferson City.
What is the Median Population Age in Jefferson City?
Median Population Age in Jefferson City is 30.8 Years.
What is the Average Family Size in Jefferson City
Average Family Size in Jefferson City is 3.1 People.
What is the Average Household Size in Jefferson City
Average Household Size in Jefferson City is 2.4 People.
How Large is the Labor Force in Jefferson City?
There are 4,117 People in the Labor Forcein in Jefferson City.
What is the Percentage of People in the Labor Force in Jefferson City?
57.7% of People are in the Labor Force in Jefferson City.
What is the Unemployment Rate in Jefferson City?
Unemployment Rate in Jefferson City is 6.8%.