Zip Codes with the Highest Percentage of Population Employed in Health Diagnosing & Treating in Germantown, TN
RELATED REPORTS & OPTIONS
Health Diagnosing & Treating
Germantown
Compare Zip Codes
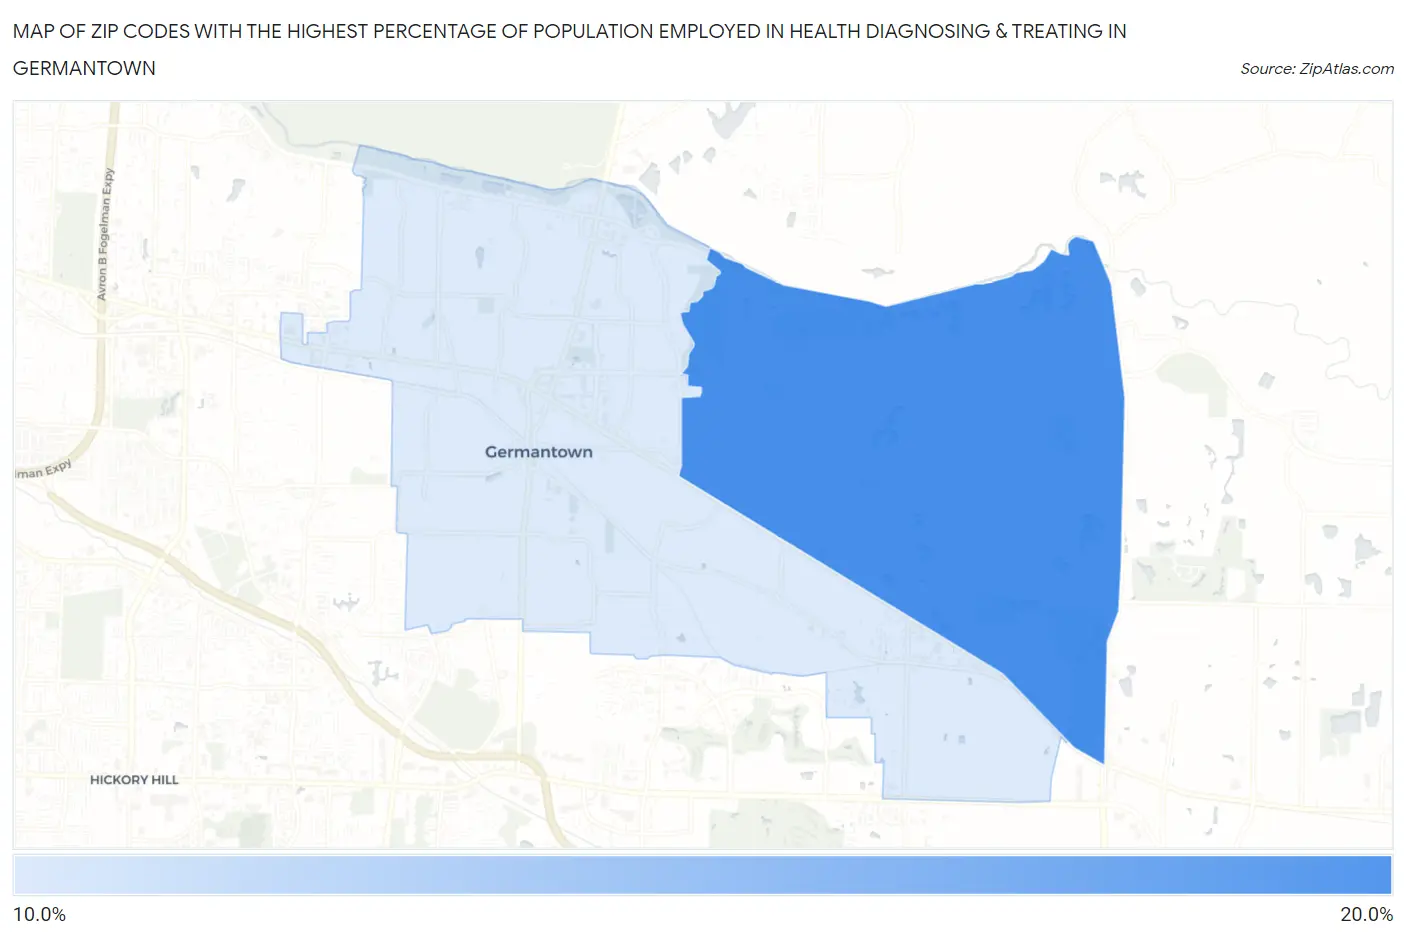
Map of Zip Codes with the Highest Percentage of Population Employed in Health Diagnosing & Treating in Germantown
11.5%
15.2%
Zip Codes with the Highest Percentage of Population Employed in Health Diagnosing & Treating in Germantown, TN
| Zip Code | % Employed | vs State | vs National | |
| 1. | 38139 | 15.2% | 6.9%(+8.34)#14 | 6.2%(+8.95)#1,106 |
| 2. | 38138 | 11.5% | 6.9%(+4.62)#52 | 6.2%(+5.24)#2,533 |
1
Common Questions
What are the Top Zip Codes with the Highest Percentage of Population Employed in Health Diagnosing & Treating in Germantown, TN?
Top Zip Codes with the Highest Percentage of Population Employed in Health Diagnosing & Treating in Germantown, TN are:
What zip code has the Highest Percentage of Population Employed in Health Diagnosing & Treating in Germantown, TN?
38139 has the Highest Percentage of Population Employed in Health Diagnosing & Treating in Germantown, TN with 15.2%.
What is the Percentage of Population Employed in Health Diagnosing & Treating in Germantown, TN?
Percentage of Population Employed in Health Diagnosing & Treating in Germantown is 12.7%.
What is the Percentage of Population Employed in Health Diagnosing & Treating in Tennessee?
Percentage of Population Employed in Health Diagnosing & Treating in Tennessee is 6.9%.
What is the Percentage of Population Employed in Health Diagnosing & Treating in the United States?
Percentage of Population Employed in Health Diagnosing & Treating in the United States is 6.2%.