Zip Codes with the Highest Percentage of Population Employed in Health Diagnosing & Treating in Franklin, TN
RELATED REPORTS & OPTIONS
Health Diagnosing & Treating
Franklin
Compare Zip Codes
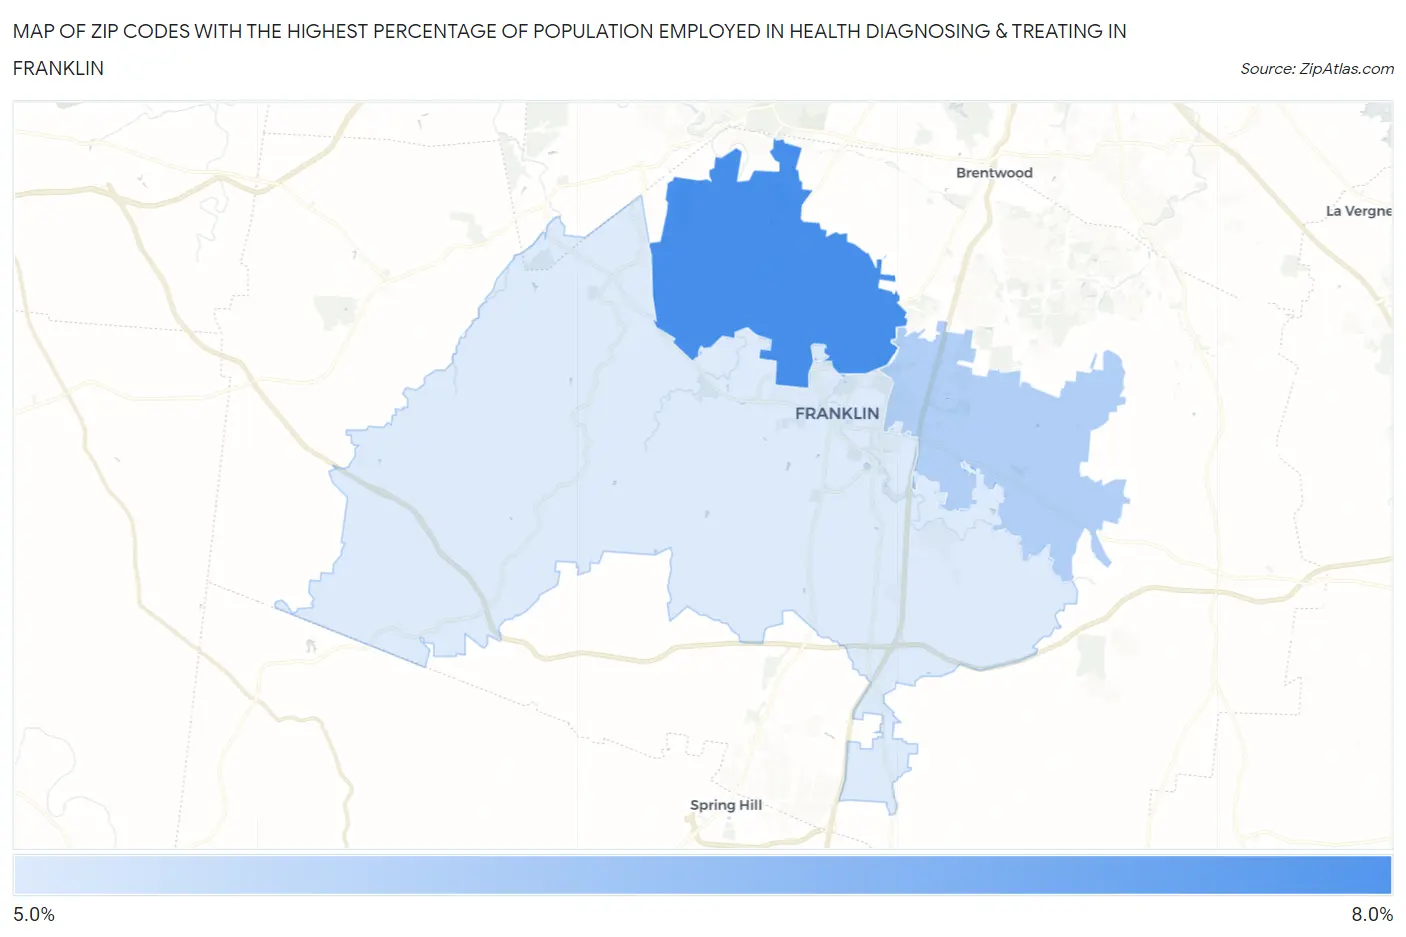
Map of Zip Codes with the Highest Percentage of Population Employed in Health Diagnosing & Treating in Franklin
6.0%
7.6%
Zip Codes with the Highest Percentage of Population Employed in Health Diagnosing & Treating in Franklin, TN
| Zip Code | % Employed | vs State | vs National | |
| 1. | 37069 | 7.6% | 6.9%(+0.709)#209 | 6.2%(+1.33)#8,588 |
| 2. | 37067 | 6.4% | 6.9%(-0.428)#288 | 6.2%(+0.188)#12,263 |
| 3. | 37064 | 6.0% | 6.9%(-0.890)#333 | 6.2%(-0.273)#13,976 |
1
Common Questions
What are the Top Zip Codes with the Highest Percentage of Population Employed in Health Diagnosing & Treating in Franklin, TN?
Top Zip Codes with the Highest Percentage of Population Employed in Health Diagnosing & Treating in Franklin, TN are:
What zip code has the Highest Percentage of Population Employed in Health Diagnosing & Treating in Franklin, TN?
37069 has the Highest Percentage of Population Employed in Health Diagnosing & Treating in Franklin, TN with 7.6%.
What is the Percentage of Population Employed in Health Diagnosing & Treating in Franklin, TN?
Percentage of Population Employed in Health Diagnosing & Treating in Franklin is 6.1%.
What is the Percentage of Population Employed in Health Diagnosing & Treating in Tennessee?
Percentage of Population Employed in Health Diagnosing & Treating in Tennessee is 6.9%.
What is the Percentage of Population Employed in Health Diagnosing & Treating in the United States?
Percentage of Population Employed in Health Diagnosing & Treating in the United States is 6.2%.